Embed Size (px)
Citation preview

American Journal of Civil Engineering 2017; 5(5): 293-306
http://www.sciencepublishinggroup.com/j/ajce
doi: 10.11648/j.ajce.20170505.14
ISSN: 2330-8729 (Print); ISSN: 2330-8737 (Online)
Incorporation of “Risk Factor” in Design Flood Review of Existing Dams
Ravi Kumar Pillai1, Om Prakash Gupta
2
1Ministry of Water Resources, River Development& Ganga Rejuvenation, New Delhi, India 2Central Water Commission, New Delhi, India
Email address:
[email protected] (R. K. Pillai), [email protected] (O. P. Gupta)
To cite this article: Ravi Kumar Pillai, Om Prakash Gupta. Incorporation of “Risk Factor” in Design Flood Review of Existing Dams. American Journal of Civil
Engineering. Vol. 5, No. 5, 2017, pp. 293-306. doi: 10.11648/j.ajce.20170505.14
Received: July 31, 2017; Accepted: August 21, 2017; Published: September 8, 2017
Abstract: At present there are about 4877 completed large dams in India. More than 75% of Indian dams are at least two
decades old and for these dams the original design floods call for revisions. Examination of revised design flood studies carried
out for a set of 118 dams under ‘Dam Rehabilitation and Improvement Project (DRIP)’ reveal that the design flood values have
increased substantially with trends indicating that percentage increases in the revised design flood values are greater for lower
dams and also for older dams. Paper illustrates that the upward revision in the design flood estimate of existing dam in no way
leads to amplification of the actual risk associated with that dam, and it only underlines the gap between the acceptable risk
level and existing risk level. The paper shows that flood related risk mitigation of existing dams is a challenging task often
facing constraints of technical and economical viabilities. With the substantial data set of design flood revisions of DRIP dams,
the paper brings out the skew observed in distribution of revised design floods on account of present-day norms related to
computation of design floods, as contained in the Indian Standard IS: 11223 – 1985 (reaffirmed 1995). Paper also proposes
amendments in this Standard in respect of existing large dams with an alternative recourse of formulating a new Standard for
revision of design floods incorporating the risk factor associated with these large dam structures.
Keywords: Large Dams, Design Flood Review, Dam Failure, Flood Risk Mitigation,
Dam Rehabilitation & Improvement Project
1. Introduction
India has invested heavily in infrastructure over the last
fifty years which is necessary to store surface runoff in
reservoirs formed by large, medium, and small dams with
associated appurtenances. In light of the sizeable numbers
and wide geographic spread of these dams, an ever-
increasing number of people are living and working in areas
that would be liable to sudden floods in the event of a dam
failure. High safety standards for large dams are thus
imperative to prevent failure that would cause extensive
environmental and property damage, economic hardships,
and, in the worst case, loss of life.
As per the findings of the International Commission on
Large Dams, approximately one third of the failures of dam
are attributed to the direct result of flood exceeding the
capacity of the dam spillway [9]. As per world-wide failure
data of large embankment dams, the most common causes of
failure are overtopping accounting for 32% failures followed
by internal erosion accounting for 27% failures [9]. In
comparison, in India, internal erosion (breaching) accounts
for about 44% of dam failures followed by overtopping that
accounts for about 25% failures. Of the world-wide dam
failures caused by overtopping, 73% are due to inadequate
spillway capacity and 27% due to spillway gate failure [1]. In
India, there is no recorded dam failure directly attributable to
gate failure. However, the worst dam failure of India –
namely, Machu-II dam failure in 1979 that resulted in loss of
lives exceeding 2000 numbers – was on account of
overtopping essentially resulting from the situation of
inadequate spillway capacity and apparently with an added
contribution from the cause of gate failure.
In the world, India now ranks third in terms of number of
large dams, after United States and China [10]. There are
currently about 4877 completed large dams in India [4]. The

American Journal of Civil Engineering 2017; 5(5): 293-306 294
total storage capacity of these dams, of which 76% are more
than 20 years old, is about 283 billion cubic meters. More than
75% of Indian dams, carrying substantial storage behind them,
are thus at least two decades old; and for these dams the
original flood peak discharges/volumes were estimated mostly
from empirical formulae with applied discretions by
experienced designers. For such existing dams, there is an
urgent need for the original design flood estimates to be either
justified or reviewed based on scientific data collected in-situ,
and on the basis of computational procedures that have been
improved since then. Even in many a cases of latter-day
constructed dams, the original estimate of design floods were
based on the scarce observed flood records or on record of
extreme rainfall events at that time; and both of these data-sets
get strengthened with more values getting added, and hence it
will be prudent to review these studies as well.
Checking and upgrading the dam design flood estimates
– incorporating the extended data sets and also
assimilating the intervening experiences – is thus a key
technical priority in India’s national dam safety program;
and, this activity is also the prime requirement under the
ongoing Dam Rehabilitation and Improvement Project
(DRIP). DRIP is a World Bank funded project, co-
ordinated by Central Water Commission (CWC), under
which the dam safety reviews and dam rehabilitation
works are being undertaken for 224 selected large dams.
Based on the outcomes of the substantial set of design
flood reviews for 118 dams under DRIP, this paper
attempts to analyzethe trend of design flood revisions in
existing dams. Since in majority of review cases the
design floods have been subjected to substantial degree of
upward revision, the paper further examines the risk
perceptions evolving from such upward design flood
revisions and the vexed issues of mitigating such risk
concerns in existing dams. Finally, the paper highlights
the limitations of prevalent guidelines for design flood
estimations, while effecting risk mitigation measures in
existing dams.
2. Brief Description of DRIP
As a part of continuous strengthening of dam safety
activity in India, Dam Rehabilitation and Improvement
Project has been taken up with the World Bank assistance for
implementation initially in four States – namely: Kerala,
Madhya Pradesh (MP), Orissa, and Tamil Nadu (TN) – and
in Central Water Commission. Three more States /
Organisations (namely: State of Karnataka, Damodar Valley
Corporation Ltd., and Uttranchal Jal Vidyut Nigam Ltd.)
have joined DRIP at a later stage, for which a provision of
unallocated resources had been provided in the project
estimate.
Besides seeking rehabilitation of existing dams to current
acceptable level, the project also aims for the dam safety
institutional strengthening in the participating States and in
Central Water Commission. The main implementation
agencies for DRIP are the owners of dams – i.e. Water
Resources Departments and State Electricity Boards in the
participating States. The overall implementation of the
project is being coordinated by CWC, and for this purpose
CWC is assisted by an Engineering and Management
Consulting Firm. DRIP, with an estimated cost of Rs. 2100
crore has become effective from 18th
April 2012, and will be
implemented over a period of six-years.
The project presently targets for rehabilitation of 224 large
dams spread over seven States [5]. Many of these dams were
built based on the empirical formulae prevalent at that time
and found to be inadequate based on the current design
standards and philosophy. Under DRIP, before any
rehabilitation and improvement works are undertaken on a
dam, the design flood review is to be mandatorily carried out
[12]. Thus, under DRIP, design floods of all the 224 select
dams shall be reviewed in accordance with IS-11223 (as
revised), using the most appropriate and recent available data.
The rehabilitation works (structural interventions) or
operational procedures (non-structural methods of coping with
design floods) proposed under DRIP will have to ensure the
safety of the dam and reservoir with this revised design flood.
3. Trends in Design Flood Revisions
Under DRIP
An examination of the design flood data of 118 projects
indicates thatdesign floods of 32 dams qualify for Probable
Maximum Flood (PMF), 67 for Standard Project Flood (SPF)
and 19 for 100 Year Flood categories based on the criteria
stipulated in Bureau of Indian Standard – IS: 11223 (1985)
‘Guidelines for Fixing Spillway Capacity’, as reaffirmed in
1995. The State-wise break-up of the categories of design
flood for 118 dams are given in Figure 1.
The complete data set of original and revised design flood
values for the mentioned 118 DRIP dams is given in
Appendix. A comparison of the revised design flood values of
these DRIP dams with their respective original design flood
values indicates that there is an upward revision of over 50%
for 63% of the dams and an upward revision of over 100%
for 40% of the dams. The State-wise observed upward trend
of design flood revisions in case of 118 DRIP dams has been
summarized in Figure 2.
Figure 1. Design Flood Categorization of Dams under DRIP.

295 Ravi Kumar Pillai and Om Prakash Gupta: Incorporation of “Risk Factor” in Design Flood Review of Existing Dams
Figure 2. Observed Extent of Upward Revisions in Design Flood Values.
For many of the dams, the revised design flood values
have exceeded their earlier adopted values by substantial
orders. For example, in comparison to the original design
flood values, the revised design flood value of Kharadi dam
of Madhya Pradesh exceeded by 929%, Sher tank of Madhya
Pradesh exceeded by 503%, Manimukhanadhi Dam of Tamil
Nadu exceeded by 384%, and Mangalam dam of Kerala
exceeded by 525%. There are also few cases where revision
has actually ended up in downsizing of the estimated design
flood values. Out of 118 dams, there are six cases, where
reduction of the order of 10% and less has been observed,
while in one case – Siddamalli Dam Project of Tamil Nadu –
the reduction in design flood has been of the order of 39%.
Using the data set of revisions of design floods in DRIP
dams, an attempt has been made to establish the trends in the
observed (percentage) increase in design flood values.
Accordingly, scattered plots have been prepared reflecting
trends of ‘percentage increase in design flood values’ vis-à-
vis parameters of ‘dam height’, ‘age of dam’ and ‘gross
storage capacity of reservoir’. These plots are presented in
Figures 3, 4 & 5 respectively.
Figure 3. Scattered Plot of Increase in Design Flood Vs Dam Height.
Figure 4. Scattered Plot of Increase in Design Flood Vs Age of Dam.
0
20
40
60
80
100
120
140
160
180
-200 0 200 400 600 800 1000
Percentage increase in Design Flood
Heig
ht
of
Dam
(m
)
0
20
40
60
80
100
120
-200 0 200 400 600 800 1000
Percentage increase in Design Flood
Ag
e o
f D
am
(Y
ears
)

American Journal of Civil Engineering 2017; 5(5): 293-306 296
Figure 5. Scattered Plot of Increase in Design Flood Vs Gross Storage Capacity.
Any apparent trend is not being established in the scattered
plot of increase in design flood versus gross storage capacity
of reservoir. But, other two plots give the impression of
establishing such trends as: (i) Increase in revised design
flood values is lower for higher height of dam; and (ii)
Increase in revised design flood values is higher for older
dams. The importance of above stated trends can not to be
downplayed in the context to the occurrence of high degree
of upward design flood revisions for existing dams,
especially owing to perceptions of heightened risks
associated with such upward revisions, and the limited
options available in existing dams for mitigation of such
risks. The first identified trend in the revision of design
floods – in terms of dam heights – points out the possibility
of excessive reliance by the earlier designers on the empirical
methods for the original design flood estimations of low
height dams. On the other hand, the second identified trend
of design flood revision – in terms of age of dam –
strengthens the argument that availability of additional data is
impacting the extent of revision; and this argument can be
supported further by the following factors attributable as the
cause of upward revisions:
(a) Availability of additional data in respect of observed
flood peak used in flood frequency analysis.
(b) Availability of additional data/information about severe
most storms from hydro-meteorologically
homogeneous regions.
(c) Adoption of different temporal distribution pattern for
the standard project storm or probable maximum
storm.
(d) Changes in response function, i.e. unit hydrograph, as a
result of analysis of more number of flood events.
4. Risk Concerns of Upward Design
Flood Revisions
The upward revisions in the design flood estimates of
existing dams often lead to perceptions of amplifying the
risks associated with such existing dams. However,
contrary to these perceptions, the reality is that the
revisions in design flood estimate as such do not bring any
change in the risk status of an existing dam.
Risk, by definition, is the relationship between the
consequences resulting from an adverse event and its
probability of occurrence [6]. It includes consideration of
both failure likelihood and the consequences of failure. As a
measurable index, the risk can be computed as a product of
probability of failure and the measure of consequences –
higher the index, greater is the risk. Thus in a hypothetical
case of an existing dam planned for a design flood of 1 in
1,000 year return period (thereby meaning a flood related
failure probability of 0.001) and with an estimate of say 10
fatalities in case of failure (meaning a life related
consequence measure of 10), the risk index will be of the
order of 0.01. Now, assuming that there is no change in the
measure of consequence of dam failure, and assuming that
the design flood estimate has been subjected to upward
revisions corresponding to 1 in 10,000 year return period,
then what happens to the risk factor? There are varied
possibilities. Firstly, if additional remedial measures are not
taken to account for enhanced design flood level, then the
dam continues to retain the same failure probability of 0.001
(corresponding to original design flood level of 1,000 year
return period) and the same risk index of 0.01. Secondly, if
full remedial measures are undertaken, then the dam’s failure
probability now stands reduced to 0.0001(corresponding to
revised design flood level of 10,000 year return period) and
thereby the risk index will reduce to 0.001. The other
possibilities include achieving a risk index level anywhere
between 0.001 and 0.01, corresponding to the enhanced level
of spillway capacity achieved after dam’s rehabilitation. But,
in no case the risk index will increase beyond its original
level of 0.01.
The above hypothetical case clearly illustrates that an
upward revision in the design flood estimate of existing dam
in no way leads to amplification of the actual risk associated
with that dam. Rather, it brings an understanding of the gap
-1000
0
1000
2000
3000
4000
5000
6000
7000
8000
9000
-200 0 200 400 600 800 1000
Percentage increase in Design Flood
Gro
ss S
tora
ge C
ap
acit
y (
MC
M)
297 Ravi Kumar Pillai and Om Prakash Gupta: Incorporation of “Risk Factor” in Design Flood Review of Existing Dams
between existing risk level and the acceptable risk level (as
per present-day norms), and it also provides an opportunity
for reducing the existing risk level even further (at par with
acceptable risk level). The society in general is risk-averse
[7]; whereby meaning: if the consequences of an adverse
event (e.g. number of fatalities in an incidence of dam
failure) were to increase, the society will desire a decrease in
the likelihood of such event. The acceptable risk can be
represented as a log-log plot with annual failure probability
of the risk-prone event on the vertical axis and consequences
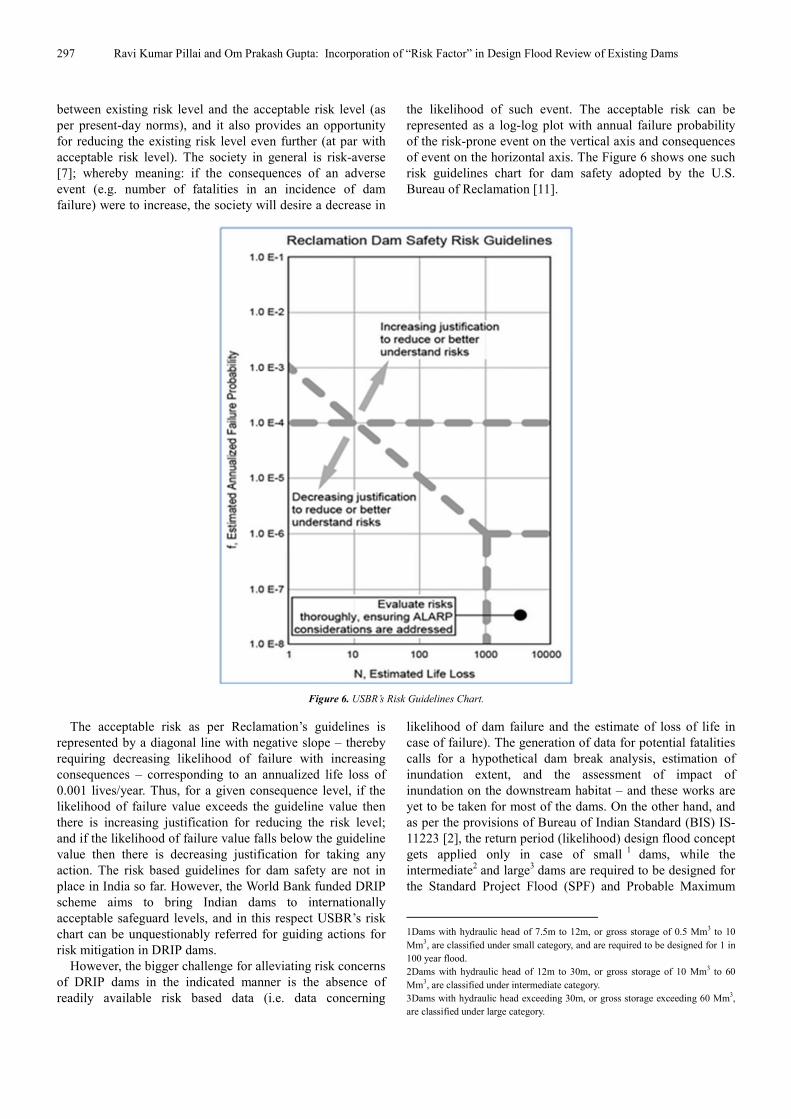
of event on the horizontal axis. The Figure 6 shows one such
risk guidelines chart for dam safety adopted by the U.S.
Bureau of Reclamation [11].
Figure 6. USBR’s Risk Guidelines Chart.
The acceptable risk as per Reclamation’s guidelines is
represented by a diagonal line with negative slope – thereby
requiring decreasing likelihood of failure with increasing
consequences – corresponding to an annualized life loss of
0.001 lives/year. Thus, for a given consequence level, if the
likelihood of failure value exceeds the guideline value then
there is increasing justification for reducing the risk level;
and if the likelihood of failure value falls below the guideline
value then there is decreasing justification for taking any
action. The risk based guidelines for dam safety are not in
place in India so far. However, the World Bank funded DRIP
scheme aims to bring Indian dams to internationally
acceptable safeguard levels, and in this respect USBR’s risk
chart can be unquestionably referred for guiding actions for
risk mitigation in DRIP dams.
However, the bigger challenge for alleviating risk concerns
of DRIP dams in the indicated manner is the absence of
readily available risk based data (i.e. data concerning
likelihood of dam failure and the estimate of loss of life in
case of failure). The generation of data for potential fatalities
calls for a hypothetical dam break analysis, estimation of
inundation extent, and the assessment of impact of
inundation on the downstream habitat – and these works are
yet to be taken for most of the dams. On the other hand, and
as per the provisions of Bureau of Indian Standard (BIS) IS-
11223 [2], the return period (likelihood) design flood concept
gets applied only in case of small1
dams, while the
intermediate2 and large
3 dams are required to be designed for
the Standard Project Flood (SPF) and Probable Maximum
1Dams with hydraulic head of 7.5m to 12m, or gross storage of 0.5 Mm3 to 10
Mm3, are classified under small category, and are required to be designed for 1 in
100 year flood.
2Dams with hydraulic head of 12m to 30m, or gross storage of 10 Mm3 to 60
Mm3, are classified under intermediate category.
3Dams with hydraulic head exceeding 30m, or gross storage exceeding 60 Mm3,
are classified under large category.

American Journal of Civil Engineering 2017; 5(5): 293-306 298
Flood (PMF) respectively. Apart from this limitation of the
prevalent guidelines for design flood estimation, its other
limitations in guiding risk mitigation of existing dams are
discussed in detail in subsequent paragraphs.
5. Design Flood Risk Mitigation
Measures Under DRIP
As brought out above, the data for guiding dam specific
risk based actions are not readily available for DRIP dams;
and in many a cases this data will be developed as an
outcome of DRIP activity, which may thus become available
only by the end of project period. Realizing this limitation
very early, the World Bank, Central Water Commission and
the DRIP States have agreed to a standardized approach for
mitigating the risks arising out of design flood. The design
flood risk mitigation approach – involving both structural
and non-structural measures – as brought out in the Project
Implementation Plan of DRIP [3] is summarized below:
a. Once the reviewed design flood is found to be
significantly higher than the original design flood,
adequacy of spillway capacity needs to be thoroughly
reviewed. When it is found that the revised design
flood hydrograph cannot be routed through the
spillway without encroaching into the free board as
per the norms, then various alternatives are available
to make the dam hydrologically safe. The solution to
be adopted will vary from case to case, and following
list of alternatives will be taken up during
implementation of DRIP for mitigating the increased
design flood:
(1) Augmenting4
the existing spillway capacity
through addition of more spillway bays of the same
type as existing.
(2) Provision of breaching sections or fuse plugs. If
suitable sites are available it is preferable to locate
such breaching sections on a saddle rather than on
the main dam section. However, it is required to
investigate the alignment of the surplus channel till
it meets the main channel to assess the likely
damages in the surrounding valley in the event of
design flood causing a breach.
(3) Increasing the freeboard above FRL of the dam by
provision of parapets including strengthening of
sections where necessary so that the flood cushion
available will be increased.
(4) Establishment of Early Warning System. An early
warning system involving flood forecasting by
utilizing real time data of rainfall, stage and
discharge at upstream stations will greatly help in
evacuating the downstream habitat area in
anticipation of severe flood inflows into the
4In an earlier dam safety program “Dam Safety Assurance & Rehabilitation
Project” assisted by the World Bank and implemented in four States of the India
during the period of 1991 to 1999, flood handling capabilities of several dams had
been upgraded by way of augmenting the existing spillway capacities.
reservoir.
(5) Increasing the flood storage by lowering the
conservation storage level, so that flood
moderation will be enhanced. However, this may
also result in some reduction in benefits and on the
positive side it will involve little investment
required for modification.
b. A suitable alternative is to be chosen by considering
various options that are feasible and working out the
relative benefit cost and the most favorable is to be
chosen.
c. In order to accommodate the revised design flood
magnitudes, there may be cases where the dam height
(but not the spillway height and so there will be no
increase in reservoir capacity) may have to be
increased if freeboard is not sufficient to allow
temporary heightening of the reservoir level. In such a
rare event, an adequate public warning system must
be in place to warn people living around the reservoir.
The option of increasing of dam height resulting in
the increase in storage volume or head will not be
considered under DRIP.
d. If the maximum water level in the reservoir were
temporarily to be increased during peak floods,
structural stability analysis will be made to ensure the
stability of the dam against the increased water load,
and the safety of the structure must be confirmed.
Also, in the event of the revised design flood
exceeding the spillway capacity (with normal
freeboard) by more than 50 percent, a comprehensive
warning system will also have to be put in place, and
an awareness campaign will be conducted, in
accordance with the emergency action plan.
e. Many a times structural interventions are not possible
owing to topographical and/or structural constraints.
In such a case it is often found difficult to increase the
capacity of an existing spillway to suit the revised
design flood. In such cases, routing trials can be
carried out for identification of lower reservoir levels
during the flood season. Even this, in some cases, is
found to be costly and unviable in terms of loss of
power and irrigation benefits and, therefore other
non-structural options can be considered for the safe
operation of the reservoir. It has been learned from
the past experiences that the best results in flood
mitigation can be achieved by combining structural
measures and non-structural measures. Emergency
action planning in terms of Emergency Action Plan
(EAP), implemented with Early Warning System
(EWS) where necessary, are non-structural measures
to minimize flood impacts and play an important roles
in emergency planning in case of dam break induced
flood event. Emergency action plans for downstream
flood plains, including warning and evacuation plan is
a special risk mitigation procedure. In fact, public risk
protection and EAP are very important dimensions in
any risk and crisis management methodology.
299 Ravi Kumar Pillai and Om Prakash Gupta: Incorporation of “Risk Factor” in Design Flood Review of Existing Dams
f. Even though floods of the order of PMF have only
very low exceedance probabilities, their possibility
cannot be ruled and in order to counter such
emergency situations there is a need to adopt both
well thought out structural remedies and also an
emergency action plan to be set in motion as soon as
an event unfolding is perceived. There is a provision
in DRIP that whenever revised design flood exceeds
the spillway capacity by more than 50 percent, the
emergency action plan will have to be prepared by the
State project authorities. However, it is worth
mentioning that an emergency action plan is not a
substitute for proper maintenance or remedial
construction, but it facilitates the recognition of dam
safety problems as they develop and establishes non-
structural means to minimize the risk of loss of life
and reduce property damage.
6. Limitations of Present Guidelines for
Design Flood Risk Mitigation of
Existing Dams
From the narration contained in this paper up till this point
it can be inferred that: (i) a substantial proportion of DRIP
dams are getting subjected to extensive upward revisions in
their design floods; (ii) these revisions underline the large
gap between the existing risk levels and the acceptable risk
levels; and (iii) under DRIP, suitable structural measures,
non-structural measure, or a combination of two measures
will be required to be undertaken to mitigate the identified
flood related risks. However, the depths/ degrees of concerns
marked under these three inferences (i.e. extent of upward
revision, gap from acceptable risks, and complexities of
remedial measures) relate to a common factor, namely the
present-day norms related to computation of design floods.
These norms are contained in the Indian Standard–
Guidelines for Fixing Spillway Capacity (IS: 11223 – 1985,
reaffirmed in 1995). This Standard lays down the guidelines
for fixing spillway capacity consistent with the safety of the
dam; and towards this intent it also lays down the norm for
inflow design flood of dam. Some of the limitations of this
Standard, in general as well as in specific context to existing
dams – supported by inferences drawn from DRIP dams – are
discussed below.
As per internationally accepted practice, the norms for
inflow design floods are developed primarily on the basis of
hazard categorization5 of dams. Thus, floods of greater return
periods are considered as acceptable design floods for dams
posing larger hazard potentials in terms of loss of lives or
economic losses. In these norms, secondary importance is
also given to the parameters of dam height and dam storage
because these can play proportional role in the severity of the
5Hazard categorization is a system of classifying dams according to the degree of
adverse incremental consequences of failure or misoperation of a dam. The
hazard categorization does not reflect in any way on the current condition of the
dam (i.e. safety, structural integrity, flood routing capacity etc.).
hazard (in terms of level, velocity, and duration of
submergence flows) brought about by dam failure. Evidently,
in the international norms – applying the risk based approach
for dam safety – the probability of occurrence of design flood
(indicative of the probability of dam failure due to floods)
gets decided by the measure of consequences of failure.
However, in India, the system of hazard classification of
dams is still not in place; and in light of this constraint the
desired primary basis of developing design flood norms
(namely, the hazard categorization of dam) has not been
applied in the case of IS: 11223. Instead, the Indian norms for
inflow design floods have been developed solely on the basis
of the height and storage parameters of the dam. This
limitation of the Indian Standard apparently brings
unwarranted skew in the distribution of the estimates of
design flood values, often raising issues of technical and
economical viability of meeting the requirements of the
Standard.
The IS: 11223 Standard has provision for only three
categories of inflow design floods – namely, 100 year return
period flood, Standard Project Flood (SPF) and Probable
Maximum Flood (PMF). The SPF (computed by using the
Standard Project Storm) is expected from the most severe
combination of hydrological and meteorological factors, and
may match to a flood of the order of 1,000 year return period.
On the other hand, the PMF (computed by using the Probable
Maximum Storm) corresponds to the physical upper limit to
maximum precipitation, and may match to a flood of the
order of 10,000 year return period or even higher.
Though SPF and PMF values are not truly the probabilistic
estimates of the design flood, even then it can be safely
concluded that only three acceptable levels of design flood
probabilities have been considered and that too with
substantial jump – from 1-in-100, to 1-in-1000, and finally to
1-in-10000. And these abrupt jumps are linked only to the
hydraulic head (related to dam height) and gross storage
parameters of the dam in the manner indicated in Table 1
below. As per this Standard, the hydraulic head criteria and
the gross storage criteria need to be fulfilled in isolation (and
not concurrently) for arriving at the design flood level of the
dam.
Table 1. Inflow Design Flood (as per IS: 11223-1985).
Dams with gross
storage
Dams with hydraulic
head
Inflow Design
Flood
0.5 Mm3 to 10Mm3 7.5m to 12m 100 year flood
10 Mm3 to 60Mm3 12 m to 30 m SPF
Greater than 60Mm3 Greater than 30 m PMF
Though the Standard, in full earnest, also provides for use
of a larger or smaller magnitude floods based on high or low
hazard potential of the dam, but this adjustment is perhaps
never made owing to the absence of hazard rating and also
because of insufficient clarity on the application of this
clause. A cursory examination of the Table will thus show
that a dam with height of 12m will have an acceptable design
flood level of 100 year return period, while a marginally
higher dam of 12.5 m will invariably call for a design flood

American Journal of Civil Engineering 2017; 5(5): 293-306 300
of the order of 1,000 year return period (corresponding to
SPF); and similar anomaly will be encountered for dams of
height bordering 30m. On the same lines, the design flood
values arrived on the basis of gross storage will show skew in
its distribution.
As pointed out earlier, the analysis of the recently
completed design flood studies (applying IS: 11223) of 118
DRIP dams indicates that about 25% of them come under
PMF category, about 55% under SPF category, and about
20% under 100 year return period category. In this manner,
about 80% of the dams are being (re)classified under the
categories of very high design floods –corresponding to
1,000 year or 10,000 year return periods. And, this is being
done without having even an indicative assessment of the
consequences of respective dam failures. As explained
earlier, these large revised estimates are merely creating wide
gaps between the existing spillway capacities of the dams
and their design floods, without any alteration in the actual
risk factors. As described, efforts are being made under DRIP
to augment the spillway capacities of these dams to their
revised design flood levels, but in many a cases it may not be
possible to bridge the gap or to even reduce it in significant
manner. Consequentially, substantial efforts are also likely to
get directed towards non-structural interventions for
mitigation of design flood risks. It is generally felt by the
officials concerned with the DRIP that an imbalance is being
encountered in DRIP activities on account of high design
flood revisions, reasons for which can be attributed to the
limitations of the Indian Standard as elucidated above. Since
in terms of varied parameters, the portfolio of DRIP dams
presents a close sample of the total basket of Indian dams, the
prevalence of this challenge in respect of balance dams of the
country cannot be ruled out.
The ultimate remedy for the above problem lies in the
establishment of proper hazard classification system and
hazard categorization of the dams, followed by risk based
amendments of the Indian Standards. However, till such
times, some amendments may also be required in the current
Standards to improve upon the mentioned skewed situation
for at least the existing large dams of the country. With this
perspective and since absolute reliance has been placed on
the criteria of dam height and gross storage for determination
of design flood, an attempt has been made to establish the
correlation of computed design floods with the parameters of
dam height and gross storage capacity. Accordingly, scattered
plots have been developed to establish mentioned
correlations and these plots are shown in Figures 7 & 8.
Figure 7. Scattered Plot of Design Flood Vs Dam height.
Figure 8. Scattered Plot of Design Flood Vs Dam Storage.
y = 93.859x + 544.88
R2 = 0.0973
0
10000
20000
30000
40000
50000
60000
70000
80000
0 20 40 60 80 100 120 140 160 180
Height of Dam (m)
De
sig
n F
loo
d (
Cu
me
c)
y = 7.9253x + 1703.7
R2 = 0.8288
0
10000
20000
30000
40000
50000
60000
70000
80000
0 1000 2000 3000 4000 5000 6000 7000 8000 9000
Gross Storage Capacity (MCM)
De
sig
n F
loo
d (
Cu
me
c)
301 Ravi Kumar Pillai and Om Prakash Gupta: Incorporation of “Risk Factor” in Design Flood Review of Existing Dams
From the computed values of Coefficient of
Determination6 it is observed that a strong correlation is
established between the design flood and the gross storage
capacity – i.e. estimate of design flood closely increases
with the increase in design storage capacity of the dam.
However, very poor correlation exists between the design
flood and the dam height – i.e. estimate of design flood
increases or decreases at random with the increase in dam
height. Evidently it means that the application of dam
height criteria (when it is not being applied as a parameter
influencing the failure consequences) in isolation for the
determination of design flood may not be appropriate.
A remedy for this anomaly can be found in the
concurrent application of the hydraulic head criteria with
the gross storage criteria for arriving at the desired design
flood levels of existing large dams. Assuming the minimum
design flood criteria of 100 year return period for any large
dam, the application of this slightly modified approach in
the data set of DRIP dams show a marked improvement in
the distribution of design flood as brought out in Table 2
below:
Table 2. Design Flood Distribution.
Inflow
Design Flood
Number (& percentage) of dams
with isolated application
of dam height and gross
storage criteria
with concurrent
application of dam height
and gross storage criteria
100 year flood 19 (16%) 65 (55%)
SPF 67 (57%) 34 (29%)
PMF 32 (27%) 19 (16%)
It is also felt that there is scope for the introduction of
two more levels of flood category; one between 100 year
flood and SPF categories, and another between SPF and
PMF categories. Between the 100 year and SPF categories,
it is proposed to introduce ‘500 year flood’ category.
Between SPF and PMF categories, a category of ‘3000 year
flood’ may be introduced; alternatively ‘average of SPF and
PMF’ may be considered under this level. In order to make
a clear distinction between the actual design flood capacity
and the acceptable design flood of a dam, it is further
suggested to use a new nomenclature of ‘Safety Basis Flood
(SBF)’. Appropriate norms proposed for computation of
Safety Basis Flood of Large Dams7are summarized in Table
3 below:
The nomenclature of ‘Design Flood’ shall be retained to
indicate the actual spillway routed capacity of the dam, as
6 Coefficient of Determination (R2) is a parameter which gives the strength of
correlation between the two variables. 0< R2<1.
7A Large dam, as per the definition given by ICOLD [8], means a dam with a
maximum height of more than 15 metres from its deepest foundation to the crest.
A dam between 10 and 15 metresin height from its deepest foundation is also
included in the classification of a large dam provided it complies with one of the
following conditions: (a) length of crest of the dam is not less than 500 metres or
(b) capacity of the reservoir formed by the dam is not less than one million cubic
metres or (c) the maximum flood discharge dealt with by the dam is not less than
2000 cubic metres per second or (d) the dam has specially difficult foundation
problems, or (e) the dam is of unusual design.
built. The SBF shall be computed on return-period basis (i.e.
in terms of probability) so as to enable meaningful risk
assessment of existing dams; and the actual (routed) design
flood capacities of existing dams shall be expressed as
percentage of SBF so as to systematically highlight the gap
between actual and acceptable flood risks. It is also proposed
to compute the PMF for every large dam so as to assess the
upper bound (or envelop) of the potential flood at the dam
site and thereby giving an understanding of the dam’s
ultimate risk potential; and present the SBF as percentage of
PMF so as to point out the level of risk-acceptance in relation
to ultimate-risk.
Table 3. Safety Basis Flood for Large Dams.
Large Dam Criteria Safety Basis Flood
Dam Height (H) Dam’s Storage (S)
> 30m > 100 Mm3 PMF
> 30m 60 Mm3 to 100 Mm3 Return Period: 3000 yrs
15m to 30m >30 Mm3 Return Period: 1000 yrs
15m to 30m 10 Mm3 to 30 Mm3 Return Period: 500 yrs
< 15m < 30 Mm3 Return Period: 100 yrs
Based on the above discussion, it is proposed to suitably
amend the IS: 11223 Standard for existing large dams, or to
formulate a new Standard for revision of design floods of
existing large dams.
7. Conclusions
Examination of revised design flood studies carried out for
a set of 118 dams under ‘Dam Rehabilitation and
Improvement Project’ reveal that the design flood values
invariably increase as a result of reviews as per IS: 11223
Standard except for few cases. In majority of cases, the
upward revision in design flood is on very high side,
exceeding the 50% mark. The observed trends indicate that
the percentage increases in the revised design flood values
are greater for lower (height) dams and for older dams.
However, the upward revision in the design flood estimate of
existing dam in no way leads to amplification of the actual
risk associated with that dam. Rather, it brings an
understanding of the gap between existing risk level and the
acceptable risk level thereby providing an opportunity for
reducing the existing risk level even further (at par with
acceptable risk level). But, risk mitigation (for floods) in
existing dams is a challenging task calling for structural as
well as non-structural alternatives, often facing constraints of
technical and economical viability. The challenge is
compounded by the skewed distribution of revised design
floods on account of present-day norms related to
computation of design floods, as contained in the Indian
Standard – Guidelines for Fixing Spillway Capacity (IS:
11223 – 1985). After examining in detail the limitations of
the Standard, the paper brings out proposal for its suitable
amendments in respect of existing large dams incorporating:
(i) concurrent application of the hydraulic head criteria with
gross storage criteria for deciding the design flood category

American Journal of Civil Engineering 2017; 5(5): 293-306 302
of a dam; and (ii) introduction of two more design flood
categories – namely, ‘500 year flood’ to be placed between
100 year and SPF categories, and ‘average of SPF and PMF’
to be placed between SPF and PMF categories. Alternatively
the recourse of formulation of a new Standard for revision of
design floods of existing large dams has been proposed.
Appendix
Original and Revised Design flood Values for 118 DRIP Dams.
Sl. No. Name of Dam State/ Organization* Original Design Flood (Cumec) Revised Design Flood (Cumec)
1 Sanjay Sarovar (Bhim Garh Project) Madhya Pradesh 16652 15428
2 Ari Project Madhya Pradesh 240 1241
3 Tawa Project Madhya Pradesh 30800 29619
4 Jirbhar Project Madhya Pradesh 373.5 1074
5 Thanwar Tank Madhya Pradesh 3993.2 7137
6 Sakhiya Sagar (Chanda Patha Project) Madhya Pradesh 424 1226
7 Barna Project Madhya Pradesh 13557 13235
8 Kankarkhera Tank Project Madhya Pradesh 144 625
9 Gopi Krishan Sagar Project Madhya Pradesh 3605 4209
10 Kharadi Project Madhya Pradesh 100 1029.8
11 Nahlesara Project Madhya Pradesh 271.68 1543.6
12 Chandra Keshar Project Madhya Pradesh 870.84 1644
13 Sagarnadi Project Madhya Pradesh 186 758
14 Kolar Project Madhya Pradesh 8605 8605
15 Sarathi Tank Project Madhya Pradesh 289 1651
16 Sampana Project Madhya Pradesh 492 788
17 Mooram Nallah Project Madhya Pradesh 185 852
18 Chawarpani Project Madhya Pradesh 202.53 453.8
19 Bundala Tank Madhya Pradesh 838 1512
20 Marhi Tank Madhya Pradesh 296.7 952
21 Kunwar Chain Madhya Pradesh 1310 1733
22 Makroda Tank Madhya Pradesh 598.41 2554
23 Sanjay Sagar Tank project Madhya Pradesh 1565 2039
24 Sher Project Madhya Pradesh 120 724
25 Sundrel Madhya Pradesh 60.81 66.05
26 Gangulpara Madhya Pradesh 191.73 607
27 Guradia Surdas Madhya Pradesh 110 215.57
28 Manjhikhedi Madhya Pradesh 88.52 123.23
29 Lasudiakanger Madhya Pradesh 68.74 179.98
30 Dhablamata Madhya Pradesh 72.44 133.08
31 Deogaon Madhya Pradesh 182.2 476.16
32 Birpur Madhya Pradesh 423.99 737
33 Birnai Madhya Pradesh 81.13 268
34 Umrar Madhya Pradesh 479.78 1449
35 Kamera Madhya Pradesh 279.99 825
36 Arniya Bahadurpur Madhya Pradesh 533 818
37 Tigra Madhya Pradesh 4067 6672
38 Dholawad Tank Madhya Pradesh 1473 2396
39 Kanhargaon Tank Madhya Pradesh 736 1621
40 Kachan Madhya Pradesh 485 1586
41 Banksal Dam Project Odisha 420 868
42 Kalo Dam Project Odisha 965 1997
43 Nesa Dam Project Odisha 351 364
44 Sanamachhakandana Dam Project Odisha 226 374
45 Padampurnalla Odisha 303 443
46 Budhabudhiani Odisha 401 903
47 Balaskumpa Odisha 132.48 302
48 Ashokanalla Odisha 69.34 221
49 Daha Odisha 1380 1828
50 Derjang Odisha 3952 3590
51 Dhanel Odisha 733 1230
52 Pillasalki Odisha 793 1054
53 Salia Odisha 1019.42 2464
54 Sarafgarh Odisha 695 819
55 Satiguda (Malkangiri) Odisha 1060 1883
56 Talsara Odisha 820 913
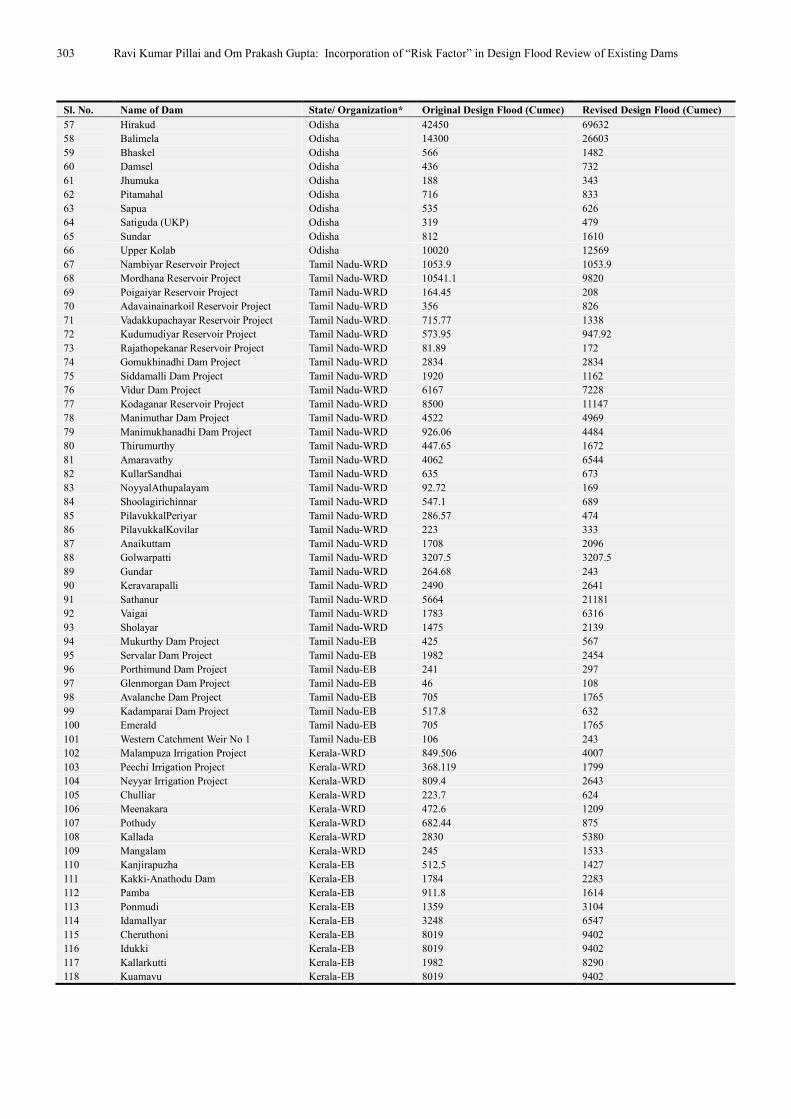
303 Ravi Kumar Pillai and Om Prakash Gupta: Incorporation of “Risk Factor” in Design Flood Review of Existing Dams
Sl. No. Name of Dam State/ Organization* Original Design Flood (Cumec) Revised Design Flood (Cumec)
57 Hirakud Odisha 42450 69632
58 Balimela Odisha 14300 26603
59 Bhaskel Odisha 566 1482
60 Damsel Odisha 436 732
61 Jhumuka Odisha 188 343
62 Pitamahal Odisha 716 833
63 Sapua Odisha 535 626
64 Satiguda (UKP) Odisha 319 479
65 Sundar Odisha 812 1610
66 Upper Kolab Odisha 10020 12569
67 Nambiyar Reservoir Project Tamil Nadu-WRD 1053.9 1053.9
68 Mordhana Reservoir Project Tamil Nadu-WRD 10541.1 9820
69 Poigaiyar Reservoir Project Tamil Nadu-WRD 164.45 208
70 Adavainainarkoil Reservoir Project Tamil Nadu-WRD 356 826
71 Vadakkupachayar Reservoir Project Tamil Nadu-WRD 715.77 1338
72 Kudumudiyar Reservoir Project Tamil Nadu-WRD 573.95 947.92
73 Rajathopekanar Reservoir Project Tamil Nadu-WRD 81.89 172
74 Gomukhinadhi Dam Project Tamil Nadu-WRD 2834 2834
75 Siddamalli Dam Project Tamil Nadu-WRD 1920 1162
76 Vidur Dam Project Tamil Nadu-WRD 6167 7228
77 Kodaganar Reservoir Project Tamil Nadu-WRD 8500 11147
78 Manimuthar Dam Project Tamil Nadu-WRD 4522 4969
79 Manimukhanadhi Dam Project Tamil Nadu-WRD 926.06 4484
80 Thirumurthy Tamil Nadu-WRD 447.65 1672
81 Amaravathy Tamil Nadu-WRD 4062 6544
82 KullarSandhai Tamil Nadu-WRD 635 673
83 NoyyalAthupalayam Tamil Nadu-WRD 92.72 169
84 Shoolagirichinnar Tamil Nadu-WRD 547.1 689
85 PilavukkalPeriyar Tamil Nadu-WRD 286.57 474
86 PilavukkalKovilar Tamil Nadu-WRD 223 333
87 Anaikuttam Tamil Nadu-WRD 1708 2096
88 Golwarpatti Tamil Nadu-WRD 3207.5 3207.5
89 Gundar Tamil Nadu-WRD 264.68 243
90 Keravarapalli Tamil Nadu-WRD 2490 2641
91 Sathanur Tamil Nadu-WRD 5664 21181
92 Vaigai Tamil Nadu-WRD 1783 6316
93 Sholayar Tamil Nadu-WRD 1475 2139
94 Mukurthy Dam Project Tamil Nadu-EB 425 567
95 Servalar Dam Project Tamil Nadu-EB 1982 2454
96 Porthimund Dam Project Tamil Nadu-EB 241 297
97 Glenmorgan Dam Project Tamil Nadu-EB 46 108
98 Avalanche Dam Project Tamil Nadu-EB 705 1765
99 Kadamparai Dam Project Tamil Nadu-EB 517.8 632
100 Emerald Tamil Nadu-EB 705 1765
101 Western Catchment Weir No 1 Tamil Nadu-EB 106 243
102 Malampuza Irrigation Project Kerala-WRD 849.506 4007
103 Peechi Irrigation Project Kerala-WRD 368.119 1799
104 Neyyar Irrigation Project Kerala-WRD 809.4 2643
105 Chulliar Kerala-WRD 223.7 624
106 Meenakara Kerala-WRD 472.6 1209
107 Pothudy Kerala-WRD 682.44 875
108 Kallada Kerala-WRD 2830 5380
109 Mangalam Kerala-WRD 245 1533
110 Kanjirapuzha Kerala-EB 512.5 1427
111 Kakki-Anathodu Dam Kerala-EB 1784 2283
112 Pamba Kerala-EB 911.8 1614
113 Ponmudi Kerala-EB 1359 3104
114 Idamallyar Kerala-EB 3248 6547
115 Cheruthoni Kerala-EB 8019 9402
116 Idukki Kerala-EB 8019 9402
117 Kallarkutti Kerala-EB 1982 8290
118 Kuamavu Kerala-EB 8019 9402

American Journal of Civil Engineering 2017; 5(5): 293-306 304
Continue. Original and Revised Design flood Values for 118 DRIP Dams.
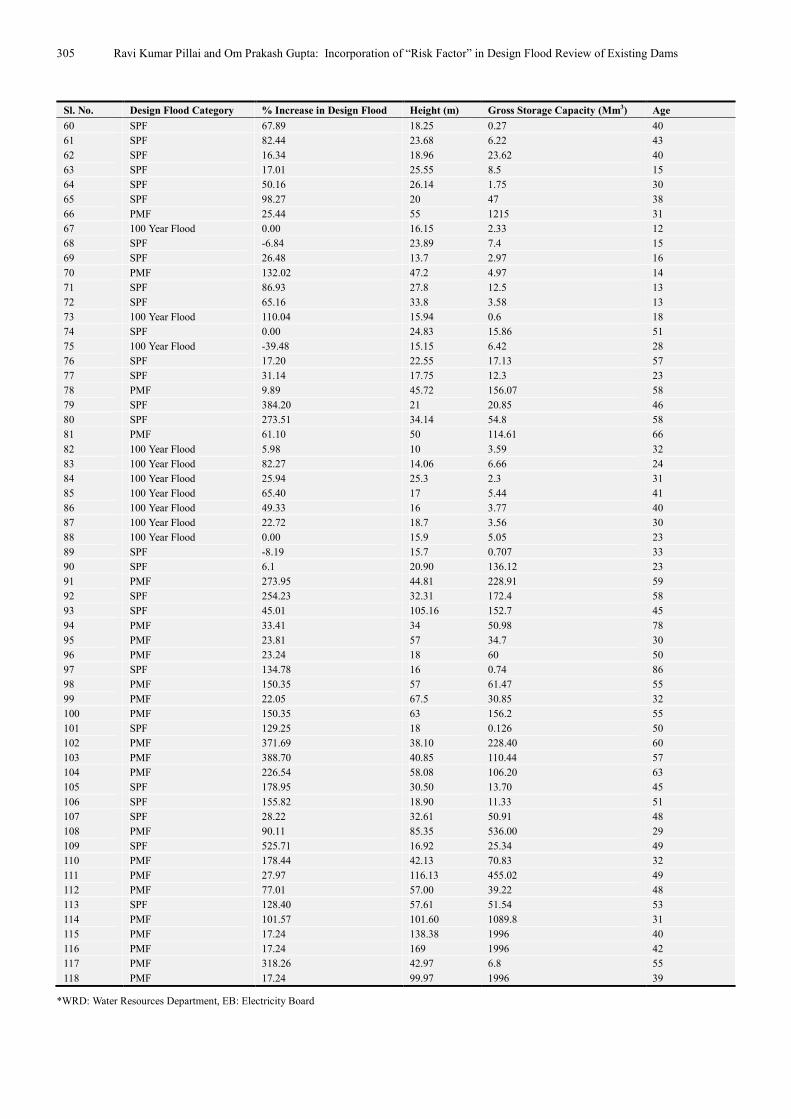
Sl. No. Design Flood Category % Increase in Design Flood Height (m) Gross Storage Capacity (Mm3) Age
1 PMF -7.35 42.67 507 28
2 SPF 417.08 19.5 15.3 60
3 PMF -3.83 32 2311.54 38
4 SPF 187.55 21.33 11.19 32
5 PMF 78.73 27.1 139.2 32
6 SPF 189.15 13.81 7.79 94
7 PMF -2.38 47.7 539 37
8 100 Year Flood 334.03 15.65 4.83 32
9 PMF 16.75 30.8 85.01 17
10 SPF 929.80 14.17 14.73 52
11 SPF 468.17 21.89 16.143 44
12 SPF 88.78 18.9 30.07 36
13 SPF 307.53 17.21 5.13 46
14 PMF 0.00 45 270 23
15 SPF 471.28 17.68 17.05 89
16 SPF 60.16 21.95 16.9 56
17 SPF 360.54 18.1 5.9 62
18 SPF 124.07 12.95 3.75 52
19 SPF 80.43 27.3 20.41 26
20 SPF 220.86 28.94 14.24 33
21 SPF 32.29 18.28 26.66 11
22 SPF 326.80 30.97 46.57 32
23 SPF 30.29 40.85 37.51 13
24 SPF 503.33 17 3.53 33
25 100 Year Flood 8.62 12.6 0.874 25
26 100 Year Flood 216.59 19.51 11.38 53
27 SPF 95.97 16.58 3.18 16
28 100 Year Flood 39.21 19.76 2.74 22
29 100 Year Flood 161.83 13.41 3.12 31
30 100 Year Flood 83.71 10.67 2.755 36
31 100 Year Flood 161.34 17.43 0.413 25
32 100 Year Flood 73.82 13.49 5.469 8
33 100 Year Flood 230.33 18.26 1.661 26
34 SPF 202.01 27.76 18.9 26
35 SPF 194.65 12 3.37 106
36 SPF 53.5 18.90 25.23 36
37 PMF 64.05 24.08 130 99
38 SPF 62.66 36.86 54.27 30
39 SPF 120.24 30.31 26.97 30
40 SPF 227.01 25.45 40.27 37
41 SPF 106.67 14.63 4.98 34
42 SPF 106.94 24.24 29.7 34
43 SPF 3.70 18 7.8 34
44 SPF 65.49 16.15 4.53 37
45 SPF 46.20 14.17 7.103 37
46 SPF 125.19 24.39 22 49
47 SPF 127.96 17.69 1.15 39
48 SPF 218.72 22.08 0.57 29
49 SPF 32.46 19.3 28 28
50 SPF -9.16 27.81 46 38
51 SPF 67.80 20.57 15.32 51
52 SPF 32.91 26.5 19.2 28
53 SPF 141.71 32.91 60.66 46
54 SPF 17.84 26 13.75 31
55 SPF 77.64 25.5 76.2 36
56 SPF 11.34 25.82 19.85 32
57 PMF 64.03 60.96 8136 59
58 PMF 86.03 70 3610 39
59 SPF 161.84 26.86 29.82 50
305 Ravi Kumar Pillai and Om Prakash Gupta: Incorporation of “Risk Factor” in Design Flood Review of Existing Dams
Sl. No. Design Flood Category % Increase in Design Flood Height (m) Gross Storage Capacity (Mm3) Age
60 SPF 67.89 18.25 0.27 40
61 SPF 82.44 23.68 6.22 43
62 SPF 16.34 18.96 23.62 40
63 SPF 17.01 25.55 8.5 15
64 SPF 50.16 26.14 1.75 30
65 SPF 98.27 20 47 38
66 PMF 25.44 55 1215 31
67 100 Year Flood 0.00 16.15 2.33 12
68 SPF -6.84 23.89 7.4 15
69 SPF 26.48 13.7 2.97 16
70 PMF 132.02 47.2 4.97 14
71 SPF 86.93 27.8 12.5 13
72 SPF 65.16 33.8 3.58 13
73 100 Year Flood 110.04 15.94 0.6 18
74 SPF 0.00 24.83 15.86 51
75 100 Year Flood -39.48 15.15 6.42 28
76 SPF 17.20 22.55 17.13 57
77 SPF 31.14 17.75 12.3 23
78 PMF 9.89 45.72 156.07 58
79 SPF 384.20 21 20.85 46
80 SPF 273.51 34.14 54.8 58
81 PMF 61.10 50 114.61 66
82 100 Year Flood 5.98 10 3.59 32
83 100 Year Flood 82.27 14.06 6.66 24
84 100 Year Flood 25.94 25.3 2.3 31
85 100 Year Flood 65.40 17 5.44 41
86 100 Year Flood 49.33 16 3.77 40
87 100 Year Flood 22.72 18.7 3.56 30
88 100 Year Flood 0.00 15.9 5.05 23
89 SPF -8.19 15.7 0.707 33
90 SPF 6.1 20.90 136.12 23
91 PMF 273.95 44.81 228.91 59
92 SPF 254.23 32.31 172.4 58
93 SPF 45.01 105.16 152.7 45
94 PMF 33.41 34 50.98 78
95 PMF 23.81 57 34.7 30
96 PMF 23.24 18 60 50
97 SPF 134.78 16 0.74 86
98 PMF 150.35 57 61.47 55
99 PMF 22.05 67.5 30.85 32
100 PMF 150.35 63 156.2 55
101 SPF 129.25 18 0.126 50
102 PMF 371.69 38.10 228.40 60
103 PMF 388.70 40.85 110.44 57
104 PMF 226.54 58.08 106.20 63
105 SPF 178.95 30.50 13.70 45
106 SPF 155.82 18.90 11.33 51
107 SPF 28.22 32.61 50.91 48
108 PMF 90.11 85.35 536.00 29
109 SPF 525.71 16.92 25.34 49
110 PMF 178.44 42.13 70.83 32
111 PMF 27.97 116.13 455.02 49
112 PMF 77.01 57.00 39.22 48
113 SPF 128.40 57.61 51.54 53
114 PMF 101.57 101.60 1089.8 31
115 PMF 17.24 138.38 1996 40
116 PMF 17.24 169 1996 42
117 PMF 318.26 42.97 6.8 55
118 PMF 17.24 99.97 1996 39
*WRD: Water Resources Department, EB: Electricity Board

American Journal of Civil Engineering 2017; 5(5): 293-306 306
References
[1] Benstsson, S. (2001). Case Study: Risk Analysis of Spillway Gate function. Licentiate thesis at the Division of Hydraulics Engineering. Dam Safety and Risk Management. KTH. Stockholm.
[2] BIS (Bureau of Indian Standard) (1985). Guidelines for Fixing Spillway Capacity, IS-11223 (1985). New Delhi.
[3] CWC (Central Water Commission) (2010). Project Implementation Plan of Dam Rehabilitation and Improvement Project. New Delhi.
[4] CWC (Central Water Commission) (2016). National Register of Large Dams (2016). http://www.cwc.nic.in/main/downloads/New%20NRLD.pdf (Accessed August 16, 2017).
[5] CWC (Central Water Commission) (2017). Dam Rehabilitation & Improvement Project Web Page. https://damsafety.in/?page=About%20DRIP&origin=front-end&page_id=63&lang=en(Accessed August 16, 2017).
[6] FEMA (Federal Emergency Management Agency) (2004). Federal Guidelines for Dam Safety: Selecting and Accommodating Inflow Design Floods for Dams. Maryland, USA.
[7] Gregg A. Scott (2011). The Practical Application of Risk Assessment to Dam Safety, ASCE.
[8] ICOLD (International Committee on Large Dams) (1982). A Glossary of Words and Phrases related to Dams, Bulletin 31a. Paris.
[9] ICOLD (International Committee on Large Dams) (1995). Dam failure Statistical Analysis, Bulletin 99. Paris.
[10] ICOLD (International Committee on Large Dams) (2017). Number of Dams by Country Members. http://www.icold-cigb.net/article/GB/world_register/general_synthesis/number-of-dams-by-country-members (Accessed August 16, 2017).
[11] USBR (United States Bureau of Reclamation) (2011). Dam Safety Public Protection Guidelines. Denver, USA.
[12] World Bank (2010). Project Appraisal Document on Dam Rehabilitation and Improvement Project, Report No. 51061-IN. Washington.


![Incorporation of Okara into Gluten-Free Cookies with High ...downloads.hindawi.com/journals/jfq/2017/4071585.pdfis an important factor in cookie quality evaluation [11]. Hardness is](https://img.pdfslide.us/doc/110x75/5e9a531304393c78e72368a9/incorporation-of-okara-into-gluten-free-cookies-with-high-is-an-important-factor.jpg)


![[Code of Federal Regulations]€¦ · Web viewFreeboard means a factor of safety usually expressed in feet above a flood level for purposes of flood plain management. ``Freeboard](https://img.pdfslide.us/doc/110x75/5e87cb88ff042516ad3cd381/code-of-federal-regulations-web-view-freeboard-means-a-factor-of-safety-usually.jpg)