Embed Size (px)
Citation preview

Incorporating Travel Time Reliability Data in Travel Path Estimation
Sam Granato, Ohio DOTRakesh Sharma, Belomar Regional Council

Which travel path to take?• Not much to do with “equilibrium” (latest exp. GPS study - only
1/3 of travelers on shortest time path, none on the shortest distance path - unless the same as shortest time path).
• Why? Plenty of day-to-day variability in both link-level volumes and travel delays (as well as differences in traveler perceptions).
• Use of variability of travel times in models born out of a sense that delay should somehow get more “weight” than other travel time for impatient drivers (but I never followed thru on some initial ideas for “off-line” weighting via static (& 1-off) link penalties).

How do people select a travel path?
• Distance (fixed)• Travel time (average) • Travel time (variability/reliability)• Pavement condition• Safety (perceived, both on and off-road)• “Fear of merging”• The “scenic route?”

The occasional scenic diversion . . .

Forecasting framework using
“not your father’s QRSII”
DTA is integrated within 4-step process as a
feedback loop instead of a “stand-alone” process,
while a separate (3rd) loop estimates the
“reliable” travel paths - if non-additive by link.
Trip Generation
Trip Distribution
Mode Split
All-or-Nothing TrafficAssignment to Links,
Intersections and Time Slices
Measures ofEffectiveness
Delay Calculations
TransitAssignment(last k, only)
NextTime
Slice,
NextEquilibriuimIteration, k
Measures ofEffectiveness
VolumeAveraging
Highway Times,Paths, Time
Slices
Year/ Scenario/Alternative/
Random Effects

Implementing Reliability in Path Building step:
• Total Path Impedance (RR = reliability ratio)
• Variance of Path Travel Time
• Thru movements on successive links are correlated.
• Marginal change in travel time standard deviation from selecting the next link:
• So that for any path between an origin and destination:
pathpathpathpath ytRRI
1
111,
1
22 2M
iiiii
M
iipath r
5.02
111,
1
1
2
5.01
111,
1
2 22
k
iiiii
k
ii
k
iiiii
k
iik rrR
M
iipath R
1

Details of the Link-level Reliability calcs:
• Path correction using MSA, vine building necessary.• Convergence found in a finite number of steps (via
calculation of “path error” term).• Link travel time includes intersection delay, while
standard deviation derived from the coefficient of variation equation
• “Free” travel time t0 includes intersection delays under low-flow conditions. (L=link length)
• Calibration coefficients can vary by road type
Lt
tCV
0
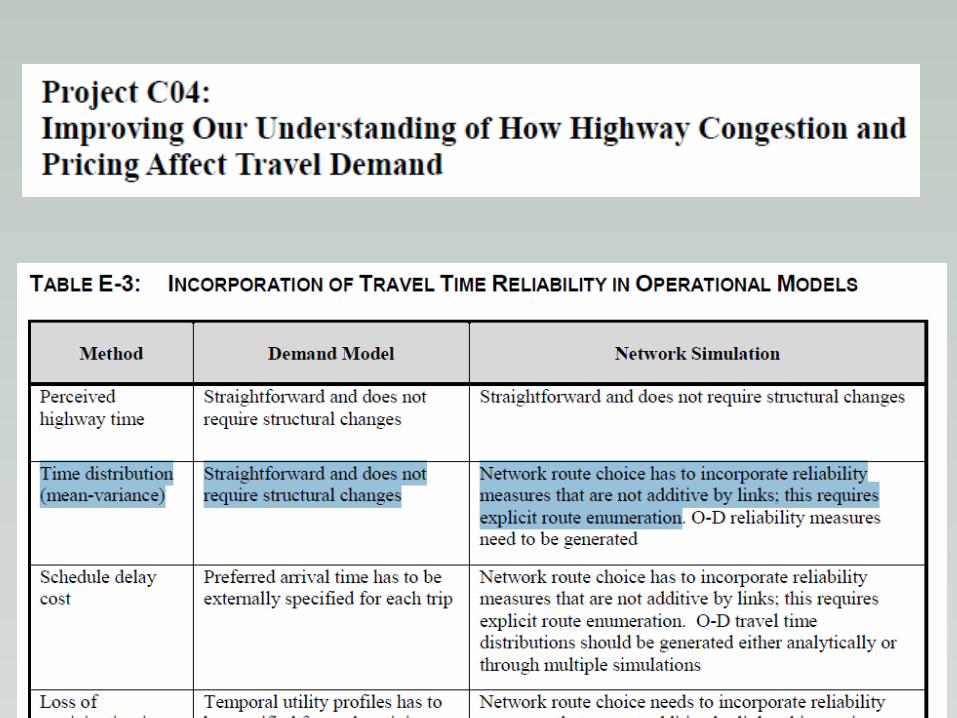
Reliability Parameters
Link Impedance =all other components + (reliability ratio)*t*CV

Wheeling Area Travel Demand
Model
150,000 metro population, 900 modeled intersections (125
signalized), validated to local travel time surveys as well as counts

Initial CV estimates (by route) from research in UK

Variability in intersection delay from travel time survey with large sample sizes from nearby MPO region
From “local” floating-car surveys:

Travel time variability as a function of route length, or number of intersections

Simplified Example (average time/”free-flow” time):(All links are 0.25 miles with running speed=30 mph so “running” time=0.5 minutes)

Path impedance with reliability (additive)(Posted: Average time / standard deviation)
Lt
tCV
0
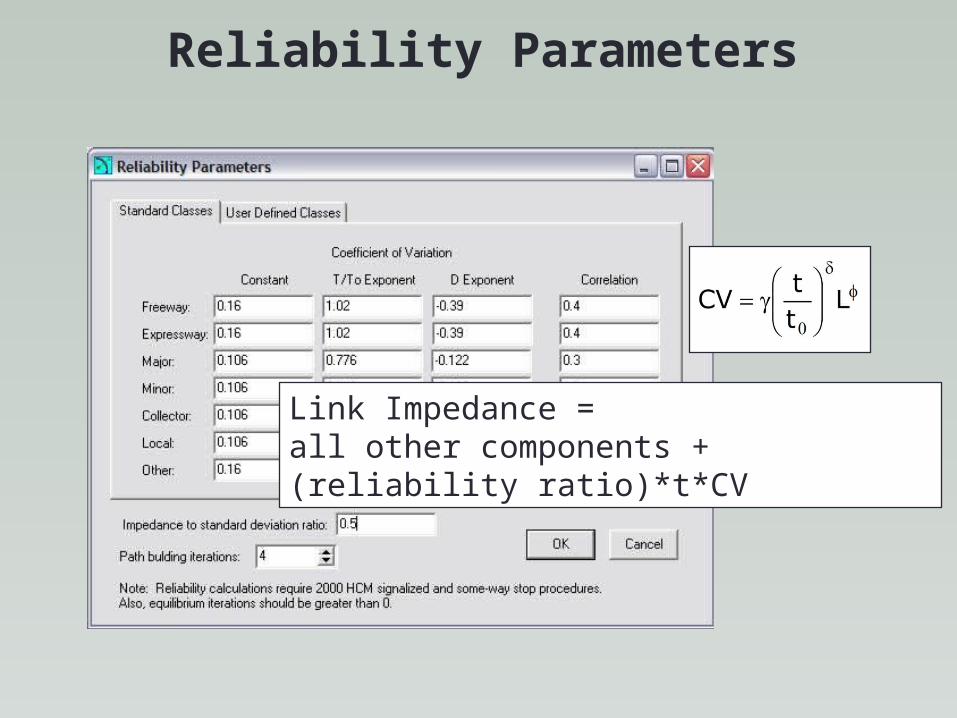
Path impedance with reliability (NON-additive)(Posted: Average time / standard deviation)
Lt
tCV
0

Results• Number of Path building iterations has clear impact on model
volumes but mixed on validation• Procedures reduce impact of “worst” intersections • Counter-intuitively (?), equation values from UK study worked
better than nearby (WWW region) surveys• Virtually no differences among options for local travel time
error (table shows “bottom line” for volume)

Overall Impact of Incorporating Reliability in the Model Update?
• Little impact on overall validation v. counts or travel times• Regardless of option taken, superior validation
Few differences overall due to relative lack of congestion

Modeled Travel Time with Procedures
• Urban street travel time errors (average of 8%) lower than models from other regions (esp. those still relying on fixed capacities & vdfs).
• Errors even less on freeways (2%) and rural roads (4%)

Impact of using new data sources:• Freeway floating car (Cleveland)• Local GPS data (Columbus sample)• Generated new sets of CV
equation coefficients• No impact on model’s• Validation (so far) • Statewide GPS data on
curves/grades/RR crossings found less delay than expected
• Demand-side in future?