Embed Size (px)
Citation preview

Incorporating a total cost perspective into the purchasing strategy – A case study of a
medium sized retail company
MARCUS EKSTRÖM CAROLINA FAHNEHJELM
Master of Science Thesis Stockholm, Sweden 2016
Incorporating a total cost perspective into the purchasing strategy – A case study of a
medium sized retail company
Marcus Ekström Carolina Fahnehjelm
Master of Science Thesis INDEK 2016:67 KTH Industrial Engineering and Management
Industrial Management
SE-100 44 STOCKHOLM

3
Examensarbete INDEK 2016:67
Incorporating a total cost perspective into the purchasing strategy – A case study of a medium
sized retail company
Marcus Ekström
Carolina Fahnehjelm
Godkänt
2016-06-23
Examinator
Jannis Angelis
Handledare
Andreas Feldmann Uppdragsgivare
Konfidentiellt Kontaktperson
Konfidentiellt
Sammanfattning Detaljhandeln karaktäriseras idag av en ökad konkurrens vilket lett till lägre priser och minskad lönsamhet. Styrning av inköpsfunktionen och leverantörskedjan har blivit allt strategiskt viktigare och spelar en avgörande roll för företagets framgång. Denna studie har som mål att tillföra tidigare forskning inom inköpsstrategi och styrning av leverantörskedja med en fallstudie på hur inköpsstrategin kan ta hänsyn till totalkostnadsperspektivet i leverantörskedjan. Syftet med denna studie är att föreslå aspekter att inkludera i inköpsstrategin för att möjliggöra ett totalkostnadsperspektiv i leverantörskedjan. Detta syfte uppfylls genom en fallstudie på ett medelstort svenskt detaljhandelsföretag, genom insamling och analys av kvalitativ och kvantitativ data från intervjuer, möten och interna rapporter. Utmaningar som förhindrar företaget att tillämpa ett totalkostnadsperspektiv i inköpsprocessen identifieras och en totalkostnadsmodell tas fram för att visa hur dessa påverkar totalkostnaden. Våra resultat visar att det finns sex utmaningar i inköpsprocessen som hindrar företaget att ta hänsyn till ett totalkostnadsperspektiv i leverantörskedjan; oförmågan att nå leverantörernas krav på minsta orderkvantitet, produktionsspecifika krav, problematik med kombinationsbeställningar, flödesproblematik vid orderläggning, att uppnå kostnadseffektiva täcktider och koordination av transporter. Tre aspekter identifieras som grundorsaker till dessa utmaningar och föreslås för företaget att inkludera i sin inköpsstrategi för att möjliggöra styrning av totalkostnaden i leverantörskedjan. De tre aspekterna är flexibla täcktider, intern och extern informationsdelning och koordination av transporter. Vidare ger denna studie en förståelse för hur formandet av produktsortimentet skapar utmaningarna som hindrar företaget att ha ett totalkostnadsperspektiv i sin inköpsprocess.
Nyckelord: Inköpsstrategi, totalkostnad, styrning av leverantörskedja, omköp, informationsdelning
4
Master of Science Thesis INDEK 2016:67
Incorporating a total cost perspective into the purchasing strategy – A case study of a medium
sized retail company
Marcus Ekström
Carolina Fahnehjelm
Approved
2016-06-23 Examiner
Jannis Angelis Supervisor
Andreas Feldmann Commissioner
Confidential Contact person
Confidential
Abstract The retail industry is today characterized by downward price pressure, and the increased competition in the industry has led to pressure on profit margins. Purchasing and supply chain management have become areas of increased strategic importance and play a crucial role in the business performance. This study aims to extend previous literature in these fields by providing the existing research with an empirical study on how the purchasing strategy can incorporate a total cost perspective of the supply chain. The purpose of this study was to suggest aspects to incorporate in the purchasing strategy with the objective to consider a total cost perspective of the supply chain. This was done through conducting an empirical case study at a Swedish middle sized retail company, by collecting and analyzing both qualitative and quantitative data through interviews, meetings and internal databases. Challenges that prohibit the case company to apply a total cost perspective were identified in the purchasing process and a total cost model was built to visualize how these affect total costs. Our findings show that there are six challenges that prohibit the case company to include the total cost perspective in the purchasing process; the inability to reach minimum order quantities (MOQ), production specific requirements, the difficulty to combine order suggestions on related stock keeping units (SKU), an uneven flow of orders to suppliers, inefficient time supply period and an inability to coordinate transports. Three aspects were identified as root causes for these challenges and suggested to the case company to incorporate in their purchasing strategy to enable the management of total costs in the supply chain. The aspects are flexible time supply periods, internal and external information sharing and coordination of transport. Furthermore, this research also gives an understanding of how the formation of the private label assortment fuels the challenges that prohibit the company to take a total cost perspective.
Key-words: purchasing strategy, total cost, supply chain management, replenishment, information sharing
5
Acknowledgements This research was conducted as part of our education at Industrial Engineering and Management at the Royal Institute of Technology (KTH) in Stockholm. It was the final assignment of our five years of studies and was conducted for the department of Industrial Engineering and Management. The research corresponded to 30 ECTS credits and was conducted during the spring semester 2016 from January to June. We would like to thank our supervisor Andreas Feldmann for his input in our work and for always being available for discussions. We would also like to thank our supervisors at the case company who have always helped us, given us support and provided us with valuable feedback on our work. A special thanks should also be given to all participants in this study for taking their time to contribute to our research. Finally, we would like to thank family and friends for your support and encouragement through this thesis and our studies at KTH. Stockholm, June 2016 Marcus Ekström and Carolina Fahnehjelm
6
Table of content 1 Introduction ........................................................................................................................ 9
1.1 Background ................................................................................................................ 91.2 Problematization ...................................................................................................... 101.3 Purpose and contribution ......................................................................................... 111.4 Research Questions .................................................................................................. 111.5 Delimitations ............................................................................................................ 121.6 Disposition ............................................................................................................... 13
2 Literature Review ............................................................................................................ 142.1 Purchasing in a retail context ................................................................................... 142.2 Purchasing strategy .................................................................................................. 162.3 Strategic role of supply chain management ............................................................. 212.4 Methods to map the supply chain ............................................................................ 242.5 Methods to map total costs ...................................................................................... 24
2.5.1 Total cost of ownership .................................................................................... 252.5.2 Direct Product Profitability .............................................................................. 25
2.6 Product portfolio management in a purchasing context .......................................... 263 Research methodology ..................................................................................................... 29
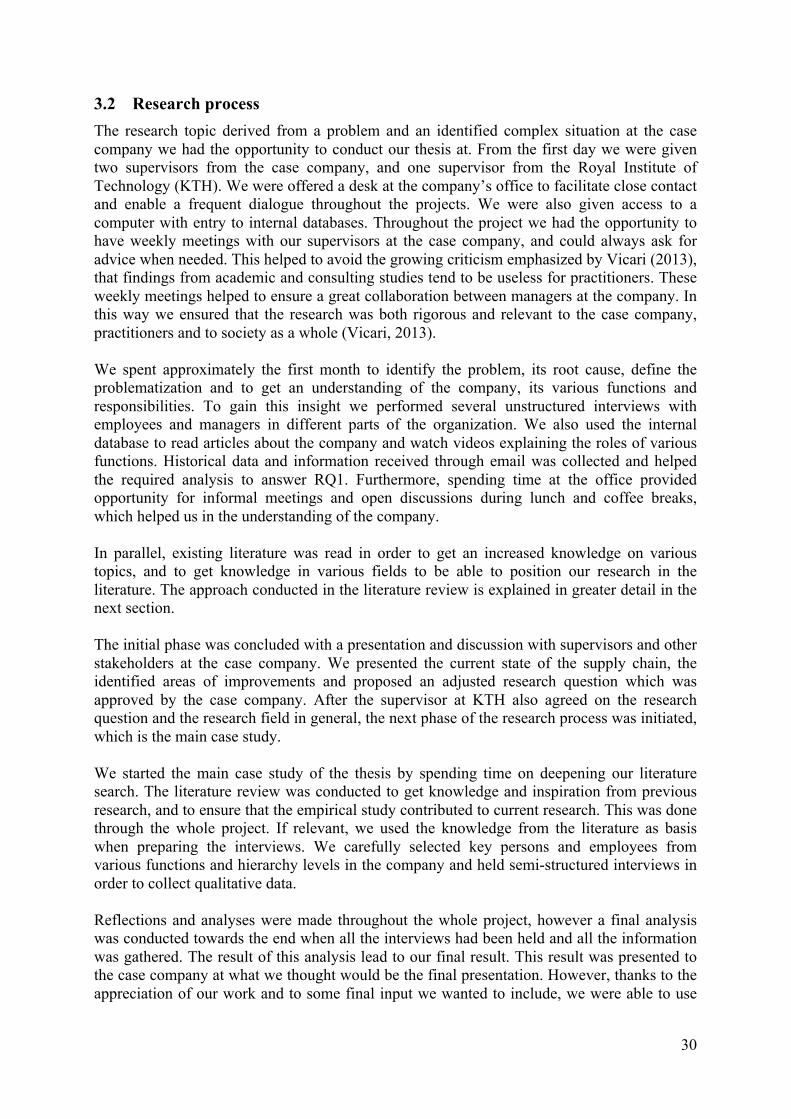
3.1 Research approach ................................................................................................... 293.2 Research process ...................................................................................................... 30
3.2.1 Literature review .............................................................................................. 313.2.2 Case study ........................................................................................................ 32
3.3 Quality of research ................................................................................................... 353.3.1 Internal validity ................................................................................................ 353.3.2 Construct validity ............................................................................................. 353.3.3 External validity ............................................................................................... 353.3.4 Reliability ......................................................................................................... 36
4 Empirical results and analysis ........................................................................................ 384.1 The current purchasing strategy ............................................................................... 384.2 Mapping of the supply chain (RQ1) ........................................................................ 38
4.2.1 Case products ................................................................................................... 394.2.2 The prognosis and ordering systems ................................................................ 394.2.3 Supply Planning ............................................................................................... 404.2.4 Asia Far East office .......................................................................................... 414.2.5 Transportation .................................................................................................. 414.2.6 Distribution Central ......................................................................................... 42
4.3 The main costs and their drivers .............................................................................. 434.3.1 Purchasing costs ............................................................................................... 434.3.2 Transportation cost ........................................................................................... 434.3.3 DC costs ........................................................................................................... 444.3.4 Costs associated with order placement ............................................................ 444.3.5 Summarizing the costs and its drivers ............................................................. 45
4.4 The total cost model ................................................................................................. 454.4.1 Targeted challenges in the purchasing process to consider ............................. 464.4.2 Building the total cost model ........................................................................... 47
4.5 Identified aspects to incorporate in the purchasing strategy (RQ2) ......................... 524.5.1 Aspect 1: Flexible time supply periods ............................................................ 524.5.2 Aspect 2: Information sharing ......................................................................... 544.5.3 Aspect 3: Coordination of transportation ......................................................... 58
4.6 Formation of the product assortment (RQ3) ............................................................ 60
7
5 Discussion and Conclusion .............................................................................................. 675.1 Reconnection to the study’s purpose ....................................................................... 675.2 Theoretical contribution ........................................................................................... 695.3 Empirical contribution ............................................................................................. 69
5.3.1 Generalizability and discussion concerning the total cost model .................... 695.3.2 Generalizability of the results .......................................................................... 705.3.3 Strategic mismatch as explanation to the challenges in the purchasing process 71
5.4 Managerial implications ........................................................................................... 725.5 Limitations ............................................................................................................... 725.6 Reflection on sustainability ...................................................................................... 735.7 Future research ......................................................................................................... 73
6 Bibliography ..................................................................................................................... 747 Appendix ........................................................................................................................... 78
7.1 SKU & vendor specific information ........................................................................ 787.2 Basic data ................................................................................................................. 787.3 Forecast of sales ....................................................................................................... 797.4 Calculations .............................................................................................................. 80
7.4.1 Stock availability without refill ....................................................................... 807.4.2 Accumulated refill ........................................................................................... 807.4.3 Production specific requirements ..................................................................... 817.4.4 Transportation cost ........................................................................................... 817.4.5 Purchasing cost ................................................................................................ 827.4.6 Storage cost ...................................................................................................... 827.4.7 Total cost .......................................................................................................... 837.4.8 Order suggestions ............................................................................................. 83
8
Table of figures Figure 1 - Overview of the business chain for trade companies (van Weele, 2002) ............... 14Figure 2 - The different areas of literature and main sources within each area ....................... 16Figure 3 - The purchasing management process (van Weele, 2002) ....................................... 19Figure 4 - Purchasing and supply chain management strategy, Monczka et. al (2005) .......... 20Figure 5 - How Direct Product Profitability (DPP) can be calculated ..................................... 26Figure 6 - Kraljic's Portfolio Purchasing Model ...................................................................... 27Figure 7 - Overview of the research process ........................................................................... 31Figure 8 - Overview of interviews ........................................................................................... 34Figure 9 - Summary of the quality of the research .................................................................. 37Figure 10 - Supply chain actors and the information flow ...................................................... 39Figure 11 - The process and cost drivers at DC ....................................................................... 44Figure 12 - Segmentation of the private label product assortment .......................................... 60Figure 13 - Picture of the BCG-matrix .................................................................................... 61Figure 14 - The combination of the fashion triangle and the BCG-matrix .............................. 62Figure 15 - Illustration of trade-off with long time supply and high storage cost ................... 63Figure 16 - Flow of products RMS controls ............................................................................ 71 Table of tables Table 1 - Disposition of the report ........................................................................................... 13Table 2 - Historical orders and purchasing prices of the leather bag ....................................... 43Table 3 - The main costs and their respective drivers ............................................................. 45Table 4 - SKU and vendor specific information required for the total cost model ................. 49Table 5 - Extract of order suggestions for time supply period of 17-25 weeks ....................... 50Table 6 - An extract of order suggestion, time supply period of 39-57 weeks ........................ 51
9
1 Introduction This chapter provides background to our research and presents the case company the study was conducted at. Furthermore, the problematization, purpose, and the research questions are presented.
1.1 Background The last 20 years, the retail industry has been in transformation and is today characterized by downward price pressure, high volatility, low predictability in demand and high product variety (Sen, 2008). An increased competition in the industry has led to pressure on profit margins, which in turn has led to more companies choosing to source globally (Perry & Towers, 2012). Due to the global competition, purchasing (Chen, Paulraj, & Augustine A., 2004) and supply chain management have gained increased attention and have become areas of increased strategic importance (Andersen & Skjoett-Larsen, 2009). An effective supply chain and purchasing process can be the crucial difference between success and failure (Sen, 2008). Researchers and managers emphasize the importance to link the purchasing function with supply chain management (Krause, Pagell, & Curkovic, 2001), and align it with the overall business strategy of the firm in order to contribute to the overall business performance (González-Benito, 2007). Since retail companies add marginal value to the product despite taking it home and supplying it to customers, it becomes significantly important to apply a bottom line thinking in the purchasing process, make smart order suggestions, consider all costs that arise from the manufacturer to end-customer (van Weele, 2002) and continuously work with efficiency in the supply chain management (Sen, 2008). This study is conducted on a medium sized Swedish retail company, which will be referred to as “the case company”. The decision to categorize it as medium sized was because of its turnover and its establishment in the country. H&M, one of its competitors, had a turnover about 30 times the size of the case company in 2014 (H&M, 2016), so it would be unsuitable to call it large. Simultaneously, during 2014 the case company served 80 million customers and had 80 department stores throughout Sweden, making it inappropriate to call it small. Consequently, to classify it as a medium sized retail company was the most suitable categorization. The case company has a wide product assortment and has business within fashion, beauty, home ware and media. They supply both brand and private label products, for which they have their production in both Europe and Asia. Three functions are responsible for managing the case company’s supply chain; supply planning, supply chain sourcing, and supply chain development. Supply planning is responsible for ensuring product availability through ordering and distributing products, both to the main warehouse and to stores. They are divided into the three business areas fashion, beauty and home ware. The supply chain sourcing department is responsible for choosing, evaluating and keeping relationships with suppliers. Furthermore, they work with the development of the IT systems which support the ordering process. The supply chain development function is responsible for leading and coordinating the work of developing and improving the supply chain. One of the most prioritized challenge these functions face is to gain a total cost perspective of the supply chain (Sourcing Manager, 2016) which has laid the foundation for our main research question. The reason for the case company to start investigating the total cost perspective of the supply chain is an internal perception that they can increase profitability if costs are decreased. The
10
reduction of costs in the supply chain will increase the margins and help the overall profitability of the case company. This becomes especially important for private label products which in contrast to brand products have a more complex supply chain. Some efforts of improvement have already been made in the supply chain. For example, IT-tools are in place to forecast demand and the sales of products, and there is an understanding of the various costs in each step of the supply chain. However, there are still relationships and dependencies in the supply chain to be investigated and analyzed in order to gain a total cost perspective. Conclusively, a total cost perspective in the supply chain is lacking, and will be our main area of study.
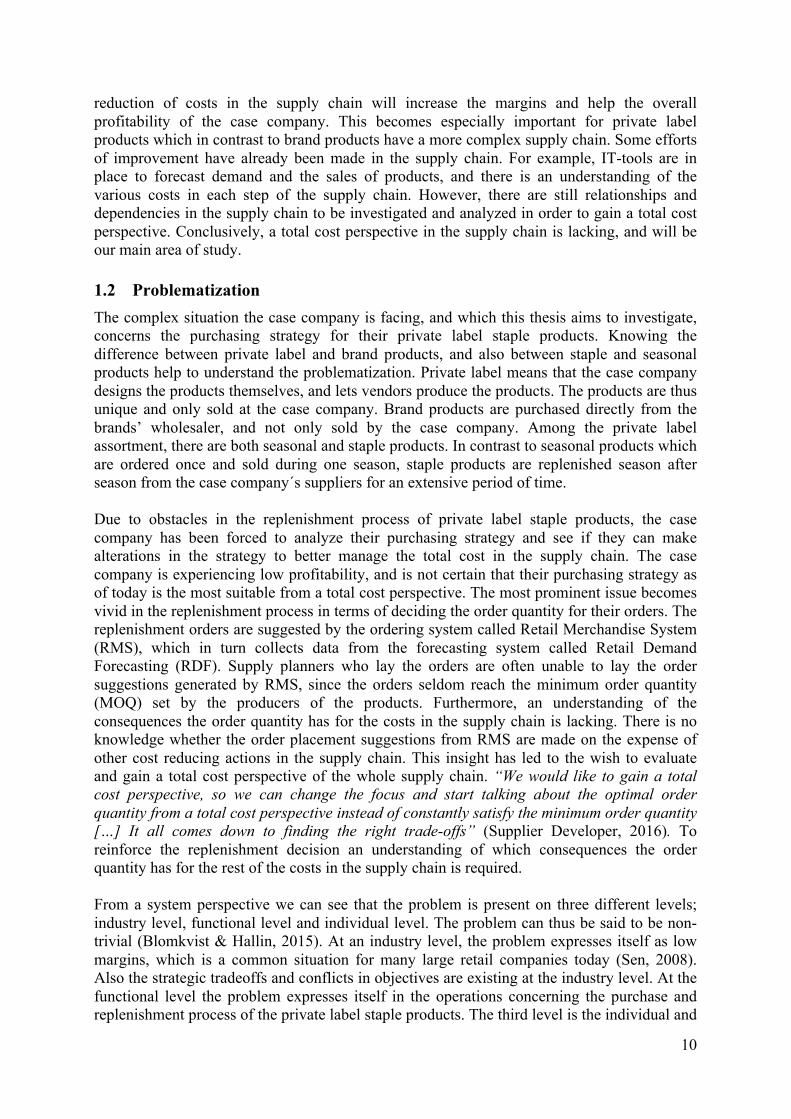
1.2 Problematization The complex situation the case company is facing, and which this thesis aims to investigate, concerns the purchasing strategy for their private label staple products. Knowing the difference between private label and brand products, and also between staple and seasonal products help to understand the problematization. Private label means that the case company designs the products themselves, and lets vendors produce the products. The products are thus unique and only sold at the case company. Brand products are purchased directly from the brands’ wholesaler, and not only sold by the case company. Among the private label assortment, there are both seasonal and staple products. In contrast to seasonal products which are ordered once and sold during one season, staple products are replenished season after season from the case company´s suppliers for an extensive period of time. Due to obstacles in the replenishment process of private label staple products, the case company has been forced to analyze their purchasing strategy and see if they can make alterations in the strategy to better manage the total cost in the supply chain. The case company is experiencing low profitability, and is not certain that their purchasing strategy as of today is the most suitable from a total cost perspective. The most prominent issue becomes vivid in the replenishment process in terms of deciding the order quantity for their orders. The replenishment orders are suggested by the ordering system called Retail Merchandise System (RMS), which in turn collects data from the forecasting system called Retail Demand Forecasting (RDF). Supply planners who lay the orders are often unable to lay the order suggestions generated by RMS, since the orders seldom reach the minimum order quantity (MOQ) set by the producers of the products. Furthermore, an understanding of the consequences the order quantity has for the costs in the supply chain is lacking. There is no knowledge whether the order placement suggestions from RMS are made on the expense of other cost reducing actions in the supply chain. This insight has led to the wish to evaluate and gain a total cost perspective of the whole supply chain. “We would like to gain a total cost perspective, so we can change the focus and start talking about the optimal order quantity from a total cost perspective instead of constantly satisfy the minimum order quantity […] It all comes down to finding the right trade-offs” (Supplier Developer, 2016). To reinforce the replenishment decision an understanding of which consequences the order quantity has for the rest of the costs in the supply chain is required. From a system perspective we can see that the problem is present on three different levels; industry level, functional level and individual level. The problem can thus be said to be non-trivial (Blomkvist & Hallin, 2015). At an industry level, the problem expresses itself as low margins, which is a common situation for many large retail companies today (Sen, 2008). Also the strategic tradeoffs and conflicts in objectives are existing at the industry level. At the functional level the problem expresses itself in the operations concerning the purchase and replenishment process of the private label staple products. The third level is the individual and
11
organizational level, where the supply planners laying the orders are affected on a daily basis by an increasing work load as a result of the problem of not being able to manage the total cost of the order. Another segmentation is to look at the problem from either a strategic or an operational view.
1.3 Purpose and contribution The purpose of this study is to propose aspects important to consider and incorporate into the purchasing strategy for a medium sized retail company with the objective to manage total cost in the supply chain. This will require an investigation of the supply chain and an analysis of how cost driving decisions in different areas of the supply chain depend on each other and affect total cost of the supply chain. These decisions are present at a strategic purchasing level, and often result in the need for tradeoffs and goal conflicts in the supply chain. However, in order to achieve the purpose and find the crucial aspects to include in the purchasing strategy, we need to gain insights from an operational level. The expected contribution is to provide the existing purchasing strategy research with an empirical study on how purchasing can incorporate a total costs perspective of the supply chain. Specifically, the contribution is to identify challenges that prohibit a total cost perspective in the purchasing process, and propose aspects to consider in the purchasing strategy for a medium sized retail company with the objective to manage total cost in the supply chain. Both purchasing strategy and total cost analyses of supply chains have already been demonstrated in previous research, but there is little research on the link between them. The results will specifically contribute to literature concerning the purchasing strategy for retail companies. The proposed aspects the study identifies to incorporate in purchasing strategy can yield as a guideline for other retail companies who are experiencing similar challenges in their purchasing process.
1.4 Research Questions The research question is formulated with the problematization and purpose of the study in mind. We want to reach an understanding of aspects to consider in the purchasing strategy for a medium sized retail company in order to enable a total cost perspective of the supply chain. Therefore, our main research question (MRQ) is: - MRQ: How to include the total cost perspective of the supply chain into the purchasing strategy? In order to answer the MRQ, three sub-research questions are formulated. Firstly, to reach an understanding concerning the total cost of the supply chain, we need to have a clear idea of the present state of the supply chain when it comes to actors, costs, lead time and information flow. Additionally, challenges that prohibits a total cost perspective in the purchasing process must be identified. It becomes important to understand main cost drivers in the supply chain, how they are related to each other and how they are affected by decisions made in the purchasing process. An approach to visualize these costs, their relationships and the challenges was necessary. Thus, the first sub-research question (RQ1) is formulated: - RQ1: How can a total cost tool visualize the costs in the supply chain and consider the challenges that prohibit a total cost perspective?
12
The challenges that prohibit the case company to manage the total cost of the supply chain must be analyzed in order to find their root cause. Aspects that would mitigate the identified challenges in the purchasing process are recognized, and proposed to be incorporated in the purchasing strategy. Thus, a second research question is formulated: - RQ2: Which aspects in the purchasing process are important to consider in the purchasing strategy to manage the total costs? An important aspect to take into consideration is how the formation of the private label assortment affects and fuels the challenges that prohibit the management of total cost. Thus, the third and final sub-research question (RQ3) is: - RQ3: How is the formation of the private label assortment related to the challenges that prohibit a total cost perspective? The three sub-research questions will help to answer the MRQ.
1.5 Delimitations The study is limited in accordance with the case company’s priorities both in terms of products and geographical aspects. The study will be limited to only include the private label assortment, since it is in the replenishment of these products the case company experiences the biggest challenges. The study will focus on staple goods, and thus put less attention to seasonal products. In order to limit the study further, two case products were chosen by the case company. This includes bed linen from the home department and a leather bag from the fashion department. Both these products are manufactured in India, thus this study will only look at vendors with production facilities located in India. An additional limitation of the study is to exclude warehousing efficiency. Existing inefficiencies that result in higher costs in the warehouses will be an area of improvement in later projects. However, the storage cost is taken in consideration in the total cost perspective, but not the aspect of including improvement areas in the warehouse. It is also important to emphasize that this study is limited to the analysis of an altered purchasing strategy which better will consider total cost. The implementation of such a purchasing strategy has been excluded from this research. The focus is on identifying, analyzing and proposing aspects the purchasing strategy needs to consider, not how it should be implemented in the case company.
13
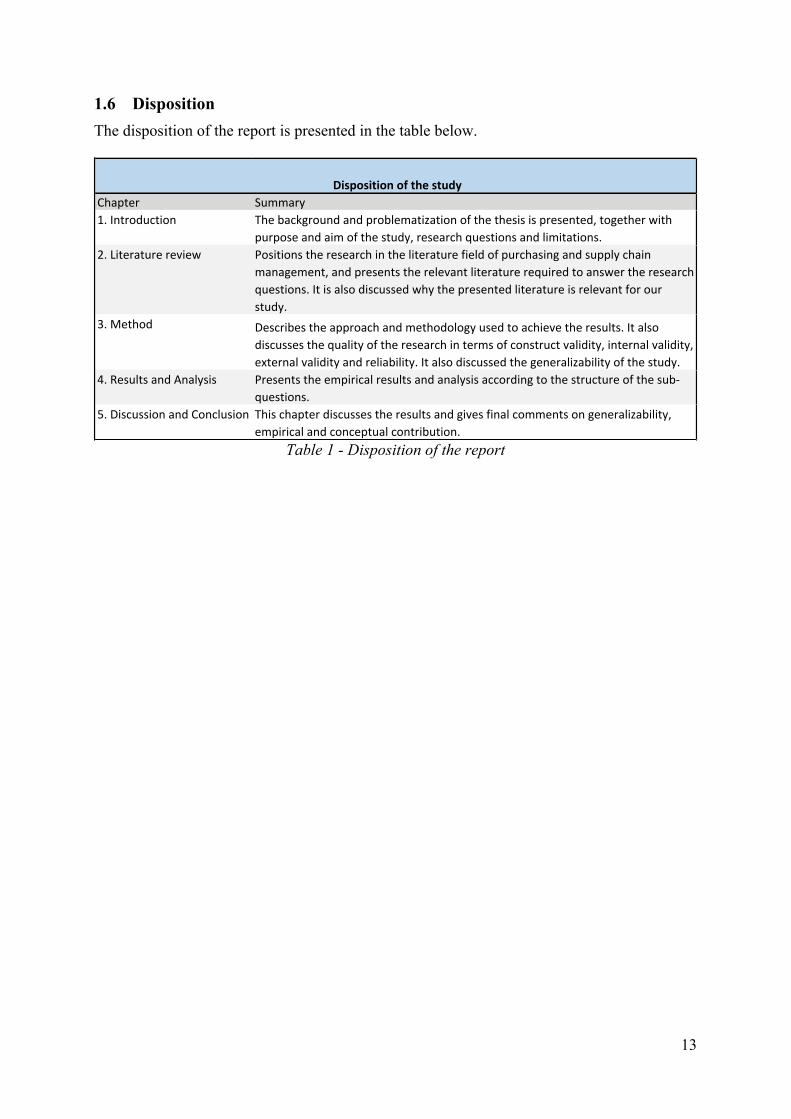
1.6 Disposition The disposition of the report is presented in the table below.
Table 1 - Disposition of the report
Chapter Summary1.Introduction Thebackgroundandproblematizationofthethesisispresented,togetherwith
purposeandaimofthestudy,researchquestionsandlimitations.2.Literaturereview Positionstheresearchintheliteraturefieldofpurchasingandsupplychain
management,andpresentstherelevantliteraturerequiredtoanswertheresearchquestions.Itisalsodiscussedwhythepresentedliteratureisrelevantforourstudy.
3.Method Describestheapproachandmethodologyusedtoachievetheresults.Italsodiscussesthequalityoftheresearchintermsofconstructvalidity,internalvalidity,externalvalidityandreliability.Italsodiscussedthegeneralizabilityofthestudy.
4.ResultsandAnalysis Presentstheempiricalresultsandanalysisaccordingtothestructureofthesub-questions.
5.DiscussionandConclusion Thischapterdiscussestheresultsandgivesfinalcommentsongeneralizability,empiricalandconceptualcontribution.
Dispositionofthestudy
14
2 Literature Review This chapter presents a review of existing literature in fields relevant to this study, with focus on purchasing strategy, supply chain management, supply chain mapping and a total cost perspective. The chapter starts with an introduction on the retail industry and the importance of the total cost perspective within this industry.
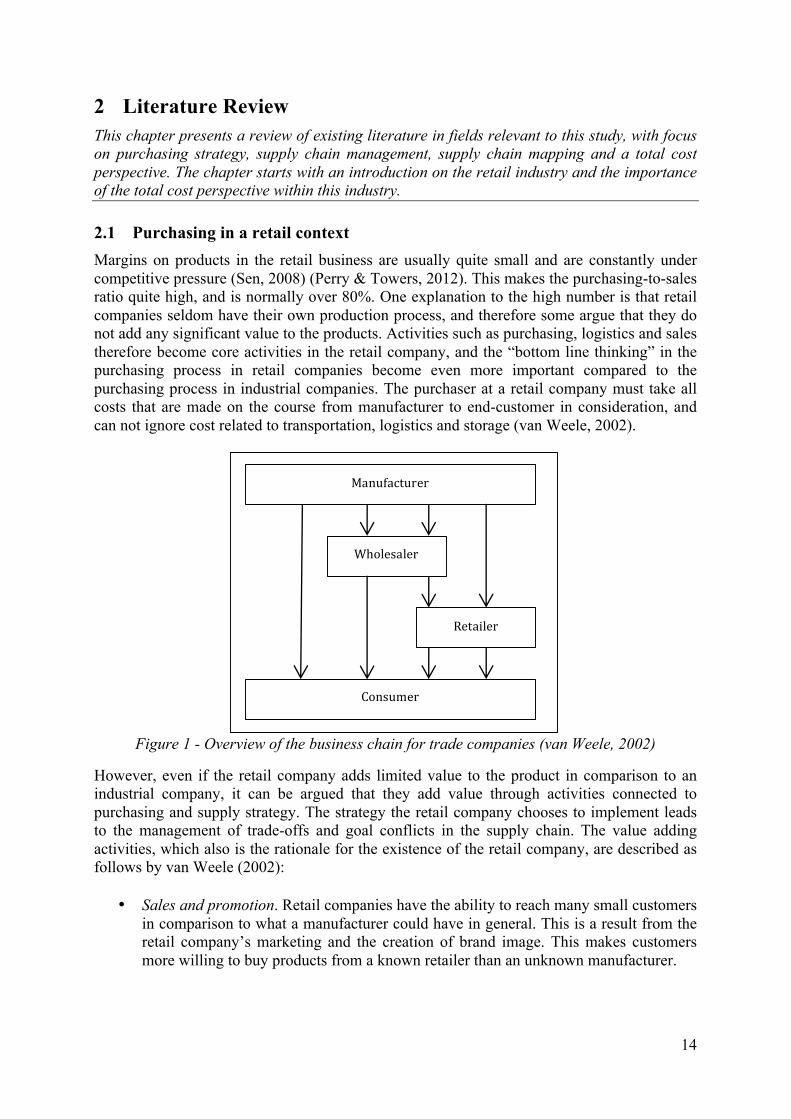
2.1 Purchasing in a retail context Margins on products in the retail business are usually quite small and are constantly under competitive pressure (Sen, 2008) (Perry & Towers, 2012). This makes the purchasing-to-sales ratio quite high, and is normally over 80%. One explanation to the high number is that retail companies seldom have their own production process, and therefore some argue that they do not add any significant value to the products. Activities such as purchasing, logistics and sales therefore become core activities in the retail company, and the “bottom line thinking” in the purchasing process in retail companies become even more important compared to the purchasing process in industrial companies. The purchaser at a retail company must take all costs that are made on the course from manufacturer to end-customer in consideration, and can not ignore cost related to transportation, logistics and storage (van Weele, 2002).
Figure 1 - Overview of the business chain for trade companies (van Weele, 2002)
However, even if the retail company adds limited value to the product in comparison to an industrial company, it can be argued that they add value through activities connected to purchasing and supply strategy. The strategy the retail company chooses to implement leads to the management of trade-offs and goal conflicts in the supply chain. The value adding activities, which also is the rationale for the existence of the retail company, are described as follows by van Weele (2002):
• Sales and promotion. Retail companies have the ability to reach many small customers in comparison to what a manufacturer could have in general. This is a result from the retail company’s marketing and the creation of brand image. This makes customers more willing to buy products from a known retailer than an unknown manufacturer.
Manufacturer
Consumer
Wholesaler
Retailer
15
• Purchasing and building up a product assortment. Retail companies form a product assortment based on information about their target customers. This makes the market more accessible for the customer and adds value.
• Bulk Breaking. The retail company buys products in large quantities from the manufacturer and sells them in smaller quantities to customers. This creates vale for the manufacturer by reducing costs as well as for the customers by making the products more accessible.
• Storage. When a retail company is holding stock it is reducing costs for both manufacturers and end users who can save time in the buying process. It also improves the availability of the products for the end user.
• Transportation. When the retail company takes over the transportation from the manufacturer it often leads to a more efficient transportation as a result of higher loading-level in the transport.
• Carrying the risk. Depending on the product, the retailer can carry risk when it comes to pilferage, damage or obsolesces. In the case study presented in this report the main risk element is the obsolescence risk of fashion products.
• Market information. Modern information technology enables retail companies to gain a clear and important picture of what their customers want and their characteristics. This helps the retail companies to assess their own assortment and also provide this information to manufactures in the creation of new products and developing of existing ones.
• Management and marketing services. Continuous development and improvement of shop layout, shelf layout, displays and the improvement of inventory management systems are driven by the cooperation between retailer and manufacturer, where the retailer is often the driving part.
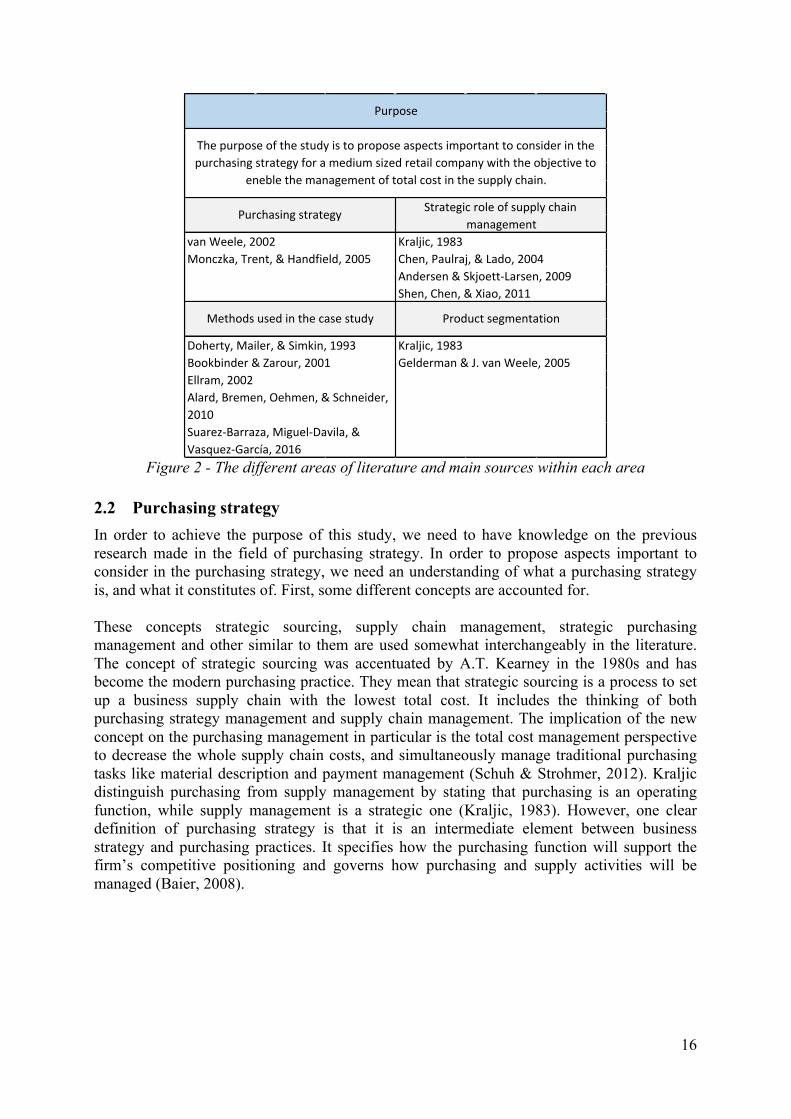
All described activities except the first and the last one are either expressly purchasing in itself or strongly connected to aspects connected to purchasing. However, the activities presented by van Weele (2002) do not account for the activity that arise when a retail company develops private label products, which are uniquely designed by the retail company itself. Here another activity is needed where the retail company has greater cooperation with the manufacturer and also has the opportunity to change design and material features to reduce costs in he manufacturing process. This is a value adding activity important in the case study conducted in this report, and is to a very high degree connected to the purchasing strategy. The following picture describes the different areas we have included in the literature review and which the main sources are within each area.
16
Figure 2 - The different areas of literature and main sources within each area
2.2 Purchasing strategy In order to achieve the purpose of this study, we need to have knowledge on the previous research made in the field of purchasing strategy. In order to propose aspects important to consider in the purchasing strategy, we need an understanding of what a purchasing strategy is, and what it constitutes of. First, some different concepts are accounted for. These concepts strategic sourcing, supply chain management, strategic purchasing management and other similar to them are used somewhat interchangeably in the literature. The concept of strategic sourcing was accentuated by A.T. Kearney in the 1980s and has become the modern purchasing practice. They mean that strategic sourcing is a process to set up a business supply chain with the lowest total cost. It includes the thinking of both purchasing strategy management and supply chain management. The implication of the new concept on the purchasing management in particular is the total cost management perspective to decrease the whole supply chain costs, and simultaneously manage traditional purchasing tasks like material description and payment management (Schuh & Strohmer, 2012). Kraljic distinguish purchasing from supply management by stating that purchasing is an operating function, while supply management is a strategic one (Kraljic, 1983). However, one clear definition of purchasing strategy is that it is an intermediate element between business strategy and purchasing practices. It specifies how the purchasing function will support the firm’s competitive positioning and governs how purchasing and supply activities will be managed (Baier, 2008).
Kraljic,1983Chen,Paulraj,&Lado,2004Andersen&Skjoett-Larsen,2009Shen,Chen,&Xiao,2011
Doherty,Mailer,&Simkin,1993Bookbinder&Zarour,2001 Gelderman&J.vanWeele,2005
Purpose
Thepurposeofthestudyistoproposeaspectsimportanttoconsiderinthepurchasingstrategyforamediumsizedretailcompanywiththeobjectiveto
eneblethemanagementoftotalcostinthesupplychain.
Purchasingstrategy Strategicroleofsupplychainmanagement
Suarez-Barraza,Miguel-Davila,&Vasquez-García,2016
Kraljic,1983
Alard,Bremen,Oehmen,&Schneider,2010
vanWeele,2002Monczka,Trent,&Handfield,2005
Ellram,2002
Methodsusedinthecasestudy Productsegmentation
17
In his study, we have chosen to adopt van Weele´s definition of what a purchasing strategy consists of, and how it is in line with the concept of strategic sourcing and supply chain management described above. The author describes that a sound purchasing and supply strategy should be based on three main principles. The principles are (1) sound business orientation, (2) to reflect a cross functional approach and (3) be directed at improving the company´s bottom line (van Weele, 2002). The principles are described more in detail below, and complemented with supporting and related literature. To have a business orientation as a base when forming the purchasing strategy is important since it should support the company in meeting its overall goals and objectives. Many authors agree to this notion that it is important to link purchasing to corporate strategy (Watts, Kee, & Hahn, 1995) (Monczka, Trent, & Handfield, 2005). To have a business orientation implicates to have knowledge and an insight regarding what end users or customers the company is targeting, and how the market is developing. Another important aspect to take in consideration is how price increase in the company’s supply chain and procurement of products can be transferred to the customer or not, that is, how price sensitive the customers are. Furthermore, internal development at the company when it comes to the products, the production and information technology is also important to take in consideration when developing the purchasing strategy. Purchasing has evolved from being a buying function into a strategic function supporting the overall business orientation (Ellram & Carr, 1994) (Chen, Paulraj, & Augustine A., 2004). The second main principle proposed by van Weele (2002) is that the purchasing strategy should reflect a cross functional approach. This means that the purchasing strategy should not only have the objective to make the purchasing process as efficient as possible, but take into account effects these decisions have on other primary activities. Examples of primary activities are production planning, materials management, and transportation. Thus, the purchasing decisions need to be based on balancing total cost of ownership. Purchasing and supply strategies can only be developed successfully with the involvement of all managers of the primary activities involved in the procurement of the products. The importance of a cross functional approach when working with and forming sourcing and purchasing strategy have also been emphasized in other literature (Trent & Monczka, 1998). Kraljic raised the importance of cross functional purchasing already in 1983 in the well known article “Purchasing must become supply chain management”. In the article, the author writes that companies can not afford to allow the management of the purchasing to be kept in isolation from other elements in the company. Greater integration in the overall business systems, stronger cross functional relations and more top management involvement are all necessary to have an efficient purchasing process. The aspect of cross functional information flows is also raised by the author, who claimed that the cross functional information flow is needed to supply the purchasing process with accurate information. This information flow would free management and buyers from preoccupied day-to-day work and let them focus on long term analytical work and planning, such as price reductions and savings, inventory reduction, reduced clerical work and better delivery and service (Kraljic, 1983). The third and last principle proposed is that the purchasing strategy should be directed at improving the company’s bottom line and the profitability. This principle implies that the purchasing process should challenge the internal customers when purchasing products, not just operate as a service function, and also make the company more cost aware. They should do this by always taking the price/value ratio in consideration when purchasing the goods. Many authors state that in today’s globalized market, purchasing is one of the strategic
18
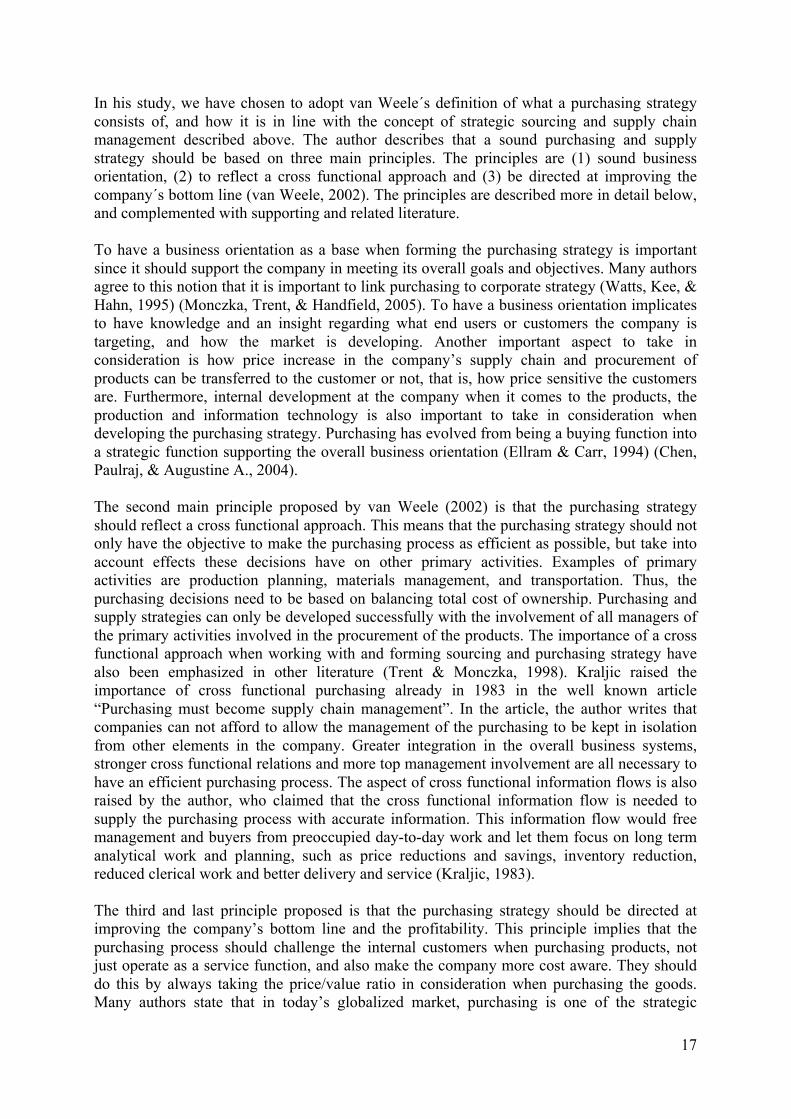
functions with a high potential to impact the profitability of the firm. Improving the profitability through purchasing could more specifically be made by supply base rationalization, supplier evaluation and information exchange (González-Benito, 2007). Furthermore, Chen et. al mean that it should be done through fostering a close relation with suppliers, having an open communication with suppliers, and develop long term relationships in order to mutually gain from these (Chen, Paulraj, & Augustine A., 2004). Van Weele (2002) also state that the purchasing management process can be schematically illustrated, including the aspects depicted in Figure 3. Firstly, a market research includes studying all of the factors which impacts demand and supply for a product. Purchasing research can have an internal focus and external focus. An external focus includes for example supplier studies, supply market studies, material costs and price analyses, while an internal focus includes analysis of the company’s purchasing portfolio, inventory holding cost, and controls on quality on produced materials. This has to be made in order to secure the future requirements on the company. Then, there is purchasing objectives which often relate to cost reducing activities and evaluation of the supplier base. Furthermore, the objectives of the purchasing department is to determine characteristics of the purchased material, managing the supply so they are delivered in time, and selecting suppliers capable to deliver the product (Krause, Pagell, & Curkovic, 2001). In our case study, these objectives express themselves as problems the case company wants to solve, and is also highly cost related. The purchasing strategy and planning includes decisions as how many suppliers should be included in the supplier base, which products should be sourced globally or be produced in a closer area, and if the purchasing activities should be centralized or decentralized in the organization. When finally implementing the purchasing process it is important to optimize the supply, develop efficient computer supported order routines, material delivery schedules, and reduce inventory. Product and supplier quality should also be reviewed regularly. These include aspects such as material specification. The author states that an early involvement in product design and improving suppliers’ performance through standardizing materials through the product assortment, and focusing on the life cycle of the product to avoid investments in products that will soon go out of the assortment, will contribute to improvements in these areas.
19
Figure 3 - The purchasing management process (van Weele, 2002)
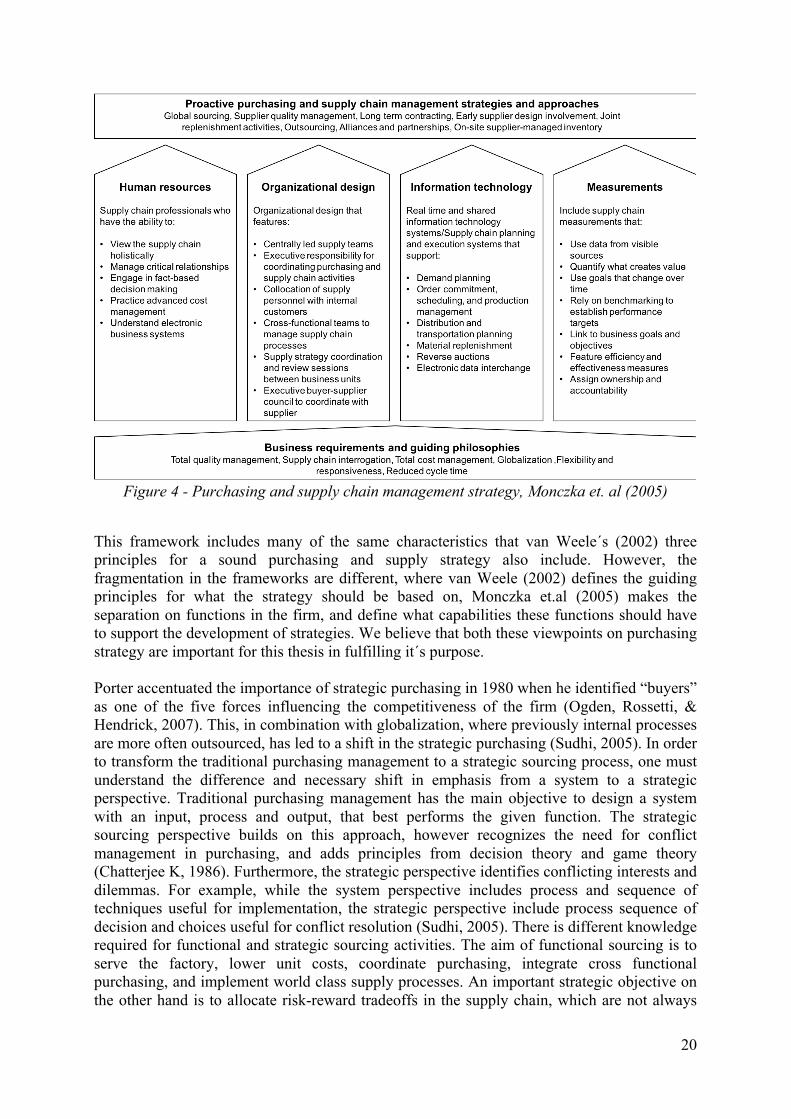
Another framework that has been identified as a proactive purchasing and supply chain management strategy was proposed by Monczka et.al (2005) where four pillars are identified to ensure excellence. The pillars are human resources, organizational design, information technology and measurement. The pillars are based on some business requirements and guiding philosophies; total quality management, supply chain integration, total cost management, globalization, flexibility and responsiveness, reduced cycle times. In this study, we will focus on the business requirement of total cost management, in order to gain a total cost perspective. The proposed framework highlight the soft factors as key elements in contributing to the firm’s purchasing strategy and is illustrated in Figure 4 (Monczka, Trent, & Handfield, 2005).
20
Figure 4 - Purchasing and supply chain management strategy, Monczka et. al (2005)
This framework includes many of the same characteristics that van Weele´s (2002) three principles for a sound purchasing and supply strategy also include. However, the fragmentation in the frameworks are different, where van Weele (2002) defines the guiding principles for what the strategy should be based on, Monczka et.al (2005) makes the separation on functions in the firm, and define what capabilities these functions should have to support the development of strategies. We believe that both these viewpoints on purchasing strategy are important for this thesis in fulfilling it´s purpose. Porter accentuated the importance of strategic purchasing in 1980 when he identified “buyers” as one of the five forces influencing the competitiveness of the firm (Ogden, Rossetti, & Hendrick, 2007). This, in combination with globalization, where previously internal processes are more often outsourced, has led to a shift in the strategic purchasing (Sudhi, 2005). In order to transform the traditional purchasing management to a strategic sourcing process, one must understand the difference and necessary shift in emphasis from a system to a strategic perspective. Traditional purchasing management has the main objective to design a system with an input, process and output, that best performs the given function. The strategic sourcing perspective builds on this approach, however recognizes the need for conflict management in purchasing, and adds principles from decision theory and game theory (Chatterjee K, 1986). Furthermore, the strategic perspective identifies conflicting interests and dilemmas. For example, while the system perspective includes process and sequence of techniques useful for implementation, the strategic perspective include process sequence of decision and choices useful for conflict resolution (Sudhi, 2005). There is different knowledge required for functional and strategic sourcing activities. The aim of functional sourcing is to serve the factory, lower unit costs, coordinate purchasing, integrate cross functional purchasing, and implement world class supply processes. An important strategic objective on the other hand is to allocate risk-reward tradeoffs in the supply chain, which are not always
21
vivid in functional sourcing. Balancing the advantages of global sourcing operations, and the accompanied risks in terms of political, legal information exchange, currency exchange rate, and logistics lead-time risks become important areas for middle managers responsibility (Sudhi, 2005). Chatterjee (1986) calls the elevated form of traditional purchasing management for a strategic sourcing perspective, however, this perspective includes what van Weele (2002) defines in his sound purchasing strategy. The author suggest that the purchasing strategy should have the objective to improve the price/value ration, which includes proposing alternative suppliers (van Weele, 2002). The same reasoning apply to why the (Sudhi, 2005) article regarding “sourcing strategy principals and design” is used in this study. It is important to understand that purchasing strategy and supply chain management are closely related, which also becomes apparent when following van Weeles (2002) definition of a sound purchasing and supply strategy and Monczka et.al (2005) purchasing and supply chain management strategy. This relation is also described in other literature, stating that purchasing has increasingly assumed a new principal strategic role in supply chain management (Chen, Paulraj, & Lado, 2004) (Andersen & Skjoett-Larsen, 2009). Kraljic (1983) discussed and raised the question that purchasing must become supply management. In the article the author argues that to ensure a long-term availability of material and components, companies must understand the risks and complexities of global sourcing, and that supply management is relevant whenever a company must procure a volume of critical items competitively under complex conditions (Kraljic, 1983).
2.3 Strategic role of supply chain management Previous research argues that purchasing decisions impact transportation, delivery, and maintenance functions (Shen, Chen, & Xiao, 2011). To be able to propose aspects important to incorporate in the purchasing strategy in order to manage and reduce total cost in the supply chain, we need to account for previous research made in the literature field of supply chain management and cost management. This because, as explained earlier, the purchasing strategy has an overall objective to reduce costs in the entire supply chain. Supply chain management involve many conflicting optimization objectives; low costs, high quality, short lead-time and a good match to meet demand to name the most common. Traditionally, the total cost of the supply chain activities was used as a measure of how well optimized the supply chain was. However, this is not always beneficial since the customer service level risk to be reduced. Instead, trade-offs between the previously mentioned conflicting performance measures must be made (Ding, Benyoucef, & Xiaolan, 2004). This conclusion is of importance to our study when analyzing the most important aspects to incorporate in the purchasing strategy.
Collaboration and information sharing The positive effect and cost reducing opportunities that are connected to collaboration and information sharing in the supply chain is a well researched area in the literature. This is an aspect in the purchasing strategy and is connected to van Weele´s (2002) elementary principles for a sound strategy. Today, more pressure is being put on companies’ ability to plan, control and improve the collaboration and the information flow between suppliers. The more complex and strategically important functions are being outsourced, supplier-buyer relationships need to become more close, intimate and long term. In order to draw advantage of the outsourcing and mitigate potential risks, companies need to integrate decision-making processes throughout the network of suppliers (Momme, Moeller, & Hvolby, 2000).

22
Previous research on the value of information sharing in supply chains reveal that the context under which circumstances information is shared matters. It has been shown that the value of information sharing in inventory control management varies widely depending on the type of information shared, and whether the demand is stationary or not. Jonsson and Matsson (2013) show that customer forecasts and planned order information are valuable to share with suppliers in a context with non-stationary demand (Jonsson & Mattsson, 2013). As will later be discussed, this is the case in this study. Gavirneni et. al (1999) made a study on a two echelon supply chain of where they studied three situations. The first was a traditional model where there was no information to the supplier prior to an order, except for past data. The second supplier knew the customers quanity for order point and the replenishment quantity that would be produced, however did not know when the order would be laid. The third supplier had full information about the state of the retailer, that is both the order quantity and the time for the order. The study showed that the cost for the third case was always smaller than for the second case, which in turn was smaller than the first first case. This lead the authors to the conclusion that information is always beneficial (Gavirneni, Kapuscinski, & Tayur, 1999). Another more contractual concept that can be used in supply chains to reduce purchasing cost is called early order commitment. It means that a retailer commits to purchase from a manufacturer. The commitment implies that a set order quantity is decided, and also the delivery time. This is committed before the actual need occurs for the retailer. It has been shown in studies that this helps the supplier or manufacturer to procure materials, schedule production and better utilize production (Iyer & Bergen, 1997). The positives for the manufacturer is intuitively clear, that they decrease the risk in their production if retailers commit to purchasing their products. However, the retailer on the other hand get exposed to the risk of a sales forecast being inaccurate. This would lead to increasing holding cost, or shortage cost (Zhao, Xie, & Wei, 2007). Thus, the early order commitment is more advantageous to the producer than the retailer, so the producer entices the retailers with mainly two types of incentives to get these kind of agreements. The first is price discounts or better paying conditions. The second is that the retailer permits the producer to offer value adding service, such as faster replenishment time or vendor managed inventory agreements. To maximize the cost savings from early order commitment, the actors in the supply chain, in different levels, must evaluate the tradeoffs between the costs and benefits of the commitment (Zhao, Xie, & Wei, 2007).
Reduction of purchasing price The actual purchasing price of a product plays a main role in the total cost of procuring the product. Here the purchasing strategy on how to purchase and replenish the products plays a major role in determining what price is set for the order, and must be balanced against the total cost in the supply chain (van Weele, 2002). The basic problem or conflict between purchasing and supply chain is that a retailer´s order decision has a direct impact on a manufacturers production (Boute, Disney, Lambrecht, & Van Houdt, 2006). A sourcing and purchasing strategy on the other hand must consider and reflect the performance of the supply chain, not least the vendors. Vendors differ in costs, lead times, and flexibility of production. Some vendors may offer a low price, but require that production is allocated evenly through the year and have long lead times. Other may take a higher price, but offer more flexibility and shorter lead times (Agrawal, Smith, & Tsay, 2002). Since strategic sourcing and inventory replenishment issues are closely linked to the total cost of the supply chain (Ding, Benyoucef, & Xiaolan, 2004), we have chosen to include both fields of literature in this literature review.
23
The primary strategic objective in the supplier relationship for retail companies purchasing and outsourcing goods and services is often low costs (Lowson, 2001). Stuart and McCutcheon (2000) identify four areas where to achieve cost reduction in the supplier relation (Stuart & McCutcheon, 2000):
• Lower production costs of the suppliers • Improved conformance quality (consistently meeting specifications) • Material or location substitution • Lower transaction costs, including the costs of incoming materials inspections, vendor
searches and evaluations, corrected supplier problems and communications with suppliers.
The first area on where to achieve cost reduction can be given specific attention. Lowering the production cost often go hand in hand with decreased purchasing price, which is a major cost for retailers. There are a number of additional ways in which companies can reduce their purchasing costs. Shen et. al (2011) propose four ways:
• Negotiations • Leverage purchasing (that is expanding the purchasing amount to benefit from large
scale and strengthen the bargaining space and power of the buyer) • Consortium purchasing (forming alliances with other units or companies and combine
purchasing) • Standardization in product specifications in order to decrease the numbers of
purchasing items. Even though the authors propose many ways to lower the purchasing price, they point out that a common misinterpretation is that the lowest purchasing cost is the most important when optimizing supply chain costs. and seldom consider management, intangible costs, and usage costs. Therefore, total cost modeling becomes crucial in a company with purchasing practice. The interaction of demand and supply have significant impact on the costs in the supply chain. A fluctuating demand becomes challenging when production capacity is constrained. Producing in advance of peak periods improves the ability to meet demand but creates inventory buildup and forces vendors to commit to production and fabric purchases, with greater uncertainty to sell all goods. Both the inventory buildup and the risk to stand with a lot of unsold products impact the total cost model. One way to handle the issues connected to fluctuations in demand and supply would be to enable the strategy to differentiate products and source products with a predictable demand to lower cost production, while sourcing more hardly predicted products to more flexible retailers. This is however a nontrivial problem operationalizing this (Agrawal, Smith, & Tsay, 2002). Another supply and demand related issue in the supply chain is what is referred to as the bullwhip effect. In order to add safety margins on products ordered, demand usually have a tendency to be amplified the more upstream in the supply chain you go (Lee, Padmanabhan, & Whang, 2004). When it comes to inventory management tension between demand seasonality and the vendor’s desire to maintain stable production schedules significantly affects retailers’ inventory patterns. Thus, to increase turnover, retailers should consider negotiations with vendors in order to achieve greater production flexibility. Improvements on inventory management must also be dealt with on an organizational level. The merchandising, sourcing,
24
and finance functions often have somewhat conflicting objectives when it comes to the inventory management strategy. (Agrawal, Smith, & Tsay, 2002) Because of the supply chains heavy involvement and affect on the purchasing strategy, as part of the effort of achieving the study’s purpose, we need to map out the supply chain to be able to gain a total cost perspective.
2.4 Methods to map the supply chain Supply chain management is a concept that includes all activities, information, knowledge and financial resources that are connected to the flow and transformation of products. Supply chain management also includes all logistical and information flow aspects that surround the purchasing activities and also takes in consideration the suppliers further down the supply chain, from raw material to the end customer (Stevens, 1989). In order to map these processes, a tool that originates from the widely used method Value Stream Mapping (VSM) can be used. We start out with describing the concept of VSM, before going in and describing Supply Chain Value Stream Mapping (SCVSM). VSM is a tool where the flow of any process, with the goal to incorporate only value-adding activities, is established. The non-value adding activities that the tool aims to eliminate are referred to as “waste”, according to the management principle Lean (Weiss, 2013). It effectively shows the key elements of a production system and shows how each actor interacts with each other. An important feature is that it maps out both the flow of products and services as well as information flow (Suarez-Barraza, Miguel-Davila, & Vasquez-García, 2016). In order to identify the waste, the process must first be visualized and mapped out. Therefore, it is an effective process mapping technique (Weiss, 2013) The VSM is a widely used, flexible and universal method which can be applied in many different contexts, and even for the whole supply chain (Masadynski, 2007). Suarez-Barraza et. al (2016) realized the importance of mapping the supply chain because of its strategic importance to stay competitive. Observing and measuring the supply chain therefor becomes important, which requires mapping of the supply chain. Supply Chain Value Stream Mapping (SCVSM) aims to visualize the supply chain (Suarez-Barraza, Miguel-Davila, & Vasquez-García, 2016). This is of great importance in this study as well, in order to visualize what effects the purchasing strategy has on the supply chain, and what cost drivers that are influenced by the deployed strategy.
2.5 Methods to map total costs In van Weeles (2002) definition on what a sound purchasing strategy should be based on, the aspect of balancing total cost of the primary activities. This aspect brought up in the second main principal of integrated cross functional approach, however, the cost of the purchased items is also important in the third principal of bottom-line orientation (van Weele, 2002). Thus, we have identified two methods in the literature which will be helpful to achieve the purpose to integrate a total cost perspective in the purchasing process; total cost of ownership and direct product profitability. While the total cost of ownership is more widely used in general, direct product profitability (DPP) has specifically been used in a retail context. However, since they are similar and have the same purpose we have included both. The following two sections present the methods and how they help to include a total cost perspective in the purchasing strategy.
25
2.5.1 Total cost of ownership Total cost of ownership (TCO) is a model where direct and indirect costs associated with a product or service over its total life cycle are estimated. Generally, purchasing price is used as a cost for a product, however, TCO helps to include costs such as labor, order placement, inspections, rejection, disposal costs, packing, raw materials, overhead and transportation. When conducting a TCO, it is not always critical to calculate the precise costs, but look at the major issues and the costs that will be relevant for a decision (M. Ellram, 2002). TCO is often used in many different industries and often in the context of make-or-buy decisions and investments (Alard, Bremen, Oehmen, & Schneider, 2010). In a procurement contexts, the primary purpose is to use TCO for supplier selection and evaluation since it helps to understand all relevant supply chain related costs of doing business with a specific supplier (Khurrum S. & Faizul, 2002) (Ellram M., 1995). For example, Pan (2015) has developed an optimizations model using TCO to vendor selection in order to reduce total cost (Pan, 2015). However, little research has used TCO to evaluate the repurchasing process of products. Since it is emphasized that TCO may be applied to any type of purchase (Ellram M., 1995) we have decided to extend the use of total cost of ownership and apply it to gain a total cost perspective of the repurchase process.
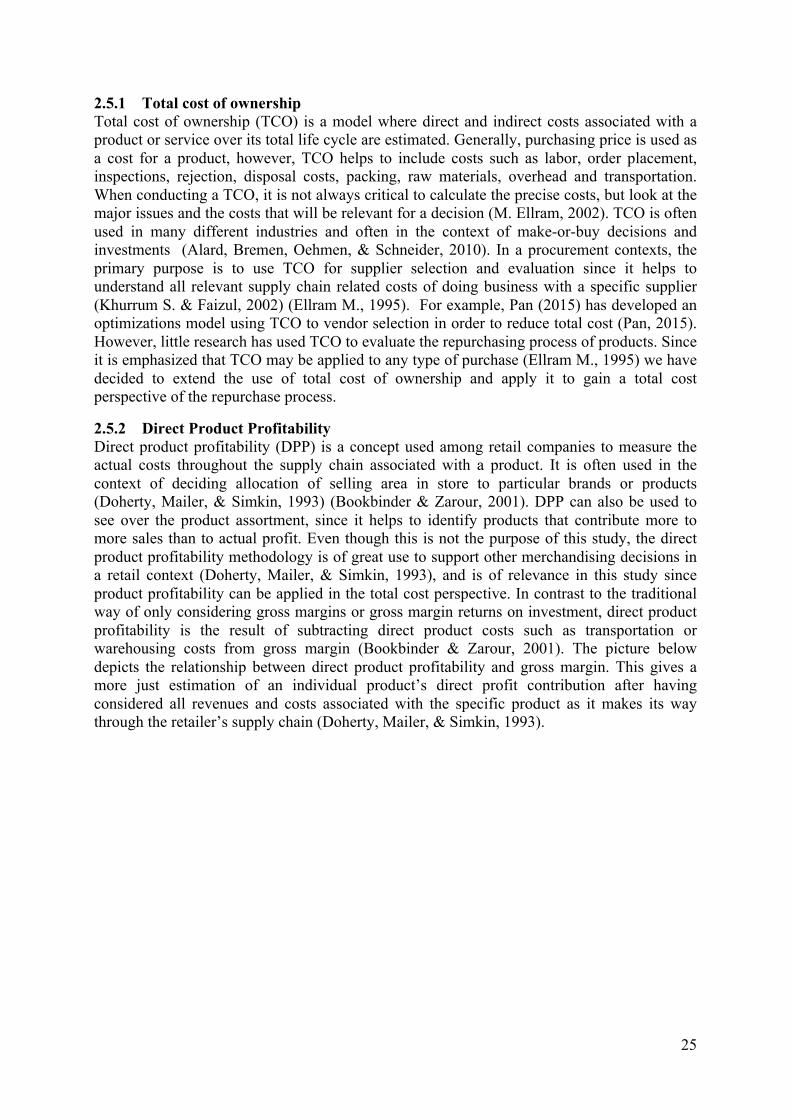
2.5.2 Direct Product Profitability Direct product profitability (DPP) is a concept used among retail companies to measure the actual costs throughout the supply chain associated with a product. It is often used in the context of deciding allocation of selling area in store to particular brands or products (Doherty, Mailer, & Simkin, 1993) (Bookbinder & Zarour, 2001). DPP can also be used to see over the product assortment, since it helps to identify products that contribute more to more sales than to actual profit. Even though this is not the purpose of this study, the direct product profitability methodology is of great use to support other merchandising decisions in a retail context (Doherty, Mailer, & Simkin, 1993), and is of relevance in this study since product profitability can be applied in the total cost perspective. In contrast to the traditional way of only considering gross margins or gross margin returns on investment, direct product profitability is the result of subtracting direct product costs such as transportation or warehousing costs from gross margin (Bookbinder & Zarour, 2001). The picture below depicts the relationship between direct product profitability and gross margin. This gives a more just estimation of an individual product’s direct profit contribution after having considered all revenues and costs associated with the specific product as it makes its way through the retailer’s supply chain (Doherty, Mailer, & Simkin, 1993).
26
Figure 5 - How Direct Product Profitability (DPP) can be calculated
2.6 Product portfolio management in a purchasing context The concept of product differentiation has been used in economics and marketing since Edward Chamberlin coined the concept in 1933 (Chamberlin, 1933). Many authors have since then sought to define ways in which products can be differentiated. Sharp and Dawes (2001) defined five sources of differentiation:
• Quality – which often also causes a difference in price • Function, feature, and design • Sales promotion activities • Availability of products in terms of timing and location
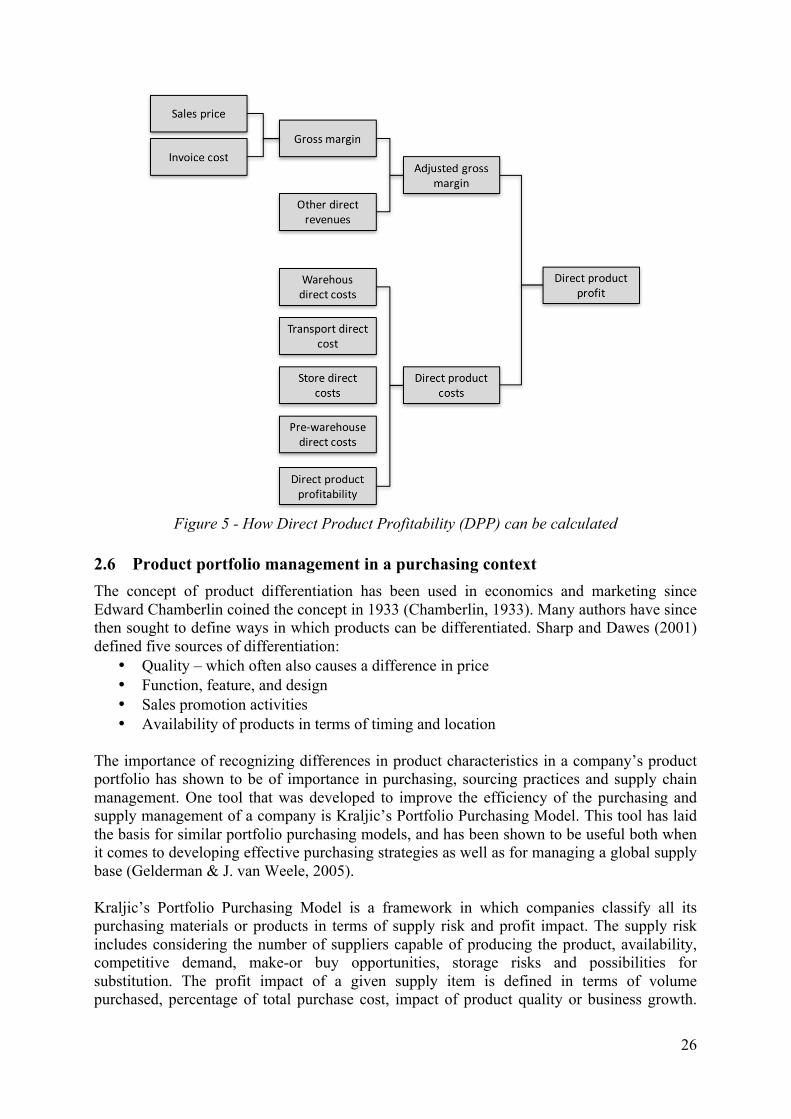
The importance of recognizing differences in product characteristics in a company’s product portfolio has shown to be of importance in purchasing, sourcing practices and supply chain management. One tool that was developed to improve the efficiency of the purchasing and supply management of a company is Kraljic’s Portfolio Purchasing Model. This tool has laid the basis for similar portfolio purchasing models, and has been shown to be useful both when it comes to developing effective purchasing strategies as well as for managing a global supply base (Gelderman & J. van Weele, 2005). Kraljic’s Portfolio Purchasing Model is a framework in which companies classify all its purchasing materials or products in terms of supply risk and profit impact. The supply risk includes considering the number of suppliers capable of producing the product, availability, competitive demand, make-or buy opportunities, storage risks and possibilities for substitution. The profit impact of a given supply item is defined in terms of volume purchased, percentage of total purchase cost, impact of product quality or business growth.
27
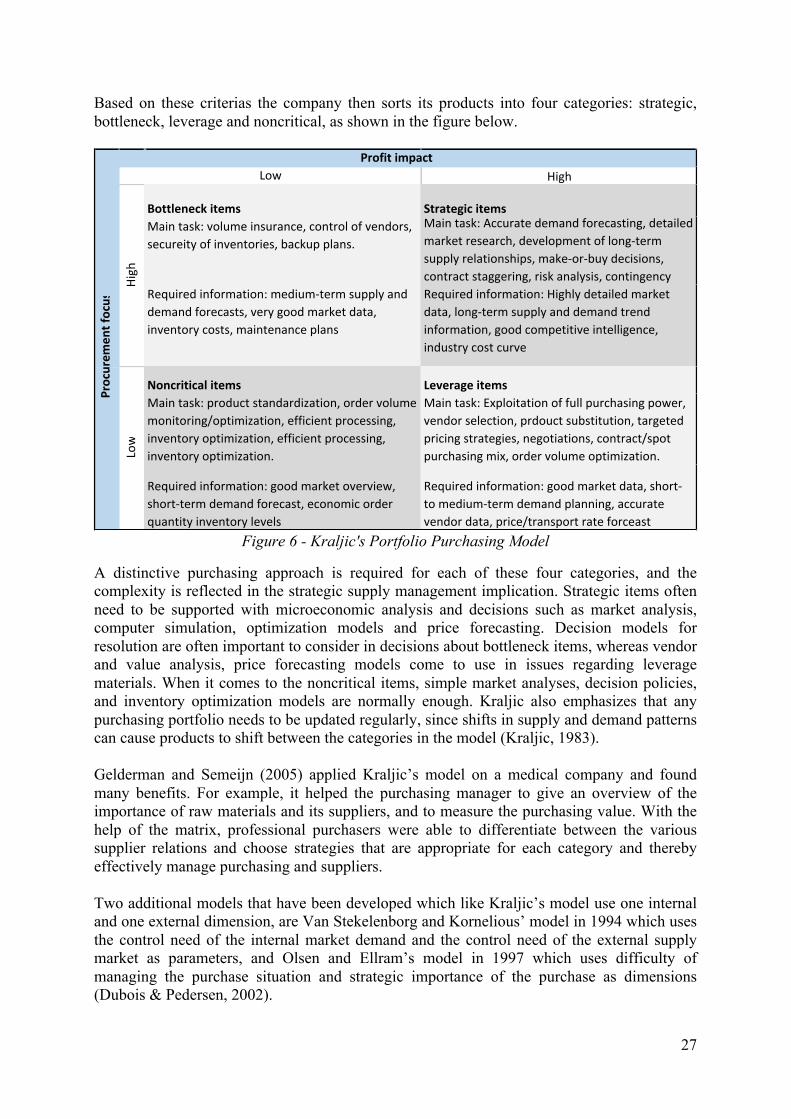
Based on these criterias the company then sorts its products into four categories: strategic, bottleneck, leverage and noncritical, as shown in the figure below.
Figure 6 - Kraljic's Portfolio Purchasing Model
A distinctive purchasing approach is required for each of these four categories, and the complexity is reflected in the strategic supply management implication. Strategic items often need to be supported with microeconomic analysis and decisions such as market analysis, computer simulation, optimization models and price forecasting. Decision models for resolution are often important to consider in decisions about bottleneck items, whereas vendor and value analysis, price forecasting models come to use in issues regarding leverage materials. When it comes to the noncritical items, simple market analyses, decision policies, and inventory optimization models are normally enough. Kraljic also emphasizes that any purchasing portfolio needs to be updated regularly, since shifts in supply and demand patterns can cause products to shift between the categories in the model (Kraljic, 1983). Gelderman and Semeijn (2005) applied Kraljic’s model on a medical company and found many benefits. For example, it helped the purchasing manager to give an overview of the importance of raw materials and its suppliers, and to measure the purchasing value. With the help of the matrix, professional purchasers were able to differentiate between the various supplier relations and choose strategies that are appropriate for each category and thereby effectively manage purchasing and suppliers. Two additional models that have been developed which like Kraljic’s model use one internal and one external dimension, are Van Stekelenborg and Kornelious’ model in 1994 which uses the control need of the internal market demand and the control need of the external supply market as parameters, and Olsen and Ellram’s model in 1997 which uses difficulty of managing the purchase situation and strategic importance of the purchase as dimensions (Dubois & Pedersen, 2002).
High
Bottleneckitems StrategicitemsMaintask:volumeinsurance,controlofvendors,secureityofinventories,backupplans.
Maintask:Accuratedemandforecasting,detailedmarketresearch,developmentoflong-termsupplyrelationships,make-or-buydecisions,contractstaggering,riskanalysis,contingency
Requiredinformation:medium-termsupplyanddemandforecasts,verygoodmarketdata,inventorycosts,maintenanceplans
Requiredinformation:Highlydetailedmarketdata,long-termsupplyanddemandtrendinformation,goodcompetitiveintelligence,industrycostcurve
Noncriticalitems LeverageitemsMaintask:productstandardization,ordervolumemonitoring/optimization,efficientprocessing,inventoryoptimization,efficientprocessing,inventoryoptimization.
Maintask:Exploitationoffullpurchasingpower,vendorselection,prdouctsubstitution,targetedpricingstrategies,negotiations,contract/spotpurchasingmix,ordervolumeoptimization.
Requiredinformation:goodmarketoverview,short-termdemandforecast,economicorderquantityinventorylevels
Requiredinformation:goodmarketdata,short-tomedium-termdemandplanning,accuratevendordata,price/transportrateforceast
Profitimpact
Procurem
entfocus
Low
High
Low
28
Despite their usage and application, these purchasing portfolio models have been criticized. The most common critique is that the complexity in business decisions can not be determined from a portfolio analysis based on only two dimensions. For example, they fail to include the relationship, network aspect and inter-firm interactions that accompanies product development (Dubois & Pedersen, 2002) and the interdependencies of business relationships and products (Ritter, 2000). Among those who completely condemn purchasing portfolio approaches, measurement issues are often mentioned. For example the result is dependent of appropriate variables being used in the model, and how they are measured, since few models give an exact suggestion on how to make the distinction between “high” and “low” values on the different dimensions (Gelderman & J. van Weele, 2005). Even though the purpose of this research is not to evaluate the supplier base, the tool was found helpful when answering RQ3 and analyzing how the product assortment affect the purchasing process.
29
3 Research methodology This chapter describes the research methodology used in this thesis. The research approach is presented, followed by a more detailed presentation of our research process. The research process is divided into two parts. The first describes how the literature review was conducted and the second how the case study was performed. Finally, the quality of the research is discussed in terms of internal validity, construct validity, external validity and reliability.
3.1 Research approach The research objective for this thesis is to investigate an existing situation at a middle-sized retail company, referred to as the case company, and as Collins & Hussey (2015) suggest, also to combine this investigation with a suggested solution to handle the problem. More specifically, the thesis is studying what aspects the purchasing strategy for private label staple products can incorporate, to take the total cost perspective of the order in consideration. To arrive at a result, the current supply chain was mapped out and areas of improvements identified. Further the literature review helped to get knowledge in strategic purchasing principles that could be applied to improve the purchasing process. A suggested solution is proposed with the help of case products from the private label assortment. The thesis aims to contribute with knowledge in the literature field of purchasing strategy and supply chain management. In order to make the problematization researchable, an exploratory case study was conducted at the case company. In a broad sense, a case study is a methodology used to explore a single phenomenon in a natural setting using a variety of methods to obtain thorough knowledge (Collins & Hussey, 2015). The exploratory case study is specifically suitable as a research method when the purpose of the research is to describe and explain a complex situation (Blomkvist & Hallin, 2015). To perform a case study as a tool to develop and test strategic management theories has proven very successful (Gibbert, Ruigrok, & Wicki, 2008). The case study can also be described as an opportunistic case study, which means that we as authors gained access to the company after an opportunity arose where we had the chance to examine this phenomenon (Collins & Hussey, 2015). Considering the purpose of the thesis being of investigative and exploring sort, we can argue that it is most suitable to use a qualitative approach. A qualitative case study tend to have less focus on reliability, and more focus on validity, so that it is the right phenomenon that is actually studied (Collins & Hussey, 2015). To conduct a qualitative case study means to use qualitative methods when collecting data. In this thesis this has been made through unstructured and semi-structured interviews. At the beginning of the study the interviews were unstructured since there was a need to explore the issues and subject fields (Blomkvist & Hallin, 2015). Later in the study, when the purpose was established together with all research questions, the interviews had a semi-structured layout in order to gather more specific information. Thanks to its flexibility, semi-structured interviews often help to uncover unexpected issues (Stanton, Salmon, Walker, Baber, & Jenkins, 2005) which was more important later in the thesis work to reveal issues that had not yet been thought of or gained any attention. It is important to bear in mind that the result in this thesis is influenced by the qualitative data collection.
30
3.2 Research process The research topic derived from a problem and an identified complex situation at the case company we had the opportunity to conduct our thesis at. From the first day we were given two supervisors from the case company, and one supervisor from the Royal Institute of Technology (KTH). We were offered a desk at the company’s office to facilitate close contact and enable a frequent dialogue throughout the projects. We were also given access to a computer with entry to internal databases. Throughout the project we had the opportunity to have weekly meetings with our supervisors at the case company, and could always ask for advice when needed. This helped to avoid the growing criticism emphasized by Vicari (2013), that findings from academic and consulting studies tend to be useless for practitioners. These weekly meetings helped to ensure a great collaboration between managers at the company. In this way we ensured that the research was both rigorous and relevant to the case company, practitioners and to society as a whole (Vicari, 2013). We spent approximately the first month to identify the problem, its root cause, define the problematization and to get an understanding of the company, its various functions and responsibilities. To gain this insight we performed several unstructured interviews with employees and managers in different parts of the organization. We also used the internal database to read articles about the company and watch videos explaining the roles of various functions. Historical data and information received through email was collected and helped the required analysis to answer RQ1. Furthermore, spending time at the office provided opportunity for informal meetings and open discussions during lunch and coffee breaks, which helped us in the understanding of the company. In parallel, existing literature was read in order to get an increased knowledge on various topics, and to get knowledge in various fields to be able to position our research in the literature. The approach conducted in the literature review is explained in greater detail in the next section. The initial phase was concluded with a presentation and discussion with supervisors and other stakeholders at the case company. We presented the current state of the supply chain, the identified areas of improvements and proposed an adjusted research question which was approved by the case company. After the supervisor at KTH also agreed on the research question and the research field in general, the next phase of the research process was initiated, which is the main case study. We started the main case study of the thesis by spending time on deepening our literature search. The literature review was conducted to get knowledge and inspiration from previous research, and to ensure that the empirical study contributed to current research. This was done through the whole project. If relevant, we used the knowledge from the literature as basis when preparing the interviews. We carefully selected key persons and employees from various functions and hierarchy levels in the company and held semi-structured interviews in order to collect qualitative data. Reflections and analyses were made throughout the whole project, however a final analysis was conducted towards the end when all the interviews had been held and all the information was gathered. The result of this analysis lead to our final result. This result was presented to the case company at what we thought would be the final presentation. However, thanks to the appreciation of our work and to some final input we wanted to include, we were able to use

31
the last input to do the final modifications to our work, and were invited to hold the final presentation again. The following figure gives an overview and summarizes the research process, and the methods used in each stage.
Figure 7 - Overview of the research process
3.2.1 Literature review This section describes the approach that has been used to conduct the literature review for this research. Literature search has been conducted continuously throughout the project. It started already in the initial phase even though the problem was not yet fully identified. Even though we spent time reading many articles in literature fields which would later be irrelevant for our work, this was very helpful since it later helped position our work in the literature and gave us knowledge in other topics related to the literature which we finally decided on. When the problem was finally identified, a literature review with a more systematic search with selected data bases, time span and specific key words started. The data bases primarily used was KTH Primo and Google Scholar. The initial approach was to gain a broad understanding of the various fields. We therefore studied literature covering the topics on a high level like management books and student literature. These gave a good knowledge base even though they are not all included in this work.
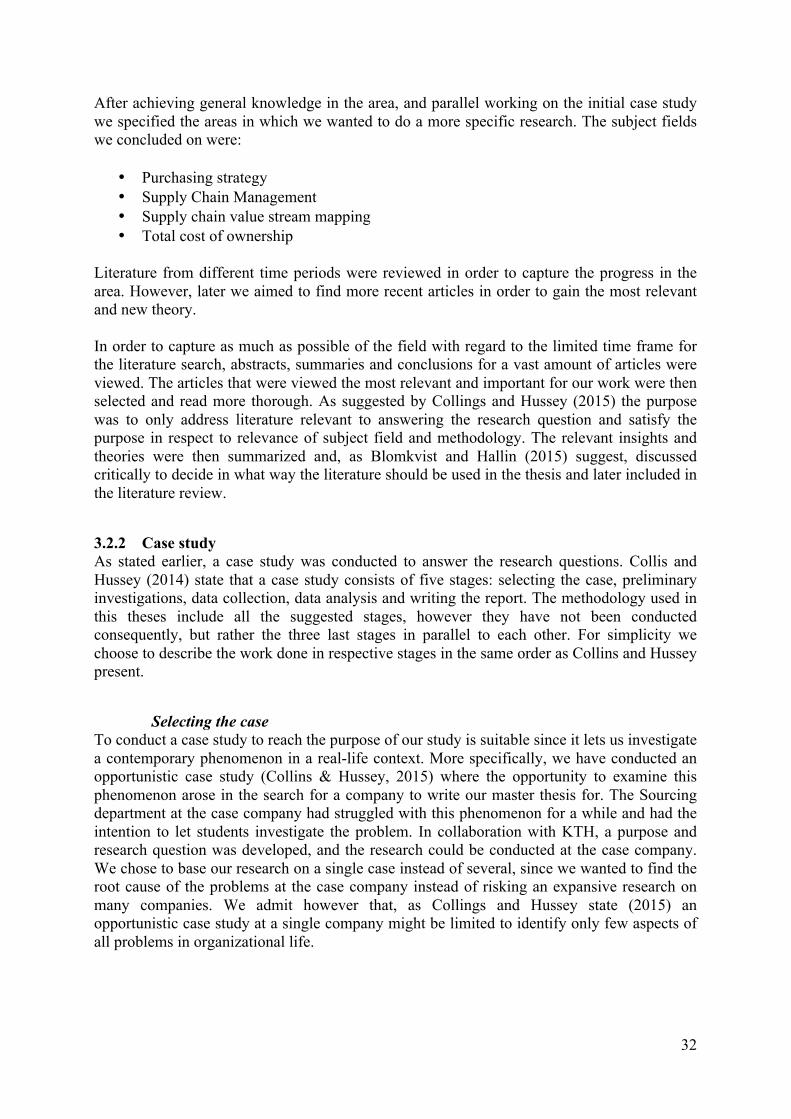
32
After achieving general knowledge in the area, and parallel working on the initial case study we specified the areas in which we wanted to do a more specific research. The subject fields we concluded on were:
• Purchasing strategy • Supply Chain Management • Supply chain value stream mapping • Total cost of ownership
Literature from different time periods were reviewed in order to capture the progress in the area. However, later we aimed to find more recent articles in order to gain the most relevant and new theory. In order to capture as much as possible of the field with regard to the limited time frame for the literature search, abstracts, summaries and conclusions for a vast amount of articles were viewed. The articles that were viewed the most relevant and important for our work were then selected and read more thorough. As suggested by Collings and Hussey (2015) the purpose was to only address literature relevant to answering the research question and satisfy the purpose in respect to relevance of subject field and methodology. The relevant insights and theories were then summarized and, as Blomkvist and Hallin (2015) suggest, discussed critically to decide in what way the literature should be used in the thesis and later included in the literature review.
3.2.2 Case study As stated earlier, a case study was conducted to answer the research questions. Collis and Hussey (2014) state that a case study consists of five stages: selecting the case, preliminary investigations, data collection, data analysis and writing the report. The methodology used in this theses include all the suggested stages, however they have not been conducted consequently, but rather the three last stages in parallel to each other. For simplicity we choose to describe the work done in respective stages in the same order as Collins and Hussey present.
Selecting the case To conduct a case study to reach the purpose of our study is suitable since it lets us investigate a contemporary phenomenon in a real-life context. More specifically, we have conducted an opportunistic case study (Collins & Hussey, 2015) where the opportunity to examine this phenomenon arose in the search for a company to write our master thesis for. The Sourcing department at the case company had struggled with this phenomenon for a while and had the intention to let students investigate the problem. In collaboration with KTH, a purpose and research question was developed, and the research could be conducted at the case company. We chose to base our research on a single case instead of several, since we wanted to find the root cause of the problems at the case company instead of risking an expansive research on many companies. We admit however that, as Collings and Hussey state (2015) an opportunistic case study at a single company might be limited to identify only few aspects of all problems in organizational life.
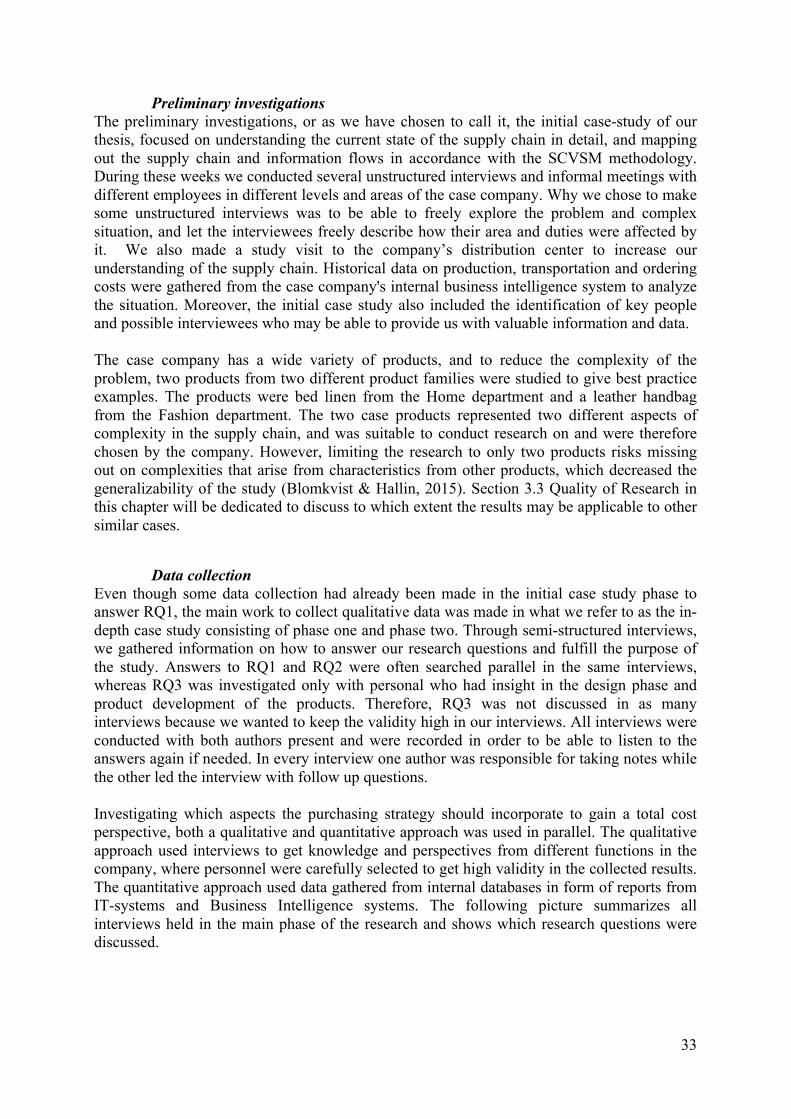
33
Preliminary investigations The preliminary investigations, or as we have chosen to call it, the initial case-study of our thesis, focused on understanding the current state of the supply chain in detail, and mapping out the supply chain and information flows in accordance with the SCVSM methodology. During these weeks we conducted several unstructured interviews and informal meetings with different employees in different levels and areas of the case company. Why we chose to make some unstructured interviews was to be able to freely explore the problem and complex situation, and let the interviewees freely describe how their area and duties were affected by it. We also made a study visit to the company’s distribution center to increase our understanding of the supply chain. Historical data on production, transportation and ordering costs were gathered from the case company's internal business intelligence system to analyze the situation. Moreover, the initial case study also included the identification of key people and possible interviewees who may be able to provide us with valuable information and data. The case company has a wide variety of products, and to reduce the complexity of the problem, two products from two different product families were studied to give best practice examples. The products were bed linen from the Home department and a leather handbag from the Fashion department. The two case products represented two different aspects of complexity in the supply chain, and was suitable to conduct research on and were therefore chosen by the company. However, limiting the research to only two products risks missing out on complexities that arise from characteristics from other products, which decreased the generalizability of the study (Blomkvist & Hallin, 2015). Section 3.3 Quality of Research in this chapter will be dedicated to discuss to which extent the results may be applicable to other similar cases.
Data collection Even though some data collection had already been made in the initial case study phase to answer RQ1, the main work to collect qualitative data was made in what we refer to as the in-depth case study consisting of phase one and phase two. Through semi-structured interviews, we gathered information on how to answer our research questions and fulfill the purpose of the study. Answers to RQ1 and RQ2 were often searched parallel in the same interviews, whereas RQ3 was investigated only with personal who had insight in the design phase and product development of the products. Therefore, RQ3 was not discussed in as many interviews because we wanted to keep the validity high in our interviews. All interviews were conducted with both authors present and were recorded in order to be able to listen to the answers again if needed. In every interview one author was responsible for taking notes while the other led the interview with follow up questions. Investigating which aspects the purchasing strategy should incorporate to gain a total cost perspective, both a qualitative and quantitative approach was used in parallel. The qualitative approach used interviews to get knowledge and perspectives from different functions in the company, where personnel were carefully selected to get high validity in the collected results. The quantitative approach used data gathered from internal databases in form of reports from IT-systems and Business Intelligence systems. The following picture summarizes all interviews held in the main phase of the research and shows which research questions were discussed.
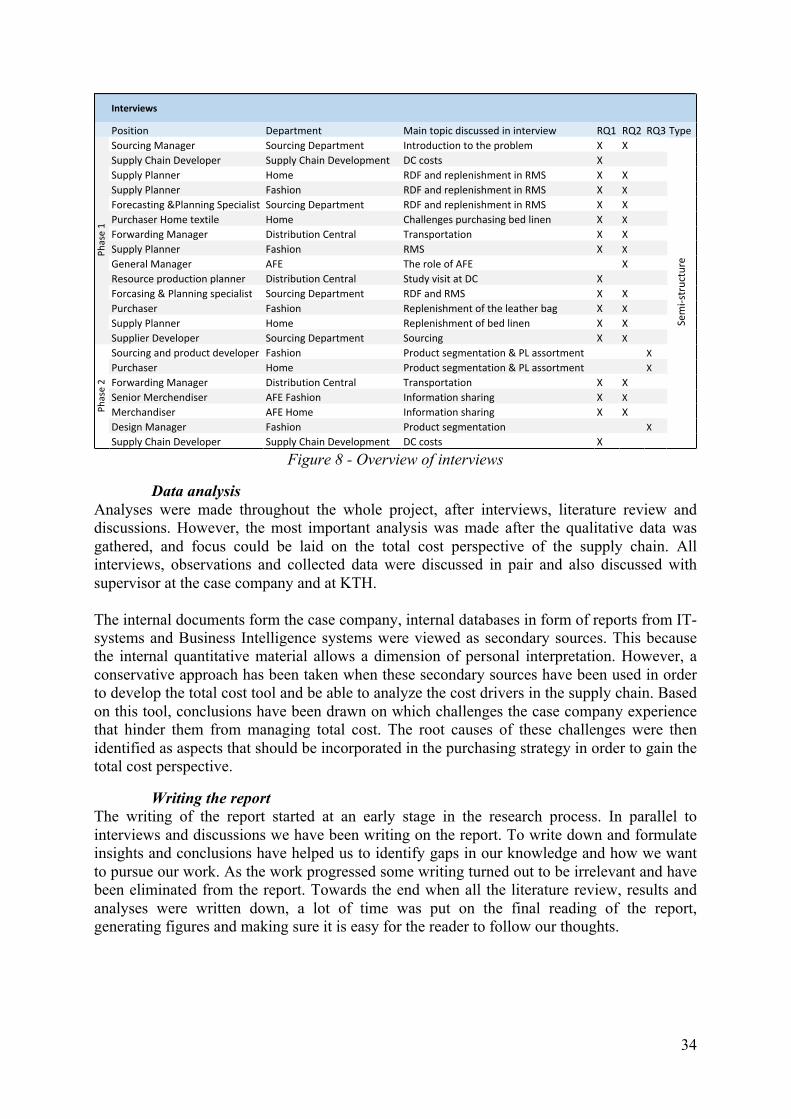
34
Figure 8 - Overview of interviews
Data analysis Analyses were made throughout the whole project, after interviews, literature review and discussions. However, the most important analysis was made after the qualitative data was gathered, and focus could be laid on the total cost perspective of the supply chain. All interviews, observations and collected data were discussed in pair and also discussed with supervisor at the case company and at KTH. The internal documents form the case company, internal databases in form of reports from IT-systems and Business Intelligence systems were viewed as secondary sources. This because the internal quantitative material allows a dimension of personal interpretation. However, a conservative approach has been taken when these secondary sources have been used in order to develop the total cost tool and be able to analyze the cost drivers in the supply chain. Based on this tool, conclusions have been drawn on which challenges the case company experience that hinder them from managing total cost. The root causes of these challenges were then identified as aspects that should be incorporated in the purchasing strategy in order to gain the total cost perspective.
Writing the report The writing of the report started at an early stage in the research process. In parallel to interviews and discussions we have been writing on the report. To write down and formulate insights and conclusions have helped us to identify gaps in our knowledge and how we want to pursue our work. As the work progressed some writing turned out to be irrelevant and have been eliminated from the report. Towards the end when all the literature review, results and analyses were written down, a lot of time was put on the final reading of the report, generating figures and making sure it is easy for the reader to follow our thoughts.
Interviews
Position Department Maintopicdiscussedininterview RQ1 RQ2 RQ3 TypeSourcingManager SourcingDepartment Introductiontotheproblem X XSupplyChainDeveloper SupplyChainDevelopment DCcosts XSupplyPlanner Home RDFandreplenishmentinRMS X XSupplyPlanner Fashion RDFandreplenishmentinRMS X XForecasting&PlanningSpecialist SourcingDepartment RDFandreplenishmentinRMS X XPurchaserHometextile Home Challengespurchasingbedlinen X XForwardingManager DistributionCentral Transportation X XSupplyPlanner Fashion RMS X XGeneralManager AFE TheroleofAFE XResourceproductionplanner DistributionCentral StudyvisitatDC XForcasing&Planningspecialist SourcingDepartment RDFandRMS X XPurchaser Fashion Replenishmentoftheleatherbag X XSupplyPlanner Home Replenishmentofbedlinen X XSupplierDeveloper SourcingDepartment Sourcing X XSourcingandproductdeveloper Fashion Productsegmentation&PLassortment XPurchaser Home Productsegmentation&PLassortment XForwardingManager DistributionCentral Transportation X XSeniorMerchendiser AFEFashion Informationsharing X XMerchandiser AFEHome Informationsharing X XDesignManager Fashion Productsegmentation XSupplyChainDeveloper SupplyChainDevelopment DCcosts X
Semi-structuredPh
ase1
Phase2

35
3.3 Quality of research This section discusses the quality of the research in terms of four concepts commonly used to ensure a rigorous case study: internal validity, construct validity, external validity and reliability (Gibbert, 2008). Based on these concepts Gibbert et al (2008) derived a strategy to ensure the methodological rigority of a thesis case study. This section uses Gibbert’s framework to discuss actions taken to ensure a rigorous case study, as well as critically evaluates how the quality of the thesis could have been improved in terms of validity and reliability.
3.3.1 Internal validity Internal validity refers to the data analysis phase, the relationship between variables and results, and whether the researcher has enough valid arguments and reasoning to supports and defend the research conclusions (Gibbert, Ruigrok, & Wicki, 2008). Gibbert et. al propose three measures to enhance internal validity. Firstly, the researcher needs to formulate a clear research framework which demonstrates that a variable lead to a certain outcome, and is not falsely caused by other variables. The research framework was derived in the initial face of the study when the problematization was understood on a detailed level, and literature review in various fields were made in order to increase the knowledge. Secondly it is important to compare empirically observed patterns with either predicted ones or patterns retained from other sources. This is done through continuously comparing observations at the case company with both knowledge retained from the literature. Finally, theory triangulation enables a researcher to verify findings by adopting multiple perspectives. In the process of mapping and identifying improvements in the supply chain, internal validity was ensured through comparing reoccurring problems enlightened by employees in interviews with numerous employees at different hierarchal positions, the literature, and historical data from the case company. Conclusions drawn by the employees on their working experience was ensured or rejected by the historical data. Literature has been validated through collecting knowledge from different journals, countries and decades. Furthermore, the same information was gathered from different departments.
3.3.2 Construct validity Construct validity refers to the extent to which a study actually investigates what it intends to investigate (Gibbert, Ruigrok, & Wicki, 2008). To ensure construct validity, Gibbert et. al proposes to establish a clear chain of evidence, enabling someone else to reconstruct how the conclusion was reached, and use triangulation. This thesis has taken Gibbert’s advice and aimed to give detailed and logical descriptions of the working process, and provide the reader with sufficient information to understand and be able to critically evaluate why specific conclusion have been made. This research triangulated data from internal documents and interviews, primarily in terms of collecting data from various sources. For example, interviews with the same purpose was conducted with several interviewees from different departments and different hierarchal levels. Applying semi-constructed interviews with open questions helped to increase the validity since the research could arrive at the same conclusion based on independent answers. Data has also been triangulated in terms of asking for the same quantitative data from various departments or key persons.
3.3.3 External validity External validity, also referred to as generalizability, is the notion that theories must be applicable for situations others than the setting in which the study is conducted. Methodologists divide external validity in two concepts: statistical and analytical generalizability. The latter differs from the primer in that it refers to the generalization from
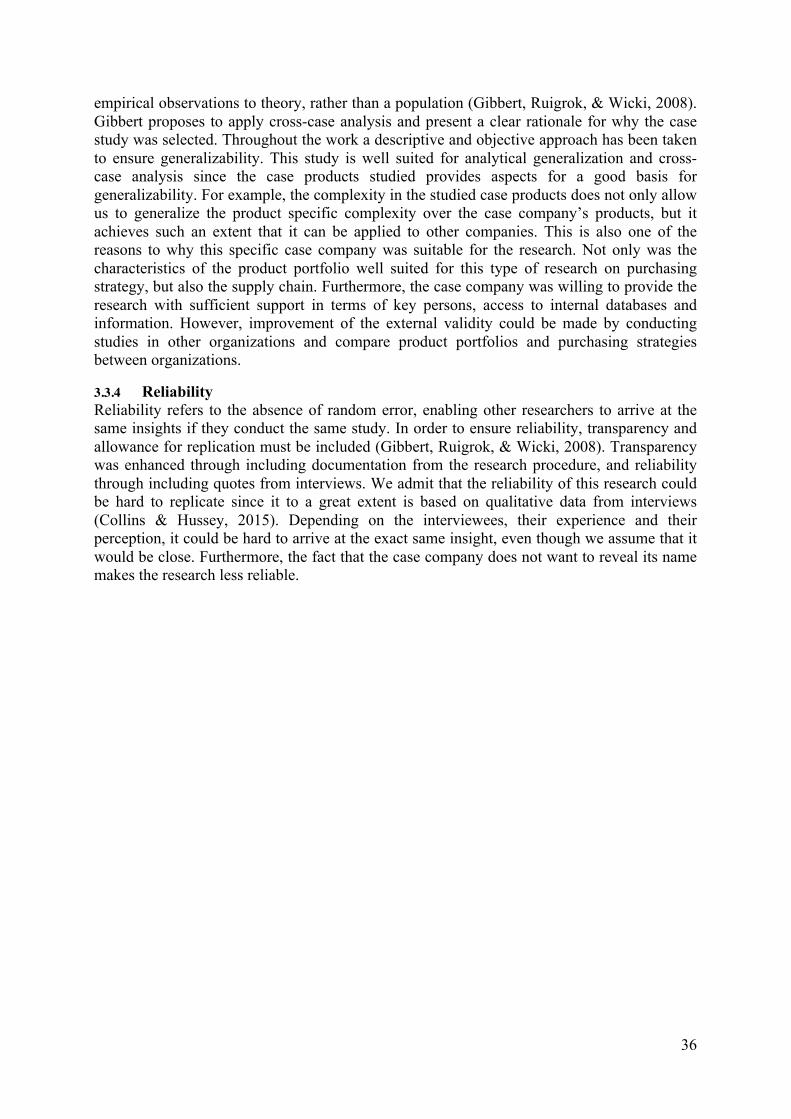
36
empirical observations to theory, rather than a population (Gibbert, Ruigrok, & Wicki, 2008). Gibbert proposes to apply cross-case analysis and present a clear rationale for why the case study was selected. Throughout the work a descriptive and objective approach has been taken to ensure generalizability. This study is well suited for analytical generalization and cross-case analysis since the case products studied provides aspects for a good basis for generalizability. For example, the complexity in the studied case products does not only allow us to generalize the product specific complexity over the case company’s products, but it achieves such an extent that it can be applied to other companies. This is also one of the reasons to why this specific case company was suitable for the research. Not only was the characteristics of the product portfolio well suited for this type of research on purchasing strategy, but also the supply chain. Furthermore, the case company was willing to provide the research with sufficient support in terms of key persons, access to internal databases and information. However, improvement of the external validity could be made by conducting studies in other organizations and compare product portfolios and purchasing strategies between organizations.
3.3.4 Reliability Reliability refers to the absence of random error, enabling other researchers to arrive at the same insights if they conduct the same study. In order to ensure reliability, transparency and allowance for replication must be included (Gibbert, Ruigrok, & Wicki, 2008). Transparency was enhanced through including documentation from the research procedure, and reliability through including quotes from interviews. We admit that the reliability of this research could be hard to replicate since it to a great extent is based on qualitative data from interviews (Collins & Hussey, 2015). Depending on the interviewees, their experience and their perception, it could be hard to arrive at the exact same insight, even though we assume that it would be close. Furthermore, the fact that the case company does not want to reveal its name makes the research less reliable.
37
Figure 9 - Summary of the quality of the research
Internalvalidity Constructvalidity Externalanalysis Reliability
Formulateaclearresearchframework
Establishaclearchainofevidence
Cross-caseanalysisReplicationoftheworksecured
•Derivedparalleltoproblematizationandliteraturereview
•Detailedandlogicaldescriptionsoftheworkingprocessincluded
•Descriptiveandobjectiveapproach
•Detailedmethoddescriptionincluded
•Meetingswithsupervisorandpeergroupstoachieveinputontheworkingprocess
•Goodbasisforgeneralizabilitywithvastnumberofcaseproducts
•Transparencyincludingnotesanddocumentsfrominterviews
Patternmatching TriangulationAclearrationaleforthecasestudyselectionprovided
•Comparingrecurrentproblemsenlightenedbyemployeesininterviewswithliteratureandhistoricaldata
•Qualitativesemi-structuredinterviewswithpersonnelfromdifferenthierarchicallevelsatthecompany.
•Suitablecompanywithexemplaryproblematization
•Suitableproductportfolio
•Competence,internalinformationandsupervisor
Theorytriangulation
•Bothintheoreticalandqualitativedatagathering.
•Severalsourcesininterviews
•Broadliteraturereview•Validatetqualitativedatawithquantitativedatafrominternaldatabases
•Quantitativedata
38
4 Empirical results and analysis In this section the results and analysis of the gathered empirical data are presented. It is structured according to the research questions posted in chapter 1, beginning with a presentation of the current purchasing strategy and a description of the case products and their purchasing requirements. After this, the three sub research questions will be chronologically answered. Firstly, a value stream mapping of the case company´s purchasing process is presented together with the main cost drivers for respective element. Secondly, identified aspects to incorporate in the purchasing strategy in order to manage total cost are presented. Finally, the privet label assortment´s impact on the total cost in the supply chain is accounted for.
4.1 The current purchasing strategy To understand how to include a total cost perspective into the purchasing strategy, it is important to first understand the current purchasing strategy. The purchasing strategy is based on a method that the case company calls time supply. This means that all the products that they order, both private label and brand products, are ordered in a quantity that will supply a determined period of time. The time supply purchasing strategy is operationalized by RMS, the IT-system generating the order suggestions. RMS knows the predetermined time supply period, and gives orders based on the demand during this determined time supply period. Since the demand varies throughout the year, there is a variation in quantity from order to order. The case company uses RDF as a prognosis system to forecast future demand in the time supply period. The time supply period for the fashion and home department is set to two months (Supply Planner Fashion, 2016) (Supply Planner Home Textile, 2016). This purchasing strategy implies that, assuming the prognosis of the demand is accurate, the orders will come in an even flow regularly in time, but in varying quantities. One of the main objective in the purchasing strategy is that the case company wants to keep low stocks (Supplier Developer, 2016). This was more or less the basis for why the case company chose to invest in a new ordering system. However, this strategy that aims to keep low inventory levels and a fixed time supply period gives raise to the complex situation of not reaching MOQ.
4.2 Mapping of the supply chain (RQ1) In order to build the total cost model, the first step is to understand the supply chain and its cost drivers. Value stream mapping was used to map out the current supply chain for our case products, the information flow between the actors, and their associated costs. The main actors relevant for our study consist of both IT-systems, departments, physical functions, key persons and are presented in the picture below. The following section will start with presenting the case products, and then explain every actor in detail and its role in the supply chain. After the actors are presented, the associated costs for every actor will be presented.
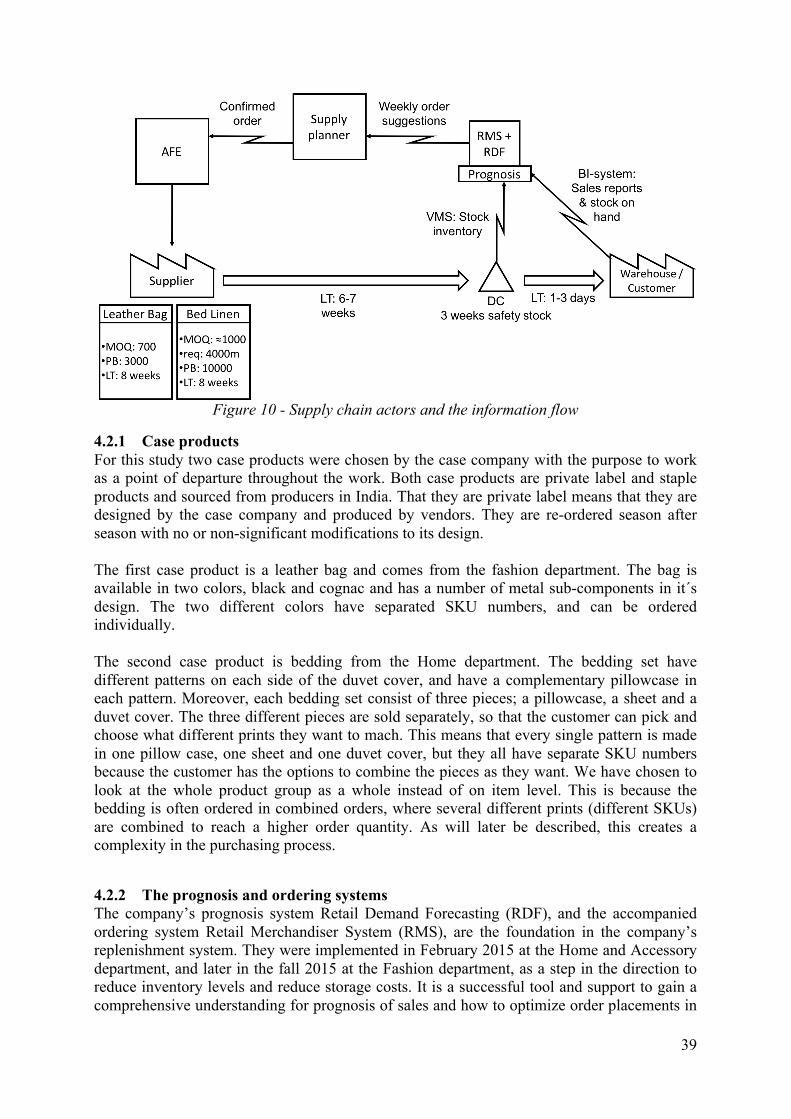
39
Figure 10 - Supply chain actors and the information flow
4.2.1 Case products For this study two case products were chosen by the case company with the purpose to work as a point of departure throughout the work. Both case products are private label and staple products and sourced from producers in India. That they are private label means that they are designed by the case company and produced by vendors. They are re-ordered season after season with no or non-significant modifications to its design. The first case product is a leather bag and comes from the fashion department. The bag is available in two colors, black and cognac and has a number of metal sub-components in it´s design. The two different colors have separated SKU numbers, and can be ordered individually. The second case product is bedding from the Home department. The bedding set have different patterns on each side of the duvet cover, and have a complementary pillowcase in each pattern. Moreover, each bedding set consist of three pieces; a pillowcase, a sheet and a duvet cover. The three different pieces are sold separately, so that the customer can pick and choose what different prints they want to mach. This means that every single pattern is made in one pillow case, one sheet and one duvet cover, but they all have separate SKU numbers because the customer has the options to combine the pieces as they want. We have chosen to look at the whole product group as a whole instead of on item level. This is because the bedding is often ordered in combined orders, where several different prints (different SKUs) are combined to reach a higher order quantity. As will later be described, this creates a complexity in the purchasing process.
4.2.2 The prognosis and ordering systems The company’s prognosis system Retail Demand Forecasting (RDF), and the accompanied ordering system Retail Merchandiser System (RMS), are the foundation in the company’s replenishment system. They were implemented in February 2015 at the Home and Accessory department, and later in the fall 2015 at the Fashion department, as a step in the direction to reduce inventory levels and reduce storage costs. It is a successful tool and support to gain a comprehensive understanding for prognosis of sales and how to optimize order placements in
40
relation to sales. The RDF system makes forecasts for sales 52 weeks in advance, and breaks this down into weekly sales forecasts for products on SKU level for every department. The forecasts are based on last years’ sales, however the users of the RDF system can correct and adjust the forecasts in retrospect to sharpen the prognosis. RMS then uses the data and prognosis gathered in RDF and generates an order suggestion. Order suggestions are presented on a weekly basis. This is referred to as the review time. In order to understand how the order suggestions are generated in RMS, it is central to understand the concept of the time supply period. It is a predetermined period of time for which the company wants to be able to supply its stores with products from its own storage. The pre-determined time supply period should according to the strategy be the same for the products, but however vary from department to department and is either two or three months. To decide when the order should be triggered, the RMS system has information on how long lead-time the products need to reach the storage, and a predetermined safety stock on three weeks. The lead-time plus storage time is our minimum supply days, that is, when the storage level drops to a quantity corresponding to our minimum supply days, an order will be triggered. RMS then sees over the demand two-three months into the future, up to what is called the maximum supply days. Theoretically, this means that the available storage quantity of the product should always range so that it can supply a minimum of three weeks (the safety stock) and a maximum of the demand during the pre-determined time supply period (Forcasing and Planning specialist, 2016).
4.2.3 Supply Planning The order suggestion generated in RMS is presented to the supply planners on a weekly order list. Every department has their own group of supply planners who are responsible for specific products. When the order is presented to the supply planner, they make one out of three choices: accepts it, neglects it (and thus postpones it so it will reappear on next weeks’ order suggestion), or start a dialogue with the Asian Far East (AFE) office to determine whether the order is likely to be approved by the vendors or not. A supply planner often only accepts the order straight away if the order quantity is higher than the MOQ for the product. When the supply planner approves the order, it is sent to the AFE office in India together with information on quantity and time of delivery, that is the date when the goods should be transported from the designated harbor in Asia so that they will be shipped to Sweden and arrive at DC (Distribution Central) in time for the selling start. The merchandisers at the AFE office lay the final order at the vendor. If, however the suggested order from RMS does not reach the MOQ, the supply planner either neglects the order so that it is postponed and reappears on the next weeks’ order, or the supply planner starts a dialogue with the AFE office in order to discuss whether the order can be laid despite the fact that the suggested order quantity is under the MOQ. Based on interviews with supply planners, the general perception is that it is very random whether orders under the minimum order quantity are approved by the vendors or not. Sometimes the merchandisers at the AFE office comes back with the information that they have renegotiated the price and can accept the order, and in other cases they receive a strict no. The supply planners are also responsible for the allocation of the right amount of products from DC, the main warehouse, to the stores so that they have enough to fill up their presentation stock, the amount of products that they store on the shelves in the store. This flow is also managed by RMS. The stores sometimes keep their own stock of products. This thesis is however only concerned with the storage at DC and has decided to exclude the distribution and storage to the warehouses in the study.

41
4.2.4 Asia Far East office As mentioned in the previous section, an order laid by supply planners is sent to the merchandisers at the AFE office, who in turn forward the order to the vendors. They can be seen as a middle-hand between the office in Stockholm and the vendors and help with order management and negotiations when necessary. The AFE office has good knowledge about the vendors and the production, and therefore can help the supply planners and purchasers in the ordering process.
4.2.5 Transportation The transportation of the finished goods is a collaboration between the vendors, a local forwarding agent and a Swedish forward agent. The products are transported from the vendors in India to a determined harbor in Mumbai, shipped overseas to Gothenburg in Sweden, and finally transported by train to DC outside Stockholm. The transportation part of the overall supply chain starts with the “pick-up date”, and ends with the products arriving at the DC-warehouse, which is called “not before date”. The pick-up date is set by the supply planners when first placing the orders, and marks the day when the order should be ready to be picked up by the shipping actor. From the production site, the products are forwarded to the harbor in Mumbai by truck. This is made by local forwarding agents who makes the transports and is an integrated part of the ordering of the products. From India, every product is ordered with a FOB (Free On Board) agreement. This means that the transportation to the harbor is included in the purchasing price for the products. When the forwarding agents reach the harbor with the finished products, it is stored in the harbor until the next shipment has departure time from the harbor. From the Mumbai harbor, the departure with container ship is every Friday, which means that they close the loading terminal on Tuesdays. There are three different alternatives used when packing the products in containers; the first is the Factory load container (FLC). This is when the vendors already have packed the ordered products in a container and sealed it. This container remains intact all the way until it is opened at DC Warehouse. This way of transporting the products requires the order to be sufficiently large to actually fill up a container, and make it economically efficient. The second alternative is a Buyers consolidation container (BCN). This means that orders from several of the case company’s vendors are taken to the harbor and then consolidated in a common container owned by the case company, with only their products in it. This type of consolidated container will be packed in the harbor in Mumbai, and then opened and unpacked in the harbor in Gothenburg. The cost for the Buyers consolidation container and the Factory load container is the same. However, one benefit with using the Factory load container instead of Buyers consolidation is that the risk of quality deterioration is smaller for Factory load container since the goods are not repacked or dealt with during the transportation. The third and last alternative is Loose container load (LCL), which means that the products are transported in a container owned by the shipping company, and are packed together with products from other companies. This is the most expensive way of transporting the products and means that the products will need to be unpacked and repacked when reaching the harbor in Gothenburg. This way of transporting products is used only when the quantities do not reach the required amount to transport in the other two previous described ways. The lead time is 6-7 weeks to reach the DC warehouse, independent of the different ways of shipping. When the containers arrive at Gothenburg harbor, the Swedish forwarding agent has the responsibility to transport the products from the harbor to the DC-warehouse by train. It is
42
personnel from the DC warehouse that calls home the orders from the harbor and decides how to prioritize which orders to take to DC first. If the products lay more than eight days a penalty fee will arise (Forwarding Manager, 2016).
4.2.6 Distribution Central DC is the main Distribution Central and warehouse that the case company uses to store its products. It is situated in proximity of Stockholm. The following information was received from a study visit at DC where we also performed an interview (Resource and tactical production planner, 2016). DC personnel first gets involved in the procurement of products when they call off the containers from the harbor in Gothenburg. They are prioritized based on upcoming promotions and demand patterns. When the products arrive at DC there are three different flows that all products pass on their way out to the department stores. The three flows are called Premark, x-docking and DC-stored. The first two flows have a very short throughput time at DC with just around two days from when the products arrive to when they are shipped out to the department stores. What constitutes the Premark flow is that the goods come pre packed for every department store from the suppliers. At DC they sort the incoming shipment so that the right box goes to the accurate warehouse. The majority of products in this flow is replenishment of brand products. Secondly, what constitutes the X-docking flow is that the goods arriving to DC is packed in bulk and have to be sorted on site with respect to demand on each department store. This is made in an automated sorting work. The majority of products in this flow is, in similarity with the Premark flow, replenishment orders of brand products. These two flows do not process any private label products, which are handled in the DC-stored flow. In the DC-stored flow the products arrive to DC and are unpacked and then transported to different storage areas at DC. Depending on the demand situation in the department stores, a part of the order (or the entire order) could be sent directly out to the department stores. This is then made through the automated sorting work. When the products are stored in the right storage area, they await to be picked when the demand of the department stores requires it. The around eighty different department stores have “pick-days” 2-5 days a week, depending on the sale rates of the stores. When a department store has its pick-day, all the products in demand gets transferred from the RMS IT-system used by the supply planners, to the VMS IT-system used at DC. The personnel at DC then gets a pick-order linked to a specific department store which is collected and packed to be transported by truck to the department store in question. The lead time for this operation includes three main activities; the picking of products, departure of the transport, and delivery to the department store. This varies in time from one to three days, depending on where the department store is situated. When it comes to costs for the DC warehouse the Supply Chain Sourcing department at the case company use a fairly new tool for estimating the costs associated with the handling and storage of products at DC. This tool was developed to be able to more closely follow up the margins on the individual products and to make better decisions when it comes to purchasing decisions. Space is not a limiting factor at DC. They have experienced shortage of space during limited periods of peak season during Christmas, however, this has always been handled by renting extra space and will not be seen as a limiting factor in this thesis work. Having mapped the whole supply chain, the cost drivers for respective step can be investigated further, which was necessary in order to develop the total cost model.
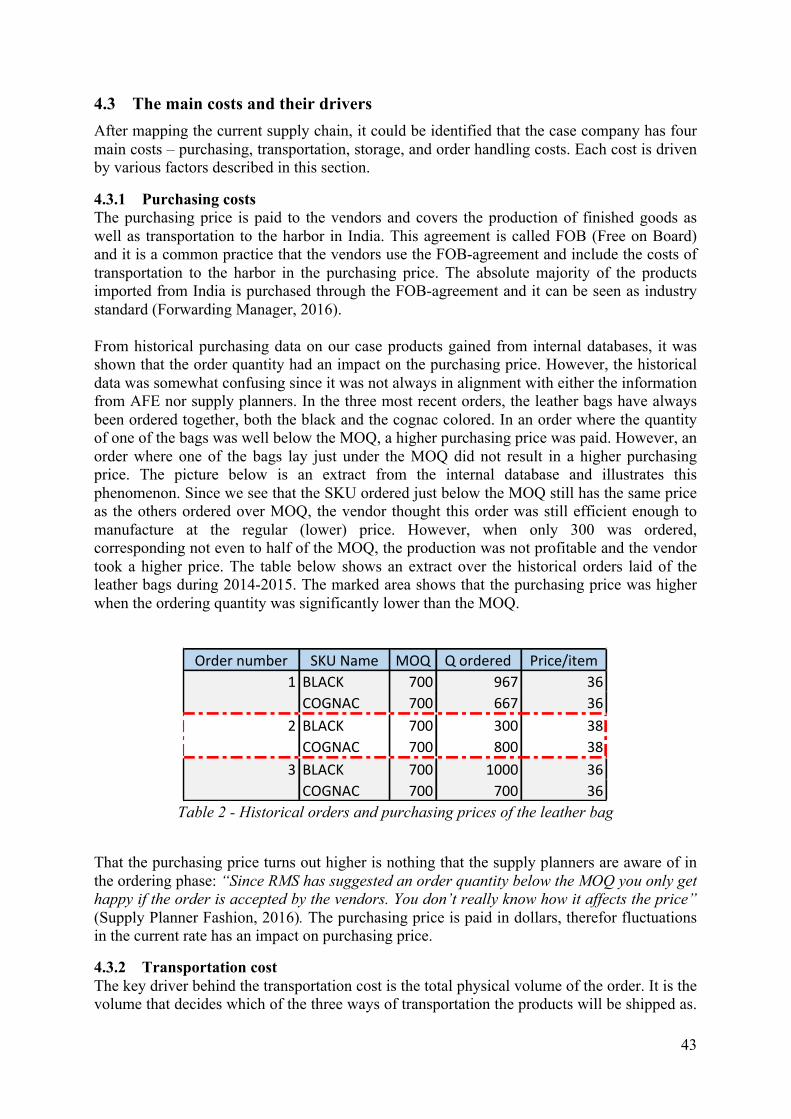
43
4.3 The main costs and their drivers After mapping the current supply chain, it could be identified that the case company has four main costs – purchasing, transportation, storage, and order handling costs. Each cost is driven by various factors described in this section.
4.3.1 Purchasing costs The purchasing price is paid to the vendors and covers the production of finished goods as well as transportation to the harbor in India. This agreement is called FOB (Free on Board) and it is a common practice that the vendors use the FOB-agreement and include the costs of transportation to the harbor in the purchasing price. The absolute majority of the products imported from India is purchased through the FOB-agreement and it can be seen as industry standard (Forwarding Manager, 2016). From historical purchasing data on our case products gained from internal databases, it was shown that the order quantity had an impact on the purchasing price. However, the historical data was somewhat confusing since it was not always in alignment with either the information from AFE nor supply planners. In the three most recent orders, the leather bags have always been ordered together, both the black and the cognac colored. In an order where the quantity of one of the bags was well below the MOQ, a higher purchasing price was paid. However, an order where one of the bags lay just under the MOQ did not result in a higher purchasing price. The picture below is an extract from the internal database and illustrates this phenomenon. Since we see that the SKU ordered just below the MOQ still has the same price as the others ordered over MOQ, the vendor thought this order was still efficient enough to manufacture at the regular (lower) price. However, when only 300 was ordered, corresponding not even to half of the MOQ, the production was not profitable and the vendor took a higher price. The table below shows an extract over the historical orders laid of the leather bags during 2014-2015. The marked area shows that the purchasing price was higher when the ordering quantity was significantly lower than the MOQ.
Table 2 - Historical orders and purchasing prices of the leather bag
That the purchasing price turns out higher is nothing that the supply planners are aware of in the ordering phase: “Since RMS has suggested an order quantity below the MOQ you only get happy if the order is accepted by the vendors. You don’t really know how it affects the price” (Supply Planner Fashion, 2016). The purchasing price is paid in dollars, therefor fluctuations in the current rate has an impact on purchasing price.
4.3.2 Transportation cost The key driver behind the transportation cost is the total physical volume of the order. It is the volume that decides which of the three ways of transportation the products will be shipped as.
Ordernumber SKUName MOQ Qordered Price/item1 BLACK 700 967 36COGNAC 700 667 36
2 BLACK 700 300 38COGNAC 700 800 38
3 BLACK 700 1000 36COGNAC 700 700 36
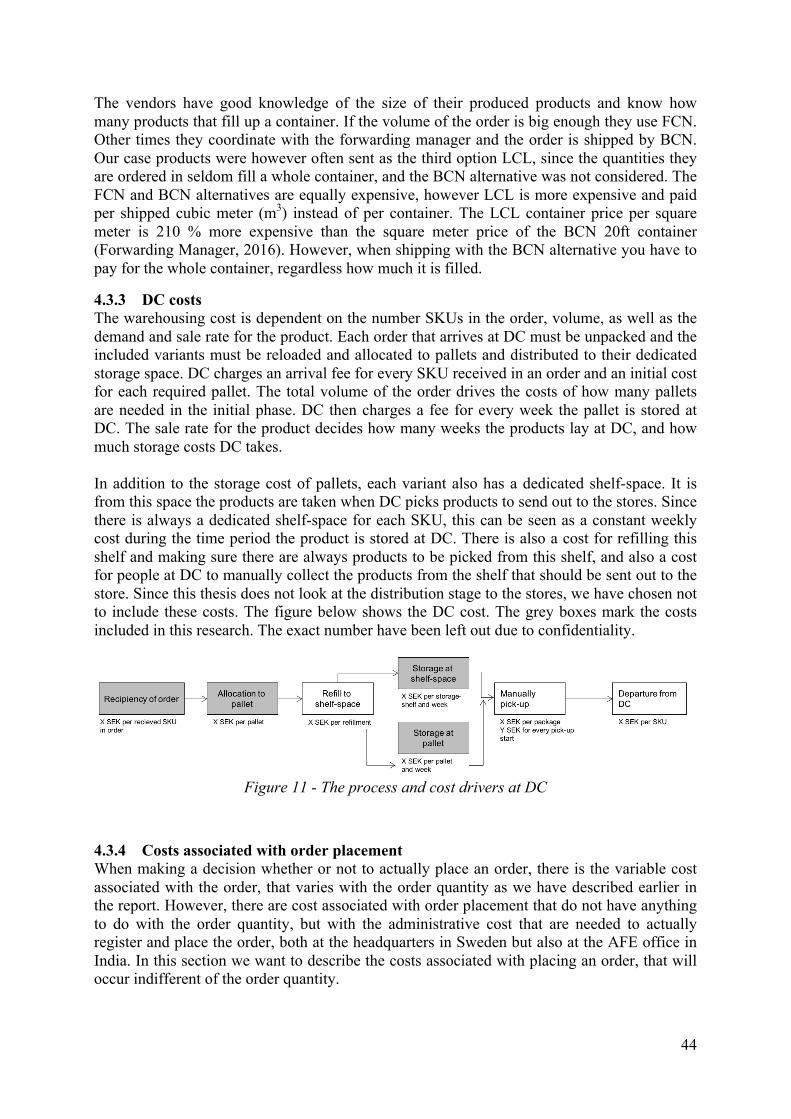
44
The vendors have good knowledge of the size of their produced products and know how many products that fill up a container. If the volume of the order is big enough they use FCN. Other times they coordinate with the forwarding manager and the order is shipped by BCN. Our case products were however often sent as the third option LCL, since the quantities they are ordered in seldom fill a whole container, and the BCN alternative was not considered. The FCN and BCN alternatives are equally expensive, however LCL is more expensive and paid per shipped cubic meter (m3) instead of per container. The LCL container price per square meter is 210 % more expensive than the square meter price of the BCN 20ft container (Forwarding Manager, 2016). However, when shipping with the BCN alternative you have to pay for the whole container, regardless how much it is filled.
4.3.3 DC costs The warehousing cost is dependent on the number SKUs in the order, volume, as well as the demand and sale rate for the product. Each order that arrives at DC must be unpacked and the included variants must be reloaded and allocated to pallets and distributed to their dedicated storage space. DC charges an arrival fee for every SKU received in an order and an initial cost for each required pallet. The total volume of the order drives the costs of how many pallets are needed in the initial phase. DC then charges a fee for every week the pallet is stored at DC. The sale rate for the product decides how many weeks the products lay at DC, and how much storage costs DC takes. In addition to the storage cost of pallets, each variant also has a dedicated shelf-space. It is from this space the products are taken when DC picks products to send out to the stores. Since there is always a dedicated shelf-space for each SKU, this can be seen as a constant weekly cost during the time period the product is stored at DC. There is also a cost for refilling this shelf and making sure there are always products to be picked from this shelf, and also a cost for people at DC to manually collect the products from the shelf that should be sent out to the store. Since this thesis does not look at the distribution stage to the stores, we have chosen not to include these costs. The figure below shows the DC cost. The grey boxes mark the costs included in this research. The exact number have been left out due to confidentiality.
Figure 11 - The process and cost drivers at DC
4.3.4 Costs associated with order placement When making a decision whether or not to actually place an order, there is the variable cost associated with the order, that varies with the order quantity as we have described earlier in the report. However, there are cost associated with order placement that do not have anything to do with the order quantity, but with the administrative cost that are needed to actually register and place the order, both at the headquarters in Sweden but also at the AFE office in India. In this section we want to describe the costs associated with placing an order, that will occur indifferent of the order quantity.
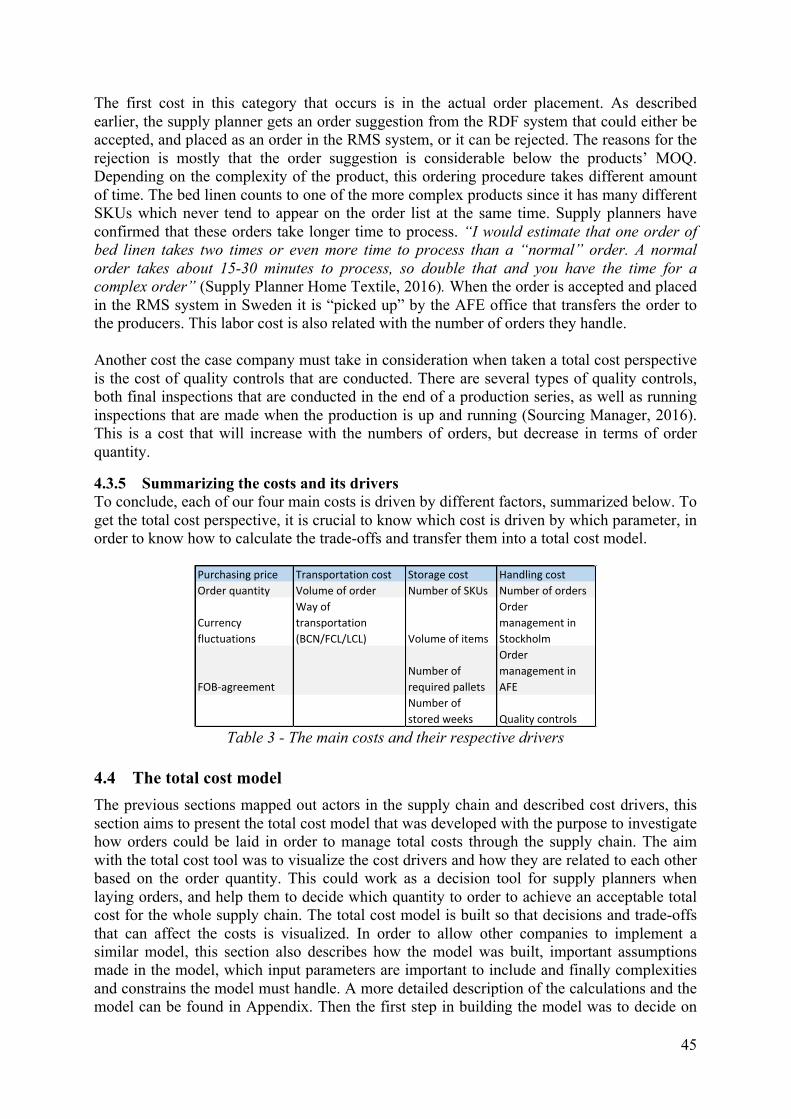
45
The first cost in this category that occurs is in the actual order placement. As described earlier, the supply planner gets an order suggestion from the RDF system that could either be accepted, and placed as an order in the RMS system, or it can be rejected. The reasons for the rejection is mostly that the order suggestion is considerable below the products’ MOQ. Depending on the complexity of the product, this ordering procedure takes different amount of time. The bed linen counts to one of the more complex products since it has many different SKUs which never tend to appear on the order list at the same time. Supply planners have confirmed that these orders take longer time to process. “I would estimate that one order of bed linen takes two times or even more time to process than a “normal” order. A normal order takes about 15-30 minutes to process, so double that and you have the time for a complex order” (Supply Planner Home Textile, 2016). When the order is accepted and placed in the RMS system in Sweden it is “picked up” by the AFE office that transfers the order to the producers. This labor cost is also related with the number of orders they handle. Another cost the case company must take in consideration when taken a total cost perspective is the cost of quality controls that are conducted. There are several types of quality controls, both final inspections that are conducted in the end of a production series, as well as running inspections that are made when the production is up and running (Sourcing Manager, 2016). This is a cost that will increase with the numbers of orders, but decrease in terms of order quantity.
4.3.5 Summarizing the costs and its drivers To conclude, each of our four main costs is driven by different factors, summarized below. To get the total cost perspective, it is crucial to know which cost is driven by which parameter, in order to know how to calculate the trade-offs and transfer them into a total cost model.
Table 3 - The main costs and their respective drivers
4.4 The total cost model The previous sections mapped out actors in the supply chain and described cost drivers, this section aims to present the total cost model that was developed with the purpose to investigate how orders could be laid in order to manage total costs through the supply chain. The aim with the total cost tool was to visualize the cost drivers and how they are related to each other based on the order quantity. This could work as a decision tool for supply planners when laying orders, and help them to decide which quantity to order to achieve an acceptable total cost for the whole supply chain. The total cost model is built so that decisions and trade-offs that can affect the costs is visualized. In order to allow other companies to implement a similar model, this section also describes how the model was built, important assumptions made in the model, which input parameters are important to include and finally complexities and constrains the model must handle. A more detailed description of the calculations and the model can be found in Appendix. Then the first step in building the model was to decide on
Purchasingprice Transportationcost Storagecost Handlingcost
Orderquantity Volumeoforder NumberofSKUs Numberoforders
Currency
fluctuations
Wayof
transportation
(BCN/FCL/LCL) Volumeofitems
Order
managementin
Stockholm
FOB-agreement
Numberof
requiredpallets
Order
managementin
AFE
Numberof
storedweeks Qualitycontrols
46
which complexities the total cost tool was supposed to handle. The second step was to find a general approach for the model. Finally, gathering the required data and setting up the calculations in the model in order to arrive at an order suggestions had to been done. All three steps are described below.
4.4.1 Targeted challenges in the purchasing process to consider After interviews with several people from different departments, it became clear which challenges in the purchasing process actually prohibit the case company to manage the total cost of the supply chain. The total cost tool aimed to resolve all these challenges:
• The inability to reach MOQ with the set time supply period • Production specific requirements • The difficulty to combine order suggestions on related SKUs • Uneven flow of orders to vendors • Inefficient time supply period • Inability to coordinate transports
The challenges with MOQs, production specific challenges and the difficulty to combine order suggestions on related SKUs are interrelated. All SKUs have their own MOQ. We will refer to this as MOQs on SKU level. This MOQ is inserted in RMS, however, the system is unable to take it into consideration when suggesting orders. Therefore, order suggestions under the MOQ appear, causing difficulties for supply planners. Furthermore, our research indicated that supply planners do not always have the same MOQs as AFE provided. This could explain the confusion that sometimes appear. After interviews with AFE, it became apparent that the MOQs on SKU level is not the only restriction that has to be considered. This becomes apparent for products that need to be jointly purchased together with other SKUs in the same product family. It is not guaranteed that an order for a SKU can be laid even though it exceeds its MOQ on SKU level. SKUs that have related SKUs and belongs to a product family, production specific aspects impact the quantity possible to lay. The bed linen is an epitome of a product family with many related SKUs and production specific requirements. The bed linen comes in many sizes and patterns. All the different patterns of pillowcases, duvet covers and sheets have their own SKU number and can be ordered separately. The product family includes about 60 different SKUs which can be mixed and matched as the customer wants. This means that the demand for every SKU is unique. Every time the vendor starts a production of a new pattern, 200 meters of fabric go to waste since they need to change color and print pattern. In order for the production to be profitable, they need a minimum quantity to produce for each batch of production, that is, each pattern. Therefore, there is a pattern requirement of 4000 meters of fabric for each pattern to be produced. This requirement can only be met if either the quantity for the specific SKU is increased, or if SKUs in the same pattern in the same product family is added to the order. The described situation of pattern group requirement combined with the previously explained problem of SKU-specific MOQs create a complex situation in the ordering process. These requirements create a need to increase orders that do not reach these requirements. Our total cost model thus aims to answer how much they should be increased, and which SKUs to increase to meet these requirements and thus consider the total cost perspective. Another phenomenon which regularly occurs is that order suggestions for SKUs in the same product family are spread over weeks close in time. For example, a reoccurring situation for the bed linen is that a pillow case in a specific pattern is suggested one week, only to be
47
followed by a suggestion of a duvet cover in the same pattern the next week. Of course, this is no long lasting situation for the vendor producing these bed linen. This causes irritation with the vendor since they could have produced the orders at the same time instead of dividing the production in two batches. It was found that some vendors have learned the case company’s ordering pattern to lay orders of SKUs that could have been produced together, closely after each other. Some vendors then wait a couple of weeks to gather the orders from the case company and produce all orders at the same time (Purchaser Home Textile, 2016 ). This is not sustainable since it causes stock outs at DC. However, the case company could benefit from gathering the whole order since this could help to reach the MOQs. To be able to tackle this problem, it would be beneficial to see into the future which SKUs that soon go out of stock so that these could be added to the order (Supply, 2016). This is however nothing that RMS is capable of today. Today, RMS is constructed so that order suggestions should be presented at a regular basis for each SKU. Achieving an even flow in production would also be beneficial since it allows vendors to plan their production in advance (Forcasing and Planning specialist, 2016). As mentioned in section 4.2.2 the time supply for the products are two months at the fashion department and three at the home department. It is however not sure that this time supply is the most suitable and the most cost efficient for the company. This time supply was chosen when the RMS system was implemented, and has recently been questioned because of the challenges in the purchasing process. A longer time supply would result in a higher ordering quantity, since it would supply for a longer time. How this would affect the storage cost is however hard to estimate today. Finally, it would be of interest to be able to know in the purchasing phase if the quantity ordered affects how the products will be transported. Since volume drives the decision whether to transport with FCL or LCL, a slightly higher ordering quantity could be enough to fill up a container, and get a lower price for the transportation. Today, it is impossible to tell in the ordering phase how it is transported. AFE however confirmed that the case products almost always go as LCL.
4.4.2 Building the total cost model Having identified the main areas of challenges, an approach to tackle them was needed. We reasoned that the MOQs is the biggest challenge and should be given highest consideration. Negotiating for lower MOQs with vendors is one alternative, however this would not solve the problem since the restriction would still be there and affect the order. Another approach is to see how to increase the order suggestion generated from RMS. Increasing the demand for the product is of course one solution, however it is out of scope for this thesis. Three other alternatives to increase the order quantity suggested by RMS remain: to increase the time supply period, to increase the review time, or to add products to combine in the order which have not appeared on the order list but soon run out of stock and will get an order trigger in the near future. To add an extra month to the time supply period would increase the order quantity since we would have to order larger quantities of products to DC since we supply for a longer period of time. However, the case company is reluctant to increasing stocks since it leads to a lot of bound capital, and is not in alignment with the current purchasing strategy. The whole point with implementing RMS was to reduce storage costs. Increasing the review time would be another option, however then we risk to miss orders that were triggered the day after the review time, and to wait a longer time for the next order suggestion increases the risk of stock outs. To avoid this situation, you would have to increase the safety stock, which again is against the current strategy. Finally, adding products that will be triggered in the near
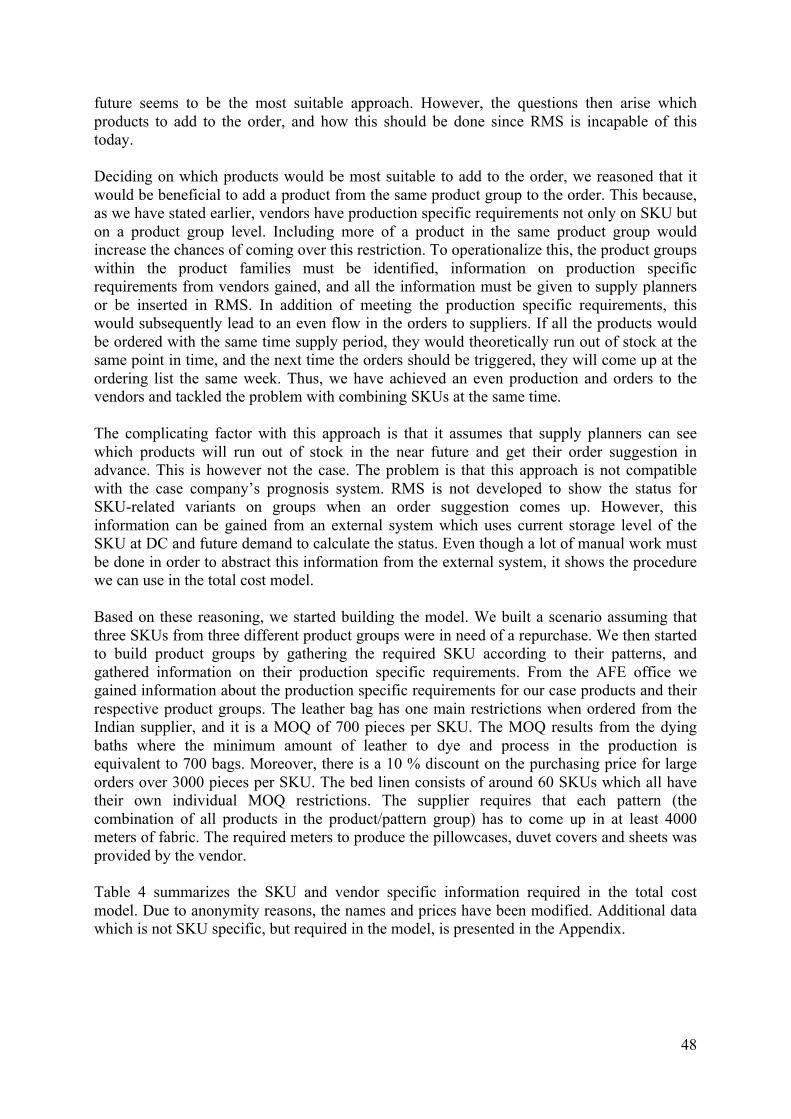
48
future seems to be the most suitable approach. However, the questions then arise which products to add to the order, and how this should be done since RMS is incapable of this today. Deciding on which products would be most suitable to add to the order, we reasoned that it would be beneficial to add a product from the same product group to the order. This because, as we have stated earlier, vendors have production specific requirements not only on SKU but on a product group level. Including more of a product in the same product group would increase the chances of coming over this restriction. To operationalize this, the product groups within the product families must be identified, information on production specific requirements from vendors gained, and all the information must be given to supply planners or be inserted in RMS. In addition of meeting the production specific requirements, this would subsequently lead to an even flow in the orders to suppliers. If all the products would be ordered with the same time supply period, they would theoretically run out of stock at the same point in time, and the next time the orders should be triggered, they will come up at the ordering list the same week. Thus, we have achieved an even production and orders to the vendors and tackled the problem with combining SKUs at the same time. The complicating factor with this approach is that it assumes that supply planners can see which products will run out of stock in the near future and get their order suggestion in advance. This is however not the case. The problem is that this approach is not compatible with the case company’s prognosis system. RMS is not developed to show the status for SKU-related variants on groups when an order suggestion comes up. However, this information can be gained from an external system which uses current storage level of the SKU at DC and future demand to calculate the status. Even though a lot of manual work must be done in order to abstract this information from the external system, it shows the procedure we can use in the total cost model. Based on these reasoning, we started building the model. We built a scenario assuming that three SKUs from three different product groups were in need of a repurchase. We then started to build product groups by gathering the required SKU according to their patterns, and gathered information on their production specific requirements. From the AFE office we gained information about the production specific requirements for our case products and their respective product groups. The leather bag has one main restrictions when ordered from the Indian supplier, and it is a MOQ of 700 pieces per SKU. The MOQ results from the dying baths where the minimum amount of leather to dye and process in the production is equivalent to 700 bags. Moreover, there is a 10 % discount on the purchasing price for large orders over 3000 pieces per SKU. The bed linen consists of around 60 SKUs which all have their own individual MOQ restrictions. The supplier requires that each pattern (the combination of all products in the product/pattern group) has to come up in at least 4000 meters of fabric. The required meters to produce the pillowcases, duvet covers and sheets was provided by the vendor. Table 4 summarizes the SKU and vendor specific information required in the total cost model. Due to anonymity reasons, the names and prices have been modified. Additional data which is not SKU specific, but required in the model, is presented in the Appendix.
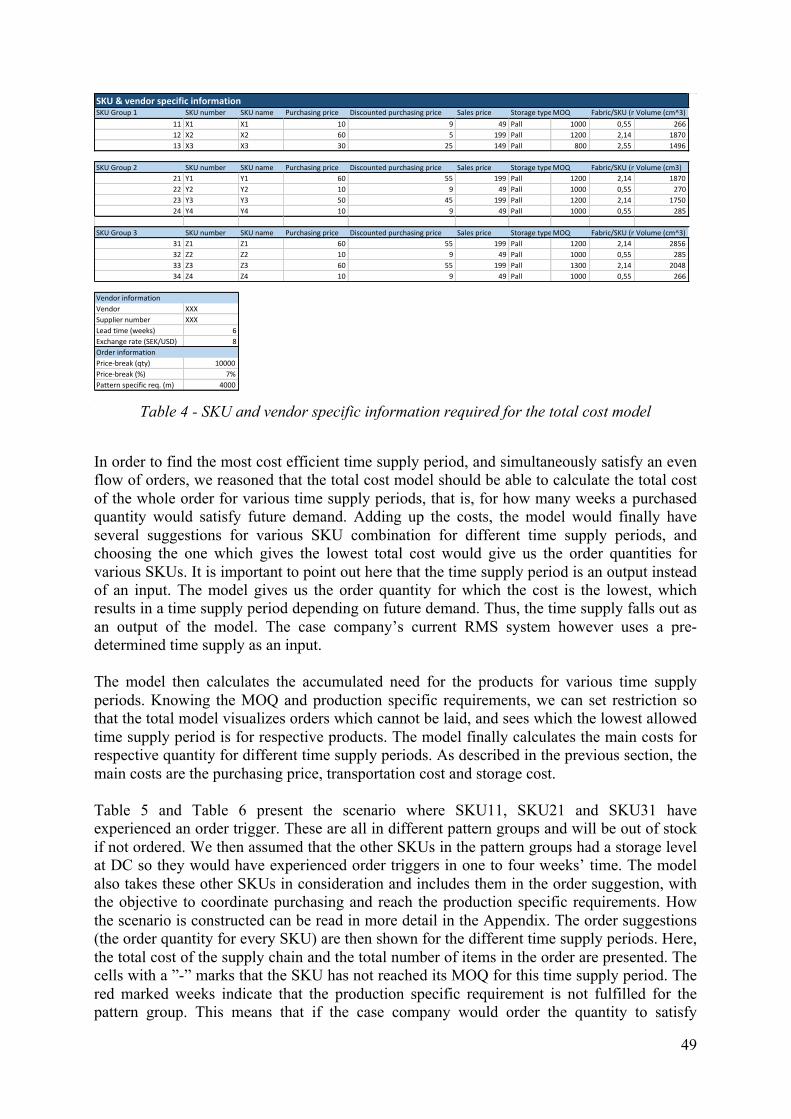
49
Table 4 - SKU and vendor specific information required for the total cost model
In order to find the most cost efficient time supply period, and simultaneously satisfy an even flow of orders, we reasoned that the total cost model should be able to calculate the total cost of the whole order for various time supply periods, that is, for how many weeks a purchased quantity would satisfy future demand. Adding up the costs, the model would finally have several suggestions for various SKU combination for different time supply periods, and choosing the one which gives the lowest total cost would give us the order quantities for various SKUs. It is important to point out here that the time supply period is an output instead of an input. The model gives us the order quantity for which the cost is the lowest, which results in a time supply period depending on future demand. Thus, the time supply falls out as an output of the model. The case company’s current RMS system however uses a pre-determined time supply as an input. The model then calculates the accumulated need for the products for various time supply periods. Knowing the MOQ and production specific requirements, we can set restriction so that the total model visualizes orders which cannot be laid, and sees which the lowest allowed time supply period is for respective products. The model finally calculates the main costs for respective quantity for different time supply periods. As described in the previous section, the main costs are the purchasing price, transportation cost and storage cost. Table 5 and Table 6 present the scenario where SKU11, SKU21 and SKU31 have experienced an order trigger. These are all in different pattern groups and will be out of stock if not ordered. We then assumed that the other SKUs in the pattern groups had a storage level at DC so they would have experienced order triggers in one to four weeks’ time. The model also takes these other SKUs in consideration and includes them in the order suggestion, with the objective to coordinate purchasing and reach the production specific requirements. How the scenario is constructed can be read in more detail in the Appendix. The order suggestions (the order quantity for every SKU) are then shown for the different time supply periods. Here, the total cost of the supply chain and the total number of items in the order are presented. The cells with a ”-” marks that the SKU has not reached its MOQ for this time supply period. The red marked weeks indicate that the production specific requirement is not fulfilled for the pattern group. This means that if the case company would order the quantity to satisfy
SKU&vendorspecificinformationSKUGroup1 SKUnumber SKUname Purchasingprice Discountedpurchasingprice Salesprice StoragetypeMOQ Fabric/SKU(m)Volume(cm^3)
11 X1 X1 10 9 49 Pall 1000 0,55 26612 X2 X2 60 5 199 Pall 1200 2,14 187013 X3 X3 30 25 149 Pall 800 2,55 1496
SKUGroup2 SKUnumber SKUname Purchasingprice Discountedpurchasingprice Salesprice StoragetypeMOQ Fabric/SKU(m)Volume(cm3)21 Y1 Y1 60 55 199 Pall 1200 2,14 187022 Y2 Y2 10 9 49 Pall 1000 0,55 27023 Y3 Y3 50 45 199 Pall 1200 2,14 175024 Y4 Y4 10 9 49 Pall 1000 0,55 285
SKUGroup3 SKUnumber SKUname Purchasingprice Discountedpurchasingprice Salesprice StoragetypeMOQ Fabric/SKU(m)Volume(cm^3)31 Z1 Z1 60 55 199 Pall 1200 2,14 285632 Z2 Z2 10 9 49 Pall 1000 0,55 28533 Z3 Z3 60 55 199 Pall 1300 2,14 204834 Z4 Z4 10 9 49 Pall 1000 0,55 266
VendorinformationVendor XXXSuppliernumber XXXLeadtime(weeks) 6Exchangerate(SEK/USD) 8Orderinformation Price-break(qty) 10000Price-break(%) 7%Patternspecificreq.(m) 4000
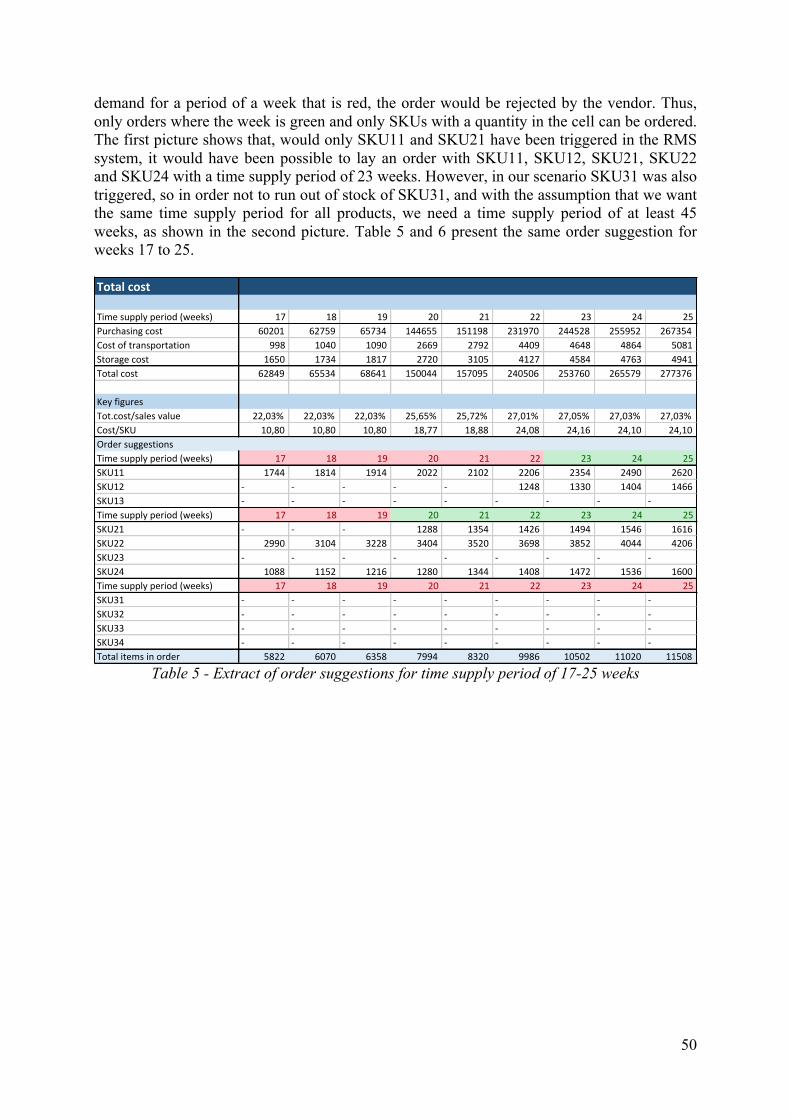
50
demand for a period of a week that is red, the order would be rejected by the vendor. Thus, only orders where the week is green and only SKUs with a quantity in the cell can be ordered. The first picture shows that, would only SKU11 and SKU21 have been triggered in the RMS system, it would have been possible to lay an order with SKU11, SKU12, SKU21, SKU22 and SKU24 with a time supply period of 23 weeks. However, in our scenario SKU31 was also triggered, so in order not to run out of stock of SKU31, and with the assumption that we want the same time supply period for all products, we need a time supply period of at least 45 weeks, as shown in the second picture. Table 5 and 6 present the same order suggestion for weeks 17 to 25.
Table 5 - Extract of order suggestions for time supply period of 17-25 weeks
Totalcost
Timesupplyperiod(weeks) 17 18 19 20 21 22 23 24 25Purchasingcost 60201 62759 65734 144655 151198 231970 244528 255952 267354Costoftransportation 998 1040 1090 2669 2792 4409 4648 4864 5081Storagecost 1650 1734 1817 2720 3105 4127 4584 4763 4941Totalcost 62849 65534 68641 150044 157095 240506 253760 265579 277376
KeyfiguresTot.cost/salesvalue 22,03% 22,03% 22,03% 25,65% 25,72% 27,01% 27,05% 27,03% 27,03%Cost/SKU 10,80 10,80 10,80 18,77 18,88 24,08 24,16 24,10 24,10OrdersuggestionsTimesupplyperiod(weeks) 17 18 19 20 21 22 23 24 25SKU11 1744 1814 1914 2022 2102 2206 2354 2490 2620SKU12 - - - - - 1248 1330 1404 1466SKU13 - - - - - - - - -Timesupplyperiod(weeks) 17 18 19 20 21 22 23 24 25SKU21 - - - 1288 1354 1426 1494 1546 1616SKU22 2990 3104 3228 3404 3520 3698 3852 4044 4206SKU23 - - - - - - - - -SKU24 1088 1152 1216 1280 1344 1408 1472 1536 1600Timesupplyperiod(weeks) 17 18 19 20 21 22 23 24 25SKU31 - - - - - - - - -SKU32 - - - - - - - - -SKU33 - - - - - - - - -SKU34 - - - - - - - - -Totalitemsinorder 5822 6070 6358 7994 8320 9986 10502 11020 11508

51
Table 6 - An extract of order suggestion, time supply period of 39-57 weeks
In this section the approach to calculate purchasing cost, transportation cost and storage cost is presented. For the purchasing price, we wanted the model to be able to consider a purchasing price with the price breaks at certain order quantities, which has hopefully been negotiated by the vendor. This information is vital to have already in the order phase. Our case study revealed that these price breaks offers often exist, but the supply planners that lay the orders are seldom aware of them or know the exact purchasing cost for respective quantities. This is information that is needed for every SKU in order to gain the total cost perspective. When it comes to the transportation cost, the model is able to make a break-even analysis to determine which way of transportation is cheapest for the various quantities. Since our case products often go by LCL, we limited the model to only consider LCL and the BCN 20ft variant of container. The break-even analysis was made through calculating the cost for each way of transportation for various quantities, and then let the model present which way of transportation that results in the lowest cost. The size of the SKU and the volume of the containers become vital in order to calculate how many SKUs that can fit into respective container, and which alternative becomes relevant for various order quantities. The model assumes that the lowest calculated way of transportation is available at the vendor. The storage cost is calculated based on the costs at DC presented in 4.3.3 DC costs. For each order quantity it is decided how many pallets that will be taken up by the order volume, and how many weeks the order lay at DC, using the average quantity stored. The constant cost for the storage shelf and order handling cost at arrival is added. A throughout presentation of all these calculations are presented in Appendix. We have thus shown how to build a model that calculates the lowest total cost for various quantities with various time supply periods.
Totalcost
Timesupplyperiod(weeks) 39 40 41 42 43 44 45 46 47Purchasingcost 437094 502538 512507 537675 550554 570750 736651 754779 771587Costoftransportation 8411 8411 8411 8411 8411 8411 8411 8411 8411Storagecost 10396 12180 12970 14856 15189 15522 21504 23084 24136Totalcost 455901 523129 533888 560941 574153 594683 766566 786274 804134
KeyfiguresTot.cost/salesvalue 26,18% 26,16% 26,20% 26,19% 26,19% 26,21% 27,16% 27,20% 27,23%Cost/SKU 25,10 26,76 26,90 26,36 26,46 26,66 30,32 30,45 30,54OrdersuggestionsTimesupplyperiod(weeks) 39 40 41 42 43 44 45 46 47SKU11 4314 4362 4436 4566 4686 4892 5052 5212 5368SKU12 2568 2582 2632 2728 2800 2932 2998 3088 3160SKU13 940 966 986 998 1038 1058 1082 1124 1140Timesupplyperiod(weeks) 39 40 41 42 43 44 45 46 47SKU21 2484 2518 2582 2676 2744 2878 2966 3040 3126SKU22 5358 5358 5358 5358 5358 5358 5358 5358 5358SKU23 - 1200 1230 1260 1290 1320 1350 1380 1410SKU24 2496 2560 2624 2688 2752 2816 2880 2944 3008Timesupplyperiod(weeks) 39 40 41 42 43 44 45 46 47SKU31 - - - - - - 1215 1242 1269SKU32 - - - - - - - - -SKU33 - - - - - - 1305 1334 1363SKU34 - - - 1008 1032 1056 1080 1104 1128Totalitemsinorder 18160 19546 19848 21282 21700 22310 25286 25826 26330
52
4.5 Identified aspects to incorporate in the purchasing strategy (RQ2) The following sub-chapter is dedicated to present the results of research question 2, which are the identified aspects that have been recognized as important to incorporate into the purchasing strategy in order to enable management of the total cost of purchasing private label products from Indian suppliers. This analysis will be based on the empirical results from the case study and be discussed and compared to the theory presented in the literature review, to explain in what way the identified aspects are important to incorporate in the purchasing strategy. The empirical results were identified by analyzing the semi-structured interviews performed with different persons at the case company, internal documents, and observations. Our findings conclude that the three main aspects that the purchasing strategy should take in consideration to facilitate a total cost perspective are flexible time supply periods, internal and external information sharing, and coordination of transports. These three aspects are discussed in terms of how they can mitigate the identified challenges that prohibit a total cost perspective, and how they are connected to previous research within purchasing strategy.
4.5.1 Aspect 1: Flexible time supply periods The set time supply period of two months results in four challenges that could be mitigated if the time supply period would be flexible. The challenges prohibit the case company to be able to take the total cost in the supply chain in consideration in the purchasing process. The first challenge is connected to order-suggestions that do not reach MOQ, and is apparent in the purchasing of the leather bags. The second challenge is connected to the ordering of combined SKUs and production specific challenges, which is apparent in the purchasing of the bed linen. The third challenge is the inability to increase the order quantity to reach more cost efficient time supply periods. Finally, the fourth challenge is connected to the uneven flow of order suggestions that the set time supply period implies. All four of these challenges impede the case company to manage the total cost of the placed order and also drive cost in the total cost perspective. These challenges would be facilitated by being considered in the purchasing strategy by letting the supply periods be flexible. Below are the four challenges presented and explained in more detail.
Not reaching MOQ requirements The first challenge occurs when the product being ordered has a highly volatile demand over different supply periods, which is the situation for the leather bag. This results in highly volatile suggestions in order quantity from RMS. In some cases, the time supply period has a high forecasted demand presented by RDF, reaching MOQ without problems. However, orders suggestions that are covering a supply period with low forecasted demand are not reaching MOQ and cannot be placed as an order (Supply Planner Fashion, 2016). These orders are handled in two ways, either they are placed with an increase in purchasing cost because they are under the MOQ, which has been the situation for the leather bag case product historically (Internal report, 2016). Alternatively, they are disregarded and not ordered, witch could lead to stock outs in the stores if they are not ordered within the safety stock period. Approximately 40-50% of all order suggestions from RMS is neglected because the order does not reach MOQ (Supply Planner Fashion, 2016). This can be described as an ad-hoc solution and is handled in contrast to the current purchasing strategy. This indicates that the leather bag can benefit from a flexible time supply period if the purchasing strategy would allow it, and a supply planner could place an order for the leather bag even in a period of low demand, instead of waiting to lay the order and thus eliminate the risk of empty shelves and lost sales.
53
Production specific challenges and ordering of combined SKUs For joint replenishment orders, where products need to be jointly purchased together with other SKUs in the same product family to reach production specific requirements, the aspect of flexible supply periods is strongly connected to the managing of total cost in the supply chain. To be able to gain an advantageous purchasing price of the products, it is important to be able to gather all the SKUs that are in the same pattern group within the bed linen product family. This is to reach the joint production requirement on pattern-level that requires 4,000 meters of fabric. If this meter requirement is not consolidated in the order within the pattern group, and only one SKU in the pattern will be ordered in the required 4,000 meters, it would mean to supply that SKU for years of forecasted demand, which is not advantageous in a total cost perspective, and also in disagreement with the current purchasing strategy. Thus, it is necessary to gather the SKUs in the pattern group, and order them together. This is not possible with the current purchasing strategy where RMS only presents order suggestions for the products that have reached the order point (Supply Planner Home Textile, 2016). This creates a situation where one SKU gets an order suggestion and is ordered one week, only to be followed by an order suggestion for another SKU in the same pattern group the next week. If the two SKUs would have been ordered together in the first week one would have been better off in a total cost perspective, due to lower levels of storage costs because they could have shared the production requirements.
Cost efficient time supply periods The third challenge is the inability to increase the order quantity to reach more cost efficient time supply periods. This is linked to the joint replenishment challenge presented earlier, where a longer supply period would include more SKUs in the same pattern and reach reduced costs by splitting the product requirements on several SKUs. However, another aspect of the cost efficient time supply periods have to do with the opportunity to reach advantages due to economics of scale like price reduction due to quantity discounts for the order. For the bed linen, the discount on purchasing price is connected to the quantity on pattern specific level. If the order on pattern-level is 10,000 units or higher, the purchasing price is reduced with 7% (Merchendiser AFE, 2016). This opportunity of cost reduction is only accessible in the current purchasing strategy if the demand during the two-month supply period is sufficient to reach the price break quantity. Here it would be beneficial if the strategy would allow flexible time supply periods to extend an order that lies close to the price-break quantity to actually extend the supply period so the price break quantity is met and the 7% price reduction obtained. In a total cost perspective, the extra storage cost for extending the time supply period must be compared with the reduction in price.
Even Flow The fourth challenge is connected to the uneven flow of order suggestions that the set time supply period implies. This situation originates for several reasons, one is that if the RDF prognosis that RMS bases its order suggestions on is incorrect, the set time supply period will result in infrequent order suggestions from RMS. Moreover, as explained earlier for the bed linen case product, the even flow in received order suggestions within a pattern group is important. This because of the production requirement on pattern level to be able to place the order. This coordination would be facilitated if the SKUs within the pattern family gets order suggestions at the same time. This even flow of orders could be obtained if the supply periods for the SKUs within the pattern group is set to the same for one order, taking both individual MOQ and production requirements in consideration. The consequence would be that all the SKUs within the order meet their production requirements and is ordered in a quantity that corresponds to one supply period for the whole pattern group. Assuming the prognosis is accurate, all the SKUs within the pattern group will be suggested for reorder by the system at
54
the same time. This would greatly improve the total cost perspective through reducing the complexity and workload in the replenishment orders for the bed linen case products. And also facilitate other supply chain elements such as transportation. Aspect three will cover this in more detail.
Summary and connection to literature - flexible time supply periods All the four previous described challenges that hinder the case company from managing the total cost of a purchase could be mitigated if the purchasing strategy allowed flexible time supply periods. A flexible time supply period enables the case company to take the production cost of their vendors in consideration when they are placing their order. This is an aspect of purchasing that has been recognized as problematic and has previously been researched in supply chain management literature. It has been shown that the order placed can have direct impact on the manufacturers production scheduling and material purchase, which in turn will affect the price (Boute, Disney, Lambrecht, & Van Houdt, 2006) (Agrawal, Smith, & Tsay, 2002). The actual purchasing price of a product plays a main role in the total cost of procuring the product. Here the purchasing strategy on how to purchase and replenish the products plays a major role in determining what price will be set for the order (van Weele, 2002). Thus, the aspect of flexible supply time periods was concluded to be important to incorporate in the purchasing strategy to enable the striving of improved purchasing prices, which is achieved by meeting quantity and production requirements in the order. This connects to the main principle of an integrated, cross functional approach to the purchasing strategy where there is a need for the purchasing decision to balance the total cost of ownership (van Weele, 2002). Furthermore, the pillars that build the proactive purchasing and supply chain management strategies developed by Monczka et.al (2005) describe that the supply chain professionals should be able to manage critical relationships and engage in fact-based decision making. (Monczka, Trent, & Handfield, 2005). The managing of critical relationships is enabled with the flexible supply periods, which otherwise is not possible.
4.5.2 Aspect 2: Information sharing It became apparent in the value stream mapping of the supply chain and also from the semi-structured interviews that many of the challenges presented in the previous sub-chapter can be connected to lack of information in the purchasing process. The lacking information is present in an internal and external perspective of the supply chain. Both perspectives prohibits the case company to manage the total cost in the supply chain when purchasing products. The internal perspective on information sharing relates to the information needed for a total cost perspective that different actors within the case company posses, but is not shared to the purchasers and thus not available in the purchasing process. The external perspective of information sharing relates to the information the case company possess and witch the producers would benefit from, but is not shared in the supply chain. The internal and external perspective of information sharing is described in more detail below.
Internal information sharing The initial order quantity, which is laid the first time a product is purchased and introduced in the assortment, is decided by the purchasing department. They are the ones holding the contact with the suppliers who produce the private label products. The purchasers also negotiate all initial contracts and terms, including prices, with the producers. If the product is a seasonal product, it will normally only be ordered once and not again the following season. However, products that are sold season after season are called staples, and require re-purchasing over time (Purchaser Home Textile, 2016 ). Supply planners are responsible for
55
the re-purchasing and often require more information and a deeper analysis before placing an order to the supplier. This information is not available in the re-purchase suggestion coming from RMS. The information needed to make an informed decision is supplier and product specific, and includes information on MOQ, production requirements such as combined order placement and purchasing price discounts. The MOQ is stated in RMS, but the other information is not known for the supply planners (Supply Planner Fashion, 2016) (Supply Planner Home Textile, 2016) Taking the bed linen as an example, it is of uttermost importance that all the ordering requirements on pattern-group level is known to the supply planner placing the orders, and witch SKUs that can be divided in the same pattern groups. However, this was not the case when the value stream mapping was made, and the information about the production requirements was collected partly from the supply planners and partly from AFE office when presented in this study. Thus, the total information needed to place to orders for the bed linen case products was not completely clear for the supply planners working with it. The same situation was present when it came to the price discount quantity of the orders. This lack of information is prohibiting the total cost perspective in the purchasing process, because the orders are placed when lacking vital information. It also drives cost in itself when the process of replenishing these items are complex and requires a large amount of time. When the supply planners do not have the information, they contact purchasing for support, who is then involved in the process once more. An order where this information is not clearly stated, which is the case with the bed linen case product, takes more than twice the time than a regular replenishment order where the information is present(Purchaser Home Textile, 2016 ). The supporting activity is not a part of the business process and could be seen as waste since it takes extra time and extra working effort for both the supply planners and purchasers.
Summary and connection to literature - internal information sharing This particular issue of the need of information is highly connected to the need of a total cost perspective. Before a repurchasing order is placed, it would be beneficial if the systems would be able to supply the right information to support the decision. This information can be accessed through the different business systems, but there is no codified process of accessing this information. Conclusively, a purchasing strategy that facilitate production requirements and suggestions on product specific synergy groups would enable a total cost perspective in the purchasing process. This aspect is connected to the integrating and cross functional approach to base the purchasing strategy on where the supply planner must have the information needed to be able to balance the cost from a total cost perspective. Also, the aspect connects to the principal of a business orientation, which says that the purchasing strategy should support the rest of the company’s goals and objectives. Here, the author includes the company’s IT-systems (van Weele, 2002). For the case company, this means that the purchasing strategy must include internal information sharing of previously mentioned information between the different IT-systems and actors within the supply chain. Furthermore, the pillars that builds the Proactive purchasing and supply chain management strategies describes that the supply chain professionals should have the ability to view the supply chain holistically, and to be able to manage critical relationships and engage in fact-based decision making (Monczka, Trent, & Handfield, 2005). To be able to do this it requires the supply planner to have the necessary information when placing the order.
External information sharing The mapping of the supply chain and the semi-structured interviews have led to the insight that the sourcing strategy must include a closer collaboration with vendors in India and
56
include a clear objective to help them to reduce their costs, since they then can offer the case company a better price for the products. One strategic change to achieve this is information and prognosis sharing with the producers. After several interviews, it was revealed that information and prognosis sharing would have significant impact on the costs in the supply chain. (General Manager AFE, 2016) (Senior Merchendiser, 2016) (Merchendiser AFE, 2016). Information sharing would have cost reducing effects in several areas; reduced purchasing price and in the facilitation in the ordering of products. An interview with two merchandisers from the AFE office revealed that information and prognosis sharing with vendors would help to reduce the purchasing costs of the procured products. This is because of two reasons. Firstly, the information gives the AFE office a better position when they negotiate on price, and secondly, it allows the vendor to plan their production, keep raw material in stock and offer a better price (Senior Merchendiser, 2016). The AFE office is very keen to always apply a total cost perspective and take efforts to reduce purchasing price. One way to do this is to share the sales prognosis with the producers. The key information they need is the total quantity that the case company will order for half a year. “This is an important component of the total cost structure we try to set up […] At this moment it is very important that we are part of the supplies, part of the production chain, and it is very important that they know all the important information that we are planning around, whether we are focusing on on-time-delivery, quality, price-improvements. The more they know the better the whole production chain can be secured” (Senior Merchendiser, 2016). Based on information about the product, that is if its a staple product or a seasonal product that will only be purchased once, and which quantity the case company will order on a 6-month horizon, they can prepare a stage for the supplier and prepare a better negotiation. “The more informed the harder the negotiations can be. The more we know the better we can negotiate […]This strategy, to share 6-month prognosis with vendors, could reduce the costs with 3% on repeated [orders]” (Senior Merchendiser, 2016). With this information on hand they can also have an internal discussion and do a better choice on which supplier to choose for the production. With a 6-month prognosis at hand it is also easier for the vendor to give price-breaks (General Manager AFE, 2016). Furthermore, they sometimes come with suggestions on changes in style that would reduce the cost. However, this discussion must always be taken with the head office. They know what they want in the end, and AFE can only provide them with the available options. This prognosis that AFE shares with the producer is provided by the supply planners at the head office in Stockholm. AFE assumes that these 6-months quantities are a combination of a suggestion from RDF and previous experience among supply planners. However, the AFE merchandisers states that “It is very important that the information is as accurate as possible” (Senior Merchendiser, 2016). It can thus be concluded that it is vital for the supply planners in Stockholm to continuously work with securing a good prognosis, and to forward this information to the vendors. Since a different strategy is applied in the negotiations depending on the type of the product (if it is a staple or seasonal) the fact that staple products are often previous seasonal products, inhibits the case company’s negotiation space and affects it negatively. For a seasonal product that will only be ordered once, the AFE office do not have the same position in the negotiation since it is a one-time purchase. However, if they know that they will order the

57
product several times in the future, and can provide a prognosis of the quantity they will order during the year, they have a better chance to push prices. “This change from seasonal to staple product is not good for us. If we know it before we can negotiate better. When there is a seasonal product they only negotiate once, and ask for on product one time. If we know that we will order it five times, that changes the terms of the negotiations completely, because then we can negotiate on production 5 times a year. It gives us better position in the negotiations” (Senior Merchendiser, 2016). Therefore, knowing as soon as possible weather a product should be sold as a seasonal or a staple helps the AFE office in their negotiations. From the vendors´ point of view however, it is only beneficial that the customer comes back and wants to order more of a product already purchased once. It seldom requires a change in supplier, but instead allows the vendor to improve production efficiency. Knowing the prognosis in advance also helps the AFE office to ask for a reduced purchasing price. In general, most producers can offer better prices if they know the approximated quantity the customer will buy half a year in advance. This allows them to plan their production, and also secure the required raw material for production. Since the supplier often gets a reduced price from their raw material suppliers if they buy bigger quantities, they can reduce their raw material costs, which in turn enables them to offer a lower purchasing price for the case company. Setting a fixed price in advance also eliminates external fluctuations in raw material prices. Even though cotton prices would go up during the year, the producer will stick to the price that was negotiated from the beginning, and not change the price until the next negotiation period (General Manager AFE, 2016). At a first glance, the strategy of sharing ordering prognosis can however appear risky because of the uncertainty in the prognosis shared with the vendor. It can appear that the case company commits to buy the quantity shared through the prognosis with the vendor, even though the demand half a year later does not reach the estimated quantity. This is however seldom a problem. The AFE office clarified that it is only the raw material that the vendor secures, and does not start producing the actual items until an actual order is laid. They must however receive the actual order the latest a certain time (a specific lead time including production and shipping time) before the products have their selling start in Stockholm. This could also facilitate the case company’s problem concerning high MOQ-levels. If the producers have the order prognosis for 6-months, it could in some cases lower the negotiated MOQ that the supply planners must take in to account when placing re-orders of staple products (General Manager AFE, 2016).
Summary and connection to literature - external information sharing In summary, to make sure that the case company always has the best platform for negotiation, and to help the vendor to lower their production costs and secure their raw material, which benefits the case company, and sharing the estimated order quantity for a 6-month period would help reduce purchasing costs. To enable this, the purchasing strategy must include requirements on information sharing externally to facilitate a total cost perspective in the purchasing process and also cost reducing opportunities. The topic of information sharing and the growing importance of collaboration and decision integrating in the supply chain is a well researched topic (Momme, Moeller, & Hvolby, 2000). This is in compliance with studies that show that sharing information on customer forecast and planned order information are valuable for products non-stationary demand, which it the current situation for the products at the case company (Jonsson & Mattsson, 2013). Moreover, Gavirneni et.al (1999) showed that the more information a retail share the more costs can be saved (Gavirneni, Kapuscinski, & Tayur, 1999). Furthermore, the cost saving opportunities that the AFE office are reporting on are similar to what the early order commitment theories show, where the manufacturer better
58
can procure raw material and schedule production. (Zhao, Xie, & Wei, 2007) (Iyer & Bergen, 1997). The result from our interviews indicate that the Indian producers would act according to early order commitment theories, only if the case company could share forecasts of what they will order, without having to actually commit to the order. A situation that would be very advantageous to incorporate in the purchasing strategy and be in accordance with the bottom-line orientation of the purchasing strategy (van Weele, 2002). This because the purchasing process should always strive to improve the bottom-line of the company, and if information and prognosis sharing is a part of that strive it should be incorporated in the purchasing strategy.
4.5.3 Aspect 3: Coordination of transportation Cost efficiency in transportation of finished products from India to Sweden is an area where the case company lack insight from a total cost perspective when it comes to the purchasing of private label products. The case company do have a clear image of what everything costs when they transport goods home from India, however, as the Forwarding manager put it; “When we place the order and make the cost estimates on product level, we do not know how it will be shipped [under what kind of shipping condition]” (Forwarding Manager, 2016) This is due to the fact that the orders made from the supply planners are not coordinated and weather an order will be shipped with byers consolidation, factory load or lose container load is decided continuously by AFE and by the contracted freight company. (Forwarding Manager, 2016) In practice, this means that depending of which orders that are delivered to the harbor before a shipping, you either fill one/several consolidated containers, or you transport some of the products in lose load containers, which is more expensive. Here, an opportunity of efficiency arises where the case company could work more extensively in their supply chain with the coordination of orders and to try and fill full containers. The complex situation concerning the transportation is derived from the fact that the case company have a purchasing strategy to keep low stock, which leads to focus on the minimizing of order quantities and keeping inventory stock levels low, and not to to adjust the order quantities to make the transportation of products more efficient. There are mainly two approaches the case company can make their transportation more efficient. First is to make a greater effort in coordinating the existing orders in time, trying to congregate larger and better suited volumes of products in their shipping rounds. The current order system can take information on the weight and volume of the order, but it is nothing that is used currently (Forwarding Manager, 2016). This first approach described is connected to the challenge of even flow in the purchasing of private label products. When the flow of products is more even and predictable, it will be easier to coordinate transports in consolidated containers. The second approach is to change and alternate the order quantities from the start, to make them more suited for the transportation, and only order in predetermined volumes suited for the containers. Consequently, the challenge of coordinating transport is closely connected to the challenge of being able to choose the most cost efficient times supply period. Here, one reason for extending the supply period to contain a higher quantity could be that the volume of the order then increases and reaches a breaking point where it is cost efficient to ship the order in a 20ft container. So that the coordination is easier from the start. The total cost model presented in RQ1 can facilitate the cost estimates when placing the order, because it presents the volume of the total order and in which way it is most cost efficient to be shipped (FCL, BCN, LCL). If the model is extended to treat other order suggestions also, the supply planner could actually fill containers and know exactly it the order will be shipped to Sweden.
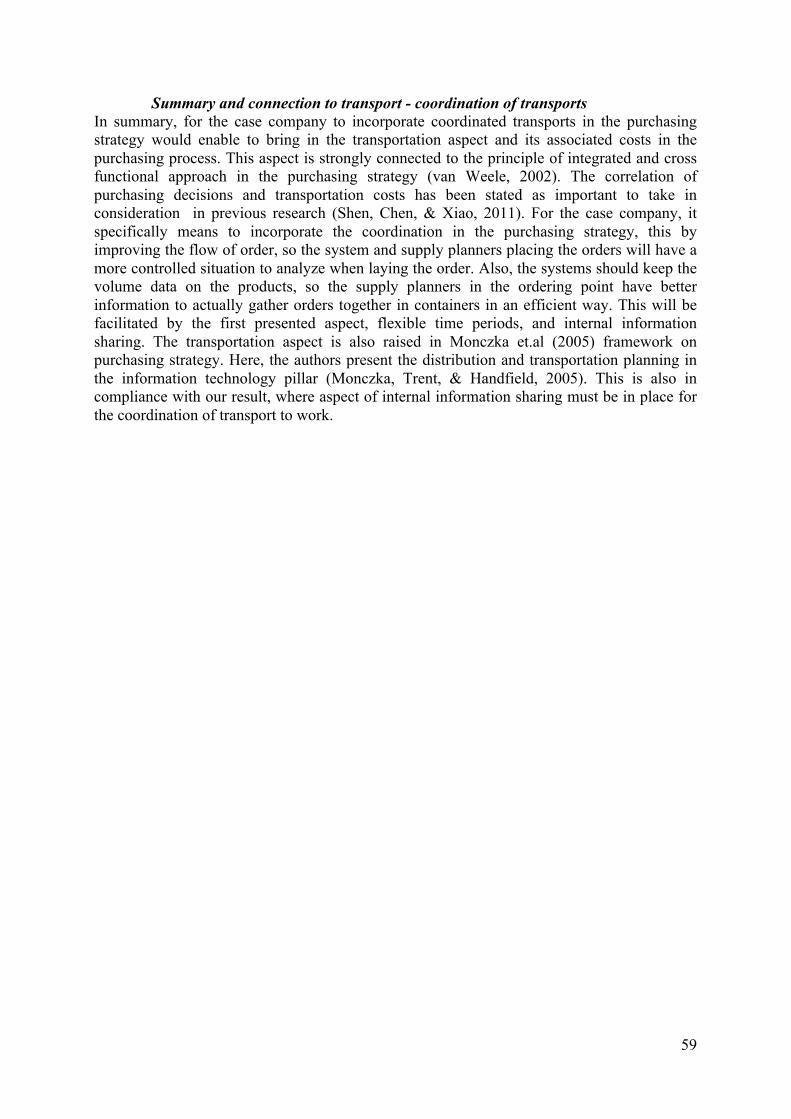
59
Summary and connection to transport - coordination of transports In summary, for the case company to incorporate coordinated transports in the purchasing strategy would enable to bring in the transportation aspect and its associated costs in the purchasing process. This aspect is strongly connected to the principle of integrated and cross functional approach in the purchasing strategy (van Weele, 2002). The correlation of purchasing decisions and transportation costs has been stated as important to take in consideration in previous research (Shen, Chen, & Xiao, 2011). For the case company, it specifically means to incorporate the coordination in the purchasing strategy, this by improving the flow of order, so the system and supply planners placing the orders will have a more controlled situation to analyze when laying the order. Also, the systems should keep the volume data on the products, so the supply planners in the ordering point have better information to actually gather orders together in containers in an efficient way. This will be facilitated by the first presented aspect, flexible time periods, and internal information sharing. The transportation aspect is also raised in Monczka et.al (2005) framework on purchasing strategy. Here, the authors present the distribution and transportation planning in the information technology pillar (Monczka, Trent, & Handfield, 2005). This is also in compliance with our result, where aspect of internal information sharing must be in place for the coordination of transport to work.
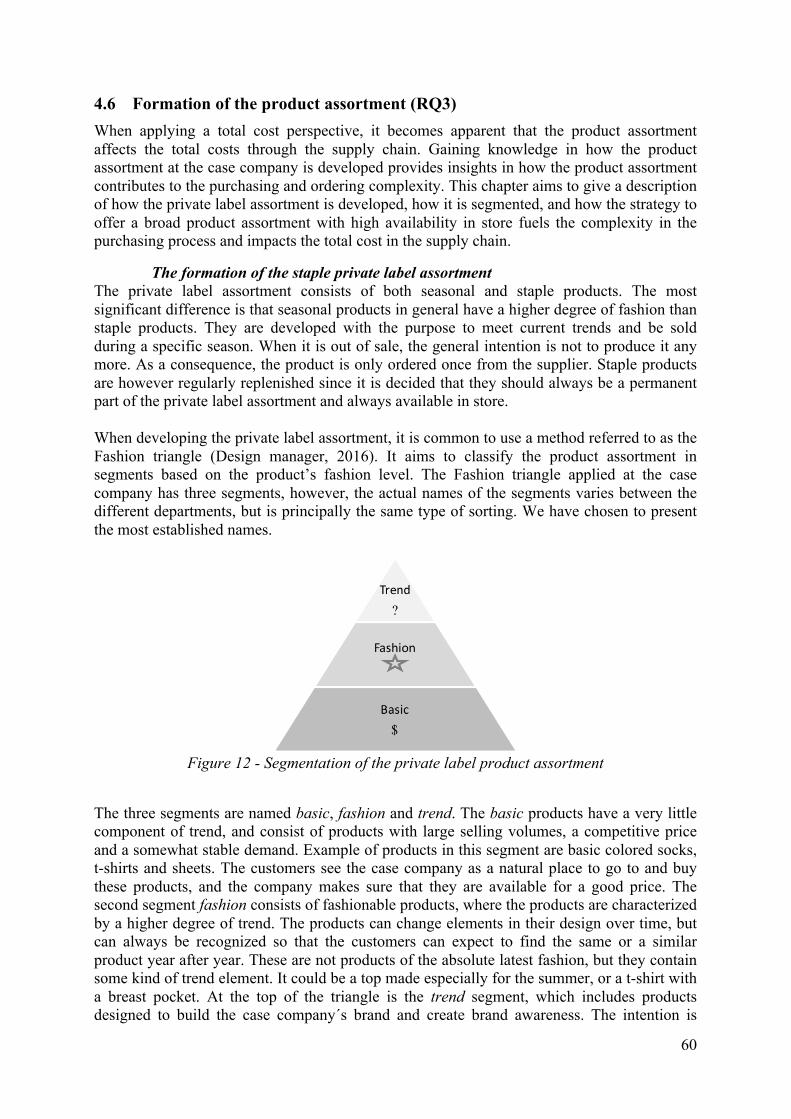
60
4.6 Formation of the product assortment (RQ3) When applying a total cost perspective, it becomes apparent that the product assortment affects the total costs through the supply chain. Gaining knowledge in how the product assortment at the case company is developed provides insights in how the product assortment contributes to the purchasing and ordering complexity. This chapter aims to give a description of how the private label assortment is developed, how it is segmented, and how the strategy to offer a broad product assortment with high availability in store fuels the complexity in the purchasing process and impacts the total cost in the supply chain.
The formation of the staple private label assortment The private label assortment consists of both seasonal and staple products. The most significant difference is that seasonal products in general have a higher degree of fashion than staple products. They are developed with the purpose to meet current trends and be sold during a specific season. When it is out of sale, the general intention is not to produce it any more. As a consequence, the product is only ordered once from the supplier. Staple products are however regularly replenished since it is decided that they should always be a permanent part of the private label assortment and always available in store. When developing the private label assortment, it is common to use a method referred to as the Fashion triangle (Design manager, 2016). It aims to classify the product assortment in segments based on the product’s fashion level. The Fashion triangle applied at the case company has three segments, however, the actual names of the segments varies between the different departments, but is principally the same type of sorting. We have chosen to present the most established names.
Figure 12 - Segmentation of the private label product assortment
The three segments are named basic, fashion and trend. The basic products have a very little component of trend, and consist of products with large selling volumes, a competitive price and a somewhat stable demand. Example of products in this segment are basic colored socks, t-shirts and sheets. The customers see the case company as a natural place to go to and buy these products, and the company makes sure that they are available for a good price. The second segment fashion consists of fashionable products, where the products are characterized by a higher degree of trend. The products can change elements in their design over time, but can always be recognized so that the customers can expect to find the same or a similar product year after year. These are not products of the absolute latest fashion, but they contain some kind of trend element. It could be a top made especially for the summer, or a t-shirt with a breast pocket. At the top of the triangle is the trend segment, which includes products designed to build the case company´s brand and create brand awareness. The intention is
61
rarely to drive volume, but to include products with some kind of statement to strategically position the company on the market, or simply to offer customers the latest fashion. Fashionable design and a high quality make the price a little bit higher for these products. To summarize, these three categories vary on price, number of variants, variability over time of the product, availability in store, and quality. Applying this fashion triangle on the private label assortment of the case company, it is implied that (even though it is not clearly stated), that seasonal products are included in the trend and sometimes the fashion segment, and staple products are more often in the fashion or basic segment. If a seasonal product does really well and the case company experience that the trend or fashion product is still popular, or even increasing in popularity, they off course decide to buy the product one more season. The case company decides which seasonal products to include in the staple assortment, by combining the segmentation triangle with the BCG-matrix, which is depicted in the picture below.
Figure 13 - Picture of the BCG-matrix
The BCG-matrix is a tool created by the management firm Boston Consulting Group in the 1970s to help corporations analyze their product assortment. The products are grouped relative to market share and growth rate. Cash cows are products with high market share in a slow-growing industry and often highly valued by the company since they generate a lot of cash. Dogs are products with low market share in a slow growing industry, and thus barely break-even. These should be considered if they should continue to be a part of the product assortment. Question marks, newly developed products which have not yet gained market share but grow at a high rate, often have potential to become a star. Stars are products in a high market growth with high market share. They have a unique selling position however require a lot of funding, and often become a cash cow in the long run (Aline, 2015). Putting these two models together and applying them at the private label assortment explains how the staple assortment is developed in the case company. The staple assortment evolves from the transition of popular seasonal trend and fashion products, for which sales are high, to staple products. When developing a seasonal product, it could be position in the question mark segment of the BCG matrix. Even though designers have a lot of knowledge of current trend and customer preferences, it is impossible to know how popular the product will actually be. Since they want to develop a popular product but it is so new, the market growth is large, but the market share is still low. Weekly lists on sales give information on margins on various products, and an evaluation is made how successful it is. If the product becomes
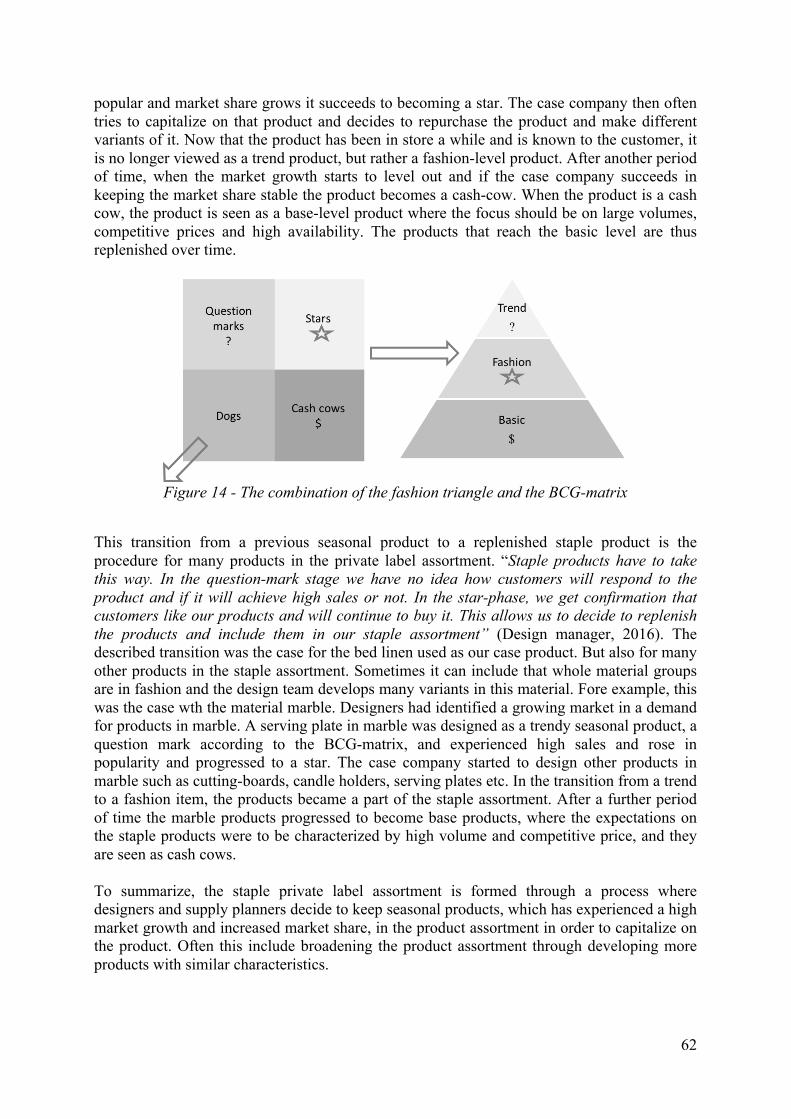
62
popular and market share grows it succeeds to becoming a star. The case company then often tries to capitalize on that product and decides to repurchase the product and make different variants of it. Now that the product has been in store a while and is known to the customer, it is no longer viewed as a trend product, but rather a fashion-level product. After another period of time, when the market growth starts to level out and if the case company succeeds in keeping the market share stable the product becomes a cash-cow. When the product is a cash cow, the product is seen as a base-level product where the focus should be on large volumes, competitive prices and high availability. The products that reach the basic level are thus replenished over time.
Figure 14 - The combination of the fashion triangle and the BCG-matrix
This transition from a previous seasonal product to a replenished staple product is the procedure for many products in the private label assortment. “Staple products have to take this way. In the question-mark stage we have no idea how customers will respond to the product and if it will achieve high sales or not. In the star-phase, we get confirmation that customers like our products and will continue to buy it. This allows us to decide to replenish the products and include them in our staple assortment” (Design manager, 2016). The described transition was the case for the bed linen used as our case product. But also for many other products in the staple assortment. Sometimes it can include that whole material groups are in fashion and the design team develops many variants in this material. Fore example, this was the case wth the material marble. Designers had identified a growing market in a demand for products in marble. A serving plate in marble was designed as a trendy seasonal product, a question mark according to the BCG-matrix, and experienced high sales and rose in popularity and progressed to a star. The case company started to design other products in marble such as cutting-boards, candle holders, serving plates etc. In the transition from a trend to a fashion item, the products became a part of the staple assortment. After a further period of time the marble products progressed to become base products, where the expectations on the staple products were to be characterized by high volume and competitive price, and they are seen as cash cows.
To summarize, the staple private label assortment is formed through a process where designers and supply planners decide to keep seasonal products, which has experienced a high market growth and increased market share, in the product assortment in order to capitalize on the product. Often this include broadening the product assortment through developing more products with similar characteristics.
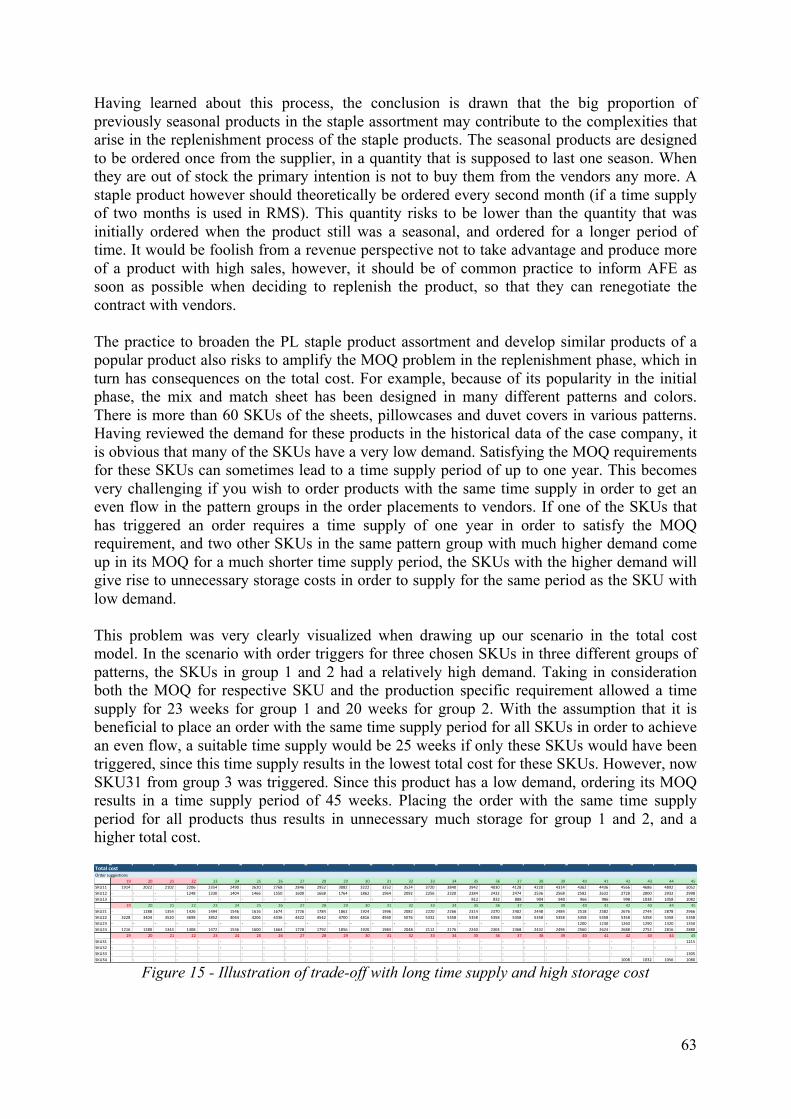
63
Having learned about this process, the conclusion is drawn that the big proportion of previously seasonal products in the staple assortment may contribute to the complexities that arise in the replenishment process of the staple products. The seasonal products are designed to be ordered once from the supplier, in a quantity that is supposed to last one season. When they are out of stock the primary intention is not to buy them from the vendors any more. A staple product however should theoretically be ordered every second month (if a time supply of two months is used in RMS). This quantity risks to be lower than the quantity that was initially ordered when the product still was a seasonal, and ordered for a longer period of time. It would be foolish from a revenue perspective not to take advantage and produce more of a product with high sales, however, it should be of common practice to inform AFE as soon as possible when deciding to replenish the product, so that they can renegotiate the contract with vendors. The practice to broaden the PL staple product assortment and develop similar products of a popular product also risks to amplify the MOQ problem in the replenishment phase, which in turn has consequences on the total cost. For example, because of its popularity in the initial phase, the mix and match sheet has been designed in many different patterns and colors. There is more than 60 SKUs of the sheets, pillowcases and duvet covers in various patterns. Having reviewed the demand for these products in the historical data of the case company, it is obvious that many of the SKUs have a very low demand. Satisfying the MOQ requirements for these SKUs can sometimes lead to a time supply period of up to one year. This becomes very challenging if you wish to order products with the same time supply in order to get an even flow in the pattern groups in the order placements to vendors. If one of the SKUs that has triggered an order requires a time supply of one year in order to satisfy the MOQ requirement, and two other SKUs in the same pattern group with much higher demand come up in its MOQ for a much shorter time supply period, the SKUs with the higher demand will give rise to unnecessary storage costs in order to supply for the same period as the SKU with low demand. This problem was very clearly visualized when drawing up our scenario in the total cost model. In the scenario with order triggers for three chosen SKUs in three different groups of patterns, the SKUs in group 1 and 2 had a relatively high demand. Taking in consideration both the MOQ for respective SKU and the production specific requirement allowed a time supply for 23 weeks for group 1 and 20 weeks for group 2. With the assumption that it is beneficial to place an order with the same time supply period for all SKUs in order to achieve an even flow, a suitable time supply would be 25 weeks if only these SKUs would have been triggered, since this time supply results in the lowest total cost for these SKUs. However, now SKU31 from group 3 was triggered. Since this product has a low demand, ordering its MOQ results in a time supply period of 45 weeks. Placing the order with the same time supply period for all products thus results in unnecessary much storage for group 1 and 2, and a higher total cost.
Figure 15 - Illustration of trade-off with long time supply and high storage cost
TotalcostOrdersuggestions
19 20 21 22 23 24 25 26 27 28 29 30 31 32 33 34 35 36 37 38 39 40 41 42 43 44 45SKU11 1914 2022 2102 2206 2354 2490 2620 2768 2846 2952 3082 3222 3352 3524 3720 3840 3942 4030 4128 4220 4314 4362 4436 4566 4686 4892 5052SKU12 - - - 1248 1330 1404 1466 1550 1600 1668 1764 1862 1964 2092 2256 2320 2384 2432 2474 2536 2568 2582 2632 2728 2800 2932 2998SKU13 - - - - - - - - - - - - - - - - 812 832 888 904 940 966 986 998 1038 1058 1082
19 20 21 22 23 24 25 26 27 28 29 30 31 32 33 34 35 36 37 38 39 40 41 42 43 44 45SKU21 - 1288 1354 1426 1494 1546 1616 1674 1726 1784 1862 1924 1996 2082 2220 2266 2314 2370 2402 2448 2484 2518 2582 2676 2744 2878 2966SKU22 3228 3404 3520 3698 3852 4044 4206 4336 4422 4542 4700 4816 4940 5076 5332 5358 5358 5358 5358 5358 5358 5358 5358 5358 5358 5358 5358SKU23 - - - - - - - - - - - - - - - - - - - - - 1200 1230 1260 1290 1320 1350SKU24 1216 1280 1344 1408 1472 1536 1600 1664 1728 1792 1856 1920 1984 2048 2112 2176 2240 2304 2368 2432 2496 2560 2624 2688 2752 2816 2880
19 20 21 22 23 24 25 26 27 28 29 30 31 32 33 34 35 36 37 38 39 40 41 42 43 44 45SKU31 - - - - - - - - - - - - - - - - - - - - - - - - - - 1215SKU32 - - - - - - - - - - - - - - - - - - - - - - - - - - -SKU33 - - - - - - - - - - - - - - - - - - - - - - - - - - 1305SKU34 - - - - - - - - - - - - - - - - - - - - - - - 1008 1032 1056 1080
64
One can thus question the assumption how beneficial it is to order with the same time supply in order to achieve an even flow in a product assortment with very varying demand. The benefit is that it helps vendors plan their production, and thus increases the chances to get price reductions in the future and a better relationship with the vendor. On the other hand, as illustrated in the example above, it can result in unnecessary much storage of accompanied SKUs in the order. However, it is important to emphasize that this problem is a consequence of combined order triggers of SKUs with very low demand and SKUs with a high demand in relation to their MOQ. Would the low-sale products not be in the product assortment; the problem would not arise in the first place. This problem can have more serious consequences for some products than others. Products with a high degree of fashion which are sensitive to fast changing trends risk to drop in demand. With a time supply period and storage of these products for up to one year, the risk to bound up a lot of products which will never get sold is significantly higher. Thus, when managing orders including products with a low demand in relation to its MOQ, it becomes important to reconsider the assumption we have done in the total cost tool; that all products having triggered an order should be ordered with the same time supply period. This will reduce the even flow of orders to the vendors, however, will reduce the risk to stand with a lot of bound capital and unsold products. On a higher level however, further actions to avoid this situation could be to take some of these low demand items out of the assortment. This could reduce cannibalization of sales from other related products, and thus increase sales for the products left in the assortment, which would allow the order suggestions to more easily come up in MOQs. The previously suggested approach to reduce the product assortment is however contradicting to the case company’s strategy. Being a retail company, one of its most important strengths is to offer a broad variety of products to its customers. However, applying a total cost perspective suggests that it is crucial to eliminate unprofitable products from the product assortment. It should be up to the responsible supply planner and designer who are well aware of the assortment and current trends to sort out the least attractive items, as well as the least profitable once, so that the customer experience is not affected negatively. Furthermore, this also illustrates the typical conflicts of interests between the manufacture and marketing department in a manufacturing company. This reasoning advocates a production focused approach of developing the product assortment. In the case company, these approach was positively received among employees in the Supply and Sourcing Department. However, it was discussed during a meeting that the Design department probably have a more skeptical view since they prioritize customer preferences higher (Sourcing Manager & Supply Chain Manager, 2016).
Evaluation project As described in the section above, the transition of seasonal products to staple products contributes to the problems in the replenishment of private label. One reason is that the MOQ restriction is not considered when broadening the product assortment. In order to fit the new product classification, it was suggested that the case company initiate a evaluation project when commercial high achieving seasonal products are identified, and before the products are transferred to the staple assortment. The project should include the sourcing department, the design department, purchasers, and AFE and have the objective to ensure the total cost perspective and evaluate the profitability. As of today, the company is very purchased driven and design comes in second hand. “Different companies are in different phases in maturity,
65
and the case company is in an early phase where design is added last [when forming the product assortment]” (Design manager, 2016). For products where you would like to gain high volume and advantage of scale, which is the case for the staple assortment, design must come in at an earlier phase. Therefore, a closer collaboration between purchasers and designers is required. In a desirable future scenario, designers together with purchasers would visit the suppliers in order to gain valuable knowledge about the production. With a MOQ and margin requirement as the starting point of the discussion, the supplier can give input on which production techniques can be used, material quality, which colors can be used and so on. This information could then be used by the purchaser and design department to evaluate if the feedback is commercially sustainable, and if the proposed volumes corresponds to what the case company can sell. This information could then be evaluated by the purchaser and designer and together they could decide on a design that meet the requirements of the supplier, as well as meet the customers’ preferences. “This is a suitable process for products you want to benefit from volume” (Design manager, 2016). Applying Kraljic’s purchasing matrix on the case company’s private label assortment gives us insight in an additional aspect causing complexities in the purchasing strategy. Kraljic states that a distinctive purchasing approach is required for products in each of the different categories in the matrix (Kraljic, 1983). Even though Kraljic definition of purchasing approach refers more of a sourcing perspective and supplier selection than this research has done, it is still valuable to reflect on where the private label seasonal and staple products could be placed in the matrix. Comparing the profit impact, the seasonal products can be placed higher on the scale than staple products. They have higher margins, and as described above, are a star product compared to a cash cow. The supplier risk is not that obvious to map out. It could be argued that the supply risk is relatively low for both products since these are not high technological products, and there are many suppliers of clothes and home ware in Asia. Thus, the staple product is mapped among the “non-critical items” with low standardization, high volume, inventory optimization, and economic order quantity inventory levels. The seasonal products should be mapped as a leveraged item, where targeting pricing strategies, and exploration of full purchasing power becomes more important. Since these products fall within different product segments of the Kraljic’s matrix, it could be discussed if the purchasing strategy should be adjusted accordingly. Keeping the same vendor to order a product might be inefficient from a purchasing strategy since the Kraljic matrix suggests that they need different strategies. As (Gelderman & J. van Weele, 2005) found in a study applying Kraljic’s purchasing portfolio on a medical company, the strategy for non-critical items should be to minimize the cost of preparing and placing purchase orders. Options they were using was standardization of procedures, combining orders and use e-procurement. For leverage items the purchasing department should continuously reevaluate the supplier performance and take action whenever a supplier fails to live up to an agreement. From the case company it was revealed that they seldom change supplier when a product shifts from a seasonal to a staple product. The relationship is already established and the investment made in required production techniques, so it would be inefficient to change supplier. Kraljic also state that any purchasing portfolio needs to be updated regularly since shifts in supply and demand patterns can cause products to shift between the categories in the model. Miemczyk et. al (2011) agree that changes in the product characteristics over time could be reasons to see over the sourcing location for the case company. Since the transition from a seasonal to staple product often goes hand in hand with a shift in demand pattern,
66
Kraljic’s suggested differentiation of a purchasing strategy could be an aspect for the case company to consider in the future.
Summary and connection to literature The staple assortment is developed through a process where seasonal products with high sales and a market growth opportunity is transferred to the staple assortment. The process under which the private label staple product assortment is formed has an impact on the challenges the case company faces. Having learned about this process, we draw the conclusion that the big proportion of previously seasonal products in the staple assortment contributes to the complexities that arise in the replenishment process of the staple products. The wish to capitalize on popular products give rise to the development of new products and a broader product assortment risk to complicate the replenishment of products. According to our analysis this risk could then be mitigated if a cross functional evaluation project would be deployed to assess the product and the production requirements when transitioning from seasonal to staple assortment. The objective with this kind of evaluation project is supported in previous research on purchasing strategy. The bottom line orientation principle presented by van Weele´s (2002) implies that the purchasing process should be involved in raising awareness throughout the company about the price/value ratio. This suggests to shed light on questions concerning design, materials, suppliers etc. and whether or not the purchasing can be done more effectively (van Weele, 2002). Furthermore, Monczka et. al (2005) suggest that cross-functional teams should manage supply chain processes (Monczka, Trent, & Handfield, 2005). This is in compliance with our analysis of the need for evaluation projects where both design and purchasing and supply planning would be involved.
67
5 Discussion and Conclusion In this chapter the findings and purpose are discussed, and also the generalizability of the total cost model and the empirical results. We also present and discuss a final thought on the origin to the problems in the purchasing process.
5.1 Reconnection to the study’s purpose In this paper the management of total costs in the case company’s supply chain has been investigated, and how a total cost perspective can be incorporated into the purchasing strategy. This was done by firstly mapping out the supply chain, its actors and its cost drivers, and then identify challenges in the purchasing process that drive these costs and prohibit the case company to manage the total costs in the supply chain. A total cost model was constructed to show dependencies and relationships between costs in the supply chain. The model was also built in order to support the case company in the ordering process by overcoming the identified challenges and taking all the major costs in the supply chain in consideration when ordering the case products. Until now, this has been a complex task to perform. Subsequently, the root causes of the identified challenges were analyzed in order to suggest aspects to incorporate in the purchasing strategy to enable a total cost perspective in the purchasing process. The identified aspects to incorporate in the purchasing strategy are in compliance with what previous research has concluded to be a sound purchasing strategy. Also, an analysis on how the formation of the private label assortment is related to the challenges was made in order to gain a greater understanding to why the challenges that prohibit a total cost perspective is present. The purpose of this research was to propose aspects important to consider in the purchasing strategy for a medium sized retail company with the objective to manage and reduce the total costs in the supply chain. In order to achieve the purpose, one main research question was formulated. This research question was in turn divided in three sub- research questions in order to answer the main one. The case study conducted helped to answer these questions. The results are described in detail in Chapter 4. Here we provide a summary of the main findings and conclusions for respective sub-research question. RQ1: How can a total cost tool visualize the costs in the supply chain and consider the challenges that prohibit a total cost perspective? The empirical findings show that the main costs that appear in the supply chain in the replenishing process of private label products are purchasing, transportation, storage and order handling costs. The cost drivers are the order quantity, currency fluctuations, volume of the order, how the products are transported, the number of SKUs in the order, specific production requirements, the cost of the required storage space, and the order management costs. The total cost tool helps to visualize how these costs affect each other, and how they can be managed. Furthermore, the total cost tool considers the challenges in the purchasing strategy that prohibit the supply planners to efficiently lay orders. The challenges are the inability to reach MOQs, production specific requirements, the difficulty to combine order suggestions on related SKUs, uneven flow of orders to vendors, inefficient time supply periods and inability to coordinate transports. The tool enables the supply planners responsible for the replenishment process to manage the total cost in the supply chain in the ordering phase.
68
RQ2: Which aspects in the purchasing process are important to consider in the purchasing strategy to manage the total costs? The empirical findings from RQ2 can be summarized in three identified aspects that the case company should incorporate in their purchasing strategy to manage total costs of the supply chain. The aspects are in compliance with what previous research on the subject suggests as being a sound purchasing strategy. The three aspects are flexible time supply periods, information sharing, and coordination of transports. To allow flexible time supply periods would enable the case company to increase the quantity ordered from its vendors, by increasing the supply period. The opportunity to increase the quantity enables the supply planners to reach MOQ requirements and in some cases reach quantities that leads to price discounts. Moreover, it would also enable the combination of different SKUs in one order to reach production specific requirements by collecting all necessary SKUs within the product group. The opportunities that results from allowing flexible time supply periods would enable the case company to manage total cost in the supply chain through control of the purchasing price, and to weigh this cost against the increasing storage cost. Hence, the enablement to take total cost of the supply chain into account. The second aspect is the information sharing, and can be divided into an internal and external perspective. Necessary internal information required to make an informed order decision is lacking in the purchasing process. The information concerns MOQ levels, production requirements, price discounts, transportation specific information, and information concerning product groups (e.g. pattern groups). The external perspective of information sharing is connected to prognosis sharing where the case company could share a six-months order forecast with its vendors in India to achieve a better negotiating position and reduced prices with 3 % on staple products. The third aspect is the coordination of transport from India and is important to consider when managing the total cost. In combination with the two previous mentioned aspects, the coordination can be achieved in two ways. Firstly, by coordinating the existing orders in time, which would help to fill up the consolidated containers that the case company uses. Secondly, by adjusting the quantity when placing the orders to fill up containers and meet the volume requirements for factory load containers. Both approaches would enable the management of total cost in the order placement by being able to include the transport in the cost calculation of the order, and not get this cost subsequently. RQ3: How is the formation of the private label assortment related to the challenges that prohibit a total cost perspective? The process under which the private label staple product assortment is formed has an impact on challenges that prohibit a total cost perspective. Having learned about this process, the conclusion is drawn that the big proportion of previously seasonal products in the staple assortment contributes to the complexities that arise in the replenishment process of the staple products since MOQ and production requirements which are not necessary to consider when ordering a seasonal product, suddenly must be considered when the product turns into a staple and should be replenished. Furthermore, to capitalize on popular products give rise to the development of new products and a broader product assortment, which risk to give way to the ordering challenge with combined SKUs.
69
MRQ: How to include the total cost perspective of the supply chain into the purchasing strategy? Answering the three sub-research questions helped to answer the main research question, and fulfill the purpose of the study. Challenges in the current purchasing process prohibit the case company from managing total cost in the supply chain. The proposed aspects were identified to mitigate the root cause of the challenges. If the proposed aspects; flexible time supply periods, information sharing and coordination of transports, would be incorporated in the purchasing strategy, it would be possible for the case company to overcome their challenges and manage the total cost in the supply chain. Knowledge concerning the formation of the private labeled staple assortment provides insights on how the challenges prohibiting a total cost perspective arise, and how to respond to them, for example in the form of evaluation projects when products transitions from seasonal to staple assortment.
5.2 Theoretical contribution The theoretical contribution of this thesis is quite limited, instead the empirical contribution is in focus. However, one can argue that an analytical contribution (Blomkvist & Hallin, 2015) has been made in the literature fields of purchasing strategy and supply chain management. More specifically the contribution concerns how these literature fields are connected to each other in order to manage the total cost of the supply chain from a purchasing perspective.
5.3 Empirical contribution The main empirical contribution from this thesis originates from case study performed in the retail business. The contribution lies in the field of purchasing strategy and how to incorporate a total cost perspective of the supply chain. The contribution is more specifically the identified challenges in the purchasing process described in chapter 4.4, the proposed aspects to include in the purchasing strategy described in chapter 4.5, and the analysis concerning the formation of the product assortment described in chapter 4.6. The empirical findings of this study has provided concrete results of what a total cost perspective in the purchasing strategy imply for a medium sized Swedish retail company with a time-supply purchasing strategy. In consequence, this research has made an empirical contribution to the theoretical field of purchasing strategy.
5.3.1 Generalizability and discussion concerning the total cost model The insights and conclusions we have drawn from the total cost model presented in chapter 4.4 is applicable for other companies than the case company. The total cost model which was developed had the purpose to gain a total cost perspective of the supply chain, and simultaneously help to mitigate the challenges that the supply planners face in the ordering phase. Using the case products as means to build the model helped to visualize the existing complexities and how they affect the ordering process. The development of the total cost tool was very helpful to understand the challenges that prohibit a total cost perspective in the purchasing process. Even though specific numbers were used in the model, the problems we had to deal with to build the model must be taken in account for other companies that wish to apply a total cost perspective in the supply chain. We would also like to emphasize that our model cannot ensure an optimal order suggestion, resulting in the lowest total cost of the supply chain. This kind of result would have required advanced mathematics and the kind of research approach applied in optimization models
70
(Agrawal, Smith, & Tsay, 2002) (Ding, Benyoucef, & Xiaolan, 2004). Once again, the intention with building the total cost model was never to find the optimal order quantity, but to learn how decisions made in the purchasing process affect total cost in the supply chain and how the identified challenges prohibit the replenishment order. Building the model gave insights in which assumptions must be made in order to integrate the total cost perspective in the purchasing strategy, and suggest an approach for how the total cost perspective can be applied in the repurchase of private label products. The tool helps supply planners take control over the costs, and make educated and well balanced decisions in accordance with the strategy of the firm. Another important factor to bear in mind when developing the total cost tool is to be aware of the compatibleness with the rest of the IT-systems and tools within the firm. There is however a fine line weather to limit the total cost tool analysis to the current and existing tools at the company, or to “think outside the box” and identify limitations and conditions for the total cost tool to work properly. For example, as described in the results, we soon identified that a total cost tool would be dependent on prognosis forecast from RDF, not only on the SKU in question which needed to be ordered, but for SKUs for which an order had not yet been triggered. It would however have been impossible to transfer this data to an excel file (in which the total cost tool was developed) and as of today RMS is unable to show demand for future SKUs, which has not reached their order point. Instead of limiting the work to these conditions, we challenged their characteristics and either found a way to extract the same or similar data from another internal source, or assumed that these problems can be solved in the future, thus identifying future work for the firm to tackle in order for the total cost model to work as efficiently as possible. The same yields for the challenge with the time supply restriction. Today, RMS is restricted to the same time supply for all products. We have challenged this idea since the total cost tool is better managed if products have their own specific time supply. This puts pressure on the developers of RMS.
5.3.2 Generalizability of the results It is important to ask oneself to which extent the results regarding challenges prohibiting a total cost perspective and how the formation of the private label assortment are relevant for other companies. Furthermore, to reflect in which industries the kind of problems the case company has experienced in the purchasing process arise. The results are of more value to companies not necessarily in the retail business, but companies that operate under the same conditions as the case company. The complexities and challenges in the purchasing and ordering process which our case study has reviled are characteristic for a middle sized retail company producing their own products. Small to middle-sized companies that struggle to come up to MOQs because of the relatively low demand for its products compared to competitors will advantage from the conclusions drawn in this research. In an interview with a design manager at the case company who had experience from a larger retail company producing their own products, MOQs were seldom a problem (Design manager, 2016). Furthermore, they had better bargaining power with suppliers and could easily negotiate for better purchasing prices, so our results are therefore not relevant for these companies. Secondly, it matters weather the company produces private label products or only sells brand products. As we have seen, many of the enquired problems are connected to the private label assortment. This is because the ordering of products directly affects the manufacturing of the products. Completely different challenges and consequently solutions probably yield for brand products, where an order gets shipped from a main distribution center owned by the brand. However, this is nothing we can ensure and thus is a suggested area for future research.
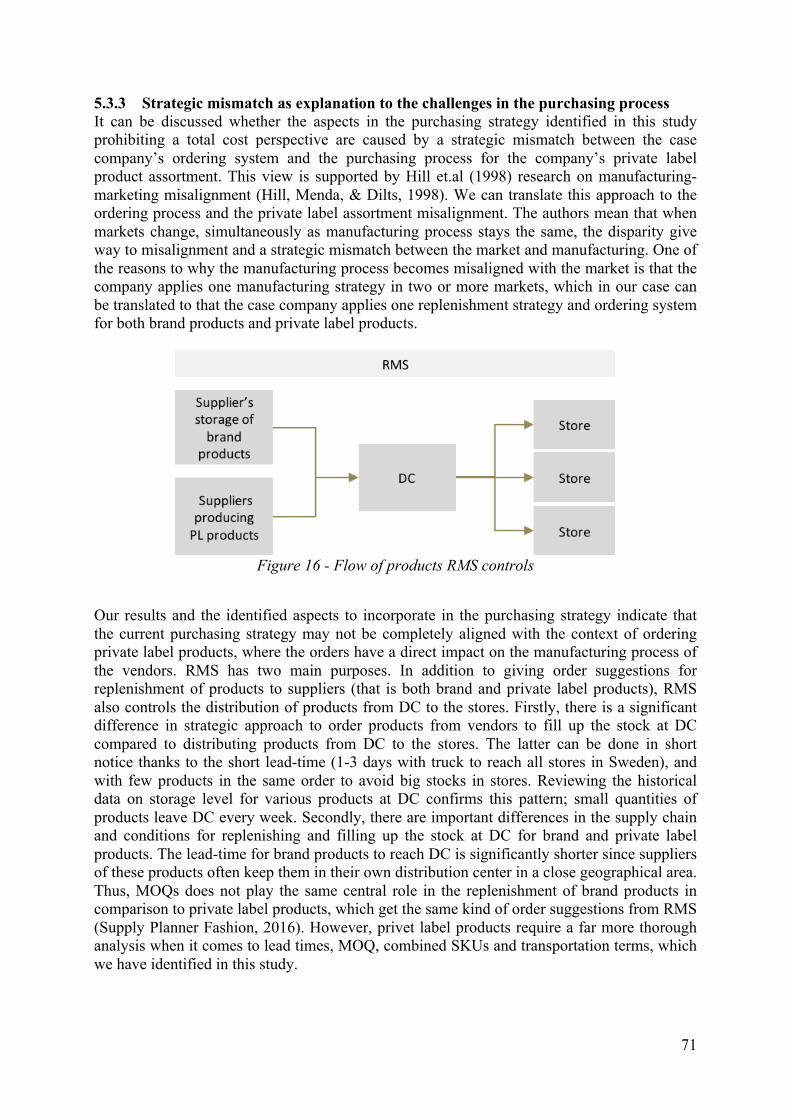
71
5.3.3 Strategic mismatch as explanation to the challenges in the purchasing process It can be discussed whether the aspects in the purchasing strategy identified in this study prohibiting a total cost perspective are caused by a strategic mismatch between the case company’s ordering system and the purchasing process for the company’s private label product assortment. This view is supported by Hill et.al (1998) research on manufacturing-marketing misalignment (Hill, Menda, & Dilts, 1998). We can translate this approach to the ordering process and the private label assortment misalignment. The authors mean that when markets change, simultaneously as manufacturing process stays the same, the disparity give way to misalignment and a strategic mismatch between the market and manufacturing. One of the reasons to why the manufacturing process becomes misaligned with the market is that the company applies one manufacturing strategy in two or more markets, which in our case can be translated to that the case company applies one replenishment strategy and ordering system for both brand products and private label products.
Figure 16 - Flow of products RMS controls
Our results and the identified aspects to incorporate in the purchasing strategy indicate that the current purchasing strategy may not be completely aligned with the context of ordering private label products, where the orders have a direct impact on the manufacturing process of the vendors. RMS has two main purposes. In addition to giving order suggestions for replenishment of products to suppliers (that is both brand and private label products), RMS also controls the distribution of products from DC to the stores. Firstly, there is a significant difference in strategic approach to order products from vendors to fill up the stock at DC compared to distributing products from DC to the stores. The latter can be done in short notice thanks to the short lead-time (1-3 days with truck to reach all stores in Sweden), and with few products in the same order to avoid big stocks in stores. Reviewing the historical data on storage level for various products at DC confirms this pattern; small quantities of products leave DC every week. Secondly, there are important differences in the supply chain and conditions for replenishing and filling up the stock at DC for brand and private label products. The lead-time for brand products to reach DC is significantly shorter since suppliers of these products often keep them in their own distribution center in a close geographical area. Thus, MOQs does not play the same central role in the replenishment of brand products in comparison to private label products, which get the same kind of order suggestions from RMS (Supply Planner Fashion, 2016). However, privet label products require a far more thorough analysis when it comes to lead times, MOQ, combined SKUs and transportation terms, which we have identified in this study.
72
To summarize, the fact that RMS does not make any distinct difference between these two types of products can be a contributing factor to the complex situation in the ordering process. This because the private label ordering process requires a more thorough analysis and cost calculations before being ordered, and cannot only be based on a replenishment system. The reason is that the privet label replenishment orders have direct affect on the manufacturing process of the vendors.
5.4 Managerial implications The identified challenges in the purchasing process and their root causes give managers at the case company valuable guidelines for how they should proceed and develop the purchasing strategy to consider a total cost perspective. The suggestions presented in this research can help to set the requirements when developing the purchasing systems RDF and RMS. This is however a work which can take time since it will include external partners and big financial investments. On the contrary, aspects concerning internal information sharing can be acted upon fairly quickly. The production requirements and price breaks of the private label products must be codified and made accessible to supply planners in the purchasing process. Moreover, managers can take actions to target challenges apparent in the purchasing process caused by production requirements and the formation of the private label assortment. Since we have shown that these complexities occur in the transition from seasonal product to staple products, this highlights the need of some kind of effort to be made in this transition. Our research indicates that clarifying and negotiating the production requirements when a seasonal product is moved to the staple assortment, would simplify the re-purchasing process of the product. These actions could be made in an evaluation project as proposed in chapter 4.6. Finally, the IT-system structure must be evaluated and include complementing purchasing tools in line with this study’s developed total cost tool. Developing the ordering system according to the purchasing strategy suggested in RQ1, for example providing unique time supplies for every product and include MOQ restrictions, could help to align the product-process again. This is however nothing we have been able to prove in our thesis, and it is suggested that future research look at how the implementation of our proposed aspects should be implemented in RMS in order to ensure a smooth transition to the new strategy, and to secure the positive results.
5.5 Limitations This paper has the same limitations as most case-study based research, including analysis subjectivity and questionable generalization of findings (Blomkvist & Hallin, 2015) (Collins & Hussey, 2015). The interviews held are primary sources and the answers in the interviews risk to become subjective based on the previous experience of the person interviewed. To mitigate this risk, we have held interviews with the same purpose, and asked the same questions to different persons and checked information gathered in interviews with other persons. To completely eliminate this risk more interviews could have been held, however, since we gained similar or equal information from several interviews, we mean that the results based on the interviews are reliable. Throughout the thesis interview preparations have been made to secure that the right questions are asked, to confirm the validity of the research so that it matches the purpose. Secondly, we have complemented the interviews with secondary sources like internal reports and databases. There is a risk that we have influenced the conclusions drawn with a personal interpretation, however, throughout the process we have

73
ensured to our knowledge that we have approached the data objectively without turning them to our advantage. Another limitation is that the study only includes two case products, in an assortment with up to a thousand products. Similarly as an opportunistic case study at a single company might be limited to identify only few aspects of all problems in organizational life (Collins & Hussey, 2015), choosing only two products risk to result in limited results. However, we think that the results these case products have helped to generate are highly relevant for the whole product assortment at the case company, and for that matter product assortments at other middle-sized retail companies. Also, since we have identified the aspects from the root cause of the challenges, the results are applicable to more products in the product assortment. However, we admit that there might be other products with other complexities, that would have given us insights and lead us to additional aspects to include in the purchasing strategy.
5.6 Reflection on sustainability It was clear from the beginning that the case company is well aware of the sustainability throughout their supply chain, both when it comes to corporate social responsibility (CSR) questions, its impact on the environment, and responsibility for a sustainable production and supplier base. The total cost model and the aspects to integrate cost awareness in the purchasing strategy are developed in accordance with the company’s sustainability guidelines, and would not jeopardize the company’s work on social responsibility. One example of how this work has added to the company’s sustainability work is that incorporating a total cost perspective in the purchasing strategy has direct benefits from an environmental perspective. For example, coordinating transportation would reduce emissions in the supply chain. Furthermore, our research has shown that implementing our suggestions on flexible time supply and information sharing in the purchasing strategy would contribute to a more efficient purchasing process. In the long run, this would also have environmental benefits, since suppliers can plan their production better and use raw materials more efficiently.
5.7 Future research This study investigates which aspects are most important for a retail company to incorporate in their purchasing strategy to enable the management of the total cost in the supply chain. This was made by doing a case-study on a medium sized retail company from Sweden, with a specific context of a time supply strategy and the problem of reaching MOQs in production. Future research in the academic perspective could include other retail companies, with other strategies to see what aspects are most important for them. Also, retail companies in different sizes would be valuable to include to gain a more comprehensive picture of the retail industry and compare the identified aspects. Furthermore, the same research questions this study has investigated for the private label products can also be conducted for the brand products. This study implies that these results are specific for only the private label assortment, however, it would be valuable to do the same research on brand products to see if the same or completely different challenges arise. In addition to these suggestions, one area has already been proposed in chapter 5.4, which is to look at how our proposed aspects should be implementation in RMS to ensure a smooth transition to the new strategy.
74
6 Bibliography Agrawal, D., & Schorling, C. (1996). Market share forecasting: An empirical comparison of artificial neural networks and multinomial logit model. Journal of Retailing , 72 (4), 383-407. Agrawal, D., & Smith, S. (2009). Retail Supply Chain Management. International Series in Operations Research & Management Sience , 122. Agrawal, N., Smith, A. S., & Tsay, A. A. (2002). Multi-vendor Sourcing in a retail supply chain. Production and operations managements . Akilliouglu, H. (2015). Production Planning. (H. Akilliouglu, Performer) Royal Institute of Technology, Stockholm, Sweden. Alard, R., Bremen, P., Oehmen, J., & Schneider, C. (2010). Total Cost of Owneship Considerations in Global Sourcing Processes. Advances in Information and Communication Technology , 491-488. Aline, K. (2015, February 3). Business News Daily Contributer. Retrieved from www.businessnewsdaily.com: http://www.businessnewsdaily.com/5693-bcg-matrix.html Andersen, M., & Skjoett-Larsen, T. (2009). Corporate social responsibility in global supply chains”. Supply Chain Management: An International Journal , 14 (2), pp. 75-86. Baier, C. (2008). The alignment performence link in purchasing and supply management. Wiesbaden: Springer Fachmedien. Barksdale, H., & Hilliard, J. (1975). A cross-spectral analysis of retail inventories and sales. Journal of Business , 48 (3), 365-382. Bernstein, F., Chen, F., & Federgruen, A. (2006). Coordinating supply chains with simple pricing schemes: the role of vendor-managed inventories. Management Science , 52 (10), 1483-1492. Blomkvist, P., & Hallin, A. (2015). Method for engineering students (Vol. 1). Lund: Studentlitteratur. Bookbinder, J. H., & Zarour, F. H. (2001). Direct Product Profitability and retail shelf-space allocation models. Journal of business logistics , 22 (2). Boute, R. N., Disney, S. M., Lambrecht, M. R., & Van Houdt, B. (2006, Januari). An integrated production and inventory model to dampen upstream demand variability in the supply chain. European Journal of Operational Research , 178 (2007), pp. 121-142. Carr, A., & Smeltzer, L. (1997). An empirically based operational definition of strategic purchasing. 3, 199-207. Chamberlin, E. (1933). The Theory of Monopolistic Competition. Political Science Quarterly , 48 (3), pp. 458-460. Chatterjee K, L. G. (1986). Game theory in marketing science: Uses and limitations. International Journal of Research in Marketing , 79-93. Chen, I. J., Paulraj, A., & Augustine A., L. (2004). Strategic purchasing, supply management, and firm performance. Journal of Operations Management , 22 (5), 505-523. Chen, I. J., Paulraj, A., & Lado, A. A. (2004). Strategic Purchasing, supply management, and firm performance. Journal of opertions management , 22, pp. 505-523. Chen, X., Gang, H., Xun, L., Ka, F., Cedric, & Yiu. (2012). The impact of demand variability and transshipment on vendor's distribution policies under vendor managed inventory. 139 (1), 42-48. Chu, C., & Zhang, G. (2003). A comparative study of linear and nonlinear models for aggregate retail sales forecasting. International Journal of Production Economics , 86 (3), 217-231. Collins, J., & Hussey, R. (2015). Business Research, a practical guide for undergraduates and postgraduate students. Palgrave. Design manager. (2016, April 11). (M. Ekström, & C. Fahnehjelm, Interviewers)
75
Ding, H., Benyoucef, L., & Xiaolan, X. (2004). A Multiobjective Optimization Method for Strategic Sourcing and Inventory Replenishment. International Conference on Robotics & Automation . Doherty, C., Mailer, J., & Simkin, L. (1993). DPP Decisions Support in Retail Merchandising. Omega International Journal of Management Science , 21 (1), pp. 25-33. Dubois, A., & Pedersen, A.-C. (2002). Why relationships do not fit into purchasing portfolio models - a comparison between the portfolio and industrial network approaches. European Journal of Purchasing & Supply Management , 8 (1), pp. 35-42. Dwyer, R. F., H, S. P., & Sejo, O. (1987). Developing Buyer-Seller Relationships. Journal of Markering , 11-27. Ellram M., L. (1995). Total cost of ownership: an analysis approach for purchasing. International Journal of Physical Distribution & Logistics Management , 25 (8), 4-23. Ellram, L. M., & Carr, A. (1994). Strategic purchasing: A history and review of the literature. International Journal of Purchasing and Materials Management , 2 (30), p. 10. Forcasing and Planning specialist. (2016, February 12). (M. Ekström, & C. Fahnehjelm, Interviewers) Forwarding Manager. (2016, Februari 1). (M. Ekström, & C. Fahnehjelm, Interviewers) Gavirneni, S., Kapuscinski, R., & Tayur, S. (1999, January). Value of Information in Capacitated Supply Chains. Management Science , 45 (1). Gelderman, C. J., & J. van Weele, A. (2005). Purchasing Portfolio Models: A Critique and Update. Journal of Supply Chain Management , 41 (3), pp. 19-28. General Manager AFE. (2016, February 9). (M. Ekström, & C. Fahnehjelm, Interviewers) Gerard J., B., Janice E, C., & Asoo J., V. (2007). Single versus multiple supplier sourcing strategies. European Journal of Operational Research , 182 (1), pp. 95-112. Gibbert, M., Ruigrok, W., & Wicki, B. (2008, june 9). What passes as a rigorous case study? Strategic Management Journal (29), pp. 1465-1474. González-Benito, J. (2007). A theory of purchasing's contribution to business performance. Journal of Operations Management , 25 (4), 901-917. H&M. (2016). Hennes & Mauritz AB. Retrieved mars 21, 2016, from Financial reports 2014: http://about.hm.com/content/dam/hm/about/documents/en/cision/2015/01/1460341_en.pdf Hill, T. J., Menda, R., & Dilts, D. M. (1998). Using Product Profiling to Illustrate Manufacturing-Marketing Misalignment. Interfaces , 28 (4), 47-63. Internal report. (2016, april). Product follow up sales stock and intake. Iyer, A. V., & Bergen, M. E. (1997). Quick response in manufacturer-retailer channels. Management Science , 4 (43), pp. 559-570. Izquierdo, C. C., Samaniego, M. J., & Cabezudo, R. S. (2015). How Strategic Purchasing Orientation and Transformational Leadership Impact Performance: The Mediating Role of Information and Communciation. Journal of Business-to-Business Marketing , 22 (4), 269-292. Jonsson, P., & Mattsson, S.-A. (2013, October). The value of sharing planning information in supply chains. International Journal of Physical Distribution & Logistics Management , 43 (4), pp. 282-299. Khurrum S., B., & Faizul, H. (2002). Supplier selection problem: a comparison of the total cost of ownership and analytical hierarhy process aproaches. Supply Chain Management: An International Journal , 7 (3), 126-135. Kraljic, P. (1983, 9). Purchasing must become Supply Management. Harvard Business Review . Krause, D. R., Pagell, M., & Curkovic, S. (2001). Toward a measure of competitive priorities for puchasing. Journal of Operations Management , 19 (4), 497-512.
76
Lee, L., Padmanabhan, V., & Whang, S. (2004). Comments on information distortion in a supply chain - the bullwhip effect. 18871893. Lowson, H. R. (2001). Retail Sourcing Strategies: Are They Cost-effective? International Journal of Logistics Research and Applications , 270-296. M. Ellram, L. (2002). Total Cost of Ownership. In D. Hahn, & L. Kaufmann, Handbuch Industrielles Beschaffungsmanagement (pp. 659-671). Collebe of Business Administration at Arizona State University. Manager, S. (2015, December). Case Introduction. Not published. (M. Ekström, & C. Fahnehjelm, Interviewers) Masadynski, M. (2007). Value Stream Mapping. Ekonomika i Organizacja , 43-51. Matsson, S.-A. (2010, April). Inventory control in environments with seasonal demands. Oper Mamag Res . Merchendiser AFE, H. (2016, March). (M. Ekström, & C. Fahnejelm, Interviewers) Miemczyk, J., Johnsen, T., Karjalainen, K., Salmi, A., & Federico, C. (2011). Global sourcing: Linking category characteristics to the geographical scope of sourcing. Annual IPSERA Conference Maastricht Netherlands . Momme, J., Moeller, M. M., & Hvolby, H.-H. (2000). Linking Modular Product Architecture to the Strategic Sourcing Process: Case Studies of Two Danish Industrial Enterprises. International Journal of Logistics: Research and Applications , 3 (2), 127-146. Monczka, R., Trent, R., & Handfield, R. (2005). Purchasing and supply chain management. London, South-Western: International Thomson. Muckstadt, J., & Sapra, A. (2010). Principles of inventory management: when you are down to Four, Order more. Springer Series in Operations Research and Financial Engineering. Nathorst-Westfelt, F. (2016, Marsh 03). Supplier Developer. (C. Fahnehjelm, Interviewer) Nishiguchi, T. (1994). Strategic Industrial Sourcing. New York: Oxford University. Ogden, J. A., Rossetti, C. L., & Hendrick, T. E. (2007). An exploratory cross-country comparison of strategic purchasing. Journal of Purchasing and Supply Management , 13, pp. 2-16. Pan, F. (2015). The optimization model of the vendor selection for the joint procurement from a total cost of ownership perspective. Journal of Industrial Engineering and Management , 8 (4). Payne, J., & Dorn, J. W. (2012). Managing Indirect Spend: Enhancing Profitability through Strategic Sourcing. Online: John Wiley & Sons, Inc. Pentico, D., & Drake, M. (2011). A survey of deterministic moel for the EOQ and EPQ with partial backordering. European Journal of Operational Research , 179-198. Perry, P., & Towers, N. (2012). Conceptual framework development: CSR implementations in fashion supply chains. International Journal of Physical Distribution & Logistic Management , 43 (5), pp. 478-500. Purchaser Home Textile. (2016 , Januari 29). (M. Ekström, & C. Fahnehjelm, Interviewers) Resource and tactical production planner. (2016, Februri 11). (M. Ekström, & C. Fahnehjelm, Interviewers) Rezaei, J. (2014). Economic order quantity for growing items. International Journal of Production Economics , 109-113. Ritter, T. (2000). A Framework for Analyzing Interconnectedness of Relationships. 29 (4), pp. 317-326. S. P. (2016, 02 16). (M. E. Fahnehjelm, Interviewer) Schuh, C., & Strohmer, M. (2012). How to become a procurement champion. Vienna: AT Kearny. Sen, A. (2008). The U.S. fashion industry: A supply chain review. International Journal of Production Economies , 114, pp. 571-593.
77
Senior Merchendiser. (2016, Marsh 04). (M. Ekström, & C. Fahnehjelm, Interviewers) Senior Merchendiser. (2016, Marsh 04). (M. Ekström, & C. Fahnehjelm, Interviewers) Sharp, B., & Dawes, J. (2001). What is Differentiation and How Does it Work? Journal of Marketing Management , 17 (7-8), pp. 739-759. Shen, W., Chen, J., & Xiao, H. (2011). Total Cost Modeling and Systemic, Strategic Methods for Purchasing Cost Decision and Management. International Conference on Management and Service Science , pp. 1-4. Sourcing and Product developer. (2016, Mars 29). (M. Ekström, & C. Fahnehjelm, Interviewers) Sourcing Manager. (2016, 01 13). (M. Ekström, & C. Fahnehjelm, Interviewers) Sourcing Manager, & Supply Chain Manager. (2016, 05 13). (C. F. Ekström, Interviewer) Spekman, R., Kamauff, J., & Salmond, D. (1994). At last purchasing is becoming strategic. Long Range Planning , 27 (2), 76-84. Stanton, N., Salmon, P., Walker, G., Baber, C., & Jenkins, D. (2005). Human Factors Methods - A Practical Guide for Engingeering and Design. Padstow, Cornwall: Ashgate Publishing Company. Stevens, G. (1989). Integrating the supply chain. International Journal fo Physical Distribution and Materials Management , 19 (8), pp. 3-8. Stuart, F. I., & McCutcheon, D. D. (2000). The Manager's Guide to Supply Chain Management. Business Horizons , 35-44. Suarez-Barraza, M. F., Miguel-Davila, J.-Á., & Vasquez-García, C. (2016). Supply chain value stream mapping: a new tool of operation management. International Journal of Quality & Reliability Management , 33, 518-534. Sudhi, S. (2005). Sourcing Strategy Principles, Policy and Designs. New York: Springer Science+Business Media Inc. Supplier Developer. (2016, Marsh 03). (C. Fahnehjelm, Interviewer) Supply Planner Fashion. (2016, Februari 1). (M. Ekström, & C. Fahnehjelm, Interviewers) Supply Planner Home Textile. (2016, Februari 16). (C. F. Marcus Ekström, Interviewer) Trent, R. J., & Monczka, R. M. (1998, November). Purchasing and Supply Management: Trends and Changes Throughout the 1990s. International Journal of Purchasing and Materials Management . Tsai, W., & Chih-Hsiung, W. (2010). Decision making of sourcing and order allocation with price discounts. Journal of Manufacturing Systems , 29 (1), pp. 47-54. van Weele, A. J. (2002). Purchasing and supply chain management - Analysis, planning and practice (Vol. III). London, UK: Thomson Learning. Wang, C.-H. (2010). Some remarks on an optimal order quantity and reorder point when supply and demand are uncertain. Computers & Industrial Engineering , 809-813. Watts, C., Kee, K., & Hahn, C. (1995). Linking purchasing tot corporate competitive strategy. International Journal of Purchasing and Materials Management , 31 (2), 2. Weiss, S. I. (2013). Product and Systems Development: A Value Approach. New Jersey: John Wiley & Sons, Inc. Vicari, S. (2013). Is the Problem Only Ours? A Question of Relevance in Management Research. European Management Review , 10, pp. pp 173-181. Zhao, X., Xie, J., & Wei, J. C. (2007). The value of early order commitment in a two-level supply chain. European Journal of Operational Research (180), pp. 194-214.
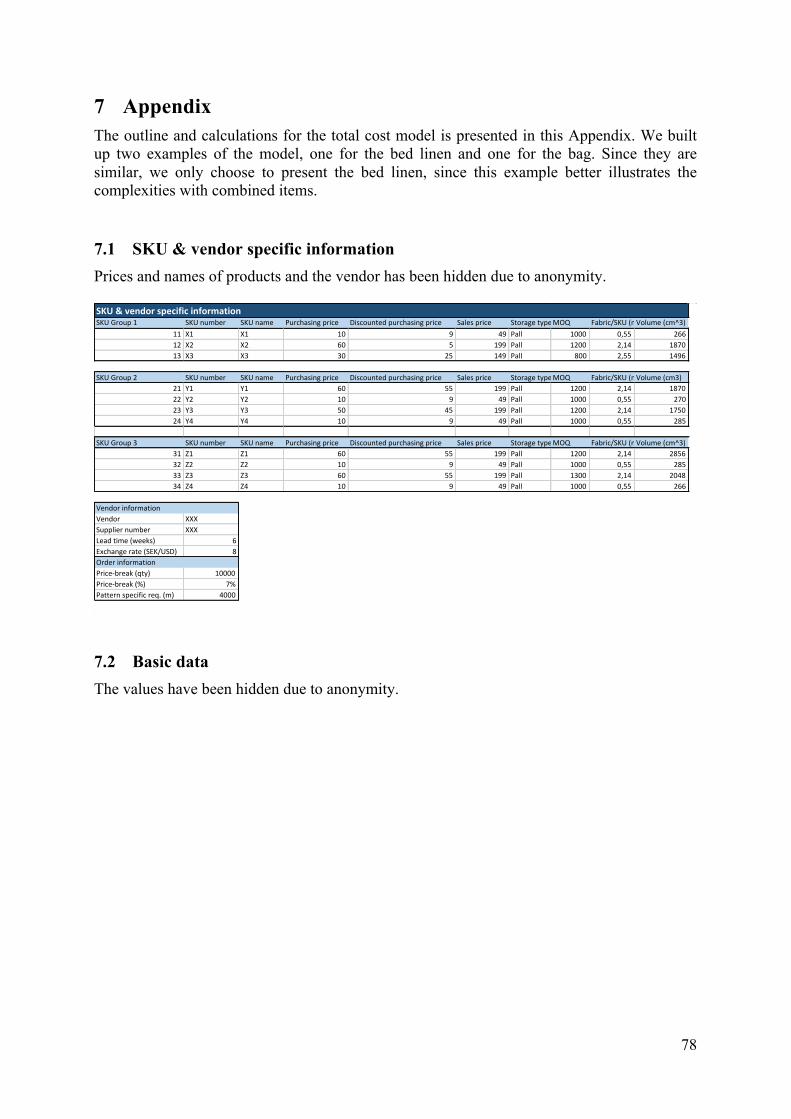
78
7 Appendix The outline and calculations for the total cost model is presented in this Appendix. We built up two examples of the model, one for the bed linen and one for the bag. Since they are similar, we only choose to present the bed linen, since this example better illustrates the complexities with combined items.
7.1 SKU & vendor specific information Prices and names of products and the vendor has been hidden due to anonymity.
7.2 Basic data The values have been hidden due to anonymity.
SKU&vendorspecificinformationSKUGroup1 SKUnumber SKUname Purchasingprice Discountedpurchasingprice Salesprice StoragetypeMOQ Fabric/SKU(m)Volume(cm^3)
11 X1 X1 10 9 49 Pall 1000 0,55 26612 X2 X2 60 5 199 Pall 1200 2,14 187013 X3 X3 30 25 149 Pall 800 2,55 1496
SKUGroup2 SKUnumber SKUname Purchasingprice Discountedpurchasingprice Salesprice StoragetypeMOQ Fabric/SKU(m)Volume(cm3)21 Y1 Y1 60 55 199 Pall 1200 2,14 187022 Y2 Y2 10 9 49 Pall 1000 0,55 27023 Y3 Y3 50 45 199 Pall 1200 2,14 175024 Y4 Y4 10 9 49 Pall 1000 0,55 285
SKUGroup3 SKUnumber SKUname Purchasingprice Discountedpurchasingprice Salesprice StoragetypeMOQ Fabric/SKU(m)Volume(cm^3)31 Z1 Z1 60 55 199 Pall 1200 2,14 285632 Z2 Z2 10 9 49 Pall 1000 0,55 28533 Z3 Z3 60 55 199 Pall 1300 2,14 204834 Z4 Z4 10 9 49 Pall 1000 0,55 266
VendorinformationVendor XXXSuppliernumber XXXLeadtime(weeks) 6Exchangerate(SEK/USD) 8Orderinformation Price-break(qty) 10000Price-break(%) 7%Patternspecificreq.(m) 4000
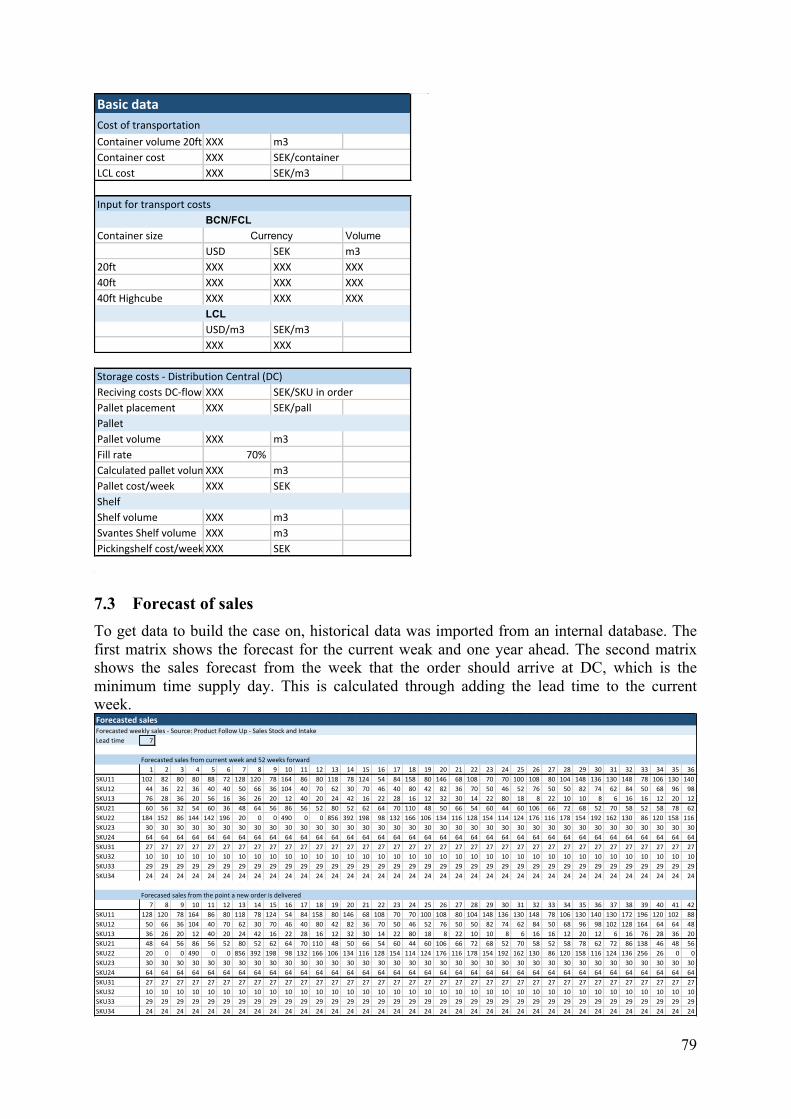
79
7.3 Forecast of sales To get data to build the case on, historical data was imported from an internal database. The first matrix shows the forecast for the current weak and one year ahead. The second matrix shows the sales forecast from the week that the order should arrive at DC, which is the minimum time supply day. This is calculated through adding the lead time to the current week.
BasicdataCostoftransportationContainervolume20ft XXX m3Containercost XXX SEK/containerLCLcost XXX SEK/m3Inputfortransportcosts
BCN/FCLContainersize Volume
USD SEK m320ft XXX XXX XXX40ft XXX XXX XXX40ftHighcube XXX XXX XXX
LCLUSD/m3 SEK/m3XXX XXX
Storagecosts-DistributionCentral(DC)RecivingcostsDC-flow XXX SEK/SKUinorderPalletplacement XXX SEK/pallPalletPalletvolume XXX m3Fillrate 70%CalculatedpalletvolumeXXX m3Palletcost/week XXX SEKShelfShelfvolume XXX m3SvantesShelfvolume XXX m3Pickingshelfcost/week XXX SEK
Currency
ForecastedsalesForecastedweeklysales-Source:ProductFollowUp-SalesStockandIntakeLeadtime 7
Forecastedsalesfromcurrentweekand52weeksforward1 2 3 4 5 6 7 8 9 10 11 12 13 14 15 16 17 18 19 20 21 22 23 24 25 26 27 28 29 30 31 32 33 34 35 36
SKU11 102 82 80 80 88 72 128 120 78 164 86 80 118 78 124 54 84 158 80 146 68 108 70 70 100 108 80 104 148 136 130 148 78 106 130 140SKU12 44 36 22 36 40 40 50 66 36 104 40 70 62 30 70 46 40 80 42 82 36 70 50 46 52 76 50 50 82 74 62 84 50 68 96 98SKU13 76 28 36 20 56 16 36 26 20 12 40 20 24 42 16 22 28 16 12 32 30 14 22 80 18 8 22 10 10 8 6 16 16 12 20 12SKU21 60 56 32 54 60 36 48 64 56 86 56 52 80 52 62 64 70 110 48 50 66 54 60 44 60 106 66 72 68 52 70 58 52 58 78 62SKU22 184 152 86 144 142 196 20 0 0 490 0 0 856 392 198 98 132 166 106 134 116 128 154 114 124 176 116 178 154 192 162 130 86 120 158 116SKU23 30 30 30 30 30 30 30 30 30 30 30 30 30 30 30 30 30 30 30 30 30 30 30 30 30 30 30 30 30 30 30 30 30 30 30 30SKU24 64 64 64 64 64 64 64 64 64 64 64 64 64 64 64 64 64 64 64 64 64 64 64 64 64 64 64 64 64 64 64 64 64 64 64 64SKU31 27 27 27 27 27 27 27 27 27 27 27 27 27 27 27 27 27 27 27 27 27 27 27 27 27 27 27 27 27 27 27 27 27 27 27 27SKU32 10 10 10 10 10 10 10 10 10 10 10 10 10 10 10 10 10 10 10 10 10 10 10 10 10 10 10 10 10 10 10 10 10 10 10 10SKU33 29 29 29 29 29 29 29 29 29 29 29 29 29 29 29 29 29 29 29 29 29 29 29 29 29 29 29 29 29 29 29 29 29 29 29 29SKU34 24 24 24 24 24 24 24 24 24 24 24 24 24 24 24 24 24 24 24 24 24 24 24 24 24 24 24 24 24 24 24 24 24 24 24 24
Forecasedsalesfromthepointaneworderisdelivered7 8 9 10 11 12 13 14 15 16 17 18 19 20 21 22 23 24 25 26 27 28 29 30 31 32 33 34 35 36 37 38 39 40 41 42
SKU11 128 120 78 164 86 80 118 78 124 54 84 158 80 146 68 108 70 70 100 108 80 104 148 136 130 148 78 106 130 140 130 172 196 120 102 88SKU12 50 66 36 104 40 70 62 30 70 46 40 80 42 82 36 70 50 46 52 76 50 50 82 74 62 84 50 68 96 98 102 128 164 64 64 48SKU13 36 26 20 12 40 20 24 42 16 22 28 16 12 32 30 14 22 80 18 8 22 10 10 8 6 16 16 12 20 12 6 16 76 28 36 20SKU21 48 64 56 86 56 52 80 52 62 64 70 110 48 50 66 54 60 44 60 106 66 72 68 52 70 58 52 58 78 62 72 86 138 46 48 56SKU22 20 0 0 490 0 0 856 392 198 98 132 166 106 134 116 128 154 114 124 176 116 178 154 192 162 130 86 120 158 116 124 136 256 26 0 0SKU23 30 30 30 30 30 30 30 30 30 30 30 30 30 30 30 30 30 30 30 30 30 30 30 30 30 30 30 30 30 30 30 30 30 30 30 30SKU24 64 64 64 64 64 64 64 64 64 64 64 64 64 64 64 64 64 64 64 64 64 64 64 64 64 64 64 64 64 64 64 64 64 64 64 64SKU31 27 27 27 27 27 27 27 27 27 27 27 27 27 27 27 27 27 27 27 27 27 27 27 27 27 27 27 27 27 27 27 27 27 27 27 27SKU32 10 10 10 10 10 10 10 10 10 10 10 10 10 10 10 10 10 10 10 10 10 10 10 10 10 10 10 10 10 10 10 10 10 10 10 10SKU33 29 29 29 29 29 29 29 29 29 29 29 29 29 29 29 29 29 29 29 29 29 29 29 29 29 29 29 29 29 29 29 29 29 29 29 29SKU34 24 24 24 24 24 24 24 24 24 24 24 24 24 24 24 24 24 24 24 24 24 24 24 24 24 24 24 24 24 24 24 24 24 24 24 24
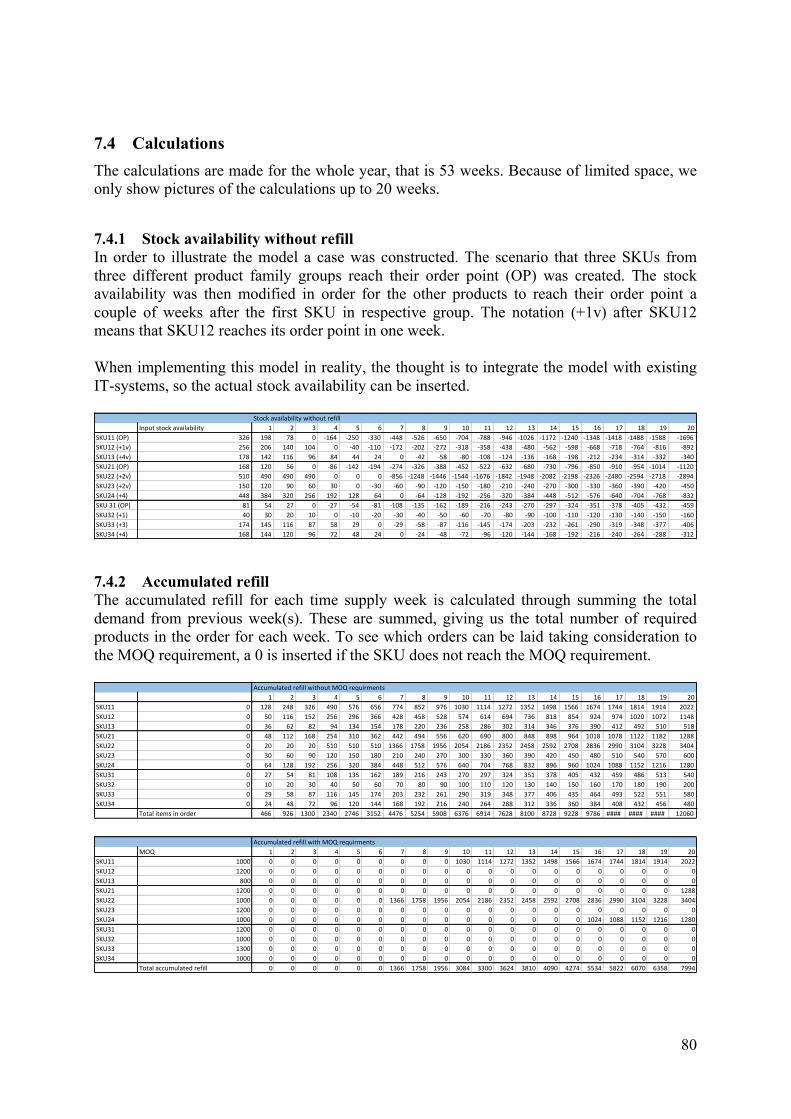
80
7.4 Calculations The calculations are made for the whole year, that is 53 weeks. Because of limited space, we only show pictures of the calculations up to 20 weeks.
7.4.1 Stock availability without refill In order to illustrate the model a case was constructed. The scenario that three SKUs from three different product family groups reach their order point (OP) was created. The stock availability was then modified in order for the other products to reach their order point a couple of weeks after the first SKU in respective group. The notation (+1v) after SKU12 means that SKU12 reaches its order point in one week. When implementing this model in reality, the thought is to integrate the model with existing IT-systems, so the actual stock availability can be inserted.
7.4.2 Accumulated refill The accumulated refill for each time supply week is calculated through summing the total demand from previous week(s). These are summed, giving us the total number of required products in the order for each week. To see which orders can be laid taking consideration to the MOQ requirement, a 0 is inserted if the SKU does not reach the MOQ requirement.
StockavailabilitywithoutrefillInputstockavailability 1 2 3 4 5 6 7 8 9 10 11 12 13 14 15 16 17 18 19 20
SKU11(OP) 326 198 78 0 -164 -250 -330 -448 -526 -650 -704 -788 -946 -1026 -1172 -1240 -1348 -1418 -1488 -1588 -1696SKU12(+1v) 256 206 140 104 0 -40 -110 -172 -202 -272 -318 -358 -438 -480 -562 -598 -668 -718 -764 -816 -892SKU13(+4v) 178 142 116 96 84 44 24 0 -42 -58 -80 -108 -124 -136 -168 -198 -212 -234 -314 -332 -340SKU21(OP) 168 120 56 0 -86 -142 -194 -274 -326 -388 -452 -522 -632 -680 -730 -796 -850 -910 -954 -1014 -1120SKU22(+2v) 510 490 490 490 0 0 0 -856 -1248 -1446 -1544 -1676 -1842 -1948 -2082 -2198 -2326 -2480 -2594 -2718 -2894SKU23(+2v) 150 120 90 60 30 0 -30 -60 -90 -120 -150 -180 -210 -240 -270 -300 -330 -360 -390 -420 -450SKU24(+4) 448 384 320 256 192 128 64 0 -64 -128 -192 -256 -320 -384 -448 -512 -576 -640 -704 -768 -832SKU31(OP) 81 54 27 0 -27 -54 -81 -108 -135 -162 -189 -216 -243 -270 -297 -324 -351 -378 -405 -432 -459SKU32(+1) 40 30 20 10 0 -10 -20 -30 -40 -50 -60 -70 -80 -90 -100 -110 -120 -130 -140 -150 -160SKU33(+3) 174 145 116 87 58 29 0 -29 -58 -87 -116 -145 -174 -203 -232 -261 -290 -319 -348 -377 -406SKU34(+4) 168 144 120 96 72 48 24 0 -24 -48 -72 -96 -120 -144 -168 -192 -216 -240 -264 -288 -312
AccumulatedrefillwithoutMOQrequirments1 2 3 4 5 6 7 8 9 10 11 12 13 14 15 16 17 18 19 20
SKU11 0 128 248 326 490 576 656 774 852 976 1030 1114 1272 1352 1498 1566 1674 1744 1814 1914 2022SKU12 0 50 116 152 256 296 366 428 458 528 574 614 694 736 818 854 924 974 1020 1072 1148SKU13 0 36 62 82 94 134 154 178 220 236 258 286 302 314 346 376 390 412 492 510 518SKU21 0 48 112 168 254 310 362 442 494 556 620 690 800 848 898 964 1018 1078 1122 1182 1288SKU22 0 20 20 20 510 510 510 1366 1758 1956 2054 2186 2352 2458 2592 2708 2836 2990 3104 3228 3404SKU23 0 30 60 90 120 150 180 210 240 270 300 330 360 390 420 450 480 510 540 570 600SKU24 0 64 128 192 256 320 384 448 512 576 640 704 768 832 896 960 1024 1088 1152 1216 1280SKU31 0 27 54 81 108 135 162 189 216 243 270 297 324 351 378 405 432 459 486 513 540SKU32 0 10 20 30 40 50 60 70 80 90 100 110 120 130 140 150 160 170 180 190 200SKU33 0 29 58 87 116 145 174 203 232 261 290 319 348 377 406 435 464 493 522 551 580SKU34 0 24 48 72 96 120 144 168 192 216 240 264 288 312 336 360 384 408 432 456 480
Totalitemsinorder 466 926 1300 2340 2746 3152 4476 5254 5908 6376 6914 7628 8100 8728 9228 9786 #### #### #### 12060
AccumulatedrefillwithMOQrequirmentsMOQ 1 2 3 4 5 6 7 8 9 10 11 12 13 14 15 16 17 18 19 20
SKU11 1000 0 0 0 0 0 0 0 0 0 1030 1114 1272 1352 1498 1566 1674 1744 1814 1914 2022SKU12 1200 0 0 0 0 0 0 0 0 0 0 0 0 0 0 0 0 0 0 0 0SKU13 800 0 0 0 0 0 0 0 0 0 0 0 0 0 0 0 0 0 0 0 0SKU21 1200 0 0 0 0 0 0 0 0 0 0 0 0 0 0 0 0 0 0 0 1288SKU22 1000 0 0 0 0 0 0 1366 1758 1956 2054 2186 2352 2458 2592 2708 2836 2990 3104 3228 3404SKU23 1200 0 0 0 0 0 0 0 0 0 0 0 0 0 0 0 0 0 0 0 0SKU24 1000 0 0 0 0 0 0 0 0 0 0 0 0 0 0 0 1024 1088 1152 1216 1280SKU31 1200 0 0 0 0 0 0 0 0 0 0 0 0 0 0 0 0 0 0 0 0SKU32 1000 0 0 0 0 0 0 0 0 0 0 0 0 0 0 0 0 0 0 0 0SKU33 1300 0 0 0 0 0 0 0 0 0 0 0 0 0 0 0 0 0 0 0 0SKU34 1000 0 0 0 0 0 0 0 0 0 0 0 0 0 0 0 0 0 0 0 0
Totalaccumulatedrefill 0 0 0 0 0 0 1366 1758 1956 3084 3300 3624 3810 4090 4274 5534 5822 6070 6358 7994
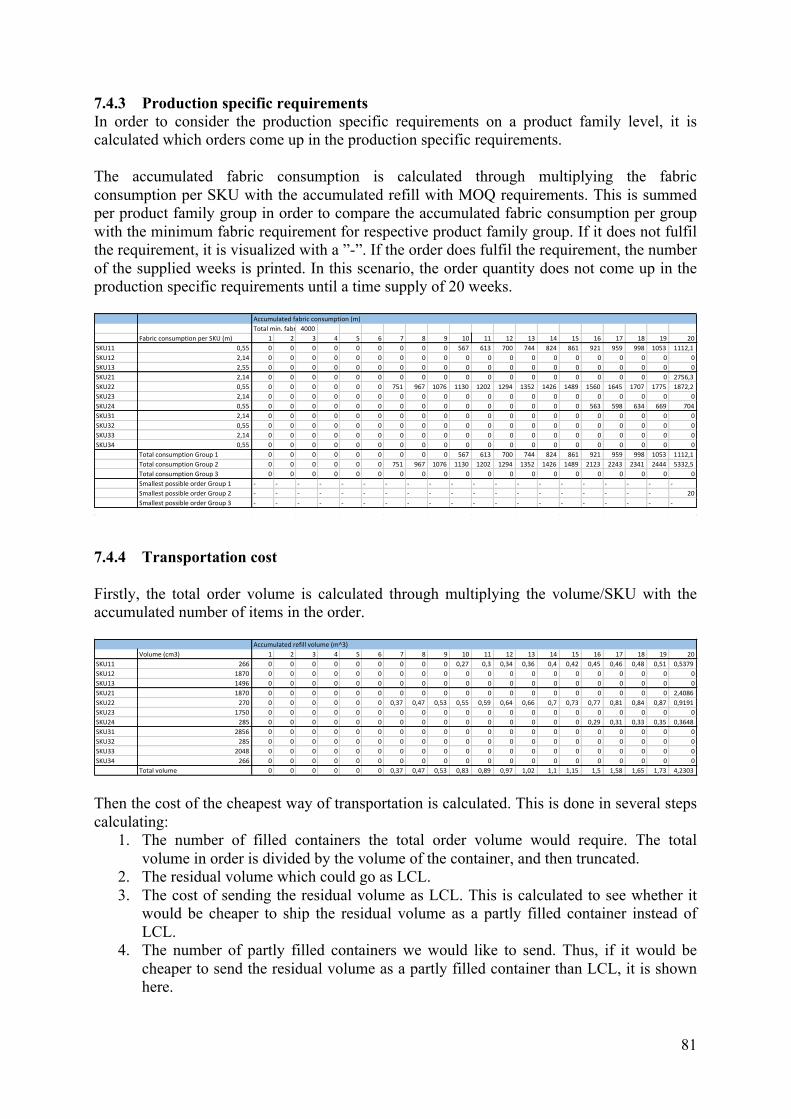
81
7.4.3 Production specific requirements In order to consider the production specific requirements on a product family level, it is calculated which orders come up in the production specific requirements. The accumulated fabric consumption is calculated through multiplying the fabric consumption per SKU with the accumulated refill with MOQ requirements. This is summed per product family group in order to compare the accumulated fabric consumption per group with the minimum fabric requirement for respective product family group. If it does not fulfil the requirement, it is visualized with a ”-”. If the order does fulfil the requirement, the number of the supplied weeks is printed. In this scenario, the order quantity does not come up in the production specific requirements until a time supply of 20 weeks.
7.4.4 Transportation cost Firstly, the total order volume is calculated through multiplying the volume/SKU with the accumulated number of items in the order.
Then the cost of the cheapest way of transportation is calculated. This is done in several steps calculating:
1. The number of filled containers the total order volume would require. The total volume in order is divided by the volume of the container, and then truncated.
2. The residual volume which could go as LCL. 3. The cost of sending the residual volume as LCL. This is calculated to see whether it
would be cheaper to ship the residual volume as a partly filled container instead of LCL.
4. The number of partly filled containers we would like to send. Thus, if it would be cheaper to send the residual volume as a partly filled container than LCL, it is shown here.
Accumulatedfabricconsumption(m)Totalmin.fabric4000
FabricconsumptionperSKU(m) 1 2 3 4 5 6 7 8 9 10 11 12 13 14 15 16 17 18 19 20SKU11 0,55 0 0 0 0 0 0 0 0 0 567 613 700 744 824 861 921 959 998 1053 1112,1SKU12 2,14 0 0 0 0 0 0 0 0 0 0 0 0 0 0 0 0 0 0 0 0SKU13 2,55 0 0 0 0 0 0 0 0 0 0 0 0 0 0 0 0 0 0 0 0SKU21 2,14 0 0 0 0 0 0 0 0 0 0 0 0 0 0 0 0 0 0 0 2756,3SKU22 0,55 0 0 0 0 0 0 751 967 1076 1130 1202 1294 1352 1426 1489 1560 1645 1707 1775 1872,2SKU23 2,14 0 0 0 0 0 0 0 0 0 0 0 0 0 0 0 0 0 0 0 0SKU24 0,55 0 0 0 0 0 0 0 0 0 0 0 0 0 0 0 563 598 634 669 704SKU31 2,14 0 0 0 0 0 0 0 0 0 0 0 0 0 0 0 0 0 0 0 0SKU32 0,55 0 0 0 0 0 0 0 0 0 0 0 0 0 0 0 0 0 0 0 0SKU33 2,14 0 0 0 0 0 0 0 0 0 0 0 0 0 0 0 0 0 0 0 0SKU34 0,55 0 0 0 0 0 0 0 0 0 0 0 0 0 0 0 0 0 0 0 0
TotalconsumptionGroup1 0 0 0 0 0 0 0 0 0 567 613 700 744 824 861 921 959 998 1053 1112,1TotalconsumptionGroup2 0 0 0 0 0 0 751 967 1076 1130 1202 1294 1352 1426 1489 2123 2243 2341 2444 5332,5TotalconsumptionGroup3 0 0 0 0 0 0 0 0 0 0 0 0 0 0 0 0 0 0 0 0SmallestpossibleorderGroup1 - - - - - - - - - - - - - - - - - - - -SmallestpossibleorderGroup2 - - - - - - - - - - - - - - - - - - - 20SmallestpossibleorderGroup3 - - - - - - - - - - - - - - - - - - - -
Accumulatedrefillvolume(m^3)Volume(cm3) 1 2 3 4 5 6 7 8 9 10 11 12 13 14 15 16 17 18 19 20
SKU11 266 0 0 0 0 0 0 0 0 0 0,27 0,3 0,34 0,36 0,4 0,42 0,45 0,46 0,48 0,51 0,5379SKU12 1870 0 0 0 0 0 0 0 0 0 0 0 0 0 0 0 0 0 0 0 0SKU13 1496 0 0 0 0 0 0 0 0 0 0 0 0 0 0 0 0 0 0 0 0SKU21 1870 0 0 0 0 0 0 0 0 0 0 0 0 0 0 0 0 0 0 0 2,4086SKU22 270 0 0 0 0 0 0 0,37 0,47 0,53 0,55 0,59 0,64 0,66 0,7 0,73 0,77 0,81 0,84 0,87 0,9191SKU23 1750 0 0 0 0 0 0 0 0 0 0 0 0 0 0 0 0 0 0 0 0SKU24 285 0 0 0 0 0 0 0 0 0 0 0 0 0 0 0 0,29 0,31 0,33 0,35 0,3648SKU31 2856 0 0 0 0 0 0 0 0 0 0 0 0 0 0 0 0 0 0 0 0SKU32 285 0 0 0 0 0 0 0 0 0 0 0 0 0 0 0 0 0 0 0 0SKU33 2048 0 0 0 0 0 0 0 0 0 0 0 0 0 0 0 0 0 0 0 0SKU34 266 0 0 0 0 0 0 0 0 0 0 0 0 0 0 0 0 0 0 0 0
Totalvolume 0 0 0 0 0 0 0,37 0,47 0,53 0,83 0,89 0,97 1,02 1,1 1,15 1,5 1,58 1,65 1,73 4,2303
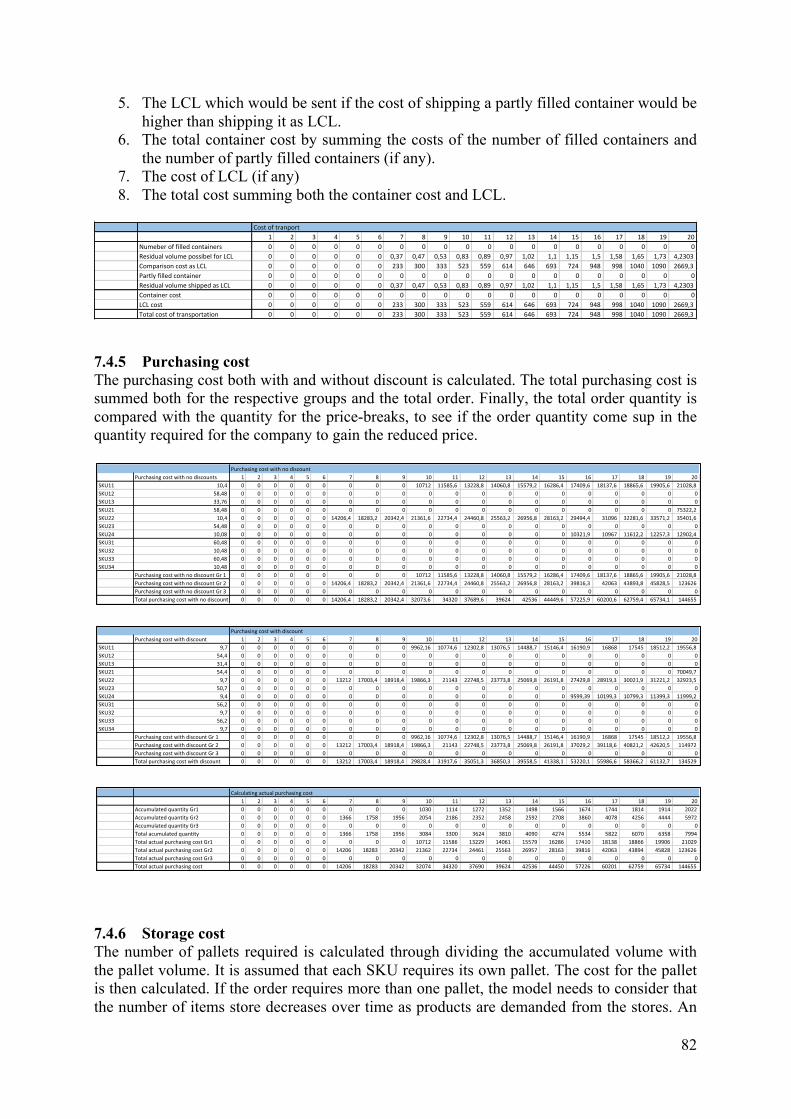
82
5. The LCL which would be sent if the cost of shipping a partly filled container would be higher than shipping it as LCL.
6. The total container cost by summing the costs of the number of filled containers and the number of partly filled containers (if any).
7. The cost of LCL (if any) 8. The total cost summing both the container cost and LCL.
7.4.5 Purchasing cost The purchasing cost both with and without discount is calculated. The total purchasing cost is summed both for the respective groups and the total order. Finally, the total order quantity is compared with the quantity for the price-breaks, to see if the order quantity come sup in the quantity required for the company to gain the reduced price.
7.4.6 Storage cost The number of pallets required is calculated through dividing the accumulated volume with the pallet volume. It is assumed that each SKU requires its own pallet. The cost for the pallet is then calculated. If the order requires more than one pallet, the model needs to consider that the number of items store decreases over time as products are demanded from the stores. An
Costoftranport1 2 3 4 5 6 7 8 9 10 11 12 13 14 15 16 17 18 19 20
Numeberoffilledcontainers 0 0 0 0 0 0 0 0 0 0 0 0 0 0 0 0 0 0 0 0ResidualvolumepossibelforLCL 0 0 0 0 0 0 0,37 0,47 0,53 0,83 0,89 0,97 1,02 1,1 1,15 1,5 1,58 1,65 1,73 4,2303ComparisoncostasLCL 0 0 0 0 0 0 233 300 333 523 559 614 646 693 724 948 998 1040 1090 2669,3Partlyfilledcontainer 0 0 0 0 0 0 0 0 0 0 0 0 0 0 0 0 0 0 0 0ResidualvolumeshippedasLCL 0 0 0 0 0 0 0,37 0,47 0,53 0,83 0,89 0,97 1,02 1,1 1,15 1,5 1,58 1,65 1,73 4,2303Containercost 0 0 0 0 0 0 0 0 0 0 0 0 0 0 0 0 0 0 0 0LCLcost 0 0 0 0 0 0 233 300 333 523 559 614 646 693 724 948 998 1040 1090 2669,3Totalcostoftransportation 0 0 0 0 0 0 233 300 333 523 559 614 646 693 724 948 998 1040 1090 2669,3
PurchasingcostwithnodiscountPurchasingcostwithnodiscounts 1 2 3 4 5 6 7 8 9 10 11 12 13 14 15 16 17 18 19 20
SKU11 10,4 0 0 0 0 0 0 0 0 0 10712 11585,6 13228,8 14060,8 15579,2 16286,4 17409,6 18137,6 18865,6 19905,6 21028,8SKU12 58,48 0 0 0 0 0 0 0 0 0 0 0 0 0 0 0 0 0 0 0 0SKU13 33,76 0 0 0 0 0 0 0 0 0 0 0 0 0 0 0 0 0 0 0 0SKU21 58,48 0 0 0 0 0 0 0 0 0 0 0 0 0 0 0 0 0 0 0 75322,2SKU22 10,4 0 0 0 0 0 0 14206,4 18283,2 20342,4 21361,6 22734,4 24460,8 25563,2 26956,8 28163,2 29494,4 31096 32281,6 33571,2 35401,6SKU23 54,48 0 0 0 0 0 0 0 0 0 0 0 0 0 0 0 0 0 0 0 0SKU24 10,08 0 0 0 0 0 0 0 0 0 0 0 0 0 0 0 10321,9 10967 11612,2 12257,3 12902,4SKU31 60,48 0 0 0 0 0 0 0 0 0 0 0 0 0 0 0 0 0 0 0 0SKU32 10,48 0 0 0 0 0 0 0 0 0 0 0 0 0 0 0 0 0 0 0 0SKU33 60,48 0 0 0 0 0 0 0 0 0 0 0 0 0 0 0 0 0 0 0 0SKU34 10,48 0 0 0 0 0 0 0 0 0 0 0 0 0 0 0 0 0 0 0 0
PurchasingcostwithnodiscountGr1 0 0 0 0 0 0 0 0 0 10712 11585,6 13228,8 14060,8 15579,2 16286,4 17409,6 18137,6 18865,6 19905,6 21028,8PurchasingcostwithnodiscountGr2 0 0 0 0 0 0 14206,4 18283,2 20342,4 21361,6 22734,4 24460,8 25563,2 26956,8 28163,2 39816,3 42063 43893,8 45828,5 123626PurchasingcostwithnodiscountGr3 0 0 0 0 0 0 0 0 0 0 0 0 0 0 0 0 0 0 0 0Totalpurchasingcostwithnodiscount 0 0 0 0 0 0 14206,4 18283,2 20342,4 32073,6 34320 37689,6 39624 42536 44449,6 57225,9 60200,6 62759,4 65734,1 144655
PurchasingcostwithdiscountPurchasingcostwithdiscount 1 2 3 4 5 6 7 8 9 10 11 12 13 14 15 16 17 18 19 20
SKU11 9,7 0 0 0 0 0 0 0 0 0 9962,16 10774,6 12302,8 13076,5 14488,7 15146,4 16190,9 16868 17545 18512,2 19556,8SKU12 54,4 0 0 0 0 0 0 0 0 0 0 0 0 0 0 0 0 0 0 0 0SKU13 31,4 0 0 0 0 0 0 0 0 0 0 0 0 0 0 0 0 0 0 0 0SKU21 54,4 0 0 0 0 0 0 0 0 0 0 0 0 0 0 0 0 0 0 0 70049,7SKU22 9,7 0 0 0 0 0 0 13212 17003,4 18918,4 19866,3 21143 22748,5 23773,8 25069,8 26191,8 27429,8 28919,3 30021,9 31221,2 32923,5SKU23 50,7 0 0 0 0 0 0 0 0 0 0 0 0 0 0 0 0 0 0 0 0SKU24 9,4 0 0 0 0 0 0 0 0 0 0 0 0 0 0 0 9599,39 10199,3 10799,3 11399,3 11999,2SKU31 56,2 0 0 0 0 0 0 0 0 0 0 0 0 0 0 0 0 0 0 0 0SKU32 9,7 0 0 0 0 0 0 0 0 0 0 0 0 0 0 0 0 0 0 0 0SKU33 56,2 0 0 0 0 0 0 0 0 0 0 0 0 0 0 0 0 0 0 0 0SKU34 9,7 0 0 0 0 0 0 0 0 0 0 0 0 0 0 0 0 0 0 0 0
PurchasingcostwithdiscountGr1 0 0 0 0 0 0 0 0 0 9962,16 10774,6 12302,8 13076,5 14488,7 15146,4 16190,9 16868 17545 18512,2 19556,8PurchasingcostwithdiscountGr2 0 0 0 0 0 0 13212 17003,4 18918,4 19866,3 21143 22748,5 23773,8 25069,8 26191,8 37029,2 39118,6 40821,2 42620,5 114972PurchasingcostwithdiscountGr3 0 0 0 0 0 0 0 0 0 0 0 0 0 0 0 0 0 0 0 0Totalpurchasingcostwithdiscount 0 0 0 0 0 0 13212 17003,4 18918,4 29828,4 31917,6 35051,3 36850,3 39558,5 41338,1 53220,1 55986,6 58366,2 61132,7 134529
Calculatingactualpurchasingcost1 2 3 4 5 6 7 8 9 10 11 12 13 14 15 16 17 18 19 20
AccumulatedquantityGr1 0 0 0 0 0 0 0 0 0 1030 1114 1272 1352 1498 1566 1674 1744 1814 1914 2022AccumulatedquantityGr2 0 0 0 0 0 0 1366 1758 1956 2054 2186 2352 2458 2592 2708 3860 4078 4256 4444 5972AccumulatedquantityGr3 0 0 0 0 0 0 0 0 0 0 0 0 0 0 0 0 0 0 0 0Totalacumulatedquantity 0 0 0 0 0 0 1366 1758 1956 3084 3300 3624 3810 4090 4274 5534 5822 6070 6358 7994TotalactualpurchasingcostGr1 0 0 0 0 0 0 0 0 0 10712 11586 13229 14061 15579 16286 17410 18138 18866 19906 21029TotalactualpurchasingcostGr2 0 0 0 0 0 0 14206 18283 20342 21362 22734 24461 25563 26957 28163 39816 42063 43894 45828 123626TotalactualpurchasingcostGr3 0 0 0 0 0 0 0 0 0 0 0 0 0 0 0 0 0 0 0 0Totalactualpurchasingcost 0 0 0 0 0 0 14206 18283 20342 32074 34320 37690 39624 42536 44450 57226 60201 62759 65734 144655

83
order which requires two or more pallets from the beginning, will not require the same number of pallets at the end of the supply period. To consider this, we have assumed a constant demand rate, and that the number of products stored during the period is Q/2 (Akilliouglu, 2015). Finally, the receiving costs are added by calculating how many SKUs there is in the order.
7.4.7 Total cost The total cost is finally calculated by summing the purchasing, transportation and storage costs. Two key figures are calculated: total cost in relation to the sales value, which is suggested by van Weele (2002) and total cost in relation to the number of SKUs in the order.
7.4.8 Order suggestions The order suggestions is then shown for the different time supplies. The cells with an ”-” marks that the SKU has not reached its MOQ. The red marked weeks indicates that the production specific requirement is not fulfilled for the product family. Thus, only orders where the week is green and only SKUs with a number in the cell can be ordered. The first picture shows that, would only SKU11 and SKU21 have been triggered, it would have been possible to lay an order with SKU11, SKU12, SKU21, SKU22 and SKU24 with a time supply
NumberofrequiredpalletsonDCPalletvolume(m^3) 1 2 3 4 5 6 7 8 9 10 11 12 13 14 15 16 17 18 19 20
SKU11 0,8064 0 0 0 0 0 0 0 0 0 1 1 1 1 1 1 1 1 1 1 1SKU12 0 0 0 0 0 0 0 0 0 0 0 0 0 0 0 0 0 0 0 0SKU13 0 0 0 0 0 0 0 0 0 0 0 0 0 0 0 0 0 0 0 0SKU21 0 0 0 0 0 0 0 0 0 0 0 0 0 0 0 0 0 0 0 3SKU22 0 0 0 0 0 0 1 1 1 1 1 1 1 1 1 1 2 2 2 2SKU23 0 0 0 0 0 0 0 0 0 0 0 0 0 0 0 0 0 0 0 0SKU24 0 0 0 0 0 0 0 0 0 0 0 0 0 0 0 1 1 1 1 1SKU31 0 0 0 0 0 0 0 0 0 0 0 0 0 0 0 0 0 0 0 0SKU32 0 0 0 0 0 0 0 0 0 0 0 0 0 0 0 0 0 0 0 0SKU33 0 0 0 0 0 0 0 0 0 0 0 0 0 0 0 0 0 0 0 0SKU34 0 0 0 0 0 0 0 0 0 0 0 0 0 0 0 0 0 0 0 0
Totalnumberofpallets 0 0 0 0 0 0 1 1 1 2 2 2 2 2 2 3 4 4 4 7
StoragecostsPalletcost/week 1 2 3 4 5 6 7 8 9 10 11 12 13 14 15 16 17 18 19 20
SKU11 23,80 0 0 0 0 0 0 0 0 0 238 262 286 309 333 357 381 405 428 452 476SKU12 0 0 0 0 0 0 0 0 0 0 0 0 0 0 0 0 0 0 0 0SKU13 0 0 0 0 0 0 0 0 0 0 0 0 0 0 0 0 0 0 0 0SKU21 0 0 0 0 0 0 0 0 0 0 0 0 0 0 0 0 0 0 0 714SKU22 0 0 0 0 0 0 167 190 214 238 262 286 309 333 357 381 405 428 452 476SKU23 0 0 0 0 0 0 0 0 0 0 0 0 0 0 0 0 0 0 0 0SKU24 0 0 0 0 0 0 0 0 0 0 0 0 0 0 0 381 405 428 452 476SKU31 0 0 0 0 0 0 0 0 0 0 0 0 0 0 0 0 0 0 0 0SKU32 0 0 0 0 0 0 0 0 0 0 0 0 0 0 0 0 0 0 0 0SKU33 0 0 0 0 0 0 0 0 0 0 0 0 0 0 0 0 0 0 0 0SKU34 0 0 0 0 0 0 0 0 0 0 0 0 0 0 0 0 0 0 0 0
Totalstoragecost 0 0 0 0 0 0 167 190 214 476 524 571 619 666 714 1142 1214 1285 1357 2142
NumberofSKUsnotintheorder 11 11 11 11 11 11 10 10 10 9 9 9 9 9 9 8 8 8 8 7NumberofSKUSintheorder 0 0 0 0 0 0 1 1 1 2 2 2 2 2 2 3 3 3 3 4RecivingcostatDC-flow 0 0 0 0 0 0 56,1 56,1 56,1 112,3 112 112 112 112 112 168 168 168 168 224,52Costofpalletplacement 0 0 0 0 0 0 16,5 16,5 16,5 32,98 33 33 33 33 33 49,5 66 66 66 115,43
Totalstoragecostincl.pickshelf 0 0 0 0 0 0 250 286 321 595 655 714 774 833 893 1333 1416 1499 1583 2380TotalstorageandDC-flowcost 0 0 0 0 0 0 323 358 394 740,2 800 859 919 978 1038 1551 1650 1734 1817 2720
Totalcost
Timesupplyperiod(weeks) 5 6 7 8 9 10 11 12 13 14 15Purchasingcost 0 0 14206 18283 20342 32074 34320 37690 39624 42536 44450Costoftransportation 0 0 233 300 333 523 559 614 646 693 724Storagecost 0 0 323 358 394 740 800 859 919 978 1038Totalcost 0 0 14762 18941 21070 33337 35679 39163 41188 44207 46212
KeyfiguresTot.cost/salesvalue 22,05% 21,99% 21,98% 22,06% 22,07% 22,05% 22,06% 22,06% 22,07%Cost/SKU 10,81 10,77 10,77 10,81 10,81 10,81 10,81 10,81 10,81
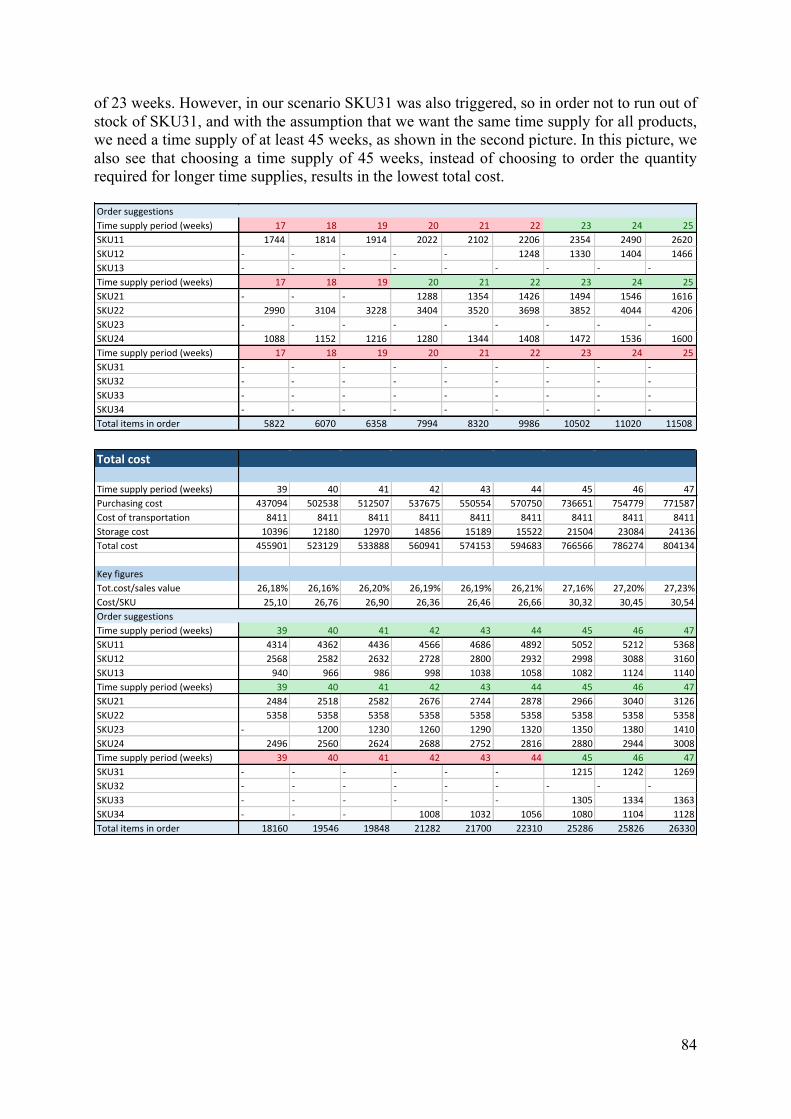
84
of 23 weeks. However, in our scenario SKU31 was also triggered, so in order not to run out of stock of SKU31, and with the assumption that we want the same time supply for all products, we need a time supply of at least 45 weeks, as shown in the second picture. In this picture, we also see that choosing a time supply of 45 weeks, instead of choosing to order the quantity required for longer time supplies, results in the lowest total cost.
Cost/SKU 10,80 10,80 10,80 18,77 18,88 24,08 24,16 24,10 24,10OrdersuggestionsTimesupplyperiod(weeks) 17 18 19 20 21 22 23 24 25SKU11 1744 1814 1914 2022 2102 2206 2354 2490 2620SKU12 - - - - - 1248 1330 1404 1466SKU13 - - - - - - - - -Timesupplyperiod(weeks) 17 18 19 20 21 22 23 24 25SKU21 - - - 1288 1354 1426 1494 1546 1616SKU22 2990 3104 3228 3404 3520 3698 3852 4044 4206SKU23 - - - - - - - - -SKU24 1088 1152 1216 1280 1344 1408 1472 1536 1600Timesupplyperiod(weeks) 17 18 19 20 21 22 23 24 25SKU31 - - - - - - - - -SKU32 - - - - - - - - -SKU33 - - - - - - - - -SKU34 - - - - - - - - -Totalitemsinorder 5822 6070 6358 7994 8320 9986 10502 11020 11508
Totalcost
Timesupplyperiod(weeks) 39 40 41 42 43 44 45 46 47Purchasingcost 437094 502538 512507 537675 550554 570750 736651 754779 771587Costoftransportation 8411 8411 8411 8411 8411 8411 8411 8411 8411Storagecost 10396 12180 12970 14856 15189 15522 21504 23084 24136Totalcost 455901 523129 533888 560941 574153 594683 766566 786274 804134
KeyfiguresTot.cost/salesvalue 26,18% 26,16% 26,20% 26,19% 26,19% 26,21% 27,16% 27,20% 27,23%Cost/SKU 25,10 26,76 26,90 26,36 26,46 26,66 30,32 30,45 30,54OrdersuggestionsTimesupplyperiod(weeks) 39 40 41 42 43 44 45 46 47SKU11 4314 4362 4436 4566 4686 4892 5052 5212 5368SKU12 2568 2582 2632 2728 2800 2932 2998 3088 3160SKU13 940 966 986 998 1038 1058 1082 1124 1140Timesupplyperiod(weeks) 39 40 41 42 43 44 45 46 47SKU21 2484 2518 2582 2676 2744 2878 2966 3040 3126SKU22 5358 5358 5358 5358 5358 5358 5358 5358 5358SKU23 - 1200 1230 1260 1290 1320 1350 1380 1410SKU24 2496 2560 2624 2688 2752 2816 2880 2944 3008Timesupplyperiod(weeks) 39 40 41 42 43 44 45 46 47SKU31 - - - - - - 1215 1242 1269SKU32 - - - - - - - - -SKU33 - - - - - - 1305 1334 1363SKU34 - - - 1008 1032 1056 1080 1104 1128Totalitemsinorder 18160 19546 19848 21282 21700 22310 25286 25826 26330