Embed Size (px)
DESCRIPTION
i
Citation preview
Erasmus University RotterdamErasmus School of EconomicsSubdepartment Accounting Auditing and ControlMaster Thesis (FEM11032)Supervisor: E.A. de Knecht RACo-reader: Dr. sc. ind. A.H. van der BoomFinal draft submitted on September 19th, 2011
Income Smoothing Across EuropeThe Informativeness Explored
Thomas van den Assem

Abstract
This research studies if the use of income smoothing improves the earnings informativeness.
Tucker and Zarowin (2006) performed a similar research for a research data sample of US listed
companies. Consequently, this research studies if the use of income smoothing by European listed
companies influences the earnings informativeness. This research shows that the use of income
smoothing does not improve the earnings informativeness. The best predictive variable for the
future earnings per share is the current earnings per share. The use of income smoothing does not
negatively influence the earnings informativeness, but no significant evidence is obtained that the
use of income smoothing actually improves the earnings informativeness. Consequently, this
research does not contradict the evidence presented by Tucker and Zarowin (2006), however no
significant research results were obtained to support the conclusions of Tucker and Zarowin.
1
Index
1. Introduction...................................................................................................................................2
1.1 Research Setting.....................................................................................................................2
1.2 Research Objectives...............................................................................................................2
1.3 Research Question..................................................................................................................2
1.4 Research Methodology...........................................................................................................2
1.5 Research Limitations..............................................................................................................2
1.6 Structure.................................................................................................................................2
2. Financial Accounting Theory and the Value of Information........................................................2
2.1 Introduction............................................................................................................................2
2.2 Financial Accounting research...............................................................................................2
2.3 The Positive Accounting Theory............................................................................................2
2.4 Agency Theory.......................................................................................................................2
2.5 Efficient Market Hypothesis..................................................................................................2
2.6 Stakeholder Theory................................................................................................................2
2.7 The Purpose of Financial Accounting....................................................................................2
2.8 Summary................................................................................................................................2
3. Income Smoothing........................................................................................................................2
3.1 Introduction............................................................................................................................2
3.2 Earnings Management............................................................................................................2
3.3 Types of Earnings Management.............................................................................................2
3.4 Income Smoothing.................................................................................................................2
3.5 Types of Smooth Income Streams..........................................................................................2
3.6 The Advantages and Disadvantages of Income Smoothing...................................................2
3.7 Motives for Income Smoothing..............................................................................................2
3.8 Smoothing Elements...............................................................................................................2
3.9 Measuring Income Smoothing...............................................................................................2
3.10 Summary..............................................................................................................................2
4. Informativeness.............................................................................................................................2
4.1 Introduction............................................................................................................................2
4.2 Definition of Informativeness................................................................................................2
4.3 Informativeness of Financial Data..........................................................................................2
4.4 Informativeness and Efficient Markets..................................................................................2
2
4.5 Decision Usefulness and Value Relevance............................................................................2
4.6 Measuring Informativeness....................................................................................................2
4.7 Summary................................................................................................................................2
5. Prior Empirical Research..............................................................................................................2
5.1 Introduction............................................................................................................................2
5.2 Empirical Research on Earnings Management.......................................................................2
5.2.1 Earnings Management and Stock Option Plans..............................................................2
5.2.2 Income Maximization.....................................................................................................2
5.2.3 Earnings Management and Debt Covenants...................................................................2
5.2.4 Earnings Management and Minimization of Taxes........................................................2
5.3 Income Smoothing and Country Studies................................................................................2
5.3.1 Income Smoothing in Finland.........................................................................................2
5.3.2 Income Smoothing in Singapore.....................................................................................2
5.3.3. Income Smoothing in Japan...........................................................................................2
5.4 Income Smoothing and Company Characteristics.................................................................2
5.4.1 Differences in Core and Periphery Sectors.....................................................................2
5.4.2 Differences in Core and Periphery Sectors Part 2...........................................................2
5.4.3 Differences in Ownership of Companies........................................................................2
5.5 Income Smoothing and the Value of the Company................................................................2
5.5.1 Market Valuation of Income Smoothing........................................................................2
5.5.2 Market Valuation of Income Smoothing Part 2..............................................................2
5.5.3 Market Valuation of Income Smoothing Part 3..............................................................2
5.5.4 Income Smoothing, Earnings Quality and Firm Valuation.............................................2
5.6 Income Smoothing and Expected Earnings............................................................................2
5.6.1. Smoothing in Anticipation of Future Earnings..............................................................2
5.6.2 Smoothing in Anticipation of Future Earnings Part 2.....................................................2
5.7 The Informativeness Methodology........................................................................................2
5.7.1 Pricing Discretionary Accruals.......................................................................................2
5.7.2 Income Smoothing and Equity Value.............................................................................2
5.7.3 Income Smoothing and Stock Price Informativeness.....................................................2
5.7.4 Income Smoothing and Earnings Informativeness.........................................................2
5.8 Research Hypotheses..............................................................................................................2
5.9 Summary................................................................................................................................2
6. Research Design...........................................................................................................................2
3
6.1 Introduction............................................................................................................................2
6.2 Empirical Research Process...................................................................................................2
6.3 Research Theory.....................................................................................................................2
6.4 Method to Measure Income Smoothing.................................................................................2
6.5 Method to Measure Informativeness......................................................................................2
6.6 Primary Model........................................................................................................................2
6.7 Additional Prescriptive Variable............................................................................................2
6.8 Data Sample............................................................................................................................2
6.9 Summary................................................................................................................................2
7. Research Results...........................................................................................................................2
7.1 Introduction............................................................................................................................2
7.2 Data Analysis Process............................................................................................................2
7.3 European Smoothers and Non-Smoothers.............................................................................2
7.4 European Income Smoothing Informativeness......................................................................2
7.4.1 Correlation of Earnings per Share.......................................................................................2
7.4.2 Testing the Primary Model..................................................................................................2
7.5 Adjusting for Economic Sector..............................................................................................2
7.6 Summary................................................................................................................................2
8. Conclusion....................................................................................................................................2
8.1 Introduction............................................................................................................................2
8.2 Summary................................................................................................................................2
8.2 Conclusion..............................................................................................................................2
8.3 Empirical Research Limitations.............................................................................................2
8.4 Recommendation for Future Research...................................................................................2
References.........................................................................................................................................2
Appendix 1: Overview of Prior Empirical Research........................................................................2
Appendix 2: Empirical Research Data..............................................................................................2
4
1. Introduction
1.1 Research Setting
The process qualified as financial accounting records all financial transactions performed by
companies. One of the outputs of the process of financial accounting is the financial statements.
By the use of financial reporting management is able to communicate the financial information
and the earnings of the company to the users of the financial statements. The financial reporting
can have many forms such as financial statements or quarterly earning reports. The users of the
financial statements or stakeholders of the company are several parties inside or outside the
company. Without the financial reporting of the company, the stakeholders would not be able to
obtain the information. Consequently, the financial reporting is used by the stakeholders as
information that is the basis for many economic decisions.
Because financial reporting is considered to be critical for the economic decision process of the
stakeholders, several regulatory bodies globally regulate the financial reporting, such as the
International Accounting Standard Board (IASB) and the Financial Accounting Standard Board
(FASB). These regulatory bodies have introduced accounting standards and principles to
standardize the financial reporting. However, the current accounting standards and principles
require the judgment of management to prepare the financial reporting. Consequently, while
preparing the financial reporting this flexibility in financial reporting enables management to
make subjective decisions. A part of these subjective decisions is the valuation of several assets
and liabilities and in addition, it provides management with choices what to disclose and what not
to disclose about these assets and liabilities. Consequently, the management has the opportunity
to manage the financial statements of the company. By acting this way, management is not
reporting the actual financial figures and the earnings of the company. Within financial
accounting research, this practice by management is qualified as earnings management.
For many years, the use of earnings management has been a hot topic in financial accounting
research. Earnings management has been defined as the attempts by management either to
mislead some stakeholders about the underlying economic performance of the company or to
influence contractual outcomes that depend on reported accounting numbers by the use of
judgment in financial reporting and in structuring transactions to alter financial reports (Healy
and Wahlen, 1999).
According to Scott (2006) four main patterns exist, or the so-called policies (Hoogendoorn, 2004)
of earnings management. These are taking a bath, income minimization, income maximization,
5
and income smoothing. Within the financial accounting research topic of earnings management,
researchers have always been very interested in studying income smoothing. Bao and Bao (2004)
stated that in general the study of income smoothing has been very successful compared to the
study of other forms of the use of earnings management. This success is due to a couple of
reasons. First of all, researchers have been able to define income smoothing more precisely than
other forms of earnings management. One generally accepted definition of income smoothing is
“an attempt by managers to manipulate income numbers so as to impart to the resulting series a
desirable and smooth trend” (Ronen and Sadan, 1981). This implies that in periods of high
earnings, management to a certain level will minimize the earnings and in periods of low earnings
bump up the earnings of the company. This results in a smooth stream of income over the
periods, which is preferred by both management and the investors. Secondly, researchers have
accomplished to make a clear differentiation between smoothers and non-smoothers. This implies
that several tests exist that can successfully measure whether or not the management of a
company practices income smoothing. Several forms of income smoothing exist. Management
can either transfer revenue from one period to another period by the use of accounting methods,
or engage in actual economic transactions. Income smoothing is the focus of this Master research.
Management can have multiple motives for smoothing the income of the company. As was stated
before, both management and investors prefer companies that report smooth streams of income.
However, the use of earnings management causes management to report manipulated financial
reporting instead of the actual financial performance of the company; income smoothing
generally is considered as garbling behavior by management and would therefore only decrease
the informativeness of the earnings. Informativeness is the information value of the current and
the past earnings about the future earnings and the cash flows of the company (Tucker and
Zarowin, 2006). As the investors and other stakeholders would consequently base their decisions
on manipulated financial reporting, prior financial accounting research has mainly focused on
income smoothing being a bad and unethical practice of management.
However, some financial accounting research takes a different view on income smoothing and
even concludes that a positive side exists of this type of earnings management. One of the more
recent approaches to research income smoothing is presented by Tucker and Zarowin (2006).
This article presents the use of income smoothing as not being necessarily bad. By examining if
the use of income smoothing improves, the earnings informativeness Tucker and Zarowin shed a
new light on the discussion of the positive and the negative effects of the use of income
smoothing. They actually found for a US data sample that not only do companies practice income
smoothing, but the use of income smoothing does in addition improves the informativeness of
6
earnings. If income smoothing is the result of management’s discretion to communicate their
forecast about future earnings, then income smoothing will therefore increase earnings
informativeness. This is quite similar to what has been stated by Ronen and Sadan (1981) that
income smoothing can be qualified as a signaling technique used by management to signal about
future earning. Additionally, prior empirical financial accounting research performed by
Subramanyam (1996), Hunt, Moyer, and Shevlin (2000), Zarowin (2002), and Tucker and
Zarowin (2006) adopted the informativeness approach to study the use of income smoothing.
These studies observed that income smoothing improves the earnings informativeness of
companies. Consequently, based on this view income smoothing is preferable not only by
management but also by stakeholders of the companies. Consequently, this research studies if the
use of income smoothing increases or decreases the informativeness of earnings for a European
research data sample. This will be the research topic of this Master research.
1.2 Research Objectives
The objective of this Master research is to study the influence of the use of income smoothing on
the informativeness of the earnings. This Master research will not focus on other influences of the
use of income smoothing (additionally see section 1.5). As Tucker and Zarowin (2006) have
performed a similar research, their research design will be the foundation for the empirical
research design of this Master research. As the research performed by Tucker and Zarowin is
based on a research data sample of American listed companies, academic research data is not yet
available on what the impact of income smoothing will be on the earnings informativeness of
European companies. Consequently, it is interesting to perform a research that tests the influence
of the use of income smoothing on the earnings informativeness for European companies.
By performing this research on a research data sample of European companies, this research will
contribute to academic research performed on the use of income smoothing that has applied the
informativeness approach. Consequently, the research results of this research on the influence of
the use of income smoothing on the earnings informativeness are of interest to other academic
researchers, global regulators and the users of the financial statements. Especially because prior
research has mostly commented on the negative characteristics of income smoothing, this
research can contribute to research that has approached the use of income smoothing as positive.
Global regulators share the opinion that the flexibility in financial accounting standards that
allows for the use of income smoothing should be limited. However, if income smoothing
improves the informativeness of the earnings, the users of the financial statements are benefited
by the use of income smoothing. Consequently, it is interesting to perform this research.
7
1.3 Research Question
As the study of this Master research is more or less the same as that of Tucker and Zarowin
(2006) the research question is formulated as:
“Does the Use of Income Smoothing Improve the Earnings Informativeness?”
To be able to conduct the research and find an answer to the research question, the following sub-
research questions need to be addressed:
- What is the theory behind use and value of financial information?
- What is the content of the term income smoothing?
- What is the content of the term earnings informativeness?
- What are the results of prior research concerning the use of income smoothing?
- What is the relation between the use of income smoothing and the earnings
informativeness?
1.4 Research Methodology
The research methodology applied in this Master research consists of combination of a literature
study and an empirical research. A compact overview of the research methodology applied in this
Master research is consequently presented. As stated in the section before, several sub-research
questions need to be answered before the main research question can be addressed. Consequently,
a literature study will be performed to address the theory of the use and value of information, the
content of the terms income smoothing and earnings informativeness. In addition, the study of
prior empirical research will be used as a basis to form the hypotheses for the research performed
in this Master research.
Once the literature study and the study of prior empirical research have been performed, the
research design will be described to be able to answer the main research question, if the use of
income smoothing improves the earnings informativeness. To answer the main research question,
the research must first perform another important test to identify the companies in the research
data sample as smoothers and non-smoothers. To determine if a company qualifies as a smoother
or a non-smoother, two main research models are used in prior empirical research. The first
model is the (modified) Jones model as applied by Kothari et al (2005) amongst others. The
(modified) Jones model is a popular method to measure the use of income smoothing by
measuring the discretionary accruals applied by the management of the company. The second
8
model is the income variability model of as applied by amongst others Albrecht and Richardson
(1990). This method measures income smoothing by dividing the coefficient of variation of one
period change in income by the coefficient of one period change in sales (Albrecht and
Richardson, 1990). This research will apply the income variability model to measure the use of
income smoothing.
After this model has been applied on the research data sample, the companies in the research data
sample will need to be ranked by the degree of the use of income smoothing to ultimately use this
in the model of Tucker and Zarowin (2006), so that the informativeness of income smoothing can
be measured. Concerning the ranking, both the smoothers and the non-smoothers are placed on a
scale from 0 to 1. After this has been performed, the main research question will be answered. To
research whether income smoothing improves earnings informativeness, the model of Collins et
al. (1994) is applied. First, to test if the current year earnings per share possess information value
about the future year earnings per share, the correlation between the two is tested. Second, to test
the informativeness of earnings Collins et al. (1994) use the Future Earnings Response
Coefficient (FERC). If the use of income smoothing does in fact improve the earnings
informativeness, the FERC should be higher if the management of companies practices a higher
level of income smoothing. If income smoothing reduces the information about the future
earnings, the companies with a high level of income smoothing should have a low FERC.
The primary research model is tested a second time including a control variable. The control
variable added to the primary model is a variable for economic sectors. Consequently, this
research tests if the informativeness of the earnings differs in specific economic sectors and if the
use of income smoothing increases the earnings informativeness different is specific economic
sectors.
The European countries for which this Master research is performed will be limited to the
Netherlands, the United Kingdom, Germany, France, and Italy. The research data sample of
European companies will only consist of listed companies of the main national indexes for which
the required research information is available in the Thomson One Banker 2011 database. The
research period of this Master research will be 2003 to 2010. In addition, data before 2003 is used
to calculate the income smoothing measure, but this period is not used for the primary test. This
data of previous years is needed to measure income smoothing in year 2003 in accordance with
the income variability method.
As the financial crisis that started in 2008 is included in the research period, a sensitivity analysis
is performed if the financial crisis influences the research results. It could be that due to the
9
financial crisis, the management of the companies has been unable to continue to apply the use of
income smoothing, or that the model applied to measure the use of income smoothing is affected.
1.5 Research Limitations
This section will comment on a couple of limitations of this Master research. Although this
research is feasible due to the use of the proven research methods and the data availability, this
research on the influence of the use of income smoothing on the earnings informativeness is
subject to several limitations.
This research only comments on the influence of the use of income smoothing on the earnings
informativeness. Consequently, the possible negative or positive effects of other research
variables on the earnings informativeness are not investigated in this Master research.
Additionally, this research applies one control variable to test the primary research model. The
primary research model is adjusted for economic sectors by the use of the control variable. Many
more control variables exist that could have a potential influence on the use of income smoothing.
In addition, certain limitations to the models applied in this research exist. Although the models
applied to classify companies as smoothers or non-smoothers are widely used models in financial
accounting research on the use of income smoothing, the models applied remain methods that
only provide an indication of the use of income smoothing. Therefore, it is very well possible that
according to one model a company is classified as a smoother or a non-smoother, while in fact
this is not true.
Furthermore, this research only focuses on one possible characteristic of income smoothing,
namely an increase in the earnings informativeness. Consequently, the possibility exists that the
use of income smoothing has also other effects on the financial statements and performance
measures of a company. As was stated in section 1.1, prior research has focused on the negative
effects of income smoothing on the financial statements. These other possible elements are not
included in this research.
As the model of Collins et al. (1994) is used, the informativeness of earnings is measured by
earnings per share. Of course, other methods exist to measure the economic performance of
companies, which may create different results. Other models could be applied to measure the
informativeness of the earnings.
Additional, this research is based on the efficient market hypothesis (see section 2.5). If this
hypothesis does not hold, it could influence the results of this research. The efficient market
hypothesis states that all information is available to a certain level to the market participants.
10
Finally, the research data sample only consists of European listed companies. No specific
economic sectors are excluded from the research data sample. Consequently, it is possible that a
research data sample that excludes specific economic sectors and or includes non-listed
companies will present a different research result. This also applies for the variables selected to
perform the empirical research. This research uses the net income of the companies in the
research data sample as the smoothing object. However other smoothing objects can be selected
that may influence the research results.
1.6 Structure
As this chapter has introduced this Master research, this section of the introduction will present a
short overview of the structure of the Master research.
The second chapter will comment on the use and the value of information. The basis for the
second chapter is the positive accounting theory. Several economic theories such as the agency
theory, the efficient market hypothesis, and the stakeholder theory will be introduced in the
second chapter.
The third chapter will start to describe the use of earnings management in general. This chapter
presents an overview of the types of earnings management and an overview of the different
elements of earnings management. The third chapter will ultimately focus on the content of the
term income smoothing; the definition of income smoothing, the types of smooth income streams,
the motives of the management for the use of income smoothing and the methods to measure the
use of income smoothing are commented on.
The fourth chapter provides an insight in the content of the term earnings informativeness.
Included is an overview of prior research on earnings informativeness and a method to measure
the earnings informativeness.
The fifth chapter will discuss prior empirical research on the use of earnings management, the use
of income smoothing, and on the relation between the use of income smoothing and the earnings
informativeness. This chapter will in addition include the research hypotheses.
The sixth chapter will describe the research design. The research design will include the methods
to measure the use of income smoothing and the method to measure the earnings informativeness.
Additionally, the primary model of this research and the research data sample are commented on
in the sixth chapter.
The seventh chapter contains the research performed and the empirical research results. A data
analysis of the research results will be commented on in the seventh chapter.
11
The eighth chapter will provide the summary, research conclusion, and the recommendations for
future research.
12
2. Financial Accounting Theory and the Value of Information
2.1 Introduction
Financial accounting has been a hot topic for economic research. Over the years there have been
many directions of financial accounting research. These are: normative accounting research,
market based accounting research, positive accounting research and behavioral accounting
research. This chapter will first provide a brief overview of these types of financial accounting
research. Chapter 2 of this Master research will focus on the topic of positive accounting theory
(PAT). In addition, other positive economic theories such as the efficient market hypothesis
(EMH), the agency theory, and the stakeholder theory are described in this chapter. Furthermore
this chapter will comment on the use and purpose of financial accounting.
2.2 Financial Accounting research
As is stated in the introduction section of this chapter, in financial accounting research different
directions of research exist. The four main directions of financial accounting research as
described by Deegan (2000) are the following.
1. Normative accounting research.
This type of financial accounting research focuses on how financial accounting should be
performed in certain situations or during certain changes in conditions. Normative accounting
research therefore always prefers a specific method of financial accounting and will prescribe this
method.
2. Market based accounting research.
This type of financial accounting research studies the relation of accounting and other financial
information and the capital markets (Deegan, 2000). This kind of research uses statistical
relations that exist between on one hand the capital markets, stock prices and profits on stocks
and on the other hand disclosed financial information. Consequently, market based accounting
research tries to determine the impact of newly disclosed information on the capital markets.
Capital market research is based on the fact that markets are information efficient. This is further
discussed in section 2.5.
3. Behavioral accounting theory.
This type of financial accounting research is comparable with market based accounting research.
Where (capital) market based accounting research tries to determine the impact of newly
disclosed information on the capital markets, behavioral accounting research tries to determine
13
the impact of newly disclosed information on the individuals (stakeholders of a company). For
example, behavioral accounting research will try to predict the behavior of management to meet
performance benchmarks set by analysts.
4. Positive accounting theory.
The term positive in positive accounting theory can be made clear by the following description of
economic science. Because it tries to predict and explain the consequences of changes in
circumstances based on tentatively accepted generalizations, as is stated by Milton Friedman
(1953); economics is a positive science. As the PAT and several other positive economic theories
are the basis for this Master research, the PAT is described in detail in section 2.3.
Next to these 4 main directions of financial accounting research, some research focuses on case
studies. For example, these studies focus on earnings management within specific companies,
such as Enron and Ahold.
2.3 The Positive Accounting Theory
This section of the second chapter will comment on the positive accounting theory (PAT). To
realize a clear understanding of the content of the PAT, a differentiation is necessary between
positive and normative accounting theories. In contrast to positive research, normative research
does not try to explain and predict, but instead tries to prescribe. Consequently, a positive theory
is a theory that tries to predict and explain a certain condition and a normative theory is a theory
that prescribes a certain condition or provides a judgment about a certain condition.
One of the most popular positive theories of accounting is the PAT. The PAT was introduced by
Watts and Zimmerman (1978). The PAT developed by Watts and Zimmerman is designed to
explore which elements will influence management’s opinion on accounting standards. These
elements will also have an influence on the lobbying behavior of management. The basis for
these elements, that influence management behavior, is that management will act in a way to
maximize their own wealth. The wealth of management is related to their expected income of
future periods. Consequently, the PAT assumes that the lobbying behavior of the management
related to accounting standards is based on the self-interest of the management. The self-interest
of management is expected to be congruent with the interest of the shareholders of the company.
The management is expected to lobby for accounting standards that increases either the
management’s compensation plans or the share price of the company. Watts and Zimmerman
(1978) identify five elements that can influence the wealth of management. First, taxes influence
management wealth through company profit related compensation plans. Management is
therefore expected to lobby for a lower level of taxes to increase the profits of the company and
14
increase their own wealth. Second, regulation is an element that influences the management’s
wealth. For example, regulation related to the rating of the company. Management is expected to
lobby for regulation that increases the rating of the company. Third, political costs can influence
the wealth of the management, because the political sector has an influence on the compensations
paid to the management by the company. Especially since the credit crunch of 2008 much
political and media attention exists for high paid management of companies. Consequently, the
management will try to avoid this attention by the use of social responsibility campaigns and by
lowering the reported earnings. Fourth, information production can influence the wealth of the
management. Information production is related to drafting the financial statements. Management
is expected to lobby for accounting standards that decrease the level of disclosures, because this
decreases the costs related to information production. The fifth element that influences
management’s wealth is compensations plans. Management is expected to lobby for accounting
standards that increase the reporting earnings of the company and that consequently increase the
bonuses of the management. However, if management has stock options of the company, it will
select accounting standards that allow for an increase in bonuses without affecting the value of
the company and the stock options. Watts and Zimmerman (1978) have consequently identified
several elements that provide incentives for management to lobby for and select certain
accounting standards. Because the management who drafts the financial statements is involved in
the process of creating financial accounting standards by the use of lobbying, they can have an
influence on the final version of the standards. Some parties involved in the political process will
have a greater power on the process than others and additionally compromises are part of the
process. This process of developing financial accounting standards is consequently qualified as a
non-democratic political process (Deegan, 2000). This can have its consequences for the true and
fair view of the financial statements prepared based on the reporting requirements of the financial
accounting standards. The predictive power to explain why management of companies will lobby
for and select certain accounting standards is the core of the PAT.
In 1990 Watts and Zimmerman published a follow-up paper to their 1978 paper. This paper
reflects on the economic research debate that was initiated by the introduction of the PAT by
Watts and Zimmerman in 1978. In this paper, Watts and Zimmerman conclude that since their
introduction of the PAT some misconceptions about the methodology used in positive financial
accounting research exist. Consequently, Watts and Zimmerman suggest that financial accounting
research should focus more on the link between theory and empirical research. Watts and
Zimmerman note that most positive accounting research has focused on three hypotheses. These
are the test of debt, bonus, and political cost hypotheses (Watts and Zimmerman, 1990). These
15
three hypotheses have been popular due to opportunistic behavior of management. Additionally,
it is important to distinguish between these three hypotheses, because these are the equivalents of
the three main motives for management to apply earnings management (see section 3.7).
Although these three hypotheses only represent limited exploration for empirical phenomena’s
and the explanations for these phenomena’s, the three hypotheses identified by Watts and
Zimmerman (1990) are briefly commented on.
The bonus plan hypothesis is related to the incentives schemes of the management. The
hypothesis states that the management is expected to select an accounting standard that increases
the current period earnings of the company, if the company has an incentive scheme in place for
the management. The selected accounting standard by the management will likely increase the
bonus of the management, because the company does not change its incentive scheme for the
management. However, this implies that the management will always have an incentive to select
an accounting standard to increase current period earnings. This is not always true. For example,
when the current period earnings are far below the threshold for the management to receive its
bonus, management may also select an accounting standard that significantly decreases current
period earnings and therefore increases future period’s earnings (see additionally chapter 3). This
method or policy is called big bath accounting. Because this research only focuses on income
smoothing, no further academic research on big bath accounting is provided. However, a short
description of big bath accounting is provided in chapter 3. Consequently, to test the bonus plan
hypothesis, it is essential to understand the incentive schemes of the management (Watts and
Zimmerman, 1990).
The debt hypothesis is related to the credit facilities obtained by the company on the capital
markets. The hypothesis states that the debt / equity ratio of a company will influence
management’s choice of accounting standard. The debt /equity ratio is also referred to as the
leverage of the company. If the leverage of the company increases, the management will prefer to
select an accounting standard that increases current period earnings. This is due to the fact that if
the leverage increases, the company is more likely to approach a potential breach in the
contractual restrictions of the debt covenant. As the management does not want to breach these
debt covenants, it will select an accounting standard that increases current period earnings and
consequently in addition the equity of the company. As the company will incur costs if it
breaches its debt covenants, management will try to use discretion over the financial figures to
influence the leverage of the company and avoid any costs related to breaching the debt covenant
(Watts and Zimmerman, 1990).
16
The political cost hypothesis is related to the attention that the company receives from outside
parties such as environmental groups and competitors. The hypothesis states that relative large
companies, in contrast to small companies, are expected to select accounting standards that
decrease the earnings of the company. This hypothesis implies that the size of the company and
the level of the earnings are considered to be proxies for political or public attention. The basis
for the political cost hypothesis is that for the users of the financial statements it is expensive to
obtain information about if the accounting earnings of the company are the actual underlying
economic earnings. Additionally it is expensive for the users of the financial statements to
cooperate with other users in the political arena to implement rules and regulations that increase
their economic wealth. Just as in the market process, in the political process the users of the
financial statements are not fully informed. Given the fact that the users of the financial
statements incur monitoring costs to obtain information and therefore monitor only the largest
companies, management will select accounting standards that decrease the earnings of the
company, to get as little attention as possible (Watts and Zimmerman, 1990).
Fields et al. (2001) also recognize these three categories of financial accounting hypotheses that
academic research has focused on. This selection of accounting standards based on the interest of
the management can have an influence on the true and fair view of the financial statements of the
company.
Furthermore, Watts and Zimmerman (1990) note that a contribution of the PAT to financial
accounting research has been the focus on contracting cost. With respect to the three hypotheses
described before, contracting cost can be information cost, agency cost, bankruptcy cost, and
lobbying costs. Agency costs will further be commented on in section 2.4. The term contracting
costs was originally introduced to economic theory by Coase in 1937 and has always played an
important role in the economic theory. However, the introduction of the PAT showed the
importance of transaction cost for financial accounting research. Before the introduction of the
PAT, financial accounting theory assumed that information was costless.
The three hypotheses of the PAT presented before are part of the opportunistic version of the
PAT. In this version, management will mostly act in their own interest to increase their own
wealth. Besides the opportunistic version of the PAT, the efficient version of the PAT exists. The
efficient version of the PAT argues that good incentive schemes, corporate governance, and good
control systems will motivate the management of the company to act in the best interest of the
company. In the majority of the cases, both versions of the PAT make similar predictions (Scott,
2006).
17
Because the agency theory, the efficient market hypothesis, and the stakeholder theory are
essential elements in the academic history of the positive financial accounting research, these
theories are presented in the following sections.
2.4 Agency Theory
In a situation where the management is also the owner of the company, costs related to
opportunistic behavior by the management will in addition be incurred by the management.
However, in a situation in which a separation exists between management and the ownership of a
company, the opportunistic behavior of management will have an impact on the wealth of the
party that owns the company. This is the basis for the agency theory. Most financial accounting
research of the agency theory has been normative research. However, in 1976 Jensen and
Meckling introduced a positive accounting research approach for the agency theory. Jensen and
Meckling (1976) define the agency theory as a situation in which a party (the agent) is engaged
by another party (the principal) to perform services on behalf of the principal, which involves the
delegation of decision-making authority to the agent. In this scenario, the assumption that the
actions of individuals are driven by self-interest is applied. Consequently, both the agent and the
principal will try to maximize their own wealth. It is very likely that if the agent will try to
maximize its own wealth, he or she will not act in the best interest of the principal (Jensen and
Meckling, 1976). This decrease in the wealth of the principal is referred to as agency costs.
The principal will consequently take action to limit the actions of the agent that will decrease the
wealth of the principal. Two types of actions the principal can take exist (Jensen and Meckling,
1976), one is preventive, and the other is detective.
The preventive action that the principal can take is to adjust the reward structure of the agent by
the use of a contract with the agent. The costs related to drafting such a contract are considered to
be agency costs. The principal can lower the salary of the agent to compensate for the
opportunistic behavior of the manager or the principal can create an incentive scheme for the
agent. By creating an incentive scheme, the principal will try to align his or her own interest with
those of the agent. As was described in section 2.3, these incentive schemes can cause the
manager the select certain accounting standards to increase the current period earnings of the
company.
The detective action that the principal can take is to put monitoring mechanisms into place. The
costs of these monitoring mechanisms can additionally be defined as agency costs or monitoring
costs. These monitoring mechanisms will act as controls for the principal to check whether the
agent is not behaving opportunistic. The principal will demand from the management to draft the
18
financial statements. One example of a detective action that the principal can take is the
contracting of external auditors. The auditors will test the financial statements for material
mistakes. These mistakes can be based on opportunistic behavior of management. If the auditor
detects such a material mistake, the management of the company needs to correct the mistake or
the auditor will provide a qualified opinion. In most situations, the principal will take both
preventive and detective actions. The principal will contractual commit to the agent by the use of
an incentive scheme and will monitor whether the agent is acting in conformity with the
contractual agreement.
2.5 Efficient Market Hypothesis
The efficient market hypothesis (EHM) was first introduced by Roberts (1967) and states that in
an information efficient market, the stock prices of companies will reflect all relevant available
information for that company. This hypothesis implies that if the stock prices of companies
reflect all relevant available information, financial resources will efficiently be allocated. In
addition, the hypothesis implies that as soon as new relevant information becomes available, this
will directly be incorporated in the stock price. Consequently, the quicker the new information is
reflected by the stock prices, the more efficient a market is operating. Furthermore, the hypothesis
implies that if stock prices and therefore stock markets reflect all relevant available information,
it is impossible for an individual to outperform the market (Aalst et al. 1997). If an individual
party is able to outperform the market, this would imply that that market is information
inefficient.
In 1970, Fama introduced a new approach to the EMH. He recognized three forms of information
efficient markets. These are:
1. The weak form of EMH.
The hypothesis of the weak form of EMH states that historical stock price information cannot
predict future stock price returns. Therefore, investments strategies based on historic stock price
data will not enable an individual party to outperform the market. Because all historic information
is included in the current stock prices, it is useless for an individual party to base his investment
strategy on the historic data.
2. The semi strong form of EMH.
The hypothesis of the semi strong form of the EMH states that all publicly available information
is quickly incorporated by stock prices. Therefore the hypothesis implies that all publicly
available information is reflected by the stock prices. The stock market is expected to react to the
new information as soon as it becomes available. Consequently, investment strategies based on
19
news available in newspapers and on the internet in addition are not able to outperform the
market, because the market prices already reflect all available information. Additionally,
investment strategies based on financial reports are not able to outperform the market.
3. The strong form of EMH.
The hypothesis of the strong form of the EMH states that all relevant available information,
public and non-public, will efficiently be reflected by the stock prices. The strong form of the
EHM implies an information efficient market; the stock prices will also reflect ‘insider
information’. If the strong form of EHM is applicable, it is impossible for all parties to
outperform the market.
As is stated by Aalst et al. (1997), the three forms of EMH are independent of each other. This
implies that for the semi strong form of the EMH to exist, in addition the weak for of the EMH
must exist. This is due to the fact that historical information is part of publicly available
information. Therefore, for the strong form of the EMH to exist, both the weak form and the semi
form of the EMH must also exist.
After the introduction of the three forms of the EMH by Fama in 1970, the theory of Fama has
received comments. Consequently, Fama published a new paper in 1991 that included a new
categorization for the three forms of the EMH. The weak form is replaced with ‘prediction of
returns’, the semi strong form is replaced with ‘event studies’ and the strong form is replaced
with ‘private information’.
For research performed to test the existence of any form of the EMH, researchers heavily rely on
the empirical verification of the capital asset pricing model (CAPM). As the semi strong and
strong form of the EMH imply that information is reflected by stock prices as soon it becomes
available, financial accounting research has focused on the impact of new information on stock
prices (Deegan, 2000). To determine what kind of impact new information would have on stock
price, it has to be determined what the stock price would be without the new information. The
CAPM calculates an expected stock price based on a linear model. If the actual stock price, after
the new information becomes available, differs from the expected stock price, the new
information was unexpected by the market. As the information was unexpected, the information
was in addition not yet reflected by the stock price. Therefore, according to the EMH, the new
information should be reflected by the stock price as soon as it becomes available.
2.6 Stakeholder Theory
Stakeholders are defined by Freeman and Reed (1983) as a group or an individual who is able to
affect the achievements of a company’s objectives or who is affected by the achievements of a
20
company’s objectives. There are two branches of the stakeholder theory. It has an ethical
(normative) branch and a managerial (positive) branch (Deegan 2000). According to the ethical
branch, all stakeholders of a company have the right to be treated in a fair manner by the
company. Consequently, one stakeholder cannot be more important than another stakeholder can.
The ethical branch also argues that stakeholders have basic rights that should not be violated by
the management of the company. This implies that all stakeholders also have the right to be
provided with information, including financial information, from the company. This is in line
with the objective of financial accounting, as commented on in section 2.7. The management of
the company should provide useful information by the use of financial reporting to the
stakeholders.
The managerial branch of the stakeholder theory argues that management is expected to act
according to the expectations of powerful stakeholders. This implies that management does not
view all stakeholders as equal, but some stakeholders are more important than others are. This is
in contradiction with the ethical branch. In addition, it implies that some stakeholders have a
certain power over management and can influence the decisions of the management.
2.7 The Purpose of Financial Accounting
Financial accounting by the use of the double entry bookkeeping system was introduced by Luca
Paciolo in 1494 (Scott, 2006). During the centuries that passed this method of financial
accounting spread all over the world. Today, financial accounting systems such as SAP are still
based on the double entry bookkeeping system of Paciolo. As was introduced in chapter 1,
financial information of companies is used by the stakeholders as a basis for their economic
decision process. The financial information provided by the management of the company is the
result of the process that is qualified as financial accounting. Financial accounting consists of the
process of registering and processing of the financial information to facilitate the stakeholders to
make economic decisions (Deegan, 2000). The stakeholders use the financial information as the
primary basis for their economic decisions, because they are not involved in the daily operations
of the company and decisions made by management. In addition, these stakeholders have very
different information demands. Consequently, the management of the company must consider
these different information demands while preparing the financial statements. The better the
financial statements are tailored to the information demands of the users of the financial
statements, the better the users of the financial statements are able to make their economic
decisions (Scott, 2006).
21
Because financial reporting of the companies is required to be based on the information demands
of the financial statement users, financial accounting is strictly regulated with general accepted
accounting standards (GAAS). By the use of the GAAS, the regulatory body standardizes the
financial reporting of the companies. In addition, most regulatory bodies argue that the
stakeholders that use the financial information provided by the companies are required to have a
basic understanding of financial accounting to comprehend the financial reporting. The
development of financial accounting is a very dynamic process. Especially during the first couple
of years of the third millennium, financial accounting has received much attention. Corporate
scandals such as Enron and Ahold and the credit crunch have made financial accounting a hot
global topic. Financial accounting has played a very important role in the global economy. This
section will further discuss the objectives of financial reporting and the users of financial reports.
According to the IASB and FASB, there are two main objectives of financial reporting (IFRS.org
and FASB.org). These are two main objectives are in addition described by Deegan (2000) and
Scott (2006). These objectives are commented on below.
The first main objective of financial reporting is to assist the users of financial reporting to make
economic decision. This is related to the subject of decision usefulness. The primary objective of
financial reporting is that it should provide useful information about the company to existing and
potential investors, lenders and other users of financial statements in making decisions about
providing resources to the company according to the IASB (IFRS.org). According to economic
research and more specific according to financial accounting research, the decision about
providing resources to the company is a rational decision that maximizes the wealth of the users
of the financial statements under uncertainty (Deegan, 2000). Consequently, it is deemed
essential that the financial statements provide the users with information that is useful in making
rational decisions to maximize their expected wealth. The objective of decision usefulness has
therefore been the focus of the regulatory bodies in drafting their conceptual frameworks.
According to Scott (2006), two types of decision usefulness exist. The first is the information
perspective. This perspective argues that the form in which information is disclosed is not
relevant to the users of the financial. Rational users of the financial statements are considered to
be sophisticated enough to be able to comprehend the information from any type of disclosure.
The second is the measurement perspective. This perspective focuses on the importance of the
use of fair values in the financial statements. The introduction of the Sarbanes Oxley Act and new
mathematical models to measure fair values has been the basis for this perspective. To safeguard
the decision usefulness of the financial statements the international financial reporting standards
(IFRS) state the financial statements should provide a true and fair view. This implies that the
22
financial statements should have a relevant and faithful representation. For the financial
statements to provide a true and fair view, it should be free from material errors. An amount or
item is considered to be material if a correction to the amount or item would likely change the
decision of the user of the financial reporting. Furthermore, the IASB states that financial
reporting should provide comparability, timeliness, verifiability, and understandability
(IFRS.org).
The second main objective of financial reporting is to enable the users of the financial statements
to assess the stewardship of the management. By the use of the financial statements, the
management should provide information on resources of the shareholders (such as cash and other
assets) that have been entrusted to the company. The shareholders expect that these resources are
used by the management of the company for the intended goals. Consequently, according to Scott
(2006) stewardship of the management is related to the reporting of the management of the
company about their success in managing the resources of the shareholders that are entrusted to
the company. As is also discussed in section 2.3; if management acts in a way to maximize their
own wealth, the resources that have been entrusted to management will likely not be used for
their intended goals. Therefore, the shareholders of the companies need financial reporting by the
management of the company to retrospective assess the performance of management. This
objective is related to the agency theory and is further commented on in section 2.4.
Deegan (2000) indicates that it is hard to define to which parties the management of the company
is accountable. This discussion to whom the management of the company is to be held
accountable, leads to the question who are the users of the financial statements. Especially with
respect to the objective of decision usefulness, it is essential to define who the users of the
financial statements are. Different users have different information needs. Therefore, it is
important to identify the users of financial reporting. Many types of users of the financial
statements exist. These users can be classified in broad groups. These groups are referred to as
constituencies of accounting (Scott, 2006). Several regulatory bodies have given slightly different
interpretations to who the users of the financial statements are. As is stated before, according to
the IASB the users of the financial statements are the existing and the potential investors, lenders
and the other users. The FASB has a similar definition for the primary users of financial reports;
present and potential investors (Deegan, 2000). The existing and potential investors are parties
that are providing resources to the company or are considering providing resources to the
company (IFRS.org). Additionally, the users of the financial statements are expected to have a
basic understanding of financial accounting to comprehend the financial reporting. Furthermore,
these parties do not have the power to force the company to provide the financial information
23
directly to them. These parties must consequently rely on the financial reporting of the company.
Moreover, financial reporting is not just aimed at parties that have a direct financial share in the
company, but also at other stakeholders of the company.
2.8 Summary
The second chapter of this Master research this chapter has commented the PAT. The PAT
developed by Watts and Zimmerman is designed to explore which elements will influence
management’s opinion on accounting standards. The management of the companies has several
motives to lobby for and select certain accounting standards. The introduction of the PAT has
been the basis for a lot of financial accounting research. Most positive accounting research over
the years has focused on three hypotheses: the bonus plan hypothesis, the debt hypothesis, and the
political cost hypothesis. Three theories that have had a great impact on positive financial
accounting research together with the PAT are the agency theory, the EMH and the stakeholder
theory.
This Master research is classified as positive accounting research, because it studies the relation
between income smoothing and the informativeness of earnings. Additionally, this chapter has
introduced the definition and purposes of financial accounting. Financial accounting is defined as
the process of registering and processing of the financial information to facilitate the stakeholders
to make economic decisions. Financial accounting has two main objectives, namely: decision
usefulness and stewardship. To safeguard the decision usefulness of the financial statements the
international financial reporting standards (IFRS) state the financial statements should provide a
true and fair view. If the financial statements are to provide a true and fair view, the financial
statements should be free from material errors. An error is material if it is expected to change the
decisions of the users of the financial statements. The stewardship objective states that the users
of the financial statements should be able to asses if the management is successful in allocating
the resources of the shareholders that are entrusted to the company. The users of financial
statements, existing and potential investors, and other users are expected to have a basic
understanding of financial accounting to comprehend the financial reporting.
The next chapter of this Master research, chapter 3, will focus on the elements of earnings
management and more specific income smoothing.
24
3. Income Smoothing
3.1 Introduction
Chapter 3 of this Master research will focus on the several elements of income smoothing. As
income smoothing is a type of earnings management, this chapter first defines earnings
management. Methods how to perform earnings management are described. Furthermore, a short
overview is provided about the different types of earnings management. Because the main type of
earnings management of the Master research is income smoothing, the focus of this chapter is on
income smoothing. Consequently, this chapter will comment on the motives for management of
the company to perform income smoothing and the objects, instruments and dimensions of
income smoothing. The final section of this chapter describes several well-known approaches to
measure income smoothing.
3.2 Earnings Management
Before the different elements of earnings management are described in this chapter, it is
important to realize clear understanding of the term earnings management. Many definitions of
earnings management exist, but the two most often used definitions are the following:
Schipper (1989): “a purposeful intervention in the external financial reporting process, with the
intent of obtaining some private gain (as opposed to, say, merely facilitating the neutral
operation of the process)”
Healy and Wahlen (1999): “Earnings management occurs when management use judgment in
financial reporting and in structuring transactions to alter financial reports to either mislead
some stakeholders about the underlying economic performance of the company or to influence
contractual outcomes that depend on reported accounting numbers”
Based on the two definitions provided, it is clear that management of companies can manage
earnings by the use of two different strategies. Either the management can use the flexibility in
accounting regulation or the management can engage in real transactions. These two strategies of
earnings management are described in this section.
If management performs earnings management by the use of the flexibility in accounting
regulation, this is considered to be earnings management by accounting choice (Fields et al,
25
2001). The approach of earnings management by accounting choice is in conformity with the
approach of Watts and Zimmerman (1990) that is described in section 2.2. This approach states
that management of companies will apply their discretion over the preparation of the financial
statements. According to Fields et al. (2001), managers select certain accounting standards and
methods to manage the earnings of the company. This for example can create bonus
maximization. Even though not all accounting choices are earnings management related, the
selection of a specific accounting method to achieve a goal reflects the idea of the use of earnings
management. This goal to influence the output of the accounting system is not always related to
the reported earnings in the financial statements, but can in addition be related to tax filings or
regulatory filings. Furthermore, for this strategy of the use of earnings management to be
effective, the users of the financial statements need to be incapable or reluctant to identify the
effects on the financial statements of the earnings management. Francis (2001) adds three
dimensions to the article of Field et al. (2001). According to Francis, in addition it is important to
focus on accounting choices made by other parties, such as auditors, internal audit committees, or
regulators that can also have an impact on the financial statements of the company. Furthermore,
research should focus on the nature of the accounting choices used by the management. In
addition, not all accounting choices have an impact on the income of the company. The practice
of earnings management by accounting choice is also described by Hoogendoorn (2004).
Earnings management by accounting choice can occur in two situations. It can occur either when
management of a company is confronted with a new type of transaction or when management
selects a different accounting method than the accounting method applied in previous years for an
existing type of transaction. It is clear that management of the company can affect the result and
income of the company by selecting a certain accounting method or changing the current
accounting method. Hoogendoorn (2004) in addition states that both the timing of the change in
accounting method and choice to incorporate the effect of the change in accounting method in the
result of the year or the equity of the company, are part of earnings management. Popular choices
of accounting method to perform earnings management are related to the recognition of income
and expenses, the valuation of assets and liabilities, goodwill, depreciation and amortization.
Because the definition of the use of earnings management by accounting choice is so broad, it is
also related to the choice between FIFO (first in first out) or LIFO (last in first out) or the
qualification of a lease contract as a financial lease or an operational lease.
Next to the use of earnings management by accounting choice Hoogendoorn (2004) further
distinguishes the use of earnings management by means of financial accounting estimates. The
preparation of the financial statements requires of management to use several estimations related
26
to both assets and liabilities. These estimates performed by the management in addition have an
effect on the equity and the income of the year of the company. Just as management can select a
different accounting method, management can also select a different estimation method to
perform earnings management. Estimations of management are often related to the recognition of
assets and liabilities, fair value valuation of assets and liabilities, impairments and provisions.
Especially the estimation of the provisions and the accruals is often subject the management
discretion and consequently a popular tool for the use of earnings management. Accruals can be
defined as the differences between the cash flow of a company and the reported earnings (Van der
Bauwhede, 2003). Regarding the accruals, it is essential to use the distinction between
discretionary and non-discretionary accruals. Management of a company is unable to use non-
discretionary accruals to perform earnings management, because no subjective element exists
related to the estimation of these accruals. Discretionary accruals however require the financial
accounting judgment of the management and consequently allow the management to influence
the reported earnings of the company. Although research performed by Healy and Wahlen (1999)
concludes that little evidence exists that specific accruals are used to perform earnings
management.
Dechow and Skinner (2000) investigated the use of earnings management by accounting choice
from the perspective of regulators. This perspective is chosen because the use of earnings
management is considered to be a problem by regulators. According to the view of Dechow and
Skinner (2000), a distinction exists between accounting choices within GAAP and accounting
choices that violate GAAP. Accounting choices within GAAP are considered to be earnings
management, while accounting choices that violate GAAP are considered to be fraudulent
accounting. Accounting choices within GAAP are classified in three categories. The first category
is conservative accounting and includes aggressive recognition of reserves and provisions and
overstatements of asset write-offs or restructuring charges. The second category is qualified as
neutral accounting and includes earnings that result from normal operations without any specific
earnings management. The third category is called aggressive accounting and is related to the
understatement of provisions for bad debt and drawing down reserves and provisions in an
aggressive matter. The use of earnings management turns into fraudulent accounting when
management engages in accounting choices that for example recognize sales before the sales are
realized, backdates sales invoices, or records fictitious sales.
The second strategy for management to perform earnings management is to engage in real
transactions. This implies that management will try to manage earnings by strategically planning
transactions such as the purchase or sale of assets. Although these type of transactions can still be
27
economic rational transactions (Hoogendoorn, 2004), the managerial intent behind the transaction
made, is to affect the output of the financial accounting system instead of a strategic reason
(Fields, 2001). Healy and Wahlen (1999) refer to this strategy of earnings management as
structuring a transaction so that it can be recorded in a certain way. Examples of these real
transactions include management’s possibility to increase production and therefore decreasing the
cost of goods sold by decreasing the fixed cost per unit. Because the cost of goods sold decrease,
the earnings increase. Another example is related to the structuring of lease contracts. If the net
present value of the lease terms payable is above 90% of the sales value of the leased asset, the
lease is classified as financial lease and the asset and corresponding debt needs to be recognized
on the balance sheet. However, most lease contracts include a maintenance fee related to the
leased asset. If this maintenance fee is increased, while the total lease amount remains the same,
the net present value of the lease terms payable will decrease below 90% of the sales value of the
leased asset. Consequently, the lease contract can be classified as operational lease. As a result of
this change in the lease contract, the debt equity ratio of the firm changes, as the debt of the lease
is not recorded on the balance sheet (Stolowy and Breton, 2004).
As can be concluded from this section, management has two main strategies to perform earnings
management. However, the choice of management in which way to perform earnings
management is influenced by several aspects (Hoogendoorn, 2004). The first aspect to consider if
management wants to perform earnings management is the level of impact the actions taken by
management must have on the financial statements. If management want the actions it has taken
to be visible in the financial statements, it is likely to prefer to perform earnings management by
the use of accounting choice. The change of accounting method is often disclosed in the financial
statements. The second aspect to consider is the irreversibility of the actions taken by
management. For example, if management engages in a real transaction, such as the sale of a
certain assets. It will be difficult to reverse this transaction. Consequently, the management in
general prefers to take actions that are more easily reversible. The third aspect focuses on the tax
impact that the actions of management will have. Earnings management by means of choice of
accounting method will often have no tax impact, but changes in financial accounting estimates
and real transactions are more likely to have a tax impact. Therefore, management must consider
whether or not it prefers its actions to have an impact on the income taxes payable of the
company.
Furthermore, Mohanram (2003) concludes that most earnings management is based on
discretionary accruals.
28
3.3 Types of Earnings Management
Section 3.2 provided a definition of earnings management and described the two main strategies
in which way the management of the company can perform earnings management. However, in
different economic situations, management is likely to prefer different types of earnings
management. This section describes the different types of earnings management. According to
Scott (2006), there are four main patterns or types of earnings management. Hoogendoorn (2004)
in addition recognizes the differentiation of the four patterns. These patterns are the following.
Taking a bath
This kind of earnings management, which is also called “big bath” accounting, usually takes
place during a period of losses or reorganization within a company. If a company is in a
period of losses, it is often not useful for management to take actions that transform the losses
into profits. Consequently, the management often prefers to further decrease the results of the
company. As the underlying economic performance of the company was already negative,
further decreasing the performance does not have a negative impact on the judgment of the
users of the financial statement. Especially during a CEO change, big bath accounting is a
recurring phenomenon. Management chooses to report one large loss by writing of assets or
providing for expected future costs. By recognizing these extra charges, management cleans-
up the balance sheet of the company. Because of this policy, it is more likely that the firm
will be able to report future profits. As management of the company already provided for
future costs, it is expected that there will be a boost in future income (Mohanram, 2003).
Management can easily reverse the accruals that were created in the year the “big bath”
accounting took place. The new management of the company will take credit for this boost in
income, even though this increase in performance is accounting related. Often the old
management is blamed for the poor performance in the year the “big bath” accounting takes
place (Ronen and Yaari, 2008). As the “big bath” accounting boosts the income of the
company in future years, this can have a positive impact on the rewards on the new
management. Taking a bath is sometimes additionally referred to as cookie jar accounting. It
is referred to as cookie jar accounting, because the management of the company reduces the
current year earnings and puts the earnings in a jar for the use future in future years, when the
earnings are considered to be more valuable.
29
Income minimization
This sort of earnings management is quite similar to big bath accounting but not so extreme.
One motive for practicing this type of earnings management is usually the public or political
visibility of the firm. If companies report relative high earnings, the company is expected to
attract more attention from public groups regarding the environmental policies of the
company. Additionally, a company with relative high earnings is expected to attract more
attention from competitors (Stolowy and Breton, 2004). The management of the company
prefers to attract as little attention as possible. A related main motive can be certain income
tax considerations. In particular, if a firm becomes political visible because of its high profits
(Scott, 2006). Another situation in which management can take actions to minimize the
company’s income is during a period of losses. This is qualified as a loss maximization
strategy. If a company is reporting losses for several years, management can take actions to
further decrease the result for a couple of years. After these couple of years, earnings are
expected to increase and the company will at least be able to report lower losses. Just like
taking a bath this policy includes hurried write offs, expensing for current and future
expenditures. In contrast to big bath accounting, this policy is not practiced to increase the
chance to report future profits but just to lower the current income of the firm.
Income maximization
This is the opposite of income minimization. The purpose of this type of earnings
management is to report a positive result. According to Dechow, Richardson, and Tuna
(2003), it is expected that management of companies with a small negative result or a result
that is close to zero will perform income maximization. By reporting a positive result, the
management tries to influence the judgment of the users of the financial statements
(Hoogendoorn, 2004). The management is able to perform this type of earnings management
by the boosting of discretionary accruals or by engaging in real transactions. Several motives
for engaging in this type of earnings management exist. According to Healy and Wahlen
(1999) bonus plans of management are one of the motives to perform income maximization.
This is in accordance with papers written by Healy (1985), and Bartov and Mohanram
(2004). Healy states that the management of the company manages the earnings to maximize
their bonus under the company’s incentive plan. However, if the performance of the company
is sufficient to support the maximum bonus, the management of the company will anticipate
this. In the years that the unmanaged income is below the lower threshold of the incentive
plan or above the upper threshold of the incentive plan, it is expected that the management of
30
the company is to use discretionary accruals that defer income. Consequently, earning
management by means of creating and reversing accruals is used, in such a way that the
management can increase earnings over the years and receive a bonus. Another incentive for
income maximization is debt contract covenants (Scott, 2006). This is in line with the debt
hypothesis of Watts and Zimmerman (1990) as commented on in section 2.3. If the leverage
increases the company comes closer to breaching the debt contract covenants. Consequently,
management will maximize income and decrease the debt / equity ratio.
Income smoothing
The managers will take actions to increase earnings when earnings are relatively low and to
decrease earnings when earnings are relatively high (Bao and Bao, 2004). Usually the
dampening in earnings variability is chosen by the management of the company to report a
gradual growth in earnings that is in line with the private information of the management
about future earnings. As income smoothing is widely accepted to be the most interesting
type of earnings management and because it is the key type of earnings management of this
Master research, the following sections of this chapter will present an extensive introduction
to this specific category of earnings management. In addition, the remaining sections of this
chapter will highlight income smoothing.
As can be concluded from this section, managers of companies will select different patterns or
types of earnings management in different situations. Consequently, it is possible that over the
course of several years managers can select different types of earnings management that they see
fit for the economic situation in which the company is operating. Kirschenheiter and Melumad
(2001) performed researched that showed that big bath accounting and income smoothing can be
practiced together by the management of companies. Management of companies can perform big
bath accounting in the current year and smooth the “saved” earnings over the future year
earnings. Other combinations of types of earnings management are in addition possible.
3.4 Income Smoothing
Within the financial accounting research topic of earnings management academic researchers
have always been very interested in studying the use of income smoothing. In general, academic
research of income smoothing has been very successful compared to the study of other forms of
the use of earnings management (Bao and Bao, 2004). Several reasons exist why academic
research on income smoothing has been more successful than research on other types of earnings
31
management. First of all, researchers have been able to define income smoothing more precisely
than other forms of the use of earnings management. Some frequent used definitions of income
smoothing are:
Beattie et al. (1994), “The reduction in earnings variability over a number of periods, or, within
a single period, as a movement towards an expected level of reported earnings.”
Fudenberg and Tirole (1995), “The process of manipulating the time profile of earnings reports
to make the reported income stream less variable, while not increasing reported earnings over
the long run.”
Ronen and Sadan (1981), “An attempt by managers to manipulate income numbers so as to
impart to the resulting series a desirable and smooth trend.”
Based on these three definitions of income smoothing it is clear that to perform income
smoothing, management of a company will try to report an increasing linear stream of earnings
over the years. To accomplish this, management needs to increase earnings in periods with
relative low earnings and needs to decrease earnings in periods with relative high earnings. If this
is compared with the other types of earnings management, one could argue that in period with
relative low earnings management needs to perform earnings maximization while in periods of
relative high earnings management needs to perform earnings minimization. Management of
companies prefers to report a smooth stream of earnings because fluctuations in the profitability
of the company are considered to have a negative effect on the company’s risk profile
(Hoogendoorn, 2004). Although this “misleading” of users of the financial statements at first
appears to have a negative effect, additionally positive effects of this type of earnings
management exist. The advantages and disadvantages of earnings management and more specific
of the use of income smoothing are commented on in section 3.6.
Secondly, academic research has been successful in studying the use of income smoothing,
because researchers have accomplished to make a clear differentiation between smoothers and
non-smoothers. This implies that several tests exist that can successfully measure whether or not
management of a company practices income smoothing. Most empirical research has focused on
ex post data of companies to determine the existence of income smoothing behavior (Albrecht
and Richardson, 1990). How to measure income smoothing will be further explained in section
3.9.
32
Third, academic researchers have been able to differentiate smooth earning streams of companies.
These types of income smoothing are explained in the next section.
3.5 Types of Smooth Income Streams
Although management of a company may report a smooth stream of earnings over several years,
not all smooth earning streams are the same. According to Eckel (1981), two main types of
income smoothing exist. These are natural smooth income streams and intentionally smoothed
income streams by the management of the company. These two main types of income smoothing
streams are in addition recognized by Albrecht and Richardson, 1990).
Although income smoothing is a type of earnings management that is deliberately performed by
management of companies, one type of income smoothing exists without the interference of
management. Natural smooth income streams are the result of an earnings-generating process that
based on its own characteristics produces smooth income streams (Eckel, 1981). For example,
public utility companies such as producers of energy or public transportation are expected to have
natural smooth income streams. Consequently, the process of natural smoothing is not qualified
as earnings management.
If the smooth income stream is qualified as intentionally being smoothed by the management of
the company, than earnings management is the basis for the reported smooth income stream.
Within intentional smoothed income stream, there are two sub-categories. These are artificial
smoothing and real smoothing.
Real income smoothing is the equivalent of earnings management by the use of real transactions
as described in section 3.2. This type of income smoothing is sometimes also called transaction or
economic smoothing (Stolowy and Breton, 2004). These transactions influence the cash flow of
the company, which is not the case for artificial smoothing. One example of real transactions that
can be applied to accomplish income smoothing is to select investment opportunities based on the
co-variance of the expected revenue series (Eckel, 1981).
Artificial smoothing, or accounting smoothing, is the equivalent of earnings management by the
use of accounting choice or earnings management by means of financial accounting estimates.
This type of smoothing does not include the use of an economic event. Instead, this type of
income smoothing transfers revenues and expenses from one period to another period. One
method for management to do this is by the use of accruals. Consequently, much academic
research on income smoothing has focused on accruals to measure income smoothing. This will
further be explained in section 3.9.
33
Both artificial and real income smoothing have been of concern to academics as well as standard
setters because of perceived manipulation by self-interested managers. The type of intentional
income smoothing is dependent on the incentives management has and therefore the most studied
type of income smoothing. These incentives or motives will be further discussed in section 3.7.
3.6 The Advantages and Disadvantages of Income Smoothing
According to Ronen and Yaari (2008) earnings management and income smoothing can be
defined as collections of decisions made by management that do not result in reporting the true
short term and value maximizing underlying performance as known to management. As Ronen
and Yaari state that not all income smoothing is considered to be misleading, they qualified the
use of earnings management in three categories. These are:
1. Good: the use of income smoothing signals private information of the management about
the future year earnings of the company.
2. Bad: the use of income smoothing conceals information about the current year and the
future year earnings of the company.
3. Neutral: the use of income smoothing reveals the information about current year
economic performance as known to management (Ronen and Yaari, 2008).
The definitions of the use of earnings management and the use of income smoothing provided in
sections 3.2 and 3.4 mostly focus on the misleading effect of income smoothing and therefore it is
considered to be a bad phenomenon. By the use of income smoothing the management of the
company is reporting manipulated figures and the users of the financial statements are not aware
of the actual underlying economic performance of the company. Suh (1990) even considers
income smoothing as an attempt by management to fool the users of the financial statements.
Also most motives (see section 3.7) are related to the self-interest of management and therefore in
addition considered to be a bad thing for the company and the users of the financial statements.
However, since the early days of academic research on income smoothing some researchers have
highlighted the positive effects of income smoothing. One positive definition of income
smoothing is:
Ronen and Sadan (1981): “Income smoothing is a deliberate attempt by management to signal
about future earnings to the users of the financial statements.”
34
This definition provided by Ronen and Sadan is related to earnings uncertainty (Moses, 1987).
Income smoothing is a signaling technique used by management to provide the users of financial
statements with a better forecast about future earnings. This is because users of financial
statements form expectations based on signals provided by management through reported
(smoothed) earnings. Income smoothing would consequently allow the users of the financial
statements to produce better forecasts. The incentive to smooth should increase when the
difference between actual earnings and expected earnings increases.
Biedleman (1973) agrees with the view of Ronen and Sadan. According to Biedleman income
smoothing can be to the advantage of both investors and financial analysts. This is due to the fact
that investors and financial analysts believe that a stable earnings stream allows a company to pay
a higher level of dividends.
Subramanyam (1996) has performed research that supports the view of Ronen and Sadan. His
research proves that if management uses earnings management in a responsible manner to signal
about future earnings by the use of discretionary accruals, that the stock markets respond
positively.
It is interesting to recognize that a positive side to income smoothing exists and that this type of
earnings management is considered to be a signaling technique used by management to signal
about future earnings. As this Master research intends to answer the question if the use of income
smoothing increases the informativeness of the earnings, chapter 4 will further discuss the topic
of informativeness and chapter 5 will focus on prior research related to the positive effects of
income smoothing.
3.7 Motives for Income Smoothing
It is important to understand why management chooses to engage in income smoothing practices.
This section will discuss the motives or incentives that management of a company can have to
perform income smoothing. Many motives exist. According to Ronen and Sadan (1981), two
main groups exist that motives of the use of income smoothing by the management of the
company are aimed at. The first group exists of the users of financial statements, because their
economic decisions are expected to change by the use of income smoothing. The second group is
the management of the company itself, because their personal wealth is expected to be affected by
the use of income smoothing. Although this separation in motives can be realized, there is a big
overlap between the two main groups. Consequently, the approach of Stolowy and Breton (2004)
is applied to group the different motives. Stolowy and Breton (2004) stated that three main
categories of motives exist for income smoothing. These are: job and bonus contracting motives
35
(equivalent of the bonus plan hypothesis), debt contracting motives (equivalent of the debt /
equity hypothesis) and regulatory motives (equivalent of political cost hypothesis). These three
main categories of motives have also been identified by Healy and Wahlen (1999). The second
and third motives for the use of income smoothing are in general advantageous to the company,
while the first motive for income smoothing is primarily related to the self-interest of the
management of the company.
First, the job and bonus contracting motives are explained. In prior research on the use of income
smoothing, the job and bonus contracting motives have received the most attention. This is
because this motive is related to the garbling behavior of the management of the company.
Management of the company is expected to act opportunistic and to maximize their own wealth.
The wealth of the managers is dependent on cash bonuses and other performance based incentive
schemes (Beattie et al., 1994). In the situation that management is compensated with stock
options or other performance based incentive schemes it has the incentive to make accounting
choices that maximize the cash flow of the company. Bartov and Mohanram (2004) additionally
state that cashing of stock options by the management is an incentive to perform earnings
management. Consequently, this will also maximize the value of the company and the wealth of
the management.
Lambert (1984) uses the agency theory to create an economic model of the relationship between
the shareholder and the manager. When management’s smoothing actions are not noted, then
income smoothing can become an optimal equilibrium behavior. In his analysis, Lambert views
the shareholders (principal) and manager (agent) as being rational parties who will both perform
actions in their own and best interests. Management will, based on the given incentive scheme,
take actions to maximize its wealth. But the principals are additionally able to expect the
opportunistic behavior of the management as a reaction to the proposed incentive scheme.
Consequently, the principal can take this into account when deciding what type of incentive
scheme to give to management. To summarize this; the principals are not fooled by the use of
income smoothing that is applied by the management of the company. Lambert (1984) therefore
concludes that the principals choose management’s incentive scheme to give a motivation to the
management to practice income smoothing. So in this view, income smoothing is seen as
preferable by the principals.
Fudenberg and Tirole (1995), state that another motive for the use of income smoothing consists
of the concern of job contract security of the management. If the management’s performance is
not so good or below a certain benchmark the possibility exists that responsible management will
be dismissed. Even if management has a good performance in the current year, this will not
36
balance out for bad performance in future years. Consequently, in that case, the management will
shift or transfer current earnings to the earnings of future periods. In addition, when current
performance is poor, management will have an incentive to shift future earnings to the earnings
of the current period. Consequently, by making accounting choices, management is in fact
borrowing and saving earnings from different periods to ultimately create a smooth stream of
income (Fudenberg and Tirole, 1995).
In a more extreme scenario of poor earnings, the firm can also fall prey to a corporate take over.
This case is similar to the one that has signaled before. In addition, this can view because of poor
performance of the management. Therefore, the possible threat of a takeover is another incentive
for management to practice income smoothing. Consequently, the job contracts and incentive
schemes of the management are qualified as a motive for the use of income smoothing.
Second, the debt contracting motives are explained. Within this group of debt contracting
motives, several individual motives exist to smooth earnings. An IPO of a company, obtaining or
renewing debt contracts and meeting analysts forecasts are several motives. Trueman and Titman
(1988) also argue that one of the motives for management to engage in income smoothing is
related to debt contracts and consequently the cost of capital. When a company reports a smooth
stream of income the company will face lower costs of capital than when it reports a variable
stream of income. In addition, when a company reports a smooth stream of income it is
considered to be less likely that the company will go bankrupt than when it reports a variable
stream of income. This also implies that with a smooth income stream, the bond value of the
company will be higher. So the analysis of Trueman and Titman (1988) states that the debt issued
by the company qualifies as an incentive for the management to perform income smoothing.
Michelson et al. (1995 and 2000) tested the reaction of the market place to income smoothing.
According to this study one of the motives for income smoothing is to increase the market value
of the company and to decrease the risk profile of the company. If the value of the company
increases and the riskiness of the company decrease, the cost of capital will also decrease. The
view of Michelson et al. (1995 and 2000) is shared by Bitner and Dolan (1996).
Third, the regulatory motives are explained. As is explained in section 2.3, the political cost
hypothesis of Watts and Zimmerman states that high earnings are proxy variable for political or
public attention. Therefore management has an incentive to smooth earnings and lower political
cost.
Third, Healy and Wahlen (1999) in addition recognize political and regulatory cost as a motive
for management of a company to smooth the earnings. Healy and Wahlen specify political cost
related to industry regulations and anti-trust regulations. The management will perform income
37
smoothing to work around industry specific regulations and constrains. Income smoothing related
to investor protection regulations is also studied by Cahan, Liu, and Sun (2008). Cahan, Liu, and
Sun conclude that in countries with weak investor protection regulations the management of
companies is expected to perform income smoothing for their self-interest, while in countries
with strong investor protection regulations management will perform income smoothing to signal
their private information about future earnings.
Labor regulation as a motive for income smoothing has been the topic of research by Godfrey and
Jones (1999). They conclude that especially the income lowering part in times of high income
within the policy of income smoothing can be used to reduce and avert attention from outside
parties. In periods of low income, income smoothing can also be used to bump up income to
avoid government attention with respect to investigations in unviable industries or employees that
are concerned about future employment. Additionally, Jones (1991) proposed that earnings
management was used by American companies during times of import relieve investigations by
the US government. Consequently, regulatory or political influences from outside the company
are a motive for management to apply income smoothing.
Furthermore, next to the 3 groups of motives provided by Stolowy and Breton (2004), another
important motive exists. This is the fact that investors and management itself like to have a
gradual growth in earnings. Healy and Wahlen (1999) refer to this motive as a capital market
motive. Once firms start to report a smooth stream of earnings, analysts will expect future
earnings to fit in this smooth stream. Consequently, managers have an incentive to continue to
smooth earnings, as they will be punished by the market once they return to reporting a more
variable stream of earnings. Thus, managers use income smoothing to achieve the growth
continuity and to avoid market consequences followed by not meeting expectations. As this
motive is related to the informativeness of the earnings, this motive is not extensively commented
on in this chapter. The informativeness of the earnings is further commented on in chapter 4.
3.8 Smoothing Elements
This section will comment on the three smoothing elements. These elements are the objects, the
dimensions, and the instruments of income smoothing. Barnea, Ronen, and Sadan (1976) state
that the smoothing object is the item or number which the management of the company will try to
smooth and that the smoothing instrument is the item or number by which management of the
company will try to smooth the selected smoothing object. A dimension can be seen as a method
used in combination with an instrument to smooth an object.
38

Smoothing can be seen as the dampening of fluctuations of the smoothing objects. Managers can
influence an object by making decisions that would increase or decrease an object. To see if
smoothing takes place around a smoothing object, a sufficient period is needed, so the dampening
affect of the fluctuations on the object can be observed. Examples of the smoothing objects are:
net income, earnings per share, ordinary and extraordinary income, operating income, and many
more (Stolowy and Breton, 2004). Depending on the smoothing motive, the management will
select a specific smoothing object. Objects can only be smoothed by the managers when the
dimensions and the instruments are taken into account.
Dimensions are methods managers use to smooth an object, this can be done in three different
manners according to Barnea, Ronen, and Sadan (1976) and Ronen and Sadan (1975):
1. Smoothing by the use of the occurrence of an economic event and/ or by the use of the
recognition of financial elements (real smoothing).
2. Smoothing by the use of allocation over time (artificial smoothing).
3. Smoothing by the use of classification (classificatory smoothing).
The first dimension, smoothing by the use of occurrence and/ or recognition relates to real
smoothing described in section 3.5. The managers can time real transactions in such a manner
that the earnings of the company can be affected through time. The second and third dimensions
are related to artificial smoothing described also in section 3.5. Managers can smooth income by
the use of allocation over time, because it has the freedom to make accounting choices that affect
the earnings. These decisions are not real transactions, so these actions taken by manager do not
affect cash flows. Smoothing by the use of classification is the third dimension. This is only
effective when other smoothing objects are used than net income. Managers can classify certain
borderline items in the extraordinary or ordinary category. This accounting choice affects the
smoothing object in the preferred manner. Examples of borderline items are: deferred R&D
expenditures or material write-downs of inventories and receivables (Ronen and Sadan, 1975).
Managers can use an instrument in combination with a dimension to smooth an object variable.
Smoothing instruments are additionally referred to as smoothing devices. A good smoothing
instrument has to have the following characteristics according to Copeland (1968):
1. Once the instrument is used, it needs to never commit the company to taking any
particular future actions.
2. The instrument needs to be based upon the application of professional judgment and must
be considered to be within the domain of GAAP.
3. The instrument needs to lead to material shifts in relation to year-to-year differences in
income.
39
4. The instrument needs not to involve a “real” transaction with a second party, but only
reclassifications of the financial accounting balances.
5. The instrument needs to be used, independent, or together with other instruments, over
consecutive periods.
Examples of instruments that management can use to perform income smoothing are: the
classification of ordinary and extraordinary items, changes in the depreciation policy of the
company and dividend income (Stolowy and Breton, 2004).
Additionally, by the use of the smoothing dimensions and the instruments, the smoothing object
needs to be adjusted by a material amount. Because, as commented on in section 2.8, the
smoothing object needs to be adjusted by a material amount to influence the decisions of the
users of the financial statements. If the smoothing object is not adjusted by a material amount, the
management of the company is unsuccessful in the use of income smoothing. Consequently, an
immaterial adjustment of the smoothing object will not influence the decisions of the users of the
financial statements.
3.9 Measuring Income Smoothing
As is commented on in section 1.1 of the introduction; according to Bao and Bao (2004) research
on the use of income smoothing has been successful because researchers have been able to
identify which companies use income smoothing and which companies do not use income
smoothing. This implies that methods exists that successfully measure the use of income
smoothing. According to Copeland (1968), three methods exits to research the use of income
smoothing. First, researchers can inquire management, second researchers can contact third
parties such as auditors, and third researchers can perform studies on ex post data. The majority
of the academic research has chosen the third option; performed studies based on ex post data.
Early research on earnings management tried to detect earnings management by determining
whether management of companies selected accounting methods and created certain provisions in
such a manner to influence the income of the companies (Van der Bauwhede, 2003). This method
is often referred to as the classical approach (Albrecht, 1990). According to Eckel (1981), several
down sides are related to this type of measuring the use of earnings management. First of all,
these methods require a model to predict an expected and normalized income. It is very difficult
to predict the expected normalized incomes for companies. Because this is very difficult,
researchers could very well conclude that management of the company used income smoothing to
manipulate the income of the company, while this was not the case. For example, some
researchers used the income of the past year to predict the income of the current year.
40
Consequently of income was differed from the expected normalized income due to another
variable, researcher could unjust conclude that management of the company was practicing
income smoothing. Moses (1987) states that these types of research approaches are not capable of
differentiating between the natural smoothed income and the intentional smoothed income.
Secondly, if researchers examine only one income smoothing variable in relation to the
normalized income could result in biased results. Consequently, researchers should study the
effect of multiple income smoothing variables in relation to the normalized income. This
decreased the chance of biased results. Third, some academic researchers examined income
smoothing variables in relation to the normalized income for only one period. As income
smoothing is a type of earnings management that is only effective if management of the company
practices it for several years, academic research should examine several periods. Only if several
periods are examined researchers can conclusively determine if income smoothing is performed.
In addition, Ronen and Sadan (1981) have also commented on these early approaches to detecting
the use of income smoothing. Their criticism is based on the fact that the early approaches are not
capable of identifying motives for income smoothing and are no able to predict when income
smoothing occurs.
Consequently, recent studies on the use of earnings management have incorporated statistical
approaches to detect the use of earnings management. These statistical approaches can be
separated into two types of approaches. Namely, the income variability approach and the accrual
models approach. According to McNichols (2000) a third approach exists that is called the
frequency distribution approach. One example of academic research performed based on the
frequency distribution approach is a study of Belkaoui and Picur (1984). They studied difference
in income smoothing behavior between core and periphery economical sectors. This third
approach is not further commented on in the research. The next paragraphs will further comment
on the income variability approach and the accrual models.
Income Variability Approach of Albrecht and Richardson
The first academic research approach that tried to identify artificial income smoothing separately
from natural smoothing was performed by Imhoff (1977). Imhoff was the first academic
researcher to apply the income variability approach. According to Imhoff, the actions taken by
management of the company to perform “real” smoothing are included in the sales figures of the
company. The sales figures would therefore represent the “real” smoothing if this is performed by
the management of the company. Consequently, by comparing the variance of sales to the
41
variance of ordinary income the use of artificial income smoothing can by examined. The income
variability approach defines a company as an income smoother if:
≤ 1
Where = One period change in income
= One period change in sales
= Coefficient of variation
=
The income variability approach is additionally selected by Eckel (1981) and by Albrecht and
Richardson (1990) to examine artificial income smoothing. The income variability approach is
considered to be a better approach than the classical approach. The classical approach tried to
predict income and the income variability approach does not include any predictions of income.
Additionally the income variability approach examines sales and income for several periods.
Although the income variability approach is an improvement over the classical approach, still
some down sides to this approach exist. First, Eckel (1981) stated that the income variability
approach only is capable of identifying the successful attempts by management of the use of
income smoothing. Unsuccessful attempts by management to perform income smoothing are not
identified by this approach. Additionally Albrecht and Richardson (1990) find that even if the
ratio in the formula before is not below 1, management of a company could still be performing
artificial income smoothing.
In addition, Michelson and et al. (1995) also apply the income variability approach for detecting
the use of income smoothing.
Accrual, Jones, and Modified Jones Models
Hoogendoorn (2004) states management of companies can perform artificial income smoothing
by the use of financial accounting estimates (see also section 3.2). One of the balance sheet items
on which management discretion can have an impact on the P&L are accruals. By creating or
releasing discretionary accruals (see in addition section 3.2) management can manipulate the
income of the company. Consequently, much academic research has focused on accruals to
42
measure the existence of income smoothing. Additionally, it can be concluded that accruals are
used as a proxy for the use of earnings management.
Before the accrual models are explained, first it needs to be clear that compared to the variable
income approach, the accrual models are not capable of directly measuring the use of income
smoothing. These models estimate (discretionary) accruals, which can be the basis for detecting
the use of income smoothing.
The accrual models used by academic researchers can be classified in two main groups according
to McNichols (2000) and Xiong (2006). These two main groups are aggregate accrual models (in
addition referred to as total accrual models) and specific accrual models (also referred to as single
accrual models). Where the aggregate accrual models focus on all discretionary accruals, the
specific accrual model only focuses on one accrual. An example of a specific accrual is a bad debt
provision, a tax accrual, or a restructuring provision. As the majority of the academic research
applies aggregate or total accrual models to determine the use of income smoothing, this research
will not further comment on the specific accrual models.
One of the most important early income smoothing researches performed by the use of an accrual
model, is the study of Healy (1985). Healy applied the accrual model to determine if incentives
schemes provided to management influenced the accounting choices.
For researchers to determine the use of income smoothing, consequently the discretionary
accruals of the company need to be determined. The most often used model to determine the
discretionary accruals is the Jones model and the variants on the Jones model that are referred to
as modified Jones models. The Jones model is a regression model introduced by Jones (1991) that
was applied to study the use of earnings management during import relief investigations. The
Jones model is a regression model that controls for nondiscretionary factors that have an
influence on accruals (McNichols, 2000). The regression model is based on a linear relation of
total accruals and two variables; the change in sales and the level of property, plant, and
equipment (PPE). Consequently, the Jones model implies that the level of nondiscretionary
accruals of a company is determined by the change in sales and the level of PPE. The original
regression model introduced by Jones (1991) and of which a cross sectional version is provided
by Kothari et al. (2005) to measure total accruals is defined as:
Where = Total accruals for company i in period t.
= Total assets for company i in period t-1.
43
= Change in sales (scaled by lagged total assets ( )).
= Property, plant and equipment (also scaled by lagged total assets).
According to Kothari et al. the use of assets as a deflator, helps to mitigate heteroskedasticy in the
residual from the annual cross section model. As was stated before, several modified versions of
the Jones discretionary accruals model exist. Two of the best know modified versions are the
modified Jones model of Dechow et al. (1995) and Kothari et al. (2005). These modified Jones
models are briefly commented on below.
The modified Jones model of Dechow et al. is defined as:
The difference applied by Dechow et al. compared to the original Jones model is that the change
in sales is adjusted for the change in receivables. This modification is applied by Dechow et al.
because they believe that management can also exercise discretion over revenue recognition on
credit sales.
The modified Jones model of Kothari et al. is defined as:
The difference applied by Kothari et al. compared to the original Jones model is that a variable
for returns on assets is added. This variable is added by Kothari et al. because based on prior
empirical research the Jones model was lacking a performance-matching variable (Kothari et al.,
2005). This implies that the Jones model did not function correctly for good performing
companies or bad performing companies. Kothari et al (2005) criticize the modified Jones model
of Dechow et al. (1995). They state that the adjustment made by Dechow et al. will provide
biased large discretionary accruals for companies that are in a period of extreme growth.
After the company specific parameters ( ) are calculated in the estimation period
(t-1), these parameters are applied in the event period (t) to estimate the non-discretionary
accruals.
The difference in the event period between the total accruals and the non-discretionary accruals
are the discretionary accruals.
Consequently, to calculate the pre-discretionary income, the discretionary accruals are subtracted
from the net income.
44
After all these actions are performed, academic research can start to measure the use of income
smoothing The use of income smoothing is measured by the correlation between the change in
discretionary accruals and the change in pre-discretionary income (Tucker and Zarowin, 2006).
For this correlation to be observed several periods need to be observed.
3.10 Summary
This chapter has provided an overview of the term earnings management a more specific income
smoothing. Earnings management is performed by management to influence the outcomes of the
financial accounting process and consequently to mislead the stakeholders of the company. Four
types of earnings management exist; taking a bath, income maximization, income minimization,
and income smoothing.
Although the use of earnings management is generally considered to be a bad thing, in addition
academic researchers exist that proclaim the opposite. According to Ronen and Sadan (1981),
income smoothing can be applied by management to provide signals to stakeholders about future
earnings of the company. Consequently, stakeholders are able to obtain a better forecast about the
future economic performance of the company.
Additionally, several types of smooth income streams exist. First of all, natural smooth income
streams exist. This type of income streams are not the result of management manipulation and are
consequently not considered being earnings management. Secondly, the intentional smoothed
income streams exist. These income streams are smoothed by the use of earnings management.
Management can either smooth income streams by engaging in “real” transactions or by
accounting method choice. If income streams are smoothed by the use of accounting choice, this
method of income smoothing is referred to as artificial income smoothing.
Several motives exist for management to perform income smoothing. Management can apply
income smoothing due to regulatory motives or costs related to debt financing of the company.
Additionally, the management can also choose to perform income smoothing based for self-
interest purposes that are related to job and bonus contracts of the management. Both incentive
schemes and the risk of losing their job are motives for management to smooth income.
The objects, the dimensions, and the instruments, or devices of income smoothing have been
commented on. The smoothing object is the item or figure that management tries to smooth by
the use of a smoothing instrument and a smoothing dimension.
Several methods exist to measure the use of income smoothing. As the classical model has a lot
of down sides, academic researchers currently use other methods to measure income smoothing.
An often-used approach to measuring the use of income smoothing is by the use of accrual
45
models. These models define accruals as a proxy for the use of earnings management.
Additionally, the income variability method is applied by academic researchers to measure the
use of income smoothing. Although several approaches exist to measure income smoothing, no
approach is perfect. All current approaches can only identify the potential use of income
smoothing. No model can perfectly measure if a company is an income smoother or a non-
smoother.
46
4. Informativeness
4.1 Introduction
This chapter of the research will comment on the content of the term informativeness. Because
this research tries to answer the question if the use of income smoothing improves the
informativeness of earnings, it is necessary to realize good understanding of the term
informativeness. Consequently, this chapter will define the term informativeness, comment on
several elements of informativeness and describe a method to measure the informativeness of the
earnings.
4.2 Definition of Informativeness
Informativeness refers to the information value of a report, quote, or item. For example, if an
investor is searching for a new attractive investment opportunity several information sources will
be investigated. The investor will contact brokers, read prospectuses and analyst reports.
Additionally the investor will analyze the historic data of the company. Some information sources
will be more valuable than others will. This implies that one source provides a higher level of
informativeness than another does. Additional a quote from management related to the
performance of the company can sometimes be very informative for current and future investors.
More specific with respect to this research, informativeness is related to earnings of the company.
Tucker and Zarowin (2006) have defined the informativeness of the earnings as:
“The information value of past and present earnings about future earnings and cash flows.”
This definition of earnings informativeness implies that analysts and other users of the financial
statements can extract certain information elements from the financial statements that provide
forecasting information for future earnings. This is of course additionally applicable for quarterly
reports. As the yearly earnings that are reported in financial statements of a company are the
result of four quarters of earnings, the quarterly earnings reports can provide information about
the yearly earnings. The informativeness of earnings can consequently be described as the
predictive power of the earnings about future earnings and cash flows. Based on current year
earnings analysts and other users of the financial statements can create forecasts about future
earnings.
47
For management of the company it can be beneficial if the users of the financial statements can
create a sufficient forecast of the future earnings of the company. Several methods exist for
management to provide the users of financial statements with information about future earnings.
As was described in section 3.6, Ronen and Sadan (1981) state management can use income
smoothing as a method to signal about future earnings to the users of the financial statements.
Especially in the US, management of the company is very careful to provide any direct forecasts.
Because if management is unable to meet the forecast, investors of the company will respond
negative, management does not provide any direct forecast. Consequently, management needs to
use indirect methods to “signal” information about future earnings to the users of the financial
statements. These methods include signals provided during conference calls and announcements
about future investments or products. Nevertheless based on the statement of Ronen and Sadan
(1981), in addition management can also use income smoothing as a method to disclose their
private information. Sankar and Subramanyam (2001) additionally state that if managers are not
allowed to disclose their private information about future earnings, they can bias current reported
earnings within GAAP and reverse this bias in the next period.
If management smoothes the income stream such that a linear increasing earnings stream
originates, this will provide investors with information about future earnings. For example, if
earnings have increased five to seven percent for the past five years, investors will expect the
earnings of the current year to have increased by that same percentage. This is similar to the
economic growth of the Chinese economy during the first couple of years of the 21 st century. The
Chinese economy has had a very stable growth of about ten percent per year. However, this
steady growth of the Chinese economy can be considered as an informative factor for future
economic growth.
4.3 Informativeness of Financial Data
Although chapter 5 of this research will further comment on prior empirical research related to
earnings management, income smoothing and informativeness, this section of the research will
comment on the informativeness of several items.
Subramanyam (1996) performed research on the informativeness of the use of discretionary
accruals by management of companies. According to the research of Subramanyam, the
discretionary accruals have got a higher level of informativeness than the non-discretionary
accruals. This implies that management of companies can use their discretion over accruals to
communicate to stakeholders of the company about their private information. Earnings reported
by companies of which management has used their discretion to draft the financial statements
48
consequently posses more information about future earnings. This is valuable to analysts and
investors as they are able to create better forecasts based on the discretionary earnings.
Hunt, Moyer and, Shevlin (2000) additionally researched if discretion of the management over
the financial statements of the company increased the informativeness. This research even states
that regulation and guidelines issued by the IASB and FASB with respect to the comparability of
financial statement have limiting effects on the informativeness of the financial statements.
Consequently, a higher level of discretion, within the boundaries of the GAAP, increases the level
of informativeness.
Demski (1998) does not agree with Hunt, Moyer and, Shevlin (2000). According to Demski,
discretion of management on the financial statements can have three types of effect. First, it can
have no effect on the informativeness, because it is of no interest to the users of the financial
statements. Second, the users of the financial statements are aware of the discretion performed by
management but tolerate it. Third, it has a negative effect on the informativeness of earnings.
Consequently, Demski (1998) believes that discretion of management can only have a neutral or
negative effect on the informativeness of the financial statements and no positive effect.
Zarowin (2002) performed a study on the informativeness of stock prices. Stock price
informativeness is defined by Zarowin as the information value of current stock prices about
future earnings of the company. According to Zarowin, the discretion performed by management
over the financial statements of the company improves the informativeness of the current stock
prices. Consequently, the current stock prices better reflect the future earnings of the company. If
management uses their discretion over the financial statements to disclose their private
information about future earnings, the stock price of a company better reflects the actual value of
the company. Analysts and investors consequently obtain more information about future earnings
from stock prices based on discretion of management.
4.4 Informativeness and Efficient Markets
Section 2.5 of this research commented on the EMH. The EMH hypothesis states that as soon as
relevant new information becomes available about a company, the stock price of the company
immediately will reflect the new information. Consequently, the stock price of a company will
reflect all relevant available information for that company.
With respect to the term informativeness, it is necessary that the market is information efficient.
Consequently, the semi-strong or strong version of the EMH must hold. If management chooses
to apply their discretion over the financial statement to signal about future earnings, the market
need to be information efficient. Otherwise, the users of the financial statements will be unable to
49
receive the signal from management about the future earnings. The information value of for
example the use of discretionary accruals will be lost if the markets are not information efficient.
4.5 Decision Usefulness and Value Relevance
The content of the term decision usefulness was introduced in section 2.7. The financial
statements should be prepared by the management of the company in such a manner that it is
useful for the users of the financial statements for making economic decisions. Consequently, if
the informativeness of the financial statements increases, this will improve the decision
usefulness of the financial statements. According to Scott (2006), this is also related to the single
person decision theory. In this theory, an individual needs to make a rational decision under
uncertain conditions. If the informativeness of the financial statements increases, the individual
will change his or her subjective assessment of the outcome of the decision.
Additionally, informativeness is related to the value relevance of the financial statements. Scott
(2006) indicates that the value relevance of the financial statements is related to the material
effect of the financial statements on the stock prices. Markets need to subtract new information
included in the financial statements to include this new information in the stock prices. In
addition, according the EMH markets will only react to the financial statements if the financial
statements include new bad or good news. Consequently, if the management of the company uses
their discretion over the financial statements to signal their private information, the value
relevance of the financial statements will increase. This implies that the private information of the
management is new information for the markets. To measure the value relevance of the financial
statements academic researchers have applied methods related to the earnings response
coefficient (ERC). Measuring informativeness is commented on in the next section.
4.6 Measuring Informativeness
For academic research to measure if the discretion of management over the financial statements
of the company increases the informativeness, it is important to be able to measure the
informativeness. One method to measure informativeness exists that is used by several academic
researchers. This is the method of Collins et al. (1994). This method applies the future earnings
response coefficient (FERC) to measure informativeness. The FERC is a regression model that
studies the relation between current year stock returns and future earnings (Tucker and Zarowin,
2006). Based on the EMH (see also section 4.4 and 2.5), the FERC examines the amount of
information about the future earnings of a company that is reflected by the change in the current
stock price. According to the EMH, all available information is reflected by the stock price.
50
Consequently, based on at the stock prices of companies, the FERC takes all available
information available for a company in consideration. The FERC regression model as applied in
the study of Tucker and Zarowin (2006) is defined as:
Where: = Ex dividend stock returns for year t.
= Earnings per share for year t-1
= Earnings per share for year t
= Sum of earnings per share for years t+1 to t+3
= The aggregate stock return for years t+1 to t+3
Consequently, coefficient is the earnings response coefficient (ERC) and coefficient is the
future earnings response coefficient (FERC). For the current year earnings per share to provide
information about future earnings and cash flow, must be positive. For a more extensive
description of the FERC model, see chapter 6.
The informativeness methodology to study earnings management and income smoothing is a
relative new approach on earnings management. Schipper (1989) stated that not much light had
yet been shed on this approach. Since a couple of years, more research has commented on the
informativeness of earnings management and income smoothing. Because this is a very
interesting approach to study income smoothing, this research studies the relation of income
smoothing and the earnings informativeness of European listed companies. For more on the
informativeness of income smoothing refer to the next four chapters.
4.7 Summary
This chapter has commented on the term informativeness. Informativeness can be defined as the
information value of an information source. In the context of this research, informativeness is
related to information value of past and present earnings about future earnings and cash flows
(Tucker and Zarowin, 2006).
In relation to informativeness, several items can be considered. The discretion of management
over accruals and financial statements can provide information related to future earnings of the
company. Additionally stock prices can provide information about future earnings to analysts and
other users of the financial statements. Some researchers argue that if management discretion
over the financial statements increases, that the informativeness of the financial statements also
51
increases. In contrast, other research claims that only neutral or negative effects are related to
management discretion over the financial statements.
To measure informativeness it is necessary for markets to be information efficient. This implies
that either the semi-strong, or the strong version of the EMH must hold.
If the informativeness of the earnings increases, it is expected that the decision usefulness and the
value relevance additionally increase.
One method that is able to test the informativeness of earnings is the FERC developed by Collins
et al. (1994). This regression model measures informativeness by testing the relation between
current year stock returns and future earnings
Since a couple of years, more research has applied the informativeness approach to study the use
of earnings management and the use of income smoothing.
52
5. Prior Empirical Research
5.1 Introduction
This chapter will focus on prior empirical research. As was commented on in previous chapters;
the use of earnings management and more specific the use of income smoothing has been a hot
topic for financial accounting research. Consequently, this chapter will briefly comment on some
directions of prior empirical research on the use of earnings management. Additionally this
chapter will focus on empirical research on the use of income smoothing. Empirical research on
the use of income smoothing is related to several main topics such as: country studies, the
influence on the value of a company and income smoothing because of expected future earnings.
A more recent approach to study the use of income smoothing is the informativeness
methodology. As this research studies the effect of the use of income smoothing on earnings
informativeness, the final part of this chapter will comment on the informativeness methodology.
As this research applies the informativeness approach to study the use of income smoothing,
section 5.8 will include the research hypotheses. Additionally, for a total overview of the prior
empirical research commented on in this chapter, refer to appendix 1.
5.2 Empirical Research on Earnings Management
To realize a better understanding of the extensive amount of financial account research performed
on the use of earnings management, this section will comment on some studies. Included in this
section are four researches that have each focused on another element of the use of earnings
management.
5.2.1 Earnings Management and Stock Option Plans
Bartov and Mohanram (2004) have performed a study on earnings management in relation to
stock option exercises by top-level management of companies. They performed their study for
1.200 US listed companies for the period 1992 to 2001. Based on the fact that management is
expected to behave opportunistic to increase their own wealth (see also section 2.3), Bartov and
Mohanram suggest that management will manage the earnings of the company in favor of the
stock option plan. Additionally a hypothesis of this research is that stock option exercises by
management of companies are predictive about future earnings. Management is expected to use
earnings maximization before they cash their stock option plan. Consequently, earnings will be
positive before they exercise their stock option plan and negative after they exercise their stock
53
option plan. To measure earnings management Bartov and Mohanram use the Jones model to
measure the discretionary accruals. The research concludes that management does in fact use
their discretion over the financial statements to maximize earnings before they exercise their
stock option plans and that the earnings decrease in the following period.
5.2.2 Income Maximization
Dechow, Richardson and Tuna (2003) performed a study to answer the question why only a small
amount of companies report small loss while or many companies report a small profits. The
researchers expect that the management of companies try to maximize earnings by the use of
discretionary accruals. The use of earnings management consequently causes a “kink” in the
normal distribution of earnings of companies. This study uses a modified Jones model to measure
the use of discretionary accruals. The total data sample includes more than 47.000 companies for
the period of 1989 to 2001. However, the research performed is not conclusive on whether
management performs earnings management. Both the companies with small losses and the
companies with small profits have the same level of discretionary accruals. According to
Dechow, Richardson and Tuna (2003) several reasons exist why they were unable to prove their
hypothesis. First of all, although the use of earnings management exists, the method to measure
earnings management may be unable to detect it. Second, it is possible that the auditors of the
companies do not allow management to use their discretion over the financial statements in the
fourth quarter. Management was able to boost the performance of the companies in the first,
second the third quarter, but the discretionary accruals are not visible per year-end due to
comments of the auditors. Third, management can engage in real transactions to perform earnings
management. If that is the case, the researchers are unable to detect it with the modified Jones
model.
5.2.3 Earnings Management and Debt Covenants
Defond and Jiambolva (1994) study the use of earnings management in relation to companies that
have reported a breach of a debt covenant. The data sample consists of 94 companies for the
period of 1985 to 1988. The researchers expect that in the year before the breach of the debt
covenant took place, management of the company has performed earnings management. Defond
and Jiambolva apply the Jones model to measure the discretionary accruals. Consequently, the
hypothesis of this research predicts that in the year before the breach a higher level of
discretionary accruals is created by the management. Based on the research performed, evidence
is obtained that in the year before the breach positive discretionary accruals are measured, and in
54
the year of the breach negative, discretionary accruals are measured. However, because 24 of the
companies in the data sample had going concern issues in the year of the breach, it is possible that
auditors of the companies are responsible for conservative accounting in the year of the breach.
Additional 27 companies in the data sample experienced a change in management in the year of a
breach. Consequently, the negative accruals measured in that year could also be related to big
bath accounting. If these companies are excluded from the research results, Defond and
Jiambolva still found substantive evidence for earnings management in the year prior to the
breach.
5.2.4 Earnings Management and Minimization of Taxes
Another type of research performed on the use of earnings management is that of Boyton et al.
(1992). This research comments on if companies use earnings management to lower their tax
liabilities. The data sample included 649 companies for a period of 1980 to 1988. The Jones
model is applied to measure the discretionary accruals. After performing their empirical research,
Boyton et al. conclude that management of companies used negative discretionary accruals to
lower the tax liabilities of the companies. Additional the research concludes that in particular
small companies performed earnings minimization to decrease their tax liabilities. No evidence
was found for large firms to perform earnings minimization for tax purposes.
This section has provided some examples on the use of earnings management related to incentive
schemes, income maximization, and income minimization. The following sections will focus on
different types of research on income smoothing.
5.3 Income Smoothing and Country Studies
Some research on the use of income smoothing has focused on specific countries. Specific
country studies can be interesting due to the characteristics of the countries, such as the local
accounting rules and regulations. Country studies performed by Booth et al. (1996), Ashari et al
(1994) and Mande et al (2000) are commented on in this section.
5.3.1 Income Smoothing in Finland
Booth et al (1996) performed a study on the use of income smoothing in Finland. The hypothesis
of the research is that markets are expected to show a stronger reaction to earning announcements
of companies that do not have natural income streams than to earnings announcements of
companies that have natural income streams. Booth el al. specifically look at natural smooth
income streams, because they state that intentional smoothing of income streams does not affect
55
the company’s cash flow and consequently the share prices. Additional the researchers expect that
the affect of an earnings announcement of a company that does not have a smooth income stream
will have a slower affect on the share price than for a company with a smooth income stream.
This is due to the fact that it is more costly for analysts to perform research on companies that do
not have a smooth income stream. Booth et al. additionally state that it is interesting to research
this phenomenon in Finland, because the country has a relative small stock market and delays in
market reactions are expected to be better observable than for example in the US. The data
sample includes 31 companies listed on the Helsinki stock exchange for the period of 1989 to
1993. The researchers apply the income variability approach to measure income smoothing.
Based on the empirical research performed, Booth et al. find that 40% of the companies in the
data sample are qualified as income smoothers. Additionally the research shows that the
responses of the market on earning announcements are bigger for companies without smooth
income streams than for companies with smooth income streams. Furthermore, their research
showed that the Helsinki stock market responded slower to earning announcements for
companies without smooth income streams, than for companies with smooth income streams.
This is due to information processing costs.
5.3.2 Income Smoothing in Singapore
Ashari et al. (1994) studied which factors affected the use of income smoothing for listed
companies in Singapore. The study of Ashari et al. has a data sample of 153 companies listed on
the Singapore stock exchange for the period of 1980 to 1990. Ashari et al. want to research if
certain factors exist that are related to income smoothing. Consequently, this research is
comparable with the empirical researches commented on in section 5.4. The researchers
formulate four hypotheses. The first hypothesis states the use of income smoothing is not
dependent on the size of the company. The second hypothesis states that the use of income
smoothing is not dependent on the profits of the company. The third hypothesis states that the use
of income smoothing is not dependent on economic sector. The fourth hypothesis states that the
use of income smoothing is not dependent on whether a company is located in Singapore or
Malaysia. After performing their empirical research, Ashari et al. obtained the following research
results. First, large companies apply more income smoothing than small companies. This is in
line with the political cost hypothesis of Watts and Zimmerman (1990) and the agency theory;
that large firms are expected not to prefer large profits. Additionally the more profitable
companies are, the less likely they are to smooth the income. The economic sector also influences
the use of income smoothing. Especially companies in risky economic sectors such as hotels and
56
real estate are more likely to perform income smoothing. Additionally companies located in
Malaysia apply more income smoothing than their counterparties in Singapore. Consequently the
research performed by Ashari et al. (1994) indicates that certain factors exist that influence the
use of income smoothing.
5.3.3. Income Smoothing in Japan
Mande et al. (2000) study the use of income smoothing of Japanese companies by the use of
discretionary R&D expenditures. This is an interesting study, because much global R&D
companies are located in Japan. Especially after the Second World War, R&D and innovation has
been the key to the economic recovery of Japan. The data sample consists of 123 Japanese
companies for the period of 1987 to 1994. The use their own regression model to measure
unexpected R&D expenditures of companies. The main hypothesis of the research is that
Japanese managers use their discretion over R&D expenditures to match analyst forecast of
earnings before R&D expenditures. Additionally the research studies the relation between analyst
sales forecasts and unexpected R&D expenditures. The empirical research performed shows that
the R&D budget of companies is changed based on current period earnings of the companies.
This is the case for companies that experience a growth in business activities and companies that
experience a decrease in business activities. Consequently, the level of R&D expenditure is a
result of earnings management instead of rational business decisions. This is additionally
interesting because although the differences in corporate governance systems, these results are the
same as for US companies.
5.4 Income Smoothing and Company Characteristics
Some prior empirical research performed by academics has focused on if certain characteristics of
companies have an influence on the use of earnings management. Belkaoui and Picur (1984),
Albrecht and Richardson (1990) and Carlson and Bathala (1997) have all studied certain
company characteristics to explain income smoothing. These three researches are commented on
in this section.
5.4.1 Differences in Core and Periphery Sectors
Belkaoui and Picur (1984) performed a research to study if differences in economic sectors (core
and periphery) have an influence on the use of income smoothing. They use a variant of the
income variability model to test income smoothing. Additionally a logit model is applied to test
the relation between sector characteristics and income smoothing. They compare the change in
57
expenses to the change in ordinary income. The data sample includes 171 US companies of which
114 companies are from the core sectors and 57 companies are from the periphery sectors. The
research period is from 1958 to 1977. The researchers use the dual economy approach to study
income smoothing, because they believe that differences between the core sectors and the
periphery sectors will explain the differences in the use of income smoothing. The core sectors
are defined as sectors in which sophisticated corporate cultures and high-educated employees that
do not face much job insecurity. Consequently, the companies in the core sectors operate in a
relative stable environment. The companies in the periphery sectors face less stable
environments. Consequently, Belkaoui and Picur (1984) form the hypothesis that management of
companies in the periphery sectors is more likely to perform earnings management than
management of companies in the core sectors. This is because the structure and environment of
the companies in the periphery sector provides more opportunities and motives for management
to perform income smoothing. Based on empirical research performed, Belkaoui and Picur
conclude that the majority of the companies in their data sample perform income smoothing.
Additionally relatively more companies in the periphery sectors apply income smoothing than in
the core sectors. Consequently, the research performed shows that certain company
characteristics influence the use of earnings management.
5.4.2 Differences in Core and Periphery Sectors Part 2
Albrecht and Richardson (1990) perform a similar research as was performed by Belkaoui and
Picur (1984). Instead of testing the use of income smoothing by comparing the change in
expenses to the change in ordinary income, Albrecht and Richardson use the standard income
variability model to test income smoothing. Additional a logit model is used to test if differences
in sectors influence income smoothing. The research period is from 1974 to 1985 and the data
sample includes 128 companies. The empirical research performed does not show the same
results as the research performed by Belkaoui and Picur. The research of Albrecht and
Richardson does not conclude that companies in the periphery sectors use a higher level of
income smoothing than the companies in the core sectors. The researchers provide several
reasons for this. First, some smoothers are successful in smoothing the stream of earnings and
others are not. Second, some companies that are classified in the core or periphery sectors may in
fact possess characteristics of both sectors. Consequently companies can be misclassified as
either core or periphery sector companies. Additionally, other company characteristics can
influence the use of income smoothing. Albrecht and Richardson consequently conclude that
although the opportunities in the core sectors to apply income smoothing are smaller than in the
58
periphery sectors, however the motives to perform income smoothing in the core sectors can be
greater. Additionally management of companies in the core sectors can be more successful in
performing income smoothing. This research proves that companies perform income smoothing,
but is unable to provide sufficient evidence for smoothing behavior differences between the core
and periphery sectors.
5.4.3 Differences in Ownership of Companies
Carlson and Bathala (1997) performed empirical research to study if differences in ownership
structures of companies are related to the use of income smoothing behavior. The researchers
apply the income variability model to test income smoothing. Just as Belkaoui and Picur (1984)
and Albrecht and Richardson (1990), this research applies a logit model to test the relation
between company characteristics (especially ownership characteristics) and the use of income
smoothing. The data sample includes 256 companies for the period of 1982 to 1988. As was
commented on in chapter 2, the agency theory predicts that a separation of ownership and
management of a company can influence the level of income smoothing due to opportunistic
behavior of the management. Additionally one of the motives of income smoothing was
explained in chapter 3 by the use of the agency theory. According to Carlson and Bathala (1977)
several factors in ownership structure exist that can influence to use of income smoothing. The
first factor is the difference in owner or manager control over the company. If management
control over the company increases, the discretion of the management over the financial
statements of the company also increases. Consequently, an increase of management control
could indicate an increase in the use of income smoothing. Second, institutional ownership of a
company is considered to be a factor. This factor assumes that institutional investors will invest in
a company to realize short-term investment profits. This could pressure management of the
company to focus on short term earnings. Consequently, the management can apply income
smoothing to meet the expectations of the institutional investors. Third, debt financing of the
company is acknowledged as a factor. If the debt / equity ratio of a company increases, the
management is more likely to perform income smoothing to avoid a breach in the debt covenants
(see in addition chapter 3). The fourth factor is ownership dispersion. If dispersion of ownership
increases, shares are held by a large group of investors, the discretion of management increases.
The empirical research proves that the ownership structure of a company is an explanatory factor
for the use of income smoothing. The study finds that if management control over the company
increases, the use of incomes smoothing also increases. Additionally debt financing and
59
institutional ownership are related to the use of income smoothing. Consequently, differences in
ownership structures of companies are related to the use of income smoothing.
5.5 Income Smoothing and the Value of the Company
Other empirical research performed by academics has studied if the use of income smoothing by
the management has an affect on the value of the company. As was stated in chapter 3, analysts
and investors prefer income streams that are smooth compared to variable. If a smooth income
stream is preferred, one could argue that a smooth income stream is also valued higher than a
variable income stream. Bao and Bao (2004), Bitner and Dolan (1996) and Michelson et al. (1995
and 2000) have all studied the influence of income smoothing on the value of the company.
5.5.1 Market Valuation of Income Smoothing
Michelson et al. (1995) study if the use of income smoothing influences the market valuation of
companies. The data sample includes 358 companies of the Standard and Poor 500 Index for the
period of 1980 to 1991. The researchers use the income variability model to measure incomes
smoothing and measure the value of the companies by measuring the daily returns. The study
examines four different smoothing objects to determine if a company performs income
smoothing. These are, operating income after depreciation, pretax income, income before
extraordinary items, and net income with respect to the coefficient in the variation in sales
(Michelson et al, 1995). The empirical research provides evidence that companies that use
income smoothing have got a higher market value than companies that do not use income
smoothing. Based on this research, companies that use income smoothing are perceived to have a
lower level of risk and to be more stable. Consequently, the use of income smoothing increases
the market value of the companies.
5.5.2 Market Valuation of Income Smoothing Part 2
Bitner and Dolan (1996) performed a similar research as Michelson et al. (1995). This research
also applies the income variability model to measure the use of income smoothing and Tobin’s Q
is applied to measure market valuation of companies. The data sample includes 218 companies
for the period of 1976 to 1980. The research is based on two hypotheses. The first hypothesis
states that markets are willing to pay a premium for smooth income streams and the second
hypothesis states that the valuation of markets differentiates between natural and intentional
smooth income streams. Based on the empirical research performed the researchers conclude that
markets value the use of income smoothing. Additionally, markets are able to value the type of
60
income smoothing. It is interesting to see that the management of companies applies income
smoothing, even if the market is able to detect the use of income smoothing. Bitner and Dolan
(1996) suggest that although the markets are able to detect and value income smoothing, some
level of income smoothing remains undetected. Management consequently believes that they can
still fool the market. The empirical research performed supports this. Markets are unable to fully
take away the effects of the use of income smoothing on the reported earnings of the companies.
The research of Bitner and Dolan Supports the empirical evidence found by Michelson et al.
(1995).
5.5.3 Market Valuation of Income Smoothing Part 3
Michelson et al. (2000) performed a follow-up research to their 1995 research. The data sample
again includes 358 companies from the Standard and Poor 500 Index for the period of 1980 to
1991. Michelson et al. apply the income variability approach to measure income smoothing. The
researchers use abnormal returns to measure if the use of income smoothing influences the
market value of the companies. They first use a model to calculate the normal returns and than
subtract the normal returns from the actual returns to calculate the abnormal returns. Just as in
1995, Michelson et al. focus on four smoothing objects to determine if a company classifies as an
income smoother. The main hypothesis of the research is that the markets react positive to
income smoothing behavior. Based on the empirical research performed the researchers conclude
that companies that qualify as income smoothers have significant higher abnormal returns than
non-smoothers. Additional, small companies have higher abnormal returns than large companies.
However, more large companies are qualified as smoothers than small companies. In addition, the
researchers find that the use of income smoothing differs per economic sector. This is in line with
the prior empirical research commented on in section 5.4. Consequently, this research of
Michelson et al. (1995) contributes to prior empirical research on income smoothing and
company valuation.
5.5.4 Income Smoothing, Earnings Quality and Firm Valuation
Bao and Bao (2004) argue that the valuation of companies is not only dependent on the use of
income smoothing but also on the quality of earnings. Consequently smooth income streams are
only perceived by the market as more valuable if the earnings are of high quality. The data
sample includes over 12.000 company year observations for the period of 1988 to 2000. The
researchers apply an alternative version of the income variability model to measure income
smoothing and the model of Sloan (1996) to measure the quality of earnings. This study applies
61
two dimensions to classify companies. First, companies are divided in smoothers and non-
smoothers. Second, companies are divided in quality earning companies and non-quality earning
companies. The quality of earnings is defined as the value relevance of the earnings. If
management of the company uses income smoothing to signal their private information about
future period earnings, the quality of the earnings should increase. Additionally, if income
smoothing improves the quality of earnings, the relation between reported earnings and the value
of the company should also improve. The empirical results of Bao and Bao (2004) are different
from those found by the other researches commented on in this section. This research concludes
that income smoothing without an increase in the quality of earnings does not improve the value
of the company. The value of quality earning companies is higher than the value of non-quality
earnings companies. Consequently, income smoothing only increases the value of a company if it
also increases the quality of the earnings of that company. Therefore this research adds to the
previous commented on researches that income smoothing only influences company value if the
management uses income smoothing to signal their private information about future earnings.
5.6 Income Smoothing and Expected Earnings
Academic researchers such as Defond and Park (1997) and Elgers et al. (2003) have studied if
income smoothing is performed by the management of companies in anticipation of future period
earnings. If current period earnings are bad and future period earnings are expected to be better,
management can borrow future period earnings in the current period. Consequently, if current
period earnings are good and future period earnings are expected to be worse, management can
save current period earnings for the future. The research on this type of income smoothing
behavior is commented on in this section.
5.6.1. Smoothing in Anticipation of Future Earnings
Defond and Park (1997) study if worries about job security of management are related to the use
of income smoothing. The data sample includes over 13.000 company year observations for the
period of 1984 to 1994. Additionally a modified Jones model is applied to measure income
smoothing. The empirical research performed by Defond and Park (1997) is based on the theory
presented by Fudenberg and Tirole (1995), that management will perform income smoothing if
they are afraid to loose their jobs. Consequently, management if management uses its discretion
over the financial statements of the company, they will consider expected future earnings.
Additionally Defond and Park provide two reasons why management will smooth the income of
the company in anticipation of future earnings. First, if management misses certain benchmarks,
62
this will affect their credibility. Second, current period earnings are more important for the
evaluation of the performance of management than future period earnings. These assumptions
that are based on the theory of Fudenberg and Tirole are tested empirically by Defond and Park.
Management’s (expected) performance is considered to be good by the researchers if the
performance is above the sector median performance. It is expected that management with bad
performance in the current period (and good expected performance) will use income-increasing
accruals and that management with good performance in the current period (and bad expected
performance) will use income-decreasing accruals. The empirical results show that 89% of the
management of companies included in the data sample applies income smoothing discretion in
accordance with the predicted behavior. Additionally the researchers conclude that predictions
related to income smoothing based on current and future earnings are more accurate than
predictions based on only current earnings. However, the results of the sensitivity analysis are
mixed. According to the researchers, their research could consequently be biased due to the
selected of variables to measure current period performance.
5.6.2 Smoothing in Anticipation of Future Earnings Part 2
Elgers et al. (2003) perform a follow-up study based on the research performed by Defond and
Park (1997). They performed this follow-up study, because the method applied by Defond and
Park to measure the unmanaged earnings is biased. The researchers apply the modified Jones
model to measure income smoothing. The data sample includes over 14.000 company year
observations for the period of 1984 to 1999. To perform their empirical research, Elgers et al. first
test the relationship between income smoothing and the use of discretionary accruals. These
results are the same as provided in the paper of Defond and Park. Additionally another approach
is introduced to measure income smoothing. Defond and Park (1997) use a randomized approach
to create an empirical distribution of discretionary accruals. This approach shows that the
evidence of Defond and Park that companies perform income smoothing, can not be
distinguished from evidence based on discretionary accrual estimates that are random numbers.
Elgers et al. also observe that the relationship between forecast errors as a measure of smoothed
earnings and forecasts as a measure of non-smoothed earnings is a biased approach. This is due to
the fact that the measurement of forecast errors also contains errors. Additionally the use of cash
flows as a proxy for non-smoothed earnings is useless to measure if the management of
companies performed income smoothing. Consequently, the research is inconclusive to proof that
management of companies will smooth the income of the company in anticipation of future
earnings. This does not imply that the theory of Fudenberg and Tirole (1995) is worthless, but
63
only that the methods of Defond and Park are not able to test the theory of Fudenberg and Tirole.
This is mainly due to the fact that according to Elgers et al. the method of Defond and Park is not
capable of correctly measuring the non-smoothed earnings of the companies.
5.7 The Informativeness Methodology
The informativeness methodology to study the use of income smoothing is a relative new
approach. Before 1989, this approach was not yet generally adopted by academic financial
accounting research (Schipper 1989). If the management of companies uses income smoothing to
disclose private information, than the discretion over the financial statements of the management
is considered to be valuable to the users of the financial statements. Much prior research had
focused on the negative aspects of the use of income smoothing, but the informativeness
methodology focuses on the positive aspects of the use of income smoothing. Consequently, this
has become a very interesting and popular approach amongst academic researchers. Additionally
this type of research on the use of income smoothing is interesting for regulatory bodies as it
studies if the flexibility in accounting standards that allows for management discretion to be
performed increases or decreases the decision usefulness of the financial statements.
Subramanyam (1996), Hunt, Moyer and Shevlin (2000), Zarowin (2002) and Tucker and Zarowin
(2006) applied the information methodology to study income smoothing. These researches are
commented on in this section.
5.7.1 Pricing Discretionary Accruals
Subramanyam (1996) performed empirical research to test if stock markets price discretionary
accruals applied by management of companies. The research applies a modified Jones model to
measure the discretionary accruals and consequently the use of income smoothing. The data
sample includes over 21.000 company year observations over the period of 1973 to 1993.
Consequently, this research contributes to research on the processing of financial accounting
information by the capital markets. Additionally this research provides information on the
incentives for the management to use discretionary accruals and the nature of the discretionary
accruals. The empirical research results show that market price discretionary accruals. Two
scenarios exist for the pricing of discretionary accruals by the stock markets. The first scenario
implies that efficient markets are able to price discretionary accruals because they contain the
private information from the management about future earnings of the company. The second
scenario implies that the discretionary accruals are the result of opportunistic behavior of
management and consequently distort the informativeness of the earnings. The empirical research
64
performed by Subramanyam (1996) concludes that income smoothing improves the predictability
of future earnings and that discretionary accruals are used by the management of the company to
communicate private information about the future period earnings. Consequently, this research
contradicts that income smoothing decreases the value relevance of the earnings. Although
Subramanyam acknowledges that income smoothing can be the result of opportunistic behavior
of the management of the companies, the empirical research does not support this. Additionally
the empirical research shows that the use of discretionary accruals is priced positively by the
stock markets. The final addition that this research makes is that accounting choice by the
management of companies benefits the informativeness of earnings and that consequently
flexibility in accounting standards should be allowed.
5.7.2 Income Smoothing and Equity Value
Hunt, Moyer and, Shevlin (2000) studied if the use of the discretionary accruals increases or
decreases the informativeness of the earnings. The data sample includes 2.225 companies for the
period of 1983 to 1992. The research applies a modified Jones model to measure the use of
discretionary accruals and consequently the use of income smoothing. Subramanyam (1996)
performed a similar study as Hunt, Moyer, and Shevlin, but did not include in his research the
affect of the use of income smoothing by the use of discretionary accruals on the pricing of
earnings. Hunt, Moyer, and Shevlin consequently have included the influence of the use of
income smoothing on the pricing of earnings in the research. To asses if the use of income
smoothing increases or decreases, the informativeness of earnings the researchers use a regression
model to measure the relationship between the earnings multiplier and the discretionary accruals.
Based on the empirical research performed the researchers find that for a certain earnings level
the use of income smoothing has a positive effect on the equity value of the company.
Additionally, the use of income smoothing by the use of discretionary accruals has a larger
positive affect on the equity value of the company, than the use of income smoothing by the use
on non-discretionary accruals. The researchers conclude that the cash flow and accruals of the
company are value relevant. The variability of earnings is priced by the stock markets.
Additionally the researchers state that the use of discretion by management of companies over the
financial statements increases the informativeness of the earnings instead of decreasing the
informativeness of the earnings.
65
5.7.3 Income Smoothing and Stock Price Informativeness
Zarowin (2002) performed empirical research to study if the use of income smoothing increases
the informativeness of stock prices. Consequently, if the stock prices of companies that use
income smoothing provide more information about future earnings than the stock prices of
companies that do not use income smoothing. The data sample includes over 24.000 company
year observations for the period of 1991 to 1999. Zarowin applies a modified Jones model to
measure the use of discretionary accruals and consequently the use of income smoothing. The
FERC model of Collins et al. (1994) (see also chapter 4) is applied by Zarowin to measure the
relation between the current earnings and the future period earnings. If the use of income
smoothing increases the informativeness of the stock prices, the FERC should be higher for
smoothers than for non-smoothers. Zarowin however warns that both to model to measure the
discretionary accruals and the model to measure the informativeness are generally accepted
models, but that these models are based on hypotheses. Consequently, no definitive proof exists
that the results based on these models are conclusive. The empirical research performed shows
that the use of income smoothing increases the informativeness of the stock prices. Although the
studies of Subramanyam (1996) and Hunt, Moyer, and Shevlin (2000) started the informativeness
approach, the study of Zarowin (2002) is the first study that uses the informativeness approach to
study income smoothing.
5.7.4 Income Smoothing and Earnings Informativeness
Tucker and Zarowin (2006) performed a similar research as Zarowin (2002) to study if the use of
income smoothing increases the earnings informativeness. The study performed by Tucker and
Zarowin is also the basis for this research. Tucker and Zarowin use a modified Jones model to
measure the use of discretionary accruals and consequently the use of earnings management. Just
as Zarowin (2002), Tucker and Zarowin (2006) use the FERC model of Collins et al. (1994) to
measure the relation between the current earnings and the future period earnings. The data sample
includes over 17.000 US company year observations for the period of 1993 to 2000. Tucker and
Zarowin state that the more information about future earnings is available to the management of a
company, the better the management is able to perform income smoothing. Consequently, the
information of the management about future earnings is disclosed by the use of discretion over
the financial statements. If this signaling of private information by the management of the
companies is “received” by the users of the financial statements, the stock prices should reflect
the information. The stock prices consequently reflect the change in expectation of the users of
the financial statements about the future period earnings (Tucker and Zarowin, 2006). The
66
hypothesis of the researchers is that if the use of income smoothing discloses private information
of the management, the informativeness of the earnings of the company should increase. The
empirical research results show that companies perform income smoothing. Additionally the
results show that the use of income smoothing increases the informativeness of the earnings.
Consequently, it is important that the management of the companies is allowed by the financial
accounting standards to perform a certain level of discretion over the financial statements to
communicate their private information. This implies that income smoothing is not considered to
be garbling behavior by the management, but of value relevance to the users of the financial
statements. The stock prices of companies that smooth their earnings contain more information
about future earnings, than the stock prices of non-smoothers. Additionally Tucker and Zarowin
(2006) state that the informativeness approaches can be used to study other types of earnings
management.
5.8 Research Hypotheses
This section will provide the research hypotheses based on the prior empirical research
commented on in the previous sections. According Bao and Bao (2004) research on the use of
income smoothing has been successful due to the fact the academic researchers have been able to
measure which companies use income smoothing. Additionally, empirical research commented
on in this chapter has provided sufficient evidence that academic researchers have successfully
measured the use of income smoothing. Consequently, the first hypothesis of this research can be
formulated as the following:
H1
The management of companies uses income smoothing as a type of earnings management.
Ronen and Sadan (1981) stated that income smoothing is used by the management of companies
to signal about future earnings of the company. This is the basis for the informativeness
methodology commented on in section 5.7. Several academic researchers have found empirical
evidence that income smoothing increases the informativeness of earnings and stocks. One of the
most recent studies of Tucker and Zarowin (2006) has contributed to the informativeness
approach to study the use of income smoothing. This research will perform a similar study as that
of Tucker and Zarowin, but for a European data sample. Consequently, the second research
hypothesis can be formulated as the following:
67
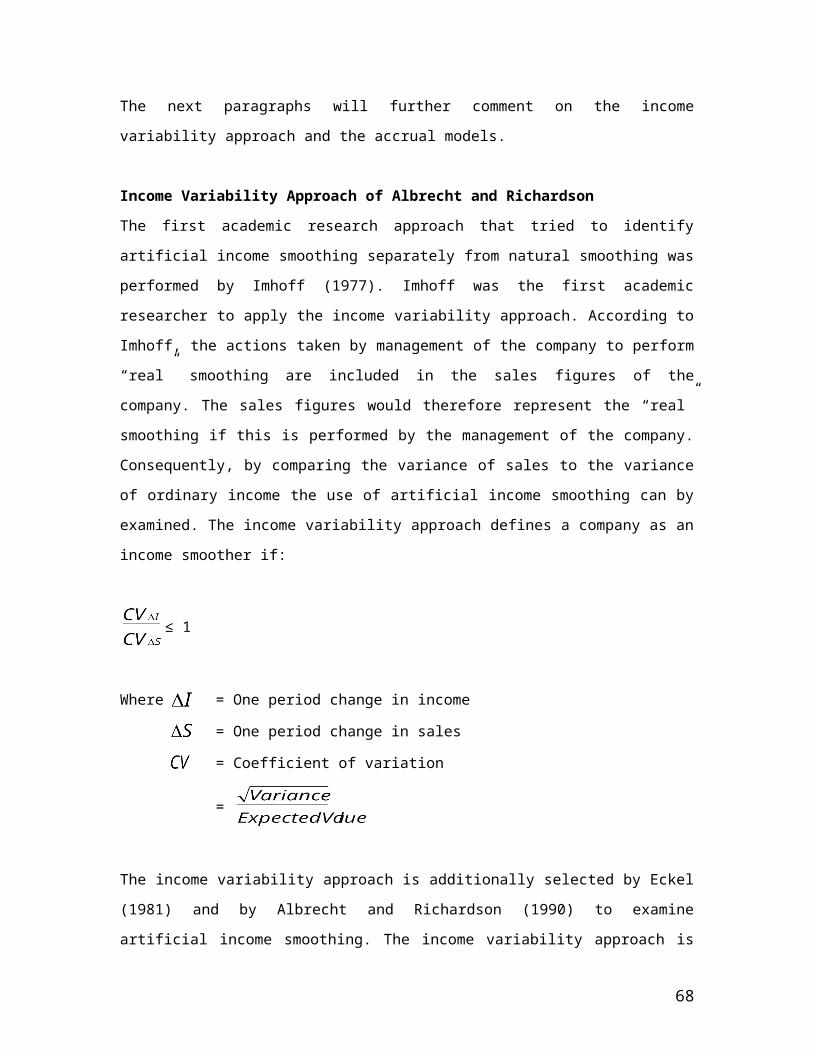
H2
The use of income smoothing increases the informativeness of earnings.
The research methodology to test these two hypotheses is described in chapter 6. The empirical
results are consequently presented in chapter 7.
5.9 Summary
This chapter has provided an overview of prior empirical research on the use of earnings
management. Empirical research has provided evidence that earnings management is performed
to maximize the earnings of the company, to cash stock options against a high price, to avoid the
breach of debt covenants and to minimize the corporate tax liabilities.
Additionally this chapter has commented on the different types of studies performed on the use of
income smoothing. Studies performed by Booth et al. (1996), Ashari et al (1994) and Mande et al
(2000) provided evidence that income smoothing is a world wide phenomenon. Although
different governance structures and accounting standards exist in the different countries, the
management of different countries performs income smoothing.
Another approach to study the use of income smoothing is to search for evidence if certain
company characteristics are related to the use of income smoothing. Belkaoui and Picur (1984),
Albrecht and Richardson (1990) and Carlson and Bathala (1997) all provided evidence that
company characteristics such as size, economic sector and ownership structure are related to the
use of income smoothing.
Bao and Bao (2004), Bitner and Dolan (1996) and Michelson et al. (1995 and 2000) have all
studied the influence of income smoothing on the value of the company. These academic
researches provided evidence that the use of income smoothing positively influences the value of
companies. However, Bao and Bao (2004) stated that the use of income smoothing only increases
the company value if it also increases the quality of earnings.
Academic researchers such as Defond and Park (1997) and Elgers et al. (2003) have provided
empirical evidence that the use of income smoothing is performed by the management of
companies in anticipation of future period earnings. If current period earnings are bad and
expected future period earnings are good, management will borrow the future period earnings for
the current period.
The informativeness methodology to study the use of income smoothing is a relative new
approach. Subramanyam (1996), Hunt, Moyer, and Shevlin (2000), Zarowin (2002) and Tucker
68
and Zarowin (2006) have provided empirical evidence that the use of income smoothing increases
the informativeness of earnings and stock prices.
For a total overview of prior empirical research, refer to appendix 1.
Consequently, the two research hypotheses are formulated based on the prior empirical research
commented on in this chapter. The first hypothesis states that the management of companies uses
income smoothing as a type of earnings management. The second hypothesis states that the use of
income smoothing increases the informativeness of earnings.
69
6. Research Design
6.1 Introduction
This chapter will focus on the research design that will be used to test empirically the hypotheses
that have been formulated in chapter 5. Additionally this chapter will provide the basis theory for
the research design. The models to measure the use of income smoothing and to measure the
informativeness of the earnings are extensively described. Furthermore, the data sample of this
research is commented on in this chapter.
6.2 Empirical Research Process
The previous chapters have provided the conceptualization of this research. Chapter 2 has
described the basic economic theories that are the foundations for financial accounting research.
Chapter 3 has commented on the term income smoothing and chapter 4 has commented on the
term informativeness. Consequently, the main elements of this research have been specified by
the use of a literature study. However, to test the hypotheses provided in chapter 5, this research
needs to include empirical observations.
To be able to conclude if the management of companies applies earnings management academic
researchers need empirical observations. As is stated by Copeland (1968) the use of earnings
management and more specific the use of income smoothing can either be tested by the use of
surveys or by the use of ex-post data. Several weaknesses exist that are related to surveys. First of
all consists of several subjective elements. Questions can be interpreted in several ways by the
respondents of the survey. Additionally, the results of the survey depend on the answers provided
by the respondents. These answers will always have an element of subjectivity and consequently
the results of the survey will never be fully objective. Furthermore, the results will vary
dependent on which the researchers include in their survey population. A survey about the use of
income smoothing will receive different answers from an auditor than from a regulator.
Consequently, most academic researchers have not opted for this type of research method to
study the use of income smoothing.
The majority of the academic researchers have chosen a research method based on ex-post
company data to study the use of income smoothing. This quantitative approach uses company
data that is stored in databases such as Thomson One Banker and Compustat. This research on the
use of income smoothing will also use ex-post data to study the use of income smoothing.
70
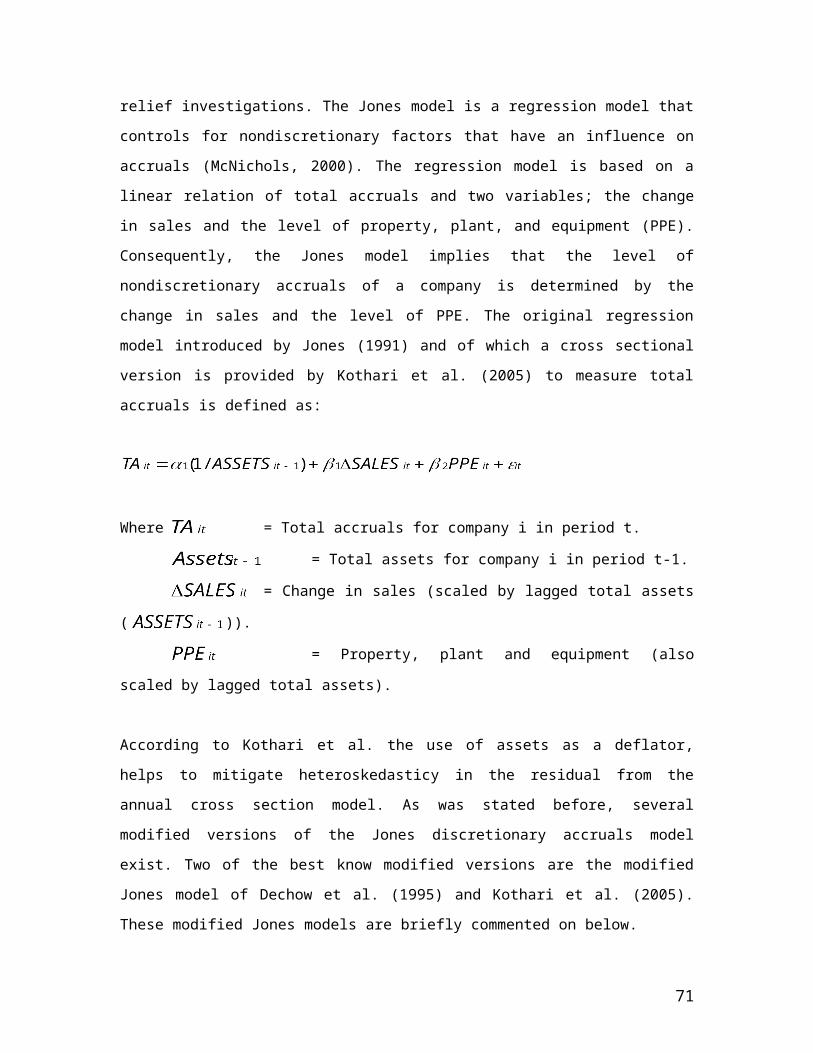
As was commented on in chapter 3, several methods exist to measure the use of income
smoothing. The two main methods to measure the use of income smoothing is by the use of a
(modified) Jones model or by the use of an income variability model. The Jones model that was
introduced by Jones (1991) separates the accruals in the discretionary accruals and the non-
discretionary accruals. Additionally, the use of income smoothing is measured by the correlation
between the pre-managed earnings and the discretionary accruals. The Jones model has been very
popular amongst academic researchers. Kothari (2005) and Dechow et al. (1995) introduced
modified Jones models by adding additional variables to the original Jones model. Prior empirical
research commented on in chapter 5 of Bartov and Mohanram (2004), Dechow, Richardson and
Tuna (2003), Defond and Jiambolva (1992), Boyton et al. (1992), Defond and Park (1997) and
others have applied the (modified) Jones model to measure the use of income smoothing.
The other main method to measure the use of income smoothing is the income variability method.
This method does not incorporate accruals. Instead, it studies the ratio of the coefficient of
variation of one period change in income and the coefficient of variation of one period change in
sales. This method was initially introduced by Imhoff (1977) and applied by academic
researchers such as Eckel (1981), and Albrecht and Richardson (1990). Prior empirical research
commented on in chapter 5 of Booth et al. (1996), Belkaoui and Picur (1984), Carlson and
Bathala (1997), Michelson et al. (1995 and 2000), Bitner and Dolan (1996) and others have
applied the income variability method to measure the use of income smoothing. This research
will also apply the income variability method to measure the use of income smoothing. The
model is extensively commented on in section 5.4.
Although both methods have proven to be successful to measure the use of income smoothing,
the results of the methods are based on models. This is a limitation of the methods that apply ex-
post data to measure the use of income smoothing. This implies that the methods applied to
measure the use of income smoothing can only indicate if a company is a smoother or a non-
smoother. Consequently, if a method indicates that a company is a smoother, it could be that in
reality the company is a non-smoother and vice versa.
6.3 Research Theory
This section provides a brief overview of the theory of this research that is based on the research
performed by Tucker and Zarowin (2006). The second research hypothesis provided in chapter 5
states that the use of income smoothing increases the informativeness of the earnings. This
section explains why it is expected that the use of income smoothing increases the
informativeness of the earnings, based on the model provided on the next page.
71
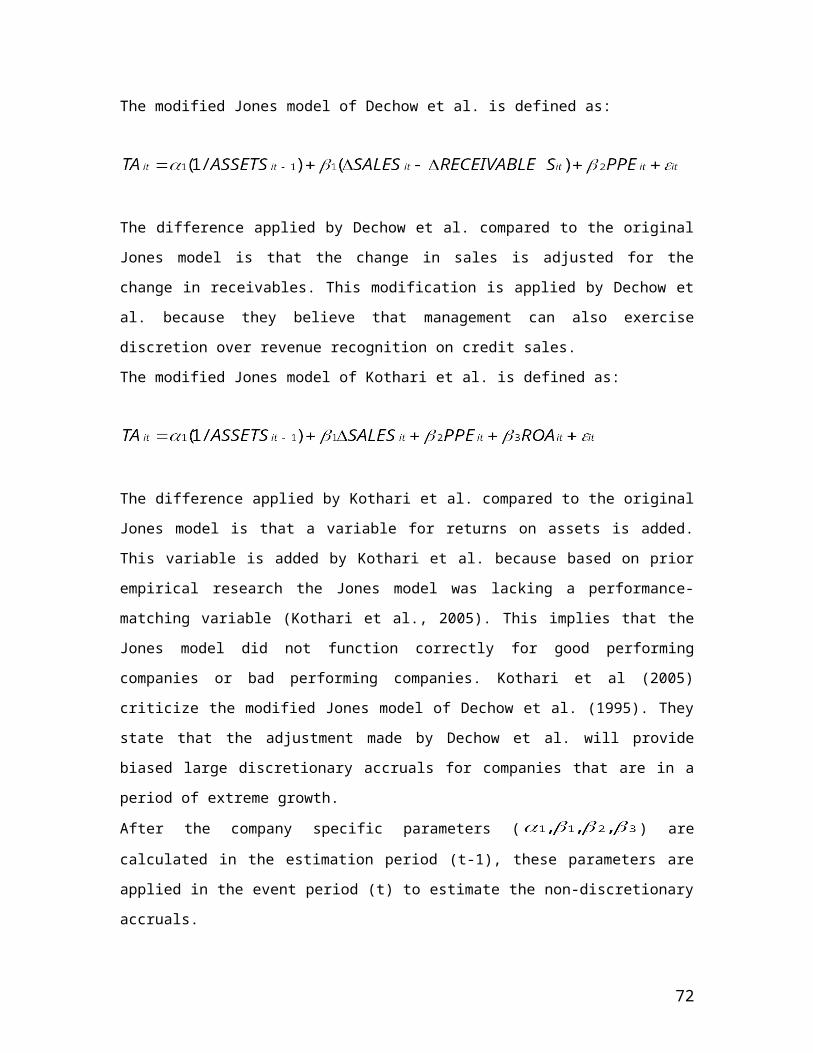
Model 6.1 of Tucker and Zarowin (2006)
72
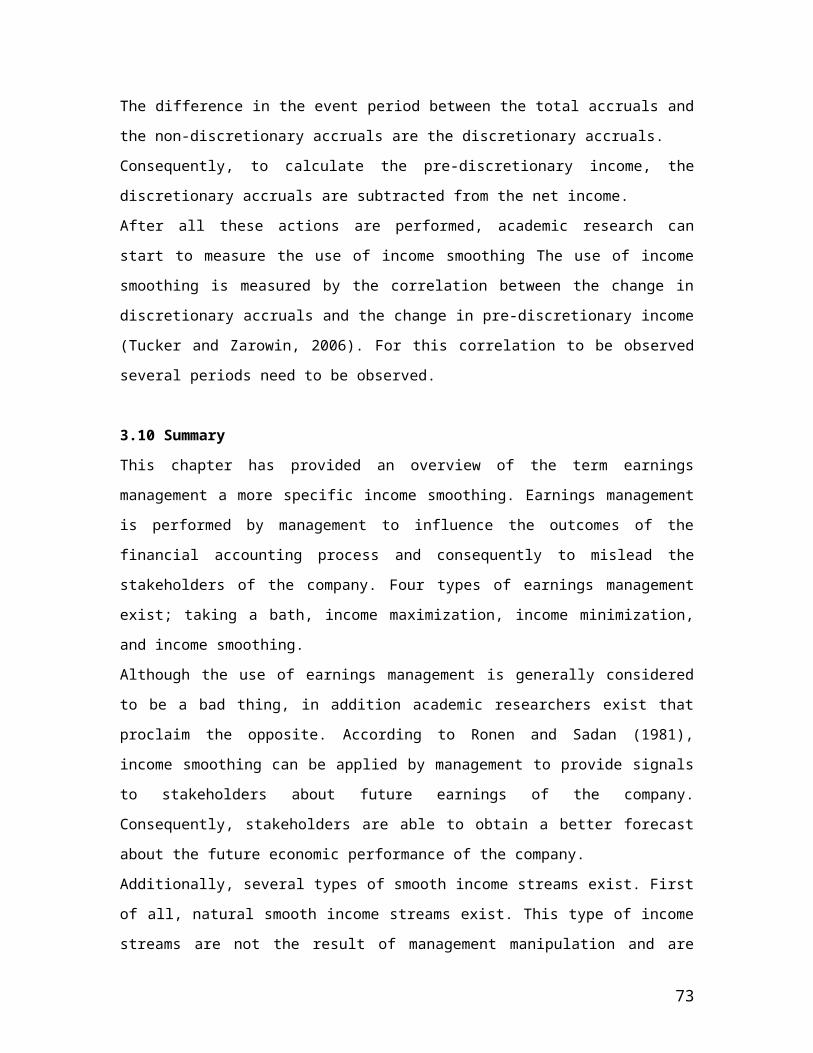
The model on the previous page explains in which way the current earnings can provide
additional information about the future earnings if income smoothing is applied by the
management of the company. If the current earnings are in line with the past earnings and
consequently form a smooth income stream, information about future earnings is revealed.
Consequently, it is essential to be able to differentiate companies in smoothers and non-
smoothers. This is explained in section 5.4.
The information about future earnings that is revealed by the current earnings is aggregated in the
stock price together with other sources of information. The change in the current stock price
reflects the information about the future earnings. Consequently, it is essential to measure the
relations between the past earnings, the current earnings, and the future earnings. This is
explained in section 5.5
6.4 Method to Measure Income Smoothing
This section will describe the income variability method. This is the method that this research
will apply to measure income smoothing. Together with the method to measure the
informativeness of the earnings as described in section 5.5, this is the operationalization of the
research design.
The income variability method to measure artificial income smoothing that was introduced by
Imhoff (1977) and applied by Eckel (1981) and Albrecht and Richardson (1990) is based on the
following assumptions:
If
And
And
And
And
Then
Where = Income in Euros
= Sales revenue in Euros
= Fixed costs in Euros
= Ratio of variable costs to sales in Euros
= Coefficient of variation for the change in sales in Euros
= Coefficient of variation for the change in income in Euros
73
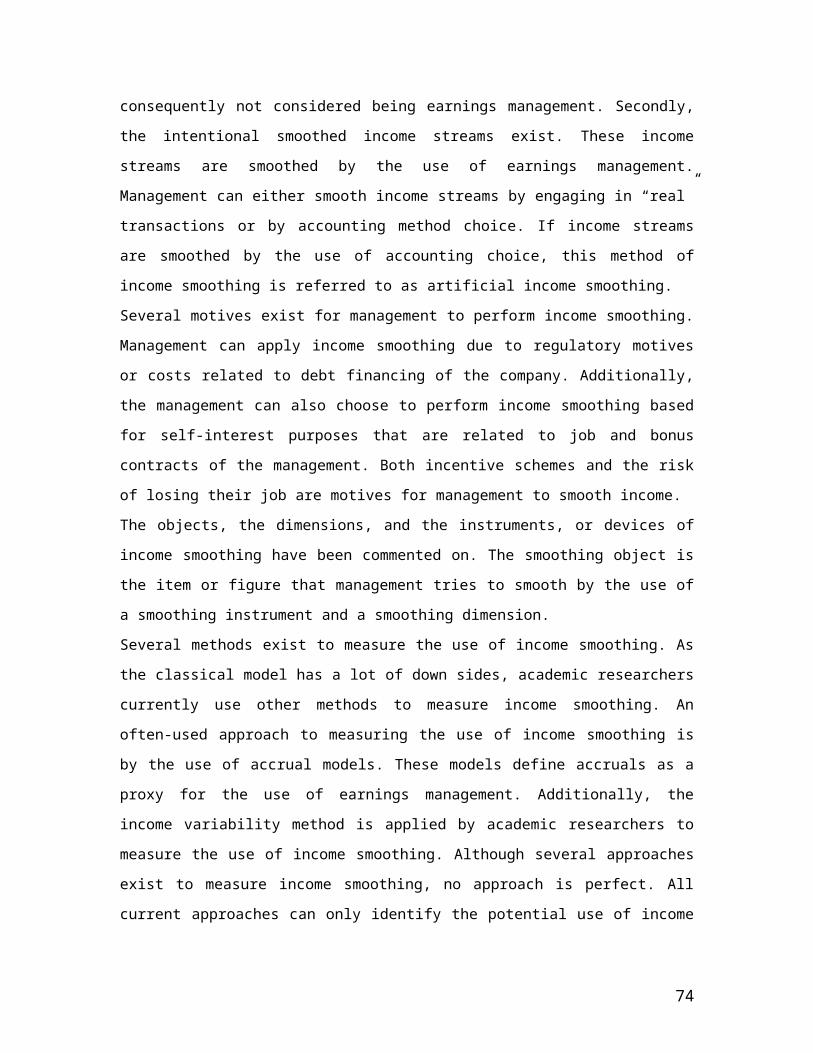
As stated by Eckel (1981), the method of Imhoff (1977) is created to determine if the variability
of sales is greater than the variability of income. If this is not the case, the company will be
identified as a smoother. Consequently, by comparing the variance of sales to the variance of
ordinary income the use of artificial income smoothing can by examined. The income variability
approach defines a company as an income smoother if:
≤ 1
Where = One period change in income
= One period change in sales
= Coefficient of variation
=
The expected value in the model before is defined as the average value of the sales and income of
a specific company. Both the variance and the expected value are calculated for the total research
period. Consequently, the coefficient of the variation is calculated for the total research period.
The operationalization of this model and the research results are commented on in chapter 7.
As commented on in chapter 3, the management of the companies can select several objects to
apply the use of income smoothing. The most popular smoothing object that has been studied by
academic research is the net income of the companies. This research will also select the net
income as the smoothing object. Consequently, the net income and sales variables have been
obtained from the Thomson One Banker database for the companies in the research data sample.
These are the variables in the table below.
Table 6.1 Variable Thomson Code
Net income TF.NetIncome
Sales TF.Sales
6.5 Method to Measure Informativeness
As section 5.4 has described the method to measure the use of income smoothing, this section
will comment on the method to measure informativeness. This research applies the method of
Collins et al. (1994) to measure the informativeness of the earnings. This is the same approach as
74

was chosen by Tucker and Zarowin (2006). The informativeness method is incorporated in the
graphical model on the third page of this chapter.
Because the expectations of investors about future earnings are not observable, a proxy is needed
for the expected future earnings (Tucker and Zarowin, 2006). The method of Collins et al. (1994)
uses the earnings of t as a proxy for the expected earnings of t. If the actual earnings are lower
than expected, the stock prices will decrease and if the actual earnings are higher than expected,
the stock prices will increase. Tucker and Zarowin use the past, the current, and the future
earnings to create a general type of earnings expectations. This method is defined by the
following regression:
Where: = Ex dividend stock returns for year t.
= Earnings per share for year t-1
= Earnings per share for year t
= Sum of earnings per share for years t+1 to t+3
= The aggregate stock return for years t+1 to t+3
To measure the influence of the use of income smoothing on the earnings informativeness the
regression commented on before is extended. The income smoothing variable is added to the
regression:
If income smoothing is applied by the management of the company to signal their private
information to the users of the financial statements should be positive (Tucker and
Zarowin, 2006).
6.6 Primary Model
Based on the regression models commented on in section 5.5, this section will formulate the
primary research model applied in this research to measure if the use of income smoothing
increases the earnings informativeness. If the use of income smoothing increases the
informativeness of the earnings, it needs to increase the relation between the current earnings and
75
the future earnings. Consequently, the earnings persistence is expected to increase (Tucker and
Zarowin, 2006). The primary research model is defined as the following regression:
Where: = Earnings per share for financial year t
= Earnings per share for financial year t+1 to t+3
If income smoothing increases the earnings informativeness, the coefficient of
should be positive. Consequently, the reported EPS variable has been obtained from the
Thomson One Banker database for the companies in the research data sample. This is the
variables in the table 6.2 below.
Table 6.2Variable Thomson Code
Reported EPS TF.EPSAsReported
6.7 Additional Prescriptive Variable
This section will comment on the additional prescriptive variable that is added to the primary
model to further test the prescriptive power of the model. Consequently, such a variable is
additionally referred to as a control variable.
Prior empirical research on the use of income smoothing has applied several control variables to
test to prescriptive power of the research models. Popular control variables are company size, use
of big four auditor or economic sector. This research will apply the economic sector as the control
variable. As commented on in section 6.8, the research data sample is not based on specific
economic sectors, but on the five selected European indexes. Consequently, multiple economic
sectors are included in the research data sample.
The economic sector variable has been obtained from the Thomson One Banker database for the
companies in the research data sample. The Thomson One Banker has several variables to
categorize the companies in the research data sample to economic sectors. Based on the size of
the grouping, the variable in table 6.3 has been selected.
76
Table 6.3Variable Thomson Code
Economic sector TF.GICSSECTOR
The research results in chapter 7 will show if the additional prescriptive variable will increase or
decrease the prescriptive power of the primary research model.
6.8 Data Sample
The data sample of this research consists of public European companies. No private companies
are included, as it is often difficult to obtain the required information for the private companies
over the several periods. The data sample of this research is limited to the following countries:
The Netherlands, United Kingdom, France, Germany, and Italy. The public European companies
in this research are all listed at one of the European stock exchanges. The following indexes have
been selected for the empirical research to be performed.
Table 6.4Country Stock Exchange Index No. of companies
The Netherlands Amsterdam Euronext AEX 25
United Kingdom London FTSE 100 100
France Paris CAC 40
Germany Frankfurt DAX 30
Italy Milan Borsa Italiana COMIT 40
Total 235
Based on the total number of companies listed on these five European Indexes the total data
sample includes 235 companies. Because this research studies the relationship between the uses
of income smoothing and the informativeness of the earnings a representative sample of
European companies. This implies that the data sample needs to be large enough to provide
conclusive research results. Consequently, the five largest European indexes have been selected
to be included in the research data sample.
This additionally implies that most economic sectors are included in the data sample. Amongst
others, economic sectors can be divided in mining, construction, financial, transportation,
communication, and technology. In much prior empirical research, the companies in the financial
sector were excluded from the data sample. This is because of the specific regulation that is
77
applicable for the sector. Most research on the use of earnings management and the use of income
smoothing that applied an accrual model to measure the use of income smoothing have excluded
the financial sector. However, research on the use of income smoothing that measured the use of
income smoothing by the use of an income variability model have included the financial sector.
For example, both Albrecht and Richardson (1990) and Michelson (2000) included the financial
sector in the research data sample. This research applies the income variability model to measure
the use of income smoothing. Consequently, the companies in the financial are included in the
data sample. Additionally, this will provide a more general result about the use of income
smoothing within the European economy.
The Thomson One Banker 2011 database is used to gather the data for the empirical research.
Both the online Thomson One Banker database and the Thomson One Banker Excel plug-in were
used to perform the research. To obtain the data from the Thomson One Banker database the
codes in the table below were used.
Table 6.5Index Thomson Code No. of companies
AEX LAMSTEOE 26
FTSE 100 LFTSE100 102
CAC LFRCAC40 41
DAX LDAXINDX 30
COMIT FTSEMIB 40
Total 239
If the first and the second tables previously provided are compared, a difference in the number of
companies is noted. This is due to the fact that the specific companies that are included in the
different indexes change. The composition of the European indexes usually changes once or twice
a year. Some companies may be excluded from a specific index and move to a mid cap, while
other companies may move from a mid cap to the index. Consequently, the number of companies
provided by the Thomson One Banker data includes four more companies than the standard
number of companies related to the five European Indexes. The initial research data sample
consequently includes a total of 239 companies.
Additionally some companies are listed on several European indexes. Consequently the data
sample needs to be corrected for this phenomenon as otherwise some companies are included
78
twice in the data sample. For example, Unilever is listed at both the AEX and the FTSE 100.
Additionally Arcelor Mittal is listed at both the AEX and the CAC. In total 6 companies are listed
at two different indexes. If the total data sample is adjusted for this ‘double listing’ issue, the total
number of companies included in the data sample decreases to 233 companies.
Additionally this research applies a time series to measure the use of income smoothing. This
implies that the period of 2003 to 2010 is studied to identify a company as a smoother or a non-
smoother. The income variability approach uses the one period change in sales and the one period
change in net income. This implies that company data of 2002 needs to be available to calculate
the one period change in sales and the one period change in net income for 2003. Consequently,
only companies for which all variables are available for the period 2002 to 2010 are included in
the research data sample. For 21 companies that are included in the initial research data sample
no data is available for the total period of 2002 to 2010. Consequently, the number of companies
included in the research data sample is reduced to 212 European companies. As 8 financial years
are included in the research data sample for a total of 212 companies, the total number of
company year observations is 1696.
Table 6.6Data sample Companies
Initial 239
Double listings 6
Incomplete data 21
Final data sample 212
Consequently, the data variables obtained from the Thomson One Banker database are applied to
measure the use of income smoothing and the influence of the use of income smoothing on the
earnings informativeness. The empirical results are presented in chapter 7.
6.9 Summary
The research design of this research has been presented in this chapter. To test if the hypotheses
formulated in chapter 5 need to be rejected or not, empirical research is needed to be performed.
Prior empirical research on the use of income smoothing has mainly used ex-post company data
to determine if a company can be classified as a smoother or a non-smoother. This research also
uses ex-post company data to measure the use of income smoothing.
79
Prior empirical research has generally used the (modified) Jones model or the income variability
model to measure the use of income smoothing. The income variability method was introduced
by Imhoff (1977) and additionally applied by Eckel (1981) and Albrecht and Richardson (1990)
to measure the use of income smoothing. This research also applies the income variability model
to measure the use of income smoothing.
Additionally the FERC model of Collins et al. (1994) has been commented on. This model
measures the informativeness of the earnings. This research combines the model of Collins et al.
with a income smoothing variable, as was done by Tucker and Zarowin (2006), to measure if the
use of income smoothing increases the informativeness of the earnings.
The variables to measure the use of income smoothing and to measure the informativeness of the
earnings are obtained from the 2011 Thomson One Banker database. Both the online Thomson
One Banker database and the Thomson One Banker Excel plug-in were used to perform the
research.
The research data sample consists of companies listed on the European stock indexes. The
companies are selected from the main indexes of the Netherland, France, the United Kingdom,
Germany, and Italy. The final research sample consists of 212 companies.
The operationalization of this research and the research results are commented on in chapter 7.
80
7. Research Results
7.1 Introduction
This chapter will comment on the research results based on the empirical research performed.
Chapter 5 has formulated and chapter 6 has provided the research design. Based on the empirical
research performed conform the research design, this chapter will comment on if the research
hypotheses need to be rejected or not. First, an overview of the data analysis process will be
provided. Second, research results regarding which companies are classified as smoothers and
which companies are classified as non-smoothers is commented on. Finally, the research results
regarding the influence of the use of income smoothing on the earnings informativeness is
commented on. These research results will answer the research question.
7.2 Data Analysis Process
This section will provide a brief overview of the data analysis process applied in this research. It
is essential to understand the data analysis process to clearly comprehend the research results.
As was commented on in chapter 6, the raw research data of the research sample is downloaded
from the Thomson One Banker database into Excel. The raw data is processed in Excel to get the
data variables needed to perform the data analysis. For example, the analysis to distinguish the
smoothers from the non-smoothers is performed by the use of Excel. Additionally the SPSS
statistics software program is applied to perform the regression analysis. Consequently, the output
tables of SPSS are used to analyze the influence of the use of income smoothing on the earnings
informativeness. To be able to better analyze the output data of SPSS, the books of Kirkpatrick
and Feeney (2003) and Fields (2009) are studied. This will realize a correct interpretation of the
statistical output data of SPSS.
As was commented on in chapter 6, the data period of this research is 2003 to 2010. This implies
that the credit crunch and additional effects of the financial crisis that started in 2008 are within
the research period. As the effects of the financial crisis on the use of income smoothing and the
earnings informativeness are unknown, additional test will be performed. It could very well be
that due to the financial crisis the management of the companies was unable to continue to use
income smoothing as a type of earnings management. Consequently, section 7.3 will include 2
tests to identify smoothers and non-smoothers.
The next sections will comment on the research results based on the empirical research
performed. Additionally, refer to appendix 2 for all research data applied in this research.
81
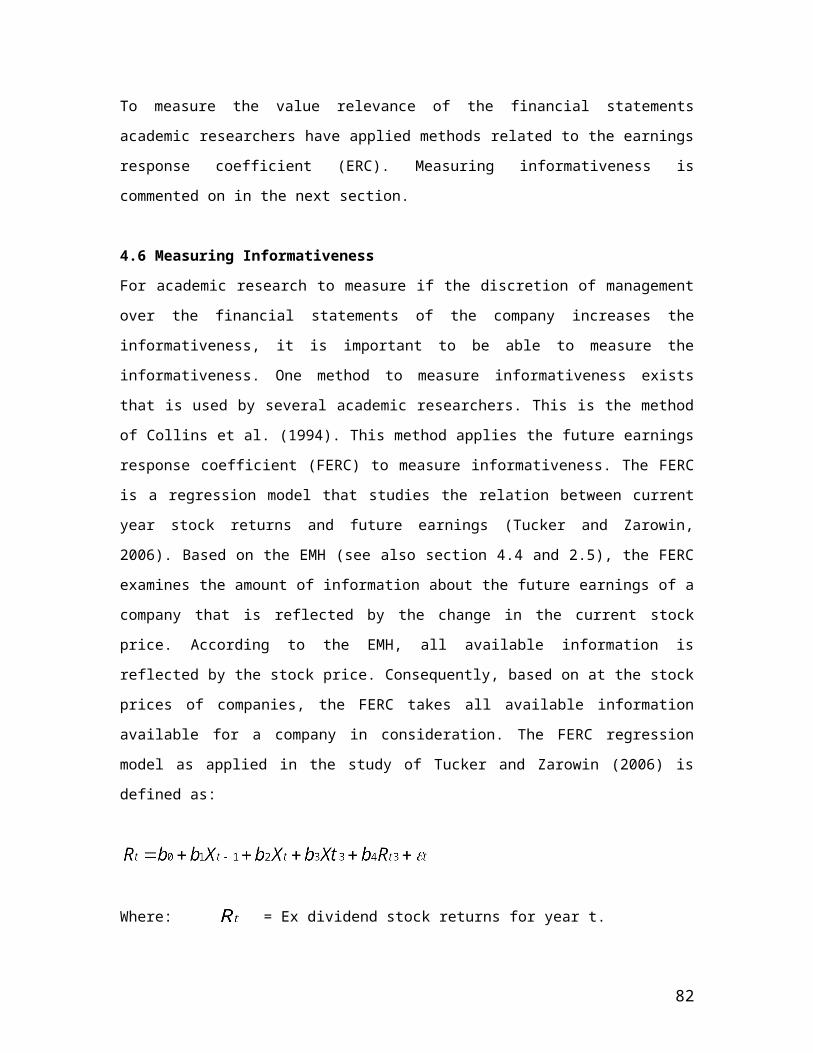
7.3 European Smoothers and Non-Smoothers
This section will present the research results based on the empirical research performed to
identify the smoothers and non-smoothers in the research data sample. The income variability
method is applied to identify which companies are smoothers and which companies are-non
smoothers. Consequently, if for a selected company is applicable, this company
is identified as a smoother.
As was commented on in section 7.2, this research additionally studies the influence of the
financial crisis on the use of income smoothing. Consequently, the test to identify the use of
income smoothing is performed for two periods. The first period to identify the smoothers and
non-smoothers is for the total research period, namely 2003 to 2008. Second, the period of 2003
to 2008 is applied to identify smoothers and non-smoothers without the potential effects of the
financial crisis. The results of both tests performed are presented in table 7.1 below.
Table 7.1 Period 2003 to 2010 Period 2003 to 2008
Smoothers 53 68
Non-smoothers 159 144
Total companies 212 212
Smoothers average 0,57 0,52
Non-smoothers average 9,61 11,24
The research results presented in table 7.1 show that the financial crisis affects the use of income
smoothing by the management of the companies. The number of companies of which the
management uses income smoothing as identified by the income variability method is lower for
the period 2003 to 2010 than for the period 2003 to 2008. It could be that the effects of the
financial crisis either influence the use of income smoothing or hides the use of income
smoothing. This implies that, without performing any further analysis, the management of the
companies is unable to continue using income smoothing to influence the results of the company.
Alternatively, it implies that due to the effects of the financial crisis the income variability
method is less successful to measure the use of income smoothing. If this second scenario is
applicable, this implies that the financial crisis masques the use of income smoothing.
82
Prior empirical research performed by Albrecht and Richardson (1990) amongst others, has
additionally shown that a change in the research period causes a change in the number of
smoothers and non-smoothers measured for the same research population. The variable income
method is just a model that can provide an indication for the use of income smoothing. Especially
with an economic phenomenon such as the financial crisis, the identification of the number of
smoothers can change.
Additional to the effect of the financial crisis on the number of companies that are identified as
smoothers and non-smoothers, it is interesting to study if companies identified as smoothers in
the first research period are still identified as smoothers in the second research period.
Consequently, if the financial crisis affects individual companies identified as a smoother or a
non-smoother. Table 7.2 below presents the effects of the financial crisis on the identification of
the individual companies as smoothers and non-smoothers.
Table 7.22003 to 2008 Changed old Unchanged Changed new 2003 to 2010
Smoothers 68 -37 31 22 53
Non-smoothers 144 -21 123 36 159
Total 212 -58 154 58 212
Table 7.2 shows that the three additional years included in the research data sample related to the
financial crisis change the identity of 58 companies. Consequently, not only the number of
smoothers increases, but additionally companies change from being identified as a smoother or a
non-smoother.
Several explanations exist for this change in identification of smoothers and non-smoothers. First
of all, the income variability method to measure the use of income smoothing might not work in
times of crisis. Smoothing behavior of the management might be undetectable by the use of the
income variability model. Due to the financial crisis, the management of the company might
additionally be unsuccessful in continuing their smoothing behavior.
Second, if the total research data period is divided into other separate period it is possible that
companies will additionally change identity. This could be caused by other anomalies in the
financial world.
Third, the smoothing behavior of the management of the companies might actually have changed
due to the financial crisis. Management might have stopped using income smoothing or even
83
started using income smoothing to hide the catastrophic financial impact of the crisis on the
company.
Consequently, it is unclear what causes the differences presented in table 7.2. However, this is
beyond the scope of this research. Additional research needs to be performed to study the effect
of the financial crisis on measuring the use of income smoothing.
Consequently, this research will continue to use the distinction between smoother and non-
smoothers that is based on the research period 2003 to 2008. By doing so, the potential impact of
the financial crisis to measure the use of income smoothing is excluded from the research. This
implies that the total research period is 6 years. This is a sufficient long period to measure the use
of income smoothing with the help of the income variability model. Prior empirical research
generally applied a research period of 5 to 6 years to measure the use of income smoothing with
the income variability model. Consequently, the power of the model should not be affected by
excluding the years related to the financial crisis.
7.4 European Income Smoothing Informativeness
This section will comment on the informativeness of the use of income smoothing. As is
concluded in section 7.3, it is not known what the impact of the financial crisis is on the research
results of measuring the use of income smoothing. Consequently, smoothers and non-smoothers
are identified based on research data of the period 2003 to 2008. Additionally the influence of the
use of income smoothing on the earnings informativeness is tested for that period. As the
financial crisis is likely to have influenced the variables to measure informativeness, such as
earnings per share, the period 2009 to 2010 is excluded from the research data sample for the
regressions performed in this section. This section will continue with several statistical tests to
determine if the use of income smoothing improves the earnings informativeness for the
European companies in the research data sample. First, this research will test the correlation of
earnings. Second, the primary research model is tested. Third, the prescriptive power of the
primary research model is tested by the use of the control variable.
7.4.1 Correlation of Earnings per Share
To test if the use of income smoothing improves the earnings informativeness, it is interesting to
test the correlation of the earnings of the companies in the research data sample. This implies that
this research tests the relation between the and the . Consequently, the relation
between the current year earnings and the future year earnings is tested. To test the correlation the
EPS research data of 2005 is applied for and the EPS research data of 2006 to 2008 is
84
applied for . Both variables are entered as scale variables in SPSS. The tested bivariate
correlation of these two variables in SPSS provided the following empirical research results.
Table 7.3
Correlations
EPSt EPSt3
EPSt Pearson Correlation 1 ,796**
Sig. (1-tailed) ,000
N 212 212
EPSt3 Pearson Correlation ,796** 1
Sig. (1-tailed) ,000
N 212 212
**. Correlation is significant at the 0.01 level (1-tailed).
The table 7.3 shows the results of the one tailed Pearson’s correlation test. A one-tailed test is
applied instead of a two-tailed test, because this research expects that the current year earnings
are positive correlated with the future year earnings. If this was not the case, a two-tailed test
would have been applied.
The Pearson’s correlation coefficient in table 7.3 for the variables and is 0,796 and
the significance value is 0,01 (p = 0,01). Based on this significance value it is clear that a relation
exists between the two variables (Fields, 2009). The chance of research results with a correlation
coefficient this big (r = 0,796) in a research data sample of 212 companies if no relation exists
between the two variables is extremely low. Consequently, these research results proof that the
current year earnings are strongly correlated with the future year earnings. This implies that if the
current year earnings increase the future year earnings are also expected to increase.
To add more explanatory power to the research results the Pearson’s correlation coefficient can
be squared. According to Fields (2009) the , additionally referred to as coefficient of
determination is a method to measure the amount of variability that is applicable for the two
variables. The two variables have a correlation of 0,796. Consequently, the value of the is
calculated as (0,796) = 0,634. The 0,634 can be interpreted as 63,4%. Consequently, 63,4% of
the variability in is in conformity with the variability of . The two variables are
therefore not only highly correlated, but additionally a high percentage of variability of the two
variables is shared. Additionally, Fields (2009) states that although is a very powerful method
to measure the substantive importance of an effect, it cannot be applied to measure the causal
relation between the two variables. This implies that even if 63,4% of the variability in one
85
variable is shared by the other variable; the variability in one variable is not necessarily based on
the variability in the other variables.
These research results proof that a relationships exists between the current year earnings and the
future year earnings. Additionally a relative high percentage of variability in the current year
earnings shared by the variability of the future year earnings.
7.4.2 Testing the Primary Model
This subsection will present the test results based on the primary research model. As the research
results presented in subsection 7.4.1 have proven that the current year earnings are positively
correlated with the future year earnings, this subsection will present the research results of the
influence of the use of income smoothing on correlation of the earnings. This is tested by the use
of a regression model.
Additional to the two variables that are tested in subsection 7.4.2 the variable for the use of
income smoothing is included to test the influence of the use of income smoothing on the
earnings informativeness. As is tested in section 7.3, companies are classified either as smoother
or as non-smoother. If a company is identified as a smoother the variable for the use of income
smoothing is 1 and if the company is identified as a non-smoother the variable for the use of
income smoothing is 0. Consequently the variables and are entered as scale variables
and in SPSS the variable for the use of income smoothing, , is entered as a categorical variable
in SPSS.
Two types of regression models exist. Regression models that have only one outcome variable
and one predictor variable are referred to as simple regression models. Regression models that
have one outcome variable and several predictor variables are referred to as multiple regression
models (Fields, 2009). The primary research model applied in this research is defined as a
multiple regression model.
The primary research model is defined as .
Consequently, the variables and are the predictor variables and the variable is
the outcome variable. If income smoothing improves the earnings informativeness the coefficient
of the interaction variable should be positive.
To test if this is applicable for the research data sample of this research, the generalized linear
model test in SPSS is applied. This function allows the model of Tucker and Zarowin (2006) to
be applied on the research data sample of the European companies. Based on the research data
sample the coefficients of the variables in the model are calculated.
86
The variables are entered as in SPSS. The performed generalized linear model test in SPSS for
these variables in provided the following empirical research results.
Table 7.4
Categorical Variable Information
N Percent
Factor ISt 0 144 67.9%
1 68 32.1%
Total 212 100.0%
Table 7.5
Tests of Model Effects
Source
Type III
Wald Chi-
Square df Sig.
(Intercept) 22.328 1 .000
ISt 3.380 1 .066
EPSt 258.254 1 .000
ISt * EPSt 2.044 1 .153
Dependent Variable: EPSt3
Model: (Intercept), ISt, EPSt, ISt * EPSt
Table 7.6
Parameter Estimates
Parameter B Std. Error
95% Wald Confidence Interval Hypothesis Test
Lower Upper
Wald Chi-
Square df Sig.
(Intercept) 1.078 .6322 -.161 2.317 2.910 1 .088
[ISt=0] 1.373 .7471 -.091 2.838 3.380 1 .066
[ISt=1] 0a . . . . . .
EPSt 2.162 .2223 1.726 2.598 94.604 1 .000
[ISt=0] * EPSt -.353 .2471 -.838 .131 2.044 1 .153
[ISt=1] * EPSt 0a . . . . . .
(Scale) 17.906b 1.7392 14.802 21.661
Dependent Variable: EPSt3
Model: (Intercept), ISt, EPSt, ISt * EPSt
a. Set to zero because this parameter is redundant.
b. Maximum likelihood estimate.
87
Table 7.4 shows that all companies are included in the generalized linear model test. Table 7.5
presents the predictive power of the independent variables on the dependent variable. These
results implicate that as was proven in section 7.3, has a high predictive value for .
However, both and have a low predictive value for .
The results of table 7.5 are additionally confirmed by the results presented in table 7.6. The beta
of is 2,162 with a significance level of p < 0,001. Consequently, the earnings per share of
the current year are a good predictor for the earnings per share of the future years. However, as
the main research question of this research is if income smoothing improves the earnings
informativeness, it is more important to interpret the research results for the variable .
The beta of variable for non-smoothers is -0,353. This implies that a negative effect is
measured for non-smoothers on the earnings informativeness. Consequently, this implies that a
positive effect is measured for smoothers on the earnings informativeness. It would seem that the
use of income smoothing increases the informativeness of the earnings. However, the beta of the
variable has a significance level of p < 0,153. Unfortunately, this is above the
significance criterion of p < 0,05. Consequently, these results imply that a positive effect of the
use of income smoothing is measured on the informativeness of the earnings, but the measured
positive effect is not qualified as significant.
Several explanations could be relevant for the research results. For example, differences in
regulation between the US and Europe could influence the research results, or other variables that
are not included in the primary research model could cause the non significance of the
improvement in the earnings informativeness due to the use of income smoothing. Consequently,
section 7.5 introduces economic sectors as a control variable to additionally test the research
model.
7.5 Adjusting for Economic Sector
This section will perform a similar test as performed in subsection 7.4.2. Additionally the control
variable for economic sectors is included in the research model. This section will test if a
differentiation in economic sectors has an influence on the informativeness of the earnings.
According to subsection 7.4.2, the use of income smoothing does not have a significant affect on
the earnings informativeness. Additionally this section will test if the use of income smoothing in
a specific sector has an affect on the earnings informativeness. Consequently, the independent
variable of economic sector is added to the multiple regression model. Additionally, the
interactions between the current year earnings, the use of income smoothing, and the economic
sector are tested. The independent variables , and are added
88
to the multiple regression model. The performed generalized linear model test in SPSS for these
variables in provided the following empirical research results.
Table 7.7
Categorical Variable Information
N Percent
Factor ISt ,00 144 67,9%
1,00 68 32,1%
Total 212 100,0%
ESt Energy (10) 15 7,1%
Materials (15) 22 10,4%
Industrials (20) 33 15,6%
Consumer Discretionary (25) 33 15,6%
Consumer Staples (30) 21 9,9%
Health Care (35) 10 4,7%
Financials (40) 46 21,7%
Information Technology (45) 9 4,2%
Telecommunication Services (50) 8 3,8%
Utilities (55) 15 7,1%
Total 212 100,0%
Table 7.8
Tests of Model Effects
Source Type III
Wald Chi-
Square df Sig.
(Intercept) 4,699 1 ,030
ISt ,325 1 ,569
ESt 9,373 9 ,404
EPSt 11,530 1 ,001
ISt * EPSt ,186 1 ,667
ISt * ESt 5,665 9 ,773
ESt * EPSt 22,926 9 ,006
ISt * ESt * EPSt 11,532 9 ,241
Dependent Variable: EPSt3
Model: (Intercept), ISt, ESt, EPSt, ISt * EPSt, ISt * ESt, ESt *
EPSt, ISt * ESt * EPSt
89
Table 7.7 shows the companies that are included in the generalized linear model test.
Additionally, this table shows the number of companies that are qualified as smoothers and non-
smoothers and the number of companies in the different economic sectors.
Table 7.8 presents the predictive power of the independent variables on the dependent variable.
These results implicate that as was proven in section 7.3 and 7.4, has a high predictive
value for , with a significance level of p < 0,001. Additionally, the interaction variable
has a high predictive value for , with a significance level of p < 0,006.
Consequently, both and comply with the significance criterion of p < 0,05. The
current year earnings per share are more informative about future year earnings in some sectors
than in other sectors. The other variables do not have a significant influence on the earnings
informativeness.
Based on the research data presented in table 7.8 the multiple regression model is reduced for
independent variables and defined as . This regression
model includes all significant variables.
This new defined multiple regression model is tested as a generalized linear model in SPSS. This
provided the following empirical results
Table 7.9
Tests of Model Effects
Source Type III
Wald Chi-
Square df Sig.
(Intercept) 18,340 1 ,000
EPSt 53,696 1 ,000
ESt * EPSt 37,214 9 ,000
Dependent Variable: EPSt3
Model: (Intercept), EPSt, ESt * EPSt
Table 7.9 shows that all independent variables have a positive influence on the informativeness of
the earnings, with a significance level of p < 0,001. As this test proves that the interaction
between economic sector and the current year earnings per share has a significant positive
influence on the earnings informativeness, it is interesting to differentiate the results for the
economic sectors. These research results are presented in table 7.10.
90
Table 7.10
Parameter Estimates
Parameter
B Std. Error
95% Wald Confidence Interval Hypothesis Test
Lower Upper
Wald Chi-
Square df Sig.
(Intercept) 1,494 ,3490 ,811 2,178 18,340 1 ,000
EPSt 2,445 ,6956 1,081 3,808 12,351 1 ,000
[ES=10] * EPSt ,840 ,9738 -1,068 2,749 ,744 1 ,388
[ES=15] * EPSt 1,423 ,7840 -,113 2,960 3,295 1 ,069
[ES=20] * EPSt -,125 ,7091 -1,515 1,264 ,031 1 ,860
[ES=25] * EPSt -,756 ,7131 -2,153 ,642 1,123 1 ,289
[ES=30] * EPSt ,171 ,9241 -1,641 1,982 ,034 1 ,854
[ES=35] * EPSt ,070 1,0183 -1,926 2,066 ,005 1 ,945
[ES=40] * EPSt -,740 ,6973 -2,107 ,627 1,127 1 ,288
[ES=45] * EPSt ,434 2,5577 -4,578 5,447 ,029 1 ,865
[ES=50] * EPSt -,775 1,2261 -3,178 1,628 ,400 1 ,527
[ES=55] * EPSt 0a . . . . . .
(Scale) 15,493b 1,5048 12,807 18,741
Dependent Variable: EPSt3
Model: (Intercept), EPSt, ESt * EPSt
a. Set to zero because this parameter is redundant.
b. Maximum likelihood estimate.
Table 7.10 shows that for the individual economic sectors no significant influence exists on the
dependent variable. The only sector that can be distinguished from the other sectors is the
materials sector (15). However, with a significance level of p < 0,069 it is above the significance
criterion of p < 0,05. Although the interaction variable has a high predictive value for
, this is not the case for specific economic sectors. Consequently, adjusting for economic
sectors has a positive influence on the earnings informativeness, but differentiating for specific
economic sectors does not add significant predictive power to the model.
7.6 Summary
This chapter has presented the empirical research results on if the use of income smoothing
increases the earnings informativeness. To answer the main research question, the companies in
the research data sample are identified as smoothers and non-smoothers. For the period 2003 to
2010, 53 companies are identified as smoothers and 159 companies are identified as non-
smoothers based on the income variability approach. However, this period includes the years of
91
the financial crisis. Consequently, the years related to the financial crisis are eliminated from the
research period. For the period 2003 to 2008, 68 companies are identified as smoothers and 144
are identified as non-smoothers. Based on these numbers additional research is performed.
This research proved the influence of the current year earnings per share on the future year
earnings per share. The current year earnings per share are highly correlated with the future year
earnings per share. This implies that the current year earnings possess informativeness about the
future year earnings.
Additionally, the primary research model is tested. Based on the empirical research results, a
positive effect of the use of income smoothing is measured on the informativeness of the
earnings, but the measured positive effect is not qualified as significant. Consequently, no
definitive research results are provided that indicates that the use of income smoothing increases
the earnings informativeness. Several reasons exist that can cause these research results.
The primary research model is tested a second time including an adjustment of the economic
sectors. This implies that the influence of the differentiation for economic sectors on the
informativeness of the earnings is tested. Based on the empirical research results, this research
can conclude that the interaction between the current year earnings per share and the economic
sector has a high predictive value for the future year earnings per share. However, differentiating
for specific economic sectors does not add significant predictive power to the model.
Consequently, this research proves that both the current year earnings per share and the
interaction between current year earnings per share and economic sector are good predictive
variables for future year earnings per share. No significant influence of the use of income
smoothing on the earnings informativeness is measured.
92
8. Conclusion
8.1 Introduction
This chapter will provide a summary of this research and a conclusion based on the empirical
research results presented in chapter 7. The main research question is answered and the two
research hypotheses are commented on. Additionally, suggestions for future empirical research
are provided. Certain limitations are applicable for this research. These research limitations are
defined in chapter 1. Additional research limitations based on the empirical research performed
are presented in this chapter. This chapter will conclude with recommendation for future research
that applies the informativeness approach to study the use of income smoothing.
8.2 Summary
This research set out to answer the main research question if the use of income smoothing
improves the earnings informativeness. To test this, this research applies a research data sample
of European listed companies for the period 2003 to 2010. This research is based on the research
performed by Tucker and Zarowin (2006). To answer the main research question several sub-
research questions have been defined. These sub-research questions are needed to perform a
literature study, which is the start to answer the main research question.
This literature study begins with the description of the use and value of the financial information.
The use and value of the financial information is explained by the use of the positive accounting
theory (PAT) of Watts and Zimmerman (1978). The PAT explains why the management of the
company prefers certain accounting standards. The preference of these accounting standards is
mostly driven by the self interest of the management.
According to Watts and Zimmerman (1990), the motives for the management to select accounting
standards are explained by three hypotheses. Managers will select certain accounting standards
based on their bonus plans, the leverage of the company and the political attention that is received
by the company. Additionally, the agency theory, efficient market hypothesis and the stakeholder
theory have been commented on to explain the value and use of financial information.
Four types of earnings management exist. These are taking a bath, income maximization, income
minimization and, income smoothing. The term income smoothing is the type of earnings
management that is studied in this research and consequently explained. Income smoothing is
defined by many academic researchers. One of the definitions of income smoothing is an attempt
93
by managers to manipulate income numbers so as to impart to the resulting series a desirable and
smooth trend (Ronen and Sadan, 1981).
According to Eckel (1981), natural smooth income streams and intentionally smoothed income
streams exist. Intentionally smoothed income streams are the focus of this research as these
income streams are the results of the use of earnings management by the management of the
company.
To be able to apply income smoothing, the management of the company needs to consider the
smoothing objects, dimensions, and instruments as defined by Barnea, Ronen and Sadan (1976)
and Copeland (1968). Although most prior empirical research has qualified income smoothing as
a bad phenomenon, this research comments on a possible good characteristic. If income
smoothing is applied by the management of the company to signal their private information about
future earnings to the users of the financial statements, the use of income smoothing can qualified
as positive. However several other motives exist that are not related to the signaling of private
information.
To be able to answer the main research question, the content of the term informativeness is
explained. Informativeness is defined by Tucker and Zarowin (2006) as the information value of
past and present earnings about future earnings and cash flows. Consequently, if the
informativeness of the earnings increases, this is advantageous for the users of the financial
statements because the decision usefulness of the financial statements also increases. For the
signaling of the management to function, the markets need to be information efficient.
Additionally, this research has provided an overview of prior empirical research on the use of
income smoothing. Several main research directions on the use of income smoothing have been
identified. These are country studies, income smoothing in relation to company characteristics,
income smoothing in relation to the value of companies and income smoothing in relation to
expected future earnings.
One of the more recent methodologies to study the use of income smoothing is the
informativeness approach. This approach is related to if the use of income smoothing influences
the information value of the financial statements about future periods. This research applies the
informativeness approach to study the use of income smoothing.
8.2 Conclusion
To empirically study if the use of income smoothing improves the earnings informativeness, this
research has formulated two hypotheses. These hypotheses are commented on below and the
94
empirical research results are presented in relation to the hypotheses. The first hypothesis is
defined as:
H1
The management of companies uses income smoothing as a type of earnings management.
To test the first hypothesis the income variability method is applied to identify the European
listed companies as smoothers and non-smoothers. The income variability is a proven method to
test the use of income smoothing and is additionally applied by Eckel (1981) and Albrecht and
Richardson (1990) amongst others. For the period 2003 to 2010, 53 companies are identified as
smoothers and 159 companies are identified as non-smoothers based on the income variability
approach. However, this period includes the years of the financial crisis. Consequently, the years
related to the financial crisis are eliminated from the research period. For the period 2003 to
2008, 68 companies are identified as smoothers and 144 are identified as non-smoothers. Based
on these numbers additional research is performed. Consequently, this research has successfully
identified companies as smoothers and non-smoothers. To test if the use of income smoothing
improves the earnings informativeness, a second hypothesis is needed. The second hypothesis is
defined as:
H2
The use of income smoothing increases the informativeness of earnings.
To test the second hypothesis this research first examined the correlation between the current year
earnings per share and the future year earnings per share. The current year earnings per share are
highly correlated with the future year earnings per share. This implies that the current year
earnings possess informativeness about the future year earnings. Additionally, the primary
research model (the multiple regression model as defined by Tucker and Zarowin (2006)) is
tested. Based on the empirical research results, a positive effect of the use of income smoothing is
measured on the informativeness of the earnings, but the measured positive effect is not qualified
as significant. Consequently, no definitive research results are provided that indicates that the use
of income smoothing increases the earnings informativeness.
Additionally, a control variable for economic sectors is introduced in the multiple regression
model. This implies that the influence of the differentiation for economic sectors on the
informativeness of the earnings is tested. Based on the empirical research results, this research
95
can conclude that the interaction between the current year earnings per share and the economic
sector has a high predictive value for the future year earnings per share. However, differentiating
for specific economic sectors does not add significant predictive power to the model.
Consequently, the empirical research results presented by this research are able to answer the
main research question. By the use of the income variability method to measure the use of income
smoothing and by the use of the multiple regression model of Tucker and Zarowin (2006), this
research shows that the use of income smoothing does not improve the earnings informativeness.
The best predictive variable for the future earnings per share is the current earnings per share. The
use of income smoothing does not negatively influence the earnings informativeness, but no
significant evidence is obtained that the use of income smoothing actually improves the earnings
informativeness. Consequently, this research does not contradict the evidence presented by
Tucker and Zarowin (2006), however no significant research results were obtained to support the
conclusions of Tucker and Zarowin.
8.3 Empirical Research Limitations
Additional to the research limitations presented in chapter 1, the empirical research performed in
chapter 7 resulted in the following extra research limitations. First, the research period included
the years related to the financial crisis. As presented in section 8.2, the financial crisis influenced
the number of companies identified as smoothers and non-smoothers. This is either a limitation of
the model applied to measure the use of income smoothing, or is related to the smoothing
behavior of the management of the companies in times of crisis. As this is beyond the scope of
this research, it is qualified as a research limitation.
Second, a research limitation is related to the variables applied in this research. This research
selected the net income of the companies as the smoothing object. This selection was made,
because the net income is the most studied smoothing object. Consequently, it is possible that
other smoothing objects will result in other identifications of smoothers and non-smoothers.
Third, this research has selected economic sectors as a control variable to be added to the primary
research model. It is possible that by adding other control variables to the primary research model
will further increase the explanatory power of the model.
These limitations are a basis for the recommendations for future research that are presented in the
next section.
96
8.4 Recommendation for Future Research
Based on the empirical research performed, several suggestions for future academic research on
the relation of income smoothing and the earnings informativeness can be defined. As is
concluded from the empirical research performed, a change in the research period influenced the
results of which companies are identified as smoothers and which companies are identified as
non-smoothers by the income variability model. This research concludes that the financial crisis
could be responsible for the change in the identification of smoothers and non-smoothers. Future
academic research could additionally comment on if the financial crisis affected the use of
income smoothing by the management of the companies. Additionally, the power of the income
variability model to measure income smoothing in times of economic distress could be
investigated by future academic research.
This research has chosen the net income of the companies as the smoothing object. Additionally,
future academic research could comment on other smoothing objects. This is further applicable
for the other variables chosen by this research. Future academic research could comment on the
use of different variables and the potential influences on the empirical research results.
Additionally, a similar research could be performed for a different time period or for a different
data research sample. It would be interesting to determine if the research period or the research
data sample influences the research results.
Other control variables could be added to the multiple regression model. It could be interesting to
see if for example the use of a certain auditor or if certain company characteristics influence the
earnings informativeness. The research applications of the informativeness approach to study the
use of income smoothing are endless. Consequently, it is interesting to see new applications of
the informativeness approach.
The informativeness approach to study the use of income smoothing is a very interesting method
to study income smoothing and a promising approach for future academic research.
97
References
Academic research papers and books in alphabetic order:
Aalst, P.C. et al. Financiering en belegging deel 2. Textbook, 7th reprint. Rhobeta consultants.
1997.
Albrecht, W.D., and F.M. Richardson. 1990. Income smoothing by economy sector. Journal of
Business Finance & Accounting 17 (5) (Winter). pp 713-730.
Ashari, N., H.C. Koh, S.L. Tan and W.H. Wong. 1994. Factors affecting income smoothing
among listed companies in Singapore. Accounting and Business Research. Vol. 24, No.96. pp
291-301.
Bartov, E., P Mohanram. 2004. Private information, earnings manipulation, and executive stock
option exercises. The Accounting Review (October 2004), Vol. 79, No. 4. pp. 889-920.
Bao, B.H. and D.H. Bao. 2004. Income Smoothing, Earnings Quality and Firm Valuation.
Journal of Business Finance & Accounting 31 (9) & (10) November/December. Journal of
Business Finance & Accounting 21 (6) (September), pp. 791-811.
Barnea, A., J. Ronen and S. Sadan. 1976. Classificatory smoothing of income with extraordinary
items. The Accounting Review (January 1976). pp. 110-122.
Beattie, V., S. Brown, D. Ewers, B. John, S. Manson, D. Thomas and M. Turner. 1994.
Extraordinary items and income smoothing: A positive accounting approach. Journal of Business
Finance and Accounting (September 1994), Vol. 21, No. 6. pp. 791-811.
Belkaoui, A. and R.D. Picur. 1984. The smoothing of income numbers: Some empirical evidence
on systematic differences between core and periphery industrial sectors. Journal of Business
Finance & Accounting (Winter 1984), Vol. 11, No. 4. pp. 527-545.
98
Beidleman, C.R. 1973. Income smoothing: the role of management. The Accounting Review
(October 1973), Vol. 48, No. 4. pp. 653-667.
Bitner, L.N. and R.C. Dolan. 1996. Assessing the relationship between income smoothing and the
value of the firm. Quarterly Journal of Business and Economics (Winter 1996), Vol. 35, No. 1.
pp. 16-35.
Booth, G.G., J.P. Kallunki and T. Martikainen. 1996. Post-announcement drift and income
smoothing: Finnish evidence. Journal of Business Finance & Accounting, Vol. 23, No. 8. pp.
1197-1211.
Boyton, C.E., P.S. Dobbins, G.A. Plesko. 1992. Earnings Management and the Alternative
Corporate Minimum Tax. Journal of Accounting Research, Vol. 30. pp. 131-153.
Cahan, S.F., G. Liu, J. Sun. 2008. Investor protection, income smoothing and earnings
informativeness. Journal of International Accounting Research, Vol. 7, No. 1. pp. 1-24.
Carlson, S.J. and C.T. Bathala. 1997. Ownership differences and firms’ income smoothing
behavior. Journal of Business Finance & Accounting (March 1997), Vol. 24, No. 2. pp. 179-196.
Collins, W.D., S.P. Kothari, J. Shanken and R.G. Sloan. 1994. Lack of timeliness and noise as
explanations for the low contemporaneous return-earnings association. Journal of Accounting and
Economics 18. pp. 289-324.
Copeland, R.M. 1968. Income smoothing. Empirical Research in Accounting, Selected Studies
(Supplement), Vol. 6. pp. 101-116.
Dechow, P.M., S.A. Richardson, I.A. Tuna. 2003. Why Are Earnings Kinky? An Examination of
the Earnings Management Explanation. Review of Accounting Studies, Vol. 8. pp. 355-384.
Dechow, P.M., D. Skinner. 2000. Earnings management: reconciling the views of accounting
academics, practitioners, and regulators. Accounting Horizons, Vol. 14, No. 2, pp. 235-250.
99
Dechow, P.M. G. Sloan, P. Sweeney. 1995. Detecting earnings management. The Accounting
Review (April 1995), Vol. 70, No. 2. pp. 193-225
Deegan, C. Financial accounting theory. McGraw-Hill Book Company Australia. 2000.
Defond, M.L., Jiambalvo, J. 1994. Debt covenant violation and manipulation of accruals. Journal
of Accounting and Economics, Vol. 17. pp. 145-176.
DeFond, M., C.W. Park. 1997. Smoothing income in anticipation of future earnings. Journal of
Accounting and Economics. Vol. 23. pp. 115-139.
Demski, J.S. 1998. Performance measure manipulation. Journal of Accounting Research (Fall
1998), Vol. 15, No. 3. pp. 261-285.
Eckel, N. 1981. The income smoothing hypothesis revisited. Abacus, Vol. 17, No. 1, pp. 28-40.
Elgers, P.T., J. Pfeiffer Jr., S.L. Porter. 2003. Anticipatory income smoothing: a re-examination.
Journal of Accounting and Economics, Vol. 35. pp. 405-422.
Fama, E.F. 1970. Efficient capital markets: a review of theory and empirical work. Journal of
Finance, Vol. 25. pp 383-417.
Fama, E.F. 1991. Efficient capital markets: 2. Journal of Finance. pp. 1575-1617.
Fields, A. 2009. Discovering Statistics Using SPSS (and sex drugs and rock ‘n’ roll), third
edition. Sage Publications Ltd.
Fields, T.D., T.Z. Lys and L. Vincent. 2001. Empirical research on accounting choice, Journal of
Accounting and Economics, Vol. 31, Nos. 1-3. pp. 255-307;
Francis, J. 2001. Discussion of empirical research on accounting choice. Journal of Accounting
and Economics, Vol. 31, Nos. 1-3. pp. 309-319.
100
Friedman, M. The methodology of positive economics, Essays in positive economics. University
of Chicago Press. 1953.
Freeman, R., D. Reed. 1983. Stockholders and stakeholders: a new perspective on corporate
governance. California Management Review, Vol. 25, No. 2. pp. 88-106
Fudenberg, D., J. Tirole. 1995. A theory of income and dividend smoothing based on incumbency
rents. Journal of Political Economy, Vol.103 No.1, pp. 75-93.
Godfrey, J.M. and K.L. Jones. 1999. Political cost influences on income smoothing via
extraordinary item classification. Accounting and Finance (November 1999), Vol. 39, No. 3. pp.
229-254.
Healy, P. 1985. The effect of bonus schemes on accounting decisions. Journal of Accounting and
Economics, Vol. 7, Nos. 1-3. pp. 85-107.
Healy, P.M., J.M. Wahlen. 1999. A review of the earnings management literature and its
implications for standard setting, Accounting Horizons, vol. 13, pp. 365-383.
Hoogendoorn, M.N., Klaassen, J., Krens, F. (redactie), Externe verslaggeving in theorie en
praktijk, vierde druk, Elsevier, 2004, 2 delen.
Hunt, A., S. Moyer, and T. Shevlin. 2000. Earnings volatility, earnings management, and equity
value. Working paper, University of Washington.
Imhoff, E.A. 1977. Income smoothing, a case for doubt. Accounting Journal (Spring 1977). pp.
85-100.
Jensen, C., W.H. Meckling. 1976. Theory of the firm: managerial behavior, agency cost and
ownership structure. Journal of Financial Economics (October 1976), Vol. 3. pp 305-360.
Jones, J.J. 1991. Earnings Management During Import Relief Investigations. Journal of
Accounting Research, Vol. 29, No.2 .pp. 193-228.
101
Kirkpatrick, L.A., B.C. Feeney. 2003. A simple Guide to SPSS for Windows. Wadsworth,
Thomson Learning.
Kirschenheiter, M, N.D. Melumad. 2002. Can big bath and earnings smoothing co-exist as
equilibrium financial reporting strategies? Journal of Accounting Research, Vol. 40, No. 3. pp
761-796.
Kothari, S.P., A.J. Leone, C.E. Wasley. 2005. Performance Matched Discretionary Accrual
Measures. Journal of Accounting and Economics 39: pp 163-197.
Lambert, O. 1984. Income smoothing as rational equilibrium behavior. The Accounting Review
(October 1984), Vol. 59 No.4. pp, 604-618.
Mande, V., R.G. File and W. Kwak. 2000. Income smoothing and discretionary R&D
expenditures of Japanese firms. Contemporary Accounting Research (Summer 2000), Vol. 17,
No.2. pp. 263-302.
McNichols, M. (2000), Research design issues in earnings management studies, Journal of
Accounting and Public Policy, vol. 19. pp. 313–345.
Michelson, S.E., J. Jordan-Wagner, C.W. Wootten. 1995. A market based analysis of income
smoothing. Journal of Business Finance & Accounting (December 1995), Vol. 22, No. 8. pp.
1179-1193.
Michelson, S.E., J. Jordan-Wagner and C.W. Wootten. 2000. The Relationship between the
Smoothing of Reported Income and Risk-Adjusted Returns. Journal of Business Finance &
Accounting (Summer 2000), Vol. 24, No. 2. pp. 141-159.
Mohanram, P.S. 2003. How to manage earnings management?. Accounting World (October
2003). Institute of Chartered Financial Analysts of India.
Moses, O.D. 1987. Income smoothing and incentives: Empirical tests using accounting changes.
The Accounting Review (April 1987), Vol. 62, No 2, pp. 358-377.
102
Roberts, H.V. 1967. Statistical versus clinical predictions of the stock market. Unpublished paper
presented on the seminar on the analysis of the security prices , University of Chicago.
Ronen, J. and S. Sadan. 1975. Do corporations use their discretion in classifying accounting items
to smooth reported income? Financial Analysts Journal (September-October 1975), Vol. 31, No.
5. pp. 62-68.
Ronen, J., S. Sadan. 1981. Smoothing income numbers, Objectives, Means, and Implications.
Reading, MA, Addison Wesley.
Ronen, J., V. Yaari. 2008. Earnings management: emerging insights in theory, practice and
research series. Springer series in accounting scholarship.
Sankar, M.R., K.R. Subramanyam. 2001. Reporting discretion and private information
communication through earnings. Journal of Accounting Research (September 2001), Vol. 39.
No. 2. pp. 365-386.
Schipper, K. 1989. Earnings management. Accounting Horizons. Vol. 3. pp. 91-106.
Scott, W.R., Financial Accounting theory, third edition, Prentice Hall, 2003.
Stolowy, H., G. Breton. 2004. Accounts manipulation: a literature review and proposed
conceptual framework, Review of Accounting & Finance, Vol. 3, No. 1, 2004. pp. 5-66.
Subramanyam, K. R. 1996. The pricing of discretionary accruals. Journal of Accounting and
Economics 22. pp 249-281.
Suh, Y.S. 1990. Communication and income smoothing through accounting method choice.
Management Science (June 1990), Vol. 36, No.6, pp 704-723.
Trueman, B. and S. Titman. 1988. An explanation for accounting income smoothing. Journal of
Accounting Research (Supplement), Vol. 26. pp. 127-139.
103
Tucker, J.W., P.A. Zarowin. 2006. Does income smoothing improve earnings informativeness?,
The Accounting Review, Vol. 81, No.1, pp.251-270.
Van der Bauwhede, H. 2003. Resultaatsturing en kapitaalmarkten. Een overzicht van de
academische literatuur. Maandblad voor Accountancy en Bedrijfseconomie, jg. 77, No. 5, (mei),
pp. 196-204.
Watts, R.L., J.L. Zimmerman. 1978. Towards a positive theory of the determinants of accounting
standards. The Accounting Review, Vol. 53, No 1 (Jan 1978). pp 112-134.
Watts, R.L., J.L. Zimmerman. 1990. Positive accounting theory: a ten year perspective. The
Accounting Review, Vol. 65, No 1 (Jan 1990). Pp 131-156.
Xiong, Y. (2006), Earnings management and its measurement: a theoretical perspective, Journal
of American Academy of Business, Vol. 9, No. 1. pp. 214-219.
Zarowin, P. 2002. Does income smoothing make stock prices more informativeness?. Working
paper, New York University, Stern School of Business.
Websites consulted in alphabetic order:
www. FASB.org
www. IFRS.org
104
Appendix 1: Overview of Prior Empirical Research
Empirical Research on Earnings Management
Authors/year Purpose of the
study
Research sample and
period
Research model Research results
Bartov and
Mohanram
(2004)
To test the relation
between earnings
management in
and stock option
exercises by top
level management
of companies
1.200 US listed
companies for the
period 1992 to 2001.
The Jones Model. Management does in fact
use their discretion over
the financial statements to
maximize earnings before
they exercise their stock
option plans
Dechow,
Richardson and
Tuna (2003)
To test why only a
small amount of
companies report
small loss while or
many companies
report a small
profits.
47.000 companies for
the period of 1989 to
2001.
Modified Jones
Model.
The research performed is
not conclusive on whether
management performs
earnings management.
Defond and
Jiambolva
(1994)
To test the use of
earnings
management in
relation to
companies that has
reported a breach
of a debt covenant.
94 companies for the
period of 1985 to 1988
The Jones Model. Evidence is obtained that
in the year before the
breach positive
discretionary accruals are
measured and in the year
of the breach negative
discretionary accruals are
measured
of Boyton et al.
(1992)
To test if
companies use
earnings
management to
lower their tax
liabilities.
649 companies for a
period of 1980 to
1988.
The Jones Model. No evidence was found
for large firms to perform
earnings minimization for
tax purposes.
105
Income Smoothing and Country Studies
Authors/year Purpose of the
study
Research sample and
period
Research model Research results
Booth et al
(1996)
To test the use of
income smoothing
in Finland.
31 companies listed on
the Helsinki stock
exchange for the
period of 1989 to 1993
The income
variability model.
40% of the companies in
the data sample are
qualified as income
smoothers
Ashari et al.
(1994)
To test which
factors affected the
use of income
smoothing for
listed companies in
Singapore
153 companies listed
on the Singapore stock
exchange for the
period of 1980 to 1990
The income
variability model.
The research indicates that
certain factors exist that
influence the use of
income smoothing.
Mande et al.
(2000)
To test the use of
income smoothing
of Japanese
companies by the
use of
discretionary R&D
expenditures.
123 Japanese
companies for the
period of 1987 to
1994.
A regression
model to measure
unexpected R&D
expenditures of
companies.
The R&D budget of
companies is changed
based on current period
earnings of the companies.
Income Smoothing and Company Characteristics
Authors/year Purpose of the
study
Research sample and
period
Research model Research results
Belkaoui and
Picur (1984)
To study if
differences in
economic sectors
have an influence
on the use of
income smoothing.
171 US companies for
the period 1958 to
1977.
A variant of the
income variability
model.
Relatively more
companies in the
periphery sectors apply
income smoothing than in
the core sectors.
Albrecht and To study if 128 companies for the The income The research proves that
106
Richardson
(1990)
differences in
economic sectors
have an influence
on the use of
income smoothing.
period 1974 to 1985. variability model. companies perform
income smoothing, but is
unable to provide
sufficient evidence for
smoothing behavior
differences between the
core and periphery sectors.
Carlson and
Bathala (1997)
To study if
differences in
ownership
structures of
companies are
related to the use
of income
smoothing
behavior.
256 companies for the
period of 1982 to
1988.
The income
variability model.
The research proves that
the ownership structure of
a company is a
explanatory factor for the
use of income smoothing.
Income Smoothing and the Value of the Company
Authors/year Purpose of the
study
Research sample and
period
Research model Research results
Michelson et
al. (1995)
To study if the use
of income
smoothing
influences the
market valuation
of companies.
358 companies of the
Standard and Poor 500
Index for the period of
1980 to 1991.
The income
variability model.
The research provides
evidence that companies
that use income smoothing
have got a higher market
value than companies that
do not use income
smoothing.
Bitner and
Dolan (1996)
To study the use of
income smoothing
in relation to
market valuation
of companies.
218 companies for the
period of 1976 to
1980.
The income
variability model.
The research results
support the results of
Michelson et al. (1995)
Michelson et To study if the use 358 companies from The income The researchers conclude
107
al. (2000) of income
smoothing
influences the
market valuation
of companies.
the Standard and Poor
500 Index for the
period of 1980 to
1991.
variability model. that companies that
qualify as income
smoothers have significant
higher abnormal returns
than non-smoothers.
Bao and Bao
(2004)
To study if the
valuation of
companies is not
only dependent on
the use of income
smoothing but also
on the quality of
earnings.
12.000 company year
observations for the
period of 1988 to
2000.
A variant of the
income variability
model.
Income smoothing only
influences company value
if the management uses
income smoothing to
signal their private
information about future
earnings.
Income Smoothing and Expected Earnings
Authors/year Purpose of the
study
Research sample and
period
Research model Research results
Defond and
Park (1997)
To study if worries
about job security
of management are
related to the use
of income
smoothing.
Over 13.000 company
year observations for
the period of 1984 to
1994.
Modified Jones
Model.
The empirical results show
that 89% of the
management of companies
included in the data
sample applies income
smoothing discretion in
accordance with the
predicted behavior.
108
Elgers et al.
(2003)
To study if worries
about job security
of management are
related to the use
of income
smoothing.
Over 14.000 company
year observations for
the period of 1984 to
1999.
Modified Jones
Model.
The research is
inconclusive to proof that
management of companies
will smooth the income of
the company in
anticipation of future
earnings.
The Informativeness Methodology
Authors/year Purpose of the
study
Research sample and
period
Research model Research results
Subramanyam
(1996)
To test if stock
markets price
discretionary
accruals applied by
management of
companies.
Over 21.000 company
year observations over
the period of 1973 to
1993.
Modified Jones
Model.
That income smoothing
improves the predictability
of future earnings and that
discretionary accruals are
used by the management
of the company to
communicate private
information about the
future period earnings.
Hunt, Moyer
and Shevlin
(2000)
To test if the use
of discretionary
accruals increases
or decreases the
informativeness of
the earnings.
2.225 companies for
the period of 1983 to
1992.
Modified Jones
Model.
The use of discretion by
management of companies
over the financial
statements increases the
informativeness of the
earnings instead of
decreasing the
informativeness of the
earnings.
109
Zarowin
(2002)
To study if the use
of income
smoothing
increases the
informativeness of
stock prices.
Over 24.000 company
year observations for
the period of 1991 to
1999.
Modified Jones
Model.
That the use of income
smoothing increases the
informativeness of the
stock prices.
Tucker and
Zarowin
(2006)
To study if the use
of income
smoothing
increases the
earnings
informativeness.
Over 17.000 US
company year
observations for the
period of 1993 to
2000.
Modified Jones
Model.
That the use of income
smoothing increases the
informativeness of the
earnings.
110
Appendix 2: Empirical Research Data
Company
2003 to 2010
2003 to 2008
Aegon NV 12,105 0 0,9282 1 2,180 1,630 40
Koninklijke Ahold NV 1,375 0 1,7790 0 1,828 0,090 30
Air France-KLM 8,444 0 3,4180 0 3,220 3,470 20
Akzo Nobel NV 1,869 0 0,1779 1 1,020 3,360 15
Arcelormittal 3,885 0 2,3349 0 12,794 3,572 15
Asml Holding NV 0,790 1 0,6691 1 3,911 0,810 45
Koninklijke BAM Groep NV 9,371 0 3,3027 0 3,202 0,183 20
Royal Boskalis Westminster NV 1,478 0 1,2589 0 5,733 0,246 20
Corio NV 11,520 0 3,3858 0 18,150 8,890 40
Koninklijke DSM 2,666 0 3,6746 0 8,630 2,680 15
Fugro NV 1,301 0 1,1492 0 9,040 1,510 10
Heineken NV 10,565 0 7,2065 0 4,550 1,550 30
ING Groep NV 5,082 0 0,9993 1 4,440 1,958 40
Koninklijke KPN NV 0,727 1 1,6234 0 2,980 0,660 50
Koninklijke Philips Electronics Na 1,884 0 3,3960 0 4,840 2,290 20
Randstad Holding NV 3,550 0 24,2733 0 6,490 2,100 20
Royal Dutch Shell 1,536 0 2,3110 0 9,665 3,061 10
SBM Offshore NV 1,890 0 2,1896 0 3,412 0,317 10
Postnl NV 2,874 0 3,0251 0 5,422 1,380 20
Tom Tom 27,907 0 3,4688 0 -1,592 0,936 25
Unibail-Rodamco 3,229 0 4,1123 0 47,990 30,450 40
Unilever NV 0,695 1 0,9307 1 4,790 0,431 30
Wereldhave NV 17,844 0 3,5027 0 26,970 9,240 40
Wolters Kluwer NV 0,695 1 0,6868 1 5,190 0,860 25
Admiral Group PLC 1,158 0 1,1748 0 1,820 0,476 40
Aggreko PLC 1,206 0 1,3792 0 1,220 0,214 20
Alliance Trust PLC 2,279 0 2,1840 0 0,334 0,012 40
Anglo American PLC 0,577 1 0,1290 1 10,269 2,355 15
Barclays PLC 4,194 0 1,8420 0 2,515 0,751 40
BT Group PLC 1,687 0 0,7610 1 0,765 0,264 50
Bunzl PLC 8,768 0 0,1742 1 1,563 0,531 20
Burberry Group PLC 5,270 0 5,6896 0 0,749 0,328 25
Cairn Energy PLC 2,328 0 0,1143 1 0,070 0,005 10
The Capita Group PLC 1,348 0 1,7139 0 0,982 0,237 20
Carnival PLC 1,938 0 1,5926 0 6,323 2,246 25
Centrica PLC 1,150 0 0,0500 1 0,211 0,200 55
Experian PLC 10,268 0 10,1537 0 0,959 0,863 20
GKN PLC 3,304 0 2,3154 0 0,261 0,051 25
Icap PLC 3,497 0 1,4489 0 0,890 0,281 40
111
Inmarsat PLC 12,318 0 2,7916 0 0,800 0,136 50
Intercontinental Hotels Group PLC 2,736 0 2,6296 0 3,679 2,569 25
Intertek Group PLC 0,758 1 0,6226 1 1,858 0,536 20
Invensys PLC 1,522 0 2,0164 0 1,118 0,375 20
Investec PLC 1,415 0 2,0856 0 1,945 0,154 40
Kazakhmys PLC 0,685 1 2,2304 0 5,489 1,035 15
Kingfisher PLC 1,868 0 2,9298 0 0,389 0,088 25
Land Securities Group PLC 5,627 0 0,7275 1 -3,887 4,052 40
Lonmin PLC 2,157 0 2,6891 0 4,690 0,830 15
Man Group PLC 0,615 1 1,6316 0 2,048 0,099 40
Marks & Spencer Group PLC 48,618 0 3,0491 0 1,542 0,450 25
National Grid PLC 0,560 1 3,7749 0 2,032 1,458 55
Next PLC 0,685 1 2,3869 0 6,221 1,865 25
Petrofac Limited 1,750 0 1,5983 0 1,089 0,197 10
Randgold Resources Limited 7,220 0 0,4108 1 1,269 0,498 15
Reckitt Benckiser Group PLC 0,764 1 0,5711 1 4,804 1,339 30
Rolls-Royce Holdings PLC 12,298 0 0,4200 1 0,456 0,262 20
Royal Dutch Shell PLC 2,010 0 2,8652 0 8,960 3,042 10
Sainsbury (J) PLC 3,245 0 2,2354 0 0,702 0,054 30
Severn Trent PLC 1,968 0 1,4531 0 2,550 2,061 55
Shire PLC 1,216 0 1,3150 0 0,290 -0,285 35
Smiths Group PLC 6,748 0 84,9242 0 5,613 1,282 20
Unilever PLC 0,198 1 2,0875 0 4,355 2,858 30
United Utilities Group PLC 33,026 0 0,3115 1 2,307 0,348 55
Vedanta Resources PLC 3,022 0 7,6114 0 4,899 1,049 15
Vodafone Group PLC 1,011 0 0,0530 1 0,076 -0,501 50
Whitbread PLC 9,079 0 5,7032 0 6,201 1,549 25
Wolseley PLC 0,713 1 2,2080 0 44,568 19,792 20
WPP PLC 1,061 0 0,7693 1 1,475 0,441 25
Xstrata PLC 2,742 0 2,3745 0 2,576 0,575 15
3I Group PLC 2,216 0 0,0601 1 0,529 1,633 40
Adidas AG 2,535 0 0,2190 1 8,330 0,512 25
Allianz SE 0,151 1 0,7502 1 29,660 11,240 40
BASF SE 2,122 0 7,0515 0 6,803 1,433 15
BMW AG 5,390 0 2,4043 0 9,650 3,330 25
Bayer AG 14,697 0 4,0090 0 7,130 2,140 35
Beiersdorf AG 26,359 0 3,2632 0 7,340 0,484 30
Commerzbank AG 1,451 0 3,4437 0 3,423 1,235 40
Daimler AG 25,869 0 2,2764 0 9,540 2,800 25
Deutsche Bank AG 1,496 0 0,1352 1 15,944 6,311 40
Deutsche Boerse AG 4,568 0 1,4348 0 11,803 1,000 40
Deutsche Post AG 2,643 0 0,7701 1 1,350 1,990 20
Deutsche Telekom AG 1,803 0 2,9424 0 1,210 1,310 50
E On AG 4,923 0 15,0231 0 2,740 0,738 55
112
Fresenius Medical Care AG 0,638 1 0,5262 1 4,117 0,422 35
Fresenius SE 1,857 0 3,3967 0 5,170 0,590 35
Heidelbergcement AG 25,000 0 21,2720 0 25,259 3,190 15
Henkel AG & Company Kgaa 7,018 0 6,6841 0 5,634 0,590 30
Infineon Technologies AG 1,133 0 0,3060 1 -3,978 -0,336 45
K + S AG 4,744 0 2,8184 0 4,983 0,231 15
Linde AG 2,661 0 5,3246 0 23,440 3,821 15
Deutsche Lufthansa AG 11,066 0 52,8208 0 5,580 0,990 20
Man SE 0,928 1 0,1384 1 21,680 3,040 20
Merck Kgaa 1,898 0 0,2703 1 6,815 3,339 35
Metro AG 5,637 0 287,9927 0 6,980 1,630 30
RWE AG 0,539 1 0,3963 1 13,940 4,010 55
SAP AG 1,004 0 1,1545 0 4,690 0,302 45
Siemens AG 0,816 1 0,7966 1 9,510 3,430 20
Thyssenkrupp AG 7,199 0 2,2672 0 12,130 1,170 15
Volkswagen AG 2,748 0 3,4041 0 29,420 2,900 25
Accor 1,101 0 1,6809 0 8,290 1,550 25
Air Liquide 0,573 1 1,4660 0 9,054 1,187 15
Alcatel-Lucent 0,120 1 0,6865 1 -4,380 0,690 45
Alstom SA 0,057 1 0,2008 1 6,170 0,318 20
AXA 3,378 0 353,5447 0 5,556 2,039 40
BNP Paribas 2,021 0 14,6291 0 18,504 6,498 40
Bouygues SA 3,662 0 2,3616 0 11,070 2,510 20
Cap Gemini SA 0,693 1 0,4753 1 8,390 1,070 45
Carrefour SA 4,957 0 32,7949 0 7,130 2,580 30
Credit Agricole SA 20,632 0 75,1135 0 5,406 2,211 40
Danone 7,138 0 77,4227 0 11,497 1,324 30
Eads NV 13,164 0 4,0791 0 1,510 2,110 20
Electricite De France 16,023 0 2,2818 0 7,718 1,894 55
Essilor International 0,711 1 0,7987 1 4,433 0,705 35
France Telecom 0,129 1 2,6159 0 4,380 2,280 50
GDF Suez 1,163 0 0,7463 1 7,830 1,850 55
L'Oreal 7,385 0 9,8036 0 11,090 3,130 30
Lafarge SA 1,103 0 0,9030 1 19,100 4,606 15
LVMH 1,179 0 0,6724 1 12,530 3,060 25
Michelin 1,669 0 2,3478 0 10,951 5,723 25
Natixis 1,854 0 0,9460 1 -0,315 0,064 40
Pernod-Ricard 0,315 1 0,2953 1 6,152 1,012 30
Peugeot SA 0,621 1 0,0231 1 3,140 4,470 25
PPR SA 3,258 0 1,1176 0 17,310 4,500 25
Publicis Groupe SA 1,167 0 1,1656 0 6,500 1,830 25
Renault SA 1,770 0 0,5568 1 23,720 13,190 25
Saint Gobain 18,153 0 3,1278 0 12,520 3,660 20
Sanofi 4,497 0 7,0927 0 9,820 1,690 35
113
Schneider Electric SA 1,908 0 0,9007 1 19,609 4,452 20
Societe Generale 2,613 0 17,4326 0 11,973 6,712 40
Stmicroelectronics NV 5,744 0 0,0442 1 -0,296 0,242 45
Technip 0,864 1 1,3305 0 7,370 0,980 10
Total SA 0,719 1 2,6568 0 15,710 1,307 10
Vallourec 1,492 0 1,5171 0 13,725 0,476 20
Veolia Environnement 7,090 0 26,7278 0 4,576 1,547 55
Vinci SA 0,658 1 0,8892 1 7,923 1,218 20
Vivendi 0,749 1 0,8220 1 7,990 2,660 50
A2A Spa 2,775 0 1,5970 0 0,404 0,136 55
Atlantia 13,650 0 21,5427 0 2,509 1,135 20
Autogrill 3,485 0 1,8506 0 1,707 0,511 25
Azimut Holding Spa 0,390 1 0,8788 1 1,627 0,400 40
Banca Monte DEI Paschi 0,708 1 1,0666 0 0,452 0,108 40
Banca Popolare DI Milano 4,317 0 9,0285 0 1,923 0,624 40
Banco Popolare 5,076 0 3,2052 0 1,561 0,792 40
Bulgari 5,551 0 30,4443 0 1,230 0,380 25
Buzzi Unicem 1,425 0 0,9963 1 5,920 1,310 15
Davide Campari 2,446 0 3,2088 0 0,320 0,105 30
Enel Spa 2,163 0 0,7334 1 1,608 0,341 55
ENI 4,296 0 1,9592 0 7,650 2,340 10
Exor 0,028 1 0,8345 1 6,029 1,292 40
Fiat Spa 0,998 1 0,1871 1 3,616 1,250 25
Finmeccanica Spa 13,923 0 13,0424 0 4,122 0,719 20
Fondiaria-SAI 2,395 0 20,9400 0 2,679 1,219 40
Impregilo 3,053 0 3,2898 0 0,890 0,760 20
Intesa Sanpaolo 0,715 1 0,8250 1 0,743 0,411 40
Lottomatica 39,416 0 2,1149 0 1,019 1,006 25
Luxottica 16,951 0 52,1079 0 2,860 0,760 25
Mediaset Spa 66,544 0 7,3638 0 1,290 0,510 25
Mediobanca 15,788 0 1,5598 0 3,175 0,617 40
Mediolanum 1,501 0 0,2230 1 0,633 0,320 40
Pirelli & C 13,379 0 4,0818 0 -4,677 6,907 25
Saipem 2,637 0 1,5379 0 4,970 0,590 10
Snam Rete Gas 1,047 0 2,9553 0 0,551 0,170 55
Telecom Italia 0,921 1 0,5402 1 0,380 0,170 50
Tenaris SA 0,749 1 1,5132 0 3,678 0,872 10
Terna Spa 2,413 0 1,5160 0 0,556 0,149 55
Tod's Spa 2,139 0 3,0024 0 7,460 1,760 25
Unicredit 4,860 0 3,1530 0 0,894 0,240 40
UBI Banca 8,667 0 8,7654 0 2,890 1,672 40
Amec PLC 0,642 1 1,3146 0 3,051 0,019 10
Antofagasta PLC 1,532 0 0,3741 1 2,999 0,118 15
Arm Holdings PLC 1,867 0 6,0711 0 0,125 0,032 45
114
Associated British Foods PLC 8,032 0 6,9193 0 1,813 0,619 30
Astrazeneca PLC 0,730 1 0,2766 1 7,978 2,336 35
Autonomy Corp. PLC 0,978 1 1,0150 0 0,721 0,056 45
Aviva PLC 0,669 1 2,1599 0 1,588 1,070 40
BAE Systems PLC 2,571 0 0,6665 1 1,628 0,253 20
BG Group PLC 2,074 0 1,9183 0 2,431 0,629 10
BHP Billiton PLC 4,021 0 1,6649 0 4,889 0,832 15
BP PLC 1,021 0 0,8383 1 2,247 0,849 10
British American Tobacco PLC 0,231 1 3,0833 0 4,074 1,230 30
British Land Company PLC 10,032 0 0,1959 1 -4,502 2,371 40
British Sky Broadcasting Group PLC 1,721 0 2,1322 0 0,767 0,329 25
Capital Shopping Centers Group PLC 0,964 1 0,7262 1 -0,490 1,489 40
Compass Group PLC 0,059 1 2,4015 0 0,828 0,000 25
Diageo PLC 6,811 0 0,2492 1 2,544 0,686 30
Glaxosmithkline PLC 0,070 1 2,1758 0 3,619 1,202 35
Hammerson PLC 3,382 0 0,4789 1 0,073 1,327 40
HSBC Holdings PLC 3,823 0 3,2507 0 1,899 0,829 40
IMI PLC 0,590 1 7,7338 0 1,158 0,057 20
Imperial Tobacco Group PLC 1,821 0 10,4186 0 3,442 0,871 30
International Power PLC 551,995 0 2,5383 0 1,324 0,282 55
Johnson Matthey PLC 3,660 0 0,9759 1 3,553 0,590 15
Legal & General Group PLC 2,111 0 2,8672 0 0,326 0,209 40
Lloyds Banking Group PLC 1,620 0 0,0415 1 0,414 0,160 40
Morrison (WM) Supermarkets PLC 3,058 0 4,4707 0 0,615 -0,138 30
Old Mutual PLC 0,097 1 0,2074 1 0,603 0,365 40
Pearson PLC 0,006 1 1,2676 0 1,856 1,138 25
Prudential PLC 0,482 1 1,1667 0 0,941 0,460 40
Rexam PLC 0,595 1 0,0281 1 1,109 0,467 15
Rio Tinto PLC 1,989 0 7,3314 0 6,760 2,094 15
Royal Bank Of Scotland Group PLC 6,257 0 1,3408 0 -0,552 0,192 40
RSA Insurance Group PLC 1,937 0 2,6381 0 0,405 0,275 40
Sabmiller PLC 0,459 1 0,4216 1 2,484 0,846 30
The Sage Group PLC 1,039 0 1,3421 0 0,505 0,164 45
Schroders PLC 1,937 0 12,3122 0 2,853 0,956 40
Scottish & Southern Energy PLC 4,148 0 7,6544 0 2,827 1,071 55
Serco Group PLC 0,856 1 0,8723 1 0,690 0,170 20
Smith & Nephew PLC 1,565 0 4,8825 0 0,806 0,290 35
Standard Chartered PLC 0,530 1 0,4156 1 2,985 0,848 40
Tesco PLC 1,377 0 1,5486 0 1,015 0,295 30
Tullow Oil PLC 25,422 0 1,7213 0 0,775 0,255 10
Weir Group PLC 1,832 0 2,8677 0 2,282 0,183 20
115


![Abacus Volume 17 Issue 1 1981 [Doi 10.1111%2Fj.1467-6281.1981.Tb00099.x] NORM ECKEL -- The Income Smoothing Hypothesis Revisited](https://img.pdfslide.us/doc/110x75/55cf858d550346484b8f4824/abacus-volume-17-issue-1-1981-doi-1011112fj1467-62811981tb00099x-norm.jpg)