Embed Size (px)
Citation preview
DI
SC
US
SI
ON
P
AP
ER
S
ER
IE
S
Forschungsinstitut zur Zukunft der ArbeitInstitute for the Study of Labor
Income Inequality in Bolivia, Colombia, and Ecuador: Different Reasons
IZA DP No. 9210
July 2015
María Aristizábal-RamírezGustavo Canavire-BacarrezaMichael Jetter
Income Inequality in Bolivia, Colombia,
and Ecuador: Different Reasons
María Aristizábal-Ramírez Universidad EAFIT
Gustavo Canavire-Bacarreza
Universidad EAFIT and IZA
Michael Jetter
University of Western Australia and IZA
Discussion Paper No. 9210 July 2015
IZA
P.O. Box 7240 53072 Bonn
Germany
Phone: +49-228-3894-0 Fax: +49-228-3894-180
E-mail: [email protected]
Any opinions expressed here are those of the author(s) and not those of IZA. Research published in this series may include views on policy, but the institute itself takes no institutional policy positions. The IZA research network is committed to the IZA Guiding Principles of Research Integrity. The Institute for the Study of Labor (IZA) in Bonn is a local and virtual international research center and a place of communication between science, politics and business. IZA is an independent nonprofit organization supported by Deutsche Post Foundation. The center is associated with the University of Bonn and offers a stimulating research environment through its international network, workshops and conferences, data service, project support, research visits and doctoral program. IZA engages in (i) original and internationally competitive research in all fields of labor economics, (ii) development of policy concepts, and (iii) dissemination of research results and concepts to the interested public. IZA Discussion Papers often represent preliminary work and are circulated to encourage discussion. Citation of such a paper should account for its provisional character. A revised version may be available directly from the author.
IZA Discussion Paper No. 9210 July 2015
ABSTRACT
Income Inequality in Bolivia, Colombia, and Ecuador: Different Reasons
This paper analyzes the individual-level determinants of wage inequality for Bolivia, Colombia, and Ecuador from 2001 to 2010. Using a rich annual data set from surveys in all three countries, we analyze wages both using conventional wage regressions and decompositions of standard Gini indices. Although popular opinion and standard Gini indices suggest Colombia to exhibit the most unequal distribution of income among these countries, our results suggest otherwise. If one assumes educational attainment to form part of one’s own responsibility the Colombian income distribution appears more equal than Bolivia’s or Ecuador’s. In 2010, educational achievement explains over 10.9 percent of the Gini score in Colombia, 6.3 percent in Ecuador, and a mere 2.4 percent in Bolivia. Our findings show that the sources of income inequality can differ substantially across countries. Respective policy prescriptions should differ accordingly. JEL Classification: D31, D63, J31 Keywords: income inequality, Gini coefficient, unfair inequality Corresponding author: Michael Jetter University of Western Australia 8716 Hackett Drive Crawley, WA 6009 Australia E-mail: [email protected]

1 Introduction
Economic inequality has emerged as a primary topic in politics and economics. Especially Latin
American countries continue to exhibit large degrees of income inequality: 15 of the 25 most
unequal nations on earth are located in Latin America, according to the Gini index derived by the
United Nations. Several historical explanations have been proposed for this development, such
as the formation of extractive institutions (Acemoglu et al., 2005) or the lack of a modernization
period introducing welfare states (Williamson, 2015). Although these broad explanations are
helpful in understanding the origins of income inequality, they provide little practical guidance
for policymakers. For example, designing potential policy solutions to inequality would differ
drastically if inequality today was mostly due to, say, educational differences, as opposed to
gender or racial differences.
This paper analyzes the sources of income inequality in three South American countries that
have taken very different political paths to combat large inequality: Bolivia, Colombia, and
Ecuador. Bolivia and Ecuador have focused on redistribution and equality, whereas Colombia
has emphasized economic growth, prosperity, and especially domestic security. At first glance,
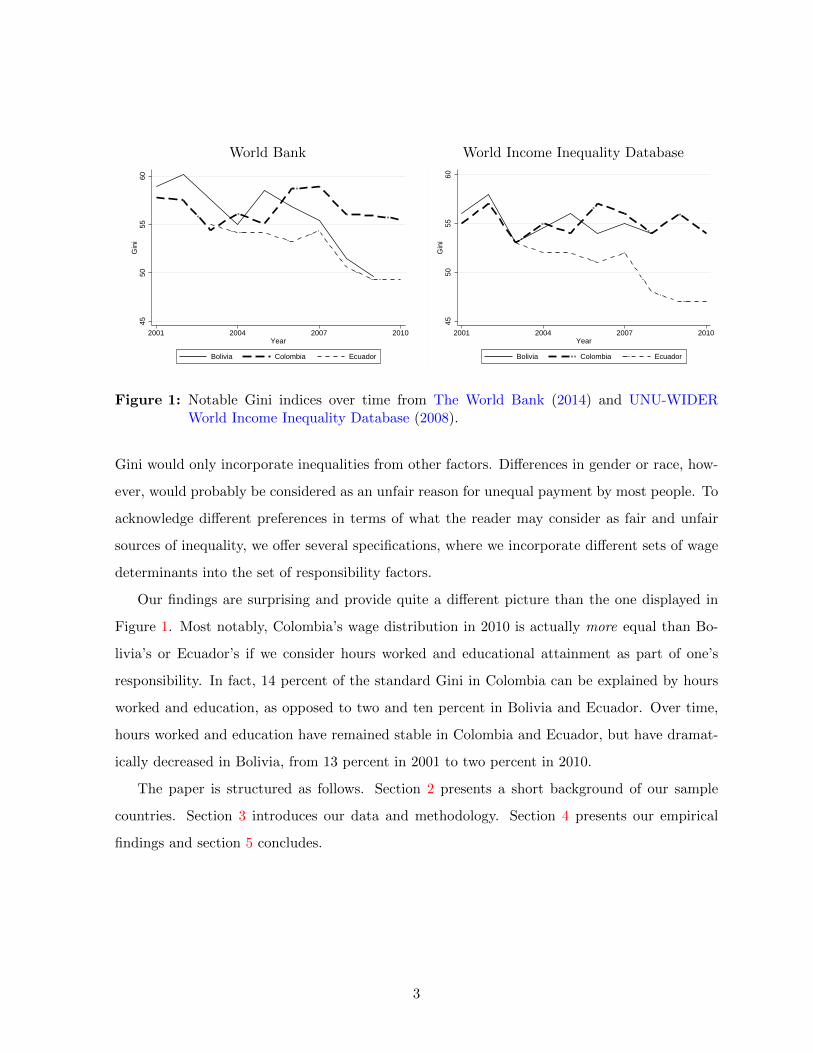
Bolivia and Ecuador have substantially reduced income inequality from 2001 to 2010, whereas
inequality in Colombia has changed very little in that time frame, as displayed by plotting the
standard Gini index in Figure 1.
However, the standard Gini does not address the immediate sources of wage inequality. We
apply a recently developed econometric technique (Almas et al., 2011; Almas et al., 2012) of
analyzing individual-level data in isolating the determinants of wage inequality. This process
allows us to filter out what part of the Gini index can be traced to differences in hours worked,
educational attainment, and occupational choices. We derive an adjusted Gini, where income
inequality resulting from so-called responsibility factors (i.e., considered as a fair source of in-
equality) is used to calculate the reference point of a fair income distribution. As a result, only
inequality from non-responsibility factors (i.e., inequality from unfair determinants) remains.
Of course, everyone has different ideas of what should be considered as part of one’s respon-
sibility. For example, most people would probably agree that pure effort levels, such as hours
worked, should be within the realm of one’s responsibility. As a consequence, the estimation
would consider all inequalities resulting from hours worked as fair and the resulting adjusted
2
World Bank World Income Inequality Database45
5055
60G
ini
2001 2004 2007 2010Year
Bolivia Colombia Ecuador
4550
5560
Gin
i
2001 2004 2007 2010Year
Bolivia Colombia Ecuador
Figure 1: Notable Gini indices over time from The World Bank (2014) and UNU-WIDERWorld Income Inequality Database (2008).
Gini would only incorporate inequalities from other factors. Differences in gender or race, how-
ever, would probably be considered as an unfair reason for unequal payment by most people. To
acknowledge different preferences in terms of what the reader may consider as fair and unfair
sources of inequality, we offer several specifications, where we incorporate different sets of wage
determinants into the set of responsibility factors.
Our findings are surprising and provide quite a different picture than the one displayed in
Figure 1. Most notably, Colombia’s wage distribution in 2010 is actually more equal than Bo-
livia’s or Ecuador’s if we consider hours worked and educational attainment as part of one’s
responsibility. In fact, 14 percent of the standard Gini in Colombia can be explained by hours
worked and education, as opposed to two and ten percent in Bolivia and Ecuador. Over time,
hours worked and education have remained stable in Colombia and Ecuador, but have dramat-
ically decreased in Bolivia, from 13 percent in 2001 to two percent in 2010.
The paper is structured as follows. Section 2 presents a short background of our sample
countries. Section 3 introduces our data and methodology. Section 4 presents our empirical
findings and section 5 concludes.
3
2 Background
The political landscape in Latin America has seen substantial changes over the past decades.
In general, some countries have decidedly moved toward what is conventionally considered left-
wing policies, most notably Bolivia and Ecuador. A second group of countries has moved
away from democratic principles and, although disguised as leftist regimes, moved toward more
authoritarian regimes, such as Venezuela or more recently Argentina. Finally, a third, smaller
group of countries have implemented more free-market policies, such as Colombia or Peru.
It is well possible that one reason for a leftward move of several countries lies in the persistent
inequality in many Latin American societies. For example, both the governments of Bolivia and
Ecuador consider inequality as a primary problem and have developed several policies aimed at
combatting inequality. Bolivia elected Evo Morales in 2005 and Rafael Correa was elected in
Ecuador in 2007. Both governments have articulated a left-wing political economy, emphasizing
an end of the elite’s privileges and expanding welfare programs (Grugel and Riggirozzi, 2012).
Both governments have started reforms to strengthen the political base. Bolivia, for example,
created the Hydrocarbons Law (Ley de Hidrocarburos) in 2008, increasing the royalty tax by
18 percent, in addition to raising direct taxes by 32 percent. Evo Morales increased the gov-
ernment’s participation in the energy sector and focused on funding social programs. Ecuador
not only increased export taxes but also renegotiated contracts with oil companies (Grugel and
Riggirozzi, 2012; Mosley, 2012).
Colombia, however, stands in contrast to these developments. Especially from 2002 to 2010,
Alvaro Uribe has formed a government focused on free-market principles and national security,
most notably a much more aggressive approach toward the Revolutionary Armed Forces of
Colombia (FARC). Uribe organized his politics in terms of rebuilding the feelings of safety and
around guaranteeing private investment to promote economic growth (Departamento Nacional
de Planeacion, 2003; Departamento Nacional de Planeacion, 2007), which could be associated
with the neo-liberal model implemented in Latin America over the nineties (Gwynne and Kay,
2000). For example, in 2003, Colombia conducted a major labor market reform with the goal
to make the labor market more flexible and to diminish the cost of labor. One often articulated
critique of the Uribe era is that the corresponding policies have not focused enough on inequality
and redistributional aspects.
4
The following pages are intended to evaluate the sources of inequality in Bolivia, Colombia,
and Ecuador from 2001 to 2010. We build our analysis on the econometric technique introduced
by Almas et al. (2011), which allows us to derive an adjusted Gini in which one can choose wage
determinants that would not enter the Gini, but rather that are used to derive the benchmark
of a fair distribution of income.
Essentially, the standard Gini represents a special case of this generalization where we as-
sume that a uniform income distribution is the most equal distribution, therefore receiving a
Gini score of 0. Almas et al. (2011)’s technique, however, derives a new fairness ideal in which
characteristics that are deemed as responsibility factors (e.g., hours worked) are used to derive
the fair distribution of income. This corresponds to a responsibility-sensitive approach of dis-
tribution (Bossert and Fleurbaey, 1996; Devooght, 2008). The adjusted Gini then produces a
measure for the remaining income inequality that is not explained by responsibility factors. In
the language of Almas et al. (2011), this adjusted Gini is then labeled as a measurement for
“unfair” inequality, i.e., inequality owed to non-responsibility factors.
3 Data and Methodology
3.1 Data
To estimate adjusted and standard Ginis, we use annual data from national labor surveys con-
ducted in Bolivia, Colombia, and Ecuador for the years 2001 to 2010. It is important to note that
the Colombian data in the years 2006 and 2007 has been labeled as being incomparable to the
remaining years.1 Nevertheless, our results are not affected by these years. Our analysis focuses
on observations of employed people between 15 and 65 years old, consistent with the methodol-
ogy used by Almas et al. (2011). For each country, we choose the variable corresponding to the
wage income from the individual’s main labor activity as the outcome variable.
Table 1 displays summary statistics for all three samples. Colombia displays the largest
number of observations, as the country counts approximately five times the population of Bo-
1In 2006, Colombia’s statistical institution, the Departamento Administrativo Nacional de Estadıstica (DANE),changed its survey methodology with the intention to obtain better and more complete data on labor markets.However, this change caused confusion as a lot of questions were not answered completely, whereas others werechanged in ways that made them incomparable to previous years. For that reason, Farne (2010) suggests avoidingcomparisons with these years.
5
livia (48.3 million versus 10.6 million) and more than three times the populace of Ecuador (15.7
million). On average, reported monthly wages range from US$172 in Bolivia to US$277 in
Ecuador. We observe substantial differences in terms of hours worked and educational attain-
ment. Specifically, the average Colombian in our sample is working more hours and achieves a
higher educational level than the average Bolivian. Note that all three countries have imple-
mented regulations for maximum working hours. In Colombia and Bolivia, the limit is 48 hours,
but 40 hours in Ecuador. It is interesting to see that average hours worked in Ecuador exceed
the regulation. Informality does not appear to be the underlying reason, as only four percent of
respondents in Ecuador report working informally. In Bolivia and Colombia, however, nearly 50
percent of the respondents admit to working in the informal sector – a number consistent with
informality levels in the region (International Labour Organization, 2014).
In addition, we find substantial differences in educational attainment. 23 percent of the
Colombian respondents states at least some university education, whereas this is true for only
one out of five respondents in Bolivia and Ecuador, where 50 percent of the individuals have not
studied beyond the primary education level. Note that we group educational attainment into
four categories: no education, primary education, (some) secondary education, and (some) ter-
tiary education. Although these classifications are general, this definition allows for consistency
between all country samples.
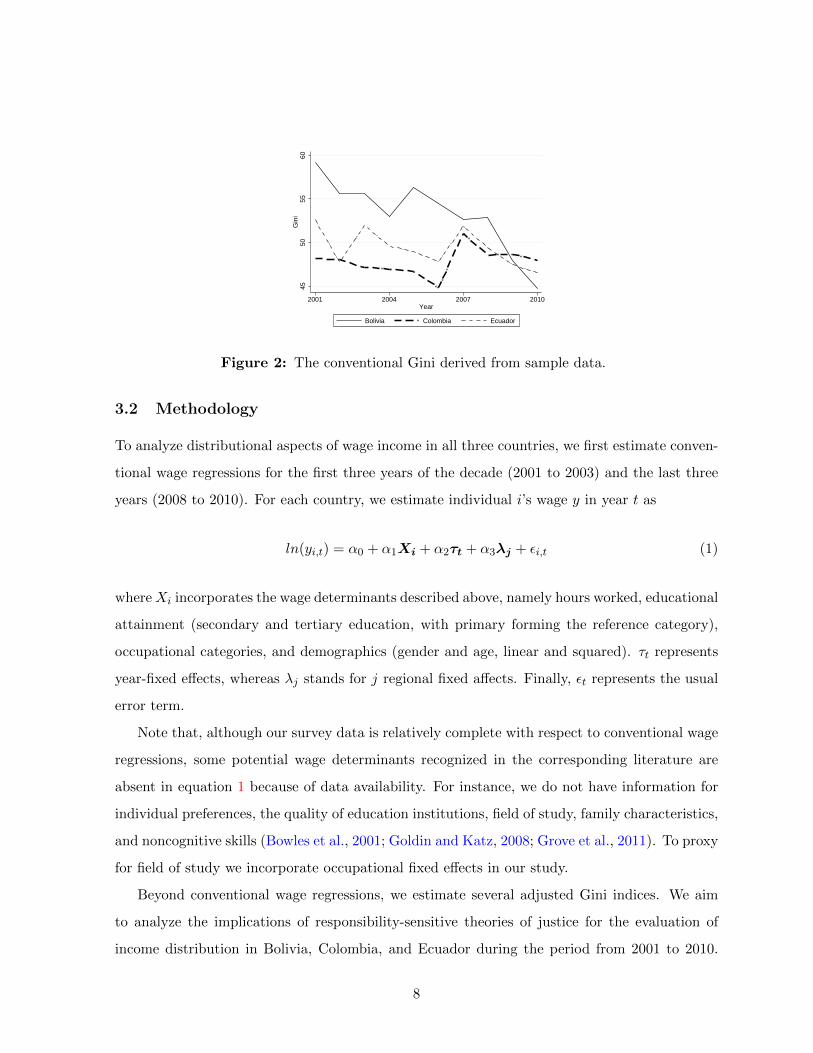
With the data described above, we first estimate standard Gini coefficients, as displayed in
Figure 2. Consistent with the Gini indices derived by the World Bank and the World Income
Inequality Database (WIID), Bolivia’s income distribution was more unequal than Colombia’s
or Ecuador’s at the beginning of the 21st century. However, this order was reversed through the
years. Ten years later, Colombia displays the most unequal society when looking at the standard
Gini index. Note that Gini estimations can vary across sources. Especially in developing nations,
it is difficult to derive an exact Gini measure, since many people work in the informal sector
and do not access official markets. Nevertheless, our survey data seems to replicate the general
trends in inequality from the World Bank and the WIID relatively well. In fact, our estimations
show a greater decline in inequality in Ecuador and Bolivia than the ones presented by Lustig
et al. (2013), who consider a broader definition of income. Thus, if anything, our data for Bolivia
and Ecuador may overstate the reduction in inequality.
6
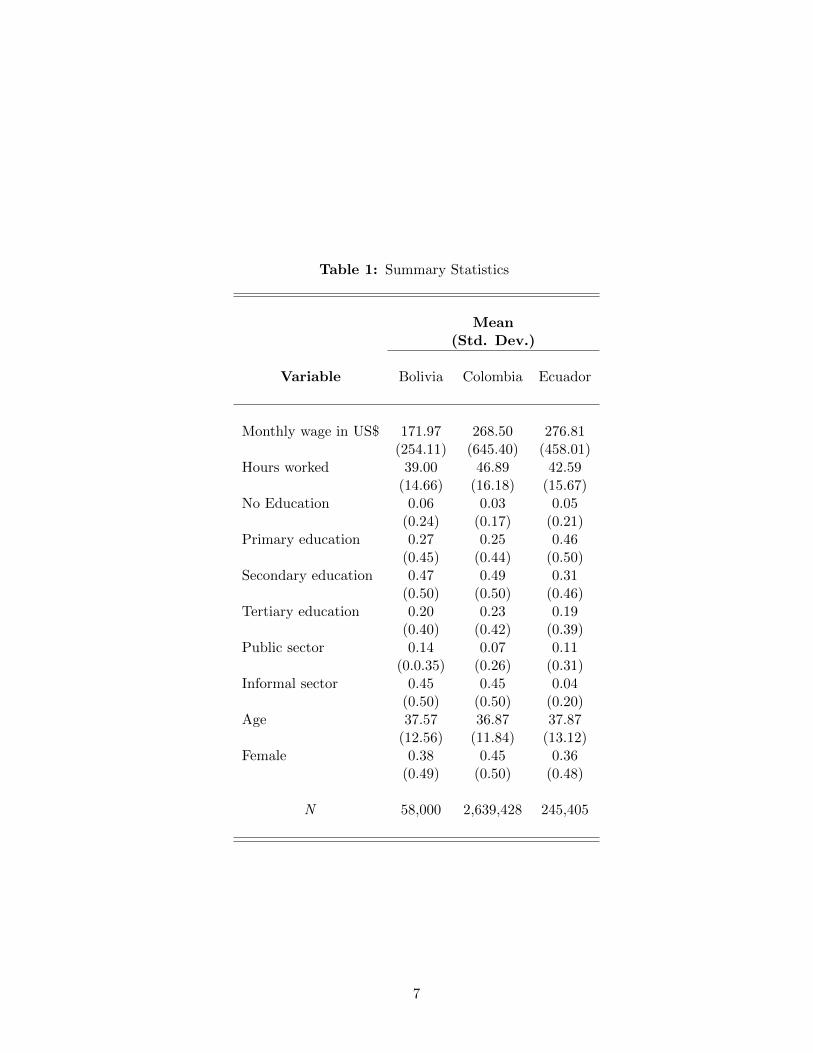
Table 1: Summary Statistics
Mean(Std. Dev.)
Variable Bolivia Colombia Ecuador
Monthly wage in US$ 171.97 268.50 276.81(254.11) (645.40) (458.01)
Hours worked 39.00 46.89 42.59(14.66) (16.18) (15.67)
No Education 0.06 0.03 0.05(0.24) (0.17) (0.21)
Primary education 0.27 0.25 0.46(0.45) (0.44) (0.50)
Secondary education 0.47 0.49 0.31(0.50) (0.50) (0.46)
Tertiary education 0.20 0.23 0.19(0.40) (0.42) (0.39)
Public sector 0.14 0.07 0.11(0.0.35) (0.26) (0.31)
Informal sector 0.45 0.45 0.04(0.50) (0.50) (0.20)
Age 37.57 36.87 37.87(12.56) (11.84) (13.12)
Female 0.38 0.45 0.36(0.49) (0.50) (0.48)
N 58,000 2,639,428 245,405
7
4550
5560
Gin
i2001 2004 2007 2010
Year
Bolivia Colombia Ecuador
Figure 2: The conventional Gini derived from sample data.
3.2 Methodology
To analyze distributional aspects of wage income in all three countries, we first estimate conven-
tional wage regressions for the first three years of the decade (2001 to 2003) and the last three
years (2008 to 2010). For each country, we estimate individual i’s wage y in year t as
ln(yi,t) = α0 + α1Xi + α2τt + α3λj + εi,t (1)
whereXi incorporates the wage determinants described above, namely hours worked, educational
attainment (secondary and tertiary education, with primary forming the reference category),
occupational categories, and demographics (gender and age, linear and squared). τt represents
year-fixed effects, whereas λj stands for j regional fixed affects. Finally, εt represents the usual
error term.
Note that, although our survey data is relatively complete with respect to conventional wage
regressions, some potential wage determinants recognized in the corresponding literature are
absent in equation 1 because of data availability. For instance, we do not have information for
individual preferences, the quality of education institutions, field of study, family characteristics,
and noncognitive skills (Bowles et al., 2001; Goldin and Katz, 2008; Grove et al., 2011). To proxy
for field of study we incorporate occupational fixed effects in our study.
Beyond conventional wage regressions, we estimate several adjusted Gini indices. We aim
to analyze the implications of responsibility-sensitive theories of justice for the evaluation of
income distribution in Bolivia, Colombia, and Ecuador during the period from 2001 to 2010.
8
This theory of justice specifies that income inequalities explained by individual decisions should
be accepted, in contrast to inequalities arising from non-responsibility factors (Cappelen and
Tungodden, 2006; Devooght, 2008). Nevertheless, we recognize that determining which factors
fall in the realm of one’s responsibility remains a subjective exercise and remain agnostic along
those lines. Specifically, we offer several responsibility cutoffs, allowing the reader to choose her
own definition as to which wage determinants should be considered as fair sources of income.
Specifically, we closely follow the methodology applied by Almas et al. (2011), who analyze
the development of the income distribution in Norway. Instead of ranking individuals based
on average income (as the standard Gini does), this methodology ranks individuals according
to the difference between their actual income and what would be considered their fair income,
given responsibility factors. Specifically, the “fair” income is derived following the application
of the generalized proportionality principle (Cappelen and Tungodden, 2006), which states that
individuals who share the same characteristics in terms of responsibility factors should enjoy
the same income. For example, if we were to say that hours worked are a fair source of income,
then any income inequality resulting from differences in hours worked would not be considered
by that adjusted Gini. Mathematically, this idea corresponds to equation (5) in Almas et al.
(2011):
zGPPi =
g(xRi ; ·)∑
j g(xRi ; ·)
∑i
yi, (2)
where zGPP captures the individual’s fair income. g(xRi ; ·) denotes the income function
of responsibility factors, considering that all individuals are identical to all non-responsibility
factors and yi represents the actual income. The derivation of the adjusted Gini is then based
on ranking individuals by zGPPi . In our application of this methodology, we follow the sequence
proposed by Almas et al. (2011), intended to capture the degree of responsibility involved. We
start by selecting only the hours of work as part of the responsibility factors and then gradually
add educational characteristics, job sector, and fixed effects for regions. Note that we select
the same educational categories for all our three samples: (some) primary education, secondary
education, and tertiary education. Overall, all variable definitions are equivalent across samples,
facilitating comparability across our results.
Beyond Almas et al. (2011), this methodology has been applied to analyzing inequality
9
developments in Brazil by Figueiredo and Junior (2014) from 1995 to 2009. Similarly, Carpantier
and Sapata (2013) use this methodology to compare inequality of opportunity in French regions.
4 Empirical Findings
4.1 Labor Earnings Equations
We start by estimating conventional wage regressions, as outlined in equation 1. Specifically,
we estimate two regressions for each of our sample countries: one including the years 2001,
2002, and 2003 and another considering the years 2008, 2009, and 2010. Although we could well
choose other time frames, we wish to emphasize the labor market situation at the end of our
sample compared to the beginning of the decade.
Table 2 displays the corresponding results. Not surprisingly, additional working hours are
rewarded with a higher wage in all subsamples. In general, one additional hour of work trans-
lates to a 1.5 – 2.1 percent increase in wage. Second, with (some) primary education forming
the omitted category, substantial country differences emerge when looking at the returns to
education. For both time frames, having a secondary education increases wages by over 30 per-
cent in Colombia. In Bolivia and Ecuador, however, this semi-elasticity only reaches 23 percent
(Ecuador in the more recent subsample). Somewhat surprisingly, at the end of the decade, a
secondary education in Bolivia only increased one’s wage by 3.6 percent.
Further, the returns to education actually decreased in Bolivia and Ecuador since 2001. This
trend is then confirmed when considering tertiary schooling. Relative to primary education
levels, at least some university education doubles wages in Colombia, increasing salaries by 50
percent in Ecuador, but we observe no statistically significant difference in Bolivia. This result
is surprising, as we would not expect a tertiary education to yield the same salary as primary
education. Previously, Canavire-Bacarreza and Rios-Avila (2015) have highlighted that Bolivia
has experienced “a sharp reduction in returns on higher education.”
Considering a comparison between private and public sector employment, government em-
ployees are earning a substantial premium in all three countries. For Bolivia and Ecuador, the
increases in salary for public sector workers confirm the announcements of Rafael Correa and
Evo Morales, who put strong emphasis on public sector participation in markets. However,
10
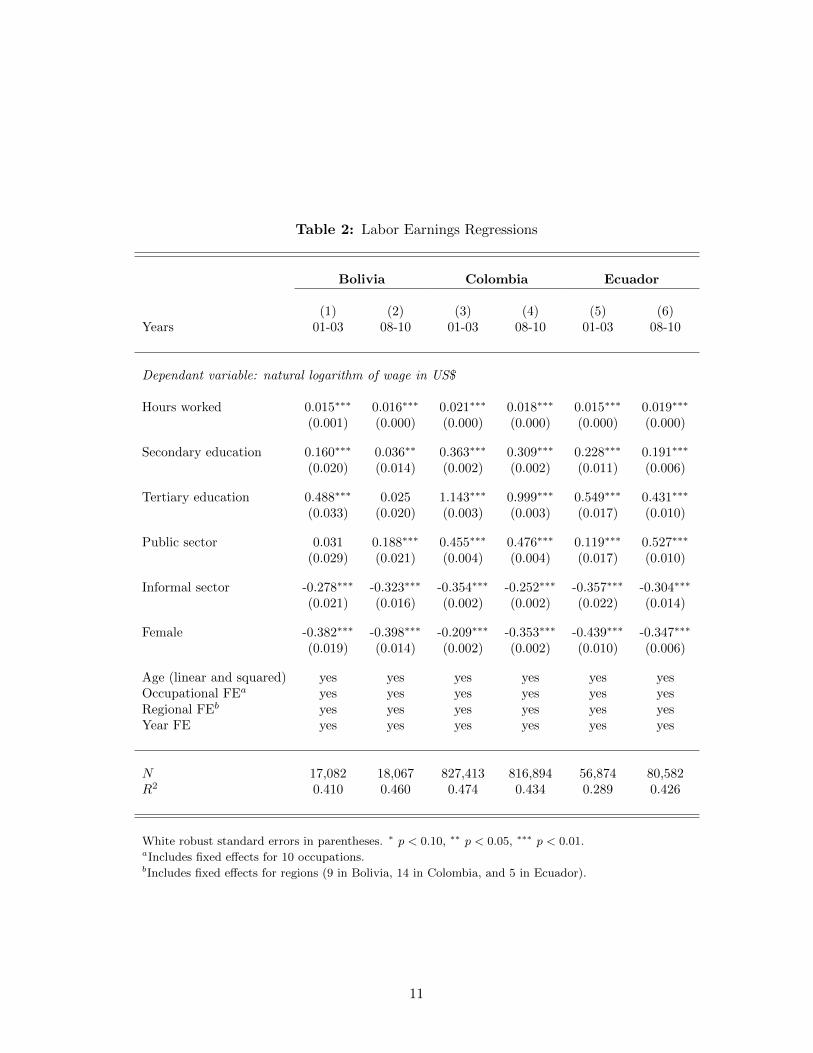
Table 2: Labor Earnings Regressions
Bolivia Colombia Ecuador
(1) (2) (3) (4) (5) (6)Years 01-03 08-10 01-03 08-10 01-03 08-10
Dependant variable: natural logarithm of wage in US$
Hours worked 0.015∗∗∗ 0.016∗∗∗ 0.021∗∗∗ 0.018∗∗∗ 0.015∗∗∗ 0.019∗∗∗
(0.001) (0.000) (0.000) (0.000) (0.000) (0.000)
Secondary education 0.160∗∗∗ 0.036∗∗ 0.363∗∗∗ 0.309∗∗∗ 0.228∗∗∗ 0.191∗∗∗
(0.020) (0.014) (0.002) (0.002) (0.011) (0.006)
Tertiary education 0.488∗∗∗ 0.025 1.143∗∗∗ 0.999∗∗∗ 0.549∗∗∗ 0.431∗∗∗
(0.033) (0.020) (0.003) (0.003) (0.017) (0.010)
Public sector 0.031 0.188∗∗∗ 0.455∗∗∗ 0.476∗∗∗ 0.119∗∗∗ 0.527∗∗∗
(0.029) (0.021) (0.004) (0.004) (0.017) (0.010)
Informal sector -0.278∗∗∗ -0.323∗∗∗ -0.354∗∗∗ -0.252∗∗∗ -0.357∗∗∗ -0.304∗∗∗
(0.021) (0.016) (0.002) (0.002) (0.022) (0.014)
Female -0.382∗∗∗ -0.398∗∗∗ -0.209∗∗∗ -0.353∗∗∗ -0.439∗∗∗ -0.347∗∗∗
(0.019) (0.014) (0.002) (0.002) (0.010) (0.006)
Age (linear and squared) yes yes yes yes yes yesOccupational FEa yes yes yes yes yes yesRegional FEb yes yes yes yes yes yesYear FE yes yes yes yes yes yes
N 17,082 18,067 827,413 816,894 56,874 80,582R2 0.410 0.460 0.474 0.434 0.289 0.426
White robust standard errors in parentheses. ∗ p < 0.10, ∗∗ p < 0.05, ∗∗∗ p < 0.01.aIncludes fixed effects for 10 occupations.bIncludes fixed effects for regions (9 in Bolivia, 14 in Colombia, and 5 in Ecuador).
11
returns for government employees are by far the largest in Colombia, where the premium over
private sector jobs reaches almost 50 percent. The increase of two percentage points from the
early 2000s until 2010 confirms earlier findings by Arango and Posada (2007). However, note
that only 7 percent of the Colombian sample are employed by the public sector, whereas the
share of government workers increases to 14 and 11 percent in Bolivia and Ecuador. Thus,
Colombia’s government employs less workers in relative terms, but pays them a higher salary,
compared to Bolivia and Ecuador.
Finally, we find substantial gender differences in earnings. Women earn up to 44 percent less
than men, even when controlling for hours worked, education, occupational choices, and age. It
is discouraging that the trend of punishing women in the labor market has actually intensified in
Bolivia and Colombia, when comparing the results from the earlier samples to the most recent
ones. Although it has been pointed out that women on average share different preferences and
ethical standards than men (Grove et al., 2011), it is difficult to imagine that unobserved pref-
erences and noncognitive skills can explain more than one third in wage differences. Thus, it is
likely that gender discrimination remains high in South American labor markets and, somewhat
concerning, has actually intensified in the recent past (Angel-Urdinola and Wodon, 2006; Atal
et al., 2009; Badel and Pena, 2009).
4.2 The Sources of Inequality
From conventional wage regressions, we now move to analyzing income inequality and specif-
ically deriving adjusted Gini indices, taking into account the inequality resulting from several
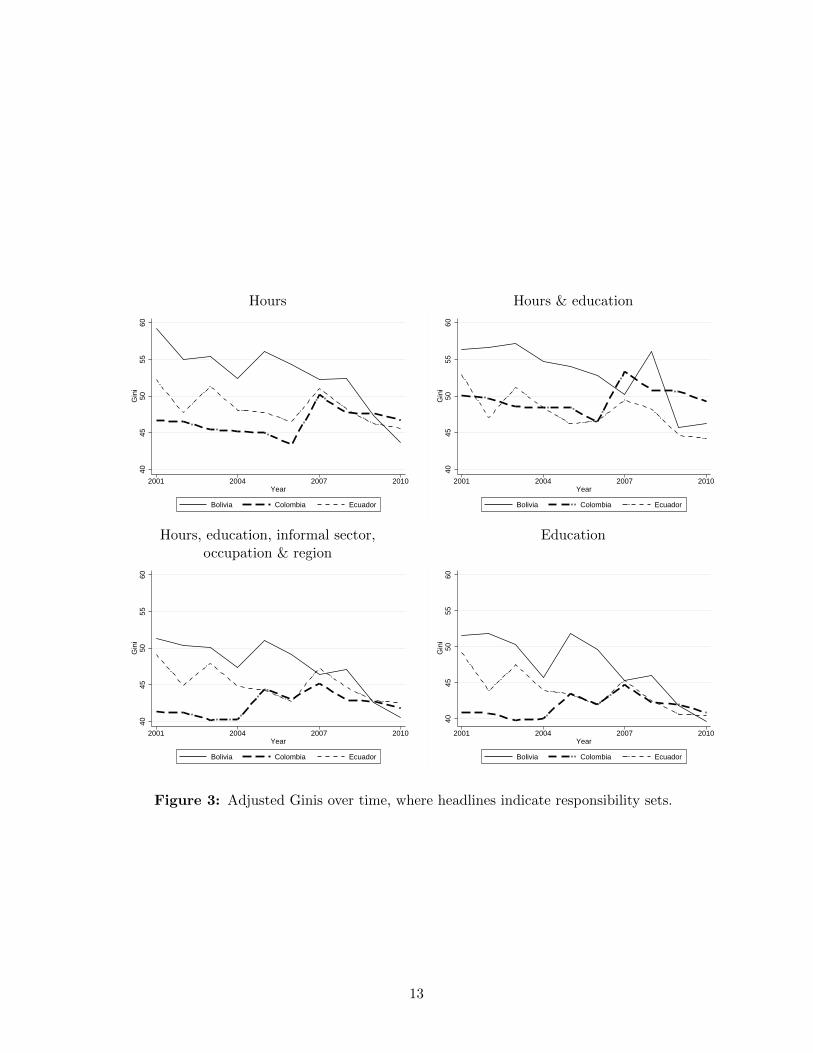
definitions of responsibility factors. Figure 3 visualizes our findings, whereas Table 3 displays
the entire sets of results. For ease of exposition, we discuss the results displayed in Figure 3, but
Table 3 should be consulted for further details. For each country and year, we derive an adjusted
Gini, following equation 2, considering six definitions of responsibility cutoffs, in addition to the
standard Gini.
The first graph in Figure 3 displays the development of income inequality over time once any
income differences related to hours worked are removed. The results are similar to the standard
Gini (Figure 2), as Colombia has gone from being the most equal country in the early 2000s
to the most unequal country in 2010. Remember that Colombian data for the years 2006 and
12
Hours Hours & education
4045
5055
60G
ini
2001 2004 2007 2010Year
Bolivia Colombia Ecuador
4045
5055
60G
ini
2001 2004 2007 2010Year
Bolivia Colombia Ecuador
Hours, education, informal sector, Educationoccupation & region
4045
5055
60G
ini
2001 2004 2007 2010Year
Bolivia Colombia Ecuador
4045
5055
60G
ini
2001 2004 2007 2010Year
Bolivia Colombia Ecuador
Figure 3: Adjusted Ginis over time, where headlines indicate responsibility sets.
13
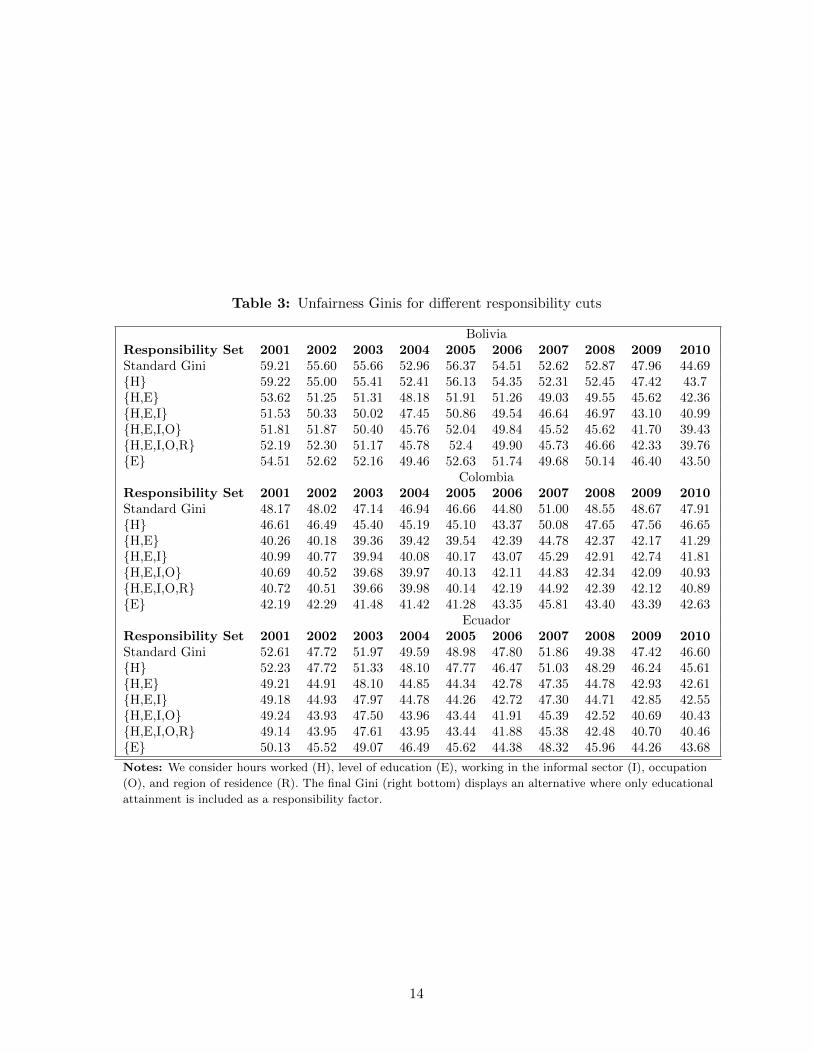
Table 3: Unfairness Ginis for different responsibility cuts
BoliviaResponsibility Set 2001 2002 2003 2004 2005 2006 2007 2008 2009 2010Standard Gini 59.21 55.60 55.66 52.96 56.37 54.51 52.62 52.87 47.96 44.69{H} 59.22 55.00 55.41 52.41 56.13 54.35 52.31 52.45 47.42 43.7{H,E} 53.62 51.25 51.31 48.18 51.91 51.26 49.03 49.55 45.62 42.36{H,E,I} 51.53 50.33 50.02 47.45 50.86 49.54 46.64 46.97 43.10 40.99{H,E,I,O} 51.81 51.87 50.40 45.76 52.04 49.84 45.52 45.62 41.70 39.43{H,E,I,O,R} 52.19 52.30 51.17 45.78 52.4 49.90 45.73 46.66 42.33 39.76{E} 54.51 52.62 52.16 49.46 52.63 51.74 49.68 50.14 46.40 43.50
ColombiaResponsibility Set 2001 2002 2003 2004 2005 2006 2007 2008 2009 2010Standard Gini 48.17 48.02 47.14 46.94 46.66 44.80 51.00 48.55 48.67 47.91{H} 46.61 46.49 45.40 45.19 45.10 43.37 50.08 47.65 47.56 46.65{H,E} 40.26 40.18 39.36 39.42 39.54 42.39 44.78 42.37 42.17 41.29{H,E,I} 40.99 40.77 39.94 40.08 40.17 43.07 45.29 42.91 42.74 41.81{H,E,I,O} 40.69 40.52 39.68 39.97 40.13 42.11 44.83 42.34 42.09 40.93{H,E,I,O,R} 40.72 40.51 39.66 39.98 40.14 42.19 44.92 42.39 42.12 40.89{E} 42.19 42.29 41.48 41.42 41.28 43.35 45.81 43.40 43.39 42.63
EcuadorResponsibility Set 2001 2002 2003 2004 2005 2006 2007 2008 2009 2010Standard Gini 52.61 47.72 51.97 49.59 48.98 47.80 51.86 49.38 47.42 46.60{H} 52.23 47.72 51.33 48.10 47.77 46.47 51.03 48.29 46.24 45.61{H,E} 49.21 44.91 48.10 44.85 44.34 42.78 47.35 44.78 42.93 42.61{H,E,I} 49.18 44.93 47.97 44.78 44.26 42.72 47.30 44.71 42.85 42.55{H,E,I,O} 49.24 43.93 47.50 43.96 43.44 41.91 45.39 42.52 40.69 40.43{H,E,I,O,R} 49.14 43.95 47.61 43.95 43.44 41.88 45.38 42.48 40.70 40.46{E} 50.13 45.52 49.07 46.49 45.62 44.38 48.32 45.96 44.26 43.68
Notes: We consider hours worked (H), level of education (E), working in the informal sector (I), occupation
(O), and region of residence (R). The final Gini (right bottom) displays an alternative where only educational
attainment is included as a responsibility factor.
14
2007 should be considered with caution, so it appears as if at least since 2008 Colombia exhibits
larger inequality than Bolivia and Ecuador.
As a next step, the top right graph incorporates educational attainment into the set of
responsibility factors. The result is now reversed: Colombia remains the most equal country
among our three sample economies. This means that schooling explains a much larger share
of income inequality in Colombia than in Bolivia and Ecuador. Remember that our wage
regressions, displayed in Table 2, have already indicated that educational aspects are rewarded
much stronger in the Colombian labor market.
Notice also that Bolivia has experienced a spike in this adjusted Gini from 2009 and 2010.
Although the magnitude seems small, this indicates that educational aspects are less able to
explain inequality developments. Nevertheless, it is important to highlight that the adjusted
Gini for hours and education in Colombia in 2010 still remains higher than that same adjusted
Gini in 2001. Thus, income inequality in Colombia based on non-responsibility factors has
increased also, not just the standard Gini.
The bottom left graph of Figure 3 then displays the results from deriving an adjusted Gini
that incorporates hours worked, educational level, occupational choice, and regions into the set
of responsibility variables. This adjusted Gini attributes virtually all aspects that can in any
way be influenced by an individual toward one’s own responsibility. Note that now Colombia
appears as the most unequal country again, as roles are reversed. In fact, especially the variable
describing public sector employment explains relatively more of income inequality in Bolivia and
Ecuador than in Colombia.
Finally, the bottom right graph of Figure 3 displays results from an exercise where we
only incorporate educational attainment into the set of responsibility factors. But, as before,
Colombia emerges as the most equal society in 2010 once we attribute educational standards
toward one’s own responsibility.
4.3 Relative Contribution of Hours Worked and Education
The results displayed in Figure 3 indicate that once educational aspects are acknowledged as part
of one’s responsibility Colombia displays less income inequality than Bolivia and Ecuador. But
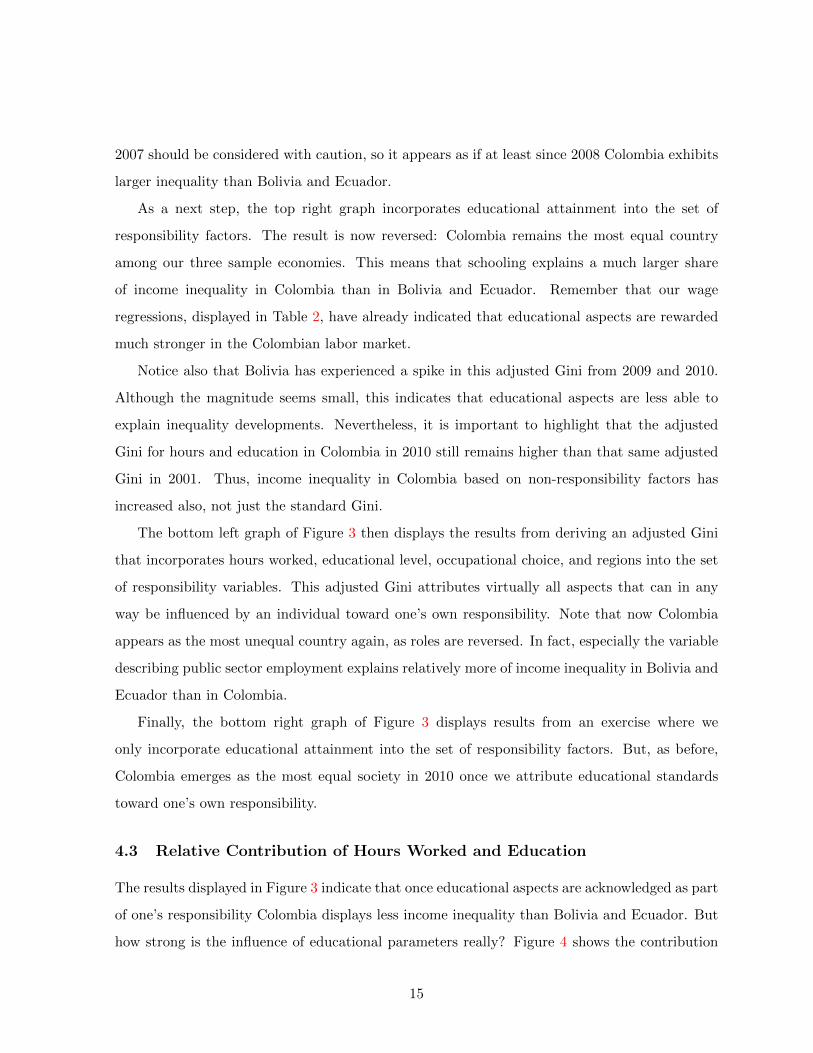
how strong is the influence of educational parameters really? Figure 4 shows the contribution
15
of hours worked and education in the standard Gini. These graphs visualize the strong role of
education in Colombia and Ecuador. For Colombia, education explains 5.2 index points of the
standard Gini or approximately 10.8 percent. For Ecuador, education can explain 6.2 percent
of the standard Gini. These contributions are far above the role of pure hours worked with 2.2
to 3.1 percent.
Contribution of hours Contribution of hoursin absolute terms in relative terms
02
46
Gin
i poi
nts
2001 2004 2007 2010Year
Bolivia Colombia Ecuador
04
812
Per
cent
age
Gin
i exp
lain
ed
2001 2004 2007 2010Year
Bolivia Colombia Ecuador
Contribution of education Contribution of educationin absolute terms in relative terms
02
46
Gin
i poi
nts
2001 2004 2007 2010Year
Bolivia Colombia Ecuador
04
812
Per
cent
age
Gin
i exp
lain
ed
2001 2004 2007 2010Year
Bolivia Colombia Ecuador
Figure 4: Portion of standard Gini explained by hours and education in absolute terms (left)and relative terms (right).
In contrast, wages in Bolivia behave differently. In 2010, hours worked there explain as
much of income inequality than educational achievement. In the context of the conventional
labor literature, this result comes as a surprise and appears disappointing, considering the
spillover effects education can produce (Barro, 2001; Eicher and Garcıa-Penalosa, 2001; Moretti,
16
2004; Tamura, 2006; Iranzo and Peri, 2009; Caselli and Ciccone, 2013). Finally, considering
further responsibility cuts, including aspects as informality, occupation, and region of residency
produces similar distributions in our three sample countries.
5 Conclusions
This paper decomposes the standard Gini index for three Latin American countries (Bolivia,
Colombia, and Ecuador) for annual data from 2001 to 2010. At first glance, Colombia appears
to be the most unequal country in terms of income in 2010. However, if people are held ac-
countable for their educational attainment Colombia exhibits less inequality than both Bolivia
and Ecuador. These results are surprising as both the Bolivian and the Ecuadorian government
have strongly focused on redistribution and income inequality.
There are several conclusions we can draw from these findings. First, education is highly
valued on the Colombian labor market, less so in Ecuador, and virtually not at all in Bolivia
today. This notion is confirmed by basic wage regressions and our results indicate that there
exists no wage premium for a Bolivian with tertiary education compared to somebody with
(some) primary schooling. This result is disappointing, given that strong positive externalities
from education have been found (Barro, 2001; Eicher and Garcıa-Penalosa, 2001; Moretti, 2004;
Tamura, 2006; Iranzo and Peri, 2009; Caselli and Ciccone, 2013). Another way of highlighting the
importance of education for a country’s development is to consider the standard growth model
introduced by Mankiw et al. (1992). Thus, although Bolivia and Ecuador show remarkable
progress in fighting general income inequality, the country may have paid the price with a
distorted incentive structure as neither effort levels (captured in hours worked) nor education
seems to be rewarded.
Second, contrary to popular opinion, inequality in Colombia in 2010 has been lower than
in Ecuador and Bolivia if educational attainment is considered as part of one’s responsibility.
This notion can of course be challenged as education is not as easily accessible in Colombia as,
say, the European Union, where school systems are largely free. Thus, one can certainly argue
whether educational attainment should be considered as entirely part of one’s own responsibility
in Colombia and we do not wish to enter such a discussion.
17
Third, and more generally, analyzing the immediate sources of income inequality is a task
that should receive more attention from researchers and policymakers interested in combatting
inequality. For example, policy recommendations would differ dramatically if income inequality
stems mostly from education, rather than other characteristics, such as occupational regional
differences.
18
References
Acemoglu, D., Johnson, S., and Robinson, J. A. (2005). Institutions as a fundamental cause of
long-run growth. Handbook of Economic Growth, 1:385–472.
Almas, I., Cappelen, A. W., Lind, J. T., Sørensen, E. Ø., and Tungodden, B. (2011). Measuring
unfair (in) equality. Journal of Public Economics, 95(7):488–499.
Almas, I., Havnes, T., and Mogstad, M. (2012). Adjusting for age effects in cross-sectional
distributions. STATA JOURNAL, 12(3):393–405.
Angel-Urdinola, D. F. and Wodon, Q. (2006). The gender wage gap and poverty in Colombia.
Labour, 20(4):721–739.
Arango, L. E. and Posada, C. E. (2007). Los salarios de los funcionarios publicos en Colombia
(1978-2005). Ensayos sobre Polıtica economica, 25(55):110–147.
Atal, J., Nopo, H., and Winder, N. (2009). New century, old disparities: gender and ethnic wage
gaps in Latin America. IDB Working Paper No. 25.
Badel, A. and Pena, X. (2009). Decomposing the gender wage gap with sample selection adjust-
ment: Evidence from Colombia. Mimeo, Universidad de las Andes.
Barro, R. J. (2001). Human capital and growth. American Economic Review, 91(2):12.
Bossert, W. and Fleurbaey, M. (1996). Redistribution and compensation. Social Choice and
Welfare, 13(3):343–355.
Bowles, S., Gintis, H., and Osborne, M. (2001). The determinants of earnings: A behavioral
approach. Journal of Economic Literature, 39(4):1137–1176.
Canavire-Bacarreza, G. and Rios-Avila, F. (2015). On the determinants of changes in wage
inequality in Bolivia. Levy Economics Institute of Bard College Working Paper, (835).
Cappelen, A. W. and Tungodden, B. (2006). Relocating the responsibility cut: Should more
responsibility imply less redistribution? Politics, Philosophy & Economics, 5(3):353–362.
19
Carpantier, J.-F. and Sapata, C. (2013). An ex-post view of inequality of opportunity in France
and its regions. Journal of Labor Research, 34(3):281–311.
Caselli, F. and Ciccone, A. (2013). The contribution of schooling in development accounting:
Results from a nonparametric upper bound. Journal of Development Economics, 104:199–211.
Departamento Nacional de Planeacion (2003). Plan nacional de desarrollo 2002-2006. Hacia un
Estado Comunitario, Departamento Nacional de Planeacion, Bogota.
Departamento Nacional de Planeacion (2007). Plan nacional de desarrollo 2006-2010. Estado
comunitario desarrollo para todos, Departamento Nacional de Planeacion, Bogota.
Devooght, K. (2008). To each the same and to each his own: A proposal to measure
responsibility-sensitive income inequality. Economica, 75(298):280–295.
Eicher, T. S. and Garcıa-Penalosa, C. (2001). Inequality and growth: the dual role of human
capital in development. Journal of Development Economics, 66(1):173–197.
Farne, S. (2010). Encuestas de hogares para dummies: Como interpretar la transicion de las
encuestas continuas a la gran encuesta integrada. Technical report, Universidad Externado
de Colombia.
Figueiredo, E. and Junior, J. L. d. S. N. (2014). More equal but not so fair: An analysis of
Brazilian income distribution from 1995 to 2009. Empirical Economics, 46(4):1325–1337.
Goldin, C. and Katz, L. F. (2008). Transitions: Career and family life cycles of the educational
elite. American Economic Review, 98(2):363–69.
Grove, W. A., Hussey, A., and Jetter, M. (2011). The gender pay gap beyond human capital:
Heterogeneity in noncognitive skills and in labor market tastes. Journal of Human Resources,
46(4):827–874.
Grugel, J. and Riggirozzi, P. (2012). Post-neoliberalism in Latin America: Rebuilding and
reclaiming the state after crisis. Development and Change, 43(1):1–21.
Gwynne, R. N. and Kay, C. (2000). Views from the periphery: Futures of neoliberalism in Latin
America. Third World Quarterly, 21(1):141–156.
20
International Labour Organization (2014). Global employment trends 2014: The risk of a jobless
recovery. Technical report, International Labour Office.
Iranzo, S. and Peri, G. (2009). Schooling externalities, technology, and productivity: Theory
and evidence from US states. Review of Economics and Statistics, 91(2):420–431.
Lustig, N., Lopez-Calva, L. F., and Ortiz-Juarez, E. (2013). Declining inequality in Latin
America in the 2000s: The cases of Argentina, Brazil, and Mexico. World Development,
44:129–141.
Mankiw, N. G., Romer, D., and Weil, D. N. (1992). A contribution to the empirics of economic
growth. Quarterly Journal of Economics, 107(2):407–437.
Moretti, E. (2004). Workers’ education, spillovers, and productivity: Evidence from plant-level
production functions. American Economic Review, 94(3):656–690.
Mosley, P. (2012). The politics of poverty reduction. Oxford University Press.
Tamura, R. (2006). Human capital and economic development. Journal of Development Eco-
nomics, 79(1):26–72.
The World Bank (2014). World development indicators. GINI index (World Bank estimate):
http: / / data .worldbank .org/ indicator/ SI .POV .GINI , March.
UNU-WIDER World Income Inequality Database (2008). World income inequality database.
GINI index (World Bank estimate): http: / / www .wider .unu .edu/ research/ Database/ ,
Version 2.0c, May.
Williamson, J. G. (2015). Latin American inequality: Colonial origins, commodity booms, or a
missed 20th century leveling? Technical report, NBER Working Paper # 20915.
21