Embed Size (px)
Citation preview
Chapter 11
Income Generation and Intra-Household Decision Making A Gender Analysis for Nigeria Diego Angel~Urdinola and Quentin Wodon
Introdudion
Household decision making and resource allocation are critical for economic and human development Many decisions made at the household level influshyence the welfare of the individuals living in the household as well as their comshymupities Decisions such as where to live how to generate income how much to invest and consume and how many children to have constitute common dilemmas faced by households The outcomes ofsuch decisions are often linked to economic performance at the household level as well as in the aggregate for the country as a whole In households with precarious opportunities (defined as living in a low-wealth environment with limited access to credit and limited labor opportunities) the intra-household dynamics of decision making and resource allocation may have an even greater impact on the welfare outcomes of family members
Within households many factors-age marital status culture income level and education-influence the dynamics ofintra-household decision making If various household members (including male as opposed to female members) have different preferences it is expected that households will behave differently according to who controls household resources For example it is often argued that when women have better command over income sources decisions on how these resources are spent tend to favor children more in terms of human capital investment (for example Hoddinott and Haddad 1995 Bourguignon and
The authors gratefully acknowledge comments from Jorge Arbache and Mayra Buvinic The views expressed in this chapter are those of the authors and need not reflect those of the World Bank its executive directors or the countries they represent
381
GOALM_381middot4061ndd 381 2906110 1154 AM I
382 GENDER DISPARITIES IN AFRICAS LABOR MARKET
Chiappori 1992 Browning and Chiappori 1998 Bussolo De Hoyos and Wodon 2009)
Lloyd and Blanc (1996 see also Blackden and Bhanu 1999) argue that children in female-headed households in Sub-Saharan Africa have better enrollment rates than those in male-headed households Higher involvement of women in decision making within the household has also been shown to lead to better outcomes in terms of nutrition (see Piesse and Simister 2002 among others) Cooperative bargaining theory suggests that expenditure decisions are proportional to resource contribution (for example Manser and Brown 1980 McElroy and Homey 1981) In this respect as a womans income increases as a share of total household income so does her bargainshying and decision-making power Hoddinott and Haddad (1995) suggest that a doubling of the share of cash income held by women within a household may increase the share of the budget allocated to food by the household by about 2 percent and may reduce much more significantly the shares allocated to cigarettes and alcohol (by 26 percent and 14 percent respectively)
In the Uganda gender assessment prepared by the World Bank (2005) the analysis suggested similar differences between male- and female-headed houseshyholds with a higher share of consumption spent on alcohol and cigarettes in male-headed households and a higher share spent on school fees in femaleshyheaded households especially in the case of divorced and widowed heads Evishydence of the effects of female labor income share on household consumption patterns was also found by Backiny-Yetna and Wodon (2010) for the Republic of Congo but the effects were not large and not always statistically significant
While there is substantial evidence worldwide about the impact of womens income on intra-household decision making including consumption allocashytions the evidence for Sub-Saharan Africa remains limited in part as a result of lack of comprehensive household surveys to conduct such analysis in many countries However good household surveys are becoming much more comshymon enabling research on gender-based decision making as illustrated for Senegal for example by Bussolo De Hoyos and Wodon (2009) and for the Republic of Congo by Backiny-Yetna and Wodon in Chapter 10 of this volume
Yet even without a comprehensive household survey with detailed consumpshytion and income data it is still often feasible to conduct useful empirical work on these issues The objective of this study is to document the extent to which income generation affects decision making within households in Nigeria using the 2003 Core Welfare Questionnaire Indicator (CWIQ) surveys implemented in eight Nigerian states While these surveys do not have income and consumpshytion data they do provide information on labor force participation and whether household members generate income for the household as well as data on who makes the decisions within the household for a wide range of expenditure catshyegories This type of data can be used to assess using simple statistical and
290610 1155AM I
INCOME GENERATION AND INTRA-HOUSEHOLD DECISION MAKING 383
econometric methods the impact of income generation by women on their decision power within the household
This chapter is structured as follows The next section provides basic descripshytive statistics on the differences in decision making within the household as well as on differences in access to resources between the household head and spouse Thereafter bivariate probit techniques are used to quantify the extent to which income contribution influences a spouses decision-making power on household expenditures in health education food and on the use of productive assets A brief conclusion follows
Data and Basic Statistics
Using data from the CWIQ surveys implemented in eight Nigerian states in 2003 this section provides basic statistics on the roles of men and women in household decision making The analysis relies on a one-page special module on gender that was added to the standard CWIQ questionnaire by the National Statistical Office Among other questions the gender module asks respondents to answer the following (1) whether each of the household members engage in a number of income-generating activities (fish smoking food processing soap making crop farming fishing and others) (2) whether household members do household chores (fetching water fetching wood cleaning toilets cookshying providing child care caring for the elderly and the sick and others) (3) whether household members take decisions in a range of areas (health edushycation food clothing use of farmland and sale of farm produce) and (4) whether household members spend most of their time on an economic activity unpaid household work child care recreational activities or other activities The survey also provides information on who contributes the most to houseshyhold income
This study focuses on an analysis of the correlates or determinants of who is the main contributor to household income and whether this affects the abilshyity of the household member to participate in decision making in a range of areas Before focusing on the interaction between income contributions and decision making a few basic statistics are useful to provide context The surshyvey provides basic statistics showing whether men and women live in poor or non-poor households For such statistics in the absence of consumption data in the survey poverty is defined using a household-level index of wealth obtained through standard factorial analysis conducted on the assets owned by the households with a poverty line defined in such a way as to roughly reproduce poverty measures similar to the official figures (according to which about two-thirds of the population lives in poverty) In conducting the factorial analysis the first factor (which is defined statistically as a weighted sum of the
I GDALM_381-406indd 383 2910611 0 11 55 AM I
384 GENDER DISPARITIES IN AFRICAS LABOR MARKET
various assets used to assess household wealth in order for that factor to explain as much as possible of the variance observed in asset ownership between houseshyholds) is used to represent the wealth index
The 2003 CWIQ data suggest that as is the case in many other African counshytries Nigeria is still a male-dominated society There are significant differences in roles played by men and women in Nigeria that influence their capacity to earn monetary income and thus their intra-household decision-making power (see table 111) While one ofevery two men in Nigeria spends most of his time in an income-generating activity a similar proportion of women spend their time in unpaid household work The differences in economic roles are most
Table 111 Basic Statistics on Employment and Education by Gender in Nigeria
Non-poor Non-poor Poor Poor Women Men women men women men
Employment and access to capital
Owns land 1302 4585 1119 3521 1502 5895
Employed (5-70 years old) 4738 5451 4579 5139 4907 5794
Main activity (6-70 years old)
Economic activity 2941 4751 3735 4975 2092 4503
Unpaid household work 4064 2561 3030 1902 5169 3291
Takes care of the children 600 081 468 078 740 085
Recreation 915 995 972 1010 853 978
Other activity 1481 1612 1795 2035 1145 1144
Education
literacy rate (all individuals) 3978 6241 5920 8124 1780 3930
School enrollment (6-15 years old) 6240 6481 8306 8594 4030 4319
Reasons to be not enrolled
Too old 167 203 166 243 169 175
Completed school 2806 3432 1737 3041 3953 3703
School is too far 243 319 212 000 277 540
School is too expensive 2682 2903 2624 3486 2745 2501
Work (job f home) 789 755 916 832 652 701
Useless 1018 1269 1064 855 969 1555
Illness or pregnancy 539 131 540 152 538 117
Failed exam 259 1113 340 642 173 1438
Got married 527 117 453 000 607 198
Awaits admission 1771 1334 2272 1781 1234 1024
Other reasons 753 521 1097 962 383 217
Source Authors estimate USing Nigerias CWIQ 2003
I GDALM_381-406indd 384 29f06l10 1155AM I
INCOME GENERATION AND INTRA-HOUSEHOLD DECISION MAKING 385
striking in poor households While only 30 percent of non-poor women engage in unpaid family work the proportion is 52 percent among poor women
The literature on Nigeria suggests that women do the most work in the subshysistence agricultural sector while men are given opportunities in the commershycial sector Households often encourage their male members to migrate in order to generate higher incomes through remittances and also in order to deal with a lack of sufficient farmland and capital in rural areas to make farming profitshyable (Chukwuezi 1999) In turn male out-migration from rural areas is leading to the feminization of agriculture By contrast in the commercial sector men are hired more easily than women including to do weeding and other tradishytional womans work The monetization of a sector often shifts hiring practices in favor of men with owners of commercial farms justifying the exclusion of women on the grounds that they are not able to work at the same pace as men which is however doubtful This may explain in part why when women are hired they are often paid lower wages
Despite doing a large share of the work in the agriculture sector rural women often lack control over key farm inputs and decisions A womans right to own land is dependent on her relationship with her husband or male relatives The risk of losing land rights has become a disincentive for women to invest in land For example land rehabilitation programs that require years to make land proshyductive are not attractive to women who may have the land taken away once it becomes fertile Women also lack control over the allocation of the labor of their children and at times even their own labor In studying tobacco production in the north Babalola and Dennis (1988) found that husbands controlled the allocation of their wives labor That is women were assigned tasks in producing a labor-intensive crop owned and controlled by their husbands
Improved farming methods while increasing productivity also increase the demand for womens labor For example applying fertilizer makes extra weedshying necessary and women do most of the weeding In contrast traditional male tasks such as land dearing and preparation are being mechanized Access to credit is much more widespread for men than for women who despite havshying better repayment rates have less access than men Even when women own resources they may not have the power to make their own decisions about using these resources and this may in turn result in the transfer of more womanshyspecific farm tasks (such as the processing and marketing of palm) to men
The 2003 CWIQ survey data confirm the existence of differences by genshyder in decision-making power these differences are especially pronounced in poor households The empowerment of women in decision making within the household seems limited in Nigeria especially regarding decisions for the use of capital goods in the household such as land use sale of agricultural produce and decisions related to shelter As shown in table 111 female land ownership is rare and the share of women who are the main contributors of income in a
GDALM_381-406indd 365 2906110 11 55 AM
386 GENDER DISPARITIES IN AFRICAS LABOR MARKET
household with both head and spouse is very low (at 4 and 3 percent respecshytively) for both poor and non-poor households What is striking is the fact that women in non-poor households have much more decision-making power than women in poor households for virtually all areas of spending For example 40 percent of women in non-poor households have a say in decisions made about education spending versus only 12 percent of women in poor houseshyholds having this say The same is true for decisions on land use and crop sales with poor women again at a disadvantage
The CWIQ data also show that literacy rates are significantly higher for men (62 percent for men versus 40 percent for women) and boys benefit from higher school enrollment rates than girls Although net primary school enrollment is high and roughly similar for boys and girls in Nigeria boys are more likely than girls to be enrolled by approximately 3 percentage points and differences are larger at higher levels Family responsibilities affect girls more than boys even at a young age and tend to magnify differences in schooling In particular while about 11 percent of girls are not enrolled in school because of marriage or pregnancy this proportion is lower than 3 percent for boys
Dealing with gender differentials in Nigeria is a complex matter For examshyple gender roles are likely to affect human development at the societys level beyond the direct impact of decision making within households One illustrashytion is the apparent relationship between the sex of teachers and the school enrollment rates of girls as teachers compared to boys which is documented in a risk and vulnerability assessment prepared by the World Bank (2004) According to that report about half the teachers in primary school are female In secondary school in contrast the proportion of female teachers is lower But in both primary and secondary schools there is a clear positive relationship between the share of female teachers in a state and the share of female students This relationship does not imply causality since apart from the female share of teachers other factors may explain the fact that some states have a higher ratio of female-to-male enrollment than others Still the relationship suggests that gender patterns in Nigeria are correlated and multi-faceted as well as deepshyrooted in the functioning of society Therefore it is important to aim to develop integrated strategies to deal with such inequalities
Monetary Contributions and Decision Power In this section the analysis focuses on the relationship between monetary contributions to household income and decision-making power on expendishyture patterns To do this we restrict the sample only to male heads and female spouses who belong to a household where there is both head and spouse excluding households where there is no spouse as well as female-headed houseshyholds The reason for this selection is that in order to compare decision power
GDALM_381-406indd 386 290611 0 11 55 AM I
INCOME GENERATION AND INTRA-HOUSEHOLD DECISION MAKING 387
between men and women it is necessary to have both men and women in the household-which in practice means that both a household head and a houseshyhold spouse need to show up in the data When there is no spouse decisions are made only by the lone parent and when there is a female head in the African context this essentially means that the father or male household head has died or has migrated Note that this exclusion does not lead to bias It is simply thatmiddot the analysis is carried over a subset of the population but this subset is very large because most households have both a spouse and a head For language simplicity men will refer to male household heads and women will refer to the spouses of household heads
As a consequence of various inequalities between men and women houseshyhold decision-making power in Nigeria remains concentrated among men especially in poor households Most decisions on the use of productive assets (land use crop sales and shelter) are taken by men (see table 112) Although women participate more in decision making on food expenditures heath and education men are still the main decision makers in these areas as well Nonshypoor women participate more actively in the household decision-making process than poor women especially in aspects involving health and education Not surprisingly non-poor women are also more likely to contribute through income to household expenses (for shelter education food health and clothshying among other things) than are poor women The rate of contribution for non-poor women is 37 percent versus 27 percent for poor women
Decision patterns among men are roughly similar to those of women whether or not the household is poor although non-poor men are less likely than poor men to be involved in decisions involving education and crop sales
Table 112 Contribution to Household Expenses and Decision Making by Gender and Poverty Status in Nigeria
Women Men
Non-poor Poor Non-poor Poor
004 003 093 093
DAD 012 079 0042
054 033 094 090
071 053 092 093
057 034 090 087
022 009 088 085
024 014 072 085
031 017 058 073
Main contributor of household income
Decides for expenditures on education
Decides for expenditures on health
Decides for expenditures on food
Decides for expenditures on clothing
Decides for expenditures on shelter
Decides for expenditures on land use
Decides for expenditures on crop sales
Source Authors using Nigerias CWIQ 2003 Note Sample = Heads and SpOUSeS belonging to non-single households
GDALM_381-406indd 387 2906110 1155 AM I
388 GENDER DISPARITIES IN AFRICAS LABOR MARKET
Note that in some cases the sum of the shares of the decisions made by men and women (that is under our terminology by household heads and spouses) is below 100 percent This is because other members of the households may make the decisions in some cases For simplicity our analysis here is bivariate comparing household heads and spouses (who tend to make most decisions) but further analysis could be made regarding areas where other household members playa role
Figures 111 through ll8 illustrate how decision making evolves for men and women as they age The graphs show the proportion of men and women involved in various decisions by age There is a difference between decisions related to education and other decisions In the case of education as shown in figure 111 as both men and women get older they are more likely to make decisions regarding education the likelihood increases up to about age 60 and decreases thereafter (probably because younger individuals inherit the authority of the elder as they become the main providers of household income) Although the concave pattern of the decision curve for education is similar for men and women the share of men who are decision makers is always larger than the equivalent share of women (the difference between both groups increases up to age 60 and then stabilizes) The probable reason for mens decision-making power on education increasing with age and why at a younger age neither men nor women make education decisions may simply be because younger couples either dont have children yet or their children are not yet school age so there are no education decisions to make
The pattern for other goods looks more similar between different goods As shown in figures 112 through 115 comparatively few women from early ages are likely to participate in decision making on spending for health food clothing and shelter In contrast mens decision curves for these items are higher flatter and decrease only slightly with age Women are likely to get more involved in decision making for these expenditure categories as they grow older although they often reach a plateau relatively quickly As for decisions regarding the use of the households productive capital (land use and sales of productive farm output) womens involvement remains low throughout their life cycle with only a slight increase with age (see figures 116 and 117)
To summarize this studys findings suggest that women gain in terms of empowerment with age for all types of intra-household decision making that pertains to non-productive household expenditures This may in part be a result of gains by women in terms of income generating activities as they age Indeed the share of women who are the main source of income in their households increases from less than 1 percent among women of age 17 to between 5 percent and 10 percent for women above 30 years of age (see figure 118) The share
2906110 1155 AM I
bull
bull bullbull bull bull bull
bull bull bull
bull bull
bull bull bull bull
bull
bull
bull bullbullbull bull bull bull bullbull bull bull
bull bull bull bull
bull bull bull bull
INCOME GENERATION AND INTRA-HOUSEHOLD DECISION MAKING 389
Figure 111 Decision Making on Education by Age and Gender in Nigeria ()
100
090 3
Qm C III m080
070
060 ~ ~ 050 3 11 bull_---T~__
040
030 bull
bullbullbull bullbullbull bull 020 bull 010
000 TTTT---------rTTTTTrrTTTTr-rTTTTT1TT--rTTTT-r+rshy
17 20 23 26 29 32 35 38 41 44 47 50 53 56 59 62 65 68 71 74 age
1- female spouses - - - male heads I Source Authors estimate using Nigeria 2003 CWIQ surveys
Figure 112 Decision Making on Health by Age and Gender in Nigeria ()
bull 080 bullbull 070
~ 060 ~ VI 050
bull 040 bull 030
020 bull
010
000 +-r--rrr--TTTTrT1----rTTTT1TrTTTTTr-TT---- 17 20 23 26 29 32 35 38 41 44 47 50 53 56 59 62 65 68 71 74
age
1-- female spouses - - - male heads I Source Authors estimate using Nigeria 2003 CWIQ surveys
GDALM_381-406indd 389 29106110 11 55 AM I
bull bull bull bull bull bull
bull bull bull
bull bull bullbull bull bull bull bull bull bullbull bull bull bullbull bull
bull
390 GENDER DISPARITIES IN AFRICAS LABOR MARKET
070
060 J1 050 II
040
Figure 113 Decision Making on Food by Age and Gender in Nigeria ()
100 aaa abullbull --JL-IItr_cIlJI 11_- liIa lL a III II II
cam m -- -r - 0 - -r ___IL II ftO 90 bull iii a a IIIW 11------- - __
bullbull bull a bullbull 080 bullbull
bull bull
bull
030
020
010
000 +-rITIITTn-TTTTTTT1IT1-TTTTT1r-r-TITlnITlTTT 17 20 23 26 29 32 35 38 41 44 47 50 53 56 59 62 65 68 71 74
age
- female spouses
Source Authors estimate using Nigeria 2003 CWlQ surveys
Figure 114 Decision Making on Clothing by Age and Gender in Nigeria ()
100
090
080
070
060
J1 050 II
040
030
020
010
ClI C a 13 a ell DcaIII III 13 a cO
_-Jl --------- -PaIIL--- 1OL1III--CI_ __ II II iii II II a II tr II - - - i - - - - - _
c bull II II 11 II
III --~bull--~bull~~--~~----~--~~ bull
bull
000 +-rr-r-Tr-r-rTTTTIrTTMMM---TTT 17 20 23 26 29 32 35 38 41 44 47 50 53 56 59 62 65 68 71 74
age
1- female spouses - _ male heads 1 Source Authors estimate using Nigeria 2003 CWIQ surveys
GDALM_381-406indd 390 29106110 11 55 AM Iltit
bull
bull
bull bullbull
bull bullbull bull bull bull
bull bull bull bull
bullbull bull bull bull bull bull bull bull bull bull bullbull bull bull bullbull bull bull bull bull bull bull bullbull bull bull bull bull
INCOME GENERATION AND INTRA-HOUSEHOLD DECISION MAKING 391
Figure 115 Decision Making on Shelter by Age and Gender in Nigeria ()
100 poundI
090 poundI
080 m
poundI m D m 11070 II CJ poundI II a iii II 11____B ___ _____ D m DDar-_IIa ______
CI II II pound111 a III 11m 13 -------- _____~a 060 cDc a Jm 0
IIl] 050 III bullbull bull II
040
030 bullbull 020
010
000 +--rr-rr---TT-r-r-r-rrr-rshy17 20 23 26 29 32 35 38 41 44 47 50 53 56 59 62 65 68 71 74
age
1- female spouses - _ male heads I Source Authors estimate using Nigeria 2003 CWlQ surveys
Figure 116 Decision Making on Sale of Farm Crop by Age and Gender in Nigeria ()
100
090
080
070
060 ltII shyltII 050s III
040
030
020
010
nil
- __LD II III II II II m aa a II
II --~--~~-r~~-~~a~_~~~-~~-~---a~--~ CI a II a a m c D D a
II
bull bull
bull bull 000 +r---rr---rrTTTI-rT--rT-rlTT--r---r--rrTT--r--
17 20 23 26 29 32 35 38 41 44 47 50 53 56 59 62 65 68 71 74 age
1- female spouses - - - male heads I Source Authors estimate using Nigeria 2003 CWlQ surveys
GDALM_381-406indd 391 2906110 1155 AM I
bullbull bull bull bullbull bull bull
bull bullbullbull bull bull bull bullbull bull bull bull bull
bull bull
bull bull bull bull bull bull
392 GENDER DISPARITIES IN AFRICAS lABOR MARKET
Figure 117 Decision Making on Land Use by Age and Gender in Nigeria ()
100
090
080
070
060 bull CII III
bull III 050
pound VI
040
030
020
010
000 +rrrrTTTT1r-rTTTTT1r-r-TTTTTlrrTTTTTlrrTTT
17 20 23 26 29 32 35 38 41 44 47 50 53 56 59 62 65 68 71 74 age
1- female spouses - _ male heads 1 Source Authors estimate using Nigeria 2003 CWlQ surveys
Figure 118 Main Contributor of Income in the Household by Age and Gender in Nigeria ()
100
095
090
VI 085 -s III CII
- 080 III
pound VI 075
070
065
am 11111 025
020
015
010
bull
bull bullbullbull bullbull 005
000 +-+--------r----------------+-+--4t+-+ 000 o 10 20 30 40 50 60
CII
= 0 Q
CIIu pound
age
Source Authors estimate using Nigeria 2003 CWIQ surveys
GDALM_381-406indd 392 2906110 1155 AM I
INCOME GENERATION AND INTRA-HOUSEHOLD DECISION MAKING 393
of men as the main provider of household income on the contrary decreases significantly after they have reached age 65 The econometric analysis in the next section provides a better assessment of the correlates of decision making and income generation
Econometric Analysis
In this section a simple empirical model is developed to quantify how much income contribution by women affects their participation in household decishysion making The analysis assumes that decision making and income conshytribution are jointly distributed outcomes which means that both outcomes are decided jointly by household members rather than sequentially That is the decision to contribute may be influenced by the decision-making power acquired in doing so and similarly the decision-making power depends on the ability to contribute (both outcomes depend on each other) We estimate for men and women separately the likelihood of decision making conditional on their contribution to the household expenditures controlling for other observable individual and household characteristics that also may influence decision making and the probability that individuals contribute income to the household
The determinants of income contribution and decision making are analyzed using a bivariate probit model The need to rely on pro bits comes from the fact that dichotomic variables are observed as outcomes (that is we observe only whether the household head or spouse contributes or not and decides or not) Rather than estimating two probit regressions we estimate the correlates of both outcomes together because this enables us to assess the impact of one outcome on the other In addition bivariate probits generate efficiency gains in the estimation precisely because they take into account the correlation between the error terms of the two regressions for contribution and decision making respectively The estimation procedure enables us to compute the probability of participating in the household decision making conditional on whether the individual contributes to household income or not
Denoting by D and C the latent and unobserved continuous decision and contribution variables by D and C their categorical observed counterparts and by X the vector of independent exogenous variables the bivariate probit model is expressed as
D =f3X +eD D = 1 if D+ gt 0 D = 0 otherwise
CO =f3~ X +ec C =1 if CO gt 0 C =0otherwise (1Ll)
E[eDJ=E[ecl=O Var[eD ] = Var[ec1 =1 COV[eDe] = P
I GDALM_381-406ndd 393 2906110 1155 AM I
394 GENDER DISPARITIES IN AFRICAS LABOR MARKET
The impact of contributing income on the probability of making a decision on a particular issue is computed as the difference in the two conditional probshyabilities of making a decision
amp=P(D=lIC 1X)-P(D=1IC OX) (112)
The set of exogenous variables X are age of the individual household size religion of the household (proxied by the type of household marriage that is whether Customary Islamic Christian or another type of marriage) education of the individual (no education at all incompletecomplete primary incom~ pletecomplete secondary or tertiary education) a number of employmentshyrelated variables for the individual (employment status whether employed unemployed or out of the labor force type of employment whether wage earner self-employed unpaid family worker or firm owner sector of employshyment whether agriculture manufacturing-construction-transport wholesaleshyretail public administration or services) and several other variables such as whether the household owns a house has access to electricity water and sanitashytion whether the household head is a temporary migrant and regional dumshymies to control for geographic effects
The detailed results from the estimations are provided in the annex We focus here on the estimates of the impact of income contributions to decision making using the method outline in equation 112 The results are provided in table 113 When they are the main contributor of income women win substantial decision-making power and thus playa more active role of leadshyership in the household The differences in decision power brought about by contributing income are largest for food shelter and health where income contributions increase the probability of decision making by approximately 20 percentage points
For example in the case of expenditures for health the predicted probabilshyity that women participate in the decision making is 43 percent when they do not contribute income and this increases to 64 percent when they contribute income For men the corresponding reduction in the probability of making decisions for expenditures on health decreases by 18 percent when they do not contribute to the households income However even when they contribute to cover most ofa households income the probability that women will make decishysions regarding the use of productive assets such as land and the commercial use of agricultural output remains low To some extent this same result is also observed with education
An additional finding is that income contribution increases the level of decision making among poor women more than among non-poor women for health food and clothing These results are provided in table 114 Yet for
GDALM_381-406indd 394 2906110 1155 AM I
INCOME GENERATION AND INTRA-HOUSEHOLD DECISION MAKING 395
Table 113 Impact of Income Contribution on Decision Making by Gender in Nigeria
Men Women
Standard Standard Probability deviation Probability deviation
Education
Decides if contributes 053 030 039 029
Decides if does not contribute 036 029 023 025
Difference -017 008 -016 009
Health
Decides if contributes 094 007 064 020
Decides if does not contribute 076 015 043 024
Difference -018 009 --021 008
Food
Decides if contributes 094 006 083 014
Decides if does not contribute 082 012 060 025
Difference --012 007 -022 013
Clothing
Decides if contributes 089 007 058 024
Decides if does not contribute 069 012 043 027
Difference --020 006 -015 005
Shelter
Decides if contributes 088 008 034 020
Decides if does not contribute 077 012 016 015
Difference --0 004 -019 008
Land use
Decides if contributes 077 023 027 025
Decides if does not contribute 066 026 016 020
Difference --011 005 -01 007
Sell agricultural output
Decides if contributes 065 025 026 030
Decides if does not contribute 051 025 021 027
Difference --015 004 -005 004
Source Authors estimates using NigeriaS CWlQ 2003 Notes Estimates based on sample of 10702 men (household heads) and 13260 women (spouses) differences in size of both samples are due to missing variables
decisions involving household productive assets such as land use crop sales and shelter contributing income increases the level of decision making among non-poor women more than among poor women
GDALM_381-406indd 395 2910610 11 55 AM I
396 GENDER DISPARITIES IN AFRICAS LABOR MARKET
Table 114 Impact of Income Contribution on Decision Making by Gender and Poverty Status in Nigeria
Men Women
Non-Poor Poor Non-poor Poor
Standard Standard Standard Standard Probability deviation Probability deviation Probability deviation Probability deviation
Education
Decides if contributes 072 024 037 025 059 026 023 020
Decides if does not contribute 054 028 020 021 038 026 010 015
Difference -018 OOS -l17 008 -l21 OOS -013 008
Health
Decides if contributes 096 005 092 OOS 075 018 055 018
Decides if does not contribute 0S1 013 073 016 055 024 033 019
Difference -l15 OOS -020 009 -l20 008 -023 00]
Food Decides if contributes 093 006 095 006 0S9 012 077 014
Decides if does not contribute OSO 011 0S4 011 072 024 051 022
Difference -l13 007 -l11 006 -l17 013 -l26 012
Clothing Decides if contributes 091 006 087 007 072 021 047 019
Decides if does not contribute 073 011 066 011 058 025 031 021
Difference -llS 006 -021 005 -l14 006 -l16 005
Shelter Decides if contributes 089 007 087 OOS 045 020 025 014
Decides if does not contribute 078 011 075 012 023 017 009 009
Difference -011 004 -l12 004 -l21 0D7 -l16 007
Land use Decides if contributes 066 027 086 014 034 024 021 024
Decides if does not contribute 054 029 077 017 021 020 013 019
Difference -012 005 -l09 004 -ln 006 -lO9 006
Sell agricultural output Decides if contributes 054 027 076 018 035 029 019 028
Decides if does not contribute 039 026 061 019 02S 027 015 025
Difference -l15 005 -l15 004 -l07 004 -l04 004
Source Authors estimates using Nigerias CWIQ 2003 Notes Estimates based on sample of 10702tnen (household heads) and 13260 women (spouses) differences in size of both samples are due to missing variables
GDALM_381-406indd 396 29106110 1155AM I
INCOME GENERATION AND INTRA-HOUSEHOLD DECISION MAKING 397
Conclusions
In Nigeria as in other Sub-Saharan countries most of household decisions are made by men who are the de facto household heads Statistical analysis of CWIQ survey data suggests that men tend to have most of the decision-making power regarding the use of productive assets such as land use crop sales and shelter Women participate more often in decisions on expenditures for food heath and education but even in these areas men more often than not remain the main decision makers The decision-making power of women is especially low among poor households in part because in such households the likelishyhood that women will be the main contributor of household income is much lower as well
Simple econometric modeling suggests that as expected when they are the main contributor of income women win substantial decision-making power The differences in decision power brought about by contributing income are as large as 20 percentage points for food shelter and health spending Howshyever the impact is much smaller in relation to the use of productive assets Finally contribution income raises decision making more among poor than non-poor women
Care must be taken not to draw strong policy recommendations from the limited and descriptive analysis in this chapter Yet some broad comments or suggestions can be made This study found that increasing the contribution ability ofwomen to household income leads to higher decision-making power for them within the household This has also been shown by several other authors to lead to higher investments in the human capital of children thereby leading to poverty reduction and higher income growth in the future This result can be used to advocate for policies to increase womens ability to conshytribute to household expenditures including policies raising the human capital of women for example through training and education programs specifically targeting women Facilitating access to land (for example through heritage law reforms or titling mechanisms) or access to credit (for example through microshycredit interventions targeted to women) are all interventions that have proven successful in other countries to promote female entrepreneurship and thereby to increase womens income and bargaining power However a detailed analysis for Nigeria should be conducted before making any specific policy recommenshydation in favor of one type of intervention or another to improve the position of women in the household
GDALM_381-406indd 397 29106110 11 55 AM I
(it
Ggt 0 raquo E I
~ ~ S w Annex Detailed Regression ResultsQ ltDQ
00 Cogt to Table 11A1 Bivariate Probit Regressions for Women in Nigeria
Decide Contrib Decide Contrib Decide Contrib Decide Contrib Decide Contrib Decide Contrib education income health income food income doth income land income crop sales income
Number of infants 0212 -0033 0054 -0033 0042 -ltgt029 0050 -0043 0042 -ltgt038 0087 -ltgt043 under-5 [482] [O42J [159] [043) [US] [036] [140J [054) [098] [048] [193] [055)
Square of number of -ltgt044 -ltgt014 -0013 -ltgt011 -ltgt008 -ltgt013 -ltgt014 -0010 -ltgt004 -ltgt010 -ltgt019 -0009 infants [384) [058) [169] [051] [124) [055) [165] [044] [039) [044) [162] [040]
Number of children 0295 0010 -ltgt012 0029 -0003 0025 0005 0026 0033 0030 -0019 0027 (age 5-14) [793] [018) [058J [048) [015] [0421 [024] ]043] ]112J [049] [064]
of number -ltgt039 -ltgt007 0003 -ltgt011 0002 -ltgt010 0001 -0011 -0001 -ltgt011 0006 -ltgt011 children [5341- [055J [097J [081J [056) [077] [O32J [O80J [0221 [085J [1331 [084]
Number of adults 0189 -0015 -0085 0005 -ltgt101 0010 -0056 -ltgt001 0049 0007 0009 0012(it [544] [O20J [353] [007J [393] [O14J [196) [002) [126J [O10J [024] [015J (it Square of number -0013 -0005 0006 -0007 0006 -ltgt007 0003 -0006 -0005 -ltgt007 -0001 -0007 of adults [396J [057J [303J [081J [284] [085J [109J [075J [136J [081) [039] [087]
Number of elderly 0096 -ltgt023 0055 0003 0145 -ltgt013 -0088 -0028 -0044 -ltgt016 -0012 -ltgt022 (age 65+) [098] [O13J [066] [002] [168) [008] [104] [016] [O42J [009] [010] [O13J
Square of number -0007 -0059 -ltgt058 -0061 -ltgt082 -0058 -0009 -0052 0022 -0053 -0008 -0053 of elderly [016J [074J [159J [080J [220J [O77J [O25J [069J [049J [O72J [0181 [071]
Female-headed -6325 2096 0684 2089 6045 2120 1592 2133 0094 2132 0259 2089 household [1905] [259] [098] 1248J [3109] [263] [272] [265J [015] [257] [043J [253]
Age of household head 0001 0025 -0011 0D25 0005 0023 -0004 0023 -ltgt010 0022 -0038 0025 [010] [123] [099J [120] [045] [115] [033] [112] [070] [110] ]275]
0000 0000 0000 0000 0000 0000 0000 0000 0000 0000 0000 0000 [105J [102J ]103] [088J [094] [046J [095J [102J [088J [278] [104J
Age of spouse 0042 -ltgt003 0028 -0001 0024 0000 0015 -ltgt001 0013 -0001 0032 -0004 [278J [012J [226] [007] [198) [001) [119J [003] [081] [007) [214] [019) ~
~
ij
raquos
(it
0
Gl 0 raquoshy I
Square of age of spouse 0000 0000 0000 0000 0000 0000 0000 0000 0000 0000 0000 0000~ [223] [069] [173] [063] [139] [057] [098J [061J [102] [063] [175] [078J5 CI CI
Head has customary 0073 0177 0166 0187 0228 0155 0110 0185 0018 0188 0088 0189 marriage [088J [129J [196[ [137] [233] [117] [121] [137] [018] [138J [098]
Head has Islamic 0141 0192 0068 0194 0155 0143 0051 0175 -0275 0197 -0208 0202 [129] [102] [068] [103] [141] [079] [049] [094] [231] [106] [176J [108]
Head has Christian 0335 0259 0405 0280 0663 0246 0386 0266 0172 0281 0240 0270 ]340] [168J [410] [181] [554] [163] [378] [174J [162] [183J [235] [1761
Head incomplete 0113 0008 -0086 0006 -0120 0003 -0059 0011 -0005 -0004 -0035 0006 primary education [120] 1005] [103] [005] [US) [002] [070] 1008J 1006] [003J [038] [0051
Head completed 0043 -0256 -0046 -0239 -0003 -0247 0059 -0246 -0081 -0251 0049 -0245 primary education 1064] 1226J [081] [215]-- 1006] 1219]-- [LOS] 1217] [118] [221] [066] [215]
Head incomplete -0050 -0155 -0139 -0129 0207 -0107 0002 -0096 -0232 -0113 -0181 -0118 secondary education 1038] 1087] 1098] 1071] [147] 1057] 1001J 1053] [146] [063] [129] [065]
Head completed 0157 -0320 0055 -0291 -0086 -0267 0029 -0295 -0128 -0290 0043 -0295 secondary education [154] [194] [063] 1176]- [092] [160] [034] [I 77] 1131] 1175] 1036] 11 77]
Head tertiary education 0080 -0171 0013 -0147 0036 -0132 0088 -0142 -0163 -0135 0126 -0139 1079] 1102] [014] [089] [037] [079] [099] [084] 1158] [081] [120] [084]
Spouse incomplete 0108 0336 -0001 0329 0178 0324 0041 0321 0076 0347 -0048 0335 primary education [123] [253] [002] [249] [181] [244] [048] 1242] [081] [261] [050] [253]
Spouse completed 0089 0211 0041 0180 0004 0193 -0055 0175 0172 0210 0086 0201 primary education [120] [181] [063] [156] [006] [164] 1090] [150] [224] [179] [106] [172]
Spouse incomplete 0201 -0108 0007 -0135 0045 -0147 -0021 -0164 0252 -0128 0073 -0143 secondary educ [169] [047] [006] [056] [033] [061] [016] [068] [203] [055] [059] [060]
Spouse completed 0067 0182 -0174 0152 0014 0144 0073 0154 -0070 0154 -0122 0162 secondary educ [064] [108] [182] [089] [013] [083] [076] [088] [065] [088] [103) [093)
0168 0073 -0149 0053 0075 0051 -0007 0051 0029 0079 -0222 0081 [099] [024] [046] [023] [005] [023] 1019] [036] [146] [037]
w 10 Head unemployed 0041 2147 -0208 2105 -0016 2194 -0340 2198 -0067 2193 -0245 2193 10 [019] 1475] [098] 1466] [007] [486] [183] 14811 [0291 [483] [093] [486]
I)
~ continued ~ 0
u raquo
(f)
Gl 0 raquo rshy I
t 00 $ f Q Head in servicel -J043 -J385 -0093 -0370 -0085 -J391 0027 -0403 -J015 -0385 -J228 -0384Q
educationladmlother [051] 1195] [128] [194] [122] [198]-- [036J [2011 1017] [199J [248]-- 1199J51
Spouse in manufconstrl 0185 0438 0075 0408 -0114 0397 0183 0409 -0571 0435 -0739 0424 transport [118] [226J [073] [205]-- [113J [206J [1781- [209J-- [258] [228) 1315] [219J
Spouse in wholesalel 0002 0121 -J069 0124 -J205 0114 0027 0125 -0543 0133 -0525 0127 retail [003] [134] [123J [137] [357] 1126] [049] [138] [891] [147] [848J [140J
Spouse in serviceleducl 0059 0324 0433 0317 -0028 0311 -0037 0304 -0645 0287 -0676 0292 admlother [070] [225]-- [664] [221] [045] [214J [059] [210] [637] [200] [778] [202]
Individual owns house 0365 0395 0319 0375 0851 0389 0462 0367 1204 Q401 1078 0396 [454] [357] [484] [336] [1035] [350] [688] [335] (1651] [364]middot [1295] [364]
Head temporary migrant 0226 1203 0220 1167 -J151 1163 -J120 1175 -J451 1194 -J328 1202 [080] [533] [119] [517] [086J [512] [070J [520] [187] [528]middot [149] [539]
Household has access to 0046 0120 0067 0121 0004 0123 0068 0121 -J014 0121 0032 0122 electricity [205]middotmiddot [324] [319]-- [330]--- [016] [330]--- [333]--- [326] (052] [333]--middot [131] [330]
(f) (f)Household has access to 0077 -0174 -J129 -0166 -0121 -0179 -0011 -0167 -J078 -0164 0017 -0164 piped water [103] [124] [186]- [119] [173] [127] [016] [119] 1081] [117] [017] [117]
Household has toilet -0005 0122 0092 0126 -0021 0155 0047 0129 -0479 0127 -0336 0113 facility
Wealth index 0129 -0043 0022 -J041 -0067 -J033 -0028 -0045 -0019 -0041 -0033 -0038 [382Jmiddotmiddot- [074J [074] 1070J [205J [055J [0911 [077] [052] [070] [086] [065)
Wealth index squared -0008 -0003 -0001 -0003 0005 -J004 0001 -J003 0000 -0003 -JOOl -J003 1275] [050] [041) (058) [165 [074 [048 [053] [014] [063 [042] [064)
Constant -2636 -4279 -J81 0 -4328 0289 -4470 -0446 -4365 -1109 -4415 -0430 -4428 [680] [572]middot bull [256) [577] [092] [571] [147] [563)--- 1308)middot 1573] [116] [569)
Observations 13225 13225 13225 13225 13225 13225 13209 13209 13209 13209 13209 13209
Source Authors estimates using Nigerias CWlQ 2003 Notes State dummy variables induded in the regressions but not shown in the tables () denotes coefficient statistically significant at 10 level () at 5 level and ( ) significant
jgt at 1 level 0
I) ltDc
0 ~
-(j raquo
(f)
G) 0 raquo rshy ~ ilojCl Cl
jgt
0 -
Table 11A2 Bivariate Probit Regressions for Men in Nigeria
Decide Contrib Decide Contrib Decide Contrib Decide Contrib Decide Contrib Decide Contrib 1G education income health income food income cloth income land use income sales income
Number of infants 0232 0033 0016 0033 -0079 0033 0029 0038 0089 0036 0037 0038 under-S [54S] [076] [040] [074] [202] [074] [0771 [085J [25SJ [0811 [122J [0861
Square of number of -0029 -0003 -0009 -0004 0001 -0004 -0008 -0005 -0014 -0005 -0005 -OOOS infants [279] [053J [130J [0S7] [013J [061] [105J [067J [179] [069] [084] 1069]
Number of children 0564 0035 0079 0033 0041 0033 0052 0034 0055 0031 0015 0031 (age 5-14) 11704J [086J [202] [087] 110SJ 1088J [168) [090) [171] [083) [055] [082]
Square of number -0070 -0004 -0008 -0004 0000 -0004 -0004 -0004 -0002 -0004 0000 -0004 of children [1044] [045] [118] [061] [001] [059J [079] [060J [028J [056] [002J [0S6]
Number of adults 0222 -0116 -0052 -0106 -0106 -0113 -0037 -0110 0095 -0116 0045 -0116 [668) [225) [100) [215) [200] [222J [107) [220] [261] [2261 [136] [2261
Square of number -0012 0010 0007 0009 0010 0010 0001 0010 -0005 0011 -0001 0011 of adults [364] [186) [132] [1791 [179] [190] 1030] [186J [154] [192) [026) [193]shy
Number of elderly 0116 -0135 0217 -0147 -0048 -0145 0180 -0119 0035 -0143 -0130 -0135 (age 6S+) [108] [106J [146] [US] [036] [111J [156] [092J [029] [109] [124] [104J Square of number -0030 0019 -0071 0030 -0008 0034 -0057 0022 0015 0026 0058 0024 of elderly [057J [036) [113] [056) [014) [061] [110J [040] [028] [047] [119) [0441
Female-headed -7759 -1265 -0711 -1213 -1452 -1195 -1369 -1224 -0625 -1277 -0289 -1250 household [2690] [174)- [106) [163] [218J [163) [180J- [158J [084J [168] [038) ]164)
Age of household head 0014 Om5 0047 0Q18 0012 0016 0026 0016 0004 0019 0012 0018 [111) [0841 [307) [1001 [081[ [093] [191) [090J [031] [108) [092J [1061
Square of age of 0000 0000 -0001 0000 0000 0000 0000 0000 0000 0000 0000 0000 household head [1311 [149J [376] [165) [1421 [156] [272]- [1561 [061] [1721- [121] [1691shy
Age of spouse 0022 0029 -0031 0025 0000 0028 0008 0027 0014 0025 0006 0025 [1561 [152) [186)- [1331 [001) [1471 [0511 [144] [098] [129] [0441 [132J
Square of age of spouse 0000 0000 0000 0000 0000 0000 0000 0000 0000 0000 0000 0000 [124J [211) [168]- [196]-- [025] [214] [038] [208]- [US] [1921- [068J [1961shy
I) ltD a ~
u raquo
0
(fJ
Gl 0 raquo rshy ~ en ~r Cl Cl Head has customary 0316 -0343 -0152 -0378 0100 -0376 0024 -0373 0089 -0356 -0031 -0358 jgt marriage [307] [266] [100] [288] [086] [283J [022] [289] [090J [277J [034] [276]8
Head has Islamic marriage 0403 -0154 -0178 -0182 -0254 -0185 -0080 -0178 -0150 -0168 -0210 -0160 [319] [094J [116] [108J [192J [111J [066J 1107] 1131J 1102J 1201J 1095J
Head has Christian 0436 -0481 -0112 -0509 0150 -0503 -0048 -0517 0062 -0498 0089 -0490 1361] [331] [066] [350J [114J [340] [038] 1358] [057] [346] [089] [339J
primary 0254 -0006 0249 -0012 0163 -0013 -0010 -OQ15 0211 -0006 0114 -0006 education 1242] 1005J 1144] [010] [140J [010J 101 OJ 1012] 1178J 1005J [119J [005]
Head completed primary 0320 0310 0093 0300 0193 0311 0127 0286 0176 0309 0124 0314 education 1475] [321] [110] [310J 1228J [319J [159J [301] [246] [316] [194] [320]
Head incomplete 0226 0077 0015 0053 0115 0074 0108 0043 0147 0Q75 0093 0078 secondary education [149] [028] [009] [020] 1069] [027] [074] [016] [109] [027] [079] [028]
Head completed 0355 0063 0136 0102 0183 0081 -0029 0076 0061 0076 0197 0088 secondary education [363] [045J [1051 [073] [149] [0571 [024] [054] [065] [054J [225] [062]
(fJ Head tertiarv education 0430 0085 0172 0109 0220 0118 0128 0081 0083 0113 0228 0119 (fJ [369] [063] [113) [081J [167] [088] [102J 1060] 1082] [084] 1237J 1088]
Spouse incomplete 0163 -0208 -0051 -0202 -0326 -0240 0123 -0212 -0048 -0234 -0232 -0239 primary education [154] [172J [030J [166J [2851 [197J [101] [176J [041] [192] 1238J [195]
Spouse completed primary 0148 -0072 -0004 -0102 -0153 -0106 0060 -0089 0097 -0094 0045 -0099 education [188] [062] [004] [089] [164] [092] [0661 [0791 [UO[ [081] 1064) [085]
Spouse incomplete 0345 -0146 -0281 -0111 -0284 -0127 -0056 -0105 -0004 -0132 -0081 -0132 secondary educ [224J [070J [155] [056J [190] [061] [0381 1053] [003] [065] [070] [065]
Spouse completed 0082 0071 -0067 0071 -0216 0046 -0036 0068 -0210 0050 -0298 0049 secondary educ [072] [048] [045] [048] [156] [031] [026] [0471 ]197] [034] [302] ]034]
Spouse tertiary education 0095 0220 0212 0188 -0088 0164 0073 0215 -0001 0182 -0220 0171 [052] [115] ]084] [099] [047] ]085] [042] [111] [001] [094] 1156] 1089]
Head unemployed -0499 -1492 -0541 -1455 -0312 -1507 -0051 -1455 -0160 -1502 -0141 -1507 gt [230] [479] [200] [472] [121] 1488] 1018J [463J 1071] 1481] [069] ]480] 0 w
continued CD co Ilt 0
en raquo
(fJ
(f)
Cl 0 raquo r 0 I
t txgt
0 CD
~~ 0- 0 Table 11A2 Bivariate Probit Regressions for Men in Nigeria continued ~
Decide Contrib Decide Contrib Decide Contrib Decide Contrib Decide Contrib Decide Contrib~ education income health income food income cloth income land use income crop sales income
Head not in labor force -J618 -1525 -J858 -1479 -J428 -1522 -J443 -1481 -J358 -1520 -J200 -1509 [3341 [5331 [366] [525] [191[ [S40J [181] 517] 1187] [531]- [119) 526]
Head in public or -J063 -J186 0136 -0173 -J201 -0157 -J401 -J169 -J099 -J175 -J270 -J162 parastatal sector [0351 [097] [057] [090] [101[ [081] [239] 1089] [081] 1092J [206] 1085]
Head wage earner -J075 -J043 -J452 -0062 0061 -J1 02 0297 -J062 0041 -J083 0188 -J094 1035] 1014] 1144] [021] [023 [ [035J 11111 10211 1021] [028] [1011 [031]
Head self employed -J423 -J138 -J277 -0129 0177 -0154 -J025 -J143 -0100 -J151 -0069 -J161 [2621 [055] [137] 10521 [0891 [062] [011] [056] [058] [059] [047] 1062]
Head unpaid family -J518 -J486 -0602 -J484 0241 -J503 -J139 -J493 -J177 -J494 -J089 -J503 worker [295] [181] [283] [183] 1107] [190] [056] 1184] [092] [182] [0541 [184]
Spouse unemployed -J160 0589 -JOO7 0598 0270 0619 -J150 0564 0067 0627 -J140 0575(f) (f)[0521 [204] [002] [210] [0791 [218Jmiddot- [051J [1981- [0261 [220) [060J [201Jmiddotmiddot
Spouse not in labor force -J112 0431 0200 0415 0568 0456 0293 0399 0271 0440 -J014 0395 [039J [163) [063J [1611 [177]- [175] [111] 1152J 1113) [168Jmiddot [006J 1150]
Spouse in public or -0217 0069 -J501 0036 0273 0072 -0397 0041 -J142 0053 0161 0062 parastatal sector [086] 1030] [166]- [016] [108] ]0311 [172[ [018] [O63J [O23J [O83J [O27J
Spouse wage earner -0322 -J802 0059 -J754 0093 -J746 0256 -J775 0166 -0757 -J245 -0808 [095] [256) [O15J [242] [026) [239 [083 [245 [055] [245) 1089) 261J
self employed -J160 -J251 0517 -J255 0468 -J238 0363 -J268 0273 -J251 0248 -J287 [057J [103] [168) [107[ [148] [099] 1144) [111] 1118] [104) [117) [118)
Spouse unpaid family -J236 -J084 0056 -J088 0538 -0064 0013 -Jl00 0290 -Jon 0037 -J101 worker [084] [034) 1018] [0361 [1671 10271 [005] [0411 [124] [030] [017) [041]
Head in manuflconstrl -J115 0156 0029 0155 0085 0156 0002 0152 -0527 0149 -JS70 0134 transport [1101 11161 1020] [116J 1071] [117J 10021 11141 1557] [112J [657J- [100J
Head in wholesaleretail -0011 -J060 -0183 -J089 0088 -J076 -0114 -J093 -0426 -J073 -J420 -J083 [013J [048J [167] [070J [O75J 1060] [121] [0741 ]531J [056] [572J [064J
~ ~
U 0gt
raquo
(f)
0
Gl C raquo E 1
~ ~ 0
5shyshy- Head in serviceeducation -0066 0132 -0088 0098 0044 0113 -0114 0092 -0397 0115 -0374 0103 admlother [078] [076] [072] [056] [046] [065] [123] [053] [479] [066] [470] [059]0
Spouse in manuflconstrl 0160 -0394 -0130 -0411 0146 -0419 0109 -0426 -0573 -0412 -0574 -0415 transport [113] [229] [090] [244] [085] [248] [075] [253] [427] [239 [451] [241]
Spouse in wholesaleretail 0002 0098 0092 0109 0140 0114 -0011 0110 -0465 0118 -0467 0123 [003] [116 [116] [128] [165] [136] 017J [129] 688J [138) [780] [144]
Spouse in serviceeducl 0103 -0191 0628 -0186 0309 -0196 0312 -0185 -0256 -0199 -0110 -0187 admlother [141] [169] [644] [163] [279J [173J [349J [162] [302J [174] [153J [164]
Individual owns house 0099 0034 0204 0041 0109 0033 0094 0038 0800 0031 0736 0033 [184] [047] [295] [057] [176] [045] [157] [053] [1609] [042] [1553] 1046]
Head temporary migrant -0307 -0778 -0149 -0754 -0252 -0738 0247 -0744 -0148 -0759 -0047 -0761 [155] [358] [062] [349J [121] [3391 [124] [343] [068] [3541 [024] [357J
Household has access -0029 -0087 0038 -0093 0036 -0094 0017 -0092 0003 -0092 0002 -0090 to electricity [119] [251] [107] [268] [120] [272] 056] [273] [012] [270J [009J [261]
Household has access 0183 -0221 -0244 -0237 -0072 -0211 -0076 -0216 0043 -0216 -0060 -0210 to piped water [233J [193J [239J [207J [066] 1182J [084] [189J [O5St 1187] [O86J [182J Household has toilet -0122 0157 -0236 0134 -0300 0137 -0317 0139 -0178 0157 -0134 0140
[076] [100J [117] [083] [203] [084J [198J [086] [LSI] [096J [114J [086]
Wealth index 0131 -0014 0112 -0004 0148 -0011 0152 -0003 -0099 -0014 -0035 -0015 [361J [0291 [240J [009] 1336] [022] [361] [007] 1261J [O28J [095] [030J
Wealth index squared -0005 0004 -0005 0004 -0011 0004 -0008 0004 -0001 0004 -0006 0004 [145J [100J [116] [085] [281] [091] [212] [084J [025] [O96J [170J [0971
Constant -1696 2159 0202 2158 0117 2194 -0575 2207 0199 2205 0085 2249 [410] [434] [044J [4331 [O26J [439] [139] [441J [052J [441J [024J 1448Jmiddotmiddot
Observations 10671 10671 10671 10671 10671 10671 10671 10671 10671 10671 10671 10671
Source Authors estimates using Nigerias CWIQ 2003 Notes State dummy variables induded in the regressions but not shown in the tables () denotes coefficient statistically significant at 10 level ( ) at 5 level and ( ) significant at 1 level
jgt
0 V1
2gt ~
Oi 01
raquo
406 GENDER DISPARITIES IN AfRICAS LABOR MARKET
References Babalola A and C Dennis 1988 Returns to Womens Labour in Cash Crop producshy
tions Tobacco in Igboho Oyo State Nigeria In Agriculture Women and Land The African Experience ed J Davidson Boulder CO West View Press
Backiny-Yetna P and Q Wodon 2010 Gender Labor Income Shares and Human Capital Investment in the Republic of Congo In Gender Disparities in Africas Labor Market ed J S Arbache A Kolev and E Filipiak Washington DC World Bank
Blackden C M and C Bhanu 1999 Gender Growth and Poverty Reduction Special Program ofAssistance for Africa 1998 Status Report on Poverty World Bank Technical Paper 428 Washington DC World Bank
Bourguignon F and P A Chiappori 1992 Collective Models of Household Behavior An Introduction European Economic Review 36 (2-3) 355-64
Browning M and P A Chiappori 1998 Efficient Intra-Household Allocations A General Characterization and Empirical Tests Econometrica 66 (6) 1241-78
Bussolo M R E De Hoyos and Q Wodon 2009 Higher Prices of Export Crops Intra-Household Inequality and Human Capital Accumulation in Senegal In Gender Aspects of the Trade and Poverty Nexus A Macro-Micro Approach ed M Bussolo and R E De Hoyos Washington DC World Bank and Palgrave Macmillan
Chukwuezi B 1999 De-agrarianization and Rural Employment in South Eastern Nigeria Working Paper 37 African Studies Centre University of Leiden the Netherlands
Hoddinott J and L Haddad 1995 Does Female Income Share Influence Household Expenditures Evidence from C6te dIvoire Oxford Bulletin of Economics and Statisshytics 57 (1) 77-96
lloyd C B and A K Blanc 1996 Childrens Schooling in Sub-Saharan Africa The Role of Fathers Mothers and Others Population and Development Review 22 (2) 265-98
Manser M and M Brown 1980 Marriage and Household Decision Making A Bargaining Analysis International Economic Review 21 (1) 31-34
McElroy M B and M J Homey 1981 Nash-bargained Household Decisions Toward a Generalization of the Theory of Demand International Economic Review 22 (2) 333-49
Piesse J and J Simister 2003 Bargaining and Household Dynamics The Impact of Education and Financial Control on Nutrition Outcomes in South Africa South African Journal ofEconomics 71 (1) 163-72
World Bank 2004 Nigeria Poverty and Vulnerability-A Preliminary Diagnostic Unpublished manuscript Human Development Department Africa Region World Bank Washington DC
--- 2005 Uganda From Periphery to Center A Strategic Country Gender Assessment Poverty Reduction and Economic Management Africa Region World Bank Washington DC
GDALM_381-406indd 406 29106110 11 55 AM I
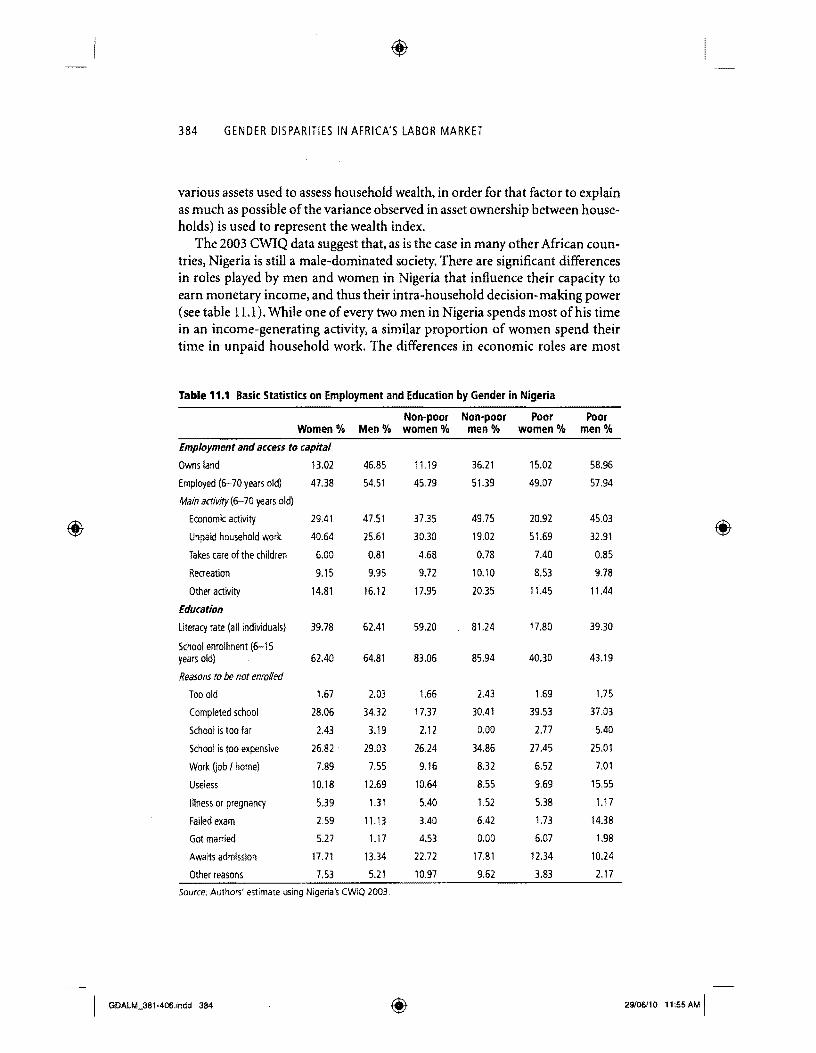
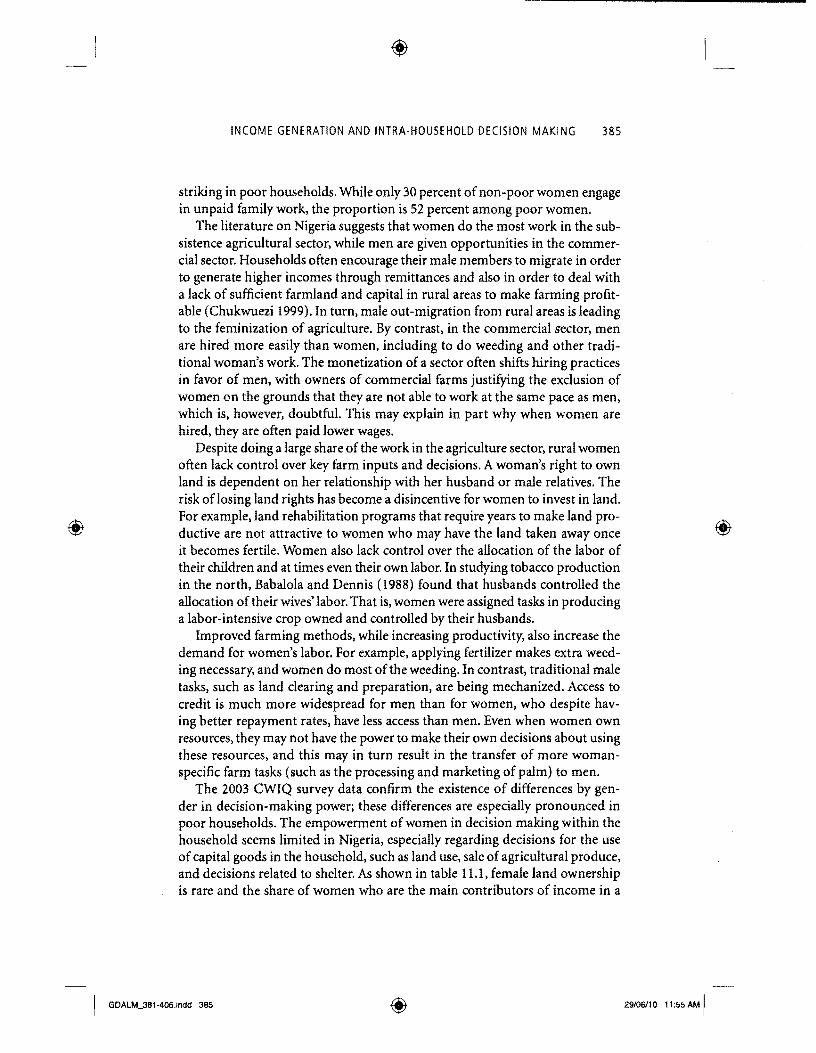
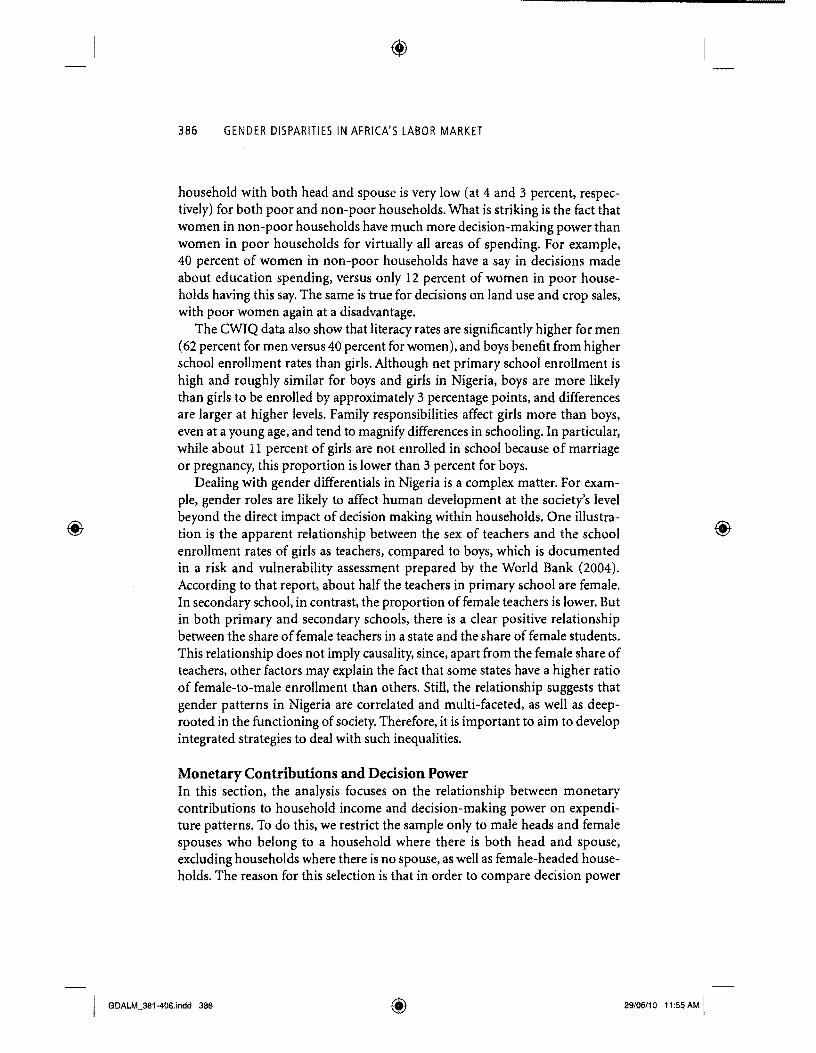
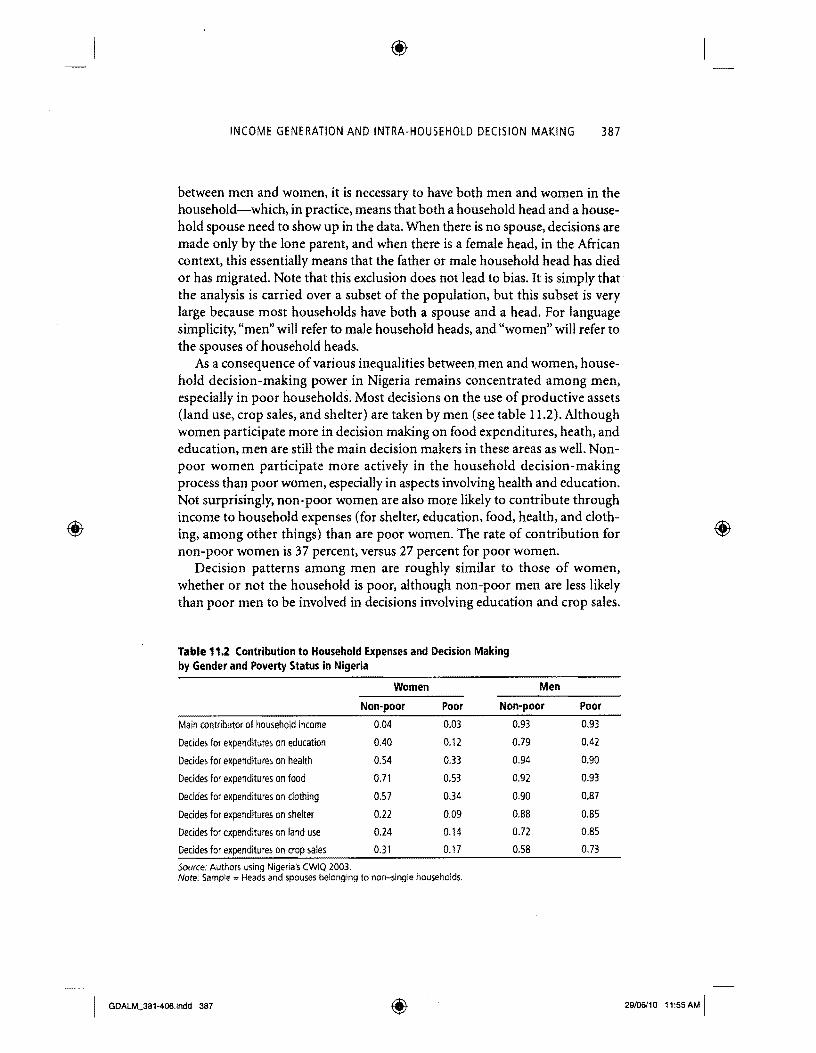
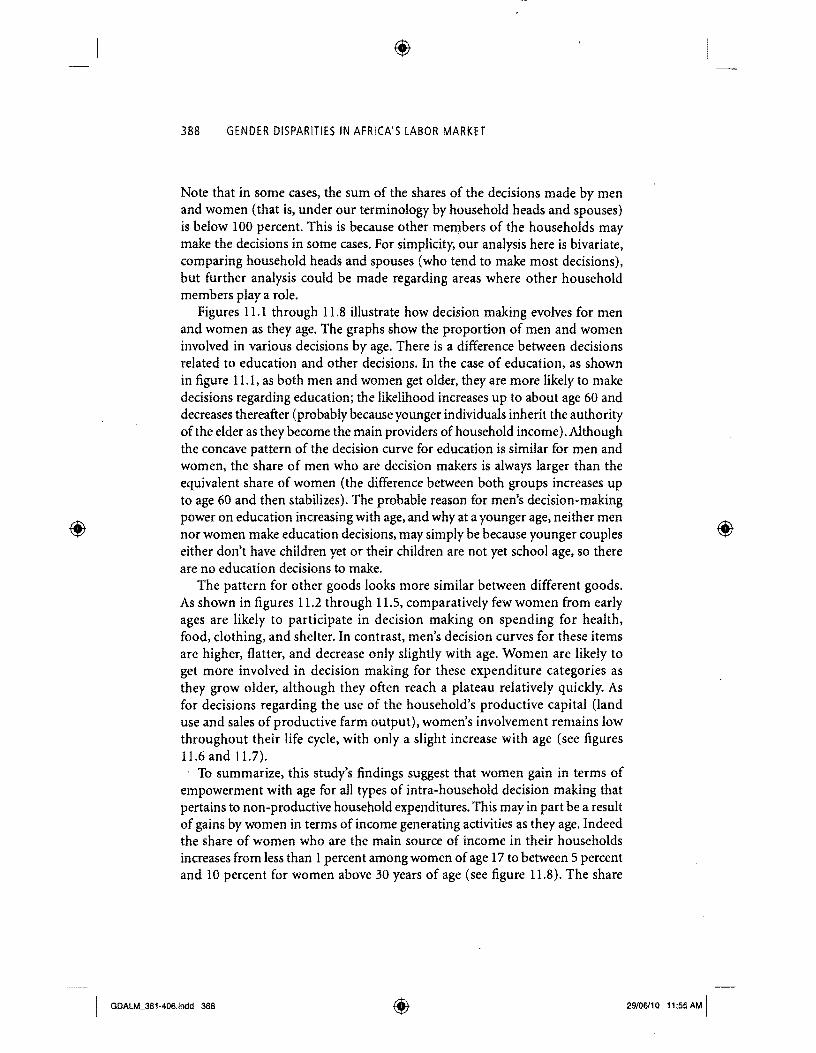
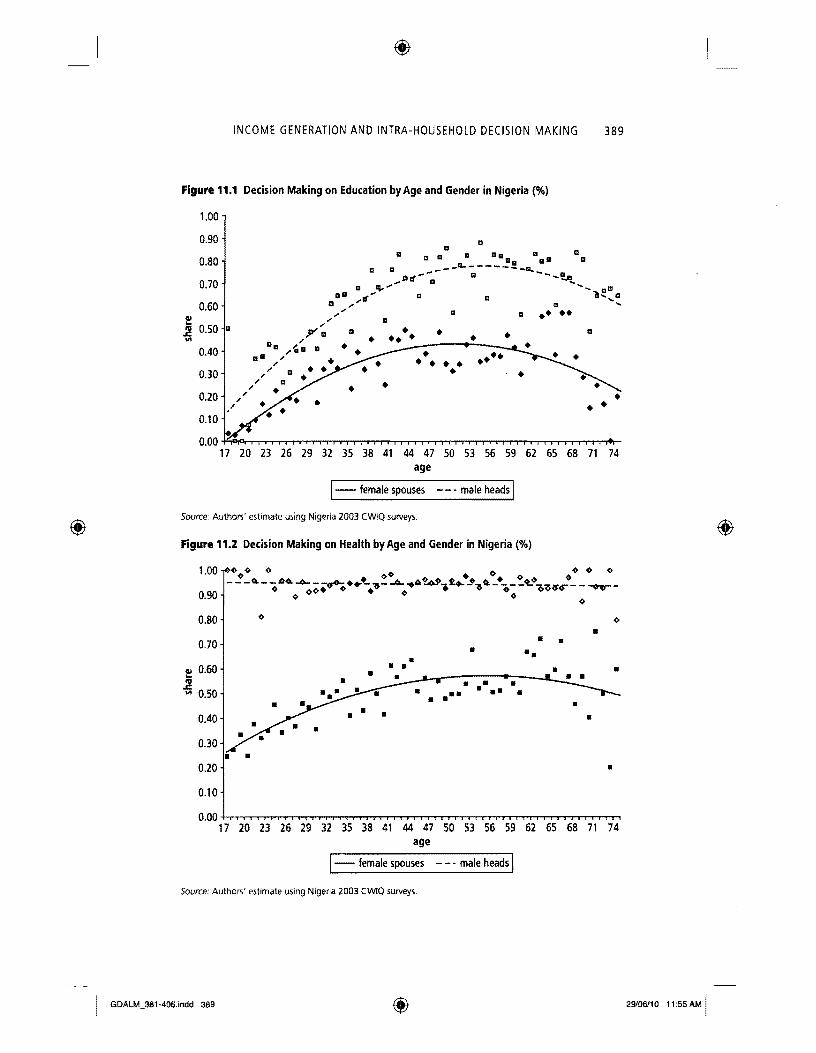
bull
bull bullbull bull bull bull
bull bull bull
bull bull
bull bull bull bull
bull
bull
bull bullbullbull bull bull bull bullbull bull bull
bull bull bull bull
bull bull bull bull
INCOME GENERATION AND INTRA-HOUSEHOLD DECISION MAKING 389
Figure 111 Decision Making on Education by Age and Gender in Nigeria ()
100
090 3
Qm C III m080
070
060 ~ ~ 050 3 11 bull_---T~__
040
030 bull
bullbullbull bullbullbull bull 020 bull 010
000 TTTT---------rTTTTTrrTTTTr-rTTTTT1TT--rTTTT-r+rshy
17 20 23 26 29 32 35 38 41 44 47 50 53 56 59 62 65 68 71 74 age
1- female spouses - - - male heads I Source Authors estimate using Nigeria 2003 CWIQ surveys
Figure 112 Decision Making on Health by Age and Gender in Nigeria ()
bull 080 bullbull 070
~ 060 ~ VI 050
bull 040 bull 030
020 bull
010
000 +-r--rrr--TTTTrT1----rTTTT1TrTTTTTr-TT---- 17 20 23 26 29 32 35 38 41 44 47 50 53 56 59 62 65 68 71 74
age
1-- female spouses - - - male heads I Source Authors estimate using Nigeria 2003 CWIQ surveys
GDALM_381-406indd 389 29106110 11 55 AM I
bull bull bull bull bull bull
bull bull bull
bull bull bullbull bull bull bull bull bull bullbull bull bull bullbull bull
bull
390 GENDER DISPARITIES IN AFRICAS LABOR MARKET
070
060 J1 050 II
040
Figure 113 Decision Making on Food by Age and Gender in Nigeria ()
100 aaa abullbull --JL-IItr_cIlJI 11_- liIa lL a III II II
cam m -- -r - 0 - -r ___IL II ftO 90 bull iii a a IIIW 11------- - __
bullbull bull a bullbull 080 bullbull
bull bull
bull
030
020
010
000 +-rITIITTn-TTTTTTT1IT1-TTTTT1r-r-TITlnITlTTT 17 20 23 26 29 32 35 38 41 44 47 50 53 56 59 62 65 68 71 74
age
- female spouses
Source Authors estimate using Nigeria 2003 CWlQ surveys
Figure 114 Decision Making on Clothing by Age and Gender in Nigeria ()
100
090
080
070
060
J1 050 II
040
030
020
010
ClI C a 13 a ell DcaIII III 13 a cO
_-Jl --------- -PaIIL--- 1OL1III--CI_ __ II II iii II II a II tr II - - - i - - - - - _
c bull II II 11 II
III --~bull--~bull~~--~~----~--~~ bull
bull
000 +-rr-r-Tr-r-rTTTTIrTTMMM---TTT 17 20 23 26 29 32 35 38 41 44 47 50 53 56 59 62 65 68 71 74
age
1- female spouses - _ male heads 1 Source Authors estimate using Nigeria 2003 CWIQ surveys
GDALM_381-406indd 390 29106110 11 55 AM Iltit
bull
bull
bull bullbull
bull bullbull bull bull bull
bull bull bull bull
bullbull bull bull bull bull bull bull bull bull bull bullbull bull bull bullbull bull bull bull bull bull bull bullbull bull bull bull bull
INCOME GENERATION AND INTRA-HOUSEHOLD DECISION MAKING 391
Figure 115 Decision Making on Shelter by Age and Gender in Nigeria ()
100 poundI
090 poundI
080 m
poundI m D m 11070 II CJ poundI II a iii II 11____B ___ _____ D m DDar-_IIa ______
CI II II pound111 a III 11m 13 -------- _____~a 060 cDc a Jm 0
IIl] 050 III bullbull bull II
040
030 bullbull 020
010
000 +--rr-rr---TT-r-r-r-rrr-rshy17 20 23 26 29 32 35 38 41 44 47 50 53 56 59 62 65 68 71 74
age
1- female spouses - _ male heads I Source Authors estimate using Nigeria 2003 CWlQ surveys
Figure 116 Decision Making on Sale of Farm Crop by Age and Gender in Nigeria ()
100
090
080
070
060 ltII shyltII 050s III
040
030
020
010
nil
- __LD II III II II II m aa a II
II --~--~~-r~~-~~a~_~~~-~~-~---a~--~ CI a II a a m c D D a
II
bull bull
bull bull 000 +r---rr---rrTTTI-rT--rT-rlTT--r---r--rrTT--r--
17 20 23 26 29 32 35 38 41 44 47 50 53 56 59 62 65 68 71 74 age
1- female spouses - - - male heads I Source Authors estimate using Nigeria 2003 CWlQ surveys
GDALM_381-406indd 391 2906110 1155 AM I
bullbull bull bull bullbull bull bull
bull bullbullbull bull bull bull bullbull bull bull bull bull
bull bull
bull bull bull bull bull bull
392 GENDER DISPARITIES IN AFRICAS lABOR MARKET
Figure 117 Decision Making on Land Use by Age and Gender in Nigeria ()
100
090
080
070
060 bull CII III
bull III 050
pound VI
040
030
020
010
000 +rrrrTTTT1r-rTTTTT1r-r-TTTTTlrrTTTTTlrrTTT
17 20 23 26 29 32 35 38 41 44 47 50 53 56 59 62 65 68 71 74 age
1- female spouses - _ male heads 1 Source Authors estimate using Nigeria 2003 CWlQ surveys
Figure 118 Main Contributor of Income in the Household by Age and Gender in Nigeria ()
100
095
090
VI 085 -s III CII
- 080 III
pound VI 075
070
065
am 11111 025
020
015
010
bull
bull bullbullbull bullbull 005
000 +-+--------r----------------+-+--4t+-+ 000 o 10 20 30 40 50 60
CII
= 0 Q
CIIu pound
age
Source Authors estimate using Nigeria 2003 CWIQ surveys
GDALM_381-406indd 392 2906110 1155 AM I
INCOME GENERATION AND INTRA-HOUSEHOLD DECISION MAKING 393
of men as the main provider of household income on the contrary decreases significantly after they have reached age 65 The econometric analysis in the next section provides a better assessment of the correlates of decision making and income generation
Econometric Analysis
In this section a simple empirical model is developed to quantify how much income contribution by women affects their participation in household decishysion making The analysis assumes that decision making and income conshytribution are jointly distributed outcomes which means that both outcomes are decided jointly by household members rather than sequentially That is the decision to contribute may be influenced by the decision-making power acquired in doing so and similarly the decision-making power depends on the ability to contribute (both outcomes depend on each other) We estimate for men and women separately the likelihood of decision making conditional on their contribution to the household expenditures controlling for other observable individual and household characteristics that also may influence decision making and the probability that individuals contribute income to the household
The determinants of income contribution and decision making are analyzed using a bivariate probit model The need to rely on pro bits comes from the fact that dichotomic variables are observed as outcomes (that is we observe only whether the household head or spouse contributes or not and decides or not) Rather than estimating two probit regressions we estimate the correlates of both outcomes together because this enables us to assess the impact of one outcome on the other In addition bivariate probits generate efficiency gains in the estimation precisely because they take into account the correlation between the error terms of the two regressions for contribution and decision making respectively The estimation procedure enables us to compute the probability of participating in the household decision making conditional on whether the individual contributes to household income or not
Denoting by D and C the latent and unobserved continuous decision and contribution variables by D and C their categorical observed counterparts and by X the vector of independent exogenous variables the bivariate probit model is expressed as
D =f3X +eD D = 1 if D+ gt 0 D = 0 otherwise
CO =f3~ X +ec C =1 if CO gt 0 C =0otherwise (1Ll)
E[eDJ=E[ecl=O Var[eD ] = Var[ec1 =1 COV[eDe] = P
I GDALM_381-406ndd 393 2906110 1155 AM I
394 GENDER DISPARITIES IN AFRICAS LABOR MARKET
The impact of contributing income on the probability of making a decision on a particular issue is computed as the difference in the two conditional probshyabilities of making a decision
amp=P(D=lIC 1X)-P(D=1IC OX) (112)
The set of exogenous variables X are age of the individual household size religion of the household (proxied by the type of household marriage that is whether Customary Islamic Christian or another type of marriage) education of the individual (no education at all incompletecomplete primary incom~ pletecomplete secondary or tertiary education) a number of employmentshyrelated variables for the individual (employment status whether employed unemployed or out of the labor force type of employment whether wage earner self-employed unpaid family worker or firm owner sector of employshyment whether agriculture manufacturing-construction-transport wholesaleshyretail public administration or services) and several other variables such as whether the household owns a house has access to electricity water and sanitashytion whether the household head is a temporary migrant and regional dumshymies to control for geographic effects
The detailed results from the estimations are provided in the annex We focus here on the estimates of the impact of income contributions to decision making using the method outline in equation 112 The results are provided in table 113 When they are the main contributor of income women win substantial decision-making power and thus playa more active role of leadshyership in the household The differences in decision power brought about by contributing income are largest for food shelter and health where income contributions increase the probability of decision making by approximately 20 percentage points
For example in the case of expenditures for health the predicted probabilshyity that women participate in the decision making is 43 percent when they do not contribute income and this increases to 64 percent when they contribute income For men the corresponding reduction in the probability of making decisions for expenditures on health decreases by 18 percent when they do not contribute to the households income However even when they contribute to cover most ofa households income the probability that women will make decishysions regarding the use of productive assets such as land and the commercial use of agricultural output remains low To some extent this same result is also observed with education
An additional finding is that income contribution increases the level of decision making among poor women more than among non-poor women for health food and clothing These results are provided in table 114 Yet for
GDALM_381-406indd 394 2906110 1155 AM I
INCOME GENERATION AND INTRA-HOUSEHOLD DECISION MAKING 395
Table 113 Impact of Income Contribution on Decision Making by Gender in Nigeria
Men Women
Standard Standard Probability deviation Probability deviation
Education
Decides if contributes 053 030 039 029
Decides if does not contribute 036 029 023 025
Difference -017 008 -016 009
Health
Decides if contributes 094 007 064 020
Decides if does not contribute 076 015 043 024
Difference -018 009 --021 008
Food
Decides if contributes 094 006 083 014
Decides if does not contribute 082 012 060 025
Difference --012 007 -022 013
Clothing
Decides if contributes 089 007 058 024
Decides if does not contribute 069 012 043 027
Difference --020 006 -015 005
Shelter
Decides if contributes 088 008 034 020
Decides if does not contribute 077 012 016 015
Difference --0 004 -019 008
Land use
Decides if contributes 077 023 027 025
Decides if does not contribute 066 026 016 020
Difference --011 005 -01 007
Sell agricultural output
Decides if contributes 065 025 026 030
Decides if does not contribute 051 025 021 027
Difference --015 004 -005 004
Source Authors estimates using NigeriaS CWlQ 2003 Notes Estimates based on sample of 10702 men (household heads) and 13260 women (spouses) differences in size of both samples are due to missing variables
decisions involving household productive assets such as land use crop sales and shelter contributing income increases the level of decision making among non-poor women more than among poor women
GDALM_381-406indd 395 2910610 11 55 AM I
396 GENDER DISPARITIES IN AFRICAS LABOR MARKET
Table 114 Impact of Income Contribution on Decision Making by Gender and Poverty Status in Nigeria
Men Women
Non-Poor Poor Non-poor Poor
Standard Standard Standard Standard Probability deviation Probability deviation Probability deviation Probability deviation
Education
Decides if contributes 072 024 037 025 059 026 023 020
Decides if does not contribute 054 028 020 021 038 026 010 015
Difference -018 OOS -l17 008 -l21 OOS -013 008
Health
Decides if contributes 096 005 092 OOS 075 018 055 018
Decides if does not contribute 0S1 013 073 016 055 024 033 019
Difference -l15 OOS -020 009 -l20 008 -023 00]
Food Decides if contributes 093 006 095 006 0S9 012 077 014
Decides if does not contribute OSO 011 0S4 011 072 024 051 022
Difference -l13 007 -l11 006 -l17 013 -l26 012
Clothing Decides if contributes 091 006 087 007 072 021 047 019
Decides if does not contribute 073 011 066 011 058 025 031 021
Difference -llS 006 -021 005 -l14 006 -l16 005
Shelter Decides if contributes 089 007 087 OOS 045 020 025 014
Decides if does not contribute 078 011 075 012 023 017 009 009
Difference -011 004 -l12 004 -l21 0D7 -l16 007
Land use Decides if contributes 066 027 086 014 034 024 021 024
Decides if does not contribute 054 029 077 017 021 020 013 019
Difference -012 005 -l09 004 -ln 006 -lO9 006
Sell agricultural output Decides if contributes 054 027 076 018 035 029 019 028
Decides if does not contribute 039 026 061 019 02S 027 015 025
Difference -l15 005 -l15 004 -l07 004 -l04 004
Source Authors estimates using Nigerias CWIQ 2003 Notes Estimates based on sample of 10702tnen (household heads) and 13260 women (spouses) differences in size of both samples are due to missing variables
GDALM_381-406indd 396 29106110 1155AM I
INCOME GENERATION AND INTRA-HOUSEHOLD DECISION MAKING 397
Conclusions
In Nigeria as in other Sub-Saharan countries most of household decisions are made by men who are the de facto household heads Statistical analysis of CWIQ survey data suggests that men tend to have most of the decision-making power regarding the use of productive assets such as land use crop sales and shelter Women participate more often in decisions on expenditures for food heath and education but even in these areas men more often than not remain the main decision makers The decision-making power of women is especially low among poor households in part because in such households the likelishyhood that women will be the main contributor of household income is much lower as well
Simple econometric modeling suggests that as expected when they are the main contributor of income women win substantial decision-making power The differences in decision power brought about by contributing income are as large as 20 percentage points for food shelter and health spending Howshyever the impact is much smaller in relation to the use of productive assets Finally contribution income raises decision making more among poor than non-poor women
Care must be taken not to draw strong policy recommendations from the limited and descriptive analysis in this chapter Yet some broad comments or suggestions can be made This study found that increasing the contribution ability ofwomen to household income leads to higher decision-making power for them within the household This has also been shown by several other authors to lead to higher investments in the human capital of children thereby leading to poverty reduction and higher income growth in the future This result can be used to advocate for policies to increase womens ability to conshytribute to household expenditures including policies raising the human capital of women for example through training and education programs specifically targeting women Facilitating access to land (for example through heritage law reforms or titling mechanisms) or access to credit (for example through microshycredit interventions targeted to women) are all interventions that have proven successful in other countries to promote female entrepreneurship and thereby to increase womens income and bargaining power However a detailed analysis for Nigeria should be conducted before making any specific policy recommenshydation in favor of one type of intervention or another to improve the position of women in the household
GDALM_381-406indd 397 29106110 11 55 AM I
(it
Ggt 0 raquo E I
~ ~ S w Annex Detailed Regression ResultsQ ltDQ
00 Cogt to Table 11A1 Bivariate Probit Regressions for Women in Nigeria
Decide Contrib Decide Contrib Decide Contrib Decide Contrib Decide Contrib Decide Contrib education income health income food income doth income land income crop sales income
Number of infants 0212 -0033 0054 -0033 0042 -ltgt029 0050 -0043 0042 -ltgt038 0087 -ltgt043 under-5 [482] [O42J [159] [043) [US] [036] [140J [054) [098] [048] [193] [055)
Square of number of -ltgt044 -ltgt014 -0013 -ltgt011 -ltgt008 -ltgt013 -ltgt014 -0010 -ltgt004 -ltgt010 -ltgt019 -0009 infants [384) [058) [169] [051] [124) [055) [165] [044] [039) [044) [162] [040]
Number of children 0295 0010 -ltgt012 0029 -0003 0025 0005 0026 0033 0030 -0019 0027 (age 5-14) [793] [018) [058J [048) [015] [0421 [024] ]043] ]112J [049] [064]
of number -ltgt039 -ltgt007 0003 -ltgt011 0002 -ltgt010 0001 -0011 -0001 -ltgt011 0006 -ltgt011 children [5341- [055J [097J [081J [056) [077] [O32J [O80J [0221 [085J [1331 [084]
Number of adults 0189 -0015 -0085 0005 -ltgt101 0010 -0056 -ltgt001 0049 0007 0009 0012(it [544] [O20J [353] [007J [393] [O14J [196) [002) [126J [O10J [024] [015J (it Square of number -0013 -0005 0006 -0007 0006 -ltgt007 0003 -0006 -0005 -ltgt007 -0001 -0007 of adults [396J [057J [303J [081J [284] [085J [109J [075J [136J [081) [039] [087]
Number of elderly 0096 -ltgt023 0055 0003 0145 -ltgt013 -0088 -0028 -0044 -ltgt016 -0012 -ltgt022 (age 65+) [098] [O13J [066] [002] [168) [008] [104] [016] [O42J [009] [010] [O13J
Square of number -0007 -0059 -ltgt058 -0061 -ltgt082 -0058 -0009 -0052 0022 -0053 -0008 -0053 of elderly [016J [074J [159J [080J [220J [O77J [O25J [069J [049J [O72J [0181 [071]
Female-headed -6325 2096 0684 2089 6045 2120 1592 2133 0094 2132 0259 2089 household [1905] [259] [098] 1248J [3109] [263] [272] [265J [015] [257] [043J [253]
Age of household head 0001 0025 -0011 0D25 0005 0023 -0004 0023 -ltgt010 0022 -0038 0025 [010] [123] [099J [120] [045] [115] [033] [112] [070] [110] ]275]
0000 0000 0000 0000 0000 0000 0000 0000 0000 0000 0000 0000 [105J [102J ]103] [088J [094] [046J [095J [102J [088J [278] [104J
Age of spouse 0042 -ltgt003 0028 -0001 0024 0000 0015 -ltgt001 0013 -0001 0032 -0004 [278J [012J [226] [007] [198) [001) [119J [003] [081] [007) [214] [019) ~
~
ij
raquos
(it
0
Gl 0 raquoshy I
Square of age of spouse 0000 0000 0000 0000 0000 0000 0000 0000 0000 0000 0000 0000~ [223] [069] [173] [063] [139] [057] [098J [061J [102] [063] [175] [078J5 CI CI
Head has customary 0073 0177 0166 0187 0228 0155 0110 0185 0018 0188 0088 0189 marriage [088J [129J [196[ [137] [233] [117] [121] [137] [018] [138J [098]
Head has Islamic 0141 0192 0068 0194 0155 0143 0051 0175 -0275 0197 -0208 0202 [129] [102] [068] [103] [141] [079] [049] [094] [231] [106] [176J [108]
Head has Christian 0335 0259 0405 0280 0663 0246 0386 0266 0172 0281 0240 0270 ]340] [168J [410] [181] [554] [163] [378] [174J [162] [183J [235] [1761
Head incomplete 0113 0008 -0086 0006 -0120 0003 -0059 0011 -0005 -0004 -0035 0006 primary education [120] 1005] [103] [005] [US) [002] [070] 1008J 1006] [003J [038] [0051
Head completed 0043 -0256 -0046 -0239 -0003 -0247 0059 -0246 -0081 -0251 0049 -0245 primary education 1064] 1226J [081] [215]-- 1006] 1219]-- [LOS] 1217] [118] [221] [066] [215]
Head incomplete -0050 -0155 -0139 -0129 0207 -0107 0002 -0096 -0232 -0113 -0181 -0118 secondary education 1038] 1087] 1098] 1071] [147] 1057] 1001J 1053] [146] [063] [129] [065]
Head completed 0157 -0320 0055 -0291 -0086 -0267 0029 -0295 -0128 -0290 0043 -0295 secondary education [154] [194] [063] 1176]- [092] [160] [034] [I 77] 1131] 1175] 1036] 11 77]
Head tertiary education 0080 -0171 0013 -0147 0036 -0132 0088 -0142 -0163 -0135 0126 -0139 1079] 1102] [014] [089] [037] [079] [099] [084] 1158] [081] [120] [084]
Spouse incomplete 0108 0336 -0001 0329 0178 0324 0041 0321 0076 0347 -0048 0335 primary education [123] [253] [002] [249] [181] [244] [048] 1242] [081] [261] [050] [253]
Spouse completed 0089 0211 0041 0180 0004 0193 -0055 0175 0172 0210 0086 0201 primary education [120] [181] [063] [156] [006] [164] 1090] [150] [224] [179] [106] [172]
Spouse incomplete 0201 -0108 0007 -0135 0045 -0147 -0021 -0164 0252 -0128 0073 -0143 secondary educ [169] [047] [006] [056] [033] [061] [016] [068] [203] [055] [059] [060]
Spouse completed 0067 0182 -0174 0152 0014 0144 0073 0154 -0070 0154 -0122 0162 secondary educ [064] [108] [182] [089] [013] [083] [076] [088] [065] [088] [103) [093)
0168 0073 -0149 0053 0075 0051 -0007 0051 0029 0079 -0222 0081 [099] [024] [046] [023] [005] [023] 1019] [036] [146] [037]
w 10 Head unemployed 0041 2147 -0208 2105 -0016 2194 -0340 2198 -0067 2193 -0245 2193 10 [019] 1475] [098] 1466] [007] [486] [183] 14811 [0291 [483] [093] [486]
I)
~ continued ~ 0
u raquo
(f)
Gl 0 raquo rshy I
t 00 $ f Q Head in servicel -J043 -J385 -0093 -0370 -0085 -J391 0027 -0403 -J015 -0385 -J228 -0384Q
educationladmlother [051] 1195] [128] [194] [122] [198]-- [036J [2011 1017] [199J [248]-- 1199J51
Spouse in manufconstrl 0185 0438 0075 0408 -0114 0397 0183 0409 -0571 0435 -0739 0424 transport [118] [226J [073] [205]-- [113J [206J [1781- [209J-- [258] [228) 1315] [219J
Spouse in wholesalel 0002 0121 -J069 0124 -J205 0114 0027 0125 -0543 0133 -0525 0127 retail [003] [134] [123J [137] [357] 1126] [049] [138] [891] [147] [848J [140J
Spouse in serviceleducl 0059 0324 0433 0317 -0028 0311 -0037 0304 -0645 0287 -0676 0292 admlother [070] [225]-- [664] [221] [045] [214J [059] [210] [637] [200] [778] [202]
Individual owns house 0365 0395 0319 0375 0851 0389 0462 0367 1204 Q401 1078 0396 [454] [357] [484] [336] [1035] [350] [688] [335] (1651] [364]middot [1295] [364]
Head temporary migrant 0226 1203 0220 1167 -J151 1163 -J120 1175 -J451 1194 -J328 1202 [080] [533] [119] [517] [086J [512] [070J [520] [187] [528]middot [149] [539]
Household has access to 0046 0120 0067 0121 0004 0123 0068 0121 -J014 0121 0032 0122 electricity [205]middotmiddot [324] [319]-- [330]--- [016] [330]--- [333]--- [326] (052] [333]--middot [131] [330]
(f) (f)Household has access to 0077 -0174 -J129 -0166 -0121 -0179 -0011 -0167 -J078 -0164 0017 -0164 piped water [103] [124] [186]- [119] [173] [127] [016] [119] 1081] [117] [017] [117]
Household has toilet -0005 0122 0092 0126 -0021 0155 0047 0129 -0479 0127 -0336 0113 facility
Wealth index 0129 -0043 0022 -J041 -0067 -J033 -0028 -0045 -0019 -0041 -0033 -0038 [382Jmiddotmiddot- [074J [074] 1070J [205J [055J [0911 [077] [052] [070] [086] [065)
Wealth index squared -0008 -0003 -0001 -0003 0005 -J004 0001 -J003 0000 -0003 -JOOl -J003 1275] [050] [041) (058) [165 [074 [048 [053] [014] [063 [042] [064)
Constant -2636 -4279 -J81 0 -4328 0289 -4470 -0446 -4365 -1109 -4415 -0430 -4428 [680] [572]middot bull [256) [577] [092] [571] [147] [563)--- 1308)middot 1573] [116] [569)
Observations 13225 13225 13225 13225 13225 13225 13209 13209 13209 13209 13209 13209
Source Authors estimates using Nigerias CWlQ 2003 Notes State dummy variables induded in the regressions but not shown in the tables () denotes coefficient statistically significant at 10 level () at 5 level and ( ) significant
jgt at 1 level 0
I) ltDc
0 ~
-(j raquo
(f)
G) 0 raquo rshy ~ ilojCl Cl
jgt
0 -
Table 11A2 Bivariate Probit Regressions for Men in Nigeria
Decide Contrib Decide Contrib Decide Contrib Decide Contrib Decide Contrib Decide Contrib 1G education income health income food income cloth income land use income sales income
Number of infants 0232 0033 0016 0033 -0079 0033 0029 0038 0089 0036 0037 0038 under-S [54S] [076] [040] [074] [202] [074] [0771 [085J [25SJ [0811 [122J [0861
Square of number of -0029 -0003 -0009 -0004 0001 -0004 -0008 -0005 -0014 -0005 -0005 -OOOS infants [279] [053J [130J [0S7] [013J [061] [105J [067J [179] [069] [084] 1069]
Number of children 0564 0035 0079 0033 0041 0033 0052 0034 0055 0031 0015 0031 (age 5-14) 11704J [086J [202] [087] 110SJ 1088J [168) [090) [171] [083) [055] [082]
Square of number -0070 -0004 -0008 -0004 0000 -0004 -0004 -0004 -0002 -0004 0000 -0004 of children [1044] [045] [118] [061] [001] [059J [079] [060J [028J [056] [002J [0S6]
Number of adults 0222 -0116 -0052 -0106 -0106 -0113 -0037 -0110 0095 -0116 0045 -0116 [668) [225) [100) [215) [200] [222J [107) [220] [261] [2261 [136] [2261
Square of number -0012 0010 0007 0009 0010 0010 0001 0010 -0005 0011 -0001 0011 of adults [364] [186) [132] [1791 [179] [190] 1030] [186J [154] [192) [026) [193]shy
Number of elderly 0116 -0135 0217 -0147 -0048 -0145 0180 -0119 0035 -0143 -0130 -0135 (age 6S+) [108] [106J [146] [US] [036] [111J [156] [092J [029] [109] [124] [104J Square of number -0030 0019 -0071 0030 -0008 0034 -0057 0022 0015 0026 0058 0024 of elderly [057J [036) [113] [056) [014) [061] [110J [040] [028] [047] [119) [0441
Female-headed -7759 -1265 -0711 -1213 -1452 -1195 -1369 -1224 -0625 -1277 -0289 -1250 household [2690] [174)- [106) [163] [218J [163) [180J- [158J [084J [168] [038) ]164)
Age of household head 0014 Om5 0047 0Q18 0012 0016 0026 0016 0004 0019 0012 0018 [111) [0841 [307) [1001 [081[ [093] [191) [090J [031] [108) [092J [1061
Square of age of 0000 0000 -0001 0000 0000 0000 0000 0000 0000 0000 0000 0000 household head [1311 [149J [376] [165) [1421 [156] [272]- [1561 [061] [1721- [121] [1691shy
Age of spouse 0022 0029 -0031 0025 0000 0028 0008 0027 0014 0025 0006 0025 [1561 [152) [186)- [1331 [001) [1471 [0511 [144] [098] [129] [0441 [132J
Square of age of spouse 0000 0000 0000 0000 0000 0000 0000 0000 0000 0000 0000 0000 [124J [211) [168]- [196]-- [025] [214] [038] [208]- [US] [1921- [068J [1961shy
I) ltD a ~
u raquo
0
(fJ
Gl 0 raquo rshy ~ en ~r Cl Cl Head has customary 0316 -0343 -0152 -0378 0100 -0376 0024 -0373 0089 -0356 -0031 -0358 jgt marriage [307] [266] [100] [288] [086] [283J [022] [289] [090J [277J [034] [276]8
Head has Islamic marriage 0403 -0154 -0178 -0182 -0254 -0185 -0080 -0178 -0150 -0168 -0210 -0160 [319] [094J [116] [108J [192J [111J [066J 1107] 1131J 1102J 1201J 1095J
Head has Christian 0436 -0481 -0112 -0509 0150 -0503 -0048 -0517 0062 -0498 0089 -0490 1361] [331] [066] [350J [114J [340] [038] 1358] [057] [346] [089] [339J
primary 0254 -0006 0249 -0012 0163 -0013 -0010 -OQ15 0211 -0006 0114 -0006 education 1242] 1005J 1144] [010] [140J [010J 101 OJ 1012] 1178J 1005J [119J [005]
Head completed primary 0320 0310 0093 0300 0193 0311 0127 0286 0176 0309 0124 0314 education 1475] [321] [110] [310J 1228J [319J [159J [301] [246] [316] [194] [320]
Head incomplete 0226 0077 0015 0053 0115 0074 0108 0043 0147 0Q75 0093 0078 secondary education [149] [028] [009] [020] 1069] [027] [074] [016] [109] [027] [079] [028]
Head completed 0355 0063 0136 0102 0183 0081 -0029 0076 0061 0076 0197 0088 secondary education [363] [045J [1051 [073] [149] [0571 [024] [054] [065] [054J [225] [062]
(fJ Head tertiarv education 0430 0085 0172 0109 0220 0118 0128 0081 0083 0113 0228 0119 (fJ [369] [063] [113) [081J [167] [088] [102J 1060] 1082] [084] 1237J 1088]
Spouse incomplete 0163 -0208 -0051 -0202 -0326 -0240 0123 -0212 -0048 -0234 -0232 -0239 primary education [154] [172J [030J [166J [2851 [197J [101] [176J [041] [192] 1238J [195]
Spouse completed primary 0148 -0072 -0004 -0102 -0153 -0106 0060 -0089 0097 -0094 0045 -0099 education [188] [062] [004] [089] [164] [092] [0661 [0791 [UO[ [081] 1064) [085]
Spouse incomplete 0345 -0146 -0281 -0111 -0284 -0127 -0056 -0105 -0004 -0132 -0081 -0132 secondary educ [224J [070J [155] [056J [190] [061] [0381 1053] [003] [065] [070] [065]
Spouse completed 0082 0071 -0067 0071 -0216 0046 -0036 0068 -0210 0050 -0298 0049 secondary educ [072] [048] [045] [048] [156] [031] [026] [0471 ]197] [034] [302] ]034]
Spouse tertiary education 0095 0220 0212 0188 -0088 0164 0073 0215 -0001 0182 -0220 0171 [052] [115] ]084] [099] [047] ]085] [042] [111] [001] [094] 1156] 1089]
Head unemployed -0499 -1492 -0541 -1455 -0312 -1507 -0051 -1455 -0160 -1502 -0141 -1507 gt [230] [479] [200] [472] [121] 1488] 1018J [463J 1071] 1481] [069] ]480] 0 w
continued CD co Ilt 0
en raquo
(fJ
(f)
Cl 0 raquo r 0 I
t txgt
0 CD
~~ 0- 0 Table 11A2 Bivariate Probit Regressions for Men in Nigeria continued ~
Decide Contrib Decide Contrib Decide Contrib Decide Contrib Decide Contrib Decide Contrib~ education income health income food income cloth income land use income crop sales income
Head not in labor force -J618 -1525 -J858 -1479 -J428 -1522 -J443 -1481 -J358 -1520 -J200 -1509 [3341 [5331 [366] [525] [191[ [S40J [181] 517] 1187] [531]- [119) 526]
Head in public or -J063 -J186 0136 -0173 -J201 -0157 -J401 -J169 -J099 -J175 -J270 -J162 parastatal sector [0351 [097] [057] [090] [101[ [081] [239] 1089] [081] 1092J [206] 1085]
Head wage earner -J075 -J043 -J452 -0062 0061 -J1 02 0297 -J062 0041 -J083 0188 -J094 1035] 1014] 1144] [021] [023 [ [035J 11111 10211 1021] [028] [1011 [031]
Head self employed -J423 -J138 -J277 -0129 0177 -0154 -J025 -J143 -0100 -J151 -0069 -J161 [2621 [055] [137] 10521 [0891 [062] [011] [056] [058] [059] [047] 1062]
Head unpaid family -J518 -J486 -0602 -J484 0241 -J503 -J139 -J493 -J177 -J494 -J089 -J503 worker [295] [181] [283] [183] 1107] [190] [056] 1184] [092] [182] [0541 [184]
Spouse unemployed -J160 0589 -JOO7 0598 0270 0619 -J150 0564 0067 0627 -J140 0575(f) (f)[0521 [204] [002] [210] [0791 [218Jmiddot- [051J [1981- [0261 [220) [060J [201Jmiddotmiddot
Spouse not in labor force -J112 0431 0200 0415 0568 0456 0293 0399 0271 0440 -J014 0395 [039J [163) [063J [1611 [177]- [175] [111] 1152J 1113) [168Jmiddot [006J 1150]
Spouse in public or -0217 0069 -J501 0036 0273 0072 -0397 0041 -J142 0053 0161 0062 parastatal sector [086] 1030] [166]- [016] [108] ]0311 [172[ [018] [O63J [O23J [O83J [O27J
Spouse wage earner -0322 -J802 0059 -J754 0093 -J746 0256 -J775 0166 -0757 -J245 -0808 [095] [256) [O15J [242] [026) [239 [083 [245 [055] [245) 1089) 261J
self employed -J160 -J251 0517 -J255 0468 -J238 0363 -J268 0273 -J251 0248 -J287 [057J [103] [168) [107[ [148] [099] 1144) [111] 1118] [104) [117) [118)
Spouse unpaid family -J236 -J084 0056 -J088 0538 -0064 0013 -Jl00 0290 -Jon 0037 -J101 worker [084] [034) 1018] [0361 [1671 10271 [005] [0411 [124] [030] [017) [041]
Head in manuflconstrl -J115 0156 0029 0155 0085 0156 0002 0152 -0527 0149 -JS70 0134 transport [1101 11161 1020] [116J 1071] [117J 10021 11141 1557] [112J [657J- [100J
Head in wholesaleretail -0011 -J060 -0183 -J089 0088 -J076 -0114 -J093 -0426 -J073 -J420 -J083 [013J [048J [167] [070J [O75J 1060] [121] [0741 ]531J [056] [572J [064J
~ ~
U 0gt
raquo
(f)
0
Gl C raquo E 1
~ ~ 0
5shyshy- Head in serviceeducation -0066 0132 -0088 0098 0044 0113 -0114 0092 -0397 0115 -0374 0103 admlother [078] [076] [072] [056] [046] [065] [123] [053] [479] [066] [470] [059]0
Spouse in manuflconstrl 0160 -0394 -0130 -0411 0146 -0419 0109 -0426 -0573 -0412 -0574 -0415 transport [113] [229] [090] [244] [085] [248] [075] [253] [427] [239 [451] [241]
Spouse in wholesaleretail 0002 0098 0092 0109 0140 0114 -0011 0110 -0465 0118 -0467 0123 [003] [116 [116] [128] [165] [136] 017J [129] 688J [138) [780] [144]
Spouse in serviceeducl 0103 -0191 0628 -0186 0309 -0196 0312 -0185 -0256 -0199 -0110 -0187 admlother [141] [169] [644] [163] [279J [173J [349J [162] [302J [174] [153J [164]
Individual owns house 0099 0034 0204 0041 0109 0033 0094 0038 0800 0031 0736 0033 [184] [047] [295] [057] [176] [045] [157] [053] [1609] [042] [1553] 1046]
Head temporary migrant -0307 -0778 -0149 -0754 -0252 -0738 0247 -0744 -0148 -0759 -0047 -0761 [155] [358] [062] [349J [121] [3391 [124] [343] [068] [3541 [024] [357J
Household has access -0029 -0087 0038 -0093 0036 -0094 0017 -0092 0003 -0092 0002 -0090 to electricity [119] [251] [107] [268] [120] [272] 056] [273] [012] [270J [009J [261]
Household has access 0183 -0221 -0244 -0237 -0072 -0211 -0076 -0216 0043 -0216 -0060 -0210 to piped water [233J [193J [239J [207J [066] 1182J [084] [189J [O5St 1187] [O86J [182J Household has toilet -0122 0157 -0236 0134 -0300 0137 -0317 0139 -0178 0157 -0134 0140
[076] [100J [117] [083] [203] [084J [198J [086] [LSI] [096J [114J [086]
Wealth index 0131 -0014 0112 -0004 0148 -0011 0152 -0003 -0099 -0014 -0035 -0015 [361J [0291 [240J [009] 1336] [022] [361] [007] 1261J [O28J [095] [030J
Wealth index squared -0005 0004 -0005 0004 -0011 0004 -0008 0004 -0001 0004 -0006 0004 [145J [100J [116] [085] [281] [091] [212] [084J [025] [O96J [170J [0971
Constant -1696 2159 0202 2158 0117 2194 -0575 2207 0199 2205 0085 2249 [410] [434] [044J [4331 [O26J [439] [139] [441J [052J [441J [024J 1448Jmiddotmiddot
Observations 10671 10671 10671 10671 10671 10671 10671 10671 10671 10671 10671 10671
Source Authors estimates using Nigerias CWIQ 2003 Notes State dummy variables induded in the regressions but not shown in the tables () denotes coefficient statistically significant at 10 level ( ) at 5 level and ( ) significant at 1 level
jgt
0 V1
2gt ~
Oi 01
raquo
406 GENDER DISPARITIES IN AfRICAS LABOR MARKET
References Babalola A and C Dennis 1988 Returns to Womens Labour in Cash Crop producshy
tions Tobacco in Igboho Oyo State Nigeria In Agriculture Women and Land The African Experience ed J Davidson Boulder CO West View Press
Backiny-Yetna P and Q Wodon 2010 Gender Labor Income Shares and Human Capital Investment in the Republic of Congo In Gender Disparities in Africas Labor Market ed J S Arbache A Kolev and E Filipiak Washington DC World Bank
Blackden C M and C Bhanu 1999 Gender Growth and Poverty Reduction Special Program ofAssistance for Africa 1998 Status Report on Poverty World Bank Technical Paper 428 Washington DC World Bank
Bourguignon F and P A Chiappori 1992 Collective Models of Household Behavior An Introduction European Economic Review 36 (2-3) 355-64
Browning M and P A Chiappori 1998 Efficient Intra-Household Allocations A General Characterization and Empirical Tests Econometrica 66 (6) 1241-78
Bussolo M R E De Hoyos and Q Wodon 2009 Higher Prices of Export Crops Intra-Household Inequality and Human Capital Accumulation in Senegal In Gender Aspects of the Trade and Poverty Nexus A Macro-Micro Approach ed M Bussolo and R E De Hoyos Washington DC World Bank and Palgrave Macmillan
Chukwuezi B 1999 De-agrarianization and Rural Employment in South Eastern Nigeria Working Paper 37 African Studies Centre University of Leiden the Netherlands
Hoddinott J and L Haddad 1995 Does Female Income Share Influence Household Expenditures Evidence from C6te dIvoire Oxford Bulletin of Economics and Statisshytics 57 (1) 77-96
lloyd C B and A K Blanc 1996 Childrens Schooling in Sub-Saharan Africa The Role of Fathers Mothers and Others Population and Development Review 22 (2) 265-98
Manser M and M Brown 1980 Marriage and Household Decision Making A Bargaining Analysis International Economic Review 21 (1) 31-34
McElroy M B and M J Homey 1981 Nash-bargained Household Decisions Toward a Generalization of the Theory of Demand International Economic Review 22 (2) 333-49
Piesse J and J Simister 2003 Bargaining and Household Dynamics The Impact of Education and Financial Control on Nutrition Outcomes in South Africa South African Journal ofEconomics 71 (1) 163-72
World Bank 2004 Nigeria Poverty and Vulnerability-A Preliminary Diagnostic Unpublished manuscript Human Development Department Africa Region World Bank Washington DC
--- 2005 Uganda From Periphery to Center A Strategic Country Gender Assessment Poverty Reduction and Economic Management Africa Region World Bank Washington DC
GDALM_381-406indd 406 29106110 11 55 AM I
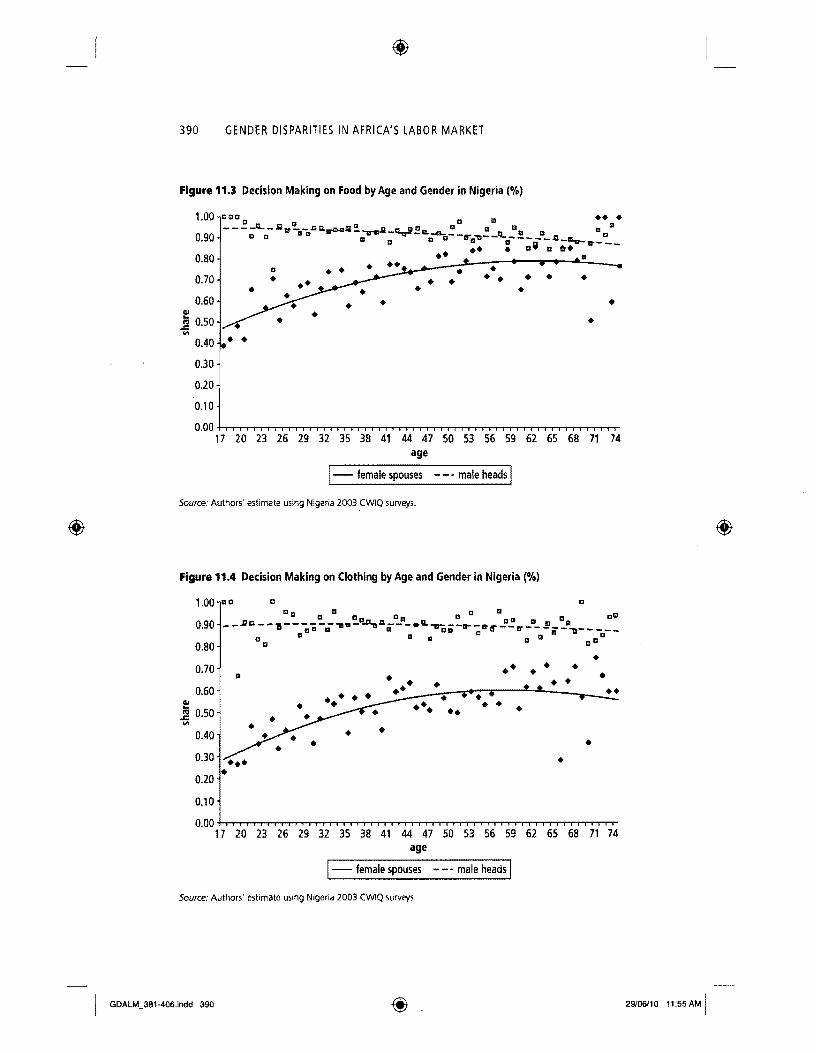
bull bull bull bull bull bull
bull bull bull
bull bull bullbull bull bull bull bull bull bullbull bull bull bullbull bull
bull
390 GENDER DISPARITIES IN AFRICAS LABOR MARKET
070
060 J1 050 II
040
Figure 113 Decision Making on Food by Age and Gender in Nigeria ()
100 aaa abullbull --JL-IItr_cIlJI 11_- liIa lL a III II II
cam m -- -r - 0 - -r ___IL II ftO 90 bull iii a a IIIW 11------- - __
bullbull bull a bullbull 080 bullbull
bull bull
bull
030
020
010
000 +-rITIITTn-TTTTTTT1IT1-TTTTT1r-r-TITlnITlTTT 17 20 23 26 29 32 35 38 41 44 47 50 53 56 59 62 65 68 71 74
age
- female spouses
Source Authors estimate using Nigeria 2003 CWlQ surveys
Figure 114 Decision Making on Clothing by Age and Gender in Nigeria ()
100
090
080
070
060
J1 050 II
040
030
020
010
ClI C a 13 a ell DcaIII III 13 a cO
_-Jl --------- -PaIIL--- 1OL1III--CI_ __ II II iii II II a II tr II - - - i - - - - - _
c bull II II 11 II
III --~bull--~bull~~--~~----~--~~ bull
bull
000 +-rr-r-Tr-r-rTTTTIrTTMMM---TTT 17 20 23 26 29 32 35 38 41 44 47 50 53 56 59 62 65 68 71 74
age
1- female spouses - _ male heads 1 Source Authors estimate using Nigeria 2003 CWIQ surveys
GDALM_381-406indd 390 29106110 11 55 AM Iltit
bull
bull
bull bullbull
bull bullbull bull bull bull
bull bull bull bull
bullbull bull bull bull bull bull bull bull bull bull bullbull bull bull bullbull bull bull bull bull bull bull bullbull bull bull bull bull
INCOME GENERATION AND INTRA-HOUSEHOLD DECISION MAKING 391
Figure 115 Decision Making on Shelter by Age and Gender in Nigeria ()
100 poundI
090 poundI
080 m
poundI m D m 11070 II CJ poundI II a iii II 11____B ___ _____ D m DDar-_IIa ______
CI II II pound111 a III 11m 13 -------- _____~a 060 cDc a Jm 0
IIl] 050 III bullbull bull II
040
030 bullbull 020
010
000 +--rr-rr---TT-r-r-r-rrr-rshy17 20 23 26 29 32 35 38 41 44 47 50 53 56 59 62 65 68 71 74
age
1- female spouses - _ male heads I Source Authors estimate using Nigeria 2003 CWlQ surveys
Figure 116 Decision Making on Sale of Farm Crop by Age and Gender in Nigeria ()
100
090
080
070
060 ltII shyltII 050s III
040
030
020
010
nil
- __LD II III II II II m aa a II
II --~--~~-r~~-~~a~_~~~-~~-~---a~--~ CI a II a a m c D D a
II
bull bull
bull bull 000 +r---rr---rrTTTI-rT--rT-rlTT--r---r--rrTT--r--
17 20 23 26 29 32 35 38 41 44 47 50 53 56 59 62 65 68 71 74 age
1- female spouses - - - male heads I Source Authors estimate using Nigeria 2003 CWlQ surveys
GDALM_381-406indd 391 2906110 1155 AM I
bullbull bull bull bullbull bull bull
bull bullbullbull bull bull bull bullbull bull bull bull bull
bull bull
bull bull bull bull bull bull
392 GENDER DISPARITIES IN AFRICAS lABOR MARKET
Figure 117 Decision Making on Land Use by Age and Gender in Nigeria ()
100
090
080
070
060 bull CII III
bull III 050
pound VI
040
030
020
010
000 +rrrrTTTT1r-rTTTTT1r-r-TTTTTlrrTTTTTlrrTTT
17 20 23 26 29 32 35 38 41 44 47 50 53 56 59 62 65 68 71 74 age
1- female spouses - _ male heads 1 Source Authors estimate using Nigeria 2003 CWlQ surveys
Figure 118 Main Contributor of Income in the Household by Age and Gender in Nigeria ()
100
095
090
VI 085 -s III CII
- 080 III
pound VI 075
070
065
am 11111 025
020
015
010
bull
bull bullbullbull bullbull 005
000 +-+--------r----------------+-+--4t+-+ 000 o 10 20 30 40 50 60
CII
= 0 Q
CIIu pound
age
Source Authors estimate using Nigeria 2003 CWIQ surveys
GDALM_381-406indd 392 2906110 1155 AM I
INCOME GENERATION AND INTRA-HOUSEHOLD DECISION MAKING 393
of men as the main provider of household income on the contrary decreases significantly after they have reached age 65 The econometric analysis in the next section provides a better assessment of the correlates of decision making and income generation
Econometric Analysis
In this section a simple empirical model is developed to quantify how much income contribution by women affects their participation in household decishysion making The analysis assumes that decision making and income conshytribution are jointly distributed outcomes which means that both outcomes are decided jointly by household members rather than sequentially That is the decision to contribute may be influenced by the decision-making power acquired in doing so and similarly the decision-making power depends on the ability to contribute (both outcomes depend on each other) We estimate for men and women separately the likelihood of decision making conditional on their contribution to the household expenditures controlling for other observable individual and household characteristics that also may influence decision making and the probability that individuals contribute income to the household
The determinants of income contribution and decision making are analyzed using a bivariate probit model The need to rely on pro bits comes from the fact that dichotomic variables are observed as outcomes (that is we observe only whether the household head or spouse contributes or not and decides or not) Rather than estimating two probit regressions we estimate the correlates of both outcomes together because this enables us to assess the impact of one outcome on the other In addition bivariate probits generate efficiency gains in the estimation precisely because they take into account the correlation between the error terms of the two regressions for contribution and decision making respectively The estimation procedure enables us to compute the probability of participating in the household decision making conditional on whether the individual contributes to household income or not
Denoting by D and C the latent and unobserved continuous decision and contribution variables by D and C their categorical observed counterparts and by X the vector of independent exogenous variables the bivariate probit model is expressed as
D =f3X +eD D = 1 if D+ gt 0 D = 0 otherwise
CO =f3~ X +ec C =1 if CO gt 0 C =0otherwise (1Ll)
E[eDJ=E[ecl=O Var[eD ] = Var[ec1 =1 COV[eDe] = P
I GDALM_381-406ndd 393 2906110 1155 AM I
394 GENDER DISPARITIES IN AFRICAS LABOR MARKET
The impact of contributing income on the probability of making a decision on a particular issue is computed as the difference in the two conditional probshyabilities of making a decision
amp=P(D=lIC 1X)-P(D=1IC OX) (112)
The set of exogenous variables X are age of the individual household size religion of the household (proxied by the type of household marriage that is whether Customary Islamic Christian or another type of marriage) education of the individual (no education at all incompletecomplete primary incom~ pletecomplete secondary or tertiary education) a number of employmentshyrelated variables for the individual (employment status whether employed unemployed or out of the labor force type of employment whether wage earner self-employed unpaid family worker or firm owner sector of employshyment whether agriculture manufacturing-construction-transport wholesaleshyretail public administration or services) and several other variables such as whether the household owns a house has access to electricity water and sanitashytion whether the household head is a temporary migrant and regional dumshymies to control for geographic effects
The detailed results from the estimations are provided in the annex We focus here on the estimates of the impact of income contributions to decision making using the method outline in equation 112 The results are provided in table 113 When they are the main contributor of income women win substantial decision-making power and thus playa more active role of leadshyership in the household The differences in decision power brought about by contributing income are largest for food shelter and health where income contributions increase the probability of decision making by approximately 20 percentage points
For example in the case of expenditures for health the predicted probabilshyity that women participate in the decision making is 43 percent when they do not contribute income and this increases to 64 percent when they contribute income For men the corresponding reduction in the probability of making decisions for expenditures on health decreases by 18 percent when they do not contribute to the households income However even when they contribute to cover most ofa households income the probability that women will make decishysions regarding the use of productive assets such as land and the commercial use of agricultural output remains low To some extent this same result is also observed with education
An additional finding is that income contribution increases the level of decision making among poor women more than among non-poor women for health food and clothing These results are provided in table 114 Yet for
GDALM_381-406indd 394 2906110 1155 AM I
INCOME GENERATION AND INTRA-HOUSEHOLD DECISION MAKING 395
Table 113 Impact of Income Contribution on Decision Making by Gender in Nigeria
Men Women
Standard Standard Probability deviation Probability deviation
Education
Decides if contributes 053 030 039 029
Decides if does not contribute 036 029 023 025
Difference -017 008 -016 009
Health
Decides if contributes 094 007 064 020
Decides if does not contribute 076 015 043 024
Difference -018 009 --021 008
Food
Decides if contributes 094 006 083 014
Decides if does not contribute 082 012 060 025
Difference --012 007 -022 013
Clothing
Decides if contributes 089 007 058 024
Decides if does not contribute 069 012 043 027
Difference --020 006 -015 005
Shelter
Decides if contributes 088 008 034 020
Decides if does not contribute 077 012 016 015
Difference --0 004 -019 008
Land use
Decides if contributes 077 023 027 025
Decides if does not contribute 066 026 016 020
Difference --011 005 -01 007
Sell agricultural output
Decides if contributes 065 025 026 030
Decides if does not contribute 051 025 021 027
Difference --015 004 -005 004
Source Authors estimates using NigeriaS CWlQ 2003 Notes Estimates based on sample of 10702 men (household heads) and 13260 women (spouses) differences in size of both samples are due to missing variables
decisions involving household productive assets such as land use crop sales and shelter contributing income increases the level of decision making among non-poor women more than among poor women
GDALM_381-406indd 395 2910610 11 55 AM I
396 GENDER DISPARITIES IN AFRICAS LABOR MARKET
Table 114 Impact of Income Contribution on Decision Making by Gender and Poverty Status in Nigeria
Men Women
Non-Poor Poor Non-poor Poor
Standard Standard Standard Standard Probability deviation Probability deviation Probability deviation Probability deviation
Education
Decides if contributes 072 024 037 025 059 026 023 020
Decides if does not contribute 054 028 020 021 038 026 010 015
Difference -018 OOS -l17 008 -l21 OOS -013 008
Health
Decides if contributes 096 005 092 OOS 075 018 055 018
Decides if does not contribute 0S1 013 073 016 055 024 033 019
Difference -l15 OOS -020 009 -l20 008 -023 00]
Food Decides if contributes 093 006 095 006 0S9 012 077 014
Decides if does not contribute OSO 011 0S4 011 072 024 051 022
Difference -l13 007 -l11 006 -l17 013 -l26 012
Clothing Decides if contributes 091 006 087 007 072 021 047 019
Decides if does not contribute 073 011 066 011 058 025 031 021
Difference -llS 006 -021 005 -l14 006 -l16 005
Shelter Decides if contributes 089 007 087 OOS 045 020 025 014
Decides if does not contribute 078 011 075 012 023 017 009 009
Difference -011 004 -l12 004 -l21 0D7 -l16 007
Land use Decides if contributes 066 027 086 014 034 024 021 024
Decides if does not contribute 054 029 077 017 021 020 013 019
Difference -012 005 -l09 004 -ln 006 -lO9 006
Sell agricultural output Decides if contributes 054 027 076 018 035 029 019 028
Decides if does not contribute 039 026 061 019 02S 027 015 025
Difference -l15 005 -l15 004 -l07 004 -l04 004
Source Authors estimates using Nigerias CWIQ 2003 Notes Estimates based on sample of 10702tnen (household heads) and 13260 women (spouses) differences in size of both samples are due to missing variables
GDALM_381-406indd 396 29106110 1155AM I
INCOME GENERATION AND INTRA-HOUSEHOLD DECISION MAKING 397
Conclusions
In Nigeria as in other Sub-Saharan countries most of household decisions are made by men who are the de facto household heads Statistical analysis of CWIQ survey data suggests that men tend to have most of the decision-making power regarding the use of productive assets such as land use crop sales and shelter Women participate more often in decisions on expenditures for food heath and education but even in these areas men more often than not remain the main decision makers The decision-making power of women is especially low among poor households in part because in such households the likelishyhood that women will be the main contributor of household income is much lower as well
Simple econometric modeling suggests that as expected when they are the main contributor of income women win substantial decision-making power The differences in decision power brought about by contributing income are as large as 20 percentage points for food shelter and health spending Howshyever the impact is much smaller in relation to the use of productive assets Finally contribution income raises decision making more among poor than non-poor women
Care must be taken not to draw strong policy recommendations from the limited and descriptive analysis in this chapter Yet some broad comments or suggestions can be made This study found that increasing the contribution ability ofwomen to household income leads to higher decision-making power for them within the household This has also been shown by several other authors to lead to higher investments in the human capital of children thereby leading to poverty reduction and higher income growth in the future This result can be used to advocate for policies to increase womens ability to conshytribute to household expenditures including policies raising the human capital of women for example through training and education programs specifically targeting women Facilitating access to land (for example through heritage law reforms or titling mechanisms) or access to credit (for example through microshycredit interventions targeted to women) are all interventions that have proven successful in other countries to promote female entrepreneurship and thereby to increase womens income and bargaining power However a detailed analysis for Nigeria should be conducted before making any specific policy recommenshydation in favor of one type of intervention or another to improve the position of women in the household
GDALM_381-406indd 397 29106110 11 55 AM I
(it
Ggt 0 raquo E I
~ ~ S w Annex Detailed Regression ResultsQ ltDQ
00 Cogt to Table 11A1 Bivariate Probit Regressions for Women in Nigeria
Decide Contrib Decide Contrib Decide Contrib Decide Contrib Decide Contrib Decide Contrib education income health income food income doth income land income crop sales income
Number of infants 0212 -0033 0054 -0033 0042 -ltgt029 0050 -0043 0042 -ltgt038 0087 -ltgt043 under-5 [482] [O42J [159] [043) [US] [036] [140J [054) [098] [048] [193] [055)
Square of number of -ltgt044 -ltgt014 -0013 -ltgt011 -ltgt008 -ltgt013 -ltgt014 -0010 -ltgt004 -ltgt010 -ltgt019 -0009 infants [384) [058) [169] [051] [124) [055) [165] [044] [039) [044) [162] [040]
Number of children 0295 0010 -ltgt012 0029 -0003 0025 0005 0026 0033 0030 -0019 0027 (age 5-14) [793] [018) [058J [048) [015] [0421 [024] ]043] ]112J [049] [064]
of number -ltgt039 -ltgt007 0003 -ltgt011 0002 -ltgt010 0001 -0011 -0001 -ltgt011 0006 -ltgt011 children [5341- [055J [097J [081J [056) [077] [O32J [O80J [0221 [085J [1331 [084]
Number of adults 0189 -0015 -0085 0005 -ltgt101 0010 -0056 -ltgt001 0049 0007 0009 0012(it [544] [O20J [353] [007J [393] [O14J [196) [002) [126J [O10J [024] [015J (it Square of number -0013 -0005 0006 -0007 0006 -ltgt007 0003 -0006 -0005 -ltgt007 -0001 -0007 of adults [396J [057J [303J [081J [284] [085J [109J [075J [136J [081) [039] [087]
Number of elderly 0096 -ltgt023 0055 0003 0145 -ltgt013 -0088 -0028 -0044 -ltgt016 -0012 -ltgt022 (age 65+) [098] [O13J [066] [002] [168) [008] [104] [016] [O42J [009] [010] [O13J
Square of number -0007 -0059 -ltgt058 -0061 -ltgt082 -0058 -0009 -0052 0022 -0053 -0008 -0053 of elderly [016J [074J [159J [080J [220J [O77J [O25J [069J [049J [O72J [0181 [071]
Female-headed -6325 2096 0684 2089 6045 2120 1592 2133 0094 2132 0259 2089 household [1905] [259] [098] 1248J [3109] [263] [272] [265J [015] [257] [043J [253]
Age of household head 0001 0025 -0011 0D25 0005 0023 -0004 0023 -ltgt010 0022 -0038 0025 [010] [123] [099J [120] [045] [115] [033] [112] [070] [110] ]275]
0000 0000 0000 0000 0000 0000 0000 0000 0000 0000 0000 0000 [105J [102J ]103] [088J [094] [046J [095J [102J [088J [278] [104J
Age of spouse 0042 -ltgt003 0028 -0001 0024 0000 0015 -ltgt001 0013 -0001 0032 -0004 [278J [012J [226] [007] [198) [001) [119J [003] [081] [007) [214] [019) ~
~
ij
raquos
(it
0
Gl 0 raquoshy I
Square of age of spouse 0000 0000 0000 0000 0000 0000 0000 0000 0000 0000 0000 0000~ [223] [069] [173] [063] [139] [057] [098J [061J [102] [063] [175] [078J5 CI CI
Head has customary 0073 0177 0166 0187 0228 0155 0110 0185 0018 0188 0088 0189 marriage [088J [129J [196[ [137] [233] [117] [121] [137] [018] [138J [098]
Head has Islamic 0141 0192 0068 0194 0155 0143 0051 0175 -0275 0197 -0208 0202 [129] [102] [068] [103] [141] [079] [049] [094] [231] [106] [176J [108]
Head has Christian 0335 0259 0405 0280 0663 0246 0386 0266 0172 0281 0240 0270 ]340] [168J [410] [181] [554] [163] [378] [174J [162] [183J [235] [1761
Head incomplete 0113 0008 -0086 0006 -0120 0003 -0059 0011 -0005 -0004 -0035 0006 primary education [120] 1005] [103] [005] [US) [002] [070] 1008J 1006] [003J [038] [0051
Head completed 0043 -0256 -0046 -0239 -0003 -0247 0059 -0246 -0081 -0251 0049 -0245 primary education 1064] 1226J [081] [215]-- 1006] 1219]-- [LOS] 1217] [118] [221] [066] [215]
Head incomplete -0050 -0155 -0139 -0129 0207 -0107 0002 -0096 -0232 -0113 -0181 -0118 secondary education 1038] 1087] 1098] 1071] [147] 1057] 1001J 1053] [146] [063] [129] [065]
Head completed 0157 -0320 0055 -0291 -0086 -0267 0029 -0295 -0128 -0290 0043 -0295 secondary education [154] [194] [063] 1176]- [092] [160] [034] [I 77] 1131] 1175] 1036] 11 77]
Head tertiary education 0080 -0171 0013 -0147 0036 -0132 0088 -0142 -0163 -0135 0126 -0139 1079] 1102] [014] [089] [037] [079] [099] [084] 1158] [081] [120] [084]
Spouse incomplete 0108 0336 -0001 0329 0178 0324 0041 0321 0076 0347 -0048 0335 primary education [123] [253] [002] [249] [181] [244] [048] 1242] [081] [261] [050] [253]
Spouse completed 0089 0211 0041 0180 0004 0193 -0055 0175 0172 0210 0086 0201 primary education [120] [181] [063] [156] [006] [164] 1090] [150] [224] [179] [106] [172]
Spouse incomplete 0201 -0108 0007 -0135 0045 -0147 -0021 -0164 0252 -0128 0073 -0143 secondary educ [169] [047] [006] [056] [033] [061] [016] [068] [203] [055] [059] [060]
Spouse completed 0067 0182 -0174 0152 0014 0144 0073 0154 -0070 0154 -0122 0162 secondary educ [064] [108] [182] [089] [013] [083] [076] [088] [065] [088] [103) [093)
0168 0073 -0149 0053 0075 0051 -0007 0051 0029 0079 -0222 0081 [099] [024] [046] [023] [005] [023] 1019] [036] [146] [037]
w 10 Head unemployed 0041 2147 -0208 2105 -0016 2194 -0340 2198 -0067 2193 -0245 2193 10 [019] 1475] [098] 1466] [007] [486] [183] 14811 [0291 [483] [093] [486]
I)
~ continued ~ 0
u raquo
(f)
Gl 0 raquo rshy I
t 00 $ f Q Head in servicel -J043 -J385 -0093 -0370 -0085 -J391 0027 -0403 -J015 -0385 -J228 -0384Q
educationladmlother [051] 1195] [128] [194] [122] [198]-- [036J [2011 1017] [199J [248]-- 1199J51
Spouse in manufconstrl 0185 0438 0075 0408 -0114 0397 0183 0409 -0571 0435 -0739 0424 transport [118] [226J [073] [205]-- [113J [206J [1781- [209J-- [258] [228) 1315] [219J
Spouse in wholesalel 0002 0121 -J069 0124 -J205 0114 0027 0125 -0543 0133 -0525 0127 retail [003] [134] [123J [137] [357] 1126] [049] [138] [891] [147] [848J [140J
Spouse in serviceleducl 0059 0324 0433 0317 -0028 0311 -0037 0304 -0645 0287 -0676 0292 admlother [070] [225]-- [664] [221] [045] [214J [059] [210] [637] [200] [778] [202]
Individual owns house 0365 0395 0319 0375 0851 0389 0462 0367 1204 Q401 1078 0396 [454] [357] [484] [336] [1035] [350] [688] [335] (1651] [364]middot [1295] [364]
Head temporary migrant 0226 1203 0220 1167 -J151 1163 -J120 1175 -J451 1194 -J328 1202 [080] [533] [119] [517] [086J [512] [070J [520] [187] [528]middot [149] [539]
Household has access to 0046 0120 0067 0121 0004 0123 0068 0121 -J014 0121 0032 0122 electricity [205]middotmiddot [324] [319]-- [330]--- [016] [330]--- [333]--- [326] (052] [333]--middot [131] [330]
(f) (f)Household has access to 0077 -0174 -J129 -0166 -0121 -0179 -0011 -0167 -J078 -0164 0017 -0164 piped water [103] [124] [186]- [119] [173] [127] [016] [119] 1081] [117] [017] [117]
Household has toilet -0005 0122 0092 0126 -0021 0155 0047 0129 -0479 0127 -0336 0113 facility
Wealth index 0129 -0043 0022 -J041 -0067 -J033 -0028 -0045 -0019 -0041 -0033 -0038 [382Jmiddotmiddot- [074J [074] 1070J [205J [055J [0911 [077] [052] [070] [086] [065)
Wealth index squared -0008 -0003 -0001 -0003 0005 -J004 0001 -J003 0000 -0003 -JOOl -J003 1275] [050] [041) (058) [165 [074 [048 [053] [014] [063 [042] [064)
Constant -2636 -4279 -J81 0 -4328 0289 -4470 -0446 -4365 -1109 -4415 -0430 -4428 [680] [572]middot bull [256) [577] [092] [571] [147] [563)--- 1308)middot 1573] [116] [569)
Observations 13225 13225 13225 13225 13225 13225 13209 13209 13209 13209 13209 13209
Source Authors estimates using Nigerias CWlQ 2003 Notes State dummy variables induded in the regressions but not shown in the tables () denotes coefficient statistically significant at 10 level () at 5 level and ( ) significant
jgt at 1 level 0
I) ltDc
0 ~
-(j raquo
(f)
G) 0 raquo rshy ~ ilojCl Cl
jgt
0 -
Table 11A2 Bivariate Probit Regressions for Men in Nigeria
Decide Contrib Decide Contrib Decide Contrib Decide Contrib Decide Contrib Decide Contrib 1G education income health income food income cloth income land use income sales income
Number of infants 0232 0033 0016 0033 -0079 0033 0029 0038 0089 0036 0037 0038 under-S [54S] [076] [040] [074] [202] [074] [0771 [085J [25SJ [0811 [122J [0861
Square of number of -0029 -0003 -0009 -0004 0001 -0004 -0008 -0005 -0014 -0005 -0005 -OOOS infants [279] [053J [130J [0S7] [013J [061] [105J [067J [179] [069] [084] 1069]
Number of children 0564 0035 0079 0033 0041 0033 0052 0034 0055 0031 0015 0031 (age 5-14) 11704J [086J [202] [087] 110SJ 1088J [168) [090) [171] [083) [055] [082]
Square of number -0070 -0004 -0008 -0004 0000 -0004 -0004 -0004 -0002 -0004 0000 -0004 of children [1044] [045] [118] [061] [001] [059J [079] [060J [028J [056] [002J [0S6]
Number of adults 0222 -0116 -0052 -0106 -0106 -0113 -0037 -0110 0095 -0116 0045 -0116 [668) [225) [100) [215) [200] [222J [107) [220] [261] [2261 [136] [2261
Square of number -0012 0010 0007 0009 0010 0010 0001 0010 -0005 0011 -0001 0011 of adults [364] [186) [132] [1791 [179] [190] 1030] [186J [154] [192) [026) [193]shy
Number of elderly 0116 -0135 0217 -0147 -0048 -0145 0180 -0119 0035 -0143 -0130 -0135 (age 6S+) [108] [106J [146] [US] [036] [111J [156] [092J [029] [109] [124] [104J Square of number -0030 0019 -0071 0030 -0008 0034 -0057 0022 0015 0026 0058 0024 of elderly [057J [036) [113] [056) [014) [061] [110J [040] [028] [047] [119) [0441
Female-headed -7759 -1265 -0711 -1213 -1452 -1195 -1369 -1224 -0625 -1277 -0289 -1250 household [2690] [174)- [106) [163] [218J [163) [180J- [158J [084J [168] [038) ]164)
Age of household head 0014 Om5 0047 0Q18 0012 0016 0026 0016 0004 0019 0012 0018 [111) [0841 [307) [1001 [081[ [093] [191) [090J [031] [108) [092J [1061
Square of age of 0000 0000 -0001 0000 0000 0000 0000 0000 0000 0000 0000 0000 household head [1311 [149J [376] [165) [1421 [156] [272]- [1561 [061] [1721- [121] [1691shy
Age of spouse 0022 0029 -0031 0025 0000 0028 0008 0027 0014 0025 0006 0025 [1561 [152) [186)- [1331 [001) [1471 [0511 [144] [098] [129] [0441 [132J
Square of age of spouse 0000 0000 0000 0000 0000 0000 0000 0000 0000 0000 0000 0000 [124J [211) [168]- [196]-- [025] [214] [038] [208]- [US] [1921- [068J [1961shy
I) ltD a ~
u raquo
0
(fJ
Gl 0 raquo rshy ~ en ~r Cl Cl Head has customary 0316 -0343 -0152 -0378 0100 -0376 0024 -0373 0089 -0356 -0031 -0358 jgt marriage [307] [266] [100] [288] [086] [283J [022] [289] [090J [277J [034] [276]8
Head has Islamic marriage 0403 -0154 -0178 -0182 -0254 -0185 -0080 -0178 -0150 -0168 -0210 -0160 [319] [094J [116] [108J [192J [111J [066J 1107] 1131J 1102J 1201J 1095J
Head has Christian 0436 -0481 -0112 -0509 0150 -0503 -0048 -0517 0062 -0498 0089 -0490 1361] [331] [066] [350J [114J [340] [038] 1358] [057] [346] [089] [339J
primary 0254 -0006 0249 -0012 0163 -0013 -0010 -OQ15 0211 -0006 0114 -0006 education 1242] 1005J 1144] [010] [140J [010J 101 OJ 1012] 1178J 1005J [119J [005]
Head completed primary 0320 0310 0093 0300 0193 0311 0127 0286 0176 0309 0124 0314 education 1475] [321] [110] [310J 1228J [319J [159J [301] [246] [316] [194] [320]
Head incomplete 0226 0077 0015 0053 0115 0074 0108 0043 0147 0Q75 0093 0078 secondary education [149] [028] [009] [020] 1069] [027] [074] [016] [109] [027] [079] [028]
Head completed 0355 0063 0136 0102 0183 0081 -0029 0076 0061 0076 0197 0088 secondary education [363] [045J [1051 [073] [149] [0571 [024] [054] [065] [054J [225] [062]
(fJ Head tertiarv education 0430 0085 0172 0109 0220 0118 0128 0081 0083 0113 0228 0119 (fJ [369] [063] [113) [081J [167] [088] [102J 1060] 1082] [084] 1237J 1088]
Spouse incomplete 0163 -0208 -0051 -0202 -0326 -0240 0123 -0212 -0048 -0234 -0232 -0239 primary education [154] [172J [030J [166J [2851 [197J [101] [176J [041] [192] 1238J [195]
Spouse completed primary 0148 -0072 -0004 -0102 -0153 -0106 0060 -0089 0097 -0094 0045 -0099 education [188] [062] [004] [089] [164] [092] [0661 [0791 [UO[ [081] 1064) [085]
Spouse incomplete 0345 -0146 -0281 -0111 -0284 -0127 -0056 -0105 -0004 -0132 -0081 -0132 secondary educ [224J [070J [155] [056J [190] [061] [0381 1053] [003] [065] [070] [065]
Spouse completed 0082 0071 -0067 0071 -0216 0046 -0036 0068 -0210 0050 -0298 0049 secondary educ [072] [048] [045] [048] [156] [031] [026] [0471 ]197] [034] [302] ]034]
Spouse tertiary education 0095 0220 0212 0188 -0088 0164 0073 0215 -0001 0182 -0220 0171 [052] [115] ]084] [099] [047] ]085] [042] [111] [001] [094] 1156] 1089]
Head unemployed -0499 -1492 -0541 -1455 -0312 -1507 -0051 -1455 -0160 -1502 -0141 -1507 gt [230] [479] [200] [472] [121] 1488] 1018J [463J 1071] 1481] [069] ]480] 0 w
continued CD co Ilt 0
en raquo
(fJ
(f)
Cl 0 raquo r 0 I
t txgt
0 CD
~~ 0- 0 Table 11A2 Bivariate Probit Regressions for Men in Nigeria continued ~
Decide Contrib Decide Contrib Decide Contrib Decide Contrib Decide Contrib Decide Contrib~ education income health income food income cloth income land use income crop sales income
Head not in labor force -J618 -1525 -J858 -1479 -J428 -1522 -J443 -1481 -J358 -1520 -J200 -1509 [3341 [5331 [366] [525] [191[ [S40J [181] 517] 1187] [531]- [119) 526]
Head in public or -J063 -J186 0136 -0173 -J201 -0157 -J401 -J169 -J099 -J175 -J270 -J162 parastatal sector [0351 [097] [057] [090] [101[ [081] [239] 1089] [081] 1092J [206] 1085]
Head wage earner -J075 -J043 -J452 -0062 0061 -J1 02 0297 -J062 0041 -J083 0188 -J094 1035] 1014] 1144] [021] [023 [ [035J 11111 10211 1021] [028] [1011 [031]
Head self employed -J423 -J138 -J277 -0129 0177 -0154 -J025 -J143 -0100 -J151 -0069 -J161 [2621 [055] [137] 10521 [0891 [062] [011] [056] [058] [059] [047] 1062]
Head unpaid family -J518 -J486 -0602 -J484 0241 -J503 -J139 -J493 -J177 -J494 -J089 -J503 worker [295] [181] [283] [183] 1107] [190] [056] 1184] [092] [182] [0541 [184]
Spouse unemployed -J160 0589 -JOO7 0598 0270 0619 -J150 0564 0067 0627 -J140 0575(f) (f)[0521 [204] [002] [210] [0791 [218Jmiddot- [051J [1981- [0261 [220) [060J [201Jmiddotmiddot
Spouse not in labor force -J112 0431 0200 0415 0568 0456 0293 0399 0271 0440 -J014 0395 [039J [163) [063J [1611 [177]- [175] [111] 1152J 1113) [168Jmiddot [006J 1150]
Spouse in public or -0217 0069 -J501 0036 0273 0072 -0397 0041 -J142 0053 0161 0062 parastatal sector [086] 1030] [166]- [016] [108] ]0311 [172[ [018] [O63J [O23J [O83J [O27J
Spouse wage earner -0322 -J802 0059 -J754 0093 -J746 0256 -J775 0166 -0757 -J245 -0808 [095] [256) [O15J [242] [026) [239 [083 [245 [055] [245) 1089) 261J
self employed -J160 -J251 0517 -J255 0468 -J238 0363 -J268 0273 -J251 0248 -J287 [057J [103] [168) [107[ [148] [099] 1144) [111] 1118] [104) [117) [118)
Spouse unpaid family -J236 -J084 0056 -J088 0538 -0064 0013 -Jl00 0290 -Jon 0037 -J101 worker [084] [034) 1018] [0361 [1671 10271 [005] [0411 [124] [030] [017) [041]
Head in manuflconstrl -J115 0156 0029 0155 0085 0156 0002 0152 -0527 0149 -JS70 0134 transport [1101 11161 1020] [116J 1071] [117J 10021 11141 1557] [112J [657J- [100J
Head in wholesaleretail -0011 -J060 -0183 -J089 0088 -J076 -0114 -J093 -0426 -J073 -J420 -J083 [013J [048J [167] [070J [O75J 1060] [121] [0741 ]531J [056] [572J [064J
~ ~
U 0gt
raquo
(f)
0
Gl C raquo E 1
~ ~ 0
5shyshy- Head in serviceeducation -0066 0132 -0088 0098 0044 0113 -0114 0092 -0397 0115 -0374 0103 admlother [078] [076] [072] [056] [046] [065] [123] [053] [479] [066] [470] [059]0
Spouse in manuflconstrl 0160 -0394 -0130 -0411 0146 -0419 0109 -0426 -0573 -0412 -0574 -0415 transport [113] [229] [090] [244] [085] [248] [075] [253] [427] [239 [451] [241]
Spouse in wholesaleretail 0002 0098 0092 0109 0140 0114 -0011 0110 -0465 0118 -0467 0123 [003] [116 [116] [128] [165] [136] 017J [129] 688J [138) [780] [144]
Spouse in serviceeducl 0103 -0191 0628 -0186 0309 -0196 0312 -0185 -0256 -0199 -0110 -0187 admlother [141] [169] [644] [163] [279J [173J [349J [162] [302J [174] [153J [164]
Individual owns house 0099 0034 0204 0041 0109 0033 0094 0038 0800 0031 0736 0033 [184] [047] [295] [057] [176] [045] [157] [053] [1609] [042] [1553] 1046]
Head temporary migrant -0307 -0778 -0149 -0754 -0252 -0738 0247 -0744 -0148 -0759 -0047 -0761 [155] [358] [062] [349J [121] [3391 [124] [343] [068] [3541 [024] [357J
Household has access -0029 -0087 0038 -0093 0036 -0094 0017 -0092 0003 -0092 0002 -0090 to electricity [119] [251] [107] [268] [120] [272] 056] [273] [012] [270J [009J [261]
Household has access 0183 -0221 -0244 -0237 -0072 -0211 -0076 -0216 0043 -0216 -0060 -0210 to piped water [233J [193J [239J [207J [066] 1182J [084] [189J [O5St 1187] [O86J [182J Household has toilet -0122 0157 -0236 0134 -0300 0137 -0317 0139 -0178 0157 -0134 0140
[076] [100J [117] [083] [203] [084J [198J [086] [LSI] [096J [114J [086]
Wealth index 0131 -0014 0112 -0004 0148 -0011 0152 -0003 -0099 -0014 -0035 -0015 [361J [0291 [240J [009] 1336] [022] [361] [007] 1261J [O28J [095] [030J
Wealth index squared -0005 0004 -0005 0004 -0011 0004 -0008 0004 -0001 0004 -0006 0004 [145J [100J [116] [085] [281] [091] [212] [084J [025] [O96J [170J [0971
Constant -1696 2159 0202 2158 0117 2194 -0575 2207 0199 2205 0085 2249 [410] [434] [044J [4331 [O26J [439] [139] [441J [052J [441J [024J 1448Jmiddotmiddot
Observations 10671 10671 10671 10671 10671 10671 10671 10671 10671 10671 10671 10671
Source Authors estimates using Nigerias CWIQ 2003 Notes State dummy variables induded in the regressions but not shown in the tables () denotes coefficient statistically significant at 10 level ( ) at 5 level and ( ) significant at 1 level
jgt
0 V1
2gt ~
Oi 01
raquo
406 GENDER DISPARITIES IN AfRICAS LABOR MARKET
References Babalola A and C Dennis 1988 Returns to Womens Labour in Cash Crop producshy
tions Tobacco in Igboho Oyo State Nigeria In Agriculture Women and Land The African Experience ed J Davidson Boulder CO West View Press
Backiny-Yetna P and Q Wodon 2010 Gender Labor Income Shares and Human Capital Investment in the Republic of Congo In Gender Disparities in Africas Labor Market ed J S Arbache A Kolev and E Filipiak Washington DC World Bank
Blackden C M and C Bhanu 1999 Gender Growth and Poverty Reduction Special Program ofAssistance for Africa 1998 Status Report on Poverty World Bank Technical Paper 428 Washington DC World Bank
Bourguignon F and P A Chiappori 1992 Collective Models of Household Behavior An Introduction European Economic Review 36 (2-3) 355-64
Browning M and P A Chiappori 1998 Efficient Intra-Household Allocations A General Characterization and Empirical Tests Econometrica 66 (6) 1241-78
Bussolo M R E De Hoyos and Q Wodon 2009 Higher Prices of Export Crops Intra-Household Inequality and Human Capital Accumulation in Senegal In Gender Aspects of the Trade and Poverty Nexus A Macro-Micro Approach ed M Bussolo and R E De Hoyos Washington DC World Bank and Palgrave Macmillan
Chukwuezi B 1999 De-agrarianization and Rural Employment in South Eastern Nigeria Working Paper 37 African Studies Centre University of Leiden the Netherlands
Hoddinott J and L Haddad 1995 Does Female Income Share Influence Household Expenditures Evidence from C6te dIvoire Oxford Bulletin of Economics and Statisshytics 57 (1) 77-96
lloyd C B and A K Blanc 1996 Childrens Schooling in Sub-Saharan Africa The Role of Fathers Mothers and Others Population and Development Review 22 (2) 265-98
Manser M and M Brown 1980 Marriage and Household Decision Making A Bargaining Analysis International Economic Review 21 (1) 31-34
McElroy M B and M J Homey 1981 Nash-bargained Household Decisions Toward a Generalization of the Theory of Demand International Economic Review 22 (2) 333-49
Piesse J and J Simister 2003 Bargaining and Household Dynamics The Impact of Education and Financial Control on Nutrition Outcomes in South Africa South African Journal ofEconomics 71 (1) 163-72
World Bank 2004 Nigeria Poverty and Vulnerability-A Preliminary Diagnostic Unpublished manuscript Human Development Department Africa Region World Bank Washington DC
--- 2005 Uganda From Periphery to Center A Strategic Country Gender Assessment Poverty Reduction and Economic Management Africa Region World Bank Washington DC
GDALM_381-406indd 406 29106110 11 55 AM I
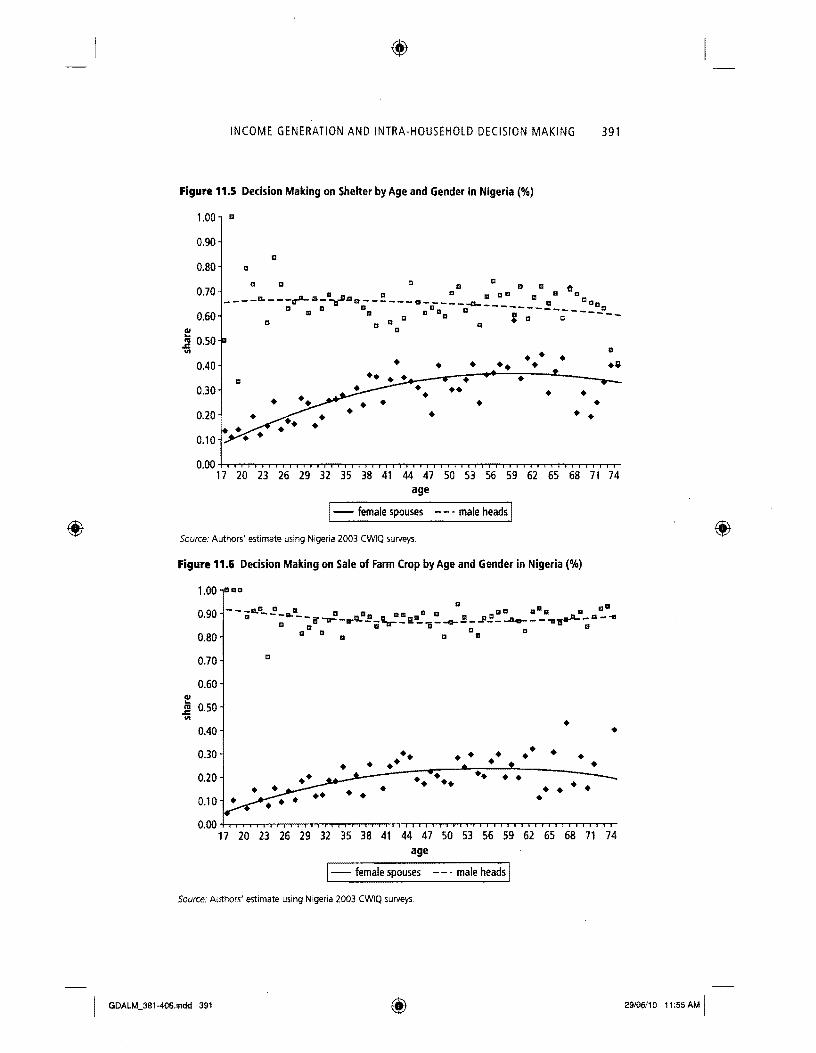
bull
bull
bull bullbull
bull bullbull bull bull bull
bull bull bull bull
bullbull bull bull bull bull bull bull bull bull bull bullbull bull bull bullbull bull bull bull bull bull bull bullbull bull bull bull bull
INCOME GENERATION AND INTRA-HOUSEHOLD DECISION MAKING 391
Figure 115 Decision Making on Shelter by Age and Gender in Nigeria ()
100 poundI
090 poundI
080 m
poundI m D m 11070 II CJ poundI II a iii II 11____B ___ _____ D m DDar-_IIa ______
CI II II pound111 a III 11m 13 -------- _____~a 060 cDc a Jm 0
IIl] 050 III bullbull bull II
040
030 bullbull 020
010
000 +--rr-rr---TT-r-r-r-rrr-rshy17 20 23 26 29 32 35 38 41 44 47 50 53 56 59 62 65 68 71 74
age
1- female spouses - _ male heads I Source Authors estimate using Nigeria 2003 CWlQ surveys
Figure 116 Decision Making on Sale of Farm Crop by Age and Gender in Nigeria ()
100
090
080
070
060 ltII shyltII 050s III
040
030
020
010
nil
- __LD II III II II II m aa a II
II --~--~~-r~~-~~a~_~~~-~~-~---a~--~ CI a II a a m c D D a
II
bull bull
bull bull 000 +r---rr---rrTTTI-rT--rT-rlTT--r---r--rrTT--r--
17 20 23 26 29 32 35 38 41 44 47 50 53 56 59 62 65 68 71 74 age
1- female spouses - - - male heads I Source Authors estimate using Nigeria 2003 CWlQ surveys
GDALM_381-406indd 391 2906110 1155 AM I
bullbull bull bull bullbull bull bull
bull bullbullbull bull bull bull bullbull bull bull bull bull
bull bull
bull bull bull bull bull bull
392 GENDER DISPARITIES IN AFRICAS lABOR MARKET
Figure 117 Decision Making on Land Use by Age and Gender in Nigeria ()
100
090
080
070
060 bull CII III
bull III 050
pound VI
040
030
020
010
000 +rrrrTTTT1r-rTTTTT1r-r-TTTTTlrrTTTTTlrrTTT
17 20 23 26 29 32 35 38 41 44 47 50 53 56 59 62 65 68 71 74 age
1- female spouses - _ male heads 1 Source Authors estimate using Nigeria 2003 CWlQ surveys
Figure 118 Main Contributor of Income in the Household by Age and Gender in Nigeria ()
100
095
090
VI 085 -s III CII
- 080 III
pound VI 075
070
065
am 11111 025
020
015
010
bull
bull bullbullbull bullbull 005
000 +-+--------r----------------+-+--4t+-+ 000 o 10 20 30 40 50 60
CII
= 0 Q
CIIu pound
age
Source Authors estimate using Nigeria 2003 CWIQ surveys
GDALM_381-406indd 392 2906110 1155 AM I
INCOME GENERATION AND INTRA-HOUSEHOLD DECISION MAKING 393
of men as the main provider of household income on the contrary decreases significantly after they have reached age 65 The econometric analysis in the next section provides a better assessment of the correlates of decision making and income generation
Econometric Analysis
In this section a simple empirical model is developed to quantify how much income contribution by women affects their participation in household decishysion making The analysis assumes that decision making and income conshytribution are jointly distributed outcomes which means that both outcomes are decided jointly by household members rather than sequentially That is the decision to contribute may be influenced by the decision-making power acquired in doing so and similarly the decision-making power depends on the ability to contribute (both outcomes depend on each other) We estimate for men and women separately the likelihood of decision making conditional on their contribution to the household expenditures controlling for other observable individual and household characteristics that also may influence decision making and the probability that individuals contribute income to the household
The determinants of income contribution and decision making are analyzed using a bivariate probit model The need to rely on pro bits comes from the fact that dichotomic variables are observed as outcomes (that is we observe only whether the household head or spouse contributes or not and decides or not) Rather than estimating two probit regressions we estimate the correlates of both outcomes together because this enables us to assess the impact of one outcome on the other In addition bivariate probits generate efficiency gains in the estimation precisely because they take into account the correlation between the error terms of the two regressions for contribution and decision making respectively The estimation procedure enables us to compute the probability of participating in the household decision making conditional on whether the individual contributes to household income or not
Denoting by D and C the latent and unobserved continuous decision and contribution variables by D and C their categorical observed counterparts and by X the vector of independent exogenous variables the bivariate probit model is expressed as
D =f3X +eD D = 1 if D+ gt 0 D = 0 otherwise
CO =f3~ X +ec C =1 if CO gt 0 C =0otherwise (1Ll)
E[eDJ=E[ecl=O Var[eD ] = Var[ec1 =1 COV[eDe] = P
I GDALM_381-406ndd 393 2906110 1155 AM I
394 GENDER DISPARITIES IN AFRICAS LABOR MARKET
The impact of contributing income on the probability of making a decision on a particular issue is computed as the difference in the two conditional probshyabilities of making a decision
amp=P(D=lIC 1X)-P(D=1IC OX) (112)
The set of exogenous variables X are age of the individual household size religion of the household (proxied by the type of household marriage that is whether Customary Islamic Christian or another type of marriage) education of the individual (no education at all incompletecomplete primary incom~ pletecomplete secondary or tertiary education) a number of employmentshyrelated variables for the individual (employment status whether employed unemployed or out of the labor force type of employment whether wage earner self-employed unpaid family worker or firm owner sector of employshyment whether agriculture manufacturing-construction-transport wholesaleshyretail public administration or services) and several other variables such as whether the household owns a house has access to electricity water and sanitashytion whether the household head is a temporary migrant and regional dumshymies to control for geographic effects
The detailed results from the estimations are provided in the annex We focus here on the estimates of the impact of income contributions to decision making using the method outline in equation 112 The results are provided in table 113 When they are the main contributor of income women win substantial decision-making power and thus playa more active role of leadshyership in the household The differences in decision power brought about by contributing income are largest for food shelter and health where income contributions increase the probability of decision making by approximately 20 percentage points
For example in the case of expenditures for health the predicted probabilshyity that women participate in the decision making is 43 percent when they do not contribute income and this increases to 64 percent when they contribute income For men the corresponding reduction in the probability of making decisions for expenditures on health decreases by 18 percent when they do not contribute to the households income However even when they contribute to cover most ofa households income the probability that women will make decishysions regarding the use of productive assets such as land and the commercial use of agricultural output remains low To some extent this same result is also observed with education
An additional finding is that income contribution increases the level of decision making among poor women more than among non-poor women for health food and clothing These results are provided in table 114 Yet for
GDALM_381-406indd 394 2906110 1155 AM I
INCOME GENERATION AND INTRA-HOUSEHOLD DECISION MAKING 395
Table 113 Impact of Income Contribution on Decision Making by Gender in Nigeria
Men Women
Standard Standard Probability deviation Probability deviation
Education
Decides if contributes 053 030 039 029
Decides if does not contribute 036 029 023 025
Difference -017 008 -016 009
Health
Decides if contributes 094 007 064 020
Decides if does not contribute 076 015 043 024
Difference -018 009 --021 008
Food
Decides if contributes 094 006 083 014
Decides if does not contribute 082 012 060 025
Difference --012 007 -022 013
Clothing
Decides if contributes 089 007 058 024
Decides if does not contribute 069 012 043 027
Difference --020 006 -015 005
Shelter
Decides if contributes 088 008 034 020
Decides if does not contribute 077 012 016 015
Difference --0 004 -019 008
Land use
Decides if contributes 077 023 027 025
Decides if does not contribute 066 026 016 020
Difference --011 005 -01 007
Sell agricultural output
Decides if contributes 065 025 026 030
Decides if does not contribute 051 025 021 027
Difference --015 004 -005 004
Source Authors estimates using NigeriaS CWlQ 2003 Notes Estimates based on sample of 10702 men (household heads) and 13260 women (spouses) differences in size of both samples are due to missing variables
decisions involving household productive assets such as land use crop sales and shelter contributing income increases the level of decision making among non-poor women more than among poor women
GDALM_381-406indd 395 2910610 11 55 AM I
396 GENDER DISPARITIES IN AFRICAS LABOR MARKET
Table 114 Impact of Income Contribution on Decision Making by Gender and Poverty Status in Nigeria
Men Women
Non-Poor Poor Non-poor Poor
Standard Standard Standard Standard Probability deviation Probability deviation Probability deviation Probability deviation
Education
Decides if contributes 072 024 037 025 059 026 023 020
Decides if does not contribute 054 028 020 021 038 026 010 015
Difference -018 OOS -l17 008 -l21 OOS -013 008
Health
Decides if contributes 096 005 092 OOS 075 018 055 018
Decides if does not contribute 0S1 013 073 016 055 024 033 019
Difference -l15 OOS -020 009 -l20 008 -023 00]
Food Decides if contributes 093 006 095 006 0S9 012 077 014
Decides if does not contribute OSO 011 0S4 011 072 024 051 022
Difference -l13 007 -l11 006 -l17 013 -l26 012
Clothing Decides if contributes 091 006 087 007 072 021 047 019
Decides if does not contribute 073 011 066 011 058 025 031 021
Difference -llS 006 -021 005 -l14 006 -l16 005
Shelter Decides if contributes 089 007 087 OOS 045 020 025 014
Decides if does not contribute 078 011 075 012 023 017 009 009
Difference -011 004 -l12 004 -l21 0D7 -l16 007
Land use Decides if contributes 066 027 086 014 034 024 021 024
Decides if does not contribute 054 029 077 017 021 020 013 019
Difference -012 005 -l09 004 -ln 006 -lO9 006
Sell agricultural output Decides if contributes 054 027 076 018 035 029 019 028
Decides if does not contribute 039 026 061 019 02S 027 015 025
Difference -l15 005 -l15 004 -l07 004 -l04 004
Source Authors estimates using Nigerias CWIQ 2003 Notes Estimates based on sample of 10702tnen (household heads) and 13260 women (spouses) differences in size of both samples are due to missing variables
GDALM_381-406indd 396 29106110 1155AM I
INCOME GENERATION AND INTRA-HOUSEHOLD DECISION MAKING 397
Conclusions
In Nigeria as in other Sub-Saharan countries most of household decisions are made by men who are the de facto household heads Statistical analysis of CWIQ survey data suggests that men tend to have most of the decision-making power regarding the use of productive assets such as land use crop sales and shelter Women participate more often in decisions on expenditures for food heath and education but even in these areas men more often than not remain the main decision makers The decision-making power of women is especially low among poor households in part because in such households the likelishyhood that women will be the main contributor of household income is much lower as well
Simple econometric modeling suggests that as expected when they are the main contributor of income women win substantial decision-making power The differences in decision power brought about by contributing income are as large as 20 percentage points for food shelter and health spending Howshyever the impact is much smaller in relation to the use of productive assets Finally contribution income raises decision making more among poor than non-poor women
Care must be taken not to draw strong policy recommendations from the limited and descriptive analysis in this chapter Yet some broad comments or suggestions can be made This study found that increasing the contribution ability ofwomen to household income leads to higher decision-making power for them within the household This has also been shown by several other authors to lead to higher investments in the human capital of children thereby leading to poverty reduction and higher income growth in the future This result can be used to advocate for policies to increase womens ability to conshytribute to household expenditures including policies raising the human capital of women for example through training and education programs specifically targeting women Facilitating access to land (for example through heritage law reforms or titling mechanisms) or access to credit (for example through microshycredit interventions targeted to women) are all interventions that have proven successful in other countries to promote female entrepreneurship and thereby to increase womens income and bargaining power However a detailed analysis for Nigeria should be conducted before making any specific policy recommenshydation in favor of one type of intervention or another to improve the position of women in the household
GDALM_381-406indd 397 29106110 11 55 AM I
(it
Ggt 0 raquo E I
~ ~ S w Annex Detailed Regression ResultsQ ltDQ
00 Cogt to Table 11A1 Bivariate Probit Regressions for Women in Nigeria
Decide Contrib Decide Contrib Decide Contrib Decide Contrib Decide Contrib Decide Contrib education income health income food income doth income land income crop sales income
Number of infants 0212 -0033 0054 -0033 0042 -ltgt029 0050 -0043 0042 -ltgt038 0087 -ltgt043 under-5 [482] [O42J [159] [043) [US] [036] [140J [054) [098] [048] [193] [055)
Square of number of -ltgt044 -ltgt014 -0013 -ltgt011 -ltgt008 -ltgt013 -ltgt014 -0010 -ltgt004 -ltgt010 -ltgt019 -0009 infants [384) [058) [169] [051] [124) [055) [165] [044] [039) [044) [162] [040]
Number of children 0295 0010 -ltgt012 0029 -0003 0025 0005 0026 0033 0030 -0019 0027 (age 5-14) [793] [018) [058J [048) [015] [0421 [024] ]043] ]112J [049] [064]
of number -ltgt039 -ltgt007 0003 -ltgt011 0002 -ltgt010 0001 -0011 -0001 -ltgt011 0006 -ltgt011 children [5341- [055J [097J [081J [056) [077] [O32J [O80J [0221 [085J [1331 [084]
Number of adults 0189 -0015 -0085 0005 -ltgt101 0010 -0056 -ltgt001 0049 0007 0009 0012(it [544] [O20J [353] [007J [393] [O14J [196) [002) [126J [O10J [024] [015J (it Square of number -0013 -0005 0006 -0007 0006 -ltgt007 0003 -0006 -0005 -ltgt007 -0001 -0007 of adults [396J [057J [303J [081J [284] [085J [109J [075J [136J [081) [039] [087]
Number of elderly 0096 -ltgt023 0055 0003 0145 -ltgt013 -0088 -0028 -0044 -ltgt016 -0012 -ltgt022 (age 65+) [098] [O13J [066] [002] [168) [008] [104] [016] [O42J [009] [010] [O13J
Square of number -0007 -0059 -ltgt058 -0061 -ltgt082 -0058 -0009 -0052 0022 -0053 -0008 -0053 of elderly [016J [074J [159J [080J [220J [O77J [O25J [069J [049J [O72J [0181 [071]
Female-headed -6325 2096 0684 2089 6045 2120 1592 2133 0094 2132 0259 2089 household [1905] [259] [098] 1248J [3109] [263] [272] [265J [015] [257] [043J [253]
Age of household head 0001 0025 -0011 0D25 0005 0023 -0004 0023 -ltgt010 0022 -0038 0025 [010] [123] [099J [120] [045] [115] [033] [112] [070] [110] ]275]
0000 0000 0000 0000 0000 0000 0000 0000 0000 0000 0000 0000 [105J [102J ]103] [088J [094] [046J [095J [102J [088J [278] [104J
Age of spouse 0042 -ltgt003 0028 -0001 0024 0000 0015 -ltgt001 0013 -0001 0032 -0004 [278J [012J [226] [007] [198) [001) [119J [003] [081] [007) [214] [019) ~
~
ij
raquos
(it
0
Gl 0 raquoshy I
Square of age of spouse 0000 0000 0000 0000 0000 0000 0000 0000 0000 0000 0000 0000~ [223] [069] [173] [063] [139] [057] [098J [061J [102] [063] [175] [078J5 CI CI
Head has customary 0073 0177 0166 0187 0228 0155 0110 0185 0018 0188 0088 0189 marriage [088J [129J [196[ [137] [233] [117] [121] [137] [018] [138J [098]
Head has Islamic 0141 0192 0068 0194 0155 0143 0051 0175 -0275 0197 -0208 0202 [129] [102] [068] [103] [141] [079] [049] [094] [231] [106] [176J [108]
Head has Christian 0335 0259 0405 0280 0663 0246 0386 0266 0172 0281 0240 0270 ]340] [168J [410] [181] [554] [163] [378] [174J [162] [183J [235] [1761
Head incomplete 0113 0008 -0086 0006 -0120 0003 -0059 0011 -0005 -0004 -0035 0006 primary education [120] 1005] [103] [005] [US) [002] [070] 1008J 1006] [003J [038] [0051
Head completed 0043 -0256 -0046 -0239 -0003 -0247 0059 -0246 -0081 -0251 0049 -0245 primary education 1064] 1226J [081] [215]-- 1006] 1219]-- [LOS] 1217] [118] [221] [066] [215]
Head incomplete -0050 -0155 -0139 -0129 0207 -0107 0002 -0096 -0232 -0113 -0181 -0118 secondary education 1038] 1087] 1098] 1071] [147] 1057] 1001J 1053] [146] [063] [129] [065]
Head completed 0157 -0320 0055 -0291 -0086 -0267 0029 -0295 -0128 -0290 0043 -0295 secondary education [154] [194] [063] 1176]- [092] [160] [034] [I 77] 1131] 1175] 1036] 11 77]
Head tertiary education 0080 -0171 0013 -0147 0036 -0132 0088 -0142 -0163 -0135 0126 -0139 1079] 1102] [014] [089] [037] [079] [099] [084] 1158] [081] [120] [084]
Spouse incomplete 0108 0336 -0001 0329 0178 0324 0041 0321 0076 0347 -0048 0335 primary education [123] [253] [002] [249] [181] [244] [048] 1242] [081] [261] [050] [253]
Spouse completed 0089 0211 0041 0180 0004 0193 -0055 0175 0172 0210 0086 0201 primary education [120] [181] [063] [156] [006] [164] 1090] [150] [224] [179] [106] [172]
Spouse incomplete 0201 -0108 0007 -0135 0045 -0147 -0021 -0164 0252 -0128 0073 -0143 secondary educ [169] [047] [006] [056] [033] [061] [016] [068] [203] [055] [059] [060]
Spouse completed 0067 0182 -0174 0152 0014 0144 0073 0154 -0070 0154 -0122 0162 secondary educ [064] [108] [182] [089] [013] [083] [076] [088] [065] [088] [103) [093)
0168 0073 -0149 0053 0075 0051 -0007 0051 0029 0079 -0222 0081 [099] [024] [046] [023] [005] [023] 1019] [036] [146] [037]
w 10 Head unemployed 0041 2147 -0208 2105 -0016 2194 -0340 2198 -0067 2193 -0245 2193 10 [019] 1475] [098] 1466] [007] [486] [183] 14811 [0291 [483] [093] [486]
I)
~ continued ~ 0
u raquo
(f)
Gl 0 raquo rshy I
t 00 $ f Q Head in servicel -J043 -J385 -0093 -0370 -0085 -J391 0027 -0403 -J015 -0385 -J228 -0384Q
educationladmlother [051] 1195] [128] [194] [122] [198]-- [036J [2011 1017] [199J [248]-- 1199J51
Spouse in manufconstrl 0185 0438 0075 0408 -0114 0397 0183 0409 -0571 0435 -0739 0424 transport [118] [226J [073] [205]-- [113J [206J [1781- [209J-- [258] [228) 1315] [219J
Spouse in wholesalel 0002 0121 -J069 0124 -J205 0114 0027 0125 -0543 0133 -0525 0127 retail [003] [134] [123J [137] [357] 1126] [049] [138] [891] [147] [848J [140J
Spouse in serviceleducl 0059 0324 0433 0317 -0028 0311 -0037 0304 -0645 0287 -0676 0292 admlother [070] [225]-- [664] [221] [045] [214J [059] [210] [637] [200] [778] [202]
Individual owns house 0365 0395 0319 0375 0851 0389 0462 0367 1204 Q401 1078 0396 [454] [357] [484] [336] [1035] [350] [688] [335] (1651] [364]middot [1295] [364]
Head temporary migrant 0226 1203 0220 1167 -J151 1163 -J120 1175 -J451 1194 -J328 1202 [080] [533] [119] [517] [086J [512] [070J [520] [187] [528]middot [149] [539]
Household has access to 0046 0120 0067 0121 0004 0123 0068 0121 -J014 0121 0032 0122 electricity [205]middotmiddot [324] [319]-- [330]--- [016] [330]--- [333]--- [326] (052] [333]--middot [131] [330]
(f) (f)Household has access to 0077 -0174 -J129 -0166 -0121 -0179 -0011 -0167 -J078 -0164 0017 -0164 piped water [103] [124] [186]- [119] [173] [127] [016] [119] 1081] [117] [017] [117]
Household has toilet -0005 0122 0092 0126 -0021 0155 0047 0129 -0479 0127 -0336 0113 facility
Wealth index 0129 -0043 0022 -J041 -0067 -J033 -0028 -0045 -0019 -0041 -0033 -0038 [382Jmiddotmiddot- [074J [074] 1070J [205J [055J [0911 [077] [052] [070] [086] [065)
Wealth index squared -0008 -0003 -0001 -0003 0005 -J004 0001 -J003 0000 -0003 -JOOl -J003 1275] [050] [041) (058) [165 [074 [048 [053] [014] [063 [042] [064)
Constant -2636 -4279 -J81 0 -4328 0289 -4470 -0446 -4365 -1109 -4415 -0430 -4428 [680] [572]middot bull [256) [577] [092] [571] [147] [563)--- 1308)middot 1573] [116] [569)
Observations 13225 13225 13225 13225 13225 13225 13209 13209 13209 13209 13209 13209
Source Authors estimates using Nigerias CWlQ 2003 Notes State dummy variables induded in the regressions but not shown in the tables () denotes coefficient statistically significant at 10 level () at 5 level and ( ) significant
jgt at 1 level 0
I) ltDc
0 ~
-(j raquo
(f)
G) 0 raquo rshy ~ ilojCl Cl
jgt
0 -
Table 11A2 Bivariate Probit Regressions for Men in Nigeria
Decide Contrib Decide Contrib Decide Contrib Decide Contrib Decide Contrib Decide Contrib 1G education income health income food income cloth income land use income sales income
Number of infants 0232 0033 0016 0033 -0079 0033 0029 0038 0089 0036 0037 0038 under-S [54S] [076] [040] [074] [202] [074] [0771 [085J [25SJ [0811 [122J [0861
Square of number of -0029 -0003 -0009 -0004 0001 -0004 -0008 -0005 -0014 -0005 -0005 -OOOS infants [279] [053J [130J [0S7] [013J [061] [105J [067J [179] [069] [084] 1069]
Number of children 0564 0035 0079 0033 0041 0033 0052 0034 0055 0031 0015 0031 (age 5-14) 11704J [086J [202] [087] 110SJ 1088J [168) [090) [171] [083) [055] [082]
Square of number -0070 -0004 -0008 -0004 0000 -0004 -0004 -0004 -0002 -0004 0000 -0004 of children [1044] [045] [118] [061] [001] [059J [079] [060J [028J [056] [002J [0S6]
Number of adults 0222 -0116 -0052 -0106 -0106 -0113 -0037 -0110 0095 -0116 0045 -0116 [668) [225) [100) [215) [200] [222J [107) [220] [261] [2261 [136] [2261
Square of number -0012 0010 0007 0009 0010 0010 0001 0010 -0005 0011 -0001 0011 of adults [364] [186) [132] [1791 [179] [190] 1030] [186J [154] [192) [026) [193]shy
Number of elderly 0116 -0135 0217 -0147 -0048 -0145 0180 -0119 0035 -0143 -0130 -0135 (age 6S+) [108] [106J [146] [US] [036] [111J [156] [092J [029] [109] [124] [104J Square of number -0030 0019 -0071 0030 -0008 0034 -0057 0022 0015 0026 0058 0024 of elderly [057J [036) [113] [056) [014) [061] [110J [040] [028] [047] [119) [0441
Female-headed -7759 -1265 -0711 -1213 -1452 -1195 -1369 -1224 -0625 -1277 -0289 -1250 household [2690] [174)- [106) [163] [218J [163) [180J- [158J [084J [168] [038) ]164)
Age of household head 0014 Om5 0047 0Q18 0012 0016 0026 0016 0004 0019 0012 0018 [111) [0841 [307) [1001 [081[ [093] [191) [090J [031] [108) [092J [1061
Square of age of 0000 0000 -0001 0000 0000 0000 0000 0000 0000 0000 0000 0000 household head [1311 [149J [376] [165) [1421 [156] [272]- [1561 [061] [1721- [121] [1691shy
Age of spouse 0022 0029 -0031 0025 0000 0028 0008 0027 0014 0025 0006 0025 [1561 [152) [186)- [1331 [001) [1471 [0511 [144] [098] [129] [0441 [132J
Square of age of spouse 0000 0000 0000 0000 0000 0000 0000 0000 0000 0000 0000 0000 [124J [211) [168]- [196]-- [025] [214] [038] [208]- [US] [1921- [068J [1961shy
I) ltD a ~
u raquo
0
(fJ
Gl 0 raquo rshy ~ en ~r Cl Cl Head has customary 0316 -0343 -0152 -0378 0100 -0376 0024 -0373 0089 -0356 -0031 -0358 jgt marriage [307] [266] [100] [288] [086] [283J [022] [289] [090J [277J [034] [276]8
Head has Islamic marriage 0403 -0154 -0178 -0182 -0254 -0185 -0080 -0178 -0150 -0168 -0210 -0160 [319] [094J [116] [108J [192J [111J [066J 1107] 1131J 1102J 1201J 1095J
Head has Christian 0436 -0481 -0112 -0509 0150 -0503 -0048 -0517 0062 -0498 0089 -0490 1361] [331] [066] [350J [114J [340] [038] 1358] [057] [346] [089] [339J
primary 0254 -0006 0249 -0012 0163 -0013 -0010 -OQ15 0211 -0006 0114 -0006 education 1242] 1005J 1144] [010] [140J [010J 101 OJ 1012] 1178J 1005J [119J [005]
Head completed primary 0320 0310 0093 0300 0193 0311 0127 0286 0176 0309 0124 0314 education 1475] [321] [110] [310J 1228J [319J [159J [301] [246] [316] [194] [320]
Head incomplete 0226 0077 0015 0053 0115 0074 0108 0043 0147 0Q75 0093 0078 secondary education [149] [028] [009] [020] 1069] [027] [074] [016] [109] [027] [079] [028]
Head completed 0355 0063 0136 0102 0183 0081 -0029 0076 0061 0076 0197 0088 secondary education [363] [045J [1051 [073] [149] [0571 [024] [054] [065] [054J [225] [062]
(fJ Head tertiarv education 0430 0085 0172 0109 0220 0118 0128 0081 0083 0113 0228 0119 (fJ [369] [063] [113) [081J [167] [088] [102J 1060] 1082] [084] 1237J 1088]
Spouse incomplete 0163 -0208 -0051 -0202 -0326 -0240 0123 -0212 -0048 -0234 -0232 -0239 primary education [154] [172J [030J [166J [2851 [197J [101] [176J [041] [192] 1238J [195]
Spouse completed primary 0148 -0072 -0004 -0102 -0153 -0106 0060 -0089 0097 -0094 0045 -0099 education [188] [062] [004] [089] [164] [092] [0661 [0791 [UO[ [081] 1064) [085]
Spouse incomplete 0345 -0146 -0281 -0111 -0284 -0127 -0056 -0105 -0004 -0132 -0081 -0132 secondary educ [224J [070J [155] [056J [190] [061] [0381 1053] [003] [065] [070] [065]
Spouse completed 0082 0071 -0067 0071 -0216 0046 -0036 0068 -0210 0050 -0298 0049 secondary educ [072] [048] [045] [048] [156] [031] [026] [0471 ]197] [034] [302] ]034]
Spouse tertiary education 0095 0220 0212 0188 -0088 0164 0073 0215 -0001 0182 -0220 0171 [052] [115] ]084] [099] [047] ]085] [042] [111] [001] [094] 1156] 1089]
Head unemployed -0499 -1492 -0541 -1455 -0312 -1507 -0051 -1455 -0160 -1502 -0141 -1507 gt [230] [479] [200] [472] [121] 1488] 1018J [463J 1071] 1481] [069] ]480] 0 w
continued CD co Ilt 0
en raquo
(fJ
(f)
Cl 0 raquo r 0 I
t txgt
0 CD
~~ 0- 0 Table 11A2 Bivariate Probit Regressions for Men in Nigeria continued ~
Decide Contrib Decide Contrib Decide Contrib Decide Contrib Decide Contrib Decide Contrib~ education income health income food income cloth income land use income crop sales income
Head not in labor force -J618 -1525 -J858 -1479 -J428 -1522 -J443 -1481 -J358 -1520 -J200 -1509 [3341 [5331 [366] [525] [191[ [S40J [181] 517] 1187] [531]- [119) 526]
Head in public or -J063 -J186 0136 -0173 -J201 -0157 -J401 -J169 -J099 -J175 -J270 -J162 parastatal sector [0351 [097] [057] [090] [101[ [081] [239] 1089] [081] 1092J [206] 1085]
Head wage earner -J075 -J043 -J452 -0062 0061 -J1 02 0297 -J062 0041 -J083 0188 -J094 1035] 1014] 1144] [021] [023 [ [035J 11111 10211 1021] [028] [1011 [031]
Head self employed -J423 -J138 -J277 -0129 0177 -0154 -J025 -J143 -0100 -J151 -0069 -J161 [2621 [055] [137] 10521 [0891 [062] [011] [056] [058] [059] [047] 1062]
Head unpaid family -J518 -J486 -0602 -J484 0241 -J503 -J139 -J493 -J177 -J494 -J089 -J503 worker [295] [181] [283] [183] 1107] [190] [056] 1184] [092] [182] [0541 [184]
Spouse unemployed -J160 0589 -JOO7 0598 0270 0619 -J150 0564 0067 0627 -J140 0575(f) (f)[0521 [204] [002] [210] [0791 [218Jmiddot- [051J [1981- [0261 [220) [060J [201Jmiddotmiddot
Spouse not in labor force -J112 0431 0200 0415 0568 0456 0293 0399 0271 0440 -J014 0395 [039J [163) [063J [1611 [177]- [175] [111] 1152J 1113) [168Jmiddot [006J 1150]
Spouse in public or -0217 0069 -J501 0036 0273 0072 -0397 0041 -J142 0053 0161 0062 parastatal sector [086] 1030] [166]- [016] [108] ]0311 [172[ [018] [O63J [O23J [O83J [O27J
Spouse wage earner -0322 -J802 0059 -J754 0093 -J746 0256 -J775 0166 -0757 -J245 -0808 [095] [256) [O15J [242] [026) [239 [083 [245 [055] [245) 1089) 261J
self employed -J160 -J251 0517 -J255 0468 -J238 0363 -J268 0273 -J251 0248 -J287 [057J [103] [168) [107[ [148] [099] 1144) [111] 1118] [104) [117) [118)
Spouse unpaid family -J236 -J084 0056 -J088 0538 -0064 0013 -Jl00 0290 -Jon 0037 -J101 worker [084] [034) 1018] [0361 [1671 10271 [005] [0411 [124] [030] [017) [041]
Head in manuflconstrl -J115 0156 0029 0155 0085 0156 0002 0152 -0527 0149 -JS70 0134 transport [1101 11161 1020] [116J 1071] [117J 10021 11141 1557] [112J [657J- [100J
Head in wholesaleretail -0011 -J060 -0183 -J089 0088 -J076 -0114 -J093 -0426 -J073 -J420 -J083 [013J [048J [167] [070J [O75J 1060] [121] [0741 ]531J [056] [572J [064J
~ ~
U 0gt
raquo
(f)
0
Gl C raquo E 1
~ ~ 0
5shyshy- Head in serviceeducation -0066 0132 -0088 0098 0044 0113 -0114 0092 -0397 0115 -0374 0103 admlother [078] [076] [072] [056] [046] [065] [123] [053] [479] [066] [470] [059]0
Spouse in manuflconstrl 0160 -0394 -0130 -0411 0146 -0419 0109 -0426 -0573 -0412 -0574 -0415 transport [113] [229] [090] [244] [085] [248] [075] [253] [427] [239 [451] [241]
Spouse in wholesaleretail 0002 0098 0092 0109 0140 0114 -0011 0110 -0465 0118 -0467 0123 [003] [116 [116] [128] [165] [136] 017J [129] 688J [138) [780] [144]
Spouse in serviceeducl 0103 -0191 0628 -0186 0309 -0196 0312 -0185 -0256 -0199 -0110 -0187 admlother [141] [169] [644] [163] [279J [173J [349J [162] [302J [174] [153J [164]
Individual owns house 0099 0034 0204 0041 0109 0033 0094 0038 0800 0031 0736 0033 [184] [047] [295] [057] [176] [045] [157] [053] [1609] [042] [1553] 1046]
Head temporary migrant -0307 -0778 -0149 -0754 -0252 -0738 0247 -0744 -0148 -0759 -0047 -0761 [155] [358] [062] [349J [121] [3391 [124] [343] [068] [3541 [024] [357J
Household has access -0029 -0087 0038 -0093 0036 -0094 0017 -0092 0003 -0092 0002 -0090 to electricity [119] [251] [107] [268] [120] [272] 056] [273] [012] [270J [009J [261]
Household has access 0183 -0221 -0244 -0237 -0072 -0211 -0076 -0216 0043 -0216 -0060 -0210 to piped water [233J [193J [239J [207J [066] 1182J [084] [189J [O5St 1187] [O86J [182J Household has toilet -0122 0157 -0236 0134 -0300 0137 -0317 0139 -0178 0157 -0134 0140
[076] [100J [117] [083] [203] [084J [198J [086] [LSI] [096J [114J [086]
Wealth index 0131 -0014 0112 -0004 0148 -0011 0152 -0003 -0099 -0014 -0035 -0015 [361J [0291 [240J [009] 1336] [022] [361] [007] 1261J [O28J [095] [030J
Wealth index squared -0005 0004 -0005 0004 -0011 0004 -0008 0004 -0001 0004 -0006 0004 [145J [100J [116] [085] [281] [091] [212] [084J [025] [O96J [170J [0971
Constant -1696 2159 0202 2158 0117 2194 -0575 2207 0199 2205 0085 2249 [410] [434] [044J [4331 [O26J [439] [139] [441J [052J [441J [024J 1448Jmiddotmiddot
Observations 10671 10671 10671 10671 10671 10671 10671 10671 10671 10671 10671 10671
Source Authors estimates using Nigerias CWIQ 2003 Notes State dummy variables induded in the regressions but not shown in the tables () denotes coefficient statistically significant at 10 level ( ) at 5 level and ( ) significant at 1 level
jgt
0 V1
2gt ~
Oi 01
raquo
406 GENDER DISPARITIES IN AfRICAS LABOR MARKET
References Babalola A and C Dennis 1988 Returns to Womens Labour in Cash Crop producshy
tions Tobacco in Igboho Oyo State Nigeria In Agriculture Women and Land The African Experience ed J Davidson Boulder CO West View Press
Backiny-Yetna P and Q Wodon 2010 Gender Labor Income Shares and Human Capital Investment in the Republic of Congo In Gender Disparities in Africas Labor Market ed J S Arbache A Kolev and E Filipiak Washington DC World Bank
Blackden C M and C Bhanu 1999 Gender Growth and Poverty Reduction Special Program ofAssistance for Africa 1998 Status Report on Poverty World Bank Technical Paper 428 Washington DC World Bank
Bourguignon F and P A Chiappori 1992 Collective Models of Household Behavior An Introduction European Economic Review 36 (2-3) 355-64
Browning M and P A Chiappori 1998 Efficient Intra-Household Allocations A General Characterization and Empirical Tests Econometrica 66 (6) 1241-78
Bussolo M R E De Hoyos and Q Wodon 2009 Higher Prices of Export Crops Intra-Household Inequality and Human Capital Accumulation in Senegal In Gender Aspects of the Trade and Poverty Nexus A Macro-Micro Approach ed M Bussolo and R E De Hoyos Washington DC World Bank and Palgrave Macmillan
Chukwuezi B 1999 De-agrarianization and Rural Employment in South Eastern Nigeria Working Paper 37 African Studies Centre University of Leiden the Netherlands
Hoddinott J and L Haddad 1995 Does Female Income Share Influence Household Expenditures Evidence from C6te dIvoire Oxford Bulletin of Economics and Statisshytics 57 (1) 77-96
lloyd C B and A K Blanc 1996 Childrens Schooling in Sub-Saharan Africa The Role of Fathers Mothers and Others Population and Development Review 22 (2) 265-98
Manser M and M Brown 1980 Marriage and Household Decision Making A Bargaining Analysis International Economic Review 21 (1) 31-34
McElroy M B and M J Homey 1981 Nash-bargained Household Decisions Toward a Generalization of the Theory of Demand International Economic Review 22 (2) 333-49
Piesse J and J Simister 2003 Bargaining and Household Dynamics The Impact of Education and Financial Control on Nutrition Outcomes in South Africa South African Journal ofEconomics 71 (1) 163-72
World Bank 2004 Nigeria Poverty and Vulnerability-A Preliminary Diagnostic Unpublished manuscript Human Development Department Africa Region World Bank Washington DC
--- 2005 Uganda From Periphery to Center A Strategic Country Gender Assessment Poverty Reduction and Economic Management Africa Region World Bank Washington DC
GDALM_381-406indd 406 29106110 11 55 AM I
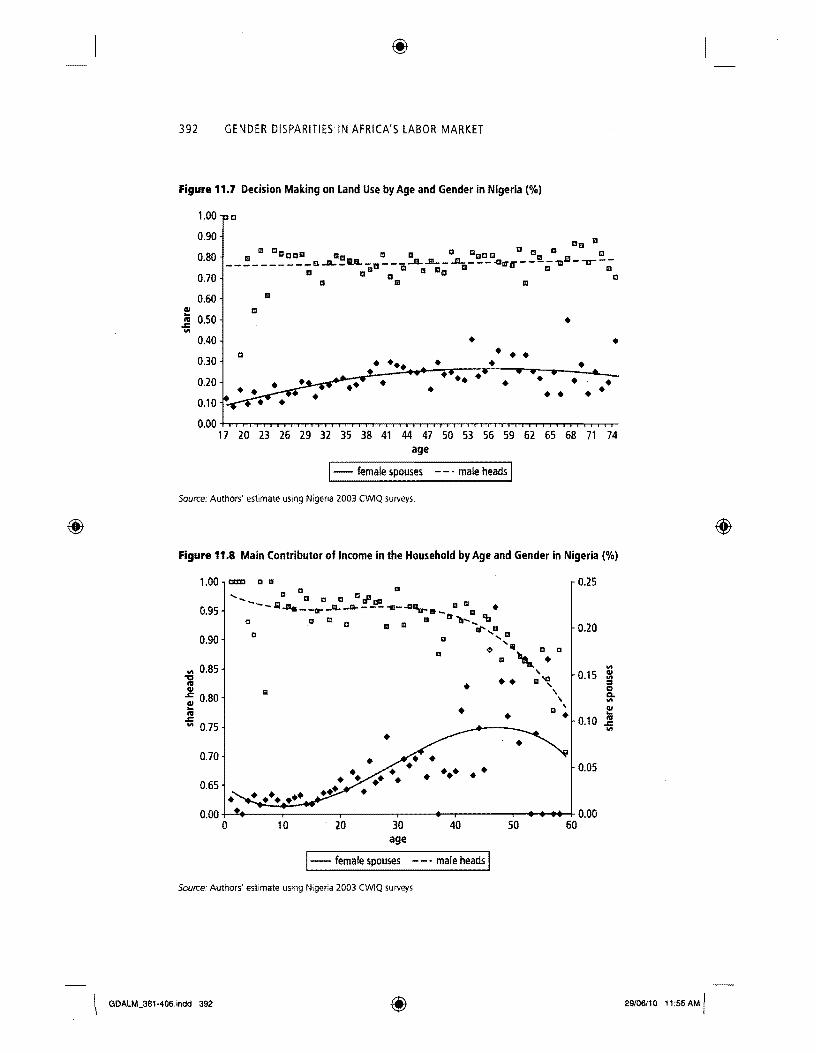
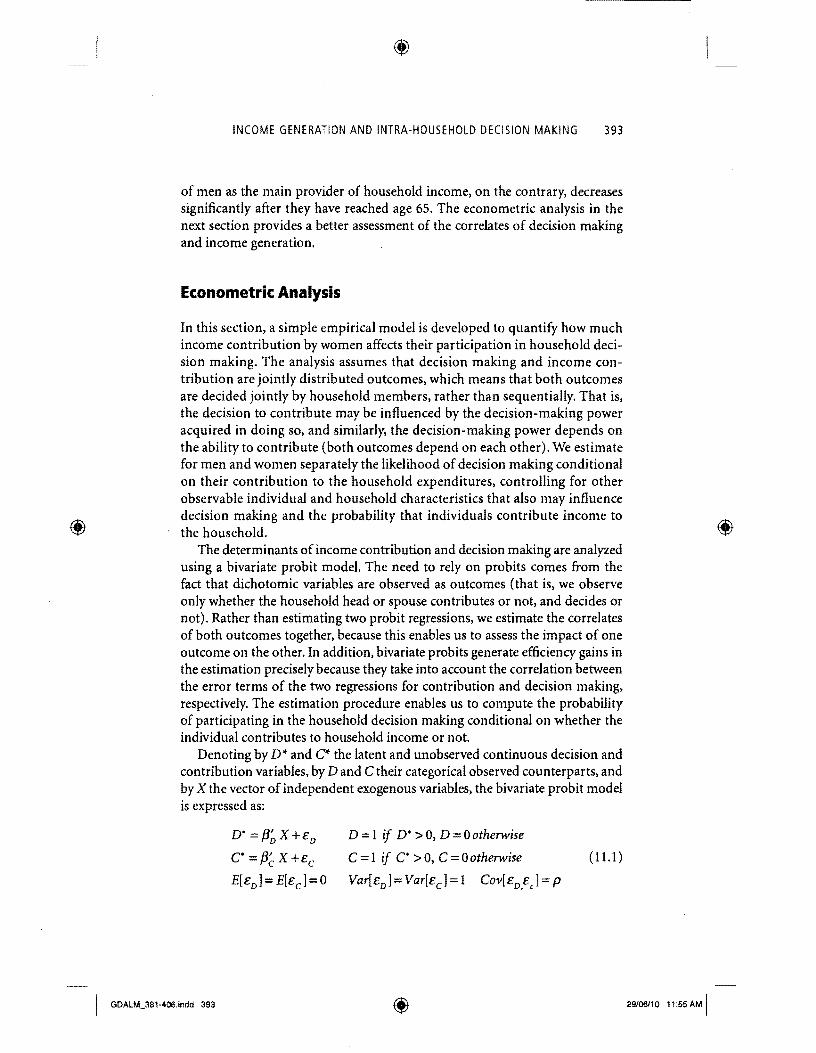
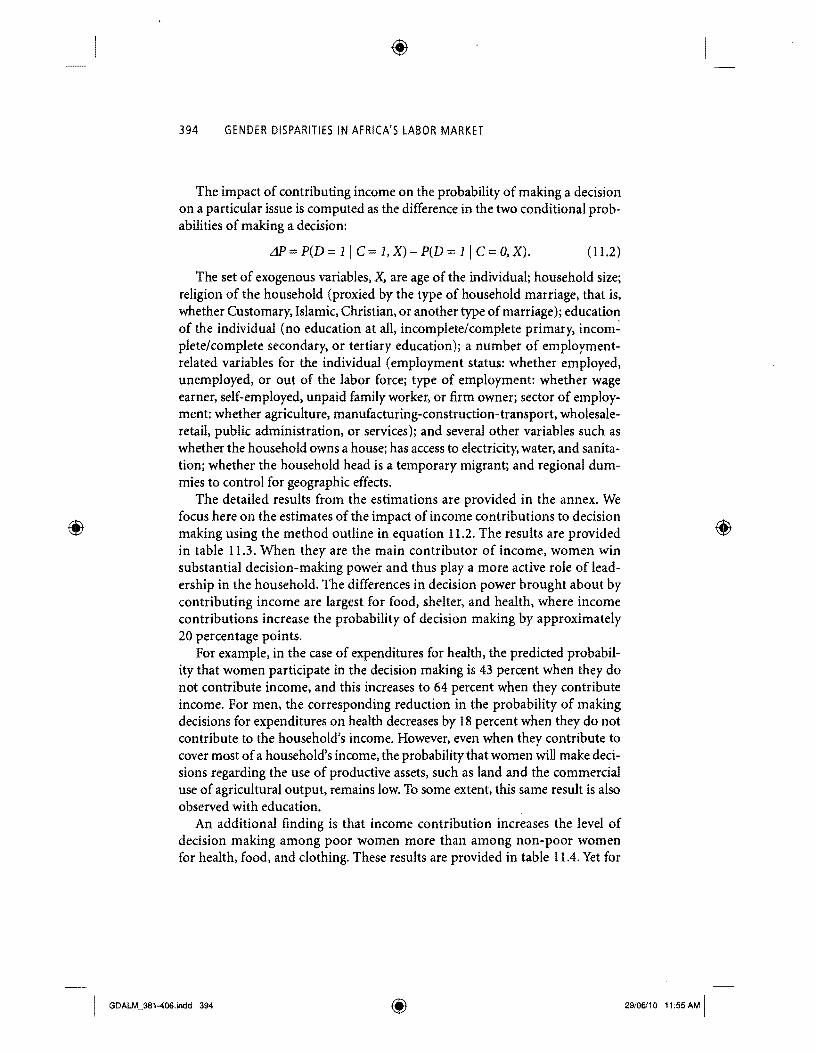
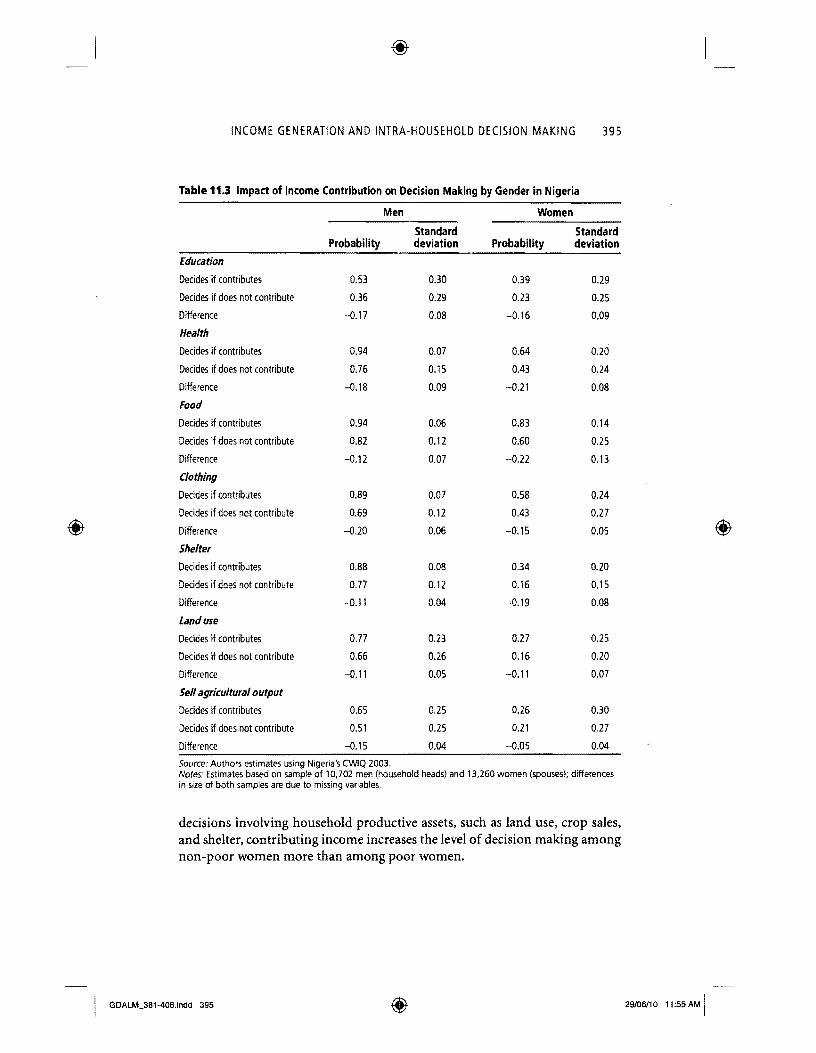
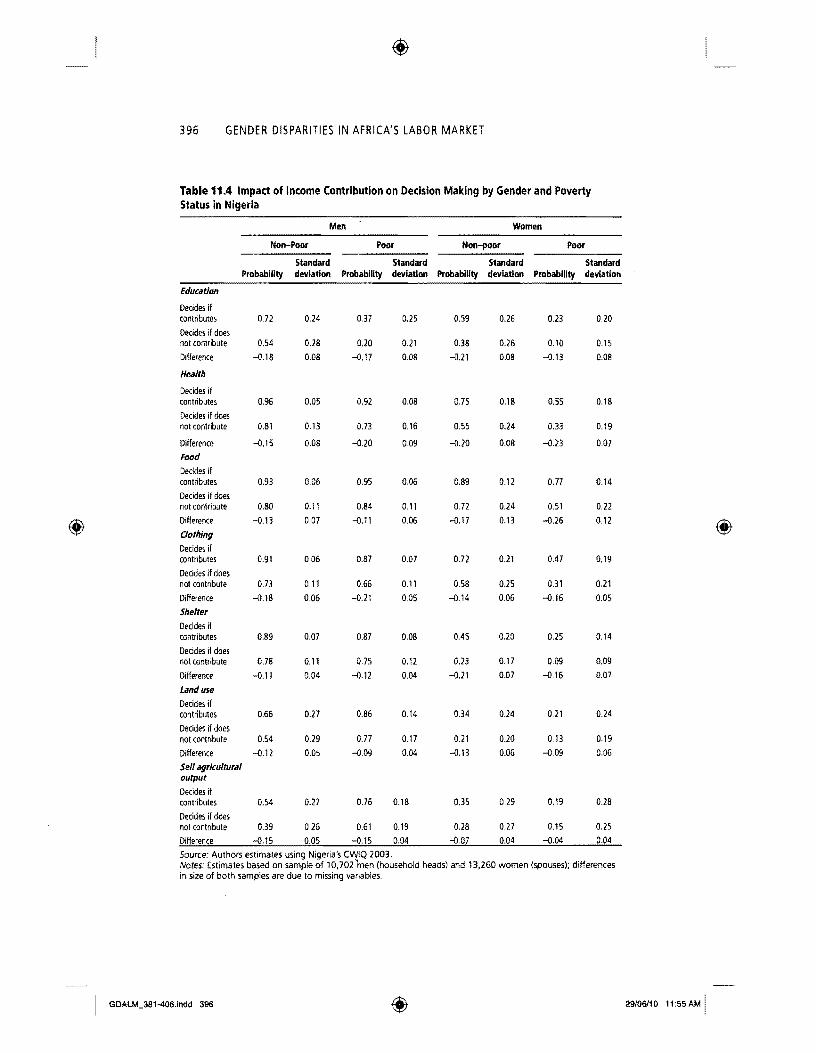
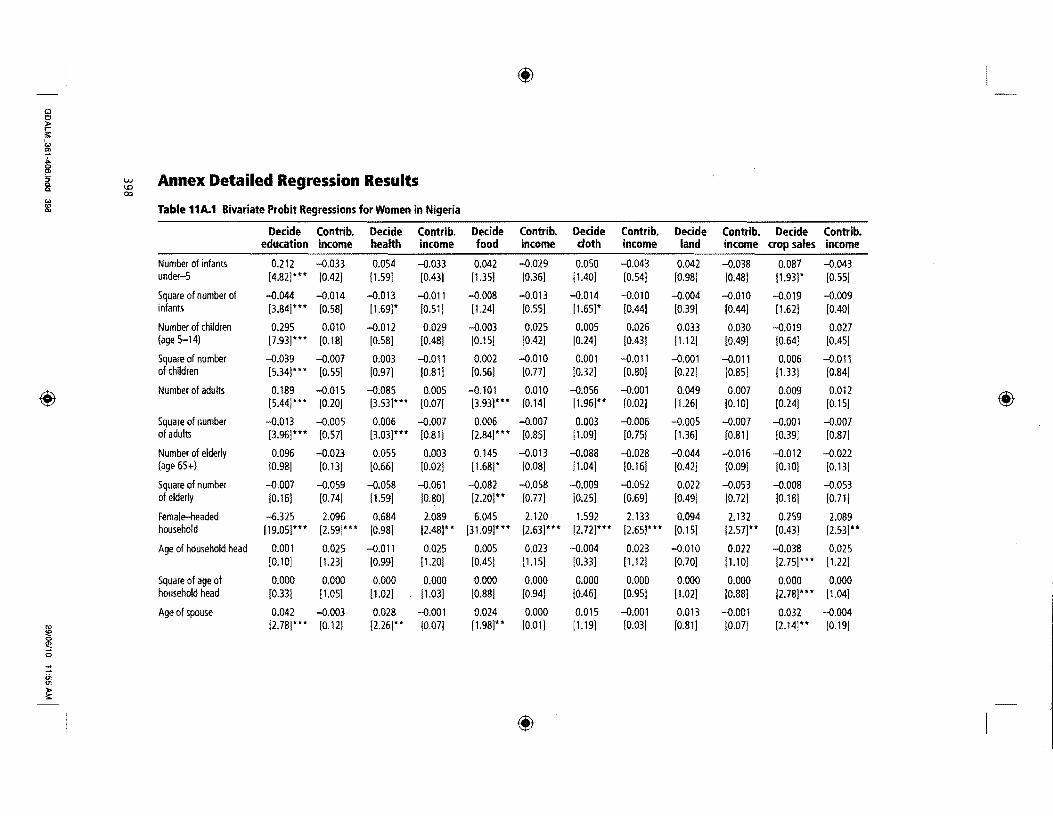
(it
Ggt 0 raquo E I
~ ~ S w Annex Detailed Regression ResultsQ ltDQ
00 Cogt to Table 11A1 Bivariate Probit Regressions for Women in Nigeria
Decide Contrib Decide Contrib Decide Contrib Decide Contrib Decide Contrib Decide Contrib education income health income food income doth income land income crop sales income
Number of infants 0212 -0033 0054 -0033 0042 -ltgt029 0050 -0043 0042 -ltgt038 0087 -ltgt043 under-5 [482] [O42J [159] [043) [US] [036] [140J [054) [098] [048] [193] [055)
Square of number of -ltgt044 -ltgt014 -0013 -ltgt011 -ltgt008 -ltgt013 -ltgt014 -0010 -ltgt004 -ltgt010 -ltgt019 -0009 infants [384) [058) [169] [051] [124) [055) [165] [044] [039) [044) [162] [040]
Number of children 0295 0010 -ltgt012 0029 -0003 0025 0005 0026 0033 0030 -0019 0027 (age 5-14) [793] [018) [058J [048) [015] [0421 [024] ]043] ]112J [049] [064]
of number -ltgt039 -ltgt007 0003 -ltgt011 0002 -ltgt010 0001 -0011 -0001 -ltgt011 0006 -ltgt011 children [5341- [055J [097J [081J [056) [077] [O32J [O80J [0221 [085J [1331 [084]
Number of adults 0189 -0015 -0085 0005 -ltgt101 0010 -0056 -ltgt001 0049 0007 0009 0012(it [544] [O20J [353] [007J [393] [O14J [196) [002) [126J [O10J [024] [015J (it Square of number -0013 -0005 0006 -0007 0006 -ltgt007 0003 -0006 -0005 -ltgt007 -0001 -0007 of adults [396J [057J [303J [081J [284] [085J [109J [075J [136J [081) [039] [087]
Number of elderly 0096 -ltgt023 0055 0003 0145 -ltgt013 -0088 -0028 -0044 -ltgt016 -0012 -ltgt022 (age 65+) [098] [O13J [066] [002] [168) [008] [104] [016] [O42J [009] [010] [O13J
Square of number -0007 -0059 -ltgt058 -0061 -ltgt082 -0058 -0009 -0052 0022 -0053 -0008 -0053 of elderly [016J [074J [159J [080J [220J [O77J [O25J [069J [049J [O72J [0181 [071]
Female-headed -6325 2096 0684 2089 6045 2120 1592 2133 0094 2132 0259 2089 household [1905] [259] [098] 1248J [3109] [263] [272] [265J [015] [257] [043J [253]
Age of household head 0001 0025 -0011 0D25 0005 0023 -0004 0023 -ltgt010 0022 -0038 0025 [010] [123] [099J [120] [045] [115] [033] [112] [070] [110] ]275]
0000 0000 0000 0000 0000 0000 0000 0000 0000 0000 0000 0000 [105J [102J ]103] [088J [094] [046J [095J [102J [088J [278] [104J
Age of spouse 0042 -ltgt003 0028 -0001 0024 0000 0015 -ltgt001 0013 -0001 0032 -0004 [278J [012J [226] [007] [198) [001) [119J [003] [081] [007) [214] [019) ~
~
ij
raquos
(it
0
Gl 0 raquoshy I
Square of age of spouse 0000 0000 0000 0000 0000 0000 0000 0000 0000 0000 0000 0000~ [223] [069] [173] [063] [139] [057] [098J [061J [102] [063] [175] [078J5 CI CI
Head has customary 0073 0177 0166 0187 0228 0155 0110 0185 0018 0188 0088 0189 marriage [088J [129J [196[ [137] [233] [117] [121] [137] [018] [138J [098]
Head has Islamic 0141 0192 0068 0194 0155 0143 0051 0175 -0275 0197 -0208 0202 [129] [102] [068] [103] [141] [079] [049] [094] [231] [106] [176J [108]
Head has Christian 0335 0259 0405 0280 0663 0246 0386 0266 0172 0281 0240 0270 ]340] [168J [410] [181] [554] [163] [378] [174J [162] [183J [235] [1761
Head incomplete 0113 0008 -0086 0006 -0120 0003 -0059 0011 -0005 -0004 -0035 0006 primary education [120] 1005] [103] [005] [US) [002] [070] 1008J 1006] [003J [038] [0051
Head completed 0043 -0256 -0046 -0239 -0003 -0247 0059 -0246 -0081 -0251 0049 -0245 primary education 1064] 1226J [081] [215]-- 1006] 1219]-- [LOS] 1217] [118] [221] [066] [215]
Head incomplete -0050 -0155 -0139 -0129 0207 -0107 0002 -0096 -0232 -0113 -0181 -0118 secondary education 1038] 1087] 1098] 1071] [147] 1057] 1001J 1053] [146] [063] [129] [065]
Head completed 0157 -0320 0055 -0291 -0086 -0267 0029 -0295 -0128 -0290 0043 -0295 secondary education [154] [194] [063] 1176]- [092] [160] [034] [I 77] 1131] 1175] 1036] 11 77]
Head tertiary education 0080 -0171 0013 -0147 0036 -0132 0088 -0142 -0163 -0135 0126 -0139 1079] 1102] [014] [089] [037] [079] [099] [084] 1158] [081] [120] [084]
Spouse incomplete 0108 0336 -0001 0329 0178 0324 0041 0321 0076 0347 -0048 0335 primary education [123] [253] [002] [249] [181] [244] [048] 1242] [081] [261] [050] [253]
Spouse completed 0089 0211 0041 0180 0004 0193 -0055 0175 0172 0210 0086 0201 primary education [120] [181] [063] [156] [006] [164] 1090] [150] [224] [179] [106] [172]
Spouse incomplete 0201 -0108 0007 -0135 0045 -0147 -0021 -0164 0252 -0128 0073 -0143 secondary educ [169] [047] [006] [056] [033] [061] [016] [068] [203] [055] [059] [060]
Spouse completed 0067 0182 -0174 0152 0014 0144 0073 0154 -0070 0154 -0122 0162 secondary educ [064] [108] [182] [089] [013] [083] [076] [088] [065] [088] [103) [093)
0168 0073 -0149 0053 0075 0051 -0007 0051 0029 0079 -0222 0081 [099] [024] [046] [023] [005] [023] 1019] [036] [146] [037]
w 10 Head unemployed 0041 2147 -0208 2105 -0016 2194 -0340 2198 -0067 2193 -0245 2193 10 [019] 1475] [098] 1466] [007] [486] [183] 14811 [0291 [483] [093] [486]
I)
~ continued ~ 0
u raquo
(f)
Gl 0 raquo rshy I
t 00 $ f Q Head in servicel -J043 -J385 -0093 -0370 -0085 -J391 0027 -0403 -J015 -0385 -J228 -0384Q
educationladmlother [051] 1195] [128] [194] [122] [198]-- [036J [2011 1017] [199J [248]-- 1199J51
Spouse in manufconstrl 0185 0438 0075 0408 -0114 0397 0183 0409 -0571 0435 -0739 0424 transport [118] [226J [073] [205]-- [113J [206J [1781- [209J-- [258] [228) 1315] [219J
Spouse in wholesalel 0002 0121 -J069 0124 -J205 0114 0027 0125 -0543 0133 -0525 0127 retail [003] [134] [123J [137] [357] 1126] [049] [138] [891] [147] [848J [140J
Spouse in serviceleducl 0059 0324 0433 0317 -0028 0311 -0037 0304 -0645 0287 -0676 0292 admlother [070] [225]-- [664] [221] [045] [214J [059] [210] [637] [200] [778] [202]
Individual owns house 0365 0395 0319 0375 0851 0389 0462 0367 1204 Q401 1078 0396 [454] [357] [484] [336] [1035] [350] [688] [335] (1651] [364]middot [1295] [364]
Head temporary migrant 0226 1203 0220 1167 -J151 1163 -J120 1175 -J451 1194 -J328 1202 [080] [533] [119] [517] [086J [512] [070J [520] [187] [528]middot [149] [539]
Household has access to 0046 0120 0067 0121 0004 0123 0068 0121 -J014 0121 0032 0122 electricity [205]middotmiddot [324] [319]-- [330]--- [016] [330]--- [333]--- [326] (052] [333]--middot [131] [330]
(f) (f)Household has access to 0077 -0174 -J129 -0166 -0121 -0179 -0011 -0167 -J078 -0164 0017 -0164 piped water [103] [124] [186]- [119] [173] [127] [016] [119] 1081] [117] [017] [117]
Household has toilet -0005 0122 0092 0126 -0021 0155 0047 0129 -0479 0127 -0336 0113 facility
Wealth index 0129 -0043 0022 -J041 -0067 -J033 -0028 -0045 -0019 -0041 -0033 -0038 [382Jmiddotmiddot- [074J [074] 1070J [205J [055J [0911 [077] [052] [070] [086] [065)
Wealth index squared -0008 -0003 -0001 -0003 0005 -J004 0001 -J003 0000 -0003 -JOOl -J003 1275] [050] [041) (058) [165 [074 [048 [053] [014] [063 [042] [064)
Constant -2636 -4279 -J81 0 -4328 0289 -4470 -0446 -4365 -1109 -4415 -0430 -4428 [680] [572]middot bull [256) [577] [092] [571] [147] [563)--- 1308)middot 1573] [116] [569)
Observations 13225 13225 13225 13225 13225 13225 13209 13209 13209 13209 13209 13209
Source Authors estimates using Nigerias CWlQ 2003 Notes State dummy variables induded in the regressions but not shown in the tables () denotes coefficient statistically significant at 10 level () at 5 level and ( ) significant
jgt at 1 level 0
I) ltDc
0 ~
-(j raquo
(f)
G) 0 raquo rshy ~ ilojCl Cl
jgt
0 -
Table 11A2 Bivariate Probit Regressions for Men in Nigeria
Decide Contrib Decide Contrib Decide Contrib Decide Contrib Decide Contrib Decide Contrib 1G education income health income food income cloth income land use income sales income
Number of infants 0232 0033 0016 0033 -0079 0033 0029 0038 0089 0036 0037 0038 under-S [54S] [076] [040] [074] [202] [074] [0771 [085J [25SJ [0811 [122J [0861
Square of number of -0029 -0003 -0009 -0004 0001 -0004 -0008 -0005 -0014 -0005 -0005 -OOOS infants [279] [053J [130J [0S7] [013J [061] [105J [067J [179] [069] [084] 1069]
Number of children 0564 0035 0079 0033 0041 0033 0052 0034 0055 0031 0015 0031 (age 5-14) 11704J [086J [202] [087] 110SJ 1088J [168) [090) [171] [083) [055] [082]
Square of number -0070 -0004 -0008 -0004 0000 -0004 -0004 -0004 -0002 -0004 0000 -0004 of children [1044] [045] [118] [061] [001] [059J [079] [060J [028J [056] [002J [0S6]
Number of adults 0222 -0116 -0052 -0106 -0106 -0113 -0037 -0110 0095 -0116 0045 -0116 [668) [225) [100) [215) [200] [222J [107) [220] [261] [2261 [136] [2261
Square of number -0012 0010 0007 0009 0010 0010 0001 0010 -0005 0011 -0001 0011 of adults [364] [186) [132] [1791 [179] [190] 1030] [186J [154] [192) [026) [193]shy
Number of elderly 0116 -0135 0217 -0147 -0048 -0145 0180 -0119 0035 -0143 -0130 -0135 (age 6S+) [108] [106J [146] [US] [036] [111J [156] [092J [029] [109] [124] [104J Square of number -0030 0019 -0071 0030 -0008 0034 -0057 0022 0015 0026 0058 0024 of elderly [057J [036) [113] [056) [014) [061] [110J [040] [028] [047] [119) [0441
Female-headed -7759 -1265 -0711 -1213 -1452 -1195 -1369 -1224 -0625 -1277 -0289 -1250 household [2690] [174)- [106) [163] [218J [163) [180J- [158J [084J [168] [038) ]164)
Age of household head 0014 Om5 0047 0Q18 0012 0016 0026 0016 0004 0019 0012 0018 [111) [0841 [307) [1001 [081[ [093] [191) [090J [031] [108) [092J [1061
Square of age of 0000 0000 -0001 0000 0000 0000 0000 0000 0000 0000 0000 0000 household head [1311 [149J [376] [165) [1421 [156] [272]- [1561 [061] [1721- [121] [1691shy
Age of spouse 0022 0029 -0031 0025 0000 0028 0008 0027 0014 0025 0006 0025 [1561 [152) [186)- [1331 [001) [1471 [0511 [144] [098] [129] [0441 [132J
Square of age of spouse 0000 0000 0000 0000 0000 0000 0000 0000 0000 0000 0000 0000 [124J [211) [168]- [196]-- [025] [214] [038] [208]- [US] [1921- [068J [1961shy
I) ltD a ~
u raquo
0
(fJ
Gl 0 raquo rshy ~ en ~r Cl Cl Head has customary 0316 -0343 -0152 -0378 0100 -0376 0024 -0373 0089 -0356 -0031 -0358 jgt marriage [307] [266] [100] [288] [086] [283J [022] [289] [090J [277J [034] [276]8
Head has Islamic marriage 0403 -0154 -0178 -0182 -0254 -0185 -0080 -0178 -0150 -0168 -0210 -0160 [319] [094J [116] [108J [192J [111J [066J 1107] 1131J 1102J 1201J 1095J
Head has Christian 0436 -0481 -0112 -0509 0150 -0503 -0048 -0517 0062 -0498 0089 -0490 1361] [331] [066] [350J [114J [340] [038] 1358] [057] [346] [089] [339J
primary 0254 -0006 0249 -0012 0163 -0013 -0010 -OQ15 0211 -0006 0114 -0006 education 1242] 1005J 1144] [010] [140J [010J 101 OJ 1012] 1178J 1005J [119J [005]
Head completed primary 0320 0310 0093 0300 0193 0311 0127 0286 0176 0309 0124 0314 education 1475] [321] [110] [310J 1228J [319J [159J [301] [246] [316] [194] [320]
Head incomplete 0226 0077 0015 0053 0115 0074 0108 0043 0147 0Q75 0093 0078 secondary education [149] [028] [009] [020] 1069] [027] [074] [016] [109] [027] [079] [028]
Head completed 0355 0063 0136 0102 0183 0081 -0029 0076 0061 0076 0197 0088 secondary education [363] [045J [1051 [073] [149] [0571 [024] [054] [065] [054J [225] [062]
(fJ Head tertiarv education 0430 0085 0172 0109 0220 0118 0128 0081 0083 0113 0228 0119 (fJ [369] [063] [113) [081J [167] [088] [102J 1060] 1082] [084] 1237J 1088]
Spouse incomplete 0163 -0208 -0051 -0202 -0326 -0240 0123 -0212 -0048 -0234 -0232 -0239 primary education [154] [172J [030J [166J [2851 [197J [101] [176J [041] [192] 1238J [195]
Spouse completed primary 0148 -0072 -0004 -0102 -0153 -0106 0060 -0089 0097 -0094 0045 -0099 education [188] [062] [004] [089] [164] [092] [0661 [0791 [UO[ [081] 1064) [085]
Spouse incomplete 0345 -0146 -0281 -0111 -0284 -0127 -0056 -0105 -0004 -0132 -0081 -0132 secondary educ [224J [070J [155] [056J [190] [061] [0381 1053] [003] [065] [070] [065]
Spouse completed 0082 0071 -0067 0071 -0216 0046 -0036 0068 -0210 0050 -0298 0049 secondary educ [072] [048] [045] [048] [156] [031] [026] [0471 ]197] [034] [302] ]034]
Spouse tertiary education 0095 0220 0212 0188 -0088 0164 0073 0215 -0001 0182 -0220 0171 [052] [115] ]084] [099] [047] ]085] [042] [111] [001] [094] 1156] 1089]
Head unemployed -0499 -1492 -0541 -1455 -0312 -1507 -0051 -1455 -0160 -1502 -0141 -1507 gt [230] [479] [200] [472] [121] 1488] 1018J [463J 1071] 1481] [069] ]480] 0 w
continued CD co Ilt 0
en raquo
(fJ
(f)
Cl 0 raquo r 0 I
t txgt
0 CD
~~ 0- 0 Table 11A2 Bivariate Probit Regressions for Men in Nigeria continued ~
Decide Contrib Decide Contrib Decide Contrib Decide Contrib Decide Contrib Decide Contrib~ education income health income food income cloth income land use income crop sales income
Head not in labor force -J618 -1525 -J858 -1479 -J428 -1522 -J443 -1481 -J358 -1520 -J200 -1509 [3341 [5331 [366] [525] [191[ [S40J [181] 517] 1187] [531]- [119) 526]
Head in public or -J063 -J186 0136 -0173 -J201 -0157 -J401 -J169 -J099 -J175 -J270 -J162 parastatal sector [0351 [097] [057] [090] [101[ [081] [239] 1089] [081] 1092J [206] 1085]
Head wage earner -J075 -J043 -J452 -0062 0061 -J1 02 0297 -J062 0041 -J083 0188 -J094 1035] 1014] 1144] [021] [023 [ [035J 11111 10211 1021] [028] [1011 [031]
Head self employed -J423 -J138 -J277 -0129 0177 -0154 -J025 -J143 -0100 -J151 -0069 -J161 [2621 [055] [137] 10521 [0891 [062] [011] [056] [058] [059] [047] 1062]
Head unpaid family -J518 -J486 -0602 -J484 0241 -J503 -J139 -J493 -J177 -J494 -J089 -J503 worker [295] [181] [283] [183] 1107] [190] [056] 1184] [092] [182] [0541 [184]
Spouse unemployed -J160 0589 -JOO7 0598 0270 0619 -J150 0564 0067 0627 -J140 0575(f) (f)[0521 [204] [002] [210] [0791 [218Jmiddot- [051J [1981- [0261 [220) [060J [201Jmiddotmiddot
Spouse not in labor force -J112 0431 0200 0415 0568 0456 0293 0399 0271 0440 -J014 0395 [039J [163) [063J [1611 [177]- [175] [111] 1152J 1113) [168Jmiddot [006J 1150]
Spouse in public or -0217 0069 -J501 0036 0273 0072 -0397 0041 -J142 0053 0161 0062 parastatal sector [086] 1030] [166]- [016] [108] ]0311 [172[ [018] [O63J [O23J [O83J [O27J
Spouse wage earner -0322 -J802 0059 -J754 0093 -J746 0256 -J775 0166 -0757 -J245 -0808 [095] [256) [O15J [242] [026) [239 [083 [245 [055] [245) 1089) 261J
self employed -J160 -J251 0517 -J255 0468 -J238 0363 -J268 0273 -J251 0248 -J287 [057J [103] [168) [107[ [148] [099] 1144) [111] 1118] [104) [117) [118)
Spouse unpaid family -J236 -J084 0056 -J088 0538 -0064 0013 -Jl00 0290 -Jon 0037 -J101 worker [084] [034) 1018] [0361 [1671 10271 [005] [0411 [124] [030] [017) [041]
Head in manuflconstrl -J115 0156 0029 0155 0085 0156 0002 0152 -0527 0149 -JS70 0134 transport [1101 11161 1020] [116J 1071] [117J 10021 11141 1557] [112J [657J- [100J
Head in wholesaleretail -0011 -J060 -0183 -J089 0088 -J076 -0114 -J093 -0426 -J073 -J420 -J083 [013J [048J [167] [070J [O75J 1060] [121] [0741 ]531J [056] [572J [064J
~ ~
U 0gt
raquo
(f)
0
Gl C raquo E 1
~ ~ 0
5shyshy- Head in serviceeducation -0066 0132 -0088 0098 0044 0113 -0114 0092 -0397 0115 -0374 0103 admlother [078] [076] [072] [056] [046] [065] [123] [053] [479] [066] [470] [059]0
Spouse in manuflconstrl 0160 -0394 -0130 -0411 0146 -0419 0109 -0426 -0573 -0412 -0574 -0415 transport [113] [229] [090] [244] [085] [248] [075] [253] [427] [239 [451] [241]
Spouse in wholesaleretail 0002 0098 0092 0109 0140 0114 -0011 0110 -0465 0118 -0467 0123 [003] [116 [116] [128] [165] [136] 017J [129] 688J [138) [780] [144]
Spouse in serviceeducl 0103 -0191 0628 -0186 0309 -0196 0312 -0185 -0256 -0199 -0110 -0187 admlother [141] [169] [644] [163] [279J [173J [349J [162] [302J [174] [153J [164]
Individual owns house 0099 0034 0204 0041 0109 0033 0094 0038 0800 0031 0736 0033 [184] [047] [295] [057] [176] [045] [157] [053] [1609] [042] [1553] 1046]
Head temporary migrant -0307 -0778 -0149 -0754 -0252 -0738 0247 -0744 -0148 -0759 -0047 -0761 [155] [358] [062] [349J [121] [3391 [124] [343] [068] [3541 [024] [357J
Household has access -0029 -0087 0038 -0093 0036 -0094 0017 -0092 0003 -0092 0002 -0090 to electricity [119] [251] [107] [268] [120] [272] 056] [273] [012] [270J [009J [261]
Household has access 0183 -0221 -0244 -0237 -0072 -0211 -0076 -0216 0043 -0216 -0060 -0210 to piped water [233J [193J [239J [207J [066] 1182J [084] [189J [O5St 1187] [O86J [182J Household has toilet -0122 0157 -0236 0134 -0300 0137 -0317 0139 -0178 0157 -0134 0140
[076] [100J [117] [083] [203] [084J [198J [086] [LSI] [096J [114J [086]
Wealth index 0131 -0014 0112 -0004 0148 -0011 0152 -0003 -0099 -0014 -0035 -0015 [361J [0291 [240J [009] 1336] [022] [361] [007] 1261J [O28J [095] [030J
Wealth index squared -0005 0004 -0005 0004 -0011 0004 -0008 0004 -0001 0004 -0006 0004 [145J [100J [116] [085] [281] [091] [212] [084J [025] [O96J [170J [0971
Constant -1696 2159 0202 2158 0117 2194 -0575 2207 0199 2205 0085 2249 [410] [434] [044J [4331 [O26J [439] [139] [441J [052J [441J [024J 1448Jmiddotmiddot
Observations 10671 10671 10671 10671 10671 10671 10671 10671 10671 10671 10671 10671
Source Authors estimates using Nigerias CWIQ 2003 Notes State dummy variables induded in the regressions but not shown in the tables () denotes coefficient statistically significant at 10 level ( ) at 5 level and ( ) significant at 1 level
jgt
0 V1
2gt ~
Oi 01
raquo
406 GENDER DISPARITIES IN AfRICAS LABOR MARKET
References Babalola A and C Dennis 1988 Returns to Womens Labour in Cash Crop producshy
tions Tobacco in Igboho Oyo State Nigeria In Agriculture Women and Land The African Experience ed J Davidson Boulder CO West View Press
Backiny-Yetna P and Q Wodon 2010 Gender Labor Income Shares and Human Capital Investment in the Republic of Congo In Gender Disparities in Africas Labor Market ed J S Arbache A Kolev and E Filipiak Washington DC World Bank
Blackden C M and C Bhanu 1999 Gender Growth and Poverty Reduction Special Program ofAssistance for Africa 1998 Status Report on Poverty World Bank Technical Paper 428 Washington DC World Bank
Bourguignon F and P A Chiappori 1992 Collective Models of Household Behavior An Introduction European Economic Review 36 (2-3) 355-64
Browning M and P A Chiappori 1998 Efficient Intra-Household Allocations A General Characterization and Empirical Tests Econometrica 66 (6) 1241-78
Bussolo M R E De Hoyos and Q Wodon 2009 Higher Prices of Export Crops Intra-Household Inequality and Human Capital Accumulation in Senegal In Gender Aspects of the Trade and Poverty Nexus A Macro-Micro Approach ed M Bussolo and R E De Hoyos Washington DC World Bank and Palgrave Macmillan
Chukwuezi B 1999 De-agrarianization and Rural Employment in South Eastern Nigeria Working Paper 37 African Studies Centre University of Leiden the Netherlands
Hoddinott J and L Haddad 1995 Does Female Income Share Influence Household Expenditures Evidence from C6te dIvoire Oxford Bulletin of Economics and Statisshytics 57 (1) 77-96
lloyd C B and A K Blanc 1996 Childrens Schooling in Sub-Saharan Africa The Role of Fathers Mothers and Others Population and Development Review 22 (2) 265-98
Manser M and M Brown 1980 Marriage and Household Decision Making A Bargaining Analysis International Economic Review 21 (1) 31-34
McElroy M B and M J Homey 1981 Nash-bargained Household Decisions Toward a Generalization of the Theory of Demand International Economic Review 22 (2) 333-49
Piesse J and J Simister 2003 Bargaining and Household Dynamics The Impact of Education and Financial Control on Nutrition Outcomes in South Africa South African Journal ofEconomics 71 (1) 163-72
World Bank 2004 Nigeria Poverty and Vulnerability-A Preliminary Diagnostic Unpublished manuscript Human Development Department Africa Region World Bank Washington DC
--- 2005 Uganda From Periphery to Center A Strategic Country Gender Assessment Poverty Reduction and Economic Management Africa Region World Bank Washington DC
GDALM_381-406indd 406 29106110 11 55 AM I
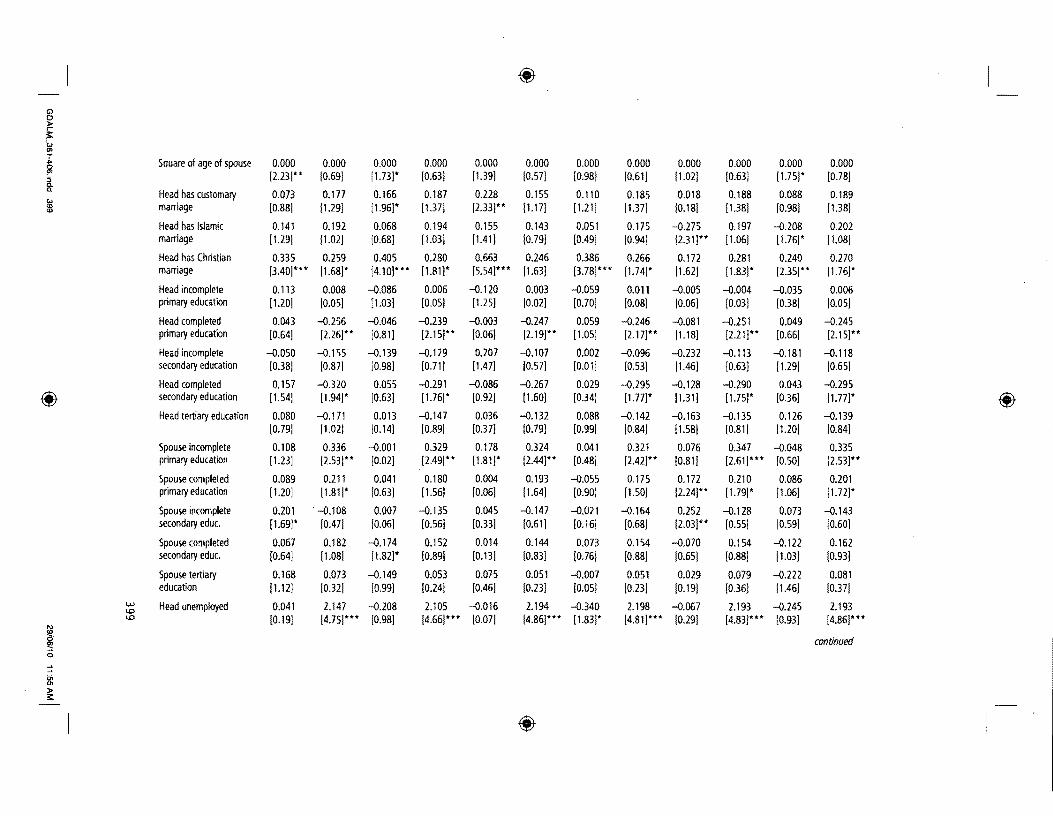
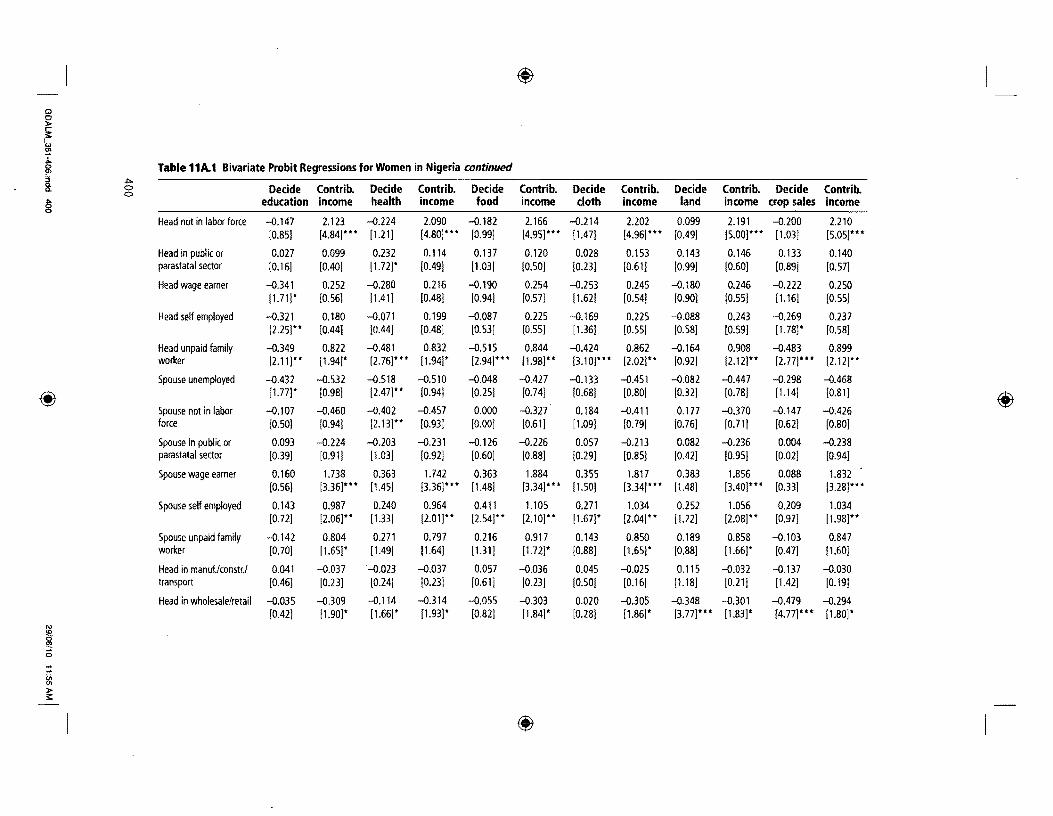
(f)
Gl 0 raquo rshy I
t 00 $ f Q Head in servicel -J043 -J385 -0093 -0370 -0085 -J391 0027 -0403 -J015 -0385 -J228 -0384Q
educationladmlother [051] 1195] [128] [194] [122] [198]-- [036J [2011 1017] [199J [248]-- 1199J51
Spouse in manufconstrl 0185 0438 0075 0408 -0114 0397 0183 0409 -0571 0435 -0739 0424 transport [118] [226J [073] [205]-- [113J [206J [1781- [209J-- [258] [228) 1315] [219J
Spouse in wholesalel 0002 0121 -J069 0124 -J205 0114 0027 0125 -0543 0133 -0525 0127 retail [003] [134] [123J [137] [357] 1126] [049] [138] [891] [147] [848J [140J
Spouse in serviceleducl 0059 0324 0433 0317 -0028 0311 -0037 0304 -0645 0287 -0676 0292 admlother [070] [225]-- [664] [221] [045] [214J [059] [210] [637] [200] [778] [202]
Individual owns house 0365 0395 0319 0375 0851 0389 0462 0367 1204 Q401 1078 0396 [454] [357] [484] [336] [1035] [350] [688] [335] (1651] [364]middot [1295] [364]
Head temporary migrant 0226 1203 0220 1167 -J151 1163 -J120 1175 -J451 1194 -J328 1202 [080] [533] [119] [517] [086J [512] [070J [520] [187] [528]middot [149] [539]
Household has access to 0046 0120 0067 0121 0004 0123 0068 0121 -J014 0121 0032 0122 electricity [205]middotmiddot [324] [319]-- [330]--- [016] [330]--- [333]--- [326] (052] [333]--middot [131] [330]
(f) (f)Household has access to 0077 -0174 -J129 -0166 -0121 -0179 -0011 -0167 -J078 -0164 0017 -0164 piped water [103] [124] [186]- [119] [173] [127] [016] [119] 1081] [117] [017] [117]
Household has toilet -0005 0122 0092 0126 -0021 0155 0047 0129 -0479 0127 -0336 0113 facility
Wealth index 0129 -0043 0022 -J041 -0067 -J033 -0028 -0045 -0019 -0041 -0033 -0038 [382Jmiddotmiddot- [074J [074] 1070J [205J [055J [0911 [077] [052] [070] [086] [065)
Wealth index squared -0008 -0003 -0001 -0003 0005 -J004 0001 -J003 0000 -0003 -JOOl -J003 1275] [050] [041) (058) [165 [074 [048 [053] [014] [063 [042] [064)
Constant -2636 -4279 -J81 0 -4328 0289 -4470 -0446 -4365 -1109 -4415 -0430 -4428 [680] [572]middot bull [256) [577] [092] [571] [147] [563)--- 1308)middot 1573] [116] [569)
Observations 13225 13225 13225 13225 13225 13225 13209 13209 13209 13209 13209 13209
Source Authors estimates using Nigerias CWlQ 2003 Notes State dummy variables induded in the regressions but not shown in the tables () denotes coefficient statistically significant at 10 level () at 5 level and ( ) significant
jgt at 1 level 0
I) ltDc
0 ~
-(j raquo
(f)
G) 0 raquo rshy ~ ilojCl Cl
jgt
0 -
Table 11A2 Bivariate Probit Regressions for Men in Nigeria
Decide Contrib Decide Contrib Decide Contrib Decide Contrib Decide Contrib Decide Contrib 1G education income health income food income cloth income land use income sales income
Number of infants 0232 0033 0016 0033 -0079 0033 0029 0038 0089 0036 0037 0038 under-S [54S] [076] [040] [074] [202] [074] [0771 [085J [25SJ [0811 [122J [0861
Square of number of -0029 -0003 -0009 -0004 0001 -0004 -0008 -0005 -0014 -0005 -0005 -OOOS infants [279] [053J [130J [0S7] [013J [061] [105J [067J [179] [069] [084] 1069]
Number of children 0564 0035 0079 0033 0041 0033 0052 0034 0055 0031 0015 0031 (age 5-14) 11704J [086J [202] [087] 110SJ 1088J [168) [090) [171] [083) [055] [082]
Square of number -0070 -0004 -0008 -0004 0000 -0004 -0004 -0004 -0002 -0004 0000 -0004 of children [1044] [045] [118] [061] [001] [059J [079] [060J [028J [056] [002J [0S6]
Number of adults 0222 -0116 -0052 -0106 -0106 -0113 -0037 -0110 0095 -0116 0045 -0116 [668) [225) [100) [215) [200] [222J [107) [220] [261] [2261 [136] [2261
Square of number -0012 0010 0007 0009 0010 0010 0001 0010 -0005 0011 -0001 0011 of adults [364] [186) [132] [1791 [179] [190] 1030] [186J [154] [192) [026) [193]shy
Number of elderly 0116 -0135 0217 -0147 -0048 -0145 0180 -0119 0035 -0143 -0130 -0135 (age 6S+) [108] [106J [146] [US] [036] [111J [156] [092J [029] [109] [124] [104J Square of number -0030 0019 -0071 0030 -0008 0034 -0057 0022 0015 0026 0058 0024 of elderly [057J [036) [113] [056) [014) [061] [110J [040] [028] [047] [119) [0441
Female-headed -7759 -1265 -0711 -1213 -1452 -1195 -1369 -1224 -0625 -1277 -0289 -1250 household [2690] [174)- [106) [163] [218J [163) [180J- [158J [084J [168] [038) ]164)
Age of household head 0014 Om5 0047 0Q18 0012 0016 0026 0016 0004 0019 0012 0018 [111) [0841 [307) [1001 [081[ [093] [191) [090J [031] [108) [092J [1061
Square of age of 0000 0000 -0001 0000 0000 0000 0000 0000 0000 0000 0000 0000 household head [1311 [149J [376] [165) [1421 [156] [272]- [1561 [061] [1721- [121] [1691shy
Age of spouse 0022 0029 -0031 0025 0000 0028 0008 0027 0014 0025 0006 0025 [1561 [152) [186)- [1331 [001) [1471 [0511 [144] [098] [129] [0441 [132J
Square of age of spouse 0000 0000 0000 0000 0000 0000 0000 0000 0000 0000 0000 0000 [124J [211) [168]- [196]-- [025] [214] [038] [208]- [US] [1921- [068J [1961shy
I) ltD a ~
u raquo
0
(fJ
Gl 0 raquo rshy ~ en ~r Cl Cl Head has customary 0316 -0343 -0152 -0378 0100 -0376 0024 -0373 0089 -0356 -0031 -0358 jgt marriage [307] [266] [100] [288] [086] [283J [022] [289] [090J [277J [034] [276]8
Head has Islamic marriage 0403 -0154 -0178 -0182 -0254 -0185 -0080 -0178 -0150 -0168 -0210 -0160 [319] [094J [116] [108J [192J [111J [066J 1107] 1131J 1102J 1201J 1095J
Head has Christian 0436 -0481 -0112 -0509 0150 -0503 -0048 -0517 0062 -0498 0089 -0490 1361] [331] [066] [350J [114J [340] [038] 1358] [057] [346] [089] [339J
primary 0254 -0006 0249 -0012 0163 -0013 -0010 -OQ15 0211 -0006 0114 -0006 education 1242] 1005J 1144] [010] [140J [010J 101 OJ 1012] 1178J 1005J [119J [005]
Head completed primary 0320 0310 0093 0300 0193 0311 0127 0286 0176 0309 0124 0314 education 1475] [321] [110] [310J 1228J [319J [159J [301] [246] [316] [194] [320]
Head incomplete 0226 0077 0015 0053 0115 0074 0108 0043 0147 0Q75 0093 0078 secondary education [149] [028] [009] [020] 1069] [027] [074] [016] [109] [027] [079] [028]
Head completed 0355 0063 0136 0102 0183 0081 -0029 0076 0061 0076 0197 0088 secondary education [363] [045J [1051 [073] [149] [0571 [024] [054] [065] [054J [225] [062]
(fJ Head tertiarv education 0430 0085 0172 0109 0220 0118 0128 0081 0083 0113 0228 0119 (fJ [369] [063] [113) [081J [167] [088] [102J 1060] 1082] [084] 1237J 1088]
Spouse incomplete 0163 -0208 -0051 -0202 -0326 -0240 0123 -0212 -0048 -0234 -0232 -0239 primary education [154] [172J [030J [166J [2851 [197J [101] [176J [041] [192] 1238J [195]
Spouse completed primary 0148 -0072 -0004 -0102 -0153 -0106 0060 -0089 0097 -0094 0045 -0099 education [188] [062] [004] [089] [164] [092] [0661 [0791 [UO[ [081] 1064) [085]
Spouse incomplete 0345 -0146 -0281 -0111 -0284 -0127 -0056 -0105 -0004 -0132 -0081 -0132 secondary educ [224J [070J [155] [056J [190] [061] [0381 1053] [003] [065] [070] [065]
Spouse completed 0082 0071 -0067 0071 -0216 0046 -0036 0068 -0210 0050 -0298 0049 secondary educ [072] [048] [045] [048] [156] [031] [026] [0471 ]197] [034] [302] ]034]
Spouse tertiary education 0095 0220 0212 0188 -0088 0164 0073 0215 -0001 0182 -0220 0171 [052] [115] ]084] [099] [047] ]085] [042] [111] [001] [094] 1156] 1089]
Head unemployed -0499 -1492 -0541 -1455 -0312 -1507 -0051 -1455 -0160 -1502 -0141 -1507 gt [230] [479] [200] [472] [121] 1488] 1018J [463J 1071] 1481] [069] ]480] 0 w
continued CD co Ilt 0
en raquo
(fJ
(f)
Cl 0 raquo r 0 I
t txgt
0 CD
~~ 0- 0 Table 11A2 Bivariate Probit Regressions for Men in Nigeria continued ~
Decide Contrib Decide Contrib Decide Contrib Decide Contrib Decide Contrib Decide Contrib~ education income health income food income cloth income land use income crop sales income
Head not in labor force -J618 -1525 -J858 -1479 -J428 -1522 -J443 -1481 -J358 -1520 -J200 -1509 [3341 [5331 [366] [525] [191[ [S40J [181] 517] 1187] [531]- [119) 526]
Head in public or -J063 -J186 0136 -0173 -J201 -0157 -J401 -J169 -J099 -J175 -J270 -J162 parastatal sector [0351 [097] [057] [090] [101[ [081] [239] 1089] [081] 1092J [206] 1085]
Head wage earner -J075 -J043 -J452 -0062 0061 -J1 02 0297 -J062 0041 -J083 0188 -J094 1035] 1014] 1144] [021] [023 [ [035J 11111 10211 1021] [028] [1011 [031]
Head self employed -J423 -J138 -J277 -0129 0177 -0154 -J025 -J143 -0100 -J151 -0069 -J161 [2621 [055] [137] 10521 [0891 [062] [011] [056] [058] [059] [047] 1062]
Head unpaid family -J518 -J486 -0602 -J484 0241 -J503 -J139 -J493 -J177 -J494 -J089 -J503 worker [295] [181] [283] [183] 1107] [190] [056] 1184] [092] [182] [0541 [184]
Spouse unemployed -J160 0589 -JOO7 0598 0270 0619 -J150 0564 0067 0627 -J140 0575(f) (f)[0521 [204] [002] [210] [0791 [218Jmiddot- [051J [1981- [0261 [220) [060J [201Jmiddotmiddot
Spouse not in labor force -J112 0431 0200 0415 0568 0456 0293 0399 0271 0440 -J014 0395 [039J [163) [063J [1611 [177]- [175] [111] 1152J 1113) [168Jmiddot [006J 1150]
Spouse in public or -0217 0069 -J501 0036 0273 0072 -0397 0041 -J142 0053 0161 0062 parastatal sector [086] 1030] [166]- [016] [108] ]0311 [172[ [018] [O63J [O23J [O83J [O27J
Spouse wage earner -0322 -J802 0059 -J754 0093 -J746 0256 -J775 0166 -0757 -J245 -0808 [095] [256) [O15J [242] [026) [239 [083 [245 [055] [245) 1089) 261J
self employed -J160 -J251 0517 -J255 0468 -J238 0363 -J268 0273 -J251 0248 -J287 [057J [103] [168) [107[ [148] [099] 1144) [111] 1118] [104) [117) [118)
Spouse unpaid family -J236 -J084 0056 -J088 0538 -0064 0013 -Jl00 0290 -Jon 0037 -J101 worker [084] [034) 1018] [0361 [1671 10271 [005] [0411 [124] [030] [017) [041]
Head in manuflconstrl -J115 0156 0029 0155 0085 0156 0002 0152 -0527 0149 -JS70 0134 transport [1101 11161 1020] [116J 1071] [117J 10021 11141 1557] [112J [657J- [100J
Head in wholesaleretail -0011 -J060 -0183 -J089 0088 -J076 -0114 -J093 -0426 -J073 -J420 -J083 [013J [048J [167] [070J [O75J 1060] [121] [0741 ]531J [056] [572J [064J
~ ~
U 0gt
raquo
(f)
0
Gl C raquo E 1
~ ~ 0
5shyshy- Head in serviceeducation -0066 0132 -0088 0098 0044 0113 -0114 0092 -0397 0115 -0374 0103 admlother [078] [076] [072] [056] [046] [065] [123] [053] [479] [066] [470] [059]0
Spouse in manuflconstrl 0160 -0394 -0130 -0411 0146 -0419 0109 -0426 -0573 -0412 -0574 -0415 transport [113] [229] [090] [244] [085] [248] [075] [253] [427] [239 [451] [241]
Spouse in wholesaleretail 0002 0098 0092 0109 0140 0114 -0011 0110 -0465 0118 -0467 0123 [003] [116 [116] [128] [165] [136] 017J [129] 688J [138) [780] [144]
Spouse in serviceeducl 0103 -0191 0628 -0186 0309 -0196 0312 -0185 -0256 -0199 -0110 -0187 admlother [141] [169] [644] [163] [279J [173J [349J [162] [302J [174] [153J [164]
Individual owns house 0099 0034 0204 0041 0109 0033 0094 0038 0800 0031 0736 0033 [184] [047] [295] [057] [176] [045] [157] [053] [1609] [042] [1553] 1046]
Head temporary migrant -0307 -0778 -0149 -0754 -0252 -0738 0247 -0744 -0148 -0759 -0047 -0761 [155] [358] [062] [349J [121] [3391 [124] [343] [068] [3541 [024] [357J
Household has access -0029 -0087 0038 -0093 0036 -0094 0017 -0092 0003 -0092 0002 -0090 to electricity [119] [251] [107] [268] [120] [272] 056] [273] [012] [270J [009J [261]
Household has access 0183 -0221 -0244 -0237 -0072 -0211 -0076 -0216 0043 -0216 -0060 -0210 to piped water [233J [193J [239J [207J [066] 1182J [084] [189J [O5St 1187] [O86J [182J Household has toilet -0122 0157 -0236 0134 -0300 0137 -0317 0139 -0178 0157 -0134 0140
[076] [100J [117] [083] [203] [084J [198J [086] [LSI] [096J [114J [086]
Wealth index 0131 -0014 0112 -0004 0148 -0011 0152 -0003 -0099 -0014 -0035 -0015 [361J [0291 [240J [009] 1336] [022] [361] [007] 1261J [O28J [095] [030J
Wealth index squared -0005 0004 -0005 0004 -0011 0004 -0008 0004 -0001 0004 -0006 0004 [145J [100J [116] [085] [281] [091] [212] [084J [025] [O96J [170J [0971
Constant -1696 2159 0202 2158 0117 2194 -0575 2207 0199 2205 0085 2249 [410] [434] [044J [4331 [O26J [439] [139] [441J [052J [441J [024J 1448Jmiddotmiddot
Observations 10671 10671 10671 10671 10671 10671 10671 10671 10671 10671 10671 10671
Source Authors estimates using Nigerias CWIQ 2003 Notes State dummy variables induded in the regressions but not shown in the tables () denotes coefficient statistically significant at 10 level ( ) at 5 level and ( ) significant at 1 level
jgt
0 V1
2gt ~
Oi 01
raquo
406 GENDER DISPARITIES IN AfRICAS LABOR MARKET
References Babalola A and C Dennis 1988 Returns to Womens Labour in Cash Crop producshy
tions Tobacco in Igboho Oyo State Nigeria In Agriculture Women and Land The African Experience ed J Davidson Boulder CO West View Press
Backiny-Yetna P and Q Wodon 2010 Gender Labor Income Shares and Human Capital Investment in the Republic of Congo In Gender Disparities in Africas Labor Market ed J S Arbache A Kolev and E Filipiak Washington DC World Bank
Blackden C M and C Bhanu 1999 Gender Growth and Poverty Reduction Special Program ofAssistance for Africa 1998 Status Report on Poverty World Bank Technical Paper 428 Washington DC World Bank
Bourguignon F and P A Chiappori 1992 Collective Models of Household Behavior An Introduction European Economic Review 36 (2-3) 355-64
Browning M and P A Chiappori 1998 Efficient Intra-Household Allocations A General Characterization and Empirical Tests Econometrica 66 (6) 1241-78
Bussolo M R E De Hoyos and Q Wodon 2009 Higher Prices of Export Crops Intra-Household Inequality and Human Capital Accumulation in Senegal In Gender Aspects of the Trade and Poverty Nexus A Macro-Micro Approach ed M Bussolo and R E De Hoyos Washington DC World Bank and Palgrave Macmillan
Chukwuezi B 1999 De-agrarianization and Rural Employment in South Eastern Nigeria Working Paper 37 African Studies Centre University of Leiden the Netherlands
Hoddinott J and L Haddad 1995 Does Female Income Share Influence Household Expenditures Evidence from C6te dIvoire Oxford Bulletin of Economics and Statisshytics 57 (1) 77-96
lloyd C B and A K Blanc 1996 Childrens Schooling in Sub-Saharan Africa The Role of Fathers Mothers and Others Population and Development Review 22 (2) 265-98
Manser M and M Brown 1980 Marriage and Household Decision Making A Bargaining Analysis International Economic Review 21 (1) 31-34
McElroy M B and M J Homey 1981 Nash-bargained Household Decisions Toward a Generalization of the Theory of Demand International Economic Review 22 (2) 333-49
Piesse J and J Simister 2003 Bargaining and Household Dynamics The Impact of Education and Financial Control on Nutrition Outcomes in South Africa South African Journal ofEconomics 71 (1) 163-72
World Bank 2004 Nigeria Poverty and Vulnerability-A Preliminary Diagnostic Unpublished manuscript Human Development Department Africa Region World Bank Washington DC
--- 2005 Uganda From Periphery to Center A Strategic Country Gender Assessment Poverty Reduction and Economic Management Africa Region World Bank Washington DC
GDALM_381-406indd 406 29106110 11 55 AM I
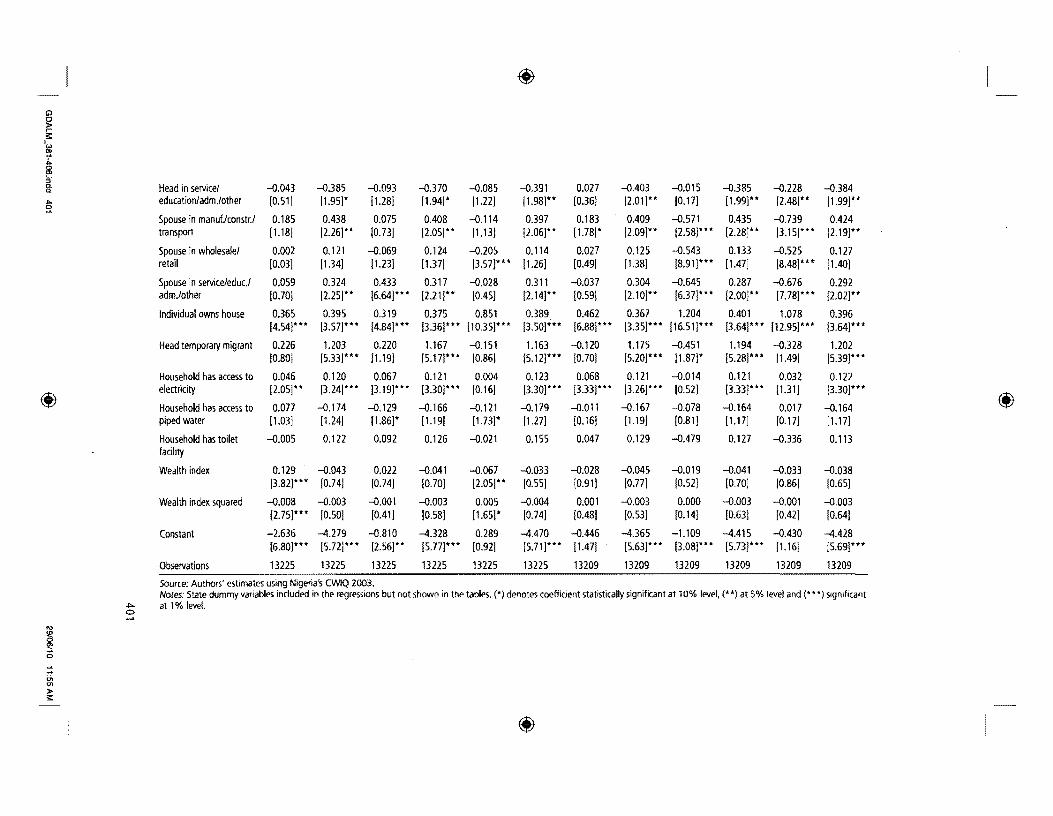
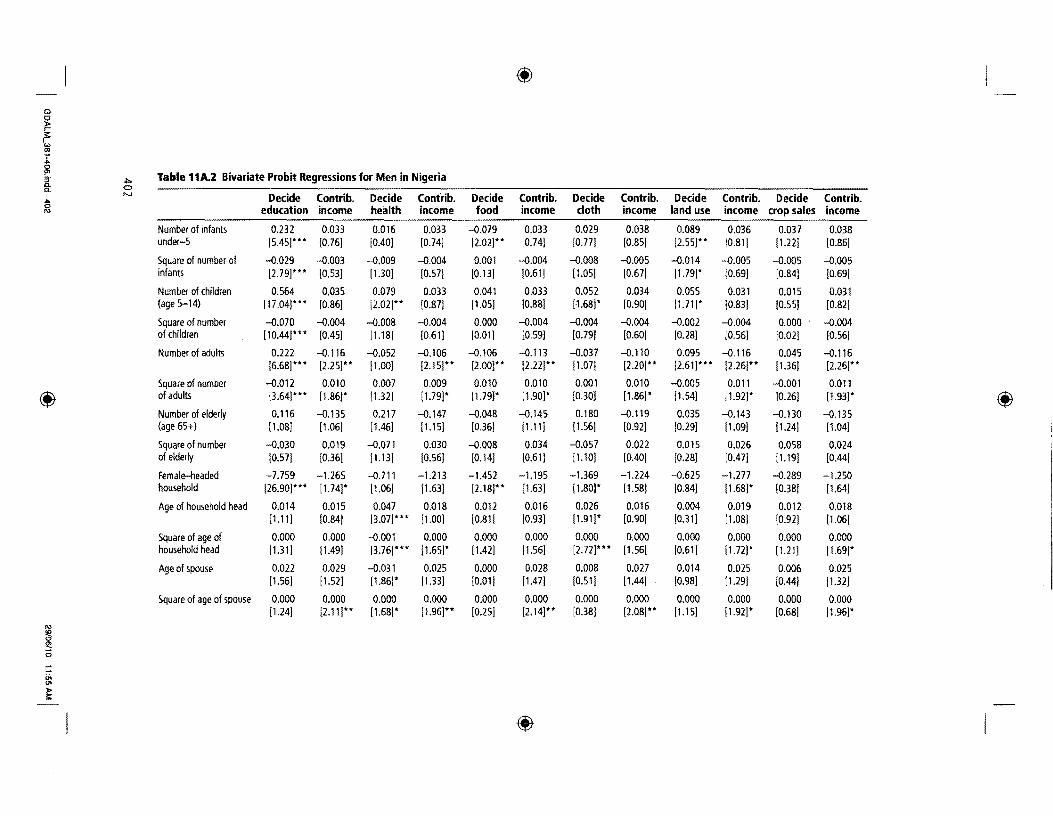
(fJ
Gl 0 raquo rshy ~ en ~r Cl Cl Head has customary 0316 -0343 -0152 -0378 0100 -0376 0024 -0373 0089 -0356 -0031 -0358 jgt marriage [307] [266] [100] [288] [086] [283J [022] [289] [090J [277J [034] [276]8
Head has Islamic marriage 0403 -0154 -0178 -0182 -0254 -0185 -0080 -0178 -0150 -0168 -0210 -0160 [319] [094J [116] [108J [192J [111J [066J 1107] 1131J 1102J 1201J 1095J
Head has Christian 0436 -0481 -0112 -0509 0150 -0503 -0048 -0517 0062 -0498 0089 -0490 1361] [331] [066] [350J [114J [340] [038] 1358] [057] [346] [089] [339J
primary 0254 -0006 0249 -0012 0163 -0013 -0010 -OQ15 0211 -0006 0114 -0006 education 1242] 1005J 1144] [010] [140J [010J 101 OJ 1012] 1178J 1005J [119J [005]
Head completed primary 0320 0310 0093 0300 0193 0311 0127 0286 0176 0309 0124 0314 education 1475] [321] [110] [310J 1228J [319J [159J [301] [246] [316] [194] [320]
Head incomplete 0226 0077 0015 0053 0115 0074 0108 0043 0147 0Q75 0093 0078 secondary education [149] [028] [009] [020] 1069] [027] [074] [016] [109] [027] [079] [028]
Head completed 0355 0063 0136 0102 0183 0081 -0029 0076 0061 0076 0197 0088 secondary education [363] [045J [1051 [073] [149] [0571 [024] [054] [065] [054J [225] [062]
(fJ Head tertiarv education 0430 0085 0172 0109 0220 0118 0128 0081 0083 0113 0228 0119 (fJ [369] [063] [113) [081J [167] [088] [102J 1060] 1082] [084] 1237J 1088]
Spouse incomplete 0163 -0208 -0051 -0202 -0326 -0240 0123 -0212 -0048 -0234 -0232 -0239 primary education [154] [172J [030J [166J [2851 [197J [101] [176J [041] [192] 1238J [195]
Spouse completed primary 0148 -0072 -0004 -0102 -0153 -0106 0060 -0089 0097 -0094 0045 -0099 education [188] [062] [004] [089] [164] [092] [0661 [0791 [UO[ [081] 1064) [085]
Spouse incomplete 0345 -0146 -0281 -0111 -0284 -0127 -0056 -0105 -0004 -0132 -0081 -0132 secondary educ [224J [070J [155] [056J [190] [061] [0381 1053] [003] [065] [070] [065]
Spouse completed 0082 0071 -0067 0071 -0216 0046 -0036 0068 -0210 0050 -0298 0049 secondary educ [072] [048] [045] [048] [156] [031] [026] [0471 ]197] [034] [302] ]034]
Spouse tertiary education 0095 0220 0212 0188 -0088 0164 0073 0215 -0001 0182 -0220 0171 [052] [115] ]084] [099] [047] ]085] [042] [111] [001] [094] 1156] 1089]
Head unemployed -0499 -1492 -0541 -1455 -0312 -1507 -0051 -1455 -0160 -1502 -0141 -1507 gt [230] [479] [200] [472] [121] 1488] 1018J [463J 1071] 1481] [069] ]480] 0 w
continued CD co Ilt 0
en raquo
(fJ
(f)
Cl 0 raquo r 0 I
t txgt
0 CD
~~ 0- 0 Table 11A2 Bivariate Probit Regressions for Men in Nigeria continued ~
Decide Contrib Decide Contrib Decide Contrib Decide Contrib Decide Contrib Decide Contrib~ education income health income food income cloth income land use income crop sales income
Head not in labor force -J618 -1525 -J858 -1479 -J428 -1522 -J443 -1481 -J358 -1520 -J200 -1509 [3341 [5331 [366] [525] [191[ [S40J [181] 517] 1187] [531]- [119) 526]
Head in public or -J063 -J186 0136 -0173 -J201 -0157 -J401 -J169 -J099 -J175 -J270 -J162 parastatal sector [0351 [097] [057] [090] [101[ [081] [239] 1089] [081] 1092J [206] 1085]
Head wage earner -J075 -J043 -J452 -0062 0061 -J1 02 0297 -J062 0041 -J083 0188 -J094 1035] 1014] 1144] [021] [023 [ [035J 11111 10211 1021] [028] [1011 [031]
Head self employed -J423 -J138 -J277 -0129 0177 -0154 -J025 -J143 -0100 -J151 -0069 -J161 [2621 [055] [137] 10521 [0891 [062] [011] [056] [058] [059] [047] 1062]
Head unpaid family -J518 -J486 -0602 -J484 0241 -J503 -J139 -J493 -J177 -J494 -J089 -J503 worker [295] [181] [283] [183] 1107] [190] [056] 1184] [092] [182] [0541 [184]
Spouse unemployed -J160 0589 -JOO7 0598 0270 0619 -J150 0564 0067 0627 -J140 0575(f) (f)[0521 [204] [002] [210] [0791 [218Jmiddot- [051J [1981- [0261 [220) [060J [201Jmiddotmiddot
Spouse not in labor force -J112 0431 0200 0415 0568 0456 0293 0399 0271 0440 -J014 0395 [039J [163) [063J [1611 [177]- [175] [111] 1152J 1113) [168Jmiddot [006J 1150]
Spouse in public or -0217 0069 -J501 0036 0273 0072 -0397 0041 -J142 0053 0161 0062 parastatal sector [086] 1030] [166]- [016] [108] ]0311 [172[ [018] [O63J [O23J [O83J [O27J
Spouse wage earner -0322 -J802 0059 -J754 0093 -J746 0256 -J775 0166 -0757 -J245 -0808 [095] [256) [O15J [242] [026) [239 [083 [245 [055] [245) 1089) 261J
self employed -J160 -J251 0517 -J255 0468 -J238 0363 -J268 0273 -J251 0248 -J287 [057J [103] [168) [107[ [148] [099] 1144) [111] 1118] [104) [117) [118)
Spouse unpaid family -J236 -J084 0056 -J088 0538 -0064 0013 -Jl00 0290 -Jon 0037 -J101 worker [084] [034) 1018] [0361 [1671 10271 [005] [0411 [124] [030] [017) [041]
Head in manuflconstrl -J115 0156 0029 0155 0085 0156 0002 0152 -0527 0149 -JS70 0134 transport [1101 11161 1020] [116J 1071] [117J 10021 11141 1557] [112J [657J- [100J
Head in wholesaleretail -0011 -J060 -0183 -J089 0088 -J076 -0114 -J093 -0426 -J073 -J420 -J083 [013J [048J [167] [070J [O75J 1060] [121] [0741 ]531J [056] [572J [064J
~ ~
U 0gt
raquo
(f)
0
Gl C raquo E 1
~ ~ 0
5shyshy- Head in serviceeducation -0066 0132 -0088 0098 0044 0113 -0114 0092 -0397 0115 -0374 0103 admlother [078] [076] [072] [056] [046] [065] [123] [053] [479] [066] [470] [059]0
Spouse in manuflconstrl 0160 -0394 -0130 -0411 0146 -0419 0109 -0426 -0573 -0412 -0574 -0415 transport [113] [229] [090] [244] [085] [248] [075] [253] [427] [239 [451] [241]
Spouse in wholesaleretail 0002 0098 0092 0109 0140 0114 -0011 0110 -0465 0118 -0467 0123 [003] [116 [116] [128] [165] [136] 017J [129] 688J [138) [780] [144]
Spouse in serviceeducl 0103 -0191 0628 -0186 0309 -0196 0312 -0185 -0256 -0199 -0110 -0187 admlother [141] [169] [644] [163] [279J [173J [349J [162] [302J [174] [153J [164]
Individual owns house 0099 0034 0204 0041 0109 0033 0094 0038 0800 0031 0736 0033 [184] [047] [295] [057] [176] [045] [157] [053] [1609] [042] [1553] 1046]
Head temporary migrant -0307 -0778 -0149 -0754 -0252 -0738 0247 -0744 -0148 -0759 -0047 -0761 [155] [358] [062] [349J [121] [3391 [124] [343] [068] [3541 [024] [357J
Household has access -0029 -0087 0038 -0093 0036 -0094 0017 -0092 0003 -0092 0002 -0090 to electricity [119] [251] [107] [268] [120] [272] 056] [273] [012] [270J [009J [261]
Household has access 0183 -0221 -0244 -0237 -0072 -0211 -0076 -0216 0043 -0216 -0060 -0210 to piped water [233J [193J [239J [207J [066] 1182J [084] [189J [O5St 1187] [O86J [182J Household has toilet -0122 0157 -0236 0134 -0300 0137 -0317 0139 -0178 0157 -0134 0140
[076] [100J [117] [083] [203] [084J [198J [086] [LSI] [096J [114J [086]
Wealth index 0131 -0014 0112 -0004 0148 -0011 0152 -0003 -0099 -0014 -0035 -0015 [361J [0291 [240J [009] 1336] [022] [361] [007] 1261J [O28J [095] [030J
Wealth index squared -0005 0004 -0005 0004 -0011 0004 -0008 0004 -0001 0004 -0006 0004 [145J [100J [116] [085] [281] [091] [212] [084J [025] [O96J [170J [0971
Constant -1696 2159 0202 2158 0117 2194 -0575 2207 0199 2205 0085 2249 [410] [434] [044J [4331 [O26J [439] [139] [441J [052J [441J [024J 1448Jmiddotmiddot
Observations 10671 10671 10671 10671 10671 10671 10671 10671 10671 10671 10671 10671
Source Authors estimates using Nigerias CWIQ 2003 Notes State dummy variables induded in the regressions but not shown in the tables () denotes coefficient statistically significant at 10 level ( ) at 5 level and ( ) significant at 1 level
jgt
0 V1
2gt ~
Oi 01
raquo
406 GENDER DISPARITIES IN AfRICAS LABOR MARKET
References Babalola A and C Dennis 1988 Returns to Womens Labour in Cash Crop producshy
tions Tobacco in Igboho Oyo State Nigeria In Agriculture Women and Land The African Experience ed J Davidson Boulder CO West View Press
Backiny-Yetna P and Q Wodon 2010 Gender Labor Income Shares and Human Capital Investment in the Republic of Congo In Gender Disparities in Africas Labor Market ed J S Arbache A Kolev and E Filipiak Washington DC World Bank
Blackden C M and C Bhanu 1999 Gender Growth and Poverty Reduction Special Program ofAssistance for Africa 1998 Status Report on Poverty World Bank Technical Paper 428 Washington DC World Bank
Bourguignon F and P A Chiappori 1992 Collective Models of Household Behavior An Introduction European Economic Review 36 (2-3) 355-64
Browning M and P A Chiappori 1998 Efficient Intra-Household Allocations A General Characterization and Empirical Tests Econometrica 66 (6) 1241-78
Bussolo M R E De Hoyos and Q Wodon 2009 Higher Prices of Export Crops Intra-Household Inequality and Human Capital Accumulation in Senegal In Gender Aspects of the Trade and Poverty Nexus A Macro-Micro Approach ed M Bussolo and R E De Hoyos Washington DC World Bank and Palgrave Macmillan
Chukwuezi B 1999 De-agrarianization and Rural Employment in South Eastern Nigeria Working Paper 37 African Studies Centre University of Leiden the Netherlands
Hoddinott J and L Haddad 1995 Does Female Income Share Influence Household Expenditures Evidence from C6te dIvoire Oxford Bulletin of Economics and Statisshytics 57 (1) 77-96
lloyd C B and A K Blanc 1996 Childrens Schooling in Sub-Saharan Africa The Role of Fathers Mothers and Others Population and Development Review 22 (2) 265-98
Manser M and M Brown 1980 Marriage and Household Decision Making A Bargaining Analysis International Economic Review 21 (1) 31-34
McElroy M B and M J Homey 1981 Nash-bargained Household Decisions Toward a Generalization of the Theory of Demand International Economic Review 22 (2) 333-49
Piesse J and J Simister 2003 Bargaining and Household Dynamics The Impact of Education and Financial Control on Nutrition Outcomes in South Africa South African Journal ofEconomics 71 (1) 163-72
World Bank 2004 Nigeria Poverty and Vulnerability-A Preliminary Diagnostic Unpublished manuscript Human Development Department Africa Region World Bank Washington DC
--- 2005 Uganda From Periphery to Center A Strategic Country Gender Assessment Poverty Reduction and Economic Management Africa Region World Bank Washington DC
GDALM_381-406indd 406 29106110 11 55 AM I
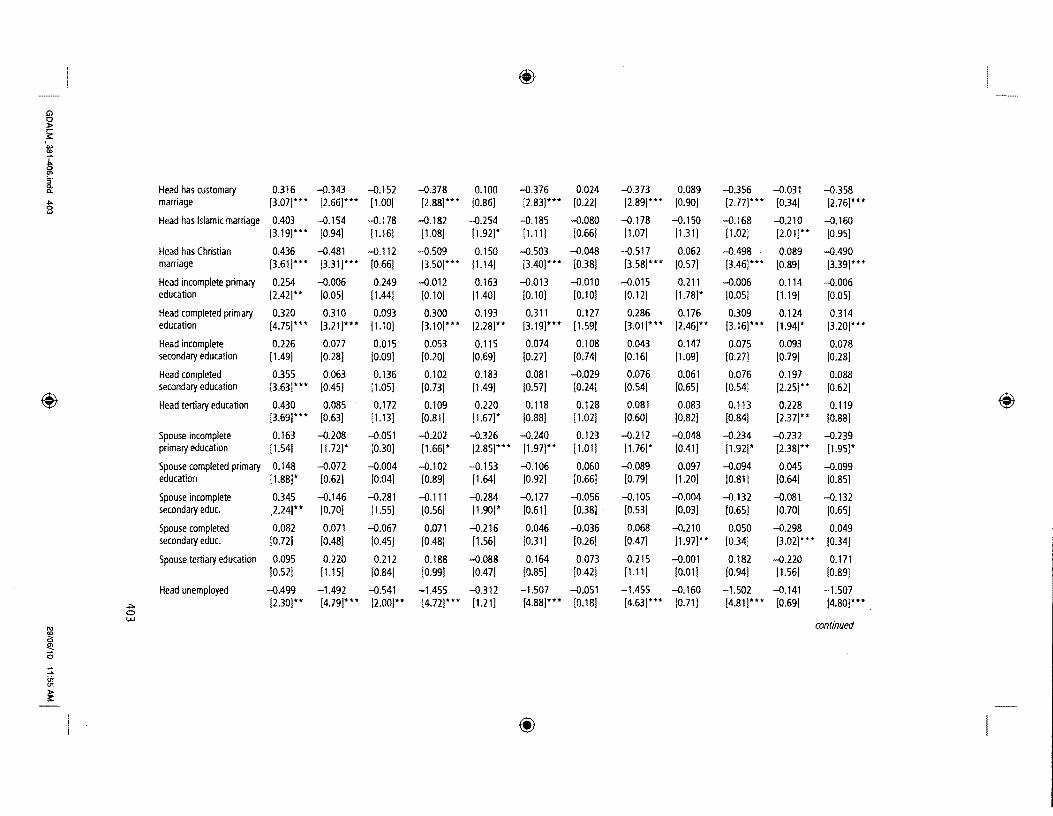
(f)
Cl 0 raquo r 0 I
t txgt
0 CD
~~ 0- 0 Table 11A2 Bivariate Probit Regressions for Men in Nigeria continued ~
Decide Contrib Decide Contrib Decide Contrib Decide Contrib Decide Contrib Decide Contrib~ education income health income food income cloth income land use income crop sales income
Head not in labor force -J618 -1525 -J858 -1479 -J428 -1522 -J443 -1481 -J358 -1520 -J200 -1509 [3341 [5331 [366] [525] [191[ [S40J [181] 517] 1187] [531]- [119) 526]
Head in public or -J063 -J186 0136 -0173 -J201 -0157 -J401 -J169 -J099 -J175 -J270 -J162 parastatal sector [0351 [097] [057] [090] [101[ [081] [239] 1089] [081] 1092J [206] 1085]
Head wage earner -J075 -J043 -J452 -0062 0061 -J1 02 0297 -J062 0041 -J083 0188 -J094 1035] 1014] 1144] [021] [023 [ [035J 11111 10211 1021] [028] [1011 [031]
Head self employed -J423 -J138 -J277 -0129 0177 -0154 -J025 -J143 -0100 -J151 -0069 -J161 [2621 [055] [137] 10521 [0891 [062] [011] [056] [058] [059] [047] 1062]
Head unpaid family -J518 -J486 -0602 -J484 0241 -J503 -J139 -J493 -J177 -J494 -J089 -J503 worker [295] [181] [283] [183] 1107] [190] [056] 1184] [092] [182] [0541 [184]
Spouse unemployed -J160 0589 -JOO7 0598 0270 0619 -J150 0564 0067 0627 -J140 0575(f) (f)[0521 [204] [002] [210] [0791 [218Jmiddot- [051J [1981- [0261 [220) [060J [201Jmiddotmiddot
Spouse not in labor force -J112 0431 0200 0415 0568 0456 0293 0399 0271 0440 -J014 0395 [039J [163) [063J [1611 [177]- [175] [111] 1152J 1113) [168Jmiddot [006J 1150]
Spouse in public or -0217 0069 -J501 0036 0273 0072 -0397 0041 -J142 0053 0161 0062 parastatal sector [086] 1030] [166]- [016] [108] ]0311 [172[ [018] [O63J [O23J [O83J [O27J
Spouse wage earner -0322 -J802 0059 -J754 0093 -J746 0256 -J775 0166 -0757 -J245 -0808 [095] [256) [O15J [242] [026) [239 [083 [245 [055] [245) 1089) 261J
self employed -J160 -J251 0517 -J255 0468 -J238 0363 -J268 0273 -J251 0248 -J287 [057J [103] [168) [107[ [148] [099] 1144) [111] 1118] [104) [117) [118)
Spouse unpaid family -J236 -J084 0056 -J088 0538 -0064 0013 -Jl00 0290 -Jon 0037 -J101 worker [084] [034) 1018] [0361 [1671 10271 [005] [0411 [124] [030] [017) [041]
Head in manuflconstrl -J115 0156 0029 0155 0085 0156 0002 0152 -0527 0149 -JS70 0134 transport [1101 11161 1020] [116J 1071] [117J 10021 11141 1557] [112J [657J- [100J
Head in wholesaleretail -0011 -J060 -0183 -J089 0088 -J076 -0114 -J093 -0426 -J073 -J420 -J083 [013J [048J [167] [070J [O75J 1060] [121] [0741 ]531J [056] [572J [064J
~ ~
U 0gt
raquo
(f)
0
Gl C raquo E 1
~ ~ 0
5shyshy- Head in serviceeducation -0066 0132 -0088 0098 0044 0113 -0114 0092 -0397 0115 -0374 0103 admlother [078] [076] [072] [056] [046] [065] [123] [053] [479] [066] [470] [059]0
Spouse in manuflconstrl 0160 -0394 -0130 -0411 0146 -0419 0109 -0426 -0573 -0412 -0574 -0415 transport [113] [229] [090] [244] [085] [248] [075] [253] [427] [239 [451] [241]
Spouse in wholesaleretail 0002 0098 0092 0109 0140 0114 -0011 0110 -0465 0118 -0467 0123 [003] [116 [116] [128] [165] [136] 017J [129] 688J [138) [780] [144]
Spouse in serviceeducl 0103 -0191 0628 -0186 0309 -0196 0312 -0185 -0256 -0199 -0110 -0187 admlother [141] [169] [644] [163] [279J [173J [349J [162] [302J [174] [153J [164]
Individual owns house 0099 0034 0204 0041 0109 0033 0094 0038 0800 0031 0736 0033 [184] [047] [295] [057] [176] [045] [157] [053] [1609] [042] [1553] 1046]
Head temporary migrant -0307 -0778 -0149 -0754 -0252 -0738 0247 -0744 -0148 -0759 -0047 -0761 [155] [358] [062] [349J [121] [3391 [124] [343] [068] [3541 [024] [357J
Household has access -0029 -0087 0038 -0093 0036 -0094 0017 -0092 0003 -0092 0002 -0090 to electricity [119] [251] [107] [268] [120] [272] 056] [273] [012] [270J [009J [261]
Household has access 0183 -0221 -0244 -0237 -0072 -0211 -0076 -0216 0043 -0216 -0060 -0210 to piped water [233J [193J [239J [207J [066] 1182J [084] [189J [O5St 1187] [O86J [182J Household has toilet -0122 0157 -0236 0134 -0300 0137 -0317 0139 -0178 0157 -0134 0140
[076] [100J [117] [083] [203] [084J [198J [086] [LSI] [096J [114J [086]
Wealth index 0131 -0014 0112 -0004 0148 -0011 0152 -0003 -0099 -0014 -0035 -0015 [361J [0291 [240J [009] 1336] [022] [361] [007] 1261J [O28J [095] [030J
Wealth index squared -0005 0004 -0005 0004 -0011 0004 -0008 0004 -0001 0004 -0006 0004 [145J [100J [116] [085] [281] [091] [212] [084J [025] [O96J [170J [0971
Constant -1696 2159 0202 2158 0117 2194 -0575 2207 0199 2205 0085 2249 [410] [434] [044J [4331 [O26J [439] [139] [441J [052J [441J [024J 1448Jmiddotmiddot
Observations 10671 10671 10671 10671 10671 10671 10671 10671 10671 10671 10671 10671
Source Authors estimates using Nigerias CWIQ 2003 Notes State dummy variables induded in the regressions but not shown in the tables () denotes coefficient statistically significant at 10 level ( ) at 5 level and ( ) significant at 1 level
jgt
0 V1
2gt ~
Oi 01
raquo
406 GENDER DISPARITIES IN AfRICAS LABOR MARKET
References Babalola A and C Dennis 1988 Returns to Womens Labour in Cash Crop producshy
tions Tobacco in Igboho Oyo State Nigeria In Agriculture Women and Land The African Experience ed J Davidson Boulder CO West View Press
Backiny-Yetna P and Q Wodon 2010 Gender Labor Income Shares and Human Capital Investment in the Republic of Congo In Gender Disparities in Africas Labor Market ed J S Arbache A Kolev and E Filipiak Washington DC World Bank
Blackden C M and C Bhanu 1999 Gender Growth and Poverty Reduction Special Program ofAssistance for Africa 1998 Status Report on Poverty World Bank Technical Paper 428 Washington DC World Bank
Bourguignon F and P A Chiappori 1992 Collective Models of Household Behavior An Introduction European Economic Review 36 (2-3) 355-64
Browning M and P A Chiappori 1998 Efficient Intra-Household Allocations A General Characterization and Empirical Tests Econometrica 66 (6) 1241-78
Bussolo M R E De Hoyos and Q Wodon 2009 Higher Prices of Export Crops Intra-Household Inequality and Human Capital Accumulation in Senegal In Gender Aspects of the Trade and Poverty Nexus A Macro-Micro Approach ed M Bussolo and R E De Hoyos Washington DC World Bank and Palgrave Macmillan
Chukwuezi B 1999 De-agrarianization and Rural Employment in South Eastern Nigeria Working Paper 37 African Studies Centre University of Leiden the Netherlands
Hoddinott J and L Haddad 1995 Does Female Income Share Influence Household Expenditures Evidence from C6te dIvoire Oxford Bulletin of Economics and Statisshytics 57 (1) 77-96
lloyd C B and A K Blanc 1996 Childrens Schooling in Sub-Saharan Africa The Role of Fathers Mothers and Others Population and Development Review 22 (2) 265-98
Manser M and M Brown 1980 Marriage and Household Decision Making A Bargaining Analysis International Economic Review 21 (1) 31-34
McElroy M B and M J Homey 1981 Nash-bargained Household Decisions Toward a Generalization of the Theory of Demand International Economic Review 22 (2) 333-49
Piesse J and J Simister 2003 Bargaining and Household Dynamics The Impact of Education and Financial Control on Nutrition Outcomes in South Africa South African Journal ofEconomics 71 (1) 163-72
World Bank 2004 Nigeria Poverty and Vulnerability-A Preliminary Diagnostic Unpublished manuscript Human Development Department Africa Region World Bank Washington DC
--- 2005 Uganda From Periphery to Center A Strategic Country Gender Assessment Poverty Reduction and Economic Management Africa Region World Bank Washington DC
GDALM_381-406indd 406 29106110 11 55 AM I
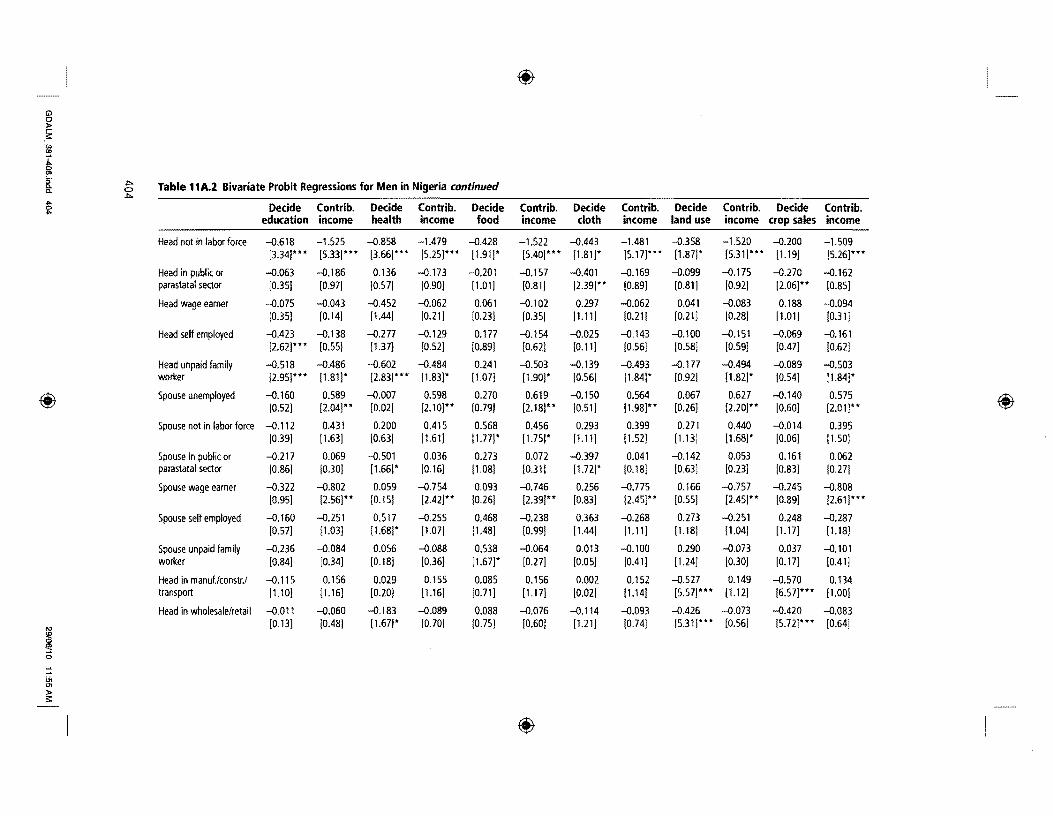
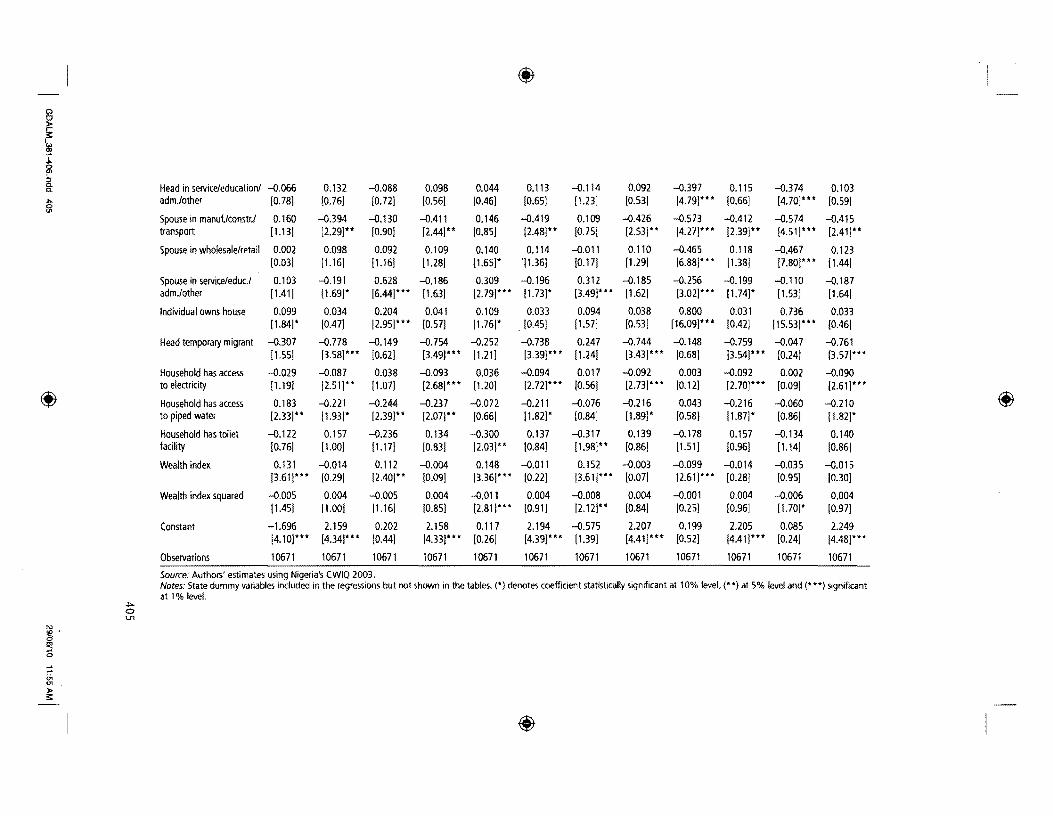