Embed Size (px)
Citation preview

P R U D E N T I A L F I N A N C I A L , I N C . A N N U A L R E P O R T
PRU
DEN
TIAL FINAN
CIAL, INC.
2013 ANN
UAL R
EPOR
T

Who We are
For more than 135 years, Prudential Financial, Inc. has
helped people grow and protect their wealth. We offer
individual and institutional clients a wide array of financial
products and services. Today, we are one of the world’s largest
financial services institutions. We have more than $1.1 trillion
in assets under management and approximately $3.5 trillion
of gross life insurance in force worldwide as of December 31,
2013. We have operations in the United States, Asia, Europe
and Latin America. We also have one of the most recognized
and trusted brand symbols: The Rock®, an icon of strength,
stability, expertise and innovation. We measure our long-
term success by our ability to deliver value for shareholders,
meet customer needs, attract and develop the best talent
in our industry, offer an inclusive work environment where
employees can develop to their full potential and support the
communities where we live and work.

Prudential Financial, Inc. 2013 Annual Report 1
Dear fellow shareholders:
I am pleased to report that Prudential Financial delivered another strong performance in 2013. Our outstanding results for the year were broadly based, reflecting strong growth across our businesses, coupled with effective pricing discipline and risk management. We also benefited from meaningful contributions from the significant transactions we have completed over the past three years: our acquisition of Star Life and Edison Life from AIG in 2011, the completion in late 2012 of two landmark pension risk transfer transactions, and our acquisition in early 2013 of the U.S. individual life insurance business from The Hartford.
The strength of our operations was proven by the achievement of our objective to deliver a return on equity in 2013 of 13 to 14 percent. In fact, we exceeded the top end of that goal.
In addition, in 2013 we altered our schedule of dividend payments to shareholders from annual to quarterly, ultimately delivering more than $800 million in Common Stock dividends during the year.
The achievement of our earnings objectives and other actions throughout the year demonstrate our ongoing commitment to maintaining a strategic mix of high-quality businesses, managing risk appropriately, deploying capital effectively, and pursuing profitable growth for the long term.
We continue to adhere to four key characteristics that drive our company’s success:
1. Our unique business mix, which we have developed by deliberately focusing on our core strengths and on markets in which we see opportunities. The complementary nature of our portfolio of operations provides a mix of growth and stability, helping balance risk across the company.
2. Our high-quality businesses, which have outstanding leadership, robust fundamentals and strong positioning in the markets in which we operate.
3. Our financial strength, which enables us to continue delivering on our promises to our stakeholders, while also seizing opportunities to innovate and grow.
4. The talent and integrity of our people, who remain our most important point of differentiation in the market. Our commitment to nurturing a diverse and inclusive culture helps us attract, develop and retain high-quality employees.
In short, 2013 was a year of major progress and accomplishments for the company on many fronts. We maintained strong momentum in our businesses and further enhanced our long-term positioning.
For 2013, on an after-tax adjusted operating income basis,* our Financial Services Businesses earned $4.586 billion, or $9.67 per share of Common Stock, compared to $3.019 billion, or $6.40 per share of Common Stock in 2012. On this basis, our earnings per share represent a 20 percent compound growth rate over the past three years.
Based on U.S. generally accepted accounting principles, our Financial Services Businesses reported a net loss of $713 million, or $1.55 per share of Common Stock, in 2013, compared to net income of $479 million, or $1.05 per share of Common Stock, in 2012. The 2013 net loss was mainly driven by volatility in the currency markets and remeasurement of non-yen product reserves in our Japanese insurance operations, which we consider non-economic since we support these reserves with investments in appropriate currencies. Changes in the market value of derivatives we use to manage our interest rate exposure were also a factor, largely due to rising U.S. interest rates.
Our worldwide assets under management continued to increase, reaching more than $1.1 trillion by year-end 2013. This growth is an important indicator of the confidence our clients continue to have in Prudential.
Message froM the ChairMan
* Adjusted operating income is not calculated under U.S. generally accepted accounting principles (GAAP) and is a financial measure we use to analyze the operating performance of our Financial Services Businesses. See footnote (1) on page 5 and footnote (A) on page 7 for a further description of adjusted operating income.
“2013 was a year of
major progress and
accomplishments for
the company on many
fronts. We maintained
strong momentum in
our businesses and
further enhanced our
long-term positioning.”
— John Strangfeld

2 Prudential Financial, Inc. 2013 Annual Report
Our strong operating results for the year were driven by solid underlying performance across our businesses. Based on our excellent performance, our solid positioning in the marketplace and the talent of our people, we remain confident in our long-term prospects and excited about our potential as a company.
Achieving our 2013 ROE objectiveIn 2010, we announced our objective to achieve an ROE of 13 to 14 percent in 2013. We believed then, as we do now, that achieving and sustaining that level of performance would demonstrate our superior performance relative to our peers.
Our ability to achieve – and exceed – that goal in 2013 confirms our belief in our earnings power. Yet we never saw that objective as a one-year, “once and done” objective. Looking ahead, we remain confident in our ability to sustain an ROE of 13 to 14 percent over the long term.
Building on our momentumIn 2013, we benefited from the contributions of several targeted acquisitions and transactions we have completed since 2011 in key markets and segments that complement our strategic business mix.
We have substantially completed the integration of the Star Life and Edison Life companies with our Gibraltar Life operation in Japan. This acquisition is delivering what we expected in terms of both synergies and business results. We are benefiting from expanded distribution capabilities from this acquisition, including new sales professionals and third-party distributors, as well as the addition of a large force of independent agents to our existing channel.
The integration of the U.S. individual life insurance operations we acquired from The Hartford in 2013 is also well on track. Through this acquisition, our U.S. life insurance operations achieved greater scale, expanded product offerings and broader distribution capabilities. Our domestic individual life insurance business is already benefiting from a unified distribution system, strong connections with financial institutions, and our solid positioning in the brokerage general agency channel.
The two landmark pension risk transfer transactions we completed in 2012 contributed to the achievement of record earnings in 2013 in our Retirement unit. We are confident that the pension risk transfer market will continue to offer exciting opportunities to our company, for which we are uniquely suited.
In addition to producing significant contributions to our earnings, these acquisitions and transactions have brought more diversity to our stream of earnings and, thus, more balance to our operations as a whole. Their successful execution has further distinguished our company within our industry and positioned us for further growth.
In 2013, we continued to invest in and expand our operations in pursuit of other promising opportunities, particularly on the international front. In August, we announced an agreement to purchase Uni.Asia Life Assurance Berhad (UAL), a mid-sized life insurer in Malaysia, through a new joint venture with Bank Simpanan Nasional, a government-owned bank. We closed this transaction in January 2014, and hold 70 percent of UAL. Malaysia is an attractive market, with low life insurance penetration, a well-developed regulatory environment and long-term growth potential. This transaction is aligned with our strategy to build upon our success in Japan, South Korea and Taiwan, and expand our footprint in growth markets in Asia.
Our success with all of these transactions demonstrates our ability to identify, seize and execute on opportunities that offer the potential for significant earnings and that further differentiate Prudential in the marketplace.
Operating high-performing businesses We continue to maintain a carefully assembled portfolio of high-quality businesses focused on two interrelated customer needs – protection and retirement. This mix of businesses reflects our long-term strategy of retaining a clear focus on core businesses where we have proven strength and see opportunity.
The solid performance of our businesses in 2013 demonstrates the strength of our businesses and our strategy.
Individual Annuities account values surpassed the $150 billion milestone at year-end 2013, totaling more than $154 billion, up 14 percent from year-end 2012. We continue to manage our annuities business prudently, adapting our products to the current environment to maintain our return prospects and improve our risk profile, while maintaining our value proposition.
Our Retirement business achieved record account values in 2013, reflecting strong sales and net flows. Total account values for the Retirement operation were approximately $323 billion as of year-end 2013, up 11 percent over the prior year.
“Based on our excellent performance,
our solid positioning in the marketplace and
the talent of our people, we remain confident
in our long-term prospects and excited about
our potential as a company.”

Prudential Financial, Inc. 2013 Annual Report 3
In our Asset Management segment, we recorded about $24 billion of institutional and retail net flows for the year. The segment’s assets under management totaled nearly $870 billion at year-end 2013, up about 5 percent from a year earlier.
Sales in our Individual Life Insurance operation reached $731 million for 2013, up 77 percent over 2012. This increase reflects the impact of The Hartford acquisition, which contributed to an improvement in our competitive position and expanded distribution through third-party distributors, including banks and wirehouses.
In Group Insurance, sales totaled $313 million for the year, representing a decrease of about 29 percent from 2012. We continue to take steps to focus our Group business on products where we see long-term opportunity, with a goal of achieving sustainable, profitable growth. We are encouraged that the operation’s 2013 results demonstrated improved claims experience.
For the year, sales in our International Insurance division, on a constant dollar basis, were about $3 billion, down from nearly $4 billion the prior year. This result reflects deliberate actions we have taken to control our product concentration and maintain appropriate returns.
Deploying capital to support sustainable growthEffective capital management remains a hallmark of Prudential and fundamental to our overall strategy. Maintaining robust capital and liquidity positions helps shield the company from market volatility and enables us to retain the financial strength and flexibility we need to pursue new opportunities, consistent with our long-term strategy.
In 2013, we reconfirmed our commitment to delivering additional value to our shareholders through share repurchases and dividends. During the year, we declared four quarterly Common Stock dividends totaling more than $800 million, including a dividend of $0.53 a share in the fourth quarter that represented a 33 percent increase from prior quarters.
In addition, we continued to repurchase stock, acquiring $750 million of Common Stock during 2013. From the commencement of share repurchases in July 2011 through December 31, 2013, the company has acquired 41.3 million shares of its Common Stock under its share repurchase authorizations, at a total cost of $2.4 billion.
Contributing to development of appropriate and meaningful regulationWe recognize the importance of meaningful regulation of our industry and our company. Financial strength is part of our value proposition, and being well regulated is important to our company.
In September, Prudential received notice that the Financial Stability Oversight Council had designated the company as a non-bank Systemically Important Financial Institution. As a result of this determination, the company is being supervised by the Board of Governors of the Federal Reserve System and is subject to stricter regulatory standards. In July, we were designated as a Global Systemically Important Insurer, which may also result in heightened regulation.
We continue to participate in active and constructive discussions with the Board of Governors of the Federal Reserve System, as well as other regulatory authorities, to develop an effective framework for group supervision of insurers, and one that reflects the important differences between insurance companies and banks. We will remain engaged at both the global and domestic levels in influencing the development of regulatory standards that are beneficial to consumers and preserve competition within the insurance industry.
Fulfilling our responsibility as a corporate citizenWe recognize the importance of fulfilling our obligations to all of our stakeholders, including our regulators, our shareholders, our customers and our employees. Maintenance of a robust program of corporate governance is one of the ways in which we achieve this objective. We continue to enhance our efforts related to our commitment to sustainability, including our work related to shareholder engagement and to diversity and inclusion. Our focus on these areas is a reflection of our corporate culture, which we believe helps differentiate us in the marketplace.
We also maintain our long-held commitment to corporate social responsibility and to supporting the communities where Prudential people live and work, through direct contributions and investments, as well as the time and talent of our employees.
In 2013, we provided contributions of nearly $29 million through The Prudential Foundation, as well as approximately $100 million in social investments. Prudential employees around the world continued to uphold the company’s long tradition of volunteerism. In October, more than 22,000 volunteers, including employees, friends, family members and clients, in the United States and 11 other countries, took part in our 19th annual Global Volunteer Day.
We continue to support the revitalization of Newark, N.J., which has been our headquarters for nearly 140 years. In April 2013, we demonstrated our commitment to Newark in a very visible and exciting way, as we broke ground for the construction of a new building, which will be our third office facility in the city.
“Effective capital management remains a
hallmark of Prudential and fundamental to
our overall strategy.”

4 Prudential Financial, Inc. 2013 Annual Report
The new Prudential tower is just one of our many investment projects in Newark. In total, our current investments in Newark will support more than 1,000 new residential units and 22 acres of open space, and leverage over $1 billion in current and new development activities in the city. We look forward to continuing to contribute to Newark’s resurgence.
Nurturing a culture of excellencePrudential’s people – their talents, ideas and integrity – represent our most important competitive advantage. That’s why we are fully committed to offering an environment where employees feel free to do their best work and empowered to bring their best ideas.
That commitment requires ensuring that diversity and inclusion are integral to our company culture – and not just in our approach at the workplace. We recognize that we need to embed diversity and inclusion in every aspect of our operations – among employees, in working with our customers and our suppliers, and in helping the communities where we live and work – to have the ability to reach and support diverse markets around the world.
In 2013, we continued our series of signature research that examines financial trends in America’s multicultural
communities by launching our second biennial study on the African American financial experience. Together with our recent research into the financial experience of women, Hispanic Americans and lesbian, gay, bisexual and transgender Americans, these studies are revealing compelling information about the needs of customers across these populations.
We also continued to support a variety of programs designed to help Veterans develop meaningful careers after their military service and between deployments. In addition to helping an often overlooked segment of our population, our work to help our Veterans successfully transition from the military to the corporate world is another important aspect of our talent management efforts. As with our efforts related to diversity and inclusion, we are reaping rewards from our work with Veterans by identifying, attracting and retaining talented new employees.
In 2013, our efforts to foster diversity and inclusion, support Veterans and their families, and be an employer of choice were again recognized by a wide variety of organizations. We were also pleased to again be named by FORTUNE® as one of the world’s most admired companies in the life and health insurance category. We are gratified by this external validation of the caliber of Prudential’s people.
Sustaining our performanceWe are very proud of our performance in 2013. We delivered on an ambitious objective and demonstrated the earnings power of our operations.
Our challenge now is to sustain a level of performance that differentiates us from our peers. We believe that the same core strengths that have served us well in the past – our financial strength, the uniqueness of our business mix, the quality of our operations and the talent of our people – will help us meet this challenge. As always, we are committed to achieving our objectives in the right way, with integrity and a relentless focus on quality control.
Thank you for your continued confidence in Prudential. I look forward to reporting to you on our future accomplishments.
John strangfeLD Chairman of the Board, Chief Executive Officer and President
Recognition Prudential’s Record
Working Mother “100 Best Companies” 24 years
LATINA Style “50 Best Companies for Latinas in the U.S.” 16 years
National Association for Female Executives “Top 50 Companies for Executive Women” 14 years
DiversityInc “Top 50 Companies for Diversity” 13 years
Human Rights Campaign Corporate Equality Index 10 years
Dave Thomas Foundation “Best Adoption-Friendly Workplaces” 7 years
GI Jobs “Top 100 Military Friendly Employers” 4 years
Military Times EDGE “Best for Vets Employers” 3 years
Computerworld “Best Places to Work in IT” 3 years
external recognition of Prudential’s commitment to diversity and to providing a supportive workplace

Prudential Financial, Inc. 2013 Annual Report 5
NOTES (1) Adjusted operating income is not calculated in accordance with accounting principles generally accepted in the United States of America (GAAP), and is a financial measure we use to analyze the operating performance of our Financial Services Businesses. Adjusted operating income excludes “Realized investment gains (losses), net,” as adjusted, and related charges and adjustments. A significant element of realized investment gains and losses are impairments and credit-related and interest rate-related gains and losses. Impairments and losses from sales of credit-impaired securities, the timing of which depends largely on market credit cycles, can vary considerably across periods. The timing of other sales that would result in gains or losses, such as interest rate-related gains or losses, is largely subject to our discretion and influenced by market opportunities as well as our tax and capital profile. Realized investment gains (losses) within certain of our businesses for which such gains (losses) are a principal source of earnings, and those associated with terminating hedges of foreign currency earnings and current period yield adjustments are included in adjusted operating income. Adjusted operating income excludes realized investment gains and losses from products that contain embedded derivatives, and from associated derivative portfolios that are part of a hedging program related to the risk of those products. Adjusted operating income also excludes gains and losses from changes in value of certain assets and liabilities relating to foreign currency exchange movements that have been economically hedged or considered part of our capital funding strategies for our international subsidiaries, as well as gains and losses on certain investments that are classified as other trading account assets. Adjusted operating income also excludes investment gains and losses on trading account assets supporting insurance liabilities and changes in experience-rated contractholder liabilities due to asset value changes, because these recorded changes in asset and liability values are expected to ultimately accrue to contractholders. Trends in the underlying profitability of our businesses can be more clearly identified without the fluctuating effects of these transactions. In addition, adjusted operating income excludes the results of divested businesses, which are not relevant to our ongoing operations. Discontinued operations, which is presented as a separate component of net income under GAAP, is also excluded from adjusted operating income. We believe that the presentation of adjusted operating income as we measure it for management purposes enhances understanding of the results of operations of the Financial Services Businesses by highlighting the results from ongoing operations and the underlying profitability of our businesses. However, adjusted operating income is not a substitute for income determined in accordance with GAAP, and the adjustments made to derive adjusted operating income are important to an understanding of our overall results of operations. References to adjusted operating income and net income refer to amounts attributable to Prudential Financial, Inc.
All facts and figures are as of or for the year ended December 31, 2013, unless otherwise noted.
Life insurance and annuities issued by The Prudential Insurance Company of America, Newark, NJ, and its insurance affiliates.
FORTUNE® and “The World’s Most Admired Companies®” are registered trademarks of Time Inc. 2014 ranking as of 3/1/2014.

6 Prudential Financial, Inc. 2013 Annual Report
Financial Services Businesses In millions, except per share amounts For the years ended December 31, 2013 2012 2011
RESULTS BASED ON ADJUSTED OPERATING INCOME (A)Revenues $ 45,281 $ 81,103 $ 38,926Benefits and expenses 38,912 77,076 34,986Adjusted operating income before income taxes $ 6,369 $ 4,027 $ 3,940
Operating return on average equity (B) 17.7 % 11.0% 11.1 %
GAAP RESULTSRevenues $ 35,425 $ 78,590 $ 42,070Benefits and expenses 37,171 77,946 37,320Income (loss) from continuing operations before income taxes and equity in earnings of operating joint ventures $ (1,746) $ 644 $ 4,750
Return on average equity (B) -2.0 % 1.4 % 11.1 %
EARNINGS PER SHARE OF COMMON STOCK—dilutedAdjusted operating income after income taxes $ 9.67 $ 6.40 $ 5.97 Reconciling items: Realized investment gains (losses), net, and related charges and adjustments (17.28 ) (5.94) 1.73 Other reconciling items 0.08 (1.10) 0.38 Tax (expense) benefit on above (5.96) (1.65 ) 1.03Income (loss) from continuing operations of the Financial Services Businesses attributable to Prudential Financial, Inc. (after-tax) $ (1.57) $ 1.01 $ 7.05
Consolidated Information In millions, unless otherwise noted As of or for the years ended December 31, 2013 2012 2011
GAAP RESULTSTotal revenues $ 41,461 $ 84,847 $ 49,085
Income (loss) after income taxes: Continuing operations $ (567) $ 555 $ 3,631 Discontinued operations 7 15 35Less: Noncontrolling interests 107 50 34 Consolidated net income (loss) attributable to Prudential Financial, Inc. $ (667) $ 520 $ 3,632
Net income (loss) attributable to Prudential Financial, Inc. Financial Services Businesses $ (713) $ 479 $ 3,486 Closed Block Business 46 41 146 Consolidated net income (loss) attributable to Prudential Financial, Inc. $ (667) $ 520 $ 3,632
FINANCIAL POSITIONInvested assets $ 398,173 $ 405,582 $ 356,247Total assets $ 731,781 $ 709,235 $ 620,114Attributed equity: Financial Services Businesses $ 33,885 $ 37,006 $ 32,694 Closed Block Business 1,393 1,497 1,436 Total attributed equity $ 35,278 $ 38,503 $ 34,130
Assets under management (in billions) $ 1,107 $ 1,060 $ 901
FINaNCIal hIghlIghTS

Prudential Financial, Inc. 2013 Annual Report 7
(A) Adjusted operating income is a non-GAAP measure of performance of our Financial Services Businesses that excludes “Realized investment gains (losses), net,” as adjusted, and related charges and adjustments; net investment gains and losses on trading account assets supporting insurance liabilities; change in experience-rated contractholder liabilities due to asset value changes; results of divested businesses and discontinued operations; earnings attributable to noncontrolling interests; and the related tax effects thereof. Adjusted operating income includes equity in earnings of operating joint ventures and the related tax effects thereof. Revenues and benefits and expenses shown as components of adjusted operating income, are presented on the same basis as pre-tax adjusted operating income and are adjusted for the items above as well.
See Management’s Discussion and Analysis of Financial Condition and Results of Operations for a discussion of results based on adjusted operating income and the Consolidated Financial Statements for a reconciliation of results based on adjusted operating income to GAAP results.
(B) Operating return on average equity is calculated by dividing adjusted operating income after income taxes by average attributed equity for the Financial Services Businesses excluding accumulated other comprehensive income. An alternative measure to operating return on average equity is return on average equity. Return on average equity is calculated by dividing income from continuing operations after-tax of the Financial Services Businesses attributable to Prudential Financial, Inc. by average total attributed equity for the Financial Services Businesses. Both income amounts above give effect to the direct equity adjustment for earnings per share calculation.
Adjusted operating income
Income (loss) from continuing operations before income taxes and equity in earnings of operating joint ventures (GAAP)
Adjusted operating revenues
Revenues (GAAP)
Financial Services Businesses adjusted Operating Income(a) and Income from Continuing Operations(pre-tax, in millions)
Financial Services Businesses adjusted Operating Revenues(a) and gaaP Revenues(in billions)
assets Under Management(in billions)
Financial Services Businesses Operating Return on average Equity(B)
and Return on average Equity(B)
Operating return on average equity
Return on average equity
$(2,000)
$(1,000)
$0
$1,000
$2,000
$3,000
$4,000
$5,000
$6,000
$7,000
20132011 2012 20132011 2012$0
$20
$40
$60
$80
$100
2011 2012 2013$0
$200
$400
$600
$800
$1,000
$1,200
0%
5%
10%
15%
20%
25%
2012 2013-5%
2011

FINANCIAL SECTION
Some of the statements included in this Annual Report may contain forward-looking statements within the meaning of the U.SPrivate Securities Reform Act of 1995. Please see page 236 for a description of certain risks and uncertainties that couldcause actual results to differ, possibly materially, from expectations or estimates reflected in such forward-looking statements.
8 Prudential Financial, Inc. 2013 Annual Report

TABLE OF CONTENTS
PageNumber
Selected Financial Data . . . . . . . . . . . . . . . . . . . . . . . . . . . . . . . . . . . . . . . . . . . . . . . . . . . . . . . . . . . . . . . . . . . . . . . . . . . . . . . . . . . . 10Management’s Discussion and Analysis of Financial Condition and Results of Operations . . . . . . . . . . . . . . . . . . . . . . . . . . . . . . . 12Quantitative and Qualitative Disclosures About Market Risk . . . . . . . . . . . . . . . . . . . . . . . . . . . . . . . . . . . . . . . . . . . . . . . . . . . . . . . 99Consolidated Financial Statements:
Management’s Annual Report on Internal Control Over Financial Reporting . . . . . . . . . . . . . . . . . . . . . . . . . . . . . . . . . . . . . . 103Report of Independent Registered Public Accounting Firm . . . . . . . . . . . . . . . . . . . . . . . . . . . . . . . . . . . . . . . . . . . . . . . . . . . . 104Consolidated Statements of Financial Position as of December 31, 2013 and 2012 . . . . . . . . . . . . . . . . . . . . . . . . . . . . . . . . . . 105Consolidated Statements of Operations for the years ended December 31, 2013, 2012 and 2011 . . . . . . . . . . . . . . . . . . . . . . . 106Consolidated Statements of Comprehensive Income for the years ended December 31, 2013, 2012 and 2011 . . . . . . . . . . . . . 107Consolidated Statements of Equity for the years ended December 31, 2013, 2012 and 2011 . . . . . . . . . . . . . . . . . . . . . . . . . . 108Consolidated Statements of Cash Flows for the years ended December 31, 2013, 2012 and 2011 . . . . . . . . . . . . . . . . . . . . . . 109Notes to Consolidated Financial Statements . . . . . . . . . . . . . . . . . . . . . . . . . . . . . . . . . . . . . . . . . . . . . . . . . . . . . . . . . . . . . . . . 110Supplemental Combining Financial Information . . . . . . . . . . . . . . . . . . . . . . . . . . . . . . . . . . . . . . . . . . . . . . . . . . . . . . . . . . . . 231
Market Price of and Dividends on Common Equity and Related Stockholder Matters . . . . . . . . . . . . . . . . . . . . . . . . . . . . . . . . . . . 234Performance Graph . . . . . . . . . . . . . . . . . . . . . . . . . . . . . . . . . . . . . . . . . . . . . . . . . . . . . . . . . . . . . . . . . . . . . . . . . . . . . . . . . . . . . . . 235Forward-Looking Statements . . . . . . . . . . . . . . . . . . . . . . . . . . . . . . . . . . . . . . . . . . . . . . . . . . . . . . . . . . . . . . . . . . . . . . . . . . . . . . . 236
Throughout this Annual Report, “Prudential Financial” refers to Prudential Financial, Inc., the ultimate holding company for allof our companies. “Prudential Insurance” refers to The Prudential Insurance Company of America. “Prudential,” the “Company,”“we” and “our” refer to our consolidated operations.
Financial Services Businesses and Closed Block Business
Effective with the date of demutualization, December 18, 2001, we established the Financial Services Businesses and the ClosedBlock Business. The Financial Services Businesses refer to the businesses in our three operating divisions and our Corporate and Otheroperations. The U.S. Retirement Solutions and Investment Management division consists of our Individual Annuities, Retirement and AssetManagement segments. The U.S. Individual Life and Group Insurance division consists of our Individual Life and Group Insurancesegments. The International Insurance division consists of our International Insurance segment. The Common Stock reflects theperformance of the Financial Services Businesses, but there can be no assurance that the market value of the Common Stock will reflectsolely the financial performance of these businesses. The Class B Stock, which was issued in a private placement on the date of thedemutualization, reflects the financial performance of the Closed Block Business, as defined in Note 22 to the Consolidated FinancialStatements.
We allocate all of our assets, liabilities and earnings between the Financial Services Businesses and Closed Block Business as if theywere separate legal entities, but there is no legal separation between these two businesses. Holders of both the Common Stock and the ClassB Stock are common stockholders of Prudential Financial and, as such, are subject to all the risks associated with an investment inPrudential Financial and all of its businesses. The Common Stock and the Class B Stock will be entitled to dividends, if and when declaredby Prudential Financial’s Board of Directors from funds legally available to pay them, as if the businesses were separate legal entities. SeeNote 15 to the Consolidated Financial Statements for a discussion of liquidation rights of the Common Stock and the Class B Stock,dividend restrictions on the Common Stock if we do not pay dividends on the Class B Stock when there are funds legally available to paythem and conversion rights of the Class B Stock.
Prudential Financial, Inc. 2013 Annual Report 9

SELECTED FINANCIAL DATA
We derived the selected consolidated income statement data for the years ended December 31, 2013, 2012 and 2011, and the selectedconsolidated balance sheet data as of December 31, 2013 and 2012, from our Consolidated Financial Statements included elsewhere herein.We derived the selected consolidated income statement data for the years ended December 31, 2010 and 2009, and the selectedconsolidated balance sheet data as of December 31, 2011, 2010 and 2009, from consolidated financial statements not included herein.
On January 2, 2013, we acquired The Hartford’s individual life insurance business through a reinsurance transaction. Under theagreement, the Company paid The Hartford cash consideration of $615 million, primarily in the form of a ceding commission to providereinsurance for approximately 700,000 life insurance policies with net retained face amount in force of approximately $141 billion. Theacquisition increases the Company’s scale in the U.S. individual life insurance market, particularly universal life products, and providescomplementary distribution opportunities through expanded wirehouse and bank distribution channels.
Results for the year ended December 31, 2012, include approximately $32 billion of premiums reflecting two significant pension risktransfer transactions. On November 1, 2012, we issued a non-participating group annuity contract to the General Motors SalariedEmployees Pension Trust, and assumed responsibility for providing specified benefits to certain participants. On December 10, 2012, weissued a non-participating group annuity contract to the Verizon Management Pension Plan and assumed responsibility for providingspecified benefits to certain participants. The premiums from these transactions were largely offset by a corresponding increase inpolicyholders’ benefits, including the change in policy reserves.
On February 1, 2011, we acquired the Star and Edison Businesses from American International Group, Inc. The results of thesecompanies are reported with the Gibraltar Life operations and are included in the results presented below from the date of acquisition. TheStar and Edison companies were merged into Gibraltar Life on January 1, 2012.
On December 31, 2009, we completed the sale of our minority joint venture interest in Wachovia Securities. In 2009, “Equity inearnings of operating joint ventures, net of taxes” includes a pre-tax gain on the sale of $2.247 billion. In addition, “General andadministrative expenses” includes certain one-time costs related to the sale of the joint venture interest of $104 million for pre-taxcompensation costs and costs related to increased contributions to the Company’s charitable foundation. The total of these items is an after-tax gain of $1.389 billion, or $2.95 per share of Common Stock.
On May 1, 2009, we acquired Yamato Life, a Japanese life insurance company that declared bankruptcy in October 2008, andrenamed The Prudential Gibraltar Financial Life Insurance Company, Ltd. Results presented below include the results of this companyfrom the date of acquisition.
The 2009 income tax provision includes a benefit of $272 million from a reduction to the liability for unrecognized tax benefits andrelated interest, primarily related to tax years prior to 2002 as a result of the expiration of the statute of limitations for the 2002 and 2003tax years.
Our Gibraltar Life operations use a November 30 fiscal year end. Consolidated balance sheet data as of December 31, 2013, 2012,2011, 2010 and 2009, includes Gibraltar Life assets and liabilities as of November 30. Consolidated income statement data for 2013, 2012,2011, 2010 and 2009, includes Gibraltar Life results for the twelve months ended November 30, 2013, 2012, 2011, 2010 and 2009,respectively.
This selected consolidated financial information should be read in conjunction with “Management’s Discussion and Analysis ofFinancial Condition and Results of Operations” and the Consolidated Financial Statements included elsewhere herein.
Year Ended December 31,
2013 2012 2011 2010 2009
(in millions, except per share and ratio information)Income Statement Data:Revenues:
Premiums . . . . . . . . . . . . . . . . . . . . . . . . . . . . . . . . . . . . . . . . . . . . . . . . . . . . . . . . . . $26,237 $65,354 $24,301 $18,238 $ 16,497Policy charges and fee income . . . . . . . . . . . . . . . . . . . . . . . . . . . . . . . . . . . . . . . . . . 5,415 4,489 3,924 3,323 2,832Net investment income . . . . . . . . . . . . . . . . . . . . . . . . . . . . . . . . . . . . . . . . . . . . . . . . 14,729 13,661 13,124 11,865 11,390Asset management fees and other income . . . . . . . . . . . . . . . . . . . . . . . . . . . . . . . . . 286 2,784 4,905 3,747 4,495Realized investment gains (losses), net . . . . . . . . . . . . . . . . . . . . . . . . . . . . . . . . . . . . (5,206) (1,441) 2,831 1,050 (2,897)
Total revenues . . . . . . . . . . . . . . . . . . . . . . . . . . . . . . . . . . . . . . . . . . . . . . . . . . . 41,461 84,847 49,085 38,223 32,317
Benefits and expenses:Policyholders’ benefits . . . . . . . . . . . . . . . . . . . . . . . . . . . . . . . . . . . . . . . . . . . . . . . . 26,733 65,131 23,614 18,285 16,346Interest credited to policyholders’ account balances . . . . . . . . . . . . . . . . . . . . . . . . . 3,111 4,234 4,484 4,209 4,484Dividends to policyholders . . . . . . . . . . . . . . . . . . . . . . . . . . . . . . . . . . . . . . . . . . . . . 2,050 2,176 2,723 2,189 1,298Amortization of deferred policy acquisition costs . . . . . . . . . . . . . . . . . . . . . . . . . . . 240 1,504 2,695 1,085 1,131General and administrative expenses . . . . . . . . . . . . . . . . . . . . . . . . . . . . . . . . . . . . . 11,011 11,094 10,605 8,309 7,788
Total benefits and expenses . . . . . . . . . . . . . . . . . . . . . . . . . . . . . . . . . . . . . . . . 43,145 84,139 44,121 34,077 31,047
10 Prudential Financial, Inc. 2013 Annual Report

Year Ended December 31,
2013 2012 2011 2010 2009
(in millions, except per share and ratio information)Income (loss) from continuing operations before income taxes and equity in earnings of
operating joint ventures . . . . . . . . . . . . . . . . . . . . . . . . . . . . . . . . . . . . . . . . . . . . . . . . . . (1,684) 708 4,964 4,146 1,270Income tax expense (benefit) . . . . . . . . . . . . . . . . . . . . . . . . . . . . . . . . . . . . . . . . . . . . . . . (1,058) 213 1,515 1,266 (115)
Income (loss) from continuing operations before equity in earnings of operating jointventures . . . . . . . . . . . . . . . . . . . . . . . . . . . . . . . . . . . . . . . . . . . . . . . . . . . . . . . . . . . . . . (626) 495 3,449 2,880 1,385
Equity in earnings of operating joint ventures, net of taxes . . . . . . . . . . . . . . . . . . . . . . . . 59 60 182 82 1,523
Income (loss) from continuing operations . . . . . . . . . . . . . . . . . . . . . . . . . . . . . . . . . . . . . (567) 555 3,631 2,962 2,908Income (loss) from discontinued operations, net of taxes . . . . . . . . . . . . . . . . . . . . . . . . . . 7 15 35 33 (19)
Net income (loss) . . . . . . . . . . . . . . . . . . . . . . . . . . . . . . . . . . . . . . . . . . . . . . . . . . . . . . . . (560) 570 3,666 2,995 2,889Less: Income (loss) attributable to noncontrolling interests . . . . . . . . . . . . . . . . . . . . . . . . 107 50 34 19 (57)
Net Income (loss) attributable to Prudential Financial, Inc. . . . . . . . . . . . . . . . . . . . . . . . . $ (667) $ 520 $ 3,632 $ 2,976 $ 2,946
Basic earnings per share—Common Stock:Income (loss) from continuing operations attributable to Prudential Financial,
Inc. . . . . . . . . . . . . . . . . . . . . . . . . . . . . . . . . . . . . . . . . . . . . . . . . . . . . . . . . . . . . . $ (1.57) $ 1.02 $ 7.14 $ 5.25 $ 7.33Income (loss) from discontinued operations, net of taxes . . . . . . . . . . . . . . . . . . . . . . 0.02 0.04 0.07 0.07 (0.05)
Net income (loss) attributable to Prudential Financial, Inc. . . . . . . . . . . . . . . . . . . . . $ (1.55) $ 1.06 $ 7.21 $ 5.32 $ 7.28
Diluted earnings per share—Common Stock:Income (loss) from continuing operations attributable to Prudential Financial,
Inc. . . . . . . . . . . . . . . . . . . . . . . . . . . . . . . . . . . . . . . . . . . . . . . . . . . . . . . . . . . . . . $ (1.57) $ 1.01 $ 7.05 $ 5.20 $ 7.28Income (loss) from discontinued operations, net of taxes . . . . . . . . . . . . . . . . . . . . . . 0.02 0.04 0.07 0.06 (0.04)
Net income (loss) attributable to Prudential Financial, Inc. . . . . . . . . . . . . . . . . . . . . $ (1.55) $ 1.05 $ 7.12 $ 5.26 $ 7.24
Dividends declared per share—Common Stock . . . . . . . . . . . . . . . . . . . . . . . . . . . . . . . . . $ 1.73 $ 1.60 $ 1.45 $ 1.15 $ 0.70
Basic and diluted earnings per share—Class B Stock:Income (loss) from continuing operations attributable to Prudential Financial,
Inc. . . . . . . . . . . . . . . . . . . . . . . . . . . . . . . . . . . . . . . . . . . . . . . . . . . . . . . . . . . . . . $ 22.00 $ 11.50 $ 61.00 $229.00 $(164.50)Income (loss) from discontinued operations, net of taxes . . . . . . . . . . . . . . . . . . . . . . 0.00 (1.00) 0.00 0.50 0.00
Net income (loss) attributable to Prudential Financial, Inc. . . . . . . . . . . . . . . . . . . . . $ 22.00 $ 10.50 $ 61.00 $229.50 $(164.50)
Dividends declared per share—Class B Stock . . . . . . . . . . . . . . . . . . . . . . . . . . . . . . . . . . $ 9.625 $ 9.625 $ 9.625 $ 9.625 $ 9.625
Ratio of earnings to fixed charges(1) . . . . . . . . . . . . . . . . . . . . . . . . . . . . . . . . . . . . . . . . . — 1.11 1.83 1.75 1.67
As of December 31,
2013 2012 2011 2010 2009
(in millions)Balance Sheet Data:Total investments excluding policy loans . . . . . . . . . . . . . . . . . . . . . . . . . . . . . . . . . . . . . . . . . . . $386,407 $394,007 $273,245 $250,406 $232,322Separate account assets . . . . . . . . . . . . . . . . . . . . . . . . . . . . . . . . . . . . . . . . . . . . . . . . . . . . . . . . . 285,060 253,254 207,776 174,074 147,095Total assets . . . . . . . . . . . . . . . . . . . . . . . . . . . . . . . . . . . . . . . . . . . . . . . . . . . . . . . . . . . . . . . . . . 731,781 709,235 535,744 476,449 442,399Future policy benefits and policyholders’ account balances . . . . . . . . . . . . . . . . . . . . . . . . . . . . 343,516 350,463 240,489 227,516 221,653Separate account liabilities . . . . . . . . . . . . . . . . . . . . . . . . . . . . . . . . . . . . . . . . . . . . . . . . . . . . . . 285,060 253,254 207,776 174,074 147,095Short-term debt . . . . . . . . . . . . . . . . . . . . . . . . . . . . . . . . . . . . . . . . . . . . . . . . . . . . . . . . . . . . . . . 2,669 2,484 1,982 3,122 10,535Long-term debt . . . . . . . . . . . . . . . . . . . . . . . . . . . . . . . . . . . . . . . . . . . . . . . . . . . . . . . . . . . . . . . 23,553 24,729 23,653 21,037 20,290Total liabilities . . . . . . . . . . . . . . . . . . . . . . . . . . . . . . . . . . . . . . . . . . . . . . . . . . . . . . . . . . . . . . . 695,900 670,123 505,696 453,312 431,307Prudential Financial, Inc. equity . . . . . . . . . . . . . . . . . . . . . . . . . . . . . . . . . . . . . . . . . . . . . . . . . . 35,278 38,503 29,535 22,603 10,741Noncontrolling interests . . . . . . . . . . . . . . . . . . . . . . . . . . . . . . . . . . . . . . . . . . . . . . . . . . . . . . . . 603 609 513 534 351Total equity . . . . . . . . . . . . . . . . . . . . . . . . . . . . . . . . . . . . . . . . . . . . . . . . . . . . . . . . . . . . . . . . . . $ 35,881 $ 39,112 $ 30,048 $ 23,137 $ 11,092
(1) For purposes of this computation, earnings are defined as income from continuing operations before income taxes excluding undistributed income (loss)from equity method investments, fixed charges and interest capitalized. Also excludes earnings attributable to noncontrolling interests. Fixed chargesare the sum of gross interest expense, interest credited to policyholders’ account balances and an estimated interest component of rent expense. Due tothe Company’s loss for the year ended December 31, 2013, the ratio coverage was less than 1:1 and is therefore not presented. Additional earnings of$1,935 million would have been required for the year ended December 31, 2013 to achieve a ratio of 1:1.
The historical information presented in the table above has been revised to reflect the impact of retrospective adoption of adiscretionary change in accounting principle for recognition of performance based incentive fee revenue. For further information,see “—Accounting Policies and Pronouncements—Adoption of New Accounting Pronouncements” and Note 2 to the ConsolidatedFinancial Statements.
Prudential Financial, Inc. 2013 Annual Report 11

MANAGEMENT’S DISCUSSION AND ANALYSIS OF FINANCIAL CONDITION AND RESULTS OFOPERATIONS
You should read the following analysis of our consolidated financial condition and results of operations in conjunction with the“Forward-Looking Statements”, “Selected Financial Data” and the “Consolidated Financial Statements” included in this Annual Report,as well as the “Risk Factors” included in Prudential Financial’s 2013 Annual Report on Form 10-K.
Overview
Prudential Financial has two classes of common stock outstanding. The Common Stock, which is publicly traded (NYSE:PRU),reflects the performance of the Financial Services Businesses, while the Class B Stock, which was issued through a private placement anddoes not trade on any exchange, reflects the performance of the Closed Block Business. The Financial Services Businesses and the ClosedBlock Business are discussed below.
Financial Services BusinessesOur Financial Services Businesses consist of three operating divisions, which together encompass six segments, and our Corporate
and Other operations. The U.S. Retirement Solutions and Investment Management division consists of our Individual Annuities,Retirement and Asset Management segments. The U.S. Individual Life and Group Insurance division consists of our Individual Life andGroup Insurance segments. The International Insurance division consists of our International Insurance segment. Our Corporate and Otheroperations include corporate items and initiatives that are not allocated to business segments, as well as businesses that have been or will bedivested.
We attribute financing costs to each segment based on the amount of financing used by each segment, excluding financing costsassociated with corporate debt which are reflected in Corporate and Other operations. The net investment income of each segment includesearnings on the amount of capital that management believes is necessary to support the risks of that segment.
We seek growth internally and through acquisitions, joint ventures or other forms of business combinations or investments. Ourprincipal acquisition focus is in our current business lines, both domestic and international.
Closed Block BusinessIn connection with the demutualization, we ceased offering domestic participating products. The liabilities for our traditional domestic
in force participating products were segregated, together with assets, in a regulatory mechanism referred to as the “Closed Block.” TheClosed Block is designed generally to provide for the reasonable expectations for future policy dividends after demutualization of holdersof participating individual life insurance policies and annuities included in the Closed Block by allocating assets that will be usedexclusively for payment of benefits, including policyholder dividends, expenses and taxes with respect to these products. See Note 12 tothe Consolidated Financial Statements and “Business—Demutualization and Separation of Business” included in Prudential Financial’s2013 Annual Report on Form 10-K for more information on the Closed Block.
Revenues and ExpensesWe earn our revenues principally from insurance premiums; mortality, expense, asset management and administrative fees from
insurance and investment products; and investment of general account and other funds. We earn premiums primarily from the sale ofindividual life insurance, group life and disability insurance, and certain annuity contracts. We earn mortality, expense, and assetmanagement fees primarily from the sale and servicing of separate account products including variable life insurance and variableannuities, and from the sale and servicing of other products including universal life insurance. We also earn asset management andadministrative fees from the distribution, servicing and management of mutual funds, retirement products and other asset managementproducts and services. Our operating expenses principally consist of insurance benefits provided and reserves established for anticipatedfuture insurance benefits, general business expenses, dividends to policyholders, commissions and other costs of selling and servicing thevarious products we sell and interest credited on general account liabilities.
ProfitabilityOur profitability depends principally on our ability to price our insurance and annuity products at a level that enables us to earn a
margin over the costs associated with providing benefits and administering those products. Profitability also depends on, among otheritems, our actuarial and policyholder behavior experience on insurance and annuity products and our ability to attract and retain customerassets, generate and maintain favorable investment results, effectively deploy capital and utilize our tax capacity, and manage expenses.
Historically, the participating products included in the Closed Block have yielded lower returns on capital invested than many of ourother businesses. As we have ceased offering domestic participating products, we expect that the proportion of the traditional participatingproducts in our in force business will gradually diminish as these older policies age, and we grow other businesses. However, the relativelylower returns to us on this existing block of business will continue to affect our consolidated results of operations for many years. OurCommon Stock reflects the performance of our Financial Services Businesses, but there can be no assurance that the market value of theCommon Stock will reflect solely the performance of these businesses.
See “Risk Factors” included in Prudential Financial’s 2013 Annual Report on Form 10-K for a discussion of risks that have affectedand may affect in the future our business, results of operations or financial condition, cause the trading price of our Common Stock todecline materially or cause our actual results to differ materially from those expected or those expressed in any forward looking statementsmade by or on behalf of the Company.
12 Prudential Financial, Inc. 2013 Annual Report

Executive Summary
Prudential Financial, a financial services leader with approximately $1.107 trillion of assets under management as of December 31, 2013,has operations in the United States, Asia, Europe and Latin America. Through our subsidiaries and affiliates, we offer a wide array of financialproducts and services, including life insurance, annuities, retirement-related services, mutual funds, and investment management. We offer theseproducts and services to individual and institutional customers through one of the largest distribution networks in the financial services industry.
Industry TrendsOur U.S. and international businesses are impacted by financial markets, economic conditions, regulatory oversight, and a variety of
trends that affect the industries where we compete.
U.S. BusinessesFinancial and Economic Environment. Although economic and financial conditions continue to show signs of improvement, global
market conditions and uncertainty continue to be factors in the markets in which we operate. As discussed further under “Impact of a LowInterest Rate Environment” below, interest rates in the U.S. remain lower than historical levels, despite recent increases, which continues tonegatively impact our portfolio income yields. Continued high unemployment rates and limited growth in salaries also continue to befactors impacting certain business drivers, including contributions to defined contribution plans and the costs of group disability claims.
Regulatory Environment. Financial market dislocations have produced, and are expected to continue to produce, extensive changes inexisting laws and regulations, and regulatory frameworks applicable to our businesses. As discussed under “Regulatory Developments” below,the Company is now subject to stricter prudential regulatory standards and supervision by the FRB as a Designated Financial Company. The useof captive reinsurance companies is also under increased scrutiny. In addition, state insurance laws regulate all aspects of our U.S. insurancebusinesses and our insurance products are substantially affected by federal and state tax laws. Insurance regulators have begun to implementsignificant changes in the way in which industry participants must determine statutory reserves and statutory capital, particularly for productswith embedded options and guarantees such as variable annuities and universal life products with secondary guarantees.
Demographics. Income protection, wealth accumulation and the needs of retiring baby boomers continue to shape the insuranceindustry. Retirement security is one of the most critical issues in the U.S. for individuals and the investment professionals and institutionsthat support them. The risk and responsibility of retirement savings continues to shift to employees, away from the government andemployers. Life insurance ownership among U.S. households remains low, with consumers citing other financial priorities and cost ofinsurance as reasons for the lack of coverage.
Competitive Environment. For the annuities business, traditional competitors continue to take actions to either exit the marketplaceor de-risk products in response to recent market volatility. We proactively monitor changes in the annuity marketplace, and have takenactions to adapt our products to the current environment in order to maintain appropriate return prospects and improve our risk profile. Webelieve our current product offerings are competitively positioned and that our differentiated risk management strategies will provide uswith an attractive risk and profitability profile.
Our retirement and asset management businesses compete on price, service and investment performance. The full service retirementmarkets are mature, with few dominant players. We have seen a trend toward unbundling of the purchase decision related to the recordkeepingand investment offerings, where product pricing, the variety of available funds and their performance are the key selection criteria of plansponsors and intermediaries. Additionally, changes in the regulatory environment have driven more standard and consistent fee disclosures acrossindustry providers, which has heightened pricing pressures and may accelerate the trend toward unbundling of services. Market disruption andrating agency downgrades have caused some of our institutional investment product competitors to withdraw from the market, creatingsignificant growth opportunities for us in certain markets, including the investment-only stable value market. Recently, new and re-emergingcompetitors are entering the investment-only stable value market. The recovery of the equity, fixed income, and commercial real estate marketshas positively impacted asset managers by increasing assets under management and corresponding fee levels. In addition, institutional fixedincome managers have generally experienced positive flows as investors have re-allocated assets into fixed income to reduce risk, including thereduction of risk in pension plans. In recent years we have established ourselves as innovators in providing pension risk management solutions toplan sponsors, as underscored by the completion of two significant pension risk transfer transactions in 2012. We believe the emerging pensionrisk transfer market offers attractive opportunities that are aligned with our expertise.
The individual life and group life and disability markets are mature and, due to the large number of competitors, competition is drivenmainly by price and service. The economy has exacerbated pressure on pricing, creating a challenge of maintaining pricing discipline. Inthe individual life market, many of our competitors took pricing actions in 2012 in response to the low interest rate environment. Ourindividual life sales in 2013 benefited from a strong competitive position as a result of these competitor actions, as well as expandeddistribution opportunities from the acquisition of The Hartford’s individual life business. In 2013 we implemented additional productdesign and pricing changes designed to shift sales away from guaranteed products toward non-guaranteed products. Maintaining ourcompetitive positioning is dependent on sources of financing for the reserves associated with this business and timely utilization of theassociated tax benefits. For group products, rate guarantees have become the industry norm, with rate guarantee durations trending upward,primarily for group life insurance, as a general industry practice. The group insurance industry has been very competitive in recent years,however we are beginning to see rate increases take hold throughout the industry. There is also an increased demand from clients forbundling of products and services to streamline administration and save costs by dealing with fewer carriers. As employers are attemptingto control costs and shift benefit decisions and funding to employees, who continue to value benefits offered in the workplace, employee-paid (voluntary) product offerings and services are becoming increasingly important in the group market.
International BusinessesFinancial and Economic Environment. Our international insurance operations, especially in Japan, continue to operate in a low
interest rate environment. However, the local market has adapted to the low rate environment in Japan. The continued low interest rate
Prudential Financial, Inc. 2013 Annual Report 13

environment in the U.S. may impact the attractiveness of U.S. dollar-denominated products in Japan relative to yen-denominated products.We are also subject to financial impacts associated with movements in foreign currency rates, particularly the Japanese yen. Fluctuations inthe value of the yen will continue to impact the relative attractiveness of non-yen products marketed in Japan.
Regulatory Environment. Effective in April 2013, Japanese insurance regulators changed the standard discount rate for statutoryreserves on new business. This resulted in increased statutory reserve requirements for new business and selective re-pricing of insuranceproducts by insurers intended to maintain expected returns. We anticipate further changes in solvency regulation from jurisdiction tojurisdiction based on regulatory developments in the U.S., the European Union, and recommendations by an international standard settingbody for the insurance regulators, as well as regulatory requirements for those companies deemed to be systemically important financialinstitutions, or SIFIs, in the U.S. or abroad. In addition, local regulators, including in Japan, may apply heightened scrutiny to non-domesticcompanies. Internationally, regulators are also increasingly adopting measures to provide greater consumer protection and privacy rights.Further, a bill passed by the Japanese legislature in 2012 will increase the consumption tax rate during 2014 and 2015. Insurancecommissions are subject to consumption tax for individuals exceeding certain earnings thresholds, however, the tax is not charged onemployee compensation or insurance premiums. The increase in this tax is expected to lead to increased costs for insurers.
Demographics. Japan has an aging population as well as a large pool of household assets invested in low yielding deposit andsavings vehicles. The aging of Japan’s population as well as strains on government pension programs have led to a growing demand forinsurance products with a significant savings element to meet savings and retirement needs as the population transitions to retirement. Weare seeing a similar shift to retirement oriented products in Korea and Taiwan, each of which also has an aging population.
Competitive Environment. The life insurance markets in Japan and Korea are mature. We generally compete more on distributioncapabilities and service provided to customers than on price. The aging of Japan’s population creates an increasing need for productinnovation, introducing insurance products which allow for savings and income as the population transitions to retirement. The ability tosell through multiple and complementary distribution channels is a competitive advantage. However, competition for sales personnel aswell as access to third party distribution channels is intense.
Impact of a Low Interest Rate Environment
Domestic Financial Services BusinessesAs interest rates in the U.S. continue to remain lower than historical levels, our current reinvestment yields are consequently lower
than the overall portfolio income yield, primarily for our investments in fixed maturity securities and commercial mortgage loans. With theFederal Reserve Board’s stated intention to keep interest rates low through at least 2014, our overall portfolio income yields are expected tocontinue to decline throughout the coming year; however, the recent increase in interest rates, if sustained, will mitigate the impact of newinvestment purchases on our overall portfolio income yields.
For the domestic Financial Services Businesses’ general account, we expect annual scheduled payments and prepayments to beapproximately 10% of the fixed maturity security and commercial mortgage loan portfolios through 2015. The domestic Financial ServicesBusinesses’ general account has approximately $156 billion of such assets (based on net carrying value) as of December 31, 2013. As theseassets mature, the current average portfolio income yield for fixed maturities and commercial mortgage loans of approximately 4.5% is expectedto decline due to reinvesting in a lower interest rate environment. Included in the $156 billion of fixed maturity securities and commercialmortgage loans are approximately $63 billion that are subject to call or redemption features at the issuer’s option, which have a weighted averageinterest rate of approximately 5%. As of December 31, 2013, approximately 80% of the assets contain prepayment penalties.
The reinvestment of scheduled payments and prepayments at rates below the current portfolio yield, including in some cases at ratesbelow those guaranteed under our insurance contracts, will impact future operating results to the extent we do not, or are unable to, reducecrediting rates on in-force blocks of business, or effectively utilize other asset/liability management strategies described below, in order tomaintain current net interest margins. As of December 31, 2013, our domestic Financial Services Businesses have approximately $150billion of insurance liabilities and policyholder account balances. Of this amount, approximately $49 billion represents contracts withcrediting rates that may be adjusted over the life of the contract, subject to guaranteed minimums. The following table sets forth the relatedaccount values by range of guaranteed minimum crediting rates and the related range of the difference, in basis points (bps), between ratesbeing credited to contractholders as of December 31, 2013, and the respective guaranteed minimums.
Account Values with Crediting Rates:
Atguaranteedminimum
1 - 49bps above
guaranteedminimum
50 - 99bps above
guaranteedminimum
100 - 150bps above
guaranteedminimum
Greater than150
bps aboveguaranteedminimum Total
($ billions)Range of Guaranteed Minimum Crediting Rates:Less than 1% . . . . . . . . . . . . . . . . . . . . . . . . . . . . . . . . . . . . . . . . . . . . . $ 0.5 $0.0 $ 0.0 $0.0 $0.0 $ 0.51%—1.99% . . . . . . . . . . . . . . . . . . . . . . . . . . . . . . . . . . . . . . . . . . . . . . 1.3 1.4 10.0 2.9 0.3 15.92%—2.99% . . . . . . . . . . . . . . . . . . . . . . . . . . . . . . . . . . . . . . . . . . . . . . 2.4 0.0 0.1 0.8 1.4 4.73%—4.00% . . . . . . . . . . . . . . . . . . . . . . . . . . . . . . . . . . . . . . . . . . . . . . 22.9 1.4 1.9 0.4 0.0 26.6Greater than 4% . . . . . . . . . . . . . . . . . . . . . . . . . . . . . . . . . . . . . . . . . . . 1.1 0.0 0.0 0.0 0.0 1.1
Total . . . . . . . . . . . . . . . . . . . . . . . . . . . . . . . . . . . . . . . . . . . . . . . . . . . . $28.2 $2.8 $12.0 $4.1 $1.7 $48.8
Percentage of total . . . . . . . . . . . . . . . . . . . . . . . . . . . . . . . . . . . . . . . . . 58% 6% 25% 8% 3% 100%
Although we may have the ability to lower crediting rates for those contracts above guaranteed minimums, our willingness to do somay be limited by competitive pressures.
14 Prudential Financial, Inc. 2013 Annual Report
Our domestic Financial Services Businesses also have approximately $13 billion of insurance liabilities and policyholder accountbalances representing participating contracts for which the investment income risk is expected to ultimately accrue to contractholders. Thecrediting rates for these contracts are periodically adjusted based on the yield earned on the related assets. The remaining $88 billion of the$150 billion of insurance liabilities and policyholder account balances in our domestic Financial Services Businesses represents longduration products such as group annuities, structured settlements and other insurance products that have fixed and guaranteed terms, forwhich underlying assets may have to be reinvested at interest rates that are lower than portfolio rates. We seek to mitigate the impact of aprolonged low interest rate environment on these contracts through asset/liability management, as discussed further below.
For the domestic Financial Services Businesses’ general account, assuming a hypothetical scenario where the average 10-year U.S.Treasury rate is 3.00% for the period from January 1, 2014 through December 31, 2015, and credit spreads remain unchanged from levels as ofDecember 31, 2013, we estimate that the unfavorable impact to net interest margins included in pre-tax adjusted operating income of reinvestingin such an environment, compared to reinvesting at current average portfolio income yields, would be approximately $16 million in 2014 and$48 million in 2015. This impact is most significant in the Retirement and Individual Annuities segments. This hypothetical scenario only reflectsthe impact related to the approximately $49 billion of contracts shown in the table above, and does not reflect: i) any benefit from potentialchanges to the crediting rates on the corresponding contractholder liabilities where the Company has the contractual ability to do so, or otherpotential mitigants such as changes in investment mix that we may implement as funds are reinvested; ii) any impact related to assets that do notdirectly support our liabilities; iii) any impact from other factors, including but not limited to, new business, contractholder behavior, changes incompetitive conditions, and changes in capital markets; and/or iv) any impact from other factors described below.
In order to mitigate the unfavorable impact that the current interest rate environment has on our net interest margins, we employ aproactive asset/liability management program, which includes strategic asset allocation and derivative strategies within a disciplined riskmanagement framework. These strategies seek to match the characteristics of our products, and to closely approximate the interest ratesensitivity of the assets with the estimated interest rate sensitivity of the product liabilities. Our asset/liability management program alsohelps manage duration gaps, currency and other risks between assets and liabilities through the use of derivatives. We adjust this dynamicprocess as products change, as customer behavior changes and as changes in the market environment occur. As a result, our asset/liabilitymanagement process has permitted us to manage interest-sensitive products successfully through several market cycles. Our interest rateexposure is also mitigated by our business mix, which includes lines of business for which fee-based and insurance underwriting earningsplay a more prominent role in product profitability.
Japanese Insurance OperationsOur Japanese insurance operations have experienced a low interest rate environment for many years. As of December 31, 2013, these
operations have $126 billion of insurance liabilities and policyholder account balances, which are predominantly comprised of long durationinsurance products that have fixed and guaranteed terms, for which underlying assets may have to be reinvested at interest rates that arelower than portfolio rates. Also included in the $126 billion are approximately $7 billion of insurance liabilities and policyholder accountbalances with crediting rates that may be adjusted over the life of the contract, subject to guaranteed minimums; however, for these contracts,most of the current crediting rates are substantially at or near contractual minimums. Although we have the ability to lower crediting rates insome cases for those contracts above guaranteed minimum crediting rates, the majority of this business has credited interest rates which aredetermined by formula. Our Japanese insurance operations employ a proactive asset-liability management program in order to mitigate theunfavorable impact that the current interest rate environment has on our net interest margins, and includes strategies similar to thosedescribed for the domestic Financial Services Businesses above.
Current DevelopmentsOn January 2, 2013, we completed the acquisition of The Hartford Financial Services Group, Inc.’s, or The Hartford, individual life
insurance business (“Hartford Life Business”) through a reinsurance transaction. The total cash consideration was $615 million consistingprimarily of a ceding commission to provide reinsurance for approximately 700,000 life insurance policies with net retained face amount inforce of approximately $141 billion.
On each of February 12, 2013, May 14, 2013, and August 15, 2013, Prudential Financial’s Board of Directors declared a cashdividend of $0.40 per share of Common Stock. On November 12, 2013, Prudential Financial’s Board of Directors declared a cash dividendof $0.53 per share of Common Stock. On February 11, 2014, Prudential Financial’s Board of Directors declared a cash dividend of $0.53per share of Common Stock.
On June 11, 2013, Prudential Financial’s Board of Directors authorized the Company to repurchase at management’s discretion up to$1.0 billion of its outstanding Common Stock during the period from July 1, 2013 through June 30, 2014. We purchased 6.1 million shares in2013 under this authorization at a total cost of $500 million. The timing and amount of any share repurchases will be determined bymanagement based upon market conditions and other considerations, and such repurchases may be effected in the open market, throughderivative, accelerated repurchase and negotiated transactions and through prearranged trading plans designed to comply with Rule 10b5-1(c)under the Exchange Act. We purchased 6.6 million shares under the prior twelve-month $1.0 billion authorization that expired on June 30,2013 for a total cost of $400 million, including 3.9 million shares purchased in the first six months of 2013 at a total cost of $250 million.
On January 2, 2014, we completed the acquisition of UniAsia Life Assurance Berhad, an established life insurance company inMalaysia, through the formation of a joint venture with Bank Simpanan Nasional (“BSN”), a bank owned by the Malaysian government.The joint venture paid cash consideration of approximately $160 million, 70% of which was provided by Prudential Insurance and 30% ofwhich was provided by BSN.
Regulatory DevelopmentsOn September 19, 2013, the Financial Stability Oversight Council (the “Council”) made a final determination that Prudential Financial
is a Designated Financial Company. As a Designated Financial Company, Prudential Financial is subject to prudential regulatory standardsand supervision by the Board of Governors of the Federal Reserve System (“FRB”) (as a “Covered Company”) pursuant to the Dodd-FrankWall Street Reform and Consumer Protection Act. As a Designated Financial Company under the Dodd-Frank Act, Prudential Financial is
Prudential Financial, Inc. 2013 Annual Report 15

now subject to supervision and examination by the Federal Reserve Bank of Boston and to prudential regulatory standards, which includeor will include requirements (some of which are subject to future rulemaking) regarding risk-based capital, leverage, liquidity, stress-testing, overall risk management, resolution plans, early remediation and credit concentration; and may also include additional standardsregarding capital, public disclosure, short-term debt limits and other related subjects as appropriate. The Company must also seek pre-approval from the Federal Reserve for acquisition of certain companies engaged in financial activities. See “Business—Regulation” and“Risk Factors” included in Prudential Financial’s 2013 Annual Report on Form 10-K for more information regarding the potential impactof the Dodd-Frank Act on the Company, including as a result of these stricter prudential standards.
On July 18, 2013, the Financial Stability Board (the “FSB”), consisting of representatives of national financial authorities of theG20 nations, identified the Company as a global systemically important insurer (“G-SII”). U.S. financial regulators are thereby expected toenhance their regulation of the Company to achieve a number of regulatory objectives, including enhanced group-wide supervision,enhanced capital standards (including basic capital and higher loss absorption capacity requirements which are expected to begin to beimplemented in 2019), and development of a risk management plan (expected to be completed within 12 months of G-SII designation) andrecovery and resolution plans (expected to be developed and agreed by the end of 2014).
At the direction of the FSB, the International Association of Insurance Supervisors (the “IAIS”) is developing a model framework(“ComFrame”) for the supervision of internationally active insurance groups (“IAIGs”) that contemplates “group wide supervision” acrossnational boundaries. Prudential Financial qualifies as an IAIG. In October 2013, the IAIS announced that it expects to develop a risk-basedglobal insurance capital standard applicable to IAIGs by 2016, with full implementation scheduled to begin in 2019. In addition, the IAISseeks to promote the financial stability of IAIGs by endorsing: uniform standards for insurer corporate governance and enterprise riskmanagement; group-wide supervision of IAIGs; a framework for group capital adequacy assessment that accounts for group-wide risks;additional regulatory and disclosure requirements for insurance groups; and the establishment of ongoing supervisory colleges. In October2013, several of the Company’s domestic and foreign insurance regulators convened a supervisory college. The purpose of the supervisorycollege is to promote ongoing supervisory coordination, facilitate the sharing of information among regulators and to enhance eachregulator’s understanding of the Company’s risk profile.
ComFrame also requires each IAIG to conduct a group-wide risk and solvency assessment (“ORSA”) to monitor and manage itsoverall solvency. In addition, state insurance regulators have focused attention on U.S. insurance solvency regulation pursuant to theNAIC’s “Solvency Modernization Initiative.” This initiative has resulted in the recent adoption of the NAIC Risk Management and ORSAmodel act which, following enactment at the state level, will require a large insurer beginning in 2015 to at least annually assess theadequacy of its and its group’s risk management and current and future solvency position.
Dodd-Frank also includes a new framework of regulation of the over-the-counter (“OTC”) derivatives markets which requires clearingof certain types of transactions currently traded OTC and imposes additional costs, including new reporting and margin requirements. Ourcosts of risk mitigation are increasing under Dodd-Frank. For example, increased margin requirements including the requirement to pledgeinitial margin for OTC cleared transactions entered into after June 10, 2013, combined with restrictions on securities that will qualify aseligible collateral, will require increased holdings of cash and highly liquid securities with lower yields causing a reduction in income.
Most of our U.S. operating insurance companies are licensed in New York, but none are domiciled in New York. The New YorkDepartment of Financial Services (“NY DFS”) has notified us that it does not agree with our calculation of statutory reserves (including theapplicable credit for reinsurance) for New York purposes in respect of certain variable annuity products. We are currently in discussionswith the NY DFS regarding the proper level of statutory reserves (including the applicable credit for reinsurance) for these products. If weare ultimately required to establish material additional reserves on a New York statutory accounting basis or post material amounts ofadditional collateral with respect to such variable annuity or other products, our ability to deploy capital held within our U.S. domesticinsurance subsidiaries for other purposes could be affected.
In addition, the NAIC, the NY DFS and other regulators have increased their focus on life insurers’ use of captive reinsurancecompanies. If applicable insurance laws are changed in a way that restricts our use of captive reinsurance companies in the future, ourability to write certain products and efficiently manage their associated risks could be adversely affected and we may need to increaseprices on certain products, modify certain products or find alternate financing sources, any of which could adversely affect ourcompetitiveness, capital and financial position and results of operations.
At this time we cannot predict the final outcome of the above regulatory developments, including the additional capital and liquidityrequirements, compliance and regulatory costs, or other implications that may affect the Company.
OutlookManagement expects that results in 2014 will continue to reflect the quality of our individual businesses and their prospects, as well as
our overall business mix and effective capital management. In 2014, we will continue to focus on long-term strategic positioning andgrowth opportunities, including the following:
• U.S. Retirement and Investment Management Market. We seek to capitalize on the growing need of baby boomers for productsthat provide guaranteed income for longer retirement periods. In addition, we continue to focus on our clients’ increasing needs forretirement income security given volatility in the financial markets. We also seek to provide products that respond to the needs ofplan sponsors to manage risk and control their benefit costs.
• U.S. Insurance Market. We continue to focus on writing high-quality business and expect to continue to benefit from expansion ofour distribution channels and deepening our relationships with third-party distributors. We also seek to capitalize on opportunities foradditional voluntary life purchases in the group insurance market, as institutional clients are focused on controlling their benefit costs.
• International Markets. We continue to concentrate on deepening our presence in the markets in which we currently operate, such asJapan, and expanding our distribution capabilities in emerging markets. We seek to capitalize on opportunities arising in internationalmarkets as changing demographics and public policy have resulted in a growing demand for retirement income products.
16 Prudential Financial, Inc. 2013 Annual Report
Results of Operations
Net loss of our Financial Services Businesses attributable to Prudential Financial, Inc. for the year ended December 31, 2013 was$713 million compared to net income of $479 million for 2012.
We analyze performance of the segments and Corporate and Other operations of the Financial Services Businesses using a measurecalled adjusted operating income. See “—Consolidated Results of Operations—Segment Measures” for a discussion of adjusted operatingincome and its use as a measure of segment operating performance.
Shown below are the contributions of each segment and Corporate and Other operations to our adjusted operating income for the yearsended December 31, 2013, 2012 and 2011 and a reconciliation of adjusted operating income of our segments and Corporate and Otheroperations to income from continuing operations before income taxes and equity in earnings of operating joint ventures.
Results reflect the implementation of a discretionary change in accounting principle related to the accrual of performance-based incentivefee revenue in our Asset Management segment. For additional information, see Note 2 to the Consolidated Financial Statements below.
Year ended December 31,
2013 2012 2011
(in millions)Adjusted operating income before income taxes for segments of the Financial Services Businesses:
Individual Annuities . . . . . . . . . . . . . . . . . . . . . . . . . . . . . . . . . . . . . . . . . . . . . . . . . . . . . . . . . . . . . . . . . . . . . . . . . . . . . . . $ 2,085 $ 1,039 $ 662Retirement . . . . . . . . . . . . . . . . . . . . . . . . . . . . . . . . . . . . . . . . . . . . . . . . . . . . . . . . . . . . . . . . . . . . . . . . . . . . . . . . . . . . . . . 1,039 638 594Asset Management . . . . . . . . . . . . . . . . . . . . . . . . . . . . . . . . . . . . . . . . . . . . . . . . . . . . . . . . . . . . . . . . . . . . . . . . . . . . . . . . 723 584 888
Total U.S. Retirement Solutions and Investment Management Division . . . . . . . . . . . . . . . . . . . . . . . . . . . . . . . . . . . 3,847 2,261 2,144
Individual Life . . . . . . . . . . . . . . . . . . . . . . . . . . . . . . . . . . . . . . . . . . . . . . . . . . . . . . . . . . . . . . . . . . . . . . . . . . . . . . . . . . . 583 384 482Group Insurance . . . . . . . . . . . . . . . . . . . . . . . . . . . . . . . . . . . . . . . . . . . . . . . . . . . . . . . . . . . . . . . . . . . . . . . . . . . . . . . . . . 157 16 163
Total U.S. Individual Life and Group Insurance Division . . . . . . . . . . . . . . . . . . . . . . . . . . . . . . . . . . . . . . . . . . . . . . 740 400 645
International Insurance . . . . . . . . . . . . . . . . . . . . . . . . . . . . . . . . . . . . . . . . . . . . . . . . . . . . . . . . . . . . . . . . . . . . . . . . . . . . . 3,152 2,704 2,263
Total International Insurance Division . . . . . . . . . . . . . . . . . . . . . . . . . . . . . . . . . . . . . . . . . . . . . . . . . . . . . . . . . . . . . 3,152 2,704 2,263
Corporate and Other . . . . . . . . . . . . . . . . . . . . . . . . . . . . . . . . . . . . . . . . . . . . . . . . . . . . . . . . . . . . . . . . . . . . . . . . . . . . . . . (1,370) (1,338) (1,112)
Adjusted operating income before income taxes for the Financial Services Businesses . . . . . . . . . . . . . . . . . . . . . . . . . . . 6,369 4,027 3,940Reconciling Items:
Realized investment gains (losses), net, and related adjustments(1) . . . . . . . . . . . . . . . . . . . . . . . . . . . . . . . . . . . . . . . . . . (9,956) (3,666) 2,503Charges related to realized investment gains (losses), net(2) . . . . . . . . . . . . . . . . . . . . . . . . . . . . . . . . . . . . . . . . . . . . . . . . 1,807 857 (1,656)Investment gains (losses) on trading account assets supporting insurance liabilities, net(3) . . . . . . . . . . . . . . . . . . . . . . . . (250) 610 223Change in experience-rated contractholder liabilities due to asset value changes(4) . . . . . . . . . . . . . . . . . . . . . . . . . . . . . . 227 (540) (123)Divested businesses(5) . . . . . . . . . . . . . . . . . . . . . . . . . . . . . . . . . . . . . . . . . . . . . . . . . . . . . . . . . . . . . . . . . . . . . . . . . . . . . 29 (615) 90Equity in earnings of operating joint ventures and earnings attributable to noncontrolling interests(6) . . . . . . . . . . . . . . . 28 (29) (227)
Income (loss) from continuing operations before income taxes and equity in earnings of operating joint ventures forFinancial Services Businesses . . . . . . . . . . . . . . . . . . . . . . . . . . . . . . . . . . . . . . . . . . . . . . . . . . . . . . . . . . . . . . . . . . . . . . . . . . (1,746) 644 4,750
Income (loss) from continuing operations before income taxes for Closed Block Business . . . . . . . . . . . . . . . . . . . . . . . . . . . . 62 64 214
Consolidated income (loss) from continuing operations before income taxes and equity in earnings of operating jointventures . . . . . . . . . . . . . . . . . . . . . . . . . . . . . . . . . . . . . . . . . . . . . . . . . . . . . . . . . . . . . . . . . . . . . . . . . . . . . . . . . . . . . . . . . . . $(1,684) $ 708 $ 4,964
(1) Represents “Realized investment gains (losses), net,” and related adjustments. See “—Realized Investment Gains and Losses” and Note 22 to ourConsolidated Financial Statements for additional information.
(2) Includes charges that represent the impact of realized investment gains (losses), net, on the amortization of deferred policy acquisition costs and othercosts, and on changes in reserves. Also includes charges resulting from payments related to market value adjustment features of certain of our annuityproducts and the impact of realized investment gains (losses), net, on the amortization of unearned revenue reserves.
(3) Represents net investment gains and losses on trading account assets supporting insurance liabilities. See “—Experience-Rated ContractholderLiabilities, Trading Account Assets Supporting Insurance Liabilities and Other Related Investments.”
(4) Represents changes in contractholder liabilities due to asset value changes in the pool of investments supporting these experience-rated contracts. See“—Experience-Rated Contractholder Liabilities, Trading Account Assets Supporting Insurance Liabilities and Other Related Investments.”
(5) See “—Divested Businesses.”(6) Equity in earnings of operating joint ventures are included in adjusted operating income but excluded from income from continuing operations before
income taxes and equity in earnings of operating joint ventures as they are reflected on a U.S. GAAP basis on an after-tax basis as a separate line in ourConsolidated Statements of Operations. Earnings attributable to noncontrolling interests are excluded from adjusted operating income but included inincome from continuing operations before taxes and equity earnings of operating joint ventures as they are reflected on a U.S. GAAP basis as a separateline in our Consolidated Statements of Operations. Earnings attributable to noncontrolling interests represent the portion of earnings from consolidatedentities that relates to the equity interests of minority investors.
Results for 2013 presented above reflect the following:
Individual Annuities. Segment results for 2013 increased in comparison to 2012. The increase reflects a favorable comparativeimpact from changes in the estimated profitability of the business, driven by annual reviews and updates of assumptions performed in thethird quarter of each year, and market performance relative to assumptions. Also contributing to the increase are higher asset-based feeincome, driven by higher average variable annuity account values, net of a related increase in asset-based commissions and reserveprovisions, as well as lower general and administrative expenses, net of capitalization.
Retirement. Segment results for 2013 increased in comparison to 2012. The increase reflects higher net investment spread, includingfavorable results from non-coupon investments, and a more favorable reserve impact from case experience, both primarily driven by the
Prudential Financial, Inc. 2013 Annual Report 17

significant pension risk transfer transactions that closed in the fourth quarter of 2012. Also contributing to this increase was higher asset-based fee income reflecting higher comparative investment-only stable value product account values and equity market appreciation. Theseincreases were partially offset by higher general and administrative expenses, net of capitalization.
Asset Management. Segment results for 2013 increased in comparison to 2012 primarily driven by higher asset management fees,net of expenses, reflecting continued growth in assets under management, as well as the absence of losses incurred in 2012 associated withtwo real estate investments from the segment’s strategic investing activities, partially offset by a lower contribution from the segment’scommercial mortgage activities.
Individual Life. Segment results for 2013 increased in comparison to 2012. The increase primarily reflects earnings from the in forcebusiness acquired from the Hartford in January 2013 as well as favorable comparative impacts from mortality experience and our annualreviews and updates of assumptions.
Group Insurance. Segment results increased in 2013 in comparison to 2012 primarily driven by more favorable group life anddisability underwriting results and a favorable comparative impact from our annual reviews and updates of assumptions and otherrefinements.
International Insurance. Segment results for 2013 increased in comparison to 2012. The increase reflects business growth in bothour Life Planner and Gibraltar Life and Other operations, additional synergies and lower integration costs associated with our acquisition ofthe former Star and Edison Businesses, favorable results from non-coupon investments, and more favorable foreign currency exchangerates, including the impact of our currency hedging programs. Partly offsetting these favorable items was the impact from our annualreviews and updates of assumptions used in estimating the profitability of the business, as well as reserve strengthening on certain policiesbased on an internal review.
Corporate and Other operations. The results for 2013 as compared to 2012 reflect an increased loss primarily driven by higherlevels of expenses and greater interest expense, net of investment income, including the impact of debt prefunding activities.
Closed Block Business. Income from continuing operations before income taxes was essentially unchanged from 2012 as a decline innet investment income was largely offset by a corresponding decrease in the policyholder dividend obligation.
Consolidated Results of Operations
The following table summarizes net income for the Financial Services Businesses and the Closed Block Business for the periods presented.
Year ended December 31,
2013 2012 2011
(in millions)Financial Services Businesses:
Revenues . . . . . . . . . . . . . . . . . . . . . . . . . . . . . . . . . . . . . . . . . . . . . . . . . . . . . . . . . . . . . . . . . . . . . . . . . . . . . . . . . . . . . . . $35,425 $78,590 $42,070Benefits and expenses . . . . . . . . . . . . . . . . . . . . . . . . . . . . . . . . . . . . . . . . . . . . . . . . . . . . . . . . . . . . . . . . . . . . . . . . . . . . . 37,171 77,946 37,320
Income (loss) from continuing operations before income taxes and equity in earnings of operating joint ventures forFinancial Services Businesses . . . . . . . . . . . . . . . . . . . . . . . . . . . . . . . . . . . . . . . . . . . . . . . . . . . . . . . . . . . . . . . . . . . . . . . . . (1,746) 644 4,750
Income tax expense (benefit) . . . . . . . . . . . . . . . . . . . . . . . . . . . . . . . . . . . . . . . . . . . . . . . . . . . . . . . . . . . . . . . . . . . (1,074) 192 1,447
Income (loss) from continuing operations before equity in earnings of operating joint ventures for Financial ServicesBusinesses . . . . . . . . . . . . . . . . . . . . . . . . . . . . . . . . . . . . . . . . . . . . . . . . . . . . . . . . . . . . . . . . . . . . . . . . . . . . . . . . . . . . . . . . (672) 452 3,303
Equity in earnings of operating joint ventures, net of taxes . . . . . . . . . . . . . . . . . . . . . . . . . . . . . . . . . . . . . . . . . . . . 59 60 182
Income (loss) from continuing operations for Financial Services Businesses . . . . . . . . . . . . . . . . . . . . . . . . . . . . . . . . . . . . . . (613) 512 3,485Income from discontinued operations, net of taxes . . . . . . . . . . . . . . . . . . . . . . . . . . . . . . . . . . . . . . . . . . . . . . . . . . . . . . 7 17 35
Net income (loss)—Financial Services Businesses . . . . . . . . . . . . . . . . . . . . . . . . . . . . . . . . . . . . . . . . . . . . . . . . . . . . . . . . . . (606) 529 3,520Less: Income attributable to noncontrolling interests . . . . . . . . . . . . . . . . . . . . . . . . . . . . . . . . . . . . . . . . . . . . . . . . . . . . . . . . . 107 50 34
Net income (loss) of Financial Services Businesses attributable to Prudential Financial, Inc. . . . . . . . . . . . . . . . . . . . . . . . . . $ (713) $ 479 $ 3,486
Closed Block Business:Revenues . . . . . . . . . . . . . . . . . . . . . . . . . . . . . . . . . . . . . . . . . . . . . . . . . . . . . . . . . . . . . . . . . . . . . . . . . . . . . . . . . . . . . . . $ 6,036 $ 6,257 $ 7,015Benefits and expenses . . . . . . . . . . . . . . . . . . . . . . . . . . . . . . . . . . . . . . . . . . . . . . . . . . . . . . . . . . . . . . . . . . . . . . . . . . . . . 5,974 6,193 6,801
Income from continuing operations before income taxes for Closed Block Business . . . . . . . . . . . . . . . . . . . . . . . . . . . . . . . . 62 64 214Income tax expense . . . . . . . . . . . . . . . . . . . . . . . . . . . . . . . . . . . . . . . . . . . . . . . . . . . . . . . . . . . . . . . . . . . . . . . . . . . . . . . . . . . 16 21 68
Income from continuing operations for Closed Block Business . . . . . . . . . . . . . . . . . . . . . . . . . . . . . . . . . . . . . . . . . . . . . . . . . 46 43 146Income (loss) from discontinued operations, net of taxes . . . . . . . . . . . . . . . . . . . . . . . . . . . . . . . . . . . . . . . . . . . . . . . . . . . . . . 0 (2) 0
Net income—Closed Block Business . . . . . . . . . . . . . . . . . . . . . . . . . . . . . . . . . . . . . . . . . . . . . . . . . . . . . . . . . . . . . . . . . . . . . 46 41 146Less: Income attributable to noncontrolling interests . . . . . . . . . . . . . . . . . . . . . . . . . . . . . . . . . . . . . . . . . . . . . . . . . . . . . . . . . 0 0 0
Net income of Closed Block Business attributable to Prudential Financial, Inc. . . . . . . . . . . . . . . . . . . . . . . . . . . . . . . . . . . . . $ 46 $ 41 $ 146
Consolidated:
Net income (loss) attributable to Prudential Financial, Inc. . . . . . . . . . . . . . . . . . . . . . . . . . . . . . . . . . . . . . . . . . . . . . . . . . . . . $ (667) $ 520 $ 3,632
18 Prudential Financial, Inc. 2013 Annual Report

Results of Operations—Financial Services Businesses2013 to 2012 Annual Comparison. Income from continuing operations for the Financial Services Businesses decreased $1,125
million from 2012 to 2013. Results for 2013 compared to 2012 reflect the following:
• A $3,072 million unfavorable variance, before income taxes, reflecting the net impact from changes in the value of our embeddedderivatives and related hedge positions associated with certain variable annuities, largely driven by changes in the adjustment fornon-performance risk, as well as the impacts from our annual reviews and updates of assumptions performed in the third quarter;
• Lower net pre-tax earnings of $2,392 million resulting from the impact of foreign currency exchange rate movements on certainnon-yen denominated assets and liabilities within our Japanese insurance operations which are economically matched and offset inAOCI, driven by the weakening of the Japanese yen; and
• $1,802 million lower net pre-tax realized gains (losses), excluding the impact of the hedging program associated with certainvariable annuities described above, primarily reflecting changes in the market value of derivatives due to changes in interest ratesand foreign currency exchange rate movements.
Partially offsetting these decreases in income from continuing operations were the following items:
• More favorable results of $1,897 million, on a pre-tax basis, associated with our Capital Protection Framework, driven by anincrease in interest rates, reflecting our decision to manage interest rate risk through this framework;
• A $1,408 million favorable variance, before taxes, from adjustments to deferred policy acquisition and other costs as well asreserves, reflecting updates to the estimated profitability of our businesses primarily driven by the impact of our annual reviews andupdates of assumptions performed in the third quarter of each year. This includes the absence of a $698 million net charge in 2012associated with long-term care products, which are included in Divested Businesses, but excludes the impact associated with thevariable annuity hedging program discussed above; and
• A $1,266 million decrease in income tax expense reflecting a decrease in pre-tax income from continuing operations(see “—Income Taxes” for additional information).
In addition to the items above, our segment’s earnings benefited from business growth, including the impact from higher accountvalues, particularly within our U.S. Retirement Solutions and Investment Management Division, growth of in force in ourInternational Insurance Division, contributions from our acquisition of the Hartford Life Business, and higher income from non-coupon investments (see “—Results of Operations for Financial Services Businesses by Segment” for additional information).
2012 to 2011 Annual Comparison. Income from continuing operations for the Financial Services Businesses decreased $2,973million from 2011 to 2012. Results for 2012 compared to 2011 reflect the following:
• A $2,386 million unfavorable variance, before income taxes, reflecting the net impact from changes in the value of our embeddedderivatives and related hedge positions associated with certain variable annuities, including the impacts from our annual reviewsand updates of assumptions performed in the third quarter;
• Lower pre-tax earnings of $2,377 million resulting from the impact of foreign currency exchange rate movements on certain non-yen denominated assets and liabilities within our Japanese insurance operations which are economically matched and offset inAOCI, driven by the weakening of the Japanese yen;
• A $336 million unfavorable variance, before taxes, from adjustments to deferred policy acquisition and other costs as well asreserves, reflecting updates to the estimated profitability of our businesses primarily driven by the impact of our annual reviews andupdates of assumptions performed in the third quarter of each year. This includes a $698 million net charge in 2012 associated withlong-term care products, which are included in Divested Businesses, but excludes the impact associated with the variable annuityhedging program discussed above;
• Lower net pre-tax realized gains (losses) of $539 million, excluding the impact of the hedging program associated with certainvariable annuities described above, primarily reflecting changes in the market value of derivatives due to changes in interest rates aswell as foreign currency exchange rate movements;
• The comparative impact of a $237 million pre-tax benefit in 2011 compared to a pre-tax benefit of $60 million in 2012 reflectingpartial sales of our indirect interest in China Pacific Insurance Group; and
• The absence of a $96 million pre-tax gain in 2011 reflecting the sale of our investment in Afore XXI, an operating joint venture inour Asset Management segment.
Partially offsetting these decreases in income from continuing operations were the following items:
• More favorable results of $1,827 million, on a pre-tax basis, associated with our Capital Protection Framework, driven by anincrease in interest rates, reflecting our decision to manage interest rate risk through this framework; and
• A $1,255 million decrease in income tax expense reflecting a decrease in pre-tax income from continuing operations; and
• The absence of a $93 million pre-tax charge recorded in 2011 for estimated payments arising from use of new Social SecurityMaster Death File matching criteria to identify deceased policy and contract holders.
Results of Operations—Closed Block BusinessFor a discussion of the results of operations for the Closed Block Business, see “—Results of Operations of Closed Block Business” below.
Segment MeasuresAdjusted Operating Income. In managing our business, we analyze operating performance separately for our Financial Services
Businesses and our Closed Block Business. For the Financial Services Businesses, we analyze our segments’ operating performance using
Prudential Financial, Inc. 2013 Annual Report 19

“adjusted operating income.” Results of the Closed Block Business for all periods are evaluated and presented only in accordance with U.S.GAAP. Adjusted operating income does not equate to “income (loss) from continuing operations before income taxes and equity inearnings of operating joint ventures” or “net income” as determined in accordance with U.S. GAAP but is the measure of segment profit orloss we use to evaluate segment performance and allocate resources, and consistent with authoritative guidance, is our measure of segmentperformance. The adjustments to derive adjusted operating income are important to an understanding of our overall results of operations.Adjusted operating income is not a substitute for income determined in accordance with U.S. GAAP, and our definition of adjustedoperating income may differ from that used by other companies. However, we believe that the presentation of adjusted operating income aswe measure it for management purposes enhances understanding of our results of operations by highlighting the results from ongoingoperations and the underlying profitability of the Financial Services Businesses.
See Note 22 to the Consolidated Financial Statements for further information on the presentation of segment results and our definitionof adjusted operating income.
Annualized New Business Premiums. In managing certain of our businesses, we analyze annualized new business premiums, whichdo not correspond to revenues under U.S. GAAP. Annualized new business premiums measure the current sales performance of thebusiness, while revenues primarily reflect the renewal persistency of policies written in prior years and net investment income, in additionto current sales. Annualized new business premiums include 10% of first year premiums or deposits from single pay products. No otheradjustments are made for limited pay contracts.
Assets Under Management. In managing our Asset Management business, we analyze assets under management, which do notcorrespond to U.S. GAAP assets, because the principal source of revenues is fees based on assets under management. Assets undermanagement represents the fair market value or account value of assets which we manage directly for institutional clients, retail clients, andfor our general account, as well as assets invested in our products that are managed by third party managers.
Account Values. For our Individual Annuity and Retirement businesses, assets are reported at account value, which do notcorrespond to U.S. GAAP assets. Net sales (redemptions) in our Individual Annuity business and net additions (withdrawals) in ourRetirement business do not correspond to revenues under U.S. GAAP, but are used as relevant measures of business activity.
Accounting Policies & Pronouncements
Application of Critical Accounting EstimatesThe preparation of financial statements in conformity with accounting principles generally accepted in the United States of America,
or U.S. GAAP, requires the application of accounting policies that often involve a significant degree of judgment. Management, on anongoing basis, reviews estimates and assumptions used in the preparation of financial statements. If management determines thatmodifications in assumptions and estimates are appropriate given current facts and circumstances, the Company’s results of operations andfinancial position as reported in the Consolidated Financial Statements could change significantly.
The following sections discuss the accounting policies applied in preparing our financial statements that management believes are mostdependent on the application of estimates and assumptions and require management’s most difficult, subjective, or complex judgments.
Deferred Policy Acquisition and Other CostsWe capitalize costs that are directly related to the acquisition or renewal of insurance and annuity contracts. These costs primarily include
commissions, as well as costs of policy issuance and underwriting and certain other expenses that are directly related to successfully negotiatedcontracts. See Note 2 to our Consolidated Financial Statements for a discussion of the authoritative guidance adopted effective January 1, 2012,regarding which costs relating to the acquisition of new or renewal insurance contracts qualify for deferral. We have also deferred costsassociated with sales inducements related to our variable and fixed annuity contracts primarily within our Individual Annuities segment. Salesinducements are amounts that are credited to the policyholder’s account balance as an inducement to purchase the contract. For additionalinformation about sales inducements, see Note 11 to the Consolidated Financial Statements. We generally amortize these deferred policyacquisition costs, or DAC, and deferred sales inducements, or DSI, over the expected lives of the contracts, based on our estimates of the leveland timing of gross margins, gross profits, or gross premiums, depending on the type of contract. As described in more detail below, incalculating DAC and DSI amortization, we are required to make assumptions about investment returns, mortality, persistency, and other itemsthat impact our estimates of the level and timing of gross margins, gross profits, or gross premiums. We also periodically evaluate therecoverability of our DAC and DSI. For certain contracts, this evaluation is performed as part of our premium deficiency testing, as discussedfurther below in “—Policyholder Liabilities.” As of December 31, 2013, DAC and DSI in our Financial Services Businesses were $16.1 billionand $1.8 billion, respectively, and DAC in our Closed Block Business was $411 million.
Amortization methodologiesDAC associated with the traditional participating products of our Closed Block Business is amortized over the expected lives of those
contracts in proportion to estimated gross margins. Gross margins consider premiums, investment returns, benefit claims, costs for policyadministration, changes in reserves, and dividends to policyholders. We evaluate our estimates of future gross margins and adjust the relatedDAC balance with a corresponding charge or credit to current period earnings for the effects of actual gross margins and changes in our expectedfuture gross margins. DAC adjustments for these participating products generally have not created significant volatility in our results ofoperations since many of the factors that affect gross margins are also included in the determination of our dividends to these policyholders and,during most years, the Closed Block has recognized a cumulative policyholder dividend obligation expense in “Policyholders’ dividends,” for theexcess of actual cumulative earnings over expected cumulative earnings as determined at the time of demutualization. However, if actualcumulative earnings fall below expected cumulative earnings in future periods, thereby eliminating the cumulative policyholder dividendobligation expense, changes in gross margins and DAC amortization would result in a net impact to the Closed Block Business results ofoperations. As of December 31, 2013, the excess of actual cumulative earnings over the expected cumulative earnings was $887 million.
DAC associated with the non-participating whole life and term life policies of our Individual Life segment and the whole life, termlife, endowment and health policies of our International Insurance segment is amortized in proportion to gross premiums.
20 Prudential Financial, Inc. 2013 Annual Report

DAC and DSI associated with the variable and universal life policies of our Individual Life and International Insurance segments and thevariable and fixed annuity contracts of our Individual Annuities and International Insurance segments are generally amortized over the expectedlife of these policies in proportion to total gross profits. Total gross profits include both actual gross profits and estimates of gross profits forfuture periods. In calculating gross profits, we consider mortality, persistency, and other elements as well as rates of return on investmentsassociated with these contracts and the costs related to our guaranteed minimum death and guaranteed minimum income benefits. For variableannuities in our Individual Annuities segment, actual gross profits also include the impacts of the embedded derivatives associated with certain ofthe optional living benefit features of our variable annuity contracts and related hedging activities, and actual gross profits used to determineamortization rates include the difference between the change in the fair value of hedge positions and the change in the value of an internally-defined hedge target related to these features. In calculating amortization expense, we estimate the amounts of gross profits that will be includedin our U.S. GAAP results and in adjusted operating income, and utilize these estimates to calculate distinct amortization rates and expenseamounts. We also regularly evaluate and adjust the related DAC and DSI balances with a corresponding charge or credit to current periodearnings for the impact of actual gross profits and changes in our projections of estimated future gross profits on our DAC and DSI amortizationrates. Adjustments to the DAC and DSI balances include the impact to our estimate of total gross profits of the annual review of assumptions, ourquarterly adjustments for current period experience, and our quarterly adjustments for market performance. Each of these adjustments is furtherdiscussed below in “—Annual assumptions review and quarterly adjustments.” For additional information on our internally-defined hedge target,see “—Results of Operations for Financial Services Businesses by Segment—U.S. Retirement Solutions and Investment ManagementDivision—Individual Annuities—Variable Annuity Living Benefits Hedging Program Results.”
The amortization methodologies for products not discussed above primarily relate to less significant DAC balances associated withproducts in our Group Insurance and Retirement segments, which comprised approximately 2% of the Company’s total DAC balance as ofDecember 31, 2013.
Annual assumptions review and quarterly adjustments
Annually, during the third quarter, we perform a comprehensive review of the assumptions used in estimating gross profits for futureperiods. Over the last several years, the Company’s most significant assumption updates resulting in a change to expected future grossprofits and the amortization of DAC and DSI have been related to lapse experience and other contractholder behavior assumptions,mortality, and revisions to expected future rates of returns on investments. These assumptions may also cause potential significantvariability in amortization expense in the future. The impact on our results of operations of changes in these assumptions can be offsettingand we are unable to predict their movement or offsetting impact over time.
The quarterly adjustments for current period experience referred to above reflect the impact of differences between actual gross profitsfor a given period and the previously estimated expected gross profits for that period. To the extent each period’s actual experience differsfrom the previous estimate for that period, the assumed level of total gross profits may change. In these cases, we recognize a cumulativeadjustment to all previous periods’ amortization, also referred to as an experience true-up adjustment.
The quarterly adjustments for market performance referred to above reflect the impact of changes to our estimate of total gross profitsto reflect actual fund performance and market conditions. A significant portion of gross profits for our variable annuity contracts and, to alesser degree, our variable life policies are dependent upon the total rate of return on assets held in separate account investment options.This rate of return influences the fees we earn, costs we incur associated with the guaranteed minimum death and guaranteed minimumincome benefit features related to our variable annuity contracts, as well as other sources of profit. Returns that are higher than ourexpectations for a given period produce higher than expected account balances, which increase the future fees we expect to earn anddecrease the future costs we expect to incur associated with the guaranteed minimum death and guaranteed minimum income benefitfeatures related to our variable annuity contracts. The opposite occurs when returns are lower than our expectations. The changes in futureexpected gross profits are used to recognize a cumulative adjustment to all prior periods’ amortization.
The near-term future rate of return assumptions used in evaluating DAC and DSI for our domestic variable annuity and variable lifeinsurance products are derived using a reversion to the mean approach, a common industry practice. Under this approach, we considerhistorical equity returns over a period of time and initially adjust future projected equity returns over the next four years (the “near-term”)so that the assets are projected to grow at the long-term expected rate of return for the entire period. If the near-term projected future rate ofreturn is greater than our near-term maximum future rate of return of 13%, we use our maximum future rate of return. As of December 312013, our variable annuities and variable life insurance businesses assume an 8.0% long-term equity expected rate of return and a 3.9%near-term mean reversion equity rate of return.
The weighted average rate of return assumptions for these businesses consider many factors specific to each business, including assetdurations, asset allocations and other factors. We generally update the near term equity rates of return and our estimate of total gross profitseach quarter to reflect the result of the reversion to the mean approach, which assumes a convergence to the long-term equity expected ratesof return. These market performance related adjustments to our estimate of total gross profits result in cumulative adjustments to prioramortization, reflecting the application of the new required rate of amortization to all prior periods’ gross profits.
DAC and DSI Sensitivities
Variability in the level of amortization expense has historically been driven by the variable annuities and variable and universal lifeinsurance policies in our Individual Life and Individual Annuities segments, for which costs are amortized in proportion to total grossprofits. For our International Insurance segment, these products have historically experienced less significant variability due to a lessmaterial block of variable annuities and variable and universal life insurance policies.
For the variable and universal life policies of our Individual Life segment, a significant portion of our gross profits is derived from mortalitymargins. As a result, our estimates of future gross profits are significantly influenced by our mortality assumptions. Our mortality assumptionsare used to estimate future death claims over the life of these policies and may be developed based on Company experience, industry experienceand/or other factors. Unless a material change in mortality experience that we feel is indicative of a long term trend is observed in an interimperiod, we generally update our mortality assumptions annually in the third quarter. Updates to our mortality assumptions in future periods couldhave a significant adverse or favorable effect on the results of our operations in the Individual Life segment.
Prudential Financial, Inc. 2013 Annual Report 21

The DAC balance associated with the variable and universal life policies of our Individual Life segment as of December 31, 2013 was $2.6billion. The following table provides a demonstration of the sensitivity of that DAC balance relative to our future mortality assumptions byquantifying the adjustments that would be required, assuming both an increase and decrease in our future mortality rate by 1%. The informationbelow is for illustrative purposes only and considers only the direct effect of changes in our mortality assumptions on the DAC balance, with nochanges in any other assumptions such as persistency, future rate of return, or expenses included in our evaluation of DAC. Further, this informationdoes not reflect changes in reserves, such as the reserves for no lapse guarantees and the unearned revenue reserve, which would partially offset theadjustments to the DAC balance reflected below. These reserves are discussed in more detail below in “—Policyholder Liabilities.”
December 31, 2013
Increase/(Decrease) in DAC
(in millions)Decrease in future mortality by 1% . . . . . . . . . . . . . . . . . . . . . . . . . . . . . . . . . . . . . . . . . . . . . . . . . . . . . . . . . . . . . . . . . . . . . . . $ 35Increase in future mortality by 1% . . . . . . . . . . . . . . . . . . . . . . . . . . . . . . . . . . . . . . . . . . . . . . . . . . . . . . . . . . . . . . . . . . . . . . . . $(36)
In addition to the impact of mortality experience relative to our assumptions, other factors may also drive variability in amortizationexpense, particularly during the third quarter when assumption updates are performed. As noted above, however, the impact on our resultsof operations of changes in these assumptions can be offsetting and we are unable to predict their movement or offsetting impact over time.In the third quarter of 2013, updates to mortality assumptions drove the most significant changes to amortization expense. For a discussionof DAC adjustments related to our Individual Life segment for the years ended December 31, 2013, 2012 and 2011, see “—Results ofOperations for Financial Services Businesses by Segment—U.S. Individual Life and Group Insurance Division—Individual Life.”
For the variable annuity contracts of our Individual Annuities segment, DAC and DSI are more sensitive to changes in our future rate ofreturn assumptions due primarily to the significant portion of our gross profits that is dependent upon the total rate of return on assets held inseparate account investment options. The DAC and DSI balances associated with our domestic variable annuity contracts were $5.5 billion and$1.8 billion, respectively, as of December 31, 2013. The following table provides a demonstration of the sensitivity of each of these balancesrelative to our future rate of return assumptions by quantifying the adjustments to each balance that would be required assuming both an increaseand decrease in our future rate of return by 100 basis points. The sensitivity includes an increase and decrease of 100 basis points to both thenear-term future rate of return assumptions used over the next four years, and the long-term expected rate of return used thereafter. Theinformation below is for illustrative purposes only and considers only the direct effect of changes in our future rate of return on the DAC and DSIbalances and not changes in any other assumptions such as persistency, mortality, or expenses included in our evaluation of DAC and DSI.Further, this information does not reflect changes in reserves, such as the reserves for the guaranteed minimum death and optional living benefitfeatures of our variable annuity products, or the impact that changes in such reserves may have on the DAC and DSI balances.
December 31, 2013
Increase/(Decrease) in DAC
Increase/(Decrease) in DSI
(in millions)Decrease in future rate of return by 100 basis points . . . . . . . . . . . . . . . . . . . . . . . . . . . . . . . . . . . . . . . . . . . . . . . . $(65) $(34)Increase in future rate of return by 100 basis points . . . . . . . . . . . . . . . . . . . . . . . . . . . . . . . . . . . . . . . . . . . . . . . . . $ 63 $ 32
In addition to the impact of market performance relative to our future rate of return assumptions, other factors may also drivevariability in amortization expense, particularly during the third quarter when assumption updates are performed. As noted above, however,the impact on our results of operations of changes in these assumptions can be offsetting and we are unable to predict their movement oroffsetting impact over time. In the third quarter of 2013, updates to lapse rate and utilization rate assumptions drove the most significantchanges to amortization expense. For a discussion of DAC and DSI adjustments related to our Individual Annuities segment for the yearsended December 31, 2013, 2012 and 2011, see “—Results of Operations for Financial Services Businesses by Segment—U.S. RetirementSolutions and Investment Management Division—Individual Annuities.”
Value of Business Acquired
In addition to DAC and DSI, we also recognize an asset for value of business acquired, or VOBA. VOBA is an intangible asset whichrepresents an adjustment to the stated value of acquired inforce insurance contract liabilities to present them at fair value, determined as of theacquisition date. It includes an explicit adjustment to reflect the cost of capital attributable to the acquired insurance contracts. VOBA isamortized over the expected life of the acquired contracts in proportion to either gross premiums or estimated gross profits, depending on the typeof contract. VOBA is also subject to recoverability testing. As of December 31, 2013, VOBA was $3,675 million, and included $2,036 millionrelated to the acquisition from American International Group, Inc., or AIG, of AIG Star Life Insurance Co., Ltd, AIG Edison Life InsuranceCompany, and related entities (collectively, the “Star and Edison Businesses”) on February 1, 2011, and $1,373 million related to the acquisitionof the Hartford’s individual life insurance business. See Note 3 to the Consolidated Financial Statements for additional information on theseacquisitions. The remaining $266 million primarily relates to previously-acquired traditional life, deferred annuity, defined contribution anddefined benefit businesses. For additional information about VOBA including details on items included in our estimates of future cash flows forthe various acquired businesses and its bases for amortization, see Note 2 and Note 8 to the Consolidated Financial Statements.
GoodwillAs of December 31, 2013, our goodwill balance of $839 million is reflected in the following four reporting units: $444 million related
to our Retirement Full Service business, $240 million related to our Asset Management business, $137 million related to our Gibraltar Lifeand Other operations and $18 million related to our International Insurance Life Planner business.
We test goodwill for impairment on an annual basis, as of December 31 of each year, or more frequently if events or circumstancesindicate the potential for impairment is more likely than not. The goodwill impairment analysis is performed at the reporting unit levelwhich is equal to or one level below our operating segments. This analysis includes a qualitative assessment, for which reporting units may
22 Prudential Financial, Inc. 2013 Annual Report

elect to bypass in accordance with accounting guidance, and a quantitative analysis consisting of two steps. For additional information ongoodwill and the process for testing goodwill for impairment, see Note 2 and Note 9 to the Consolidated Financial Statements.
The International Insurance’s Life Planner business and the Asset Management segment elected to bypass the qualitative assessmentand complete their impairment analysis using an earnings multiple approach. The earnings multiple approach indicates the value of abusiness based on comparison to publicly-traded comparable companies in similar lines of business. Each comparable company is analyzedbased on various factors, including, but not limited to, financial risk, size, geographic diversification, profitability, adequate financial data,and an actively traded stock price. A multiple of price to earnings is developed for the comparable companies using independent analysts’consensus estimates for each company’s 2014 forecasted earnings. The multiples are then aggregated and a mean and median multiple iscalculated for the group. The lower of the mean or median multiple is then applied to the 2014 forecasted earnings of the reporting unit todevelop a value. A control premium is then added to determine a total estimated fair value for the reporting unit.
The Retirement Full Service business and Gibraltar Life and Other operations also elected to bypass the qualitative assessment andcomplete their impairment analysis using a discounted cash flow approach. The discounted cash flow approach calculates the value of abusiness by applying a discount rate reflecting the market expected weighted average rate of return to the projected future cash flows of thereporting unit. These projected future cash flows were based on our internal forecasts, an expected growth rate and a terminal value. Theweighted average rate of return, or WARR, represents the required rate of return on total capitalization. It is comprised of a required rate ofreturn on equity of a company and the current tax-affected cost of debt, which are then weighted by the relative percentages of equity anddebt assumed in the capital structure. To estimate the return on equity, we applied the Capital Asset Pricing Model, or CAPM. The CAPMis a generally accepted method for estimating an equity investor’s return requirement, and hence a company’s cost of equity capital. CAPMis determined by beginning with the long-term risk-free rate of return then applying adjustments that consider the equity risk premiumrequired for large company common stock investments as well as company specific adjustments to address volatility, small companypremiums and other risks particular to a specific company. The WARR calculation is applied to a group of companies considered peers ofthe reporting unit to develop a weighted average rate of return for the peer group which is then used to estimate the market expectedweighted average rate of return for the reporting unit. This process resulted in a discount rate of 12% which was then applied to theexpected future cash flows of the Retirement Full Service business and Gibraltar Life and Other operations to estimate its fair value.
After completion of Step 1 of the quantitative tests, it was determined that fair values exceeded the carrying amounts for each of thefour reporting units and it was concluded there was no impairment as of December 31, 2013. The Asset Management, InternationalInsurance’s Life Planner, Gibraltar Life and Other operations and Retirement Full Service businesses had estimated fair values thatexceeded their carrying amounts, each by more than 45%.
Estimating the fair value of reporting units is a subjective process that involves the use of significant estimates by management.Regarding all reporting units tested, market declines or other events impacting the fair value of these businesses, including discount rates,interest rates and growth rate assumptions or increases in the level of equity required to support these businesses, could result in goodwillimpairments, resulting in a charge to income.
Valuation of Investments, Including Derivatives, and the Recognition of Other-than-Temporary Impairments
Our investment portfolio consists of public and private fixed maturity securities, commercial mortgage and other loans, equity securities,other invested assets, and derivative financial instruments. Derivatives are financial instruments whose values are derived from interest rates,foreign exchange rates, financial indices or the values of securities or commodities. Derivative financial instruments we generally use includeswaps, futures, forwards and options and may be exchange-traded or contracted in the over-the-counter market. We are also party to financialinstruments that contain derivative instruments that are “embedded” in the financial instruments. Management believes the following accountingpolicies related to investments, including derivatives, are most dependent on the application of estimates and assumptions. Each of these policiesis discussed further within other relevant disclosures related to the investments and derivatives, as referenced below.
• Valuation of investments, including derivatives
• Recognition of other-than-temporary impairments
• Determination of the valuation allowance for losses on commercial mortgage and other loans
We present our investments classified as available-for-sale, including fixed maturity and equity securities, our investments classifiedas trading, such as our trading account assets supporting insurance liabilities, our derivatives, and our embedded derivatives at fair value inthe statements of financial position. For additional information regarding the key estimates and assumptions surrounding the determinationof fair value of fixed maturity and equity securities, as well as derivative instruments, embedded derivatives and other investments, seeNote 20 to the Consolidated Financial Statements and “—Valuation of Assets and Liabilities—Fair Value of Assets and Liabilities.”
For our investments classified as available-for-sale, the impact of changes in fair value is recorded as an unrealized gain or loss in“Accumulated other comprehensive income (loss),” or “AOCI,” a separate component of equity. For our investments classified as trading, theimpact of changes in fair value is recorded within “Asset management fees and other income.” In addition, investments classified as available-for-sale, as well as those classified as held-to-maturity, are subject to impairment reviews to identify when a decline in value is other-than-temporary. For a discussion of our policies regarding other-than-temporary declines in investment value and the related methodology forrecording other-than-temporary impairments of fixed maturity and equity securities, see Note 2 to the Consolidated Financial Statements.
Commercial mortgage and other loans are carried primarily at unpaid principal balances, net of unamortized deferred loan originationfees and expenses and unamortized premiums or discounts and a valuation allowance for losses. For a discussion of our policies regardingthe valuation allowance for commercial mortgage and other loans see Note 2 to the Consolidated Financial Statements.
Prudential Financial, Inc. 2013 Annual Report 23

Policyholder Liabilities
Future Policy Benefit Reserves, other than Unpaid Claims and Claim Adjustment ExpensesWe establish reserves for future policy benefits to, or on behalf of, policyholders in the same period in which the policy is issued or acquired,
using methodologies prescribed by U.S. GAAP. The reserving methodologies used for our Financial Services Businesses include the following:
• For most long duration contracts, we utilize best estimate assumptions as of the date the policy is issued or acquired with provisionsfor the risk of adverse deviation, as appropriate. After the liabilities are initially established, we perform premium deficiency testsusing best estimate assumptions as of the testing date without provisions for adverse deviation. If the liabilities determined based onthese best estimate assumptions are greater than the net reserves (i.e., GAAP reserves net of any DAC, DSI or VOBA asset), theexisting net reserves are adjusted by first reducing these assets by the amount of the deficiency or to zero through a charge tocurrent period earnings. If the deficiency is more than these asset balances for insurance contracts, we then increase the net reservesby the excess, again through a charge to current period earnings. If a premium deficiency is recognized, the assumptions as of thepremium deficiency test date are locked in and used in subsequent valuations.
• For certain reserves, such as our contracts with guaranteed minimum death benefits (“GMDB”), guaranteed minimum incomebenefits (“GMIB”) and no lapse guarantees, we utilize current best estimate assumptions in establishing reserves. The reserves aresubject to adjustments based on annual reviews of assumptions and quarterly adjustments for experience, including marketperformance, and the reserves may be adjusted through a benefit or charge to current period earnings.
• For certain product guarantees, primarily the optional living benefit features of the variable annuity products in our Individual Annuitiessegment, the benefits are accounted for as embedded derivatives, with fair values calculated as the present value of future expected benefitpayments to customers less the present value of assessed rider fees attributable to the embedded derivative feature. Under U.S. GAAP, thefair values of these benefit features are based on assumptions a market participant would use in valuing these embedded derivatives.Changes in the fair value of the embedded derivatives are recorded quarterly through a benefit or charge to current period earnings.
The assumptions used in establishing reserves are generally based on the Company’s experience, industry experience and/or otherfactors, as applicable. We typically update our actuarial assumptions, such as mortality, morbidity, retirement and policyholder behaviorassumptions, annually in the third quarter of each year, unless a material change is observed in an interim period that we feel is indicativeof a long term trend. Generally, we do not expect trends to change significantly in the short-term and, to the extent these trends maychange, we expect such changes to be gradual over the long-term. In a sustained low interest rate environment, there is an increasedlikelihood that the reserves determined based on best estimate assumptions may be greater than the net liabilities.
The following paragraphs provide additional details about the reserves established by each of our segments.
The future policy benefit reserves for our International Insurance segment, which as of December 31, 2013, represented 45% of ourtotal future policy benefit reserves, relate primarily to non-participating whole life and term life products and endowment contracts, and aregenerally determined as the present value of expected future benefits to, or on behalf of, policyholders plus the present value of futuremaintenance expenses less the present value of future net premiums. For these reserves, we utilize best estimate assumptions as of the datethe policy is issued or acquired with provisions for the risk of adverse deviation, as described above. The primary assumptions used indetermining expected future benefits and expenses include mortality, lapse, morbidity, investment yield and maintenance expenseassumptions. In addition, future policy benefit reserves for certain contracts also include amounts related to our deferred profit liability,determined as of the date of issue, net of accumulated amortization.
The reserves for future policy benefits of our Retirement segment, which as of December 31, 2013 represented 23% of our total futurepolicy benefit reserves, primarily relate to our non-participating life contingent group annuity and structured settlement products. Thesereserves are generally determined as the present value of expected future benefits and expenses. For these reserves, we utilize best estimateassumptions as of the date the policy is issued or acquired with provisions for the risk of adverse deviation, as described above. Forcontracts that have recorded a premium deficiency reserve, we use assumptions as of the most recent premium deficiency reserveestablishment. The primary assumptions used in establishing these reserves include mortality, retirement, maintenance expense, andinterest rate assumptions. In addition, future policy benefit reserves for certain contracts also include amounts related to our deferred profitliability, determined as of the date of issue, net of accumulated amortization.
The future policy benefit reserves for our Individual Life segment, which as of December 31, 2013, represented 3% of our total future policybenefit reserves, relate primarily to variable life, term life and universal life products. For term life contracts, the future policy benefit reserves aredetermined as the present value of expected future benefits to, or on behalf of, policyholders plus the present value of future maintenance expensesless the present value of future net premiums. For these reserves, we utilize best estimate assumptions as of the date the policy is issued or acquiredwith provisions for the risk of adverse deviation, as described above. The primary assumptions used in determining expected future benefits andexpenses include mortality, lapse, and maintenance expense assumptions. For variable and universal life products, which include universal lifecontracts that contain no lapse guarantees, reserves are established using current best estimate assumptions, as described above.
The reserves for future policy benefits of our Corporate & Other operations, which as of December 31, 2013 represented 2% of our totalfuture policy benefit reserves, primarily relate to our long-term care products. These reserves are generally determined as the present value ofexpected future benefits and expenses less future premiums. Most contracts have recorded a premium deficiency reserve, so we use assumptions asof the most recent premium deficiency reserve establishment. The primary assumptions used in establishing these reserves include interest rate,morbidity, mortality, lapse, premium rate increase, and maintenance expense assumptions. In addition, certain less significant reserves for ourlong-term care products, such as our disabled life reserve, are established using current best estimate actuarial assumptions, as described above.
The reserves for future policy benefits of our Individual Annuities segment, which as of December 31, 2013 represented 1% of our totalfuture policy benefit reserves, primarily relate to reserves for the GMDB and GMIB features of our variable annuities, and for the optionalliving benefit features that are accounted for as embedded derivatives. As discussed above, in establishing reserves for GMDBs and GMIBs,we utilize current best estimate assumptions. The primary assumptions used in establishing these reserves include the timing of annuitization,lapse, withdrawal and mortality assumptions, as well as interest rate and equity market return assumptions. Our lapse assumption includes abase lapse rate that takes into account the applicability of any surrender charges. Additionally, a dynamic lapse rate adjustment reduces thebase lapse rate when the benefit amount is greater than the account value, as in-the-money contracts are less likely to lapse.
24 Prudential Financial, Inc. 2013 Annual Report

The reserves for certain optional living benefit features, including guaranteed minimum accumulation benefits (“GMAB”), guaranteedminimum withdrawal benefits (“GMWB”) and guaranteed minimum income and withdrawal benefits (“GMIWB”), are accounted for asembedded derivatives, with fair values calculated as the present value of future expected benefit payments to customers less the present value ofassessed rider fees attributable to the embedded derivative feature. This methodology could result in either a liability or contra-liability balance,given changing capital market conditions and various actuarial assumptions. Since there is no observable active market for the transfer of theseobligations, the valuations are calculated using internally-developed models with option pricing techniques. The models are based on a riskneutral valuation framework and incorporate premiums for risks inherent in valuation techniques, inputs, and the general uncertainty around thetiming and amount of future cash flows. The significant inputs to the valuation models for these embedded derivatives include capital marketassumptions, such as interest rate levels and volatility assumptions, the Company’s market-perceived risk of its own non-performance (“NPR”),as well as actuarially determined assumptions, including contractholder behavior, such as lapse rates, benefit utilization rates, withdrawal rates,and mortality rates. Capital market inputs and actual contractholders’ account values are updated each quarter based on capital market conditionsas of the end of the quarter, including interest rates, equity markets and volatility. In the risk neutral valuation, the initial swap curve drives thetotal returns used to grow the contractholders’ account values. The Company’s discount rate assumption is based on the LIBOR swap curveadjusted for an additional spread relative to LIBOR to reflect NPR. Actuarial assumptions, including contractholder behavior and mortality, arereviewed at least annually, and updated based upon emerging experience, future expectations and other data, including any observable marketdata, such as available industry studies or market transactions such as acquisitions and reinsurance transactions. For additional informationregarding the valuation of these optional living benefit features, see Note 20 to the Consolidated Financial Statements.
The remaining reserves for future policy benefits for the Financial Services Businesses, which represented 1% of our total future policybenefit reserves as of December 31, 2013, primarily represents reserves for the group life and disability benefits in our Group Insurance segment.
The future policy benefit reserves for the traditional participating life insurance products of our Closed Block Business, which as ofDecember 31, 2013, represented 25% of our total future policy benefit reserves are determined using the net level premium method. Underthis method, the future policy benefit reserves are accrued as a level proportion of the premium paid by the policyholder. In applying thismethod, we use mortality assumptions to determine our expected future benefits and expected future premiums, and apply an interest rateto determine the present value of both the expected future benefit payments and the expected future premiums. The mortality assumptionsare based on data from the standard industry mortality tables that were used to determine the cash surrender value of the policies, and theinterest rates used are the contractually guaranteed interest rates used to calculate the cash surrender value of the policies.
Sensitivity for Future Policy Benefit Reserves, other than Unpaid Claims and Claim Adjustment Expenses
We expect the future benefit reserves in our Individual Annuities segment that are based on current best estimate assumptions, and thosethat represent embedded derivatives recorded at fair value to be the ones most likely to drive variability in earnings from period to period.
For the GMDB and GMIB features of our variable annuities in our Individual Annuities segment, the reserves for these contracts aresignificantly influenced by the future rate of return assumptions. The following table provides a demonstration of the sensitivity of thereserves for GMDBs and GMIBs related to variable annuity contracts relative to our future rate of return assumptions by quantifying theadjustments to these reserves that would be required assuming both a 100 basis point increase and decrease in our future rate of return. Thesensitivity includes an increase and decrease of 100 basis points to both the near-term future rate of return assumptions used over the nextfour years, and the long-term expected rate of return used thereafter. The information below is for illustrative purposes only and considersonly the direct effect of changes in our future rate of return on operating results due to the change in the reserve balance and not changes inany other assumptions such as persistency or mortality included in our evaluation of the reserves, or any changes on DAC or otherbalances, discussed above in “—Deferred Policy Acquisition and Other Costs.”
December 31, 2013
Increase/(Decrease) inGMDB/GMIB Reserves
(in millions)Decrease in future rate of return by 100 basis points . . . . . . . . . . . . . . . . . . . . . . . . . . . . . . . . . . . . . . . . . . . . . . . . . . . . . . . . . . . . . $ 130Increase in future rate of return by 100 basis points . . . . . . . . . . . . . . . . . . . . . . . . . . . . . . . . . . . . . . . . . . . . . . . . . . . . . . . . . . . . . . $(113)
In addition to the impact of market performance relative to our future rate of return assumptions, other factors may also drivevariability in the change in reserves, particularly during the third quarter when assumption updates are performed. As noted above,however, the impact on our results of operations of changes in these assumptions can be offsetting and we are unable to predict theirmovement or offsetting impact over time. In the third quarter of 2013, updates to lapse rate and utilization rate assumptions drove the mostsignificant changes to these reserves. For a discussion of adjustments to the reserves for GMDBs and GMIBs for the years endedDecember 31, 2013, 2012 and 2011, see “—Results of Operations for Financial Services Businesses by Segment—U.S. RetirementSolutions and Investment Management Division—Individual Annuities.”
For the optional living benefit features of certain variable annuities in our Individual Annuities segment that are accounted for as embeddedderivatives, the changes in reserves are significantly impacted by changes in both the capital markets assumptions and actuarial assumptions.Capital market inputs and actual policyholders’ account values are updated each quarter based on capital market conditions as of the end of thequarter, while actuarial assumptions are reviewed at least annually, and updated based upon emerging experience, future expectations and otherdata. For additional information about the impacts of capital markets assumptions, including interest rates, NPR credit spreads and equity returns,refer to “Quantitative and Qualitative Disclosures About Market Risk” below. For actuarial assumptions, historical experience on which to basepredictions about future sources of volatility is limited due to the fact this block of business is relatively new. In the third quarter of 2013, updatesto lapse rate assumptions drove the most significant changes to these reserves. Other factors may also drive variability in the change in reserves,particularly during the third quarter when assumption updates are performed. As noted above, however, the impact on our results of operations ofchanges in these assumptions can be offsetting and we are unable to predict their movement or offsetting impact over time. For a discussion of thedrivers of the changes in our optional living benefit features for the years ended December 31, 2013, 2012 and 2011, see “—Results of Operationsfor Financial Services Businesses by Segment—U.S. Retirement Solutions and Investment Management Division—Individual Annuities.”
Prudential Financial, Inc. 2013 Annual Report 25

Unpaid claims and claim adjustment expenses
Our liability for unpaid claims and claim adjustment expenses of $3.0 billion as of December 31, 2013 is reported as a component of“Future policy benefits” and relates primarily to the group long-term disability products of our Group Insurance segment. This liability representsour estimate of future disability claim payments and expenses as well as estimates of claims that we believe have been incurred, but have not yetbeen reported as of the balance sheet date. For short duration contracts, we do not establish loss liabilities until a loss has occurred. Our liability isdetermined as the present value of expected future claim payments and expenses. The primary assumptions used in determining expected futureclaim payments are mortality and claim termination factors, an assumed interest rate and Social Security offsets. Long-term disability claims andclaim termination experience may be affected by the economic environment and internal factors such as our claims management process.
Unearned revenue reserves
Our unearned revenue reserve, or URR, reported as a component of “Policyholders’ account balances,” is $1.8 billion as ofDecember 31, 2013. This reserve primarily relates to variable and universal life products within our Individual Life segment and representspolicy charges for services to be provided in future periods. The charges are deferred as unearned revenue and are generally amortized overthe expected life of the contract in proportion to the product’s estimated gross profits, similar to DAC as discussed above.
For the variable and universal life policies of our Individual Life segment, a significant portion of our gross profits is derived frommortality margins. As a result, our estimates of future gross profits are significantly influenced by our mortality assumptions. Our mortalityassumptions are used to estimate future death claims over the life of these policies and are developed based on Company experience, industryexperience and/or other factors. Unless a material change in mortality experience that we feel is indicative of a long term trend is observed inan interim period, we generally update our mortality assumptions annually in the third quarter. Updates to our mortality assumptions in futureperiods could have a significant adverse or favorable effect on the results of our operations in the Individual Life segment.
The URR balance associated with the variable and universal life policies of our Individual Life segment as of December 31, 2013 was$1.6 billion. The following table provides a demonstration of the sensitivity of that URR balance relative to our future mortalityassumptions by quantifying the adjustments that would be required, assuming both an increase and decrease in our future mortality rate by1%. The information below is for illustrative purposes only and considers only the direct effect of changes in our mortality assumptions onthe URR balance and not changes in any other assumptions such as persistency, future rate of return, or expenses included in our evaluationof URR. It does not reflect changes in assets, such as DAC, which would partially offset the adjustments to the URR balance reflectedbelow. The impact of DAC is discussed in more detail above in “—Deferred Policy Acquisition and Other Costs.”
December 31, 2013
Increase/(Decrease) in URR
(in millions)Decrease in future mortality by 1% . . . . . . . . . . . . . . . . . . . . . . . . . . . . . . . . . . . . . . . . . . . . . . . . . . . . . . . . . . . . . . . . . . . . . . . $ 30Increase in future mortality by 1% . . . . . . . . . . . . . . . . . . . . . . . . . . . . . . . . . . . . . . . . . . . . . . . . . . . . . . . . . . . . . . . . . . . . . . . . $(30)
In addition to the impact of mortality experience relative to our assumptions, other factors may also drive variability in the change inreserves, particularly during the third quarter when assumption updates are performed. As noted above, however, the impact on our results ofoperations of changes in these assumptions can be offsetting and we are unable to predict their movement or offsetting impact over time. Inthe third quarter of 2013, updates to mortality assumptions drove the most significant changes to our URR reserve. For a discussion of thedrivers of URR adjustments related to our Individual Life segment for the years ended December 31, 2013, 2012 and 2011, see “—Results ofOperations for Financial Services Businesses by Segment—U.S. Individual Life and Group Insurance Division—Individual Life.”
Pension and Other Postretirement Benefits
We sponsor pension and other postretirement benefit plans covering employees who meet specific eligibility requirements. Our netperiodic costs for these plans consider an assumed discount (interest) rate, an expected rate of return on plan assets and expected increasesin compensation levels and trends in health care costs. Of these assumptions, our expected rate of return assumptions and our discount rateassumptions have historically had the most significant effect on our net period costs associated with these plans.
We determine our expected rate of return on plan assets based upon a building block approach that considers inflation, real return, termpremium, credit spreads, equity risk premium and capital appreciation as well as expenses, expected asset manager performance and the effect ofrebalancing for the equity, debt and real estate asset mix applied on a weighted average basis to our pension asset portfolio. See Note 18 to ourConsolidated Financial Statements for our actual asset allocations by asset category and the asset allocation ranges prescribed by our investmentpolicy guidelines for both our pension and other postretirement benefit plans. Our assumed long-term rate of return for 2013 was 6.25% for ourdomestic pension plans and 7.00% for our other postretirement benefit plans. Given the amount of plan assets as of December 31, 2012, thebeginning of the measurement year, if we had assumed an expected rate of return for both our domestic pension and other domesticpostretirement benefit plans that was 100 basis points higher or 100 basis points lower than the rates we assumed, the change in our net periodiccosts would have been as shown in the table below. The information provided in the table below considers only changes in our assumed long-term rate of return given the level and mix of invested assets at the beginning of the measurement year, without consideration of possible changesin any of the other assumptions described above that could ultimately accompany any changes in our assumed long-term rate of return.
For the year ended December 31, 2013
Increase/(Decrease) in NetPeriodic Pension Cost
Increase/(Decrease) in NetPeriodic Other Postretirement
Cost
(in millions)Increase in expected rate of return by 100 basis points . . . . . . . . . . . . . . . . . . . . . . . . . . . . . $(120) $(12)Decrease in expected rate of return by 100 basis points . . . . . . . . . . . . . . . . . . . . . . . . . . . . $ 120 $ 12
26 Prudential Financial, Inc. 2013 Annual Report

Foreign pension plans represent 5% of plan assets at the beginning of 2013. An increase in expected rate of return by 100 basis pointswould result in a decrease in net periodic pension costs of $6 million; conversely, a decrease in expected rate of return by 100 basis pointswould result in an increase in net periodic pension costs of $6 million.
We determine our discount rate, used to value the pension and postretirement benefit obligations, based upon rates commensurate withcurrent yields on high quality corporate bonds. See Note 18 to our Consolidated Financial Statements for information regarding theDecember 31, 2012 methodology we employed to determine our discount rate for 2013. Our assumed discount rate for 2013 was 4.05% forour domestic pension plans and 3.85% for our other domestic postretirement benefit plans. Given the amount of pension and postretirementobligations as of December 31, 2012, the beginning of the measurement year, if we had assumed a discount rate for both our domesticpension and other postretirement benefit plans that was 100 basis points higher or 100 basis points lower than the rates we assumed, thechange in our net periodic costs would have been as shown in the table below. The information provided in the table below considers onlychanges in our assumed discount rate without consideration of possible changes in any of the other assumptions described above that couldultimately accompany any changes in our assumed discount rate.
For the year ended December 31, 2013
Increase/(Decrease) in NetPeriodic Pension Cost
Increase/(Decrease) in NetPeriodic Other Postretirement
Cost
(in millions)Increase in discount rate by 100 basis points . . . . . . . . . . . . . . . . . . . . . . . . . . . . . . . . . . . . . $ (30) $(3)Decrease in discount rate by 100 basis points . . . . . . . . . . . . . . . . . . . . . . . . . . . . . . . . . . . . $136 $ 0
Foreign pension plans represent 16% of plan obligations at the beginning of 2013. An increase in discount rate by 100 basis pointswould result in a decrease in net periodic pension costs of $6 million; conversely, a decrease in discount rate by 100 basis points wouldresult in an increase in net periodic pension costs of $7 million.
Given the application of the authoritative guidance for accounting for pensions, and the deferral and amortization of actuarial gainsand losses arising from changes in our assumed discount rate, the change in net periodic pension cost arising from an increase in theassumed discount rate by 100 basis points would not be expected to equal the change in net periodic pension cost arising from a decrease inthe assumed discount rate by 100 basis points.
For a discussion of our expected rate of return on plan assets and discount rate for our qualified pension plan in 2013, see “—Resultsof Operations for Financial Services Businesses by Segment—Corporate and Other.”
For purposes of calculating pension income from our own qualified pension plan for the year ended December 31, 2014, we willincrease the discount rate to 4.95% from 4.05% in 2013. The expected rate of return on plan assets will remain unchanged at 6.25%, andthe assumed rate of increase in compensation will remain unchanged at 4.5%.
In addition to the effect of changes in our assumptions, the net periodic cost or benefit from our pension and other postretirementbenefit plans may change due to factors such as actual experience being different from our assumptions, special benefits to terminatedemployees, or changes in benefits provided under the plans.
At December 31, 2013, the sensitivity of our domestic and international pension and postretirement obligations to a 100 basis pointchange in discount rate was as follows:
December 31, 2013
Increase/(Decrease) inPension Benefits Obligation
Increase/(Decrease) inAccumulated Postretirement
Benefits Obligation
(in millions)Increase in discount rate by 100 basis points . . . . . . . . . . . . . . . . . . . . . . . . . . . . . . . . . . . . . $(1,173) $(180)Decrease in discount rate by 100 basis points . . . . . . . . . . . . . . . . . . . . . . . . . . . . . . . . . . . . $ 1,364 $ 198
Taxes on IncomeOur effective tax rate is based on income, non-taxable and non-deductible items, statutory tax rates and tax planning opportunities
available in the various jurisdictions in which we operate. Inherent in determining our annual tax rate are judgments regarding businessplans, planning opportunities and expectations about future outcomes. The Company provides for U.S. income taxes on unremitted foreignearnings of its operations in Japan and certain operations in India, Germany and Taiwan. In addition, beginning in 2012, the Companyprovides for U.S. income taxes on a portion of the current year foreign earnings for its insurance operations in Korea.
An increase or decrease in our effective tax rate by one percent of income (loss) from continuing operations before income taxes andequity in earnings of operating joint ventures, would have resulted in an increase or decrease in our consolidated income from continuingoperations before equity in earnings of operating joint ventures in 2013 of $17 million.
The Company’s liability for income taxes includes the liability for unrecognized tax benefits and interest that relate to tax years stillsubject to review by the Internal Revenue Service (“IRS”) or other taxing authorities. See Note 19 to the Consolidated Financial Statementsfor a discussion of the impact in 2011, 2012 and 2013 of changes to our total unrecognized tax benefits. We do not anticipate anysignificant changes within the next 12 months to our total unrecognized tax benefits related to tax years for which the statute of limitationshas not expired.
The Company’s affiliates in Japan and Korea file separate tax returns and are subject to audits by the local taxing authority. Thegeneral statute of limitations for Japan and Korea are five years from when the return is filed.
Prudential Financial, Inc. 2013 Annual Report 27

Reserves for ContingenciesA contingency is an existing condition that involves a degree of uncertainty that will ultimately be resolved upon the occurrence of
future events. Under U.S. GAAP, reserves for contingencies are required to be established when the future event is probable and its impactcan be reasonably estimated, such as in connection with an unresolved legal matter. The initial reserve reflects management’s best estimateof the probable cost of ultimate resolution of the matter and is revised accordingly as facts and circumstances change and, ultimately, whenthe matter is brought to closure.
Adoption of New Accounting PronouncementsThere were no new accounting pronouncements adopted during 2013 requiring the application of critical accounting estimates. See
Note 2 to the Consolidated Financial Statements for a complete discussion of newly issued accounting pronouncements, including furtherdiscussion of the authoritative guidance adopted in 2012 addressing which costs relating to the acquisition of new or renewal insurancecontracts qualify for deferral, as well as our retrospective adoption in 2012 of a change in method of applying an accounting principle forthe Company’s pension plans.
Results of Operations for Financial Services Businesses by Segment
U.S. Retirement Solutions and Investment Management Division
Individual AnnuitiesThe Individual Annuities segment offers variable and fixed annuities that provide our customers with tax–deferred asset accumulation
together with a base death benefit and a suite of optional guaranteed death and living benefits and annuitization options. As the investmentreturn on the contractholder funds is generally attributed directly to the contractholder, we derive our revenue mainly from fee incomegenerated on variable annuity account values, investment income earned on fixed annuity account values, and certain other managementfees. Our expenses primarily consist of interest credited and other benefits to contractholders, amortization of DAC and other costs, non-deferred expenses related to the selling and servicing of the various products we offer, costs of hedging certain risks associated with theseproducts and the change in reserves for benefit guarantees and other general business expenses. These drivers of our business results aregenerally included in adjusted operating income, with exceptions related to certain guarantees, as discussed below.
The U.S. GAAP accounting and our adjusted operating income treatment for our guarantees differs depending upon the specificfeature. The reserves for our guaranteed minimum death benefit (“GMDB”) and guaranteed minimum income benefit (“GMIB”) featuresare calculated based on our best estimate of actuarial and capital markets return assumptions. The risks associated with these benefitfeatures are retained and results are included in adjusted operating income. In contrast, certain of our optional guaranteed living benefitfeatures are accounted for as embedded derivatives and reported at fair value. Under U.S. GAAP, the fair values of these benefit featuresare based on assumptions a market participant would use in valuing these embedded derivatives. We hedge or limit our exposure to certainrisks associated with these features through our living benefits hedging program and product design elements. Adjusted operating income,as discussed below in “—Adjusted Operating Income” and “—Revenues, Benefits and Expenses” excludes amounts related to changes inthe market value of the embedded derivatives and related hedge positions, and the related impact to amortization of DAC and other costs.The items excluded from adjusted operating income are discussed below in “—Variable Annuity Living Benefits Hedging ProgramResults.”
Account Values
Account values are a significant driver of our operating results. Since most fees are determined by the level of separate account assets,fee income varies according to the level of account values. Additionally, our fee income generally drives other items such as our pattern ofamortization of DAC and other costs. Account values are driven by net flows from new business sales, the impact of market changes whichcan be either positive or negative, and outflows related to surrenders, withdrawals, benefit payments and policy charges. The annuityindustry competitive landscape, which has been dynamic over the last few years, may impact our net flows and new business sales. Thefollowing table sets forth account value information for the periods indicated.
Year ended December 31,
2013 2012 2011
(in millions)Total Individual Annuities(1):
Beginning total account value . . . . . . . . . . . . . . . . . . . . . . . . . . . . . . . . . . . . . . . . . . . . . . . . . . . . . . . . . . . . . . . . . . . . $135,342 $113,535 $106,185Sales . . . . . . . . . . . . . . . . . . . . . . . . . . . . . . . . . . . . . . . . . . . . . . . . . . . . . . . . . . . . . . . . . . . . . . . . . . . . . . . . . . . . . . . 11,513 20,032 20,293Surrenders and withdrawals . . . . . . . . . . . . . . . . . . . . . . . . . . . . . . . . . . . . . . . . . . . . . . . . . . . . . . . . . . . . . . . . . . . . . (7,727) (6,806) (7,232)
Net sales . . . . . . . . . . . . . . . . . . . . . . . . . . . . . . . . . . . . . . . . . . . . . . . . . . . . . . . . . . . . . . . . . . . . . . . . . . . . . . . . 3,786 13,226 13,061Benefit payments . . . . . . . . . . . . . . . . . . . . . . . . . . . . . . . . . . . . . . . . . . . . . . . . . . . . . . . . . . . . . . . . . . . . . . . . . . . . . (1,617) (1,450) (1,368)
Net flows . . . . . . . . . . . . . . . . . . . . . . . . . . . . . . . . . . . . . . . . . . . . . . . . . . . . . . . . . . . . . . . . . . . . . . . . . . . . . . . . 2,169 11,776 11,693Change in market value, interest credited and other activity . . . . . . . . . . . . . . . . . . . . . . . . . . . . . . . . . . . . . . . . . . . . 19,826 12,710 (2,104)Policy charges . . . . . . . . . . . . . . . . . . . . . . . . . . . . . . . . . . . . . . . . . . . . . . . . . . . . . . . . . . . . . . . . . . . . . . . . . . . . . . . . (3,197) (2,679) (2,239)
Ending total account value . . . . . . . . . . . . . . . . . . . . . . . . . . . . . . . . . . . . . . . . . . . . . . . . . . . . . . . . . . . . . . . . . . $154,140 $135,342 $113,535
(1) Includes variable and fixed annuities sold as retail investment products. Investments sold through defined contribution plan products are included withsuch products within the Retirement segment. Variable annuity account values were $150.4 billion, $131.6 billion and $109.7 billion as ofDecember 31, 2013, 2012 and 2011, respectively. Fixed annuity account values were $3.7 billion, $3.7 billion and $3.8 billion as of December 31, 2013,2012 and 2011, respectively.
28 Prudential Financial, Inc. 2013 Annual Report

2013 to 2012 Annual Comparison. As shown above, our account values are significantly impacted by net sales and the impact of marketperformance on customer accounts. The increase in account values during 2013 was largely driven by favorable changes in the market value ofcontractholder funds, primarily driven by equity market appreciation. Positive net sales also contributed to account value growth, but to a lesserextent, as results for 2013 compared to 2012 reflected a decline in sales coupled with an increase in surrenders and withdrawals. The decline insales primarily reflects the impacts of actions we have taken to adapt our products to the current environment in order to maintain appropriatereturn prospects and improve our risk profile. For our variable annuity products with optional living benefit features that provide for guaranteedlifetime withdrawal payments based on a “highest daily” contract value, we have implemented modifications for new sales to scale back benefits,change prices and reduce commissions, as well as closing of a share class. We also suspended or limited additional contractholder deposits forvariable annuities with certain optional living benefit riders that are no longer being offered. These declines have been partially offset by sales ofour Prudential Defined Income Variable Annuity, or PDI, which represented 7% of total sales for 2013. PDI was launched in the first quarter of2013 to complement the products we offer with the highest daily benefit. In addition to these impacts, policy charges increased for 2013compared to 2012, primarily reflecting higher average account values.
2012 to 2011 Annual Comparison. The increase in account values during 2012 was driven by both positive net sales and favorable changesin the market value of contractholder funds. Although net sales were relatively flat for 2012 compared to 2011, as declines in sales were offset bydeclines in surrenders and withdrawals, positive net sales still contributed significantly to overall account value growth. We began our actions toadapt our products to the current environment, as discussed above, during 2012; however, many of our competitors also implemented similarchanges and took actions to exit, or limit their presence in, the variable annuity marketplace. As a result, our net sales were not significantlyimpacted during 2012. The favorable changes in the market value of contractholder funds were primarily driven by equity market appreciation. Inaddition to these impacts, policy charges increased for 2012 compared to 2011, primarily reflecting higher average account values.
Operating Results
The following table sets forth the Individual Annuities segment’s operating results for the periods indicated.
Year ended December 31,
2013 2012 2011
(in millions)Operating results:
Revenues . . . . . . . . . . . . . . . . . . . . . . . . . . . . . . . . . . . . . . . . . . . . . . . . . . . . . . . . . . . . . . . . . . . . . . . . . . . . . . . . . . . . . . . . $ 4,465 $ 3,983 $ 3,638Benefits and expenses . . . . . . . . . . . . . . . . . . . . . . . . . . . . . . . . . . . . . . . . . . . . . . . . . . . . . . . . . . . . . . . . . . . . . . . . . . . . . . 2,380 2,944 2,976
Adjusted operating income . . . . . . . . . . . . . . . . . . . . . . . . . . . . . . . . . . . . . . . . . . . . . . . . . . . . . . . . . . . . . . . . . . . . . . . . . . 2,085 1,039 662Realized investment gains (losses), net, and related adjustments . . . . . . . . . . . . . . . . . . . . . . . . . . . . . . . . . . . . . . . . . (5,918) (1,882) 3,136Related charges . . . . . . . . . . . . . . . . . . . . . . . . . . . . . . . . . . . . . . . . . . . . . . . . . . . . . . . . . . . . . . . . . . . . . . . . . . . . . . . 1,716 942 (1,686)
Income (loss) from continuing operations before income taxes and equity in earnings of operating joint ventures . . . . . . $(2,117) $ 99 $ 2,112
Adjusted Operating Income
2013 to 2012 Annual Comparison. Adjusted operating income increased $1,046 million. Excluding the impacts of changes in theestimated profitability of the business, discussed below, adjusted operating income increased $431 million. The increase was driven byhigher asset-based fee income due to growth in average variable annuity account values, net of a related increase in asset-basedcommissions and reserve provisions. Also contributing to the increase were reduced costs to support business initiatives and the absence ofa charge related to an impairment of capitalized software costs in the fourth quarter of 2012.
The impacts of changes in the estimated profitability of the business include adjustments to the amortization of DAC and other costsand to the reserves for the GMDB and GMIB features of our variable annuity products. These adjustments resulted in net benefits of$696 million and $81 million in 2013 and 2012, respectively. The $696 million net benefit in 2013 included a $301 million net benefitresulting from our annual reviews and updates of assumptions, driven by reductions to our lapse and GMIB utilization rate assumptions toreflect our review of emerging experience, future expectations and other data, and other refinements. The remaining net benefit primarilyreflected the impact of positive market performance on customer accounts relative to our assumptions. The $81 million net benefit in 2012reflected the impact of positive market performance on customer accounts relative to our assumptions, which more than offset a $106million net charge resulting from the annual reviews and updates of assumptions performed in that period, driven by reductions to our long-term interest and equity rate of return assumptions, as well as updates to actuarial assumptions and other refinements.
2012 to 2011 Annual Comparison. Adjusted operating income increased $377 million. Excluding the impacts of changes in the estimatedprofitability of the business, discussed below, adjusted operating income increased $74 million. This increase was driven by higher asset-based feesdue to growth in average variable annuity account values, net of an increased level of distribution and amortization costs. The increase was partiallyoffset by higher general and administrative expenses, net of capitalization, reflecting increased costs to support business initiatives, including a $9million charge related to an impairment of capitalized software costs in the fourth quarter of 2012, based on a review of recoverability.
The impacts of changes in the estimated profitability of the business include adjustments to the reserves for the GMDB and GMIBfeatures of our variable annuity products and to the amortization of DAC and other costs. These adjustments reflect the impacts of marketperformance, current period experience and the annual reviews and updates of assumptions performed in the third quarter. These changesresulted in an $81 million net benefit in 2012, as discussed above, and a $222 million net charge in 2011 primarily driven by the impact ofnegative market performance on customer accounts relative to our assumptions.
Revenues, Benefits and Expenses
2013 to 2012 Annual Comparison. Revenues, as shown in the table above under “—Operating Results,” increased $482 million,primarily driven by a $553 million increase in policy charges and fee income, and asset management fees and other income, due to growth
Prudential Financial, Inc. 2013 Annual Report 29

in average variable annuity account values. Partially offsetting this increase was a $77 million decline in net investment income, driven bylower average account values in the general account due to surrenders of legacy general account products and net transfers from the generalaccount to the separate accounts, driven by an automatic rebalancing element, also referred to as an asset transfer feature, in some of ourproducts’ optional living benefit features.
Benefits and expenses, as shown in the table above under “—Operating Results,” decreased $564 million. Absent the $615 million netdecrease related to the impacts of certain changes in our estimated profitability of the business, discussed above, benefits and expensesincreased $51 million. General and administrative expenses, net of capitalization, increased $84 million, driven by higher asset-basedcommissions and asset management costs due to account value growth, partially offset by reduced costs to support business initiatives.Insurance and annuity benefits increased $28 million, driven by higher revenues used in determining reserve provisions, related to theincrease in fee income discussed above. These increases were partially offset by a $52 million decline in interest credited to policyholders’account balances driven by lower average account values in the general account, as discussed above.
2012 to 2011 Annual Comparison. Revenues increased $345 million, primarily driven by a $384 million increase in policy chargesand fee income, and asset management fees and other income, due to growth in average variable annuity account values.
Benefits and expenses decreased $32 million. Absent the $303 million net decrease related to the impacts of certain changes in ourestimated profitability of the business, discussed above, benefits and expenses increased $271 million. General and administrativeexpenses, net of capitalization, increased $211 million, driven by higher asset-based trail commissions, reflecting account value growth, aswell as higher costs to support business initiatives. The amortization of DAC increased $92 million driven by higher gross profits primarilyrelated to the increase in fee income discussed above, as well as higher amortization rates.
Variable Annuity Risks and Risk Mitigants
The primary risk exposures of our variable annuity contracts relate to actual deviations from, or changes to, the assumptions used inthe original pricing of these products, including capital markets assumptions, such as equity market returns, interest rates and marketvolatility, and actuarial assumptions, such as contractholder longevity/mortality, the timing and amount of annuitization and withdrawals,and contract lapses. For our actuarial assumptions, we have retained the risk that actual experience will differ from the assumptions used inthe original pricing of these products. For our capital markets assumptions, we hedge or limit our exposure to the risk created by capitalmarkets fluctuations through a combination of product design elements, such as an automatic rebalancing element, and inclusion of certainoptional living benefits in our living benefits hedging program.
Our automatic rebalancing element occurs at the contract level, and transfers assets between certain variable investment sub-accountsselected by the annuity contractholder and, depending on the benefit feature, a fixed-rate account in the general account or a bond fund sub-account within the separate accounts. The automatic rebalancing element associated with currently-sold products uses a designated bond fundsub-account within the separate accounts. The transfers are based on the static mathematical formula used with the particular benefit whichconsiders a number of factors, including, but not limited to, the impact of investment performance on the contractholder’s total account value.The objective of the automatic rebalancing element is to help mitigate our exposure to equity market risk and market volatility. Other productdesign elements we utilize include, among others, asset allocation restrictions, minimum issuance age requirements and certain limitations onthe amount of subsequent contractholder deposits. In addition, certain fees are based on the greater of a benefit guarantee amount or theaccount value, which helps preserve certain revenue streams when market fluctuations cause account values to decline.
We use our living benefits hedging program to manage the risk associated with certain of our optional living benefit guarantees. Thisprogram represents a balance among three objectives that seek to: 1) provide severe scenario protection, 2) minimize net income volatilityassociated with an internally-defined hedge target, and 3) maintain capital efficiency. Through our hedge program, we enter into derivativepositions that seek to replicate the net change in our hedge target, discussed further below. In addition to mitigating capital markets risk andincome statement volatility, the hedging program is also focused on a long-term goal of accumulating assets that could be used to payclaims under these benefits irrespective of market path. For additional information regarding this program see “—Variable AnnuitiesLiving Benefits Hedging Program Results” below.
For our optional living benefits features, claims will primarily represent the funding of contractholder lifetime withdrawals after thecumulative withdrawals have first exhausted the contractholder account value. Due to the age of the block, limited claim payments have occurredto date, and they are not expected to increase significantly within the next five years, based upon current assumptions. The timing and amount ofactual future claims depend on actual returns on contractholder account value and actual contractholder behavior relative to our assumptions. Themajority of our current optional living benefits features provide for guaranteed lifetime contractholder withdrawal payments based on a “highestdaily” contract value. As noted under “—Account Values” above, late in the first quarter of 2013, we launched our PDI variable annuity, tocomplement the variable annuity products we offer with the highest daily benefit. PDI also provides for guaranteed lifetime contractholderwithdrawal payments, but restricts contractholder asset allocation to a single bond fund sub-account within the separate account.
The majority of our variable annuity contracts with optional living benefits features, and all new contracts sold with our highest dailyliving benefits feature, include two risk mitigants in the form of an automatic rebalancing element and inclusion in our living benefitshedging program. The guaranteed benefits features of certain legacy products that were sold prior to our implementation of the automaticrebalancing element product feature are included in our living benefits hedge program. Certain legacy guaranteed minimum accumulationbenefit (GMAB) products include the automatic rebalancing element, but are not included in the hedging program. Our contracts with theGMIB feature and our new PDI product have neither risk mitigant.
For our GMDBs, we provide a benefit payable in the event of death. Our base GMDB is generally equal to a return of cumulativedeposits adjusted for any partial withdrawals. Certain products include an optional enhanced GMDB based on the greater of a minimumreturn on the contract value or an enhanced value. We have retained the risk that the total amount of death benefit payable may be greaterthan the contractholder account value. However, a substantial portion of the account values associated with GMDBs are subject to anautomatic rebalancing element because the contractholder also selected a living benefit feature which includes an automatic rebalancing
30 Prudential Financial, Inc. 2013 Annual Report

element. All of the variable annuity account values with living benefit features also contain GMDBs. The living and death benefit featuresfor these contracts cover the same insured life and, consequently, we have insured both the longevity and mortality risk on these lives.
The following table sets forth the risk profile of our optional living benefits and GMDB features as of the periods indicated.
December 31, 2013 December 31, 2012 December 31, 2011
Account Value% ofTotal Account Value
% ofTotal Account Value
% ofTotal
(in millions)Optional living benefit/GMDB features(1):
Both risk mitigants(2) . . . . . . . . . . . . . . . . . . . . . . . . . . . . . . . . . . . . . $105,630 71% $ 89,167 68% $ 66,853 61%Hedging program only . . . . . . . . . . . . . . . . . . . . . . . . . . . . . . . . . . . . . 12,229 8% 11,744 9% 11,615 11%Automatic rebalancing only . . . . . . . . . . . . . . . . . . . . . . . . . . . . . . . . . 2,280 2% 2,787 2% 3,488 3%Neither risk mitigant . . . . . . . . . . . . . . . . . . . . . . . . . . . . . . . . . . . . . . 4,459 3% 3,556 3% 3,685 3%
Total optional living benefit/GMDB features . . . . . . . . . . . . . . . $124,598 $107,254 $ 85,641
GMDB features only(3):Neither risk mitigant . . . . . . . . . . . . . . . . . . . . . . . . . . . . . . . . . . . . . . 25,869 16% 24,354 18% 24,102 22%
Total variable annuity account value . . . . . . . . . . . . . . . . . . . . . . $150,467 $131,608 $109,743
(1) All contracts with optional living benefit guarantees also contain GMDB features, covering the same insured life.(2) Contracts with both risk mitigants have optional living benefits that are included in our living benefits hedging program, and have an automatic
rebalancing element.(3) Reflects contracts that only include a GMDB feature and do not have an automatic rebalancing element.
The increase in the percentage of total account values that include both risk mitigants as of December 31, 2013 compared to the prioryears primarily reflects sales of our latest product offerings with our highest daily optional living benefits feature, which include anautomatic rebalancing element and are also included in our living benefits hedging program.
Variable Annuity Living Benefits Hedging Program Results
Under U.S. GAAP, the liability for certain optional living benefit features is accounted for as an embedded derivative and recorded atfair value, based on assumptions a market participant would use in valuing these features. The fair value is calculated as the present valueof future expected benefit payments to contractholders less the present value of assessed rider fees attributable to the applicable livingbenefit features using option pricing techniques. See Note 20 to the Consolidated Financial Statements for additional information regardingthe methodology and assumptions used in calculating the fair value under U.S. GAAP.
As noted within “—Variable Annuity Risks and Risk Mitigants” above, we maintain a hedge program to manage the risk associatedwith certain of these guarantees. Our hedge program utilizes an internally-defined hedge target. We review our hedge target and hedgeprogram on an ongoing basis, and may periodically adjust them based on our evaluation of the risks associated with the guarantees andother factors. Based on our review in the third quarter of 2013, we adjusted our hedge target so that, as currently defined, it includes thefollowing modifications to the assumptions used in the U.S. GAAP valuation:
• The impact of non-performance risk (“NPR”) is excluded to maximize protection against the entire projected claim irrespective ofthe possibility of our own default.
• The assumptions used in the projection of customer account values and living benefit costs are adjusted to reflect our assumedreturn and volatility expectations for the underlying investments.
• Actuarial assumptions are adjusted to remove risk margins and reflect our best estimates.
Due to these modifications, we expect differences each period between the change in the value of the embedded derivative as definedby U.S. GAAP and the change in the value of the hedge positions used to replicate the hedge target, thus potentially increasing volatility inU.S. GAAP earnings. Application of the valuation methodologies described above could result in either a liability or contra-liabilitybalance for the fair value of the embedded derivative under U.S. GAAP and/or the value of the hedge target, given changing capital marketconditions and various actuarial assumptions. The following table provides a reconciliation between the fair value of the embeddedderivative as defined by U.S. GAAP and the value of our hedge target as of the periods indicated.
As of December 31,
2013 2012
(in billions)Embedded derivative liability as defined by U.S. GAAP . . . . . . . . . . . . . . . . . . . . . . . . . . . . . . . . . . . . . . . . . . . . . . . . . . . . . . . . . . . . . . $ 0.5 $ 3.3Less: NPR Adjustment . . . . . . . . . . . . . . . . . . . . . . . . . . . . . . . . . . . . . . . . . . . . . . . . . . . . . . . . . . . . . . . . . . . . . . . . . . . . . . . . . . . . . . . . (2.2) (4.8)
Embedded derivative liability as defined by U.S. GAAP, excluding NPR . . . . . . . . . . . . . . . . . . . . . . . . . . . . . . . . . . . . . . . . . . . . 2.7 8.1Less: Amount of embedded derivative liability, excluding NPR, excluded from hedge target liability . . . . . . . . . . . . . . . . . . . . . . . . . . 3.9 2.3
Hedge target liability/(contra-liability) . . . . . . . . . . . . . . . . . . . . . . . . . . . . . . . . . . . . . . . . . . . . . . . . . . . . . . . . . . . . . . . . . . . . . . . . $(1.2) $ 5.8
Prudential Financial, Inc. 2013 Annual Report 31

We seek to replicate the changes in our hedge target by entering into a range of exchange-traded, cleared and over the counter equityand interest rate derivatives to hedge certain capital market risks present in our hedge target. The instruments include, but are not limited to,interest rate swaps, swaptions, floors and caps as well as equity options, total return swaps and equity futures. The following table sets forththe market and notional values of these instruments as of the periods indicated.
As of December 31, 2013 As of December 31, 2012
Equity Interest Rate Equity Interest Rate
Instrument NotionalMarketValue Notional
MarketValue Notional
MarketValue Notional
MarketValue
(in billions)Futures . . . . . . . . . . . . . . . . . . . . . . . . . . . . . . . . . . . . . . . . . . . . $ 0.2 $ 0.0 $ 0.0 $ 0.0 $ 6.5 $(0.2) $ 0.0 $0.0Swaps . . . . . . . . . . . . . . . . . . . . . . . . . . . . . . . . . . . . . . . . . . . . . 11.1 (0.5) 72.2 (2.8) 5.5 (0.1) 54.1 3.0Options . . . . . . . . . . . . . . . . . . . . . . . . . . . . . . . . . . . . . . . . . . . . 7.1 0.4 23.6 0.1 10.7 0.5 25.3 0.7
Total . . . . . . . . . . . . . . . . . . . . . . . . . . . . . . . . . . . . . . . . . . $18.4 $(0.1) $95.8 $(2.7) $22.7 $ 0.2 $79.4 $3.7
Due to cash flow timing differences between our hedging instruments and the corresponding hedge target, as well as other factors suchas updates to actuarial assumptions which are not hedged, the market value of the hedge portfolio compared to our hedge target measuredas of any specific point in time may be different and is not expected to be fully offsetting. In addition to the derivatives held as part of thehedging program, we have cash and other invested assets available to cover the future claims payable under these guarantees and otherliabilities. For additional information on the liquidity needs associated with our hedging program, see “—Liquidity and CapitalResources—Liquidity associated with other activities—Hedging activities associated with living benefit guarantees.”
The primary sources of differences between the changes in the fair value of the hedge positions and the hedge target, other thanchanges related to actuarial valuation assumption updates, fall into one of three categories:
• Fund Performance—In order to project future account value changes, we make certain assumptions about how each underlying fundwill perform. We map contractholder funds to indices that we believe are comparable, are readily tradable and have activederivative markets. The difference between the modeled fund performance and actual fund performance results in basis differencesthat can be either positive or negative.
• Rebalancing Costs and Volatility—We incur costs associated with rebalancing hedge positions for basis differences between thehedge positions and the hedge target. Our hedge program is also subject to the impact of realized market volatility in excess of, orlower than, our hedge target volatility assumptions.
• Liability Basis—We make assumptions about expected changes in the hedge target related to contractholder behavior, which are nothedged, and capital markets impacts, which we attempt to replicate with our hedge program. The difference between the actual change inthe hedge target and the expected changes we have modeled results in basis differences, which can be either positive or negative.
The net impact of both the change in the fair value of the embedded derivative associated with our living benefit features and thechange in the fair value of the related hedge positions is included in “Realized investment gains (losses), net, and related adjustments” andthe related impact to the amortization of DAC and other costs is included in “Related charges,” both of which are excluded from adjustedoperating income. The following table shows the net impact of changes in the embedded derivative and related hedge positions, as well asthe related amortization of DAC and other costs, for the periods indicated.
Year ended December 31,
2013 2012(1) 2011(1)
(2)(in millions)
Hedge Program Results:Change in fair value of hedge positions . . . . . . . . . . . . . . . . . . . . . . . . . . . . . . . . . . . . . . . . . . . . . . . . . . . . . . . . . . . . . . . . . . . . $(9,465) $(2,737) $ 3,873Change in value of hedge target(3) . . . . . . . . . . . . . . . . . . . . . . . . . . . . . . . . . . . . . . . . . . . . . . . . . . . . . . . . . . . . . . . . . . . . . . . 9,234 3,480 (5,170)
Net hedging impact(3)(4) . . . . . . . . . . . . . . . . . . . . . . . . . . . . . . . . . . . . . . . . . . . . . . . . . . . . . . . . . . . . . . . . . . . . . . . . . . . (231) 743 (1,297)
Reconciliation of Hedge Program Results to U.S. GAAP Results:Net hedging impact (from above) . . . . . . . . . . . . . . . . . . . . . . . . . . . . . . . . . . . . . . . . . . . . . . . . . . . . . . . . . . . . . . . . . . . . . . . . $ (231) $ 743 $(1,297)Change in portions of U.S. GAAP liability, before NPR, excluded from hedge target(3)(5) . . . . . . . . . . . . . . . . . . . . . . . . . . . 902 (817) (304)Change in the NPR adjustment(3) . . . . . . . . . . . . . . . . . . . . . . . . . . . . . . . . . . . . . . . . . . . . . . . . . . . . . . . . . . . . . . . . . . . . . . . . (4,333) (1,810) 4,677
Subtotal . . . . . . . . . . . . . . . . . . . . . . . . . . . . . . . . . . . . . . . . . . . . . . . . . . . . . . . . . . . . . . . . . . . . . . . . . . . . . . . . . . . . . (3,662) (1,884) 3,076
Related benefit/(charge) to amortization of DAC and other costs(3) . . . . . . . . . . . . . . . . . . . . . . . . . . . . . . . . . . . . . . . . . . . . . . 1,161 968 (1,623)
Net impact of assumption updates and other refinements(6) . . . . . . . . . . . . . . . . . . . . . . . . . . . . . . . . . . . . . . . . . . . . . . . . . . . . (1,533) (46) (29)
Net impact from changes in the U.S. GAAP embedded derivative and hedge positions, after the impact of NPR,DAC and other costs(4) . . . . . . . . . . . . . . . . . . . . . . . . . . . . . . . . . . . . . . . . . . . . . . . . . . . . . . . . . . . . . . . . . . . . . . $(4,034) $ (962) $ 1,424
(1) Prior periods have been reclassified to conform to current period presentation.(2) Positive amount represents income; negative amount represents a loss.(3) Excludes the impacts of assumption updates and other refinements.(4) Excludes $1,603 million, $101 million and $(1,662) million in 2013, 2012 and 2011, respectively, representing the impact of managing interest rate risk
through capital management strategies other than hedging of particular exposures. Because this decision is based on the capital considerations of theCompany as a whole, the impact is reported in Corporate and Other operations. See “—Corporate and Other.”
(5) Represents the impact attributable to the difference between the value of the hedge target and the value of the embedded derivative as defined by U.S.GAAP, before adjusting for NPR, as discussed above.
(6) Represents the total U.S. GAAP impact of assumption updates and other refinements on our hedge target, net of related changes in the NPR adjustment,related changes in amounts attributable to the difference between the value of the hedge target and the value of the embedded derivative as defined byU.S. GAAP, and related amortization of DAC and other costs.
32 Prudential Financial, Inc. 2013 Annual Report

The net hedging charge of $231 million for 2013 was primarily driven by fund underperformance relative to indices and realizedvolatility, partially offset by favorable liability basis. The net charge from the change in the NPR adjustment of $4,333 million for 2013was driven by net decreases in the base embedded derivative liability before NPR, primarily reflecting the impact of favorable capitalmarkets conditions, as well as tightening of our NPR credit spreads. Each of these items resulted in partial offsets included in the relatedbenefit to the amortization of DAC and other costs. The net charge from the impact of assumption updates and other refinements of $1,533million for 2013 was primarily driven by modifications to our lapse rate assumptions to reflect our review of emerging experience, futureexpectations and other data, and other refinements. These updates increased expected claims significantly more than expected fees, whichincreased our net liability.
The net hedging benefit of $743 million for 2012 was primarily driven by fund outperformance relative to indices. The net chargefrom the change in the NPR adjustment of $1,810 million for 2012 was driven by the tightening of our NPR credit spreads. Each of theseitems resulted in partial offsets included in the related benefit to the amortization of DAC and other costs. The net charge from the impactof assumption updates and other refinements of $46 million for 2012 was primarily driven by modifications to our lapse, mortality andutilization rate assumptions to reflect our review of emerging experience, future expectations and other data.
The net hedging charge of $1,297 million for 2011 was primarily driven by unfavorable liability basis and realized volatility. The netbenefit from the change in the NPR adjustment of $4,677 million for 2011 was driven by increases in the base embedded derivative liabilitybefore NPR primarily due to significant declines in risk-free interest rates and the impact of account value performance, as well as thewidening of our NPR credit spreads. Each of these items resulted in partial offsets included in the related charge to the amortization of DACand other costs. The net charge from the impact of assumption updates and other refinements of $29 million for 2011 was primarily driven bymodifications to our lapse and utilization rate assumptions to reflect our review of emerging experience, future expectations and other data.
For information regarding the Capital Protection Framework we use to evaluate and support the risks of our hedging program, see “—Liquidity and Capital Resources—Capital.”
Retirement
Operating Results
The following table sets forth the Retirement segment’s operating results for the periods indicated.
Year ended December 31,
2013 2012 2011
(in millions)Operating results:
Revenues . . . . . . . . . . . . . . . . . . . . . . . . . . . . . . . . . . . . . . . . . . . . . . . . . . . . . . . . . . . . . . . . . . . . . . . . . . . . . . . . . . . . . . . . $ 6,028 $36,595 $4,871Benefits and expenses . . . . . . . . . . . . . . . . . . . . . . . . . . . . . . . . . . . . . . . . . . . . . . . . . . . . . . . . . . . . . . . . . . . . . . . . . . . . . . 4,989 35,957 4,277
Adjusted operating income . . . . . . . . . . . . . . . . . . . . . . . . . . . . . . . . . . . . . . . . . . . . . . . . . . . . . . . . . . . . . . . . . . . . . . . . . . 1,039 638 594Realized investment gains (losses), net, and related adjustments . . . . . . . . . . . . . . . . . . . . . . . . . . . . . . . . . . . . . . . . . (1,489) (171) 269Related charges . . . . . . . . . . . . . . . . . . . . . . . . . . . . . . . . . . . . . . . . . . . . . . . . . . . . . . . . . . . . . . . . . . . . . . . . . . . . . . . 1 (1) (9)Investment gains on trading account assets supporting insurance liabilities, net . . . . . . . . . . . . . . . . . . . . . . . . . . . . . (718) 406 383Change in experience-rated contractholder liabilities due to asset value changes . . . . . . . . . . . . . . . . . . . . . . . . . . . . 695 (336) (283)
Income (loss) from continuing operations before income taxes and equity in earnings of operating joint ventures . . . . . . $ (472) $ 536 $ 954
Adjusted Operating Income
2013 to 2012 Annual Comparison. Adjusted operating income increased $401 million. Excluding the impact of changes in theestimated profitability of the business and certain other items discussed below, adjusted operating income increased $433 million primarilydriven by higher net investment spread results, a more favorable reserve impact from case experience and higher asset-based fee income.The increase in net investment spread results reflects higher income on institutional investment products account values, driven bysignificant pension risk transfer transactions that closed in the fourth quarter of 2012 and higher income from non-coupon investments. Themore favorable reserve impact from case experience reflects the impact of favorable mortality related to the pension risk transfer contracts.Higher asset-based fee income was driven by net additions of investment-only stable value account values and increases in full serviceaccount values primarily from market appreciation. These increases were partially offset by higher general and administrative expenses, netof capitalization, driven primarily by higher compensation costs.
The impact of changes in our estimated profitability of the business includes adjustments to the amortization of DAC, VOBA andreserves for our products. These changes resulted in net charges of $1 million and $18 million for the years ended 2013 and 2012,respectively, primarily related to our annual reviews and updates of assumptions. The net charge for the year ended 2013 was driven by lessfavorable mortality assumptions, partially offset by improved net cash flow and net spread assumptions, while the net charge for the yearended 2012 was primarily driven by a reduction to the long-term interest and equity rate of return assumptions. Additionally, results for theyear ended 2012 include $78 million related to a legal settlement, in which we recovered losses previously incurred related toreimbursements of client losses on certain investment funds managed by an unaffiliated asset manager, partially offset by a $29 millioncharge for the write off of an intangible asset on a business we acquired in 2008.
2012 to 2011 Annual Comparison. Adjusted operating income increased $44 million. Excluding the impact of changes in theestimated profitability of the business and certain other items discussed below, adjusted operating income decreased $11 million, as higherasset-based fee income and net investment spread results were more than offset by higher general and administrative expenses, net ofcapitalization, and an unfavorable comparative reserve impact from case experience. The increase in asset-based fee income primarilyreflects higher investment-only stable value account values driven by net additions, partially offset by lower full service fee income
Prudential Financial, Inc. 2013 Annual Report 33

primarily due to outflows of contracts earning higher than average margins. The increase in net investment spread results primarily reflectshigher institutional investment products account values, driven by significant pension risk transfer transactions in the fourth quarter of2012. Also contributing to net investment spread results were increases from the impacts of crediting rate reductions, higher full servicegeneral account stable value account values and higher income from non-coupon investments, partially offset by decreases from theimpacts of lower reinvestment rates and lower account values from a divestiture of bank deposits in 2012. Higher general andadministrative expenses, net of capitalization, primarily reflect increased costs to support strategic initiatives and business expansion,partially offset by lower costs related to legal matters. The unfavorable comparative reserve impact from case experience was primarilydriven by unfavorable mortality experience in 2012.
The impact of changes in our estimated profitability of the business includes adjustments to the amortization of DAC, VOBA andreserves for our products. The changes resulted in net charges of $18 million and $24 million for the years ended 2012 and 2011,respectively, primarily related to our annual reviews and updates of assumptions. The net charge for the year ended 2012 was driven by areduction to long-term interest and equity rate of return assumptions, while the net charge in 2011 was primarily driven by changes toexpense and net cash flow assumptions. Additionally, results in 2012 include $78 million related to a legal settlement, partially offset by a$29 million charge to write off an intangible asset, as discussed above.
Revenues, Benefits and Expenses
2013 to 2012 Annual Comparison. Revenues, as shown in the table above under “—Operating Results,” decreased $30,567 million.Premiums decreased $31,502 million primarily driven by premiums recorded upon the closing of the significant pension risk transfertransactions in the fourth quarter of 2012. Net investment income increased $864 million reflecting higher income on institutional investmentproducts account values, driven by the significant pension risk transfer transactions discussed above and higher income on non-couponinvestments, partially offset by lower portfolio yields on full service general account stable value account values. Policy charges and feeincome, and asset management fees and other income increased $71 million, primarily from higher asset-based fees that were driven by netadditions in investment-only stable value account values and full service account values primarily driven by equity market appreciation.
Benefits and expenses, as shown in the table above under “—Operating Results,” decreased $30,968 million. Policyholders’ benefits,including the change in policy reserves, decreased $30,870 million primarily driven by reserves recorded upon the closing of the significantpension risk transfer transactions in the fourth quarter of 2012. Absent this decrease and the $32 million increase from the changes in ourestimated profitability of the business and certain other items, as discussed above, benefits and expenses decreased $130 million. Interestcredited to policyholders’ account balances decreased $166 million reflecting the runoff of traditional guaranteed investment products inour institutional investment products business and the impact of crediting rate reductions on full service general account stable valueaccount values. The amortization of DAC decreased $23 million, reflecting amortization recorded upon the closing of the significantpension risk transfer transactions in the fourth quarter of 2012. Partially offsetting these decreases was a $53 million increase in general andadministrative expenses, net of capitalization driven primarily by higher compensation costs.
2012 to 2011 Annual Comparison. Revenues increased $31,724 million. Premiums increased $31,622 million, primarily driven bythe significant pension risk transfer transactions discussed above. The increase in premiums resulted in a corresponding increase inpolicyholders’ benefits, including the change in policy reserves, discussed below. Policy charges and fee income, and asset managementfees and other income increased $77 million, primarily from higher asset-based fees on investment-only stable value account values andhigher income from non-coupon investments accounted for under the fair value option, partially offset by lower asset-based fees on fullservice fee-based account values. Net investment income increased $25 million primarily reflecting the impacts of higher institutionalinvestment products account values, driven by the significant pension risk transfer transactions, higher full service general account stablevalue account values, and a favorable impact from changes in the market values of equity-method non-coupon investments, partially offsetby the impacts of lower portfolio yields and lower account values from a divestiture of bank deposits in 2012.
Benefits and expenses increased $31,680 million. Policyholders’ benefits, including the change in policy reserves, increased $31,723million, driven by the significant pension risk transfer transactions associated with the increase in premiums discussed above. Absent thisincrease and the $55 million net decrease from the changes in our estimated profitability of the business and certain other items, asdiscussed above, benefits and expenses increased $12 million. General and administrative expenses, net of capitalization, increased$21 million, primarily reflecting increased costs to support strategic initiatives and business expansion, partially offset by lower costsrelated to legal matters. The amortization of DAC increased $6 million, reflecting an increase from the amortization of acquisition costsrelated to the significant pension risk transfer transactions, partially offset by a decrease related to a refinement associated with certainstructured settlements recorded in 2011. Interest credited to policyholders’ account balances decreased $20 million primarily driven by theimpacts of crediting rate reductions and the divestiture of bank deposits in 2012, partially offset by the impact of higher full service generalaccount stable value account values and an increase related to a refinement associated with certain structured settlements recorded in 2011.
34 Prudential Financial, Inc. 2013 Annual Report
Account ValuesOur account values are a significant driver of our operating results, and are primarily driven by net additions (withdrawals) and the
impact of market changes. For our fee-based products, the income we earn varies with the level of fee-based account values, since manypolicy fees are determined by these values. For our spread-based products, both the investment income and interest we credit to policyholdersvary with the level of general account values. To a lesser extent, changes in account values impact our pattern of amortization of DAC andVOBA, and general and administrative expenses. The following table shows the changes in the account values and net additions(withdrawals) of Retirement segment products for the periods indicated. Net additions (withdrawals) are deposits and sales or additions, asapplicable, minus withdrawals and benefits. Account values include both internally- and externally-managed client balances as the totalbalances drive revenue for the Retirement segment. For more information on internally-managed balances see “—Asset Management.”
Year ended December 31,
2013 2012 2011
(in millions)Full Service(1):
Beginning total account value . . . . . . . . . . . . . . . . . . . . . . . . . . . . . . . . . . . . . . . . . . . . . . . . . . . . . . . . . . . . . . . . . . . . $148,405 $139,430 $141,313Deposits and sales . . . . . . . . . . . . . . . . . . . . . . . . . . . . . . . . . . . . . . . . . . . . . . . . . . . . . . . . . . . . . . . . . . . . . . . . . . . . . 20,677 16,390 16,821Withdrawals and benefits . . . . . . . . . . . . . . . . . . . . . . . . . . . . . . . . . . . . . . . . . . . . . . . . . . . . . . . . . . . . . . . . . . . . . . . (18,711) (19,223) (19,160)Change in market value, interest credited, interest income and other activity(2) . . . . . . . . . . . . . . . . . . . . . . . . . . . . . 23,131 11,808 456
Ending total account value . . . . . . . . . . . . . . . . . . . . . . . . . . . . . . . . . . . . . . . . . . . . . . . . . . . . . . . . . . . . . . . . . . $173,502 $148,405 $139,430
Net additions (withdrawals) . . . . . . . . . . . . . . . . . . . . . . . . . . . . . . . . . . . . . . . . . . . . . . . . . . . . . . . . . . . . . . . . . . . . . $ 1,966 $ (2,833) $ (2,339)
Institutional Investment Products(3):Beginning total account value . . . . . . . . . . . . . . . . . . . . . . . . . . . . . . . . . . . . . . . . . . . . . . . . . . . . . . . . . . . . . . . . . . . . $141,435 $ 90,089 $ 64,183Additions(4) . . . . . . . . . . . . . . . . . . . . . . . . . . . . . . . . . . . . . . . . . . . . . . . . . . . . . . . . . . . . . . . . . . . . . . . . . . . . . . . . . 17,294 55,005 27,773Withdrawals and benefits(5) . . . . . . . . . . . . . . . . . . . . . . . . . . . . . . . . . . . . . . . . . . . . . . . . . . . . . . . . . . . . . . . . . . . . . (9,951) (8,495) (6,150)Change in market value, interest credited and interest income . . . . . . . . . . . . . . . . . . . . . . . . . . . . . . . . . . . . . . . . . . . 1,066 4,787 4,581Other(6) . . . . . . . . . . . . . . . . . . . . . . . . . . . . . . . . . . . . . . . . . . . . . . . . . . . . . . . . . . . . . . . . . . . . . . . . . . . . . . . . . . . . . (442) 49 (298)
Ending total account value(7)(8) . . . . . . . . . . . . . . . . . . . . . . . . . . . . . . . . . . . . . . . . . . . . . . . . . . . . . . . . . . . . . . $149,402 $141,435 $ 90,089
Net additions(9) . . . . . . . . . . . . . . . . . . . . . . . . . . . . . . . . . . . . . . . . . . . . . . . . . . . . . . . . . . . . . . . . . . . . . . . . . . . . . . $ 7,343 $ 46,510 $ 21,623
(1) Ending total account value for the full service business includes assets of Prudential’s retirement plan of $7.7 billion, $6.6 billion and $6.3 billion as ofDecember 31, 2013, 2012 and 2011, respectively.
(2) Change in market value, interest credited and interest income and other activity includes $(1.4) billion for 2012 representing the divestiture of bankdeposits held by Prudential Bank & Trust, as a result of our decision to limit its operations to trust services. Other activity also includes $469 million in2011 representing the addition of Prudential’s non-qualified pension plan transferred from a third-party administrator.
(3) Ending total account value for the institutional investment products business includes assets of Prudential’s retirement plan of $5.4 billion, $6.1 billionand $5.8 billion as of December 31, 2013, 2012 and 2011, respectively. Ending total account value for the institutional investment products businessalso includes $1.9 billion, $1.9 billion and $1.5 billion as of December 31, 2013, 2012 and 2011, respectively, related to collateralized fundingagreements issued to the Federal Home Loan Bank of New York (FHLBNY), and $0.5 billion as of December 31, 2011 related to affiliated fundingagreements issued to Prudential Financial. For additional information, see Note 10 and Note 14 to the Consolidated Financial Statements.
(4) Additions include $1,008 million in 2012 representing transfers of externally-managed client balances to accounts we manage. These additions areoffset within Other.
(5) Withdrawals and benefits include $(23) million, $(902) million and $(78) million for 2013, 2012 and 2011, respectively, representing transfers of clientbalances from accounts we manage to externally-managed accounts. These withdrawals are offset within Other.
(6) Other includes $23 million, $(106) million and $78 million for 2013, 2012 and 2011, respectively, representing net transfers of externally-managedclient balances from/(to) accounts we manage. These transfers are offset within Additions or Withdrawals and benefits.
(7) Ending total account value for the institutional investment products business includes investment-only stable value account values of $72.5 billion,$60.8 billion and $41.3 billion as of December 31, 2013, 2012 and 2011, respectively.
(8) Ending total account value for the institutional investment products business includes $31.7 billion and $33.7 billion as of December 31, 2013 and 2012,respectively, related to significant pension risk transfer transactions that closed in the fourth quarter of 2012. These account values will decline overtime resulting from benefit payments to contract holders.
(9) Net additions for the institutional investment products business include investment-only stable value net additions of $12.2 billion, $17.5 billion and$22.3 billion for 2013, 2012 and 2011, respectively, and $33.6 billion for 2012 related to significant pension risk transfer transactions that closed in thefourth quarter of 2012.
2013 to 2012 Annual Comparison. The increase in full service account values primarily reflects the impact of equity marketappreciation in 2013 on customer account values. The increase in net additions (withdrawals) was primarily driven by a higher volume oflarge plan sales and a lower volume of large plan lapses.
The increase in institutional investment products account values is primarily driven by net additions of our fee-based investment-only stablevalue product partially offset by decreases in account values due to scheduled withdrawals and benefit payments. The decrease in net additionswas driven by the significant pension risk transfer transactions, discussed above, as well as lower sales of our investment-only stable valueproduct primarily driven by existing intermediary relationships reaching saturation levels and increased competition in the marketplace.
2012 to 2011 Annual Comparison. The increase in full service account values primarily reflects equity market appreciation in 2012,partially offset by net withdrawals and a divestiture of bank deposits. The increase in net withdrawals was primarily due to an increase inthe value of participant withdrawals, driven by the impact of equity market appreciation on account values.
The increase in institutional investment products account values primarily reflects net additions and increases in the market value ofcustomer funds driven by declines in fixed income yields. The increase in net additions was driven by the significant pension risk transfertransactions discussed above, partially offset by a decrease in sales of our investment-only stable value product, resulting from some of ourexisting intermediary relationships nearing saturation levels.
Prudential Financial, Inc. 2013 Annual Report 35

Asset Management
Operating ResultsThe following table sets forth the Asset Management segment’s operating results for the periods indicated.
Year ended December 31,
2013 2012 2011
(in millions)Operating results:
Revenues . . . . . . . . . . . . . . . . . . . . . . . . . . . . . . . . . . . . . . . . . . . . . . . . . . . . . . . . . . . . . . . . . . . . . . . . . . . . . . . . . . . . . . . $2,678 $2,376 $2,531Expenses . . . . . . . . . . . . . . . . . . . . . . . . . . . . . . . . . . . . . . . . . . . . . . . . . . . . . . . . . . . . . . . . . . . . . . . . . . . . . . . . . . . . . . . 1,955 1,792 1,643
Adjusted operating income . . . . . . . . . . . . . . . . . . . . . . . . . . . . . . . . . . . . . . . . . . . . . . . . . . . . . . . . . . . . . . . . . . . . . . . . . 723 584 888Realized investment gains (losses), net, and related adjustments . . . . . . . . . . . . . . . . . . . . . . . . . . . . . . . . . . . . . . . . (6) (47) (1)Equity in earnings of operating joint ventures and earnings attributable to noncontrolling interests . . . . . . . . . . . . . 90 40 27
Income from continuing operations before income taxes and equity in earnings of operating joint ventures . . . . . . . . . . $ 807 $ 577 $ 914
Adjusted Operating Income2013 to 2012 Annual Comparison. Adjusted operating income increased $139 million. The increase reflects higher asset management
fees, net of expenses, driven by higher average asset values due to positive market appreciation and net flows throughout the current year. Alsocontributing to the increase were improved strategic investing results driven by the absence of $69 million of losses incurred in the prior yearassociated with two real estate investments, partially offset by a lower contribution from the segment’s commercial mortgage activities.
2012 to 2011 Annual Comparison. Adjusted operating income decreased $304 million. The decrease reflects a $131 million lowercontribution from the segment’s strategic investing activities in 2012 largely due to $69 million of declines in value of two real estateinvestments, one of which was sold in 2012, while strategic investing activities in 2011 included a $64 million gain on a partial sale of areal estate seed investment. The decrease in adjusted operating income also reflects the absence of a $96 million gain on sale in 2011 of ourinvestment in an operating joint venture, Afore XXI, a pension fund manager in Mexico. Additionally, results for 2012 reflect an increasein operating expenses reflecting business growth, increased expenses related to new fund launches and increased compensation costs.These decreases were partially offset by an increase in asset management fees, before associated expenses, primarily from institutional andretail customer assets as a result of higher asset values due to positive net asset flows and market appreciation in 2012.
Revenues and Expenses
The following table sets forth the Asset Management segment’s revenues, presented on a basis consistent with the table above under“—Operating Results,” by type.
Year ended December 31,
2013 2012 2011
(in millions)Revenues by type:
Asset management fees by source:Institutional customers . . . . . . . . . . . . . . . . . . . . . . . . . . . . . . . . . . . . . . . . . . . . . . . . . . . . . . . . . . . . . . . . . . . . . . . . $ 838 $ 775 $ 729Retail customers(1) . . . . . . . . . . . . . . . . . . . . . . . . . . . . . . . . . . . . . . . . . . . . . . . . . . . . . . . . . . . . . . . . . . . . . . . . . . . 631 509 452General account . . . . . . . . . . . . . . . . . . . . . . . . . . . . . . . . . . . . . . . . . . . . . . . . . . . . . . . . . . . . . . . . . . . . . . . . . . . . . 412 383 360
Total asset management fees . . . . . . . . . . . . . . . . . . . . . . . . . . . . . . . . . . . . . . . . . . . . . . . . . . . . . . . . . . . . . . . . 1,881 1,667 1,541
Incentive fees(2) . . . . . . . . . . . . . . . . . . . . . . . . . . . . . . . . . . . . . . . . . . . . . . . . . . . . . . . . . . . . . . . . . . . . . . . . . . . . . . . . . 62 48 105Transaction fees . . . . . . . . . . . . . . . . . . . . . . . . . . . . . . . . . . . . . . . . . . . . . . . . . . . . . . . . . . . . . . . . . . . . . . . . . . . . . . . . . 25 40 35Strategic investing . . . . . . . . . . . . . . . . . . . . . . . . . . . . . . . . . . . . . . . . . . . . . . . . . . . . . . . . . . . . . . . . . . . . . . . . . . . . . . . . 52 (12) 118Commercial mortgage(3) . . . . . . . . . . . . . . . . . . . . . . . . . . . . . . . . . . . . . . . . . . . . . . . . . . . . . . . . . . . . . . . . . . . . . . . . . . 115 164 136
Other related revenues(4) . . . . . . . . . . . . . . . . . . . . . . . . . . . . . . . . . . . . . . . . . . . . . . . . . . . . . . . . . . . . . . . . . . 254 240 394
Service, distribution and other revenues(5) . . . . . . . . . . . . . . . . . . . . . . . . . . . . . . . . . . . . . . . . . . . . . . . . . . . . . . . . . . . . 543 469 596
Total revenues . . . . . . . . . . . . . . . . . . . . . . . . . . . . . . . . . . . . . . . . . . . . . . . . . . . . . . . . . . . . . . . . . . . . . . . . . . . $2,678 $2,376 $2,531
(1) Consists of fees from: (a) individual mutual funds and variable annuities and variable life insurance separate account assets; (b) funds invested inproprietary mutual funds through our defined contribution plan products; and (c) third-party sub-advisory relationships. Revenues from fixed annuitiesand the fixed-rate accounts of variable annuities and variable life insurance are included in the general account.
(2) A portion of incentive fee revenue is offset in expense in accordance with the terms of the contractual agreements.(3) Includes mortgage origination and spread lending revenues of our commercial mortgage origination and servicing business.(4) Future revenues will be impacted by the level and diversification of our strategic investments, the commercial real estate market, and other domestic and
international markets.(5) Includes payments from Wells Fargo under an agreement dated as of July 30, 2004, implementing arrangements with respect to money market mutual
funds in connection with the combination of our retail securities brokerage and clearing operations with those of Wells Fargo. The agreement extendsfor ten years after termination of the Wachovia Securities joint venture, which occurred on December 31, 2009. The revenue from Wells Fargo underthis agreement was $75 million in 2013, $66 million in 2012 and $74 million in 2011.
2013 to 2012 Annual Comparison. Revenues increased $302 million. Asset management fees increased $214 million, driven byhigher average asset values due to positive net flows and market appreciation throughout the current year. Service, distribution and otherrevenues increased $74 million, driven by higher revenues from certain consolidated funds, which were fully offset by higher expensesrelated to noncontrolling interests in these funds, as well as higher servicing fee income from our commercial mortgage business. Strategic
36 Prudential Financial, Inc. 2013 Annual Report

investing revenues increased $64 million, as the prior year period included $69 million of losses associated with two real estateinvestments. Performance-based incentive fee revenues increased $14 million, driven by out performance within public equity accounts in2013. These increases were partially offset by lower commercial mortgage revenues of $49 million, driven by lower production andprofitability levels, the runoff of the interim loan portfolio, and lower investment gains due to the disposition of real estate owned assets in2012. Transaction fees decreased $15 million, driven by declining acquisition and disposition volumes in certain real estate portfolios.
Expenses, as shown in the table above under “—Operating Results,” increased $163 million, primarily driven by higher compensationcosts and higher expenses related to revenues associated with certain consolidated funds, as discussed above.
2012 to 2011 Annual Comparison. Revenues decreased $155 million. Strategic investing revenues decreased $130 million reflecting$69 million of declines in value of two real estate investments, one of which was sold in 2012, while strategic investing activities in 2011include a $64 million gain on a partial sale of a real estate seed investment. Service, distribution and other revenues decreased $127 millionprimarily due to the absence of the $96 million gain on the sale of our investment in Afore XXI in 2011. Performance-based incentive feesdecreased $57 million primarily reflecting lower net asset values from institutional real estate funds resulting from market value declines.Partially offsetting the decreases in revenue above was an increase in asset management fees of $126 million primarily from themanagement of institutional and retail customer assets as a result of higher asset values. In addition, commercial mortgage revenuesincreased $28 million primarily reflecting higher origination volume.
Expenses, as shown in the table above under “—Operating Results,” increased $149 million primarily driven by business growth,increased expenses related to new fund launches and increased compensation costs.
Assets Under Management
The following table sets forth assets under management by asset class and source as of the dates indicated.
December 31,
2013 2012 2011
(in billions)Assets Under Management (at fair market value):
Institutional customers:Equity . . . . . . . . . . . . . . . . . . . . . . . . . . . . . . . . . . . . . . . . . . . . . . . . . . . . . . . . . . . . . . . . . . . . . . . . . . . . . . . . . . . . . . . . $ 63.4 $ 51.7 $ 46.3Fixed income . . . . . . . . . . . . . . . . . . . . . . . . . . . . . . . . . . . . . . . . . . . . . . . . . . . . . . . . . . . . . . . . . . . . . . . . . . . . . . . . . . . 243.8 230.8 197.8Real estate . . . . . . . . . . . . . . . . . . . . . . . . . . . . . . . . . . . . . . . . . . . . . . . . . . . . . . . . . . . . . . . . . . . . . . . . . . . . . . . . . . . . . 34.5 31.2 27.7
Institutional customers(1)(2) . . . . . . . . . . . . . . . . . . . . . . . . . . . . . . . . . . . . . . . . . . . . . . . . . . . . . . . . . . . . . . . . . . . 341.7 313.7 271.8
Retail customers:Equity . . . . . . . . . . . . . . . . . . . . . . . . . . . . . . . . . . . . . . . . . . . . . . . . . . . . . . . . . . . . . . . . . . . . . . . . . . . . . . . . . . . . . . . . 117.0 86.6 71.7Fixed income . . . . . . . . . . . . . . . . . . . . . . . . . . . . . . . . . . . . . . . . . . . . . . . . . . . . . . . . . . . . . . . . . . . . . . . . . . . . . . . . . . . 51.5 50.3 46.2Real estate . . . . . . . . . . . . . . . . . . . . . . . . . . . . . . . . . . . . . . . . . . . . . . . . . . . . . . . . . . . . . . . . . . . . . . . . . . . . . . . . . . . . . 2.2 1.8 1.4
Retail customers(3) . . . . . . . . . . . . . . . . . . . . . . . . . . . . . . . . . . . . . . . . . . . . . . . . . . . . . . . . . . . . . . . . . . . . . . . . . . 170.7 138.7 119.3
General account:Equity . . . . . . . . . . . . . . . . . . . . . . . . . . . . . . . . . . . . . . . . . . . . . . . . . . . . . . . . . . . . . . . . . . . . . . . . . . . . . . . . . . . . . . . . 8.9 9.4 8.7Fixed income . . . . . . . . . . . . . . . . . . . . . . . . . . . . . . . . . . . . . . . . . . . . . . . . . . . . . . . . . . . . . . . . . . . . . . . . . . . . . . . . . . . 347.2 363.7 316.7Real estate . . . . . . . . . . . . . . . . . . . . . . . . . . . . . . . . . . . . . . . . . . . . . . . . . . . . . . . . . . . . . . . . . . . . . . . . . . . . . . . . . . . . . 1.4 1.5 1.3
General account . . . . . . . . . . . . . . . . . . . . . . . . . . . . . . . . . . . . . . . . . . . . . . . . . . . . . . . . . . . . . . . . . . . . . . . . . . . . 357.5 374.6 326.7
Total assets under management . . . . . . . . . . . . . . . . . . . . . . . . . . . . . . . . . . . . . . . . . . . . . . . . . . . . . . . . . . . . . . . . . . . . . . . . $869.9 $827.0 $717.8
(1) Consists of third party institutional assets and group insurance contracts.(2) As of December 31, 2013, 2012 and 2011, includes $38.3 billion, $37.2 billion and $29.7 billion, respectively, of assets under management related to
investment-only stable value products.(3) Consists of: (a) individual mutual funds and variable annuities and variable life insurance separate account assets; (b) funds invested in proprietary
mutual funds through our defined contribution plan products; and (c) third-party sub-advisory relationships. Fixed annuities and the fixed-rate accountsof variable annuities and variable life insurance are included in the general account.
The following table sets forth the component changes in assets under management by asset source for the periods indicated.
December 31,
2013 2012 2011
(in billions)Institutional Customers:
Beginning Assets Under Management . . . . . . . . . . . . . . . . . . . . . . . . . . . . . . . . . . . . . . . . . . . . . . . . . . . . . . . . . . . . . . . . $313.7 $271.8 $237.8Net additions (withdrawals), excluding money market activity:
Third party(1) . . . . . . . . . . . . . . . . . . . . . . . . . . . . . . . . . . . . . . . . . . . . . . . . . . . . . . . . . . . . . . . . . . . . . . . . . . . . . . . 19.4 17.2 16.9Affiliated . . . . . . . . . . . . . . . . . . . . . . . . . . . . . . . . . . . . . . . . . . . . . . . . . . . . . . . . . . . . . . . . . . . . . . . . . . . . . . . . . . . (0.4) (1.5) (2.8)
Total . . . . . . . . . . . . . . . . . . . . . . . . . . . . . . . . . . . . . . . . . . . . . . . . . . . . . . . . . . . . . . . . . . . . . . . . . . . . . . . . . . 19.0 15.7 14.1Market appreciation . . . . . . . . . . . . . . . . . . . . . . . . . . . . . . . . . . . . . . . . . . . . . . . . . . . . . . . . . . . . . . . . . . . . . . . . . . . . . . 10.3 26.2 19.7Other increases (decreases)(2) . . . . . . . . . . . . . . . . . . . . . . . . . . . . . . . . . . . . . . . . . . . . . . . . . . . . . . . . . . . . . . . . . . . . . . (1.3) 0.0 0.2
Ending Assets Under Management . . . . . . . . . . . . . . . . . . . . . . . . . . . . . . . . . . . . . . . . . . . . . . . . . . . . . . . . . . . . . . . . . . . $341.7 $313.7 $271.8
Prudential Financial, Inc. 2013 Annual Report 37

December 31,
2013 2012 2011
(in billions)Retail Customers:
Beginning Assets Under Management . . . . . . . . . . . . . . . . . . . . . . . . . . . . . . . . . . . . . . . . . . . . . . . . . . . . . . . . . . . . . . . . $138.7 $119.3 $110.6Net additions (withdrawals), excluding money market activity:
Third party . . . . . . . . . . . . . . . . . . . . . . . . . . . . . . . . . . . . . . . . . . . . . . . . . . . . . . . . . . . . . . . . . . . . . . . . . . . . . . . . . 4.4 12.8 5.7Affiliated . . . . . . . . . . . . . . . . . . . . . . . . . . . . . . . . . . . . . . . . . . . . . . . . . . . . . . . . . . . . . . . . . . . . . . . . . . . . . . . . . . . 1.6 (6.2) 14.1
Total . . . . . . . . . . . . . . . . . . . . . . . . . . . . . . . . . . . . . . . . . . . . . . . . . . . . . . . . . . . . . . . . . . . . . . . . . . . . . . . . . . 6.0 6.6 19.8Market appreciation . . . . . . . . . . . . . . . . . . . . . . . . . . . . . . . . . . . . . . . . . . . . . . . . . . . . . . . . . . . . . . . . . . . . . . . . . . . . . . 26.7 13.4 1.1Other increases (decreases)(2) . . . . . . . . . . . . . . . . . . . . . . . . . . . . . . . . . . . . . . . . . . . . . . . . . . . . . . . . . . . . . . . . . . . . . . (0.7) (0.6) (12.2)
Ending Assets Under Management . . . . . . . . . . . . . . . . . . . . . . . . . . . . . . . . . . . . . . . . . . . . . . . . . . . . . . . . . . . . . . . . . . . $170.7 $138.7 $119.3
General Account:Beginning Assets Under Management . . . . . . . . . . . . . . . . . . . . . . . . . . . . . . . . . . . . . . . . . . . . . . . . . . . . . . . . . . . . . . . . $374.6 $326.7 $257.4Net additions (withdrawals), excluding money market activity:
Third party . . . . . . . . . . . . . . . . . . . . . . . . . . . . . . . . . . . . . . . . . . . . . . . . . . . . . . . . . . . . . . . . . . . . . . . . . . . . . . . . . 0.0 0.0 0.0Affiliated(3) . . . . . . . . . . . . . . . . . . . . . . . . . . . . . . . . . . . . . . . . . . . . . . . . . . . . . . . . . . . . . . . . . . . . . . . . . . . . . . . . 7.4 37.6 42.9
Total . . . . . . . . . . . . . . . . . . . . . . . . . . . . . . . . . . . . . . . . . . . . . . . . . . . . . . . . . . . . . . . . . . . . . . . . . . . . . . . . . . 7.4 37.6 42.9Market appreciation . . . . . . . . . . . . . . . . . . . . . . . . . . . . . . . . . . . . . . . . . . . . . . . . . . . . . . . . . . . . . . . . . . . . . . . . . . . . . . (2.8) 15.3 22.0Other increases (decreases)(2) . . . . . . . . . . . . . . . . . . . . . . . . . . . . . . . . . . . . . . . . . . . . . . . . . . . . . . . . . . . . . . . . . . . . . . (21.7) (5.0) 4.4
Ending Assets Under Management . . . . . . . . . . . . . . . . . . . . . . . . . . . . . . . . . . . . . . . . . . . . . . . . . . . . . . . . . . . . . . . . . . . $357.5 $374.6 $326.7
(1) Includes net additions into fixed income accounts related to investment-only stable value products of $1.6 billion, $6.4 billion and $10.0 billion for theyears ended December 31, 2013, 2012 and 2011, respectively.
(2) Includes the effect of foreign exchange rate changes, net money market activity and transfers (to)/from the Retirement segment as a result of changes inthe client contract form. The impact from foreign currency fluctuations, which primarily impact the general account, resulted in losses of $(21.0) billion,losses of $(7.9) billion and gains of $2.7 billion for the years ended December 31, 2013, 2012 and 2011, respectively.
(3) Includes $7.9 billion from the acquisition of the Hartford Life Business for the year ended December 31, 2013, $31.0 billion from two significantpension risk transfer transactions in the Retirement segment for the year ended December 31, 2012, and $40.4 billion from the acquisition of the Starand Edison Businesses for the year ended December 31, 2011.
Strategic Investments
The following table sets forth the strategic investments of the Asset Management segment at carrying value (including the value ofderivative instruments used to mitigate equity market and currency risk) by asset class and source as of the dates indicated.
December 31,
2013 2012
(in millions)Co-Investments:
Real estate . . . . . . . . . . . . . . . . . . . . . . . . . . . . . . . . . . . . . . . . . . . . . . . . . . . . . . . . . . . . . . . . . . . . . . . . . . . . . . . . . . . . . . . . . . . . . . . $342 $ 437Fixed income . . . . . . . . . . . . . . . . . . . . . . . . . . . . . . . . . . . . . . . . . . . . . . . . . . . . . . . . . . . . . . . . . . . . . . . . . . . . . . . . . . . . . . . . . . . . . 108 54
Seed Investments:Real estate . . . . . . . . . . . . . . . . . . . . . . . . . . . . . . . . . . . . . . . . . . . . . . . . . . . . . . . . . . . . . . . . . . . . . . . . . . . . . . . . . . . . . . . . . . . . . . . 30 32Public equity . . . . . . . . . . . . . . . . . . . . . . . . . . . . . . . . . . . . . . . . . . . . . . . . . . . . . . . . . . . . . . . . . . . . . . . . . . . . . . . . . . . . . . . . . . . . . 224 230Fixed income . . . . . . . . . . . . . . . . . . . . . . . . . . . . . . . . . . . . . . . . . . . . . . . . . . . . . . . . . . . . . . . . . . . . . . . . . . . . . . . . . . . . . . . . . . . . . 158 223
Loans Secured by Investor Equity Commitments or Fund Assets:Real estate secured by investor equity . . . . . . . . . . . . . . . . . . . . . . . . . . . . . . . . . . . . . . . . . . . . . . . . . . . . . . . . . . . . . . . . . . . . . . . . . 0 25Real estate secured by fund assets . . . . . . . . . . . . . . . . . . . . . . . . . . . . . . . . . . . . . . . . . . . . . . . . . . . . . . . . . . . . . . . . . . . . . . . . . . . . 0 0
Total . . . . . . . . . . . . . . . . . . . . . . . . . . . . . . . . . . . . . . . . . . . . . . . . . . . . . . . . . . . . . . . . . . . . . . . . . . . . . . . . . . . . . . . . . . . . . . . $862 $1,001
The $139 million decrease in strategic investments was primarily driven by returns of capital on real estate co-investments and fixedincome seed investments. In addition to the strategic investments above, the Asset Management segment’s commercial mortgageoperations maintains an interim loan portfolio. For additional details, see “—General Account Investments—Invested Assets of OtherEntities and Operations—Commercial Mortgage and Other Loans,” below.
U.S. Individual Life and Group Insurance Division
Individual Life
Operating Results
The following table sets forth the Individual Life segment’s operating results for the periods indicated.
Year ended December 31,
2013 2012 2011
(in millions)Operating results:
Revenues . . . . . . . . . . . . . . . . . . . . . . . . . . . . . . . . . . . . . . . . . . . . . . . . . . . . . . . . . . . . . . . . . . . . . . . . . . . . . . . . . . . . . . . $4,620 $3,367 $2,900Benefits and expenses . . . . . . . . . . . . . . . . . . . . . . . . . . . . . . . . . . . . . . . . . . . . . . . . . . . . . . . . . . . . . . . . . . . . . . . . . . . . . 4,037 2,983 2,418
Adjusted operating income . . . . . . . . . . . . . . . . . . . . . . . . . . . . . . . . . . . . . . . . . . . . . . . . . . . . . . . . . . . . . . . . . . . . . . . . . 583 384 482Realized investment gains (losses), net, and related adjustments . . . . . . . . . . . . . . . . . . . . . . . . . . . . . . . . . . . . . . . . (724) (38) (21)Related charges . . . . . . . . . . . . . . . . . . . . . . . . . . . . . . . . . . . . . . . . . . . . . . . . . . . . . . . . . . . . . . . . . . . . . . . . . . . . . . 286 0 0
Income from continuing operations before income taxes and equity in earnings of operating joint ventures . . . . . . . . . . $ 145 $ 346 $ 461
38 Prudential Financial, Inc. 2013 Annual Report

On January 2, 2013, we acquired the Hartford Life Business through a reinsurance transaction. We expect total pre-tax integrationcosts of approximately $120 million to be incurred through 2016, of which $51 million was incurred during 2013 and approximately $60million is expected to be incurred during 2014. After integration is complete, we expect annual cost savings of approximately $90 millionto be achieved by 2015 and, as of December 31, 2013, we have achieved approximately 65% of this annual savings on a run rate basis.Actual integration costs may exceed, and actual cost savings may fall short of, such expectations.
Adjusted Operating Income
2013 to 2012 Annual Comparison. Adjusted operating income increased $199 million, including a $54 million favorablecomparative change from the impact of certain changes in our estimated profitability of the business. These changes were based on ourannual reviews and updates of assumptions, which resulted in a $27 million net benefit in 2013 driven by a favorable mortality assumptionupdate compared to a $27 million net charge in the 2012 primarily related to reductions to the long-term interest rate and equity returnassumptions. In addition, 2013 also includes $51 million of integration costs associated with the Hartford Life acquisition compared to $20million of transaction and other costs in 2012.
Absent the effect of the items discussed above, adjusted operating income increased $176 million driven by approximately $157 million ofearnings from the acquired in force business and a favorable $77 million mortality variance. Mortality experience, net of reinsurance, wasfavorable relative to expected levels in the current year, compared to unfavorable in the prior year. These favorable items were partially offset byhigher distribution costs reflecting expanded third party distribution and increased sales, higher compensation expenses, and lower net investmentspread results driven by lower reinvestment rates, partially mitigated by higher income from non-coupon investments.
2012 to 2011 Annual Comparison. Adjusted operating income decreased $98 million including a $54 million unfavorablecomparative change from the impact of certain changes in the estimated profitability of the business. These changes were based on ourannual reviews and updates of assumptions, which resulted in a net charge of $27 million in 2012 driven by a reduction to long-terminterest rate and equity return assumptions and a net benefit of $27 million in 2011, driven by more favorable lapse and mortalityexperience. In addition, 2012 includes $20 million of transaction and other costs associated with the Hartford Life acquisition.
Absent the effect of the items discussed above, adjusted operating income decreased $24 million driven by a $13 million decrease inearnings reflecting the impact of mortality experience, net of reinsurance, which was more unfavorable in 2012, in comparison to 2011. Alsocontributing to the decrease in adjusted operating income was a decline in earnings from our variable products primarily due to the continuedexpected run-off of variable policies in force and lower net investment results from declines in portfolio reinvestment rates. Theseunfavorable items were partially offset by greater contributions from our universal life insurance products reflecting business growth.
Revenues, Benefits and Expenses
2013 to 2012 Annual Comparison. Revenues, as shown in the table above under “—Operating Results,” increased $1,253 million.Excluding the impact from our annual reviews and updates of assumptions discussed above, revenues increased $1,519 million. Policycharges and fees and asset management fees and other income increased $1,061 million primarily driven by business growth, particularlyfrom our universal life block of business, including the impact from the Hartford Life acquisition, partially offset by the continued expectedrun-off of variable life insurance in force. Net investment income increased $373 million reflecting business growth, including the impactof higher asset balances from the Hartford Life acquisition, and more favorable results from non-coupon investments, partially offset by theimpact of lower reinvestment rates.
Benefits and expenses, as shown in the table above under “—Operating Results,” increased $1,054 million. Excluding the impact ofour annual reviews and updates of assumptions, benefits and expenses increased $1,374 million. Policyholders’ benefits, including interestcredited to account balances, increased $930 million primarily due to growth of our universal life block of business, including the impact ofinsurance liabilities from the Hartford Life acquisition, partly offset by more favorable mortality experience, as discussed above. Generaland administrative expenses, net of capitalization, increased $348 million in the current year, primarily driven by Hartford Life Businessoperating expenses and integration costs, as well as higher distribution costs and compensation expenses.
2012 to 2011 Annual Comparison. Revenues increased $467 million. Excluding the impact from our annual reviews and updates ofassumptions discussed above, revenues increased $221 million. Policy charges and fees and asset management fees and other incomeincreased $157 million, primarily driven by business growth, particularly from our universal life block of business, partially offset by theongoing impact of run-off of variable life insurance in force, as well as a $73 million increase in income on an affiliated note received aspart of a financing transaction for certain regulatory capital requirements which was offset by higher interest expense, as mentioned below.Net investment income increased $55 million reflecting business growth, partially offset by the impact of lower reinvestment rates.
Benefits and expenses increased $565 million. Excluding the impact of our annual reviews and updates of assumptions, benefits andexpenses increased $265 million. Interest expense increased $102 million, reflecting higher costs associated with the financing ofregulatory capital requirements, and includes $73 million related to a financing transaction with an offset in revenue, as mentioned above.Policyholders’ benefits, including interest credited to account balances, increased $80 million driven by growth in our term and universallife blocks of business. General and administrative expenses, net of capitalization, increased $52 million, reflecting the impact of highersales and transaction and other costs associated with the Hartford Life acquisition.
Prudential Financial, Inc. 2013 Annual Report 39

Sales Results
The following table sets forth individual life insurance annualized new business premiums, as defined under “—Segment Measures”above, by distribution channel and product, for the periods indicated.
2013 2012 2011
PrudentialAgents
ThirdParty Total
PrudentialAgents
ThirdParty Total
PrudentialAgents
ThirdParty Total
(in millions)Variable Life . . . . . . . . . . . . . . . . . . . . . . . . . . . . . . . . . . . . $16 $ 22 $ 38 $13 $ 8 $ 21 $13 $ 12 $ 25Universal Life(1) . . . . . . . . . . . . . . . . . . . . . . . . . . . . . . . . . 40 457 497 38 180 218 28 67 95Term Life . . . . . . . . . . . . . . . . . . . . . . . . . . . . . . . . . . . . . . . 39 157 196 39 134 173 43 115 158
Total . . . . . . . . . . . . . . . . . . . . . . . . . . . . . . . . . . . . . . . $95 $636 $731 $90 $322 $412 $84 $194 $278
(1) Single pay life annualized new business premiums, which include 10% of excess (unscheduled) premiums, represented approximately 33%, 32% and22% of Universal Life annualized new business premiums for the years ended December 31, 2013, 2012 and 2011, respectively.
2013 to 2012 Annual Comparison. Annualized new business premiums increased $319 million, primarily driven by a $279 millionincrease in sales of universal life insurance products due to expanded distribution as a result of the acquisition of the Hartford LifeBusiness, particularly through institutional channels, as well as changes in the competitive positioning of our products. Most of thisuniversal life sales increase is from products with secondary, or “no lapse”, guarantees. As a result of recent pricing and other actionstaken, we do not expect a continuation of 2013 sales levels; however, we have been experiencing an increase in sales of other universal lifeinsurance products positioned as alternatives to those products with no lapse guarantees.
2012 to 2011 Annual Comparison. Annualized new business premiums increased $134 million, primarily driven by increased salesof universal life insurance products in the third party distribution channel due to changes in the competitive positioning of our products.
Group Insurance
Operating Results
The following table sets forth the Group Insurance segment’s operating results for the periods indicated.
Year ended December 31,
2013 2012 2011
(in millions)Operating results:
Revenues . . . . . . . . . . . . . . . . . . . . . . . . . . . . . . . . . . . . . . . . . . . . . . . . . . . . . . . . . . . . . . . . . . . . . . . . . . . . . . . . . . . . . . . $5,518 $5,601 $5,606Benefits and expenses . . . . . . . . . . . . . . . . . . . . . . . . . . . . . . . . . . . . . . . . . . . . . . . . . . . . . . . . . . . . . . . . . . . . . . . . . . . . . 5,361 5,585 5,443
Adjusted operating income . . . . . . . . . . . . . . . . . . . . . . . . . . . . . . . . . . . . . . . . . . . . . . . . . . . . . . . . . . . . . . . . . . . . . . . . . 157 16 163Realized investment gains (losses), net, and related adjustments . . . . . . . . . . . . . . . . . . . . . . . . . . . . . . . . . . . . . . . . (24) (8) 11Related charges . . . . . . . . . . . . . . . . . . . . . . . . . . . . . . . . . . . . . . . . . . . . . . . . . . . . . . . . . . . . . . . . . . . . . . . . . . . . . . (5) 0 (2)
Income from continuing operations before income taxes and equity in earnings of operating joint ventures . . . . . . . . . . $ 128 $ 8 $ 172
Adjusted Operating Income
2013 to 2012 Annual Comparison. Adjusted operating income increased $141 million reflecting a greater benefit from the impacts ofannual reviews and updates of assumptions and other refinements. Results for 2013 included a $45 million net benefit from these updates,primarily driven by the impact of favorable updates to actuarial assumptions used in calculating certain group life and group disabilityreserves, compared to a $7 million net benefit from these updates in 2012. Excluding these impacts, adjusted operating income increased$103 million primarily driven by more favorable underwriting results in both our group life and group disability businesses. For our grouplife business, more favorable underwriting results were driven by lower claim severity for non-experience-rated contracts, partly due toadverse claim severity that occurred in the first quarter of 2012. For our group disability business, more favorable underwriting results weredriven by higher claim resolutions and reduced claim incidence for long-term disability contracts. Our general and administrative expenseswere essentially flat, as higher compensation costs and other costs to support business initiatives were offset by lower expenses associatedwith updates to premium tax estimates, as well as the absence of costs related to an increase in legal reserves and other costs in 2012.
2012 to 2011 Annual Comparison. Adjusted operating income decreased $147 million reflecting higher operating expenses in 2012 primarilyfrom an increase in legal reserves, updates to premium tax estimates, and costs for strategic initiatives. Group life underwriting results were lessfavorable in 2012, primarily driven by unfavorable claims experience on non-experience-rated contracts resulting from an increase in severity,partially offset by lower claims incidence. The unfavorable underwriting results for group life also reflected the absence of a benefit from cumulativepremium adjustments in 2011. Group disability underwriting results were also less favorable in 2012, as new long term disability claims outpaced anincrease in claim resolutions. Also, reserve refinements in both group life and group disability businesses, including the impact of annual actuarialassumption updates, contributed a $7 million benefit to adjusted operating income in 2012 compared to a benefit of $22 million in 2011. Partiallyoffsetting these unfavorable items was improved investment income in 2012 primarily from non-coupon investments.
Revenues, Benefits and Expenses
2013 to 2012 Annual Comparison. Revenues, as shown in the table above under “—Operating Results,” decreased $83 million.Excluding a decrease of $44 million resulting from the impacts of annual reviews and updates of assumptions and other refinementsdiscussed above, revenues decreased $39 million. The decrease reflects $50 million lower premiums and policy charges and fee income
40 Prudential Financial, Inc. 2013 Annual Report

driven by net declines in both our group life and group disability businesses. For our group life business, the decline reflects a decreasefrom lapses of non-experience-rated contracts, partially offset by an increase from experience-rated contracts primarily driven byunfavorable claim experience. For our disability business, the decline was driven by our enhanced pricing discipline.
Benefits and expenses, as shown in the table above under “—Operating Results,” decreased $224 million. Excluding an $82 million decreaseresulting from the impacts of annual reviews and updates of assumptions and other refinements discussed above, benefits and expenses decreased$142 million. Policyholders’ benefits, including the change in reserves, decreased $147 million, driven by declines in both our group life and groupdisability businesses. The decline in our group life business reflects a decrease from non- experience-rated contracts due to lower claim severity andincreased lapses, partially offset by an increase from experience-rated contracts, driven by unfavorable claim experience. The decline in our groupdisability business reflects higher claim resolutions and reduced claim incidence for long-term contracts. Our general and administrative expenseswere essentially flat, as higher compensation costs and other costs to support business initiatives were offset by lower expenses associated withupdates to premium tax estimates, as well as the absence of costs related to an increase in legal reserves and other costs in 2012.
2012 to 2011 Annual Comparison. Revenues decreased $5 million. Premiums and policy charges and fee income decreased $40 million, drivenby a decrease in our group life business, partially offset by an increase in our group disability business. The decrease in our group life business primarilyreflected lower premiums from experience-rated contracts, largely resulting from a decrease in policyholder benefits. Partially offsetting this decreasewere higher premiums from non-experience-rated contracts reflecting growth in the business, partially offset by the benefit from cumulative premiumadjustments in 2011. The increase in our group disability business primarily reflected growth of business in force and new sales. Net investment incomealso increased in 2012 primarily from income on non-coupon investments, partially offset by a decline in reinvestment rates.
Benefits and expenses increased $142 million. Excluding a $15 million increase resulting from the impacts of annual reviews andupdates of assumptions discussed above, benefits and expenses increased $127 million. General and administrative expenses increased $82million, reflecting higher operating expenses primarily from an increase in legal reserves, updates to premium tax estimates and costs ofstrategic initiatives. Policyholders’ benefits, including the change in reserves, increased $39 million reflecting an increase in our groupdisability business, partially offset by a decrease in our group life business. The increase in our group disability business was driven by anincrease in the incidence and severity of long-term disability claims and growth in the business. The decrease in our group life business wasdriven by reduction in benefits costs on experience-rated business, partially offset by unfavorable claims experience from an increase inseverity resulting in an increase in benefits from growth in our non-experience-rated business.
Benefits and Expense Ratios
The following table sets forth the Group Insurance segment’s benefits and administrative operating expense ratios for the periodsindicated.
Year ended December 31,
2013 2012 2011Benefits ratio(1):
Group life . . . . . . . . . . . . . . . . . . . . . . . . . . . . . . . . . . . . . . . . . . . . . . . . . . . . . . . . . . . . . . . . . . . . . . . . . . . . . . . . . . . . . . 88.5% 90.9% 89.5%Group disability . . . . . . . . . . . . . . . . . . . . . . . . . . . . . . . . . . . . . . . . . . . . . . . . . . . . . . . . . . . . . . . . . . . . . . . . . . . . . . . . . 92.8% 98.1% 94.7%
Administrative operating expense ratio(2):Group life . . . . . . . . . . . . . . . . . . . . . . . . . . . . . . . . . . . . . . . . . . . . . . . . . . . . . . . . . . . . . . . . . . . . . . . . . . . . . . . . . . . . . . 10.1% 10.0% 8.5%Group disability . . . . . . . . . . . . . . . . . . . . . . . . . . . . . . . . . . . . . . . . . . . . . . . . . . . . . . . . . . . . . . . . . . . . . . . . . . . . . . . . . 26.6% 25.3% 24.8%
(1) Ratio of policyholder benefits to earned premiums, policy charges and fee income. Group disability ratios include dental products.(2) Ratio of general and administrative expenses (excluding commissions) to gross premiums plus policy charges and fee income. Group disability ratios
include dental products.
2013 to 2012 Annual Comparison. The group life benefits ratio improved 2.4 percentage points primarily driven by the favorableimpacts of annual reviews and updates of assumptions discussed above, as well as lower claim severity for non-experience-rated contracts.The group disability benefits ratio improved 5.3 percentage points primarily driven by the favorable impacts of annual reviews and updatesof assumptions discussed above, as well as higher claim resolutions and reduced claim incidence for long-term disability contracts. Thegroup life administrative operating expense ratio was essentially unchanged. The group disability administrative operating expense ratiodeteriorated 1.3 percentage points reflecting an increase in operating costs associated with our claims management process.
2012 to 2011 Annual Comparison. The group life benefits ratio deteriorated 1.4 percentage points primarily due to less favorable claimsexperience in the non-experience-rated business, as well as the unfavorable impact of reserve refinements and the cumulative premium adjustment in2011, as discussed above. The group disability benefits ratio deteriorated 3.4 percentage points primarily due to an increase in the incidence andseverity of long-term disability claims experience. The group life administrative operating expense ratio deteriorated 1.5 percentage points primarilydue to an increase in operating costs, legal reserves and the unfavorable comparative impact of updates to premium tax estimates, as discussed above.The group disability administrative operating expense ratio deteriorated 0.5 percentage points due to an increase in operating costs, as discussed above.
Sales Results
The following table sets forth the Group Insurance segment’s annualized new business premiums for the periods indicated.
Year ended December 31,
2013 2012 2011
(in millions)Annualized new business premiums(1):
Group life . . . . . . . . . . . . . . . . . . . . . . . . . . . . . . . . . . . . . . . . . . . . . . . . . . . . . . . . . . . . . . . . . . . . . . . . . . . . . . . . . . . . . . $240 $304 $486Group disability . . . . . . . . . . . . . . . . . . . . . . . . . . . . . . . . . . . . . . . . . . . . . . . . . . . . . . . . . . . . . . . . . . . . . . . . . . . . . . . . . 73 135 149
Total . . . . . . . . . . . . . . . . . . . . . . . . . . . . . . . . . . . . . . . . . . . . . . . . . . . . . . . . . . . . . . . . . . . . . . . . . . . . . . . . . . . . . . $313 $439 $635
Prudential Financial, Inc. 2013 Annual Report 41

(1) Amounts exclude new premiums resulting from rate changes on existing policies, from additional coverage under our Servicemembers’ Group LifeInsurance contract and from excess premiums on group universal life insurance that build cash value but do not purchase face amounts.
2013 to 2012 Annual Comparison. Total annualized new business premiums decreased $126 million primarily driven byenhancements in our pricing discipline for both group life and group disability products, which had an immediate impact on new sales.
2012 to 2011 Annual Comparison. Total annualized new business premiums decreased $196 million reflecting the impact of a largemarket case sale to a new customer in 2011 in group life, as well as a decrease in sales of long-term disability to existing clients.
International Insurance Division
Foreign Currency Exchange Rate Movements and Related Hedging Strategies
As a U.S.-based company with significant business operations outside the U.S., particularly in Japan, we are subject to foreigncurrency exchange rate movements that could impact our U.S. dollar-equivalent shareholder return on equity. We seek to mitigate thisimpact through various hedging strategies, including the use of derivative contracts and through holding U.S. dollar-denominated assets incertain of our foreign subsidiaries.
The operations of our International Insurance Division are subject to currency fluctuations that can materially affect our U.S. dollar-equivalent earnings from period to period, even if earnings on a local currency basis are relatively constant. We enter into forward currencyderivative contracts as part of our strategy to effectively fix the currency exchange rates for a portion of our prospective non-U.S. dollar-denominated earnings streams, thereby reducing earnings volatility from foreign currency exchange rate movements. The forward currencyhedging program is primarily associated with our insurance operations in Japan and Korea. Separately, our Japanese insurance operations offer avariety of non-yen denominated products which are supported by investments in corresponding currencies. While these non-yen denominatedassets and liabilities are economically matched, the accounting for changes in the value of these assets and liabilities due to changes in foreigncurrency exchange rate movements differs, resulting in volatility in reported U.S. GAAP earnings. For further information on the hedgingstrategies used to mitigate the risks of foreign currency exchange rate movements on earnings as well as the U.S. GAAP earnings impact fromproducts denominated in non-local currencies, see “—Impact of foreign currency exchange rate movements on earnings.”
We utilize a yen hedging strategy that calibrates the hedge level to preserve the relative contribution of our yen-based business to theCompany’s overall return on equity. We implement this hedging strategy utilizing a variety of instruments, including foreign currencyderivative contracts, as discussed above, as well as U.S. dollar-denominated assets and, to a lesser extent, “dual currency” and “syntheticdual currency” assets held locally in our Japanese insurance subsidiaries. We may also hedge using instruments held in our U.S. domiciledentities, such as U.S. dollar-denominated debt that has been swapped to yen.
The table below presents the aggregate amount of instruments that serve to hedge the impact of foreign currency exchange movementson our U.S. dollar-equivalent shareholder return on equity from our Japanese insurance subsidiaries for the periods indicated.
December 31,
2013 2012
(in billions)Instruments hedging foreign currency exchange rate exposure on U.S. dollar-equivalent earnings:
Forward currency hedging program(1) . . . . . . . . . . . . . . . . . . . . . . . . . . . . . . . . . . . . . . . . . . . . . . . . . . . . . . . . . . . . . . . . . . . . . $ 2.7 $ 2.9
Instruments hedging foreign currency exchange rate exposure on U.S. dollar-equivalent equity:U.S. dollar-denominated assets held in yen-based entities(2):
Available-for-sale U.S. dollar-denominated investments, at amortized cost . . . . . . . . . . . . . . . . . . . . . . . . . . . . . . . . . . . . . . . . 8.1 7.0Held-to-maturity U.S. dollar-denominated investments, at amortized cost . . . . . . . . . . . . . . . . . . . . . . . . . . . . . . . . . . . . . . . . . 0.2 0.3Other . . . . . . . . . . . . . . . . . . . . . . . . . . . . . . . . . . . . . . . . . . . . . . . . . . . . . . . . . . . . . . . . . . . . . . . . . . . . . . . . . . . . . . . . . . . . . . . 0.1 0.1
Subtotal . . . . . . . . . . . . . . . . . . . . . . . . . . . . . . . . . . . . . . . . . . . . . . . . . . . . . . . . . . . . . . . . . . . . . . . . . . . . . . . . . . . . . . . . . 8.4 7.4Yen-denominated liabilities held in U.S. dollar-based entities(3) . . . . . . . . . . . . . . . . . . . . . . . . . . . . . . . . . . . . . . . . . . . . . . . . . . . . 0.8 0.8Dual currency and synthetic dual currency investments(4) . . . . . . . . . . . . . . . . . . . . . . . . . . . . . . . . . . . . . . . . . . . . . . . . . . . . . . . . . 0.9 0.9
Total instruments hedging foreign currency exchange rate exposure on U.S. dollar-equivalent equity . . . . . . . . . . . . . . . . . . . . . . . 10.1 9.1
Total hedges . . . . . . . . . . . . . . . . . . . . . . . . . . . . . . . . . . . . . . . . . . . . . . . . . . . . . . . . . . . . . . . . . . . . . . . . . . . . . . . . . . . . . . . . . . . . . . . . . $12.8 $12.0
(1) Represents the notional amount of forward currency contracts outstanding.(2) Excludes $27.6 billion and $26.8 billion as of December 31, 2013 and 2012, respectively, of U.S. dollar assets supporting U.S. dollar liabilities related
to U.S. dollar-denominated products issued by our Japanese insurance operations.(3) The yen-denominated liabilities are reported in Corporate and Other operations.(4) Dual currency and synthetic dual currency investments are held by our yen-based entities in the form of fixed maturities and loans with a yen-denominated
principal component and U.S. dollar-denominated interest income. The amounts shown represent the present value of future U.S. dollar cash flows.
The U.S. dollar-denominated investments that hedge the U.S. dollar-equivalent shareholder return on equity from our Japaneseinsurance operations are recorded on the books of yen-based entities and, as a result, foreign currency exchange rate movements willimpact their value on the local books of our yen-based Japanese insurance entities. We seek to mitigate the risk that future unfavorableforeign currency exchange rate movements will decrease the value of these U.S. dollar-denominated investments on the local books of ouryen-based Japanese insurance entities and therefore negatively impact their equity and regulatory solvency margins by employing internalhedging strategies between a subsidiary of Prudential Financial and these yen-based entities. These internal hedging strategies have theeconomic effect of moving the change in value of these U.S. dollar-denominated investments due to foreign currency exchange ratemovements from our Japanese yen-based entities to our U.S. dollar-based entities. See “—Liquidity and Capital Resources—Liquidity—Liquidity associated with other activities—Foreign exchange hedging activities” for a discussion of our internal hedging strategies.
42 Prudential Financial, Inc. 2013 Annual Report

These U.S. dollar-denominated investments also pay a coupon which is generally higher than what a similar yen-denominatedinvestment would pay. The incremental impact of this higher yield on our U.S. dollar-denominated investments, as well as our dualcurrency and synthetic dual currency investments discussed below, will vary over time, and is dependent on the duration of the underlyinginvestments, as well as interest rate environments in the U.S. and Japan at the time of the investments. See “—General AccountInvestments—Investment Results” for a discussion of the investment yields generated by our Japanese insurance operations.
Impact of foreign currency exchange rate movements on earnings
Forward currency hedging programThe financial results of our International Insurance segment reflect the impact of an intercompany arrangement with Corporate and
Other operations pursuant to which the segment’s non-U.S. dollar-denominated earnings are translated at fixed currency exchange rates.The fixed rates are determined in connection with a foreign currency income hedging program designed to mitigate the impact of exchangerate changes on the segment’s U.S. dollar-equivalent earnings. Pursuant to this program, Corporate and Other operations execute forwardcurrency contracts with third parties to sell the net exposure of projected earnings for certain currencies in exchange for U.S. dollars atspecified exchange rates. The maturities of these contracts correspond with the future periods (typically on a three-year rolling basis) inwhich the identified non-U.S. dollar-denominated earnings are expected to be generated. In establishing the level of non-U.S. dollar-denominated earnings that will be hedged through this program, we exclude the anticipated level of U.S. dollar-denominated earnings thatwill be generated by dual currency and synthetic dual currency investments, as well as the anticipated level of non-yen denominatedearnings that will be generated by non-yen denominated products and investments. As of December 31, 2013, we have hedged 100%, 72%and 28% of expected yen-based earnings for 2014, 2015 and 2016, respectively. To the extent currently unhedged, our InternationalInsurance segment’s future expected U.S. dollar-equivalent earnings will be impacted by yen exchange rate movements.
As a result of this intercompany arrangement, our International Insurance segment’s results for 2011, 2012 and 2013 reflect the impactof translating yen-denominated earnings at fixed currency exchange rates of 92, 85 and 80 yen per U.S. dollar, respectively, and Koreanwon-denominated earnings at fixed currency exchange rates of 1190, 1180 and 1160 Korean won per U.S. dollar, respectively. Results for2014 will reflect the impact of translating yen and Korean won-denominated earnings at fixed currency exchange rates of 82 yen perU.S. dollar and 1150 Korean won per U.S. dollar, respectively.
Results of Corporate and Other operations include any differences between the translation adjustments recorded by the segment at thefixed currency exchange rate versus the actual average rate during the period, and the gains or losses recorded from the forward currencycontracts that settled during the period, which include the impact of any over or under hedging of actual earnings that differ from projectedearnings. The table below presents, for the periods indicated, the increase (decrease) to revenues and adjusted operating income for theInternational Insurance segment and for Corporate and Other operations, reflecting the impact of this intercompany arrangement.
Year ended December 31,
2013 2012 2011
(in millions)International Insurance Segment:
Impact of intercompany arrangement(1) . . . . . . . . . . . . . . . . . . . . . . . . . . . . . . . . . . . . . . . . . . . . . . . . . . . . . . . . . . . . . . . $ 222 $(92) $(178)Corporate and Other operations:
Impact of intercompany arrangement(1) . . . . . . . . . . . . . . . . . . . . . . . . . . . . . . . . . . . . . . . . . . . . . . . . . . . . . . . . . . . . . . . (222) 92 178Settlement gains (losses) on forward currency contracts . . . . . . . . . . . . . . . . . . . . . . . . . . . . . . . . . . . . . . . . . . . . . . . . . . 240 (72) (137)
Net benefit to Corporate and Other operations . . . . . . . . . . . . . . . . . . . . . . . . . . . . . . . . . . . . . . . . . . . . . . . . . . . . . . 18 20 41
Net impact on consolidated revenues and adjusted operating income . . . . . . . . . . . . . . . . . . . . . . . . . . . . . . . . . . . . . . . . . . . . $ 240 $(72) $(137)
(1) Represents the difference between non-U.S. dollar-denominated earnings translated on the basis of weighted average monthly currency exchange ratesversus fixed currency exchange rates determined in connection with the forward currency hedging program.
As of December 31, 2013 and 2012, the notional amounts of these forward currency contracts were $3.3 billion and $3.4 billion,respectively, of which $2.7 billion and $2.9 billion, respectively, were related to our Japanese insurance operations.
U.S. GAAP earnings impact of products denominated in non-local currenciesOur international insurance operations primarily offer products denominated in local currency. However, several of our international
insurance operations, most notably our Japanese operations, also offer products denominated in non-local currencies, primarily comprised of U.S.and Australian dollar-denominated products. The non-yen denominated insurance liabilities related to these products are supported byinvestments denominated in corresponding currencies, including a significant portion designated as available-for-sale. While the impact fromforeign currency exchange rate movements on these non-yen denominated assets and liabilities is economically matched, the accounting forchanges in the value of these assets and liabilities due to changes in foreign currency exchange rate movements differs, resulting in volatility inU.S. GAAP earnings. For example, unrealized gains and losses on available-for-sale investments, including those arising from foreign currencyexchange rate movements, are recorded in AOCI, whereas the non-yen denominated liabilities are remeasured for foreign currency exchange ratemovements, and the related changes in value are recorded in earnings within “Asset management fees and other income.” Investments designatedas held-to-maturity under U.S. GAAP are recorded at amortized cost on the balance sheet, but are remeasured for foreign currency exchange ratemovements, with the related change in value recorded in earnings within “Asset management fees and other income.” Due to this non-economicvolatility that is reflected in U.S. GAAP earnings, the gains and losses resulting from the remeasurement of these non-yen denominatedliabilities, and certain related non-yen denominated assets, are excluded from adjusted operating income and included in “Realized investmentgains (losses), net, and related adjustments.” For the years ended December 31, 2013, 2012 and 2011, “Realized investment gains (losses), net,and related adjustments” includes net losses of $3,962 million, net losses of $1,570 million and net gains of $807 million, respectively, reflectingthe remeasurement of these non-yen denominated insurance liabilities and certain related non-yen denominated assets.
The following table presents these non-yen denominated insurance liabilities and related non-yen denominated assets subject to remeasurementthrough earnings within our international insurance operations as of December 31, 2013 as well as the impact to pre-tax U.S. GAAP earnings assuminga hypothetical 5% depreciation/appreciation in value of the yen relative to the applicable currency based on balances as of December 31, 2013.
Prudential Financial, Inc. 2013 Annual Report 43

As discussed in Note 1, Gibraltar Life’s current period results of operations represent earnings through November 30, 2013 andGibraltar Life’s current period assets and liabilities represent balances as of November 30, 2013.
Balances subject to remeasurement,as of December 31, 2013
Hypothetical increase (decrease)in pre-tax GAAP earnings(2)
Assets(1) Liabilities Net Liabilities(1) 5% depreciation 5% appreciation
(in billions)U.S. dollar-denominated balances(3) . . . . . . . . . . . . . . . . . . . . . . . . . $3.1 $20.3 $17.2 $(0.9) $0.9Australian dollar-denominated balances . . . . . . . . . . . . . . . . . . . . . . 0.5 7.6 7.1 (0.4) 0.4Euro-denominated balances . . . . . . . . . . . . . . . . . . . . . . . . . . . . . . . . 0.1 0.3 0.2 (0.0) 0.0
Total . . . . . . . . . . . . . . . . . . . . . . . . . . . . . . . . . . . . . . . . . . . . . . $3.7 $28.2 $24.5 $(1.3) $1.3
(1) Includes investments designated as held-to-maturity that are remeasured for foreign currency exchange rate movements with the change in valuerecorded in U.S. GAAP earnings; excludes $26.7 billion of available-for-sale investments supporting these non-yen denominated insurance liabilitiesfor which the impact from foreign currency exchange rate movements is recorded in AOCI.
(2) The GAAP earnings impacts would largely be offset by a corresponding increase (decrease) in AOCI.(3) Excludes $6.5 billion of insurance liabilities for U.S. dollar-denominated products associated with Prudential of Japan. These liabilities are coinsured to an affiliated
U.S. domiciled insurance entity and supported by U.S. dollar-denominated assets and, as a result, are not subject to the remeasurement mismatch described above.
International Insurance
Operating ResultsThe results of our International Insurance operations are translated on the basis of weighted average monthly exchange rates, inclusive
of the effects of the intercompany arrangement discussed above. To provide a better understanding of operating performance within theInternational Insurance segment, where indicated below, we have analyzed our results of operations excluding the effect of the year overyear change in foreign currency exchange rates. Our results of operations, excluding the effect of foreign currency fluctuations, werederived by translating foreign currencies to U.S. dollars at uniform exchange rates for all periods presented, including for constant dollarinformation discussed below. The exchange rates used were Japanese yen at a rate of 82 yen per U.S. dollar and Korean won at a rate of1150 won per U.S. dollar, both of which were determined in connection with the foreign currency income hedging program discussedabove. In addition, for constant dollar information discussed below, activity denominated in U.S. dollars is generally reported based on theamounts as transacted in U.S. dollars. Annualized new business premiums presented on a constant exchange rate basis in the “SalesResults” section below reflect translation based on these same uniform exchange rates.
The following table sets forth the International Insurance segment’s operating results for the periods indicated.
Year ended December 31,
2013 2012 2011
(in millions)Operating results:
Revenues:Life Planner operations . . . . . . . . . . . . . . . . . . . . . . . . . . . . . . . . . . . . . . . . . . . . . . . . . . . . . . . . . . . . . . . . . . . . . . . . . . . $ 8,978 $ 9,002 $ 8,202Gibraltar Life and Other operations . . . . . . . . . . . . . . . . . . . . . . . . . . . . . . . . . . . . . . . . . . . . . . . . . . . . . . . . . . . . . . . . . 13,562 20,584 11,365
Total revenues . . . . . . . . . . . . . . . . . . . . . . . . . . . . . . . . . . . . . . . . . . . . . . . . . . . . . . . . . . . . . . . . . . . . . . . . . . . . . . 22,540 29,586 19,567
Benefits and expenses:Life Planner operations . . . . . . . . . . . . . . . . . . . . . . . . . . . . . . . . . . . . . . . . . . . . . . . . . . . . . . . . . . . . . . . . . . . . . . . . . . . 7,461 7,521 6,956Gibraltar Life and Other operations . . . . . . . . . . . . . . . . . . . . . . . . . . . . . . . . . . . . . . . . . . . . . . . . . . . . . . . . . . . . . . . . . 11,927 19,361 10,348
Total benefits and expenses . . . . . . . . . . . . . . . . . . . . . . . . . . . . . . . . . . . . . . . . . . . . . . . . . . . . . . . . . . . . . . . . . . . 19,388 26,882 17,304
Adjusted operating income:Life Planner operations . . . . . . . . . . . . . . . . . . . . . . . . . . . . . . . . . . . . . . . . . . . . . . . . . . . . . . . . . . . . . . . . . . . . . . . . . . . 1,517 1,481 1,246Gibraltar Life and Other operations . . . . . . . . . . . . . . . . . . . . . . . . . . . . . . . . . . . . . . . . . . . . . . . . . . . . . . . . . . . . . . . . . 1,635 1,223 1,017
Total adjusted operating income . . . . . . . . . . . . . . . . . . . . . . . . . . . . . . . . . . . . . . . . . . . . . . . . . . . . . . . . . . . . . . . . 3,152 2,704 2,263
Realized investment gains (losses), net, and related adjustments(1) . . . . . . . . . . . . . . . . . . . . . . . . . . . . . . . . . . . . . . . . (4,065) (1,989) 596Related charges . . . . . . . . . . . . . . . . . . . . . . . . . . . . . . . . . . . . . . . . . . . . . . . . . . . . . . . . . . . . . . . . . . . . . . . . . . . . . . . . . (140) (60) (18)Investment gains (losses) on trading account assets supporting insurance liabilities, net . . . . . . . . . . . . . . . . . . . . . . . . 468 204 (160)Change in experience-rated contractholder liabilities due to asset value changes . . . . . . . . . . . . . . . . . . . . . . . . . . . . . . (468) (204) 160Equity in earnings of operating joint ventures and earnings attributable to noncontrolling interests . . . . . . . . . . . . . . . . (63) (58) (244)
Income (loss) from continuing operations before income taxes and equity in earnings of operating joint ventures . . . . . . . . . . . . $ (1,116) $ 597 $ 2,597
(1) Includes gains and losses from changes in value of certain assets and liabilities relating to foreign currency exchange movements that are economicallymatched, as discussed above.
Adjusted Operating Income2013 to 2012 Annual Comparison. Adjusted operating income from Life Planner operations increased $36 million including a net favorable
impact of $51 million from currency fluctuations, inclusive of the currency hedging program discussed above. The current year includes a $78 millioncharge to strengthen reserves primarily for certain policies on a previously-acquired business based on an internal review. Both periods benefited from areduction in the amortization of deferred policy acquisition costs and lower reserves from our annual reviews and updates of assumptions used inestimating the profitability of our business, and other refinements. This resulted in a $19 million benefit in the current year, primarily driven by lowerlapse assumptions for variable and interest sensitive life insurance products, compared to a $20 million benefit in the prior year.
Excluding the effect of the items discussed above, adjusted operating income of our Life Planner operations increased $64 million.This increase primarily reflects growth of business in force driven by sales results and continued strong persistency, partly offset by lowercontributions from net investment spreads as a result of lower reinvestment rates.
44 Prudential Financial, Inc. 2013 Annual Report
Adjusted operating income from our Gibraltar Life and Other operations increased $412 million including a net favorable impact of $38million from currency fluctuations. The current year benefited from lower integration costs relating to the acquisition of the Star and EdisonBusinesses, for which we incurred $138 million in 2012 compared to $28 million in 2013. Adjusted operating income for both periodsreflects the impact from partial sales of our previous investment held in China Pacific Group, which contributed a $66 million gain in thecurrent year compared to a $60 million gain in the prior year. Partly offsetting these favorable variances is a $108 million charge in thecurrent year from our annual review and update of assumptions used in estimating the profitability of our business, and other refinements.This charge is primarily reflective of an increase in reserves for guaranteed minimum income benefit features on certain annuity productspreviously sold by the former Star and Edison Businesses, due to higher annuity election rates and lower assumed lapse rates.
Excluding the effect of the items discussed above, adjusted operating income from our Gibraltar Life and Other operations increased$366 million, primarily reflecting business growth, favorable results from non-coupon investments and $229 million of cost savingsresulting from Star and Edison integration synergies, compared to $165 million in the prior year. In addition, the current year benefitedfrom favorable mortality experience and accelerated earnings due to surrenders of fixed annuities denominated in Australian and U.S.dollars caused by the appreciation of these currencies relative to the Japanese yen.
2012 to 2011 Annual Comparison. Adjusted operating income from our Life Planner operations increased $235 million including anet favorable impact of $54 million from currency fluctuations. Results for 2012 benefited from a $20 million reduction in the amortizationof deferred policy acquisition costs and lower reserves, reflecting the impact of our annual review and update of assumptions used inestimating the profitability of the business. In addition, the increase in adjusted operating income reflects the absence of a $12 millioncharge associated with estimated claims and expenses arising from the 2011 earthquake in Japan and a $6 million benefit in 2012 resultingfrom a cash distribution received from the Japan Financial Stability Fund. Excluding the impact of these items, adjusted operating incomefor our Life Planner operations increased $143 million, primarily reflecting the growth of business in force driven by sales results andcontinued strong persistency in our Japanese Life Planner operation, partly offset by the impact of lower reinvestment rates.
Adjusted operating income from our Gibraltar Life and Other operations increased $206 million including a net favorable impact of $51million from currency fluctuations and the absence of a $49 million charge associated with claims and expenses arising from the 2011earthquake in Japan. Additionally, results for 2012 include $138 million of integration costs relating to the acquisition of the Star and EdisonBusinesses compared to $213 million of integration and transaction costs in 2011. Partly offsetting these favorable variances is a $15 millionnet charge in 2012 reflecting the impact of certain charges related to our life insurance joint venture in India offset by a cash distributionreceived from the Japan Financial Stability Fund. Both periods benefited from the impact of partial sales of our previous investment held inChina Pacific Group, which contributed a $60 million benefit to 2012 results compared to a $237 million benefit in 2011.
Excluding the effect of the items discussed above, adjusted operating income from our Gibraltar Life and Other operations increased$223 million, primarily reflecting cost savings of $165 million from Star and Edison integration synergies, compared to $21 million of costsavings in 2011, as well as business growth and the impact of including two additional months of earnings from the former Star and EdisonBusinesses. These favorable items were partly offset by higher benefits and expenses, including costs supporting distribution channelgrowth, less favorable mortality in comparison to the prior year and the impact of lower reinvestment rates.
Revenues, Benefits and Expenses
2013 to 2012 Annual Comparison. Revenues from our Life Planner operations, as shown in the table above under “—Operating Results,”decreased $24 million including a net unfavorable impact of $749 million from currency fluctuations. Excluding the impact of currencyfluctuations, revenues increased $725 million. This increase in revenues came primarily from increases in premiums and policy charges and feeincome of $584 million driven by growth of business in force in our Japanese Life Planner operation. In addition, net investment incomeincreased $146 million primarily reflecting investment portfolio growth, partly offset by the impact from lower reinvestment rates.
Benefits and expenses from our Life Planner operations, as shown in the table above under “—Operating Results,” decreased $60million including a net favorable impact of $800 million from currency fluctuations. Excluding the impact of currency fluctuations, benefitsand expenses increased $740 million. This increase in expenses primarily reflects a $597 million increase in policyholder benefits,including changes in reserves, driven by business growth as well as reserve strengthening on certain policies based on an internal review.The amortization of DAC increased $59 million primarily reflecting the growth of business in force. In addition, general and administrativeexpenses, net of capitalization, increased $52 million driven by distribution growth and technology expenditures.
Revenues from our Gibraltar Life and Other operations decreased $7,022 million, including a net unfavorable impact of $1,779 million fromcurrency fluctuations. Excluding the impact of currency fluctuations, revenues for Gibraltar Life decreased $5,243 million. This decrease reflects a$5,391 million decrease in premiums and policy charges and fee income, with a related decline in policyholder benefits, largely reflecting lowersales of yen-denominated single premium reduced death benefit whole life policies in the bank channel, as discussed further under “—Sales Results”below, partly offset by increased renewal premiums in the Independent Agency and Life Consultant distribution channels. Net investment incomeincreased $270 million primarily reflecting portfolio growth and favorable results from non-coupon investments.
Benefits and expenses of our Gibraltar Life and Other operations decreased $7,434 million including a net favorable impact of$1,817 million from currency fluctuations. Excluding the impact of currency fluctuations, benefits and expenses decreased $5,617 million.Policyholder benefits, including changes in reserves, decreased $5,332 million, with a related decline in premiums and policy charges andfee income, driven by lower sales of yen-denominated single premium reduced death benefit whole life policies. In addition, general andadministrative expenses, net of capitalization, decreased $289 million primarily driven by lower integration costs and higher integrationsynergies relating to the acquisition of the Star and Edison Businesses.
2012 to 2011 Annual Comparison. Revenues from our Life Planner operations increased $800 million including a net favorable impact of$15 million from currency fluctuations. Excluding currency fluctuations, revenues increased $785 million primarily reflecting increases in premiums andpolicy charges and fee income of $604 million driven by growth of business in force and continued strong persistency in our Japanese Life Planneroperation. Net investment income increased $155 million reflecting investment portfolio growth, partially offset by the impact of lower reinvestment rates.
Prudential Financial, Inc. 2013 Annual Report 45

Benefits and expenses of our Life Planner operations increased $565 million including a net favorable impact of $39 million from currencyfluctuations. Excluding currency fluctuations, benefits and expenses increased $604 million. Benefits and expenses of our Japanese Life Planneroperation increased $504 million, primarily reflecting an increase in policyholder benefits due to changes in reserves driven by the growth inbusiness in force, partially offset by the absence of charges recognized in 2011 associated with claims from the 2011 earthquake in Japan.Additionally, 2012 includes a $20 million benefit from a reduction in the amortization of deferred policy acquisition costs and lower reserves,reflecting the impact of our annual review and update of assumptions used in estimating the profitability of the business.
Revenues from our Gibraltar Life and Other operations increased $9,219 million including a net favorable impact of $339 millionfrom currency fluctuations. Excluding currency fluctuations, revenues increased $8,880 million. This increase is driven by an $8,683million increase in premiums and policy charges and fee income reflecting growth in the bank distribution channel, particularly from salesof yen-denominated single premium reduced death benefit whole life policies and, to a lesser extent, increased sales of cancer whole lifeand U.S. dollar-denominated retirement income products in the Life Consultant distribution channel. Also contributing to the increase inrevenues is higher net investment income of $362 million primarily reflecting investment portfolio growth, partially offset by the impact oflower reinvestment rates. Asset management fees and other income declined driven by the comparative impact of partial sales of ourprevious investment held in China Pacific Group, which resulted in a $60 million gain in 2012 compared to a $237 million gain in 2011,partially offset by the distribution received in 2012 from the Japan Financial Stability Fund.
Benefits and expenses of our Gibraltar Life and Other operations increased $9,013 million, including a net unfavorable impact of $288million from currency fluctuations. Excluding currency fluctuations, benefits and expenses increased $8,725 million. Policyholder benefits,including changes in reserves, increased $8,283 million primarily driven by higher sales of yen-denominated single premium reduced deathbenefit whole life, cancer whole life and U.S. dollar-denominated retirement income products in 2012, partially offset by the absence of chargesrecognized in 2011 associated with claims from the 2011 earthquake in Japan. General and administrative expenses, net of capitalization, andDAC amortization increased primarily due to increased costs supporting business growth and charges associated with our life insurance jointventure in India, partially offset by additional synergies and lower integration costs associated with the Star and Edison acquisition.
Sales Results
The following table sets forth annualized new business premiums, as defined under “—Segment measures” above, on an actual andconstant exchange rate basis for the periods indicated.
Year ended December 31,
2013 2012 2011
(in millions)Annualized new business premiums:
On an actual exchange rate basis:Life Planner operations . . . . . . . . . . . . . . . . . . . . . . . . . . . . . . . . . . . . . . . . . . . . . . . . . . . . . . . . . . . . . . . . . . . . . . . . . . . . $1,128 $1,354 $1,150Gibraltar Life . . . . . . . . . . . . . . . . . . . . . . . . . . . . . . . . . . . . . . . . . . . . . . . . . . . . . . . . . . . . . . . . . . . . . . . . . . . . . . . . . . . 1,756 2,724 2,042
Total . . . . . . . . . . . . . . . . . . . . . . . . . . . . . . . . . . . . . . . . . . . . . . . . . . . . . . . . . . . . . . . . . . . . . . . . . . . . . . . . . . . . . . $2,884 $4,078 $3,192
On a constant exchange rate basis:Life Planner operations . . . . . . . . . . . . . . . . . . . . . . . . . . . . . . . . . . . . . . . . . . . . . . . . . . . . . . . . . . . . . . . . . . . . . . . . . . . . $1,214 $1,321 $1,107Gibraltar Life . . . . . . . . . . . . . . . . . . . . . . . . . . . . . . . . . . . . . . . . . . . . . . . . . . . . . . . . . . . . . . . . . . . . . . . . . . . . . . . . . . . 1,904 2,635 1,976
Total . . . . . . . . . . . . . . . . . . . . . . . . . . . . . . . . . . . . . . . . . . . . . . . . . . . . . . . . . . . . . . . . . . . . . . . . . . . . . . . . . . . . . . $3,118 $3,956 $3,083
The amount of annualized new business premiums for any given period can be significantly impacted by several factors, including butnot limited to, changes in credited interest rates for certain products and other product modifications, changes in tax laws, changes in lifeinsurance regulations or changes in the competitive environment. Sales volume may increase or decrease prior to such changes becomingeffective, and then fluctuate in the other direction following such changes.
2013 to 2012 Annual Comparison. The table below presents annualized new business premiums on a constant exchange rate basis,by product and distribution channel, for the periods indicated.
Year Ended December 31, 2013 Year Ended December 31, 2012
Life
Accident&
HealthRetirement
(1) Annuity Total Life
Accident&
HealthRetirement
(1) Annuity Total
(in millions)Life Planners . . . . . . . . . . . . . . . . . . . . . . . . . . . . . $ 590 $110 $463 $ 51 $1,214 $ 479 $189 $581 $ 72 $1,321Gibraltar Life:
Life Consultants . . . . . . . . . . . . . . . . . . . . . . . 475 106 134 134 849 437 151 180 130 898Banks(2) . . . . . . . . . . . . . . . . . . . . . . . . . . . . . 701 2 9 105 817 1,228 36 12 110 1,386Independent Agency . . . . . . . . . . . . . . . . . . . . 99 35 71 33 238 77 197 50 27 351
Subtotal . . . . . . . . . . . . . . . . . . . . . . . . . . . . . . . . . 1,275 143 214 272 1,904 1,742 384 242 267 2,635Total . . . . . . . . . . . . . . . . . . . . . . . . . . . . . . . . $1,865 $253 $677 $323 $3,118 $2,221 $573 $823 $339 $3,956
(1) Includes retirement income, endowment and savings variable universal life.(2) Single pay life annualized new business premiums, which include 10% of first year premiums, and 3-year limited pay annualized new business
premiums, which include 100% of new business premiums, represented 39% and 44%, respectively, of total bank distribution channel annualized newbusiness premiums, excluding annuity products, for the year ended December 31, 2013, and 74% and 19%, respectively, of total bank distributionchannel annualized new business premiums, excluding annuity products, for the year ended December 31, 2012. Single pay and limited pay productsgenerally have less death benefit protection per premium paid than more traditional recurring premium products.
Annualized new business premiums, on a constant exchange rate basis, from our Life Planner operations decreased $107 milliondriven by a $108 million decrease in Japan. The decline in Japan primarily reflects accelerated sales of U.S. dollar-denominated retirement
46 Prudential Financial, Inc. 2013 Annual Report

income and cancer whole life products in 2012 prior to crediting rate and tax law changes, respectively. These declines were partly offsetby increased sales of protection and yen-denominated retirement income products in Japan. In addition, increased sales from growth of ourLife Planner operation in Brazil were offset by lower sales in Taiwan and Korea.
Annualized new business premiums, on a constant exchange rate basis, from our Gibraltar Life operations decreased $731 million.Bank channel sales declined $569 million reflecting lower sales of yen-denominated single premium reduced death benefit whole lifepolicies, partly offset by higher sales of recurring premium whole life products. Sales of the yen-denominated single premium reduceddeath benefit whole life product, which were suspended at the end of September 2013, were elevated in 2012 in anticipation of pricingchanges effective January 2013 as well as due to certain actions taken by our competitors. Independent Agency and Life Consultant salesdeclined $113 million and $49 million, respectively, driven by accelerated sales of cancer whole life and U.S. dollar-denominatedretirement income and whole life products in the prior year due to tax law and crediting rate changes, respectively.
2012 to 2011 Annual Comparison. The table below presents annualized new business premiums on a constant exchange rate basis,by product and distribution channel, for the periods indicated.
Year Ended December 31, 2012 Year Ended December 31, 2011
Life
Accident&
HealthRetirement
(1) Annuity Total Life
Accident&
HealthRetirement
(1) Annuity Total
(in millions)Life Planners . . . . . . . . . . . . . . . . . . . . . . . . . . . . . $ 479 $189 $581 $ 72 $1,321 $ 426 $177 $452 $ 52 $1,107Gibraltar Life:
Life Consultants . . . . . . . . . . . . . . . . . . . . . . . 437 151 180 130 898 426 201 127 189 943Banks(2) . . . . . . . . . . . . . . . . . . . . . . . . . . . . . 1,228 36 12 110 1,386 379 45 23 140 587Independent Agency . . . . . . . . . . . . . . . . . . . . 77 197 50 27 351 176 185 17 68 446
Subtotal . . . . . . . . . . . . . . . . . . . . . . . . . . . . . . . . . 1,742 384 242 267 2,635 981 431 167 397 1,976
Total . . . . . . . . . . . . . . . . . . . . . . . . . . . . . . . . $2,221 $573 $823 $339 $3,956 $1,407 $608 $619 $449 $3,083
(1) Includes retirement income, endowment and savings variable universal life.(2) Single pay life annualized new business premiums, which include 10% of first year premiums, and 3-year limited pay annualized new business
premiums, which include 100% of new business premiums, represented 74% and 19%, respectively, of total bank distribution channel annualized newbusiness premiums, excluding annuity products, for the year ended December 31, 2012, and 31% and 45%, respectively, of total bank distributionchannel annualized new business premiums, excluding annuity products, for the year ended December 31, 2011. Single pay and limited pay productsgenerally have less death benefit protection per premium paid than more traditional recurring premium products.
Annualized new business premiums, on a constant exchange rate basis, from our Life Planner operations increased $214 milliondriven by higher sales in Japan. Sales in Japan increased $177 million reflecting increased demand for U.S. dollar-denominated retirementincome products (prior to a crediting rate change in June 2012), cancer whole life products (prior to a tax law change in April 2012) andyen-denominated retirement income products in the corporate market. To a lesser extent, sales in Brazil, Korea, Taiwan and Italy increaseddue to growth and the introduction of new products into these markets.
Annualized new business premiums, on a constant exchange rate basis, from our Gibraltar Life operations increased $659 milliondriven by increased sales of $799 million in the bank channel distribution. Bank channel sales largely reflect higher sales of yen-denominated single premium reduced death benefit whole life policies in anticipation of pricing changes effective January 2013 as well asthe benefit from actions taken by certain of our competitors to limit sales and lower crediting rates on similar products. IndependentAgency and Life Consultant sales declined $95 million and $45 million, respectively, driven by the discontinuation of certain productspreviously offered by the former Star and Edison Businesses and the expected attrition of former Star and Edison Life Consultants. Thesedecreases were partly offset by higher sales of cancer whole life products prior to a tax law change in April 2012 as well as increaseddemand for U.S. dollar-denominated retirement income products prior to pricing changes in April 2012.
SalesforceThe following table sets forth the number of Life Planners and Life Consultants for the periods indicated.
As of December 31,
2013 2012 2011
Life Planners:Japan . . . . . . . . . . . . . . . . . . . . . . . . . . . . . . . . . . . . . . . . . . . . . . . . . . . . . . . . . . . . . . . . . . . . . . . . . . . . . . . . . . . . . . . . . . . 3,258 3,216 3,137All other countries . . . . . . . . . . . . . . . . . . . . . . . . . . . . . . . . . . . . . . . . . . . . . . . . . . . . . . . . . . . . . . . . . . . . . . . . . . . . . . . . . 3,990 3,842 3,655
Gibraltar Life Consultants . . . . . . . . . . . . . . . . . . . . . . . . . . . . . . . . . . . . . . . . . . . . . . . . . . . . . . . . . . . . . . . . . . . . . . . . . . . . . . . 9,327 11,333 12,791
Total . . . . . . . . . . . . . . . . . . . . . . . . . . . . . . . . . . . . . . . . . . . . . . . . . . . . . . . . . . . . . . . . . . . . . . . . . . . . . . . . . . . . . . . . . . . . 16,575 18,391 19,583
2013 to 2012 Comparison. The number of Life Planners increased by 190 from December 31, 2012 driven by a 202 increase inBrazil as a result of recruiting efforts and agency growth. Life Planner growth in Japan of 42 was offset by a decline of 44 in Taiwan.
The number of Gibraltar Life Consultants decreased by 2,006 from December 31, 2012 primarily reflecting the termination of LifeConsultants for not meeting minimum sales production standards as part of an ongoing competency assessment.
2012 to 2011 Comparison. The number of Life Planners increased by 266 from December 31, 2011 driven by increases of 96 and 79 in Koreaand Japan, respectively, reflecting recruitment and retention initiatives and 69 in Brazil due to agency growth. Also contributing to the increase in LifePlanners over the past year were increases of 61 in Poland and 22 in Italy, partly offset by declines of 37 in Taiwan and 26 in Mexico.
The number of Gibraltar Life Consultants decreased by 1,458 from December 31, 2011, including anticipated resignations and terminationsof Life Consultants, due in part to their failure to meet minimum sales production standards as part of an ongoing competency assessment.
Prudential Financial, Inc. 2013 Annual Report 47

Corporate and OtherCorporate and Other includes corporate operations, after allocations to our business segments, and divested businesses except those
that qualify for “discontinued operations” accounting treatment under U.S. GAAP.
Year ended December 31,
2013 2012 2011
(in millions)Operating results:
Capital debt interest expense . . . . . . . . . . . . . . . . . . . . . . . . . . . . . . . . . . . . . . . . . . . . . . . . . . . . . . . . . . . . . . . . . . . . . . . . . $ (655) $ (699) $ (621)Operating debt interest expense, net of investment income . . . . . . . . . . . . . . . . . . . . . . . . . . . . . . . . . . . . . . . . . . . . . . . . . (140) (53) (26)Pension and employee benefits . . . . . . . . . . . . . . . . . . . . . . . . . . . . . . . . . . . . . . . . . . . . . . . . . . . . . . . . . . . . . . . . . . . . . . . 243 162 210Other corporate activities(1) . . . . . . . . . . . . . . . . . . . . . . . . . . . . . . . . . . . . . . . . . . . . . . . . . . . . . . . . . . . . . . . . . . . . . . . . . (818) (748) (675)
Adjusted operating income . . . . . . . . . . . . . . . . . . . . . . . . . . . . . . . . . . . . . . . . . . . . . . . . . . . . . . . . . . . . . . . . . . . . . . . . . . . . . . (1,370) (1,338) (1,112)
Realized investment gains (losses), net, and related adjustments . . . . . . . . . . . . . . . . . . . . . . . . . . . . . . . . . . . . . . . . . . . . . 2,270 469 (1,487)Related charges . . . . . . . . . . . . . . . . . . . . . . . . . . . . . . . . . . . . . . . . . . . . . . . . . . . . . . . . . . . . . . . . . . . . . . . . . . . . . . . . . . . (51) (24) 59Divested businesses . . . . . . . . . . . . . . . . . . . . . . . . . . . . . . . . . . . . . . . . . . . . . . . . . . . . . . . . . . . . . . . . . . . . . . . . . . . . . . . 29 (615) 90Equity in earnings of operating joint ventures and earnings attributable to noncontrolling interests . . . . . . . . . . . . . . . . . . 1 (11) (10)
Income (loss) from continuing operations before income taxes and equity in earnings of operating joint ventures . . . . . . . . . . $ 879 $(1,519) $(2,460)
(1) Includes consolidating adjustments.
2013 to 2012 Annual Comparison. The loss from Corporate and Other operations, on an adjusted operating income basis, increased $32million. Operating debt interest expense, net of investment income, increased $87 million driven by higher levels of operating debt proceeds heldin cash for debt prefunding activities and to provide additional flexibility for the cash needs in our businesses. Net charges from corporateactivities include the impact of our annual review and update of assumptions on the reserves for certain retained obligations relating to pre-demutualization policyholders to whom we had previously agreed to provide insurance for reduced or no premium in accordance withcontractual settlements related to prior individual life insurance sales practices remediation. This update resulted in net charges of $78 million for2012. Excluding the impact of this update, the increase in net charges from other corporate activities was primarily driven by increased retainedcorporate expenses including higher compensation costs due to improvement in company earnings and favorable equity market performance.Capital debt interest expense decreased $44 million due to lower levels of capital debt and retirement of debt issued at higher interest rates.
Results from Corporate and Other operations pension and employee benefits increased $81 million primarily due to the absence of anincrease in recorded liabilities for certain employee benefits in 2012 and a favorable comparative impact of retained benefit expenses.Income from our qualified pension plan decreased $21 million driven by changes in the discount rate to 4.05% in 2013 from 4.85% in 2012and the expected rate of return on plan assets to 6.25% in 2013 from 6.75% in 2012.
At the end of 2013, we transferred $340 million of assets supporting pension benefits within the qualified pension plan to assetssupporting retiree medical and life benefits as permitted under Section 420 of the Internal Revenue Code. For purposes of calculatingpension income from our own qualified pension plan for the year ended December 31, 2014, we will increase the discount rate to 4.95%from 4.05% in 2013. The expected rate of return on plan assets and the assumed rate of increase in compensation will remain unchanged at6.25% and 4.5%, respectively. We determined our expected rate of return on plan assets based upon a building block approach thatconsiders inflation, real return, term premium, credit spreads, equity risk premium and capital appreciation as well as expenses, expectedasset manager performance and the effect of rebalancing for the equity, debt and real estate asset mix applied on a weighted average basisto our pension asset portfolio. Giving effect to the foregoing assumptions and other factors, including the Section 420 transfer, we expect,on a consolidated basis, income from our own qualified pension plan will continue to contribute to adjusted operating income in 2014, butat a level of about $100 million to $110 million lower than in 2013. We expect other postretirement benefit expenses to decrease in a rangeof $45 million to $55 million. The decrease is driven primarily by the additional assets provided by the Section 420 transfer, favorableclaims experience and by an increase in the discount rate to 4.75% from 3.85%. In 2014, pension and other postretirement benefit servicecosts related to active employees will continue to be allocated to our business segments.
2012 to 2011 Annual Comparison. The loss from Corporate and Other operations, on an adjusted operating income basis, increased $226million. Capital debt interest expense increased $78 million primarily due to higher levels of capital debt. Operating debt interest expense, net ofinvestment income, increased $27 million reflecting less favorable results from equity method investments and higher levels of operating debt.Net charges from other corporate activities for 2012 include a $78 million charge from the impact of an annual review and update of assumptionson the reserves for certain retained obligations relating to pre-demutualization policyholders to whom we had previously agreed to provideinsurance for reduced or no premium in accordance with contractual settlements related to prior individual life insurance sales practicesremediation. In addition, retained corporate expenses increased in 2012 primarily from an increase in corporate advertising, the results of ourcorporate foreign exchange hedging activities and the costs related to the prepayment of outstanding debt. These increases are partially offset by afavorable comparative impact for our estimate of payments arising from the use of new Social Security Master Death File matching criteria toidentify deceased policy and contract holders and the absence of a $20 million expense accrued in 2011 related to a voluntary contribution to bemade to the insurance industry insolvency fund, related to Executive Life Insurance.
Results from Corporate and Other operations pension and employee benefits decreased $48 million primarily due to an increase inrecorded liabilities for certain employee benefits and higher postretirement costs. Income from our qualified pension plan partially offsetthese unfavorable items reflecting better than expected growth in plan assets partially offset by a decrease in the expected rate of return onplan assets from 7.00% in 2011 to 6.75% in 2012.
Capital Protection FrameworkCorporate and Other operations includes the results related to our Capital Protection Framework, which includes the capital hedge
program. The capital hedge program broadly addresses the equity market exposure of the statutory capital of the Company as a whole,under stress scenarios, as described under “—Liquidity and Capital Resources—Capital—Capital Protection Framework.” Costs related tothis hedge program were $45 million, $40 million and $21 million for the years ended December 31, 2013, 2012 and 2011, respectively.
48 Prudential Financial, Inc. 2013 Annual Report

We also manage certain risks associated with our variable annuity products through our living benefit hedging program, which isdescribed under “—U.S. Retirement Solutions and Investment Management Division—Individual Annuities.”
In addition, we may choose to manage certain capital market related risk associated with various operations of the Financial ServicesBusinesses through capital management strategies other than hedging of particular exposures. “Realized investment gains (losses), net andrelated adjustments” includes net gains of $2,086 million, net gains of $184 million and net losses of $1,662 million for the years endedDecember 31, 2013, 2012 and 2011 respectively, resulting from our decision to utilize these capital management strategies to manage aportion of our interest rate risk. The $2,086 million of net gains in 2013 and the $1,662 million of net losses in 2011 were driven bysignificant increases and declines, respectively in risk-free interest rates during the respective years. The capital consequences associatedwith this decision have been factored into our Capital Protection Framework.
Through our Capital Protection Framework, we maintain access to on-balance sheet capital and maintain access to committed sourcesof capital to meet capital needs related to these hedging programs.
We assess the composition of these hedging programs on an ongoing basis, and we may change them from time to time based on our evaluation ofour risk position or other factors. For more information on our Capital Protection Framework, see “—Liquidity and Capital Resources.”
Results of Operations of Closed Block Business
We established the Closed Block Business effective as of the date of demutualization. The Closed Block Business includes our in forcetraditional domestic participating life insurance and annuity products and assets that are used for the payment of benefits and policyholder dividendson these policies, as well as other assets and equity and related liabilities that support these policies. We no longer offer these traditional domesticparticipating policies. See Note 12 to the Consolidated Financial Statements and “—Closed Block Business” for additional details.
Each year, the Board of Directors of Prudential Insurance determines the dividends payable on participating policies for the followingyear based on the experience of the Closed Block, including investment income, net realized and unrealized investment gains, mortalityexperience and other factors. Although Closed Block experience for dividend action decisions is based upon statutory results, at the timethe Closed Block was established, we developed, as required by U.S. GAAP, an actuarial calculation of the timing of the maximum futureearnings from the policies included in the Closed Block. If actual cumulative earnings in any given period are greater than the cumulativeearnings we expected, we will record this excess as a policyholder dividend obligation. We will subsequently pay this excess to ClosedBlock policyholders as an additional dividend unless it is otherwise offset by future Closed Block performance that is less favorable thanwe originally expected. The policyholder dividends we charge to expense within the Closed Block Business will include any change in ourpolicyholder dividend obligation that we recognize for the excess of actual cumulative earnings in any given period over the cumulativeearnings we expected in addition to the actual policyholder dividends declared by the Board of Directors of Prudential Insurance.
As of December 31, 2013, the excess of actual cumulative earnings over the expected cumulative earnings was $887 million, whichwas recorded as a policyholder dividend obligation. Actual cumulative earnings, as required by U.S. GAAP, reflect the recognition ofrealized investment gains and losses in the current period, as well as changes in assets and related liabilities that support the Closed Blockpolicies. Additionally, the accumulation of net unrealized investment gains that have arisen subsequent to the establishment of the ClosedBlock have been reflected as a policyholder dividend obligation of $3,624 million at December 31, 2013, to be paid to Closed Blockpolicyholders unless offset by future experience, with an offsetting amount reported in AOCI.
Operating ResultsManagement does not consider adjusted operating income to assess the operating performance of the Closed Block Business.
Consequently, results of the Closed Block Business for all periods are presented only in accordance with U.S. GAAP. The following tablesets forth the Closed Block Business U.S. GAAP results for the periods indicated.
Year ended December 31,
2013 2012 2011
(in millions)U.S. GAAP results:
Revenues . . . . . . . . . . . . . . . . . . . . . . . . . . . . . . . . . . . . . . . . . . . . . . . . . . . . . . . . . . . . . . . . . . . . . . . . . . . . . . . . . . . . . . . $6,036 $6,257 $7,015Benefits and expenses . . . . . . . . . . . . . . . . . . . . . . . . . . . . . . . . . . . . . . . . . . . . . . . . . . . . . . . . . . . . . . . . . . . . . . . . . . . . . 5,974 6,193 6,801
Income from continuing operations before income taxes and equity in earnings of operating joint ventures . . . . . . . . . . $ 62 $ 64 $ 214
Income from Continuing Operations Before Income Taxes and Equity in Earnings of Operating Joint Ventures
2013 to 2012 Annual Comparison. Income from continuing operations before income taxes and equity in earnings of operating jointventures decreased $2 million primarily due to a decline in net investment income. Net investment income decreased $137 millionprimarily reflecting the impact of lower reinvestment rates and lower asset balances as the business runs off, partially offset by favorableresults from non-coupon investments. Net realized investment gains decreased $11 million, primarily due to $251 million of unfavorablechanges in the value of derivatives, largely offset by higher trading gains on equity securities. For a discussion of Closed Block Businessrealized investment gains (losses), net, see “—Realized Investment Gains and Losses.” As a result of the above and other variances, a$2 million policyholder dividend obligation expense was recorded in 2013, compared to $123 million in 2012. As noted above, as ofDecember 31, 2013, the excess of actual cumulative earnings over the expected cumulative earnings was $887 million. If actual cumulativeearnings fall below expected cumulative earnings in future periods, earnings volatility in the Closed Block Business, which is primarily dueto changes in investment results, may not be offset by changes in the cumulative policyholder dividend obligation.
2012 to 2011 Annual Comparison. Income from continuing operations before income taxes and equity in earnings of operating joint venturesdecreased $150 million. Results for 2012 included $602 million of lower net realized investment gains, primarily due to lower trading gains on fixedmaturities and equity investments, as well as unfavorable changes in the value of derivatives. For a discussion of Closed Block Business realizedinvestment gains (losses), net, see “—Realized Investment Gains and Losses.” Also contributing to the decline in results was a $61 million decreasein net investment income primarily reflecting the impact of lower reinvestment rates and lower asset balances as the business runs off. As a result ofthe above and other variances, a $123 million policyholder dividend obligation expense was recorded in 2012, compared to $636 million in 2011.
Prudential Financial, Inc. 2013 Annual Report 49
Revenues, Benefits and Expenses2013 to 2012 Annual Comparison. Revenues, as shown in the table above under “—Operating Results,” decreased $221 million
primarily driven by a $137 million decrease in net investment income, as discussed above. Premiums declined by $89 million, with arelated decrease in changes in reserves, primarily due to the expected in force decline as policies terminate. Also contributing to the declinein revenues was an $11 million decrease in net realized investment gains, as discussed above.
Benefits and expenses, as shown in the table above under “—Operating Results,” decreased $219 million primarily driven by a$111 million decrease in policyholder benefits, including changes in reserves. This decrease primarily reflects the absence of a reserveincrease in the prior year for estimated payments arising from the use of new Social Security Master Death File matching criteria to identifydeceased policy and contract holders, as well as the impact from the in force decline as policies terminate. Also contributing to the decreaseis a $111 million decline in dividends to policyholders, including a $121 million decrease in the policyholder dividend obligation expensereflecting a lower increase in cumulative earnings, partially offset by an increase in dividends paid and accrued of $10 million.
2012 to 2011 Annual Comparison. Revenues decreased $758 million principally driven by the $602 million decrease in net realized investmentgains, as discussed above. Premiums declined by $101 million, with a related decrease in changes in reserves, primarily due to the expected in forcedecline as policies terminate. Also contributing to the decline in revenues was a $61 million decrease in net investment income, as discussed above.
Benefits and expenses decreased $608 million primarily driven by a $550 million decline in dividends to policyholders including a$513 million decrease in the policyholder dividend obligation expense reflecting a lower increase in cumulative earnings. In addition,policyholders’ benefits, including changes in reserves, decreased $37 million primarily due to the expected in force decline as policiesterminate, partially offset by an increase in reserves for estimated payments arising from use of new Social Security Master Death Filematching criteria to identify deceased policy and contract holders.
Income Taxes
Shown below is our income tax provision for the years ended December 31, 2013, 2012 and 2011, separately reflecting the impact ofcertain significant items. Also presented below is the income tax provision that would have resulted from application of the statutory 35%federal income tax rate in each of these periods.
Year ended December 31,
2013 2012 2011
(in millions)Tax provision . . . . . . . . . . . . . . . . . . . . . . . . . . . . . . . . . . . . . . . . . . . . . . . . . . . . . . . . . . . . . . . . . . . . . . . . . . . . . . . . . . . . . . . $(1,058) $ 213 $1,515Impact of:
Non-taxable investment income . . . . . . . . . . . . . . . . . . . . . . . . . . . . . . . . . . . . . . . . . . . . . . . . . . . . . . . . . . . . . . . . . . . . . 319 302 247Low income housing and other tax credits . . . . . . . . . . . . . . . . . . . . . . . . . . . . . . . . . . . . . . . . . . . . . . . . . . . . . . . . . . . . . 105 78 80Reversal of acquisition opening balance sheet deferred tax items . . . . . . . . . . . . . . . . . . . . . . . . . . . . . . . . . . . . . . . . . . . (55) (384) (221)Medicare Part D . . . . . . . . . . . . . . . . . . . . . . . . . . . . . . . . . . . . . . . . . . . . . . . . . . . . . . . . . . . . . . . . . . . . . . . . . . . . . . . . . 43 1 2Minority interest . . . . . . . . . . . . . . . . . . . . . . . . . . . . . . . . . . . . . . . . . . . . . . . . . . . . . . . . . . . . . . . . . . . . . . . . . . . . . . . . . 37 17 11Foreign taxes at other than U.S. rate . . . . . . . . . . . . . . . . . . . . . . . . . . . . . . . . . . . . . . . . . . . . . . . . . . . . . . . . . . . . . . . . . . 36 51 37Uncertain tax positions and interest . . . . . . . . . . . . . . . . . . . . . . . . . . . . . . . . . . . . . . . . . . . . . . . . . . . . . . . . . . . . . . . . . . 16 (8) 57State and local taxes . . . . . . . . . . . . . . . . . . . . . . . . . . . . . . . . . . . . . . . . . . . . . . . . . . . . . . . . . . . . . . . . . . . . . . . . . . . . . . (10) (15) 0Non-deductible expenses . . . . . . . . . . . . . . . . . . . . . . . . . . . . . . . . . . . . . . . . . . . . . . . . . . . . . . . . . . . . . . . . . . . . . . . . . . (10) (7) (17)Change in tax rate . . . . . . . . . . . . . . . . . . . . . . . . . . . . . . . . . . . . . . . . . . . . . . . . . . . . . . . . . . . . . . . . . . . . . . . . . . . . . . . . 2 (1) (18)Repatriation assumption change . . . . . . . . . . . . . . . . . . . . . . . . . . . . . . . . . . . . . . . . . . . . . . . . . . . . . . . . . . . . . . . . . . . . . 0 (6) 11Change in valuation allowance . . . . . . . . . . . . . . . . . . . . . . . . . . . . . . . . . . . . . . . . . . . . . . . . . . . . . . . . . . . . . . . . . . . . . . 0 1 (8)Other . . . . . . . . . . . . . . . . . . . . . . . . . . . . . . . . . . . . . . . . . . . . . . . . . . . . . . . . . . . . . . . . . . . . . . . . . . . . . . . . . . . . . . . . . . (14) 6 41
Tax provision excluding these items . . . . . . . . . . . . . . . . . . . . . . . . . . . . . . . . . . . . . . . . . . . . . . . . . . . . . . . . . . . . . . . . . . . . . . $ (589) $ 248 $1,737
Tax provision at statutory rate . . . . . . . . . . . . . . . . . . . . . . . . . . . . . . . . . . . . . . . . . . . . . . . . . . . . . . . . . . . . . . . . . . . . . . . . . . $ (589) $ 248 $1,737
Our income tax provision, on a consolidated basis, amounted to an income tax benefit of $1,058 million in 2013 compared to anexpense of $213 million in 2012. Our income tax provision for 2013 and 2012 includes $55 million and $384 million, respectively, of anadditional U.S. tax expense related to the realization of a portion of the local deferred tax assets existing on the opening day balance sheetfor the Star and Edison Businesses and Prudential Gibraltar Financial Life Insurance Company, Ltd (“Prudential Gibraltar”). The U.S. taxexpense for 2013 is reflective of a change in repatriation assumption for Gibraltar Life and Prudential Gibraltar. During the first quarter of2013, we determined that in addition to U.S. GAAP earnings, we would repatriate an additional amount from Gibraltar Life and PrudentialGibraltar, but that such additional amount would not exceed the deferred tax assets recorded in the Statement of Financial Position as of theacquisition date for Prudential Gibraltar and the Star and Edison Businesses. The U.S. tax expense for 2012 is reflective of the merger ofStar and Edison Businesses into Gibraltar Life and it represented the recomputed U.S. tax liability on Gibraltar’s Life’s prior earnings as aresult of the repatriation assumption and the merger of the entities. The local utilization of the deferred tax asset coupled with therepatriation assumption related to the applicable earnings of our Japanese entities creates the effect of a “double tax” for U.S. GAAPpurposes, whereas the tax expense will only be paid once. Excluding the impact of the “double tax”, the income tax expense decreasedprimarily due to the decrease in pre-tax income from continuing operations before income taxes and equity in earnings of operating jointventures and increase in non-taxable investment income for the year ended December 31, 2013.
Our income tax provision related to foreign operations, on a consolidated basis, amounted to an income tax benefit of $826 million in2013 compared to $46 million in 2012. Our foreign operations income tax provision for 2013 and 2012 includes $108 million and$73 million of an additional tax expense from the re-measurement of deferred tax liabilities resulting from the Japan corporate income taxrate reduction. However, since we assume repatriation of earnings from our Japanese operations, our domestic tax provision in 2013 and2012 includes $108 million and $73 million of an additional tax benefit resulting from the increase or decrease in the future foreign tax creditbenefit and, as a result, the reduction in the Japan corporate tax rate had no impact on our overall income tax provision. Excluding the impactfrom the Japan corporate income tax rate reduction, the foreign operations income tax provision decreased primarily due to the decrease inforeign operations pre-tax income from continuing operations before income taxes and equity in earnings of operating joint ventures.
50 Prudential Financial, Inc. 2013 Annual Report

We employ various tax strategies, including strategies to minimize the amount of taxes resulting from realized capital gains.
For additional information regarding income taxes, see Note 19 to the Consolidated Financial Statements.
Discontinued Operations
Included within net income are the results of businesses which are reflected as discontinued operations under U.S. GAAP. Income (loss) fromdiscontinued operations, net of taxes, was $7 million, $15 million and $35 million for the years ended December 31, 2013, 2012 and 2011, respectively.
For additional information regarding discontinued operations see Note 3 to the Consolidated Financial Statements.
Divested Businesses
Our income from continuing operations includes results from several businesses that have been or will be sold or exited that do notqualify for “discontinued operations” accounting treatment under U.S. GAAP. The results of these divested businesses are reflected in ourCorporate and Other operations, but are excluded from adjusted operating income. For a further description of these divested businesses,see “Business—Corporate and Other” included in Prudential Financial’s 2013 Annual Report on Form 10-K. A summary of the results ofthese divested businesses that have been excluded from adjusted operating income is as follows for the periods indicated:
Year ended December 31,
2013 2012 2011
(in millions)Real Estate and Relocation Services . . . . . . . . . . . . . . . . . . . . . . . . . . . . . . . . . . . . . . . . . . . . . . . . . . . . . . . . . . . . . . . . . . . . . . $ 84 $ 26 $ 81Long-Term Care . . . . . . . . . . . . . . . . . . . . . . . . . . . . . . . . . . . . . . . . . . . . . . . . . . . . . . . . . . . . . . . . . . . . . . . . . . . . . . . . . . . . . (34) (608) 47Wealth Management Services(1) . . . . . . . . . . . . . . . . . . . . . . . . . . . . . . . . . . . . . . . . . . . . . . . . . . . . . . . . . . . . . . . . . . . . . . . . (3) (18) (11)Individual Health Insurance . . . . . . . . . . . . . . . . . . . . . . . . . . . . . . . . . . . . . . . . . . . . . . . . . . . . . . . . . . . . . . . . . . . . . . . . . . . . (15) (6) (15)Financial Advisory . . . . . . . . . . . . . . . . . . . . . . . . . . . . . . . . . . . . . . . . . . . . . . . . . . . . . . . . . . . . . . . . . . . . . . . . . . . . . . . . . . . (4) (5) (7)Other(2) . . . . . . . . . . . . . . . . . . . . . . . . . . . . . . . . . . . . . . . . . . . . . . . . . . . . . . . . . . . . . . . . . . . . . . . . . . . . . . . . . . . . . . . . . . . . 1 (4) (5)
Total divested businesses income (loss) excluded from adjusted operating income . . . . . . . . . . . . . . . . . . . . . . . . . . . . . $ 29 $(615) $ 90
(1) On July 1, 2013, the Company sold its wealth management solutions business to Envestnet Inc. Due to the existence of an ongoing contractual relationshipbetween the Company and these operations, this disposition did not qualify for discontinued operations treatment under U.S. GAAP. As a result, the Companyhas classified the results of these operations, previously reported in the Asset Management segment, as a “divested business” for all periods presented.
(2) Reflects the income from discontinued real estate investments.
Real Estate and Relocation Services. Results of the year ended December 31, 2013 include pre-tax gains of $51 million from thesales of investments in real estate brokerage franchises. Results for the year ended December 31, 2011 include a pre-tax gain of $49 millionreflecting the sale of our real estate brokerage franchise and relocation services business. For additional information on the sale of our realestate brokerage franchise and relocation services business, see Note 3 to the Consolidated Financial Statements.
Long-Term Care. Results for the year ended December 31, 2012 include a $639 million pre-tax charge from an increase in reserves forour long-term care products and adjustments to deferred policy acquisition and other costs, reflecting updates to the estimated profitability of thebusiness, driven by changes to our long-term interest rate and morbidity assumptions, partially offset by expected future premium increases.
Experience-Rated Contractholder Liabilities,Trading Account Assets Supporting Insurance Liabilities and Other Related Investments
Certain products included in the Retirement and International Insurance segments are experience-rated in that investment resultsassociated with these products are expected to ultimately accrue to contractholders. The majority of investments supporting theseexperience-rated products are classified as trading and are carried at fair value. These trading investments are reflected on the statements offinancial position as “Trading account assets supporting insurance liabilities, at fair value” (“TAASIL”). Realized and unrealized gains andlosses for these investments are reported in “Asset management fees and other income.” Interest and dividend income for these investmentsis reported in “Net investment income.” To a lesser extent, these experience-rated products are also supported by derivatives andcommercial mortgage and other loans. The derivatives that support these experience-rated products are reflected on the statement offinancial position as “Other long-term investments” and are carried at fair value, and the realized and unrealized gains and losses arereported in “Realized investment gains (losses), net.” The commercial mortgage and other loans that support these experience-ratedproducts are carried at unpaid principal, net of unamortized discounts and an allowance for losses, and are reflected on the statements offinancial position as “Commercial mortgage and other loans.” Gains and losses on sales and changes in the valuation allowance forcommercial mortgage and other loans are reported in “Realized investment gains (losses), net.”
Our Retirement segment has two types of experience-rated products that are supported by TAASIL and other related investments.Fully participating products are those for which the entire return on underlying investments is passed back to the policyholders through acorresponding adjustment to the related liability. The adjustment to the liability is based on changes in the fair value of all of the relatedassets, including commercial mortgage and other loans, which are carried at amortized cost, less any valuation allowance. Partiallyparticipating products are those for which only a portion of the return on underlying investments is passed back to the policyholders overtime through changes to the contractual crediting rates. The crediting rates are typically reset semiannually, often subject to a minimumcrediting rate, and returns are required to be passed back within ten years.
In our International Insurance segment, the experience-rated products are fully participating. As a result, the entire return on theunderlying investments is passed back to policyholders through a corresponding adjustment to the related liability.
Adjusted operating income excludes net investment gains and losses on TAASIL, related derivatives and commercial mortgage andother loans. This is consistent with the exclusion of realized investment gains and losses with respect to other investments supporting
Prudential Financial, Inc. 2013 Annual Report 51

insurance liabilities managed on a consistent basis. In addition, to be consistent with the historical treatment of charges related to realizedinvestment gains and losses on investments, adjusted operating income also excludes the change in contractholder liabilities due to asset valuechanges in the pool of investments (including changes in the fair value of commercial mortgage and other loans) supporting these experience-rated contracts, which are reflected in “Interest credited to policyholders’ account balances.” The result of this approach is that adjusted operatingincome for these products includes net fee revenue and interest spread we earn on these experience-rated contracts, and excludes changes in fairvalue of the pool of investments, both realized and unrealized, that we expect will ultimately accrue to the contractholders.
The following tables set forth the impact of these items on results that are excluded from adjusted operating income for the periods indicated:
Year ended December 31,
2013 2012 2011
(in millions)Retirement Segment:Investment gains (losses) on:
Trading account assets supporting insurance liabilities, net . . . . . . . . . . . . . . . . . . . . . . . . . . . . . . . . . . . . . . . . . . . . $(718) $ 406 $ 383Derivatives . . . . . . . . . . . . . . . . . . . . . . . . . . . . . . . . . . . . . . . . . . . . . . . . . . . . . . . . . . . . . . . . . . . . . . . . . . . . . . . . . 52 (86) (160)Commercial mortgages and other loans . . . . . . . . . . . . . . . . . . . . . . . . . . . . . . . . . . . . . . . . . . . . . . . . . . . . . . . . . . . (2) 5 9
Change in experience-rated contractholder liabilities due to asset value changes(1)(2) . . . . . . . . . . . . . . . . . . . . . . . . . . . . . . 695 (336) (283)
Net gains (losses) . . . . . . . . . . . . . . . . . . . . . . . . . . . . . . . . . . . . . . . . . . . . . . . . . . . . . . . . . . . . . . . . . . . . . . . . . . . . . . . . $ 27 $ (11) $ (51)
International Insurance Segment:Investment gains (losses) on trading account assets supporting insurance liabilities, net . . . . . . . . . . . . . . . . . . . . . . . . . . . . . $ 468 $ 204 $(160)Change in experience-rated contractholder liabilities due to asset value changes . . . . . . . . . . . . . . . . . . . . . . . . . . . . . . . . . . . (468) (204) 160
Net gains (losses) . . . . . . . . . . . . . . . . . . . . . . . . . . . . . . . . . . . . . . . . . . . . . . . . . . . . . . . . . . . . . . . . . . . . . . . . . . . . . . . . $ 0 $ 0 $ 0
Total:Investment gains (losses) on:
Trading account assets supporting insurance liabilities, net . . . . . . . . . . . . . . . . . . . . . . . . . . . . . . . . . . . . . . . . $(250) $ 610 $ 223Derivatives . . . . . . . . . . . . . . . . . . . . . . . . . . . . . . . . . . . . . . . . . . . . . . . . . . . . . . . . . . . . . . . . . . . . . . . . . . . . . 52 (86) (160)Commercial mortgages and other loans . . . . . . . . . . . . . . . . . . . . . . . . . . . . . . . . . . . . . . . . . . . . . . . . . . . . . . . (2) 5 9
Change in experience-rated contractholder liabilities due to asset value changes(1)(2) . . . . . . . . . . . . . . . . . . . . . . . . . . 227 (540) (123)
Net gains (losses) . . . . . . . . . . . . . . . . . . . . . . . . . . . . . . . . . . . . . . . . . . . . . . . . . . . . . . . . . . . . . . . . . . . . . . . . . . . . $ 27 $ (11) $ (51)
(1) Decreases to contractholder liabilities due to asset value changes are limited by certain floors and therefore do not reflect cumulative declines inrecorded asset values of $26 million, $3 million and $7 million as of December 31, 2013, 2012 and 2011, respectively. We have recovered and expect torecover in future periods these declines in recorded asset values through subsequent increases in recorded asset values or reductions in crediting rates oncontractholder liabilities.
(2) Included in the amounts above related to the change in the liability to contractholders as a result of commercial mortgage and other loans are a decreaseof $58 million, and increases of $18 million and $55 million for the years ended December 31, 2013, 2012 and 2011, respectively. As prescribed byU.S. GAAP, changes in the fair value of commercial mortgage and other loans held for investment in our general account, other than when associatedwith impairments, are not recognized in income in the current period, while the impact of these changes in fair value are reflected as a change in theliability to fully participating contractholders in the current period.
The net impacts for the Retirement segment of changes in experience-rated contractholder liabilities and investment gains and losses on tradingaccount assets supporting insurance liabilities and other related investments reflect timing differences between the recognition of the mark-to-marketadjustments and the recognition of the recovery of these adjustments in future periods through subsequent increases in asset values or reductions increditing rates on contractholder liabilities for partially participating products. These impacts also reflect the difference between the fair value of theunderlying commercial mortgage and other loans and the amortized cost, less any valuation allowance, of these loans, as described above.
Valuation of Assets and Liabilities
Fair Value of Assets and LiabilitiesThe authoritative guidance related to fair value measurement establishes a framework that includes a three-level hierarchy used to classify the
inputs used in measuring fair value. The level in the hierarchy within which the fair value falls is determined based on the lowest level input that issignificant to the measurement. The fair values of assets and liabilities classified as Level 3 include at least one or more significant unobservableinput in the measurement. See Note 20 to the Consolidated Financial Statements for an additional description of the valuation hierarchy levels.
The tables below present the balances of assets and liabilities measured at fair value on a recurring basis, as of the periods indicated,split between the Financial Services Businesses and Closed Block Business, and the portion of such assets and liabilities that are classifiedin Level 3 of the valuation hierarchy. See Note 20 to the Consolidated Financial Statements for the balances of assets and liabilitiesmeasured at fair value on a recurring basis by hierarchy level presented on a consolidated basis.
As of December 31, 2013 As of December 31, 2012
Financial ServicesBusinesses
Closed BlockBusiness
Financial ServicesBusinesses
Closed BlockBusiness
Total atFair Value
TotalLevel 3(1)
Total atFair Value
TotalLevel 3(1)
Total atFair Value
TotalLevel 3(1)
Total atFair Value
TotalLevel 3(1)
(in millions)Fixed maturities, available-for-sale . . . . . . . . . . . . . . . . . $243,654 $ 4,079 $43,212 $ 866 $254,917 $ 4,261 $46,419 $1,207Trading account assets:
Fixed maturities . . . . . . . . . . . . . . . . . . . . . . . . . . . . 23,469 511 185 9 20,605 565 139 10Equity securities . . . . . . . . . . . . . . . . . . . . . . . . . . . . 2,219 722 157 120 2,341 987 136 111All other(2) . . . . . . . . . . . . . . . . . . . . . . . . . . . . . . . 1,250 6 0 0 3,697 25 0 0
Subtotal . . . . . . . . . . . . . . . . . . . . . . . . . . 26,938 1,239 342 129 26,643 1,577 275 121
52 Prudential Financial, Inc. 2013 Annual Report

As of December 31, 2013 As of December 31, 2012
Financial ServicesBusinesses
Closed BlockBusiness
Financial ServicesBusinesses
Closed BlockBusiness
Total atFair Value
TotalLevel 3(1)
Total atFair Value
TotalLevel 3(1)
Total atFair Value
TotalLevel 3(1)
Total atFair Value
TotalLevel 3(1)
(in millions)Equity securities, available-for-sale . . . . . . . . . . . . . . . . . 6,026 298 3,884 6 5,052 321 3,225 9Commercial mortgage and other loans . . . . . . . . . . . . . . 158 0 0 0 162 48 0 0Other long-term investments . . . . . . . . . . . . . . . . . . . . . . 1,595 1,396 (66) 0 1,478 1,053 (95) 0Short-term investments . . . . . . . . . . . . . . . . . . . . . . . . . . 5,520 0 1,665 0 5,130 0 1,260 0Cash equivalents . . . . . . . . . . . . . . . . . . . . . . . . . . . . . . . 6,362 0 620 0 13,063 0 537 0Other assets . . . . . . . . . . . . . . . . . . . . . . . . . . . . . . . . . . . 131 4 85 0 98 8 97 0
Subtotal excluding separate account assets . . . . . . . 290,384 7,016 49,742 1,001 306,543 7,268 51,718 1,337Separate account assets . . . . . . . . . . . . . . . . . . . . . . . . . . 285,060 22,603 0 0 253,254 21,132 0 0
Total assets . . . . . . . . . . . . . . . . . . . . . . . . . . . . $575,444 $29,619 $49,742 $1,001 $559,797 $28,400 $51,718 $1,337
Future policy benefits . . . . . . . . . . . . . . . . . . . . . . . . . . . $ 441 $ 441 $ 0 $ 0 $ 3,348 $ 3,348 $ 0 $ 0Other liabilities(2) . . . . . . . . . . . . . . . . . . . . . . . . . . . . . . 2,201 5 6 0 90 0 0 0Notes of consolidated VIEs . . . . . . . . . . . . . . . . . . . . . . . 3,254 3,254 0 0 1,406 1,406 0 0
Total liabilities . . . . . . . . . . . . . . . . . . . . . . . . . $ 5,896 $ 3,700 $ 6 $ 0 $ 4,844 $ 4,754 $ 0 $ 0
(1) The amount of Level 3 assets taken as a percentage of total assets measured at fair value on a recurring basis totaled 5.1% as of both December 31, 2013and 2012, for the Financial Services Businesses, and 2.0% and 2.6% as of December 31, 2013 and 2012, respectively, for the Closed Block Business.
(2) “All other” and “Other liabilities” primarily include derivatives. The amounts classified as Level 3 for the Financial Services Businesses exclude theimpact of netting.
The determination of fair value, which for certain assets and liabilities is dependent on the application of estimates and assumptions, can havea significant impact on our results of operations and may require the application of a greater degree of judgment depending on market conditions,as the ability to value assets and liabilities can be significantly impacted by a decrease in market activity or a lack of transactions executed in anorderly manner. The following sections provide information regarding certain assets and liabilities of our Financial Services Businesses and ourClosed Block Business which are valued using Level 3 inputs and could have a significant impact on our results of operations.
Fixed Maturity and Equity SecuritiesFixed maturity securities included in Level 3 in our fair value hierarchy are generally priced based on internally-developed valuations
or indicative broker quotes. For certain private fixed maturity and equity securities, the internally-developed valuation model usessignificant unobservable inputs and, accordingly, such securities are included in Level 3 in our fair value hierarchy. Level 3 fixed maturitysecurities included approximately $4.3 billion as of December 31, 2013 and $4.5 billion as of December 31, 2012 of public fixedmaturities, with values primarily based on indicative broker quotes, and approximately $1.2 billion as of December 31, 2013 and$1.5 billion as of December 31, 2012 of private fixed maturities, with values primarily based on internally-developed models. Significantunobservable inputs used included: issue specific credit adjustments, material non-public financial information, management judgment,estimation of future earnings and cash flows, default rate assumptions, liquidity assumptions and indicative quotes from market makers.These inputs are usually considered unobservable, as not all market participants will have access to this data.
The impact our determination of fair value for fixed maturity and equity securities has on our results of operations is dependent on ourclassification of the security as either trading, available-for-sale, or held-to-maturity. For our investments classified as trading, the impactof changes in fair value is recorded within “Asset management fees and other income.” For our investments classified as available-for-sale,the impact of changes in fair value is recorded as an unrealized gain or loss in AOCI, a separate component of equity. Our investmentsclassified as held-to-maturity are carried at amortized cost.
Other Long-Term InvestmentsOther long-term investments classified in Level 3 primarily include real estate held in consolidated investment funds and fund
investments where the fair value option has been elected. The fair value of real estate held in consolidated investment funds is determinedthrough an independent appraisal process. The appraisals generally utilize a discounted cash flow model. The appraisals also includereplacement cost estimates and recent sales data as alternate methods of fair value. These appraisals and the related assumptions areupdated at least annually. Since many of the assumptions utilized are unobservable and are considered to be significant inputs to thevaluation, the real estate investments within other long-term investments are reflected within Level 3. Consolidated real estate investmentfunds classified as Level 3 totaled approximately $0.5 billion as of both December 31, 2013 and 2012, respectively. The fair value of fundinvestments, where the fair value option has been elected, is primarily determined by the fund managers. Since the valuations may be basedon unobservable market inputs and cannot be validated by the Company, these investments are included within Level 3. Investments inthese funds included in Level 3 totaled approximately $0.7 billion and $0.5 billion as of December 31, 2013 and 2012, respectively.
Separate Account AssetsSeparate account assets included in Level 3 primarily include real estate investments for which values are determined as described
above under “Other Long-Term Investments.” Separate account liabilities are reported at contract value and not fair value.
Variable Annuity Optional Living Benefit FeaturesFuture policy benefits classified in Level 3 primarily include liabilities related to guarantees associated with the optional living benefit
features of certain variable annuity contracts offered by our Individual Annuities segment, including guaranteed minimum accumulation benefits(“GMAB”), guaranteed minimum withdrawal benefits (“GMWB”) and guaranteed minimum income and withdrawal benefits (“GMIWB”). These
Prudential Financial, Inc. 2013 Annual Report 53

benefits are accounted for as embedded derivatives and carried at fair value with changes in fair value included in “Realized investment gains(losses), net.” The fair values of the GMAB, GMWB and GMIWB liabilities are calculated as the present value of future expected benefitpayments to customers less the present value of assessed rider fees attributable to the embedded derivative feature. This methodology could resultin either a liability or contra-liability balance, based on changing capital market conditions and various policyholder behavior assumptions. Sincethere is no observable active market for the transfer of these obligations, the valuations are calculated using internally-developed models withoption pricing techniques. These models utilize significant assumptions that are primarily unobservable, including assumptions as to lapse rates,NPR, utilization rates, withdrawal rates, mortality rates and equity market volatility. Future policy benefits classified as Level 3 were net liabilitiesof $0.4 billion and $3.3 billion as of December 31, 2013 and 2012, respectively. For additional information see “—Results of Operations forFinancial Services Businesses by Segment—U.S. Retirement Solutions and Investment Management Division—Individual Annuities.”
Notes of Consolidated VIEs
As discussed in Note 5, notes of consolidated VIEs represent non-recourse notes issued by certain asset-backed investment vehicles, primarilyCDOs, which we are required to consolidate. We have elected the fair value option for these notes, which are valued based on broker quotes.
For additional information about the key estimates and assumptions used in our determination of fair value, see Note 20 to theConsolidated Financial Statements.
Realized Investment Gains and Losses
Realized investment gains and losses are generated from numerous sources, including the following significant items:
• sale of investments
• adjustments to the cost basis of investments for other-than-temporary impairments
• recognition of other-than-temporary impairments in earnings for foreign denominated securities that are approaching maturity andare in an unrealized loss position due to foreign currency exchange rate movements
• prepayment premiums received on private fixed maturity securities
• net changes in the allowance for losses, certain restructurings and foreclosures on commercial mortgage and other loans
• fair value changes on commercial mortgage loans carried at fair value
• fair value changes on embedded derivatives and free-standing derivatives that do not qualify for hedge accounting treatment
The level of other-than-temporary impairments generally reflects economic conditions and is expected to increase when economicconditions worsen and to decrease when economic conditions improve. Historically, the causes of other-than-temporary impairments havebeen specific to each individual issuer and have not directly resulted in impairments to other securities within the same industry orgeographic region. We may also realize additional credit and interest rate related losses through sales of investments pursuant to our creditrisk and portfolio management objectives. For additional information regarding our policies regarding other-than-temporary-impairmentsfor fixed maturity and equity securities, see Note 2 to the Consolidated Financial Statements.
We use interest rate and currency swaps and other derivatives to manage interest and currency exchange rate exposures arising from mismatchesbetween assets and liabilities, including duration mismatches. We use derivative contracts to mitigate the risk that unfavorable changes in currencyexchange rates will materially affect U.S. dollar equivalent earnings generated by certain of our non-U.S. businesses. We also use equity-based andinterest rate derivatives to hedge a portion of the risks embedded in certain variable annuity products with optional living benefit guarantees. Derivativecontracts also include forward purchases and sales of to-be-announced mortgage-backed securities primarily related to our dollar roll program. Many ofthese derivative contracts do not qualify for hedge accounting and, consequently, we recognize the changes in fair value of such contracts from period toperiod in current earnings, although we do not necessarily account for the related assets or liabilities the same way.
Accordingly, realized investment gains and losses from our derivative activities can contribute significantly to fluctuations in netincome. For a further discussion of optional living benefit guarantees and related hedge positions in our Individual Annuities segment, see“—Results of Operations for Financial Services Businesses by Segment—U.S. Retirement Solutions and Investment ManagementDivision—Individual Annuities” above.
Adjusted operating income generally excludes “Realized investment gains (losses), net,” subject to certain exceptions. Theseexceptions primarily include realized investment gains or losses within certain of our businesses for which such gains or losses are aprincipal source of earnings, gains or losses associated with terminating hedges of foreign currency earnings and current period yieldadjustments, and related charges and adjustments. Other-than-temporary impairments, interest rate related losses and credit related losseson sales (other than those related to certain of our businesses which primarily originate investments for sale or syndication to unrelatedinvestors) are excluded from adjusted operating income.
54 Prudential Financial, Inc. 2013 Annual Report
The following table sets forth “Realized investment gains (losses), net,” by investment type for the Financial Services Businesses andClosed Block Business, as well as related charges and adjustments associated with the Financial Services Businesses, for the periodsindicated. For additional details regarding adjusted operating income, which is our measure of performance for the segments of ourFinancial Services Businesses, see Note 22 to the Consolidated Financial Statements.
Year Ended December 31,
2013 2012 2011
(in millions)Realized investment gains (losses), net:Financial Services Businesses . . . . . . . . . . . . . . . . . . . . . . . . . . . . . . . . . . . . . . . . . . . . . . . . . . . . . . . . . . . . . . . . . . . . . $(5,438) $(1,684) $ 1,986Closed Block Business . . . . . . . . . . . . . . . . . . . . . . . . . . . . . . . . . . . . . . . . . . . . . . . . . . . . . . . . . . . . . . . . . . . . . . . . . . 232 243 845
Consolidated realized investment gains (losses), net . . . . . . . . . . . . . . . . . . . . . . . . . . . . . . . . . . . . . . . . . . . . . . . $(5,206) $(1,441) $ 2,831
Financial Services Businesses:Realized investment gains (losses), net: . . . . . . . . . . . . . . . . . . . . . . . . . . . . . . . . . . . . . . . . . . . . . . . . . . . . . . . . . . . . .
Fixed maturity securities . . . . . . . . . . . . . . . . . . . . . . . . . . . . . . . . . . . . . . . . . . . . . . . . . . . . . . . . . . . . . . . . . . . . . $ (213) $ (140) $ (125)Equity securities . . . . . . . . . . . . . . . . . . . . . . . . . . . . . . . . . . . . . . . . . . . . . . . . . . . . . . . . . . . . . . . . . . . . . . . . . . . 130 (54) (120)Commercial mortgage and other loans . . . . . . . . . . . . . . . . . . . . . . . . . . . . . . . . . . . . . . . . . . . . . . . . . . . . . . . . . . 72 92 89Derivative instruments . . . . . . . . . . . . . . . . . . . . . . . . . . . . . . . . . . . . . . . . . . . . . . . . . . . . . . . . . . . . . . . . . . . . . . (5,488) (1,552) 2,095Other . . . . . . . . . . . . . . . . . . . . . . . . . . . . . . . . . . . . . . . . . . . . . . . . . . . . . . . . . . . . . . . . . . . . . . . . . . . . . . . . . . . . 61 (30) 47
Total . . . . . . . . . . . . . . . . . . . . . . . . . . . . . . . . . . . . . . . . . . . . . . . . . . . . . . . . . . . . . . . . . . . . . . . . . . . . . . . . . . . . . . . . $(5,438) $(1,684) $ 1,986
Related adjustments . . . . . . . . . . . . . . . . . . . . . . . . . . . . . . . . . . . . . . . . . . . . . . . . . . . . . . . . . . . . . . . . . . . . . . . . (4,518) (1,982) 517
Realized investment gains (losses), net, and related adjustments . . . . . . . . . . . . . . . . . . . . . . . . . . . . . . . . . . . . . . . . . . (9,956) (3,666) 2,503
Related charges . . . . . . . . . . . . . . . . . . . . . . . . . . . . . . . . . . . . . . . . . . . . . . . . . . . . . . . . . . . . . . . . . . . . . . . . . . . . 1,807 857 (1,656)
Realized investment gains (losses), net, and related charges and adjustments . . . . . . . . . . . . . . . . . . . . . . . . . . . . . . . . $(8,149) $(2,809) $ 847
Closed Block Business:Realized investment gains (losses), net:
Fixed maturity securities . . . . . . . . . . . . . . . . . . . . . . . . . . . . . . . . . . . . . . . . . . . . . . . . . . . . . . . . . . . . . . . . . . . . . $ 120 $ 103 $ 355Equity securities . . . . . . . . . . . . . . . . . . . . . . . . . . . . . . . . . . . . . . . . . . . . . . . . . . . . . . . . . . . . . . . . . . . . . . . . . . . 314 78 265Commercial mortgage and other loans . . . . . . . . . . . . . . . . . . . . . . . . . . . . . . . . . . . . . . . . . . . . . . . . . . . . . . . . . . 7 2 33Derivative instruments . . . . . . . . . . . . . . . . . . . . . . . . . . . . . . . . . . . . . . . . . . . . . . . . . . . . . . . . . . . . . . . . . . . . . . (200) 52 199Other . . . . . . . . . . . . . . . . . . . . . . . . . . . . . . . . . . . . . . . . . . . . . . . . . . . . . . . . . . . . . . . . . . . . . . . . . . . . . . . . . . . . (9) 8 (7)
Total . . . . . . . . . . . . . . . . . . . . . . . . . . . . . . . . . . . . . . . . . . . . . . . . . . . . . . . . . . . . . . . . . . . . . . . . . . . . . . . . . . . . . . . . $ 232 $ 243 $ 845
2013 to 2012 Annual Comparison
Financial Services Businesses
The Financial Services Businesses’ net realized investment losses were $5,438 million in 2013, compared to net realized investmentlosses of $1,684 million in 2012.
Net realized losses on fixed maturity securities were $213 million in 2013, compared to net realized losses of $140 million in 2012, asset forth in the following table:
Year Ended December 31,
2013 2012
(in millions)Realized investment gains (losses), net—Fixed Maturity Securities—Financial Services Businesses
Gross realized investment gains:Gross gains on sales and maturities(1) . . . . . . . . . . . . . . . . . . . . . . . . . . . . . . . . . . . . . . . . . . . . . . . . . . . . . . . . . . . . . . $ 1,172 $ 375Private bond prepayment premiums . . . . . . . . . . . . . . . . . . . . . . . . . . . . . . . . . . . . . . . . . . . . . . . . . . . . . . . . . . . . . . . . 66 23
Total gross realized investment gains . . . . . . . . . . . . . . . . . . . . . . . . . . . . . . . . . . . . . . . . . . . . . . . . . . . . . . . . . . . . . . . . . . . 1,238 398
Gross realized investment losses:Net other-than-temporary impairments recognized in earnings(2) . . . . . . . . . . . . . . . . . . . . . . . . . . . . . . . . . . . . . . . . . (150) (263)Gross losses on sales and maturities(1) . . . . . . . . . . . . . . . . . . . . . . . . . . . . . . . . . . . . . . . . . . . . . . . . . . . . . . . . . . . . . . (1,270) (247)Credit related losses on sales . . . . . . . . . . . . . . . . . . . . . . . . . . . . . . . . . . . . . . . . . . . . . . . . . . . . . . . . . . . . . . . . . . . . . . (31) (28)
Total gross realized investment losses . . . . . . . . . . . . . . . . . . . . . . . . . . . . . . . . . . . . . . . . . . . . . . . . . . . . . . . . . . . . . . . . . . (1,451) (538)
Realized investment gains (losses), net—Fixed Maturity Securities . . . . . . . . . . . . . . . . . . . . . . . . . . . . . . . . . . . . . . . . . . . . . . . $ (213) $(140)
Net gains (losses) on sales and maturities—Fixed Maturity Securities(1) . . . . . . . . . . . . . . . . . . . . . . . . . . . . . . . . . . . . . . . . . . . $ (98) $ 128
(1) Amounts exclude prepayment premiums, other-than-temporary impairments, and credit related losses through sales of investments pursuant to our creditrisk objectives.
(2) Excludes the portion of other-than-temporary impairments recorded in “Other comprehensive income (loss),” representing any difference between thefair value of the impaired debt security and the net present value of its projected future cash flows at the time of impairment.
Net losses on sales and maturities of fixed maturity securities of $98 million in 2013 were primarily driven by losses on sales ofsecurities due to changes in interest rates subsequent to the acquisition of securities that were sold, partially offset by gains on sales withinour International Insurance segment initiated for purposes of duration management as well as from surrenders of fixed annuitiesdenominated in Australian and U.S. dollars. Net gains on sales and maturities of fixed maturity securities of $128 million in 2012 wereprimarily due to sales within our International Insurance, Retirement and Individual Annuities segments. See below for informationregarding the other-than-temporary impairments of fixed maturity securities in 2013 and 2012.
Prudential Financial, Inc. 2013 Annual Report 55

Net realized gains on equity securities were $130 million in 2013 and included net gains on sales of equity securities of $142 million,primarily within our International insurance segment, partially offset by other-than-temporary impairments of $12 million. Net realizedlosses on equity securities were $54 million in 2012, including other-than-temporary impairments of $104 million, partially offset by netgains on sales of equity securities of $50 million, primarily within our Corporate and Other operations. See below for additionalinformation regarding the other-than-temporary impairments of equity securities in 2013 and 2012.
Net realized gains on commercial mortgage and other loans were $72 million and $92 million for the years ended in 2013 and 2012,respectively. Both years’ gains were primarily related to a net decrease in the loan loss reserves primarily driven by payoffs and qualityrating upgrades. For additional information regarding our commercial mortgage and other loan loss reserves, see “—General AccountInvestments—Commercial Mortgage and Other Loans—Commercial Mortgage and Other Loan Quality” below.
Net realized losses on derivatives were $5,488 million in 2013, compared to net realized losses of $1,552 million in 2012. The net derivativelosses in 2013 primarily reflect net losses of $4,195 million on product related embedded derivatives and related hedge positions mainly associatedwith certain variable annuity contracts as well as net mark-to-market losses of $987 million on interest rate derivatives used to manage duration aslong-term interest rates increased. Also contributing to the net derivative losses were net losses of $794 million on foreign currency derivatives usedto hedge portfolio assets in our Japan business primarily due to the weakening of the Japanese yen against the U.S. dollar and other currencies.Partially offsetting these losses were net gains of $472 million on foreign currency forward contracts used to hedge the future income of non-U.S.businesses, predominantly in Japan, due to the strengthening of the U.S. dollar against the Japanese yen. The net derivative losses in 2012 primarilyreflect net losses of $1,829 million on product related embedded derivatives and related hedge positions primarily associated with certain variableannuity contracts. Also contributing to the net derivative losses were net losses of $254 million on foreign currency forward contracts used to hedgeportfolio assets in our Japan business primarily due to the weakening of the Japanese yen against the U.S. dollar and other currencies. Partiallyoffsetting these losses were net gains of $121 million primarily representing fees earned on fee-based synthetic guaranteed investment contracts,which are accounted for as derivatives, and net gains of $342 million on foreign currency forward contracts used to hedge the future income of non-U.S. businesses, predominantly in Japan, due to the strengthening of the U.S. dollar against the Japanese yen.
Net realized gains on other investments were $61 million in 2013 and included net gains of $73 million, primarily within our Corporate andOther segment, partially offset by other-than-temporary impairments of $12 million on real estate and joint ventures and partnership investments.Net realized losses on other investments were $30 million in 2012, which included other-than-temporary impairments of $74 million on realestate, joint ventures and partnership investments, partially offset by a $41 million gain related to the sale of a real estate investment.
Related adjustments include the portions of “Realized investment gains (losses), net” that are included in adjusted operating incomeand the portions of “Asset management fees and other income” and “Net investment income” that are excluded from adjusted operatingincome. These adjustments are made to arrive at “Realized investment gains (losses), net, and related adjustments” which are excludedfrom adjusted operating income. Results for 2013 include a net negative related adjustment of $4,518 million, compared to a net negativerelated adjustment of $1,982 million for 2012. The adjustments in both years were primarily driven by the impact of foreign currencyexchange rate movements on certain non-yen denominated assets and liabilities within our Japanese insurance operations for which theforeign currency exposure is economically matched and offset in AOCI. For additional information, see “—Results of Operations forFinancial Services Businesses by Segment—International Insurance Division—Impact of foreign currency exchange rate movements onearnings—U.S. GAAP earnings impact of products denominated in non-local currencies” above.
Charges that relate to “Realized investment gains (losses), net, and related adjustments” are also excluded from adjusted operatingincome, and may be reflected as net charges or net benefits. Results for 2013 include net related benefits of $1,807 million, compared to netrelated benefits of $857 million in 2012. The impacts in both years were primarily driven by the portion of amortization of deferred policyacquisition and other costs relating to changes in value of embedded derivatives and related hedge positions associated with certain variableannuity contracts. For additional information, see Note 22 to the Consolidated Financial Statements.
During 2013, we recorded other-than-temporary impairments of $174 million in earnings, compared to $441 million in 2012. Thefollowing tables set forth, for the periods indicated, the composition of other-than-temporary impairments recorded in earnings attributableto the Financial Services Businesses by asset type, and for fixed maturity securities, by reason.
Year Ended December 31,
2013 2012
(in millions)Other-than-temporary impairments recorded in earnings—Financial Services Businesses(1)
Public fixed maturity securities . . . . . . . . . . . . . . . . . . . . . . . . . . . . . . . . . . . . . . . . . . . . . . . . . . . . . . . . . . . . . . . . . . . . . . . $111 $219Private fixed maturity securities . . . . . . . . . . . . . . . . . . . . . . . . . . . . . . . . . . . . . . . . . . . . . . . . . . . . . . . . . . . . . . . . . . . . . . 39 44
Total fixed maturity securities . . . . . . . . . . . . . . . . . . . . . . . . . . . . . . . . . . . . . . . . . . . . . . . . . . . . . . . . . . . . . . . . . . . 150 263Equity securities . . . . . . . . . . . . . . . . . . . . . . . . . . . . . . . . . . . . . . . . . . . . . . . . . . . . . . . . . . . . . . . . . . . . . . . . . . . . . . . . . . 12 104Other invested assets(2) . . . . . . . . . . . . . . . . . . . . . . . . . . . . . . . . . . . . . . . . . . . . . . . . . . . . . . . . . . . . . . . . . . . . . . . . . . . . 12 74
Total . . . . . . . . . . . . . . . . . . . . . . . . . . . . . . . . . . . . . . . . . . . . . . . . . . . . . . . . . . . . . . . . . . . . . . . . . . . . . . . . . . . . . . . $174 $441
(1) Excludes the portion of other-than-temporary impairments recorded in “Other comprehensive income (loss),” representing any difference between thefair value of the impaired debt security and the net present value of its projected future cash flows at the time of impairment.
(2) Includes other-than-temporary impairments relating to investments in joint ventures and partnerships and real estate investments.
Year Ended December 31,
2013 2012
(in millions)Other-than-temporary impairments on fixed maturity securities recorded in earnings—Financial Services
Businesses(1)Due to credit events or adverse conditions of the respective issuer(2) . . . . . . . . . . . . . . . . . . . . . . . . . . . . . . . . . . . . . . . . . $ 80 $108Due to other accounting guidelines(3) . . . . . . . . . . . . . . . . . . . . . . . . . . . . . . . . . . . . . . . . . . . . . . . . . . . . . . . . . . . . . . . . . 70 155
Total . . . . . . . . . . . . . . . . . . . . . . . . . . . . . . . . . . . . . . . . . . . . . . . . . . . . . . . . . . . . . . . . . . . . . . . . . . . . . . . . . . . . . . . $150 $263
56 Prudential Financial, Inc. 2013 Annual Report

(1) Excludes the portion of other-than-temporary impairment recorded in “Other comprehensive income (loss),” representing any difference between thefair value of the impaired debt security and the net present value of its projected future cash flows at the time of impairment.
(2) Represents circumstances where we believe credit events or other adverse conditions of the respective issuers have caused, or will lead to, a deficiencyin the contractual cash flows related to the investment. The amount of the impairment recorded in earnings is the difference between the amortized costof the debt security and the net present value of its projected future cash flows discounted at the effective interest rate implicit in the debt security priorto impairment.
(3) Primarily represents circumstances where securities with losses from foreign currency exchange rate movements approach maturity.
Fixed maturity other-than-temporary impairments in 2013 were concentrated in asset-backed securities collateralized by sub-primemortgages, and in the utility, communications, and consumer non-cyclical sectors within corporate securities. These other-than-temporaryimpairments were primarily related to intent to sell securities or related to securities with liquidity concerns, downgrades in credit,bankruptcy or other adverse financial conditions of the respective issuers. Fixed maturity security other-than-temporary impairments in2012 were concentrated in the consumer non-cyclical, technology, and utility sectors within corporate securities and, to a lesser extent,within asset-backed securities collateralized by sub-prime mortgages. These other-than-temporary impairments were primarily related tosecurities with unrealized losses from foreign currency exchange rate movements that are approaching maturity or related to securities withliquidity concerns, downgrades in credit, bankruptcy or other adverse financial conditions of the respective issuers.
Equity security other-than-temporary impairments in 2013 were primarily driven by circumstances where the decline in value wasmaintained for one year or greater or due to the extent and duration of declines in values. Equity security other-than-temporary impairmentsin 2012 were primarily driven by circumstances where the decline in value was maintained for one year or greater or where we intended tosell the security.
Closed Block Business
For the Closed Block Business, net realized investment gains were $232 million in 2013, compared to net realized investment gains of$243 million in 2012.
Net realized gains on fixed maturity securities were $120 million in 2013, compared to net realized gains of $103 million in 2012, asset forth in the following table:
Year Ended December 31,
2013 2012
(in millions)Realized investment gains (losses), net—Fixed Maturity Securities—Closed Block Business
Gross realized investment gains:Gross gains on sales and maturities(1) . . . . . . . . . . . . . . . . . . . . . . . . . . . . . . . . . . . . . . . . . . . . . . . . . . . . . . . . . . . . . $ 300 $ 243Private bond prepayment premiums . . . . . . . . . . . . . . . . . . . . . . . . . . . . . . . . . . . . . . . . . . . . . . . . . . . . . . . . . . . . . . . 33 18
Total gross realized investment gains . . . . . . . . . . . . . . . . . . . . . . . . . . . . . . . . . . . . . . . . . . . . . . . . . . . . . . . . . . . . . . . . . . 333 261
Gross realized investment losses:Net other-than-temporary impairments recognized in earnings(2) . . . . . . . . . . . . . . . . . . . . . . . . . . . . . . . . . . . . . . . . (49) (74)Gross losses on sales and maturities(1) . . . . . . . . . . . . . . . . . . . . . . . . . . . . . . . . . . . . . . . . . . . . . . . . . . . . . . . . . . . . . (149) (56)Credit related losses on sales . . . . . . . . . . . . . . . . . . . . . . . . . . . . . . . . . . . . . . . . . . . . . . . . . . . . . . . . . . . . . . . . . . . . (15) (28)
Total gross realized investment losses . . . . . . . . . . . . . . . . . . . . . . . . . . . . . . . . . . . . . . . . . . . . . . . . . . . . . . . . . . . . . . . . . (213) (158)
Realized investment gains (losses), net—Fixed Maturity Securities . . . . . . . . . . . . . . . . . . . . . . . . . . . . . . . . . . . . . . . . . . . . . . $ 120 $ 103
Net gains (losses) on sales and maturities—Fixed Maturity Securities(1) . . . . . . . . . . . . . . . . . . . . . . . . . . . . . . . . . . . . . . . . . . $ 151 $ 187
(1) Amounts exclude prepayment premiums, other-than-temporary impairments, and credit related losses through sales of investments pursuant to our creditrisk objectives.
(2) Excludes the portion of other-than-temporary impairments recorded in “Other comprehensive income (loss),” representing any difference between thefair value of the impaired debt security and the net present value of its projected future cash flows at the time of impairment.
Net realized gains on equity securities were $314 million in 2013 and included net gains on sales of equity securities of $317 million,partially offset by other-than-temporary impairments of $3 million. Net realized gains on equity securities were $78 million in 2012 andincluded net gains on sales of equity securities of $99 million, partially offset by other-than-temporary impairments of $21 million. Seebelow for additional information regarding the other-than-temporary impairments of equity securities in 2013 and 2012.
Net realized gains on commercial mortgage and other loans were $7 million and $2 million for the years ended 2013 and 2012, respectively.Both years primarily related to a net decrease in the loan loss reserve. For additional information regarding our loan loss reserves, see “—GeneralAccount Investments—Commercial Mortgage and Other Loans—Commercial Mortgage and Other Loan Quality” below.
Net realized losses on derivatives were $200 million in 2013, compared to net realized gains of $52 million in 2012. Derivative lossesin 2013 primarily reflect net losses of $106 million on interest rate derivatives primarily used to manage duration as long term interest ratesincreased as well as losses of $74 million on currency derivatives used to hedge foreign denominated investments as the U.S. dollarweakened against the euro. Derivative gains in 2012 primarily reflect net gains of $80 million on interest rate derivatives primarily used tomanage duration and net gains of $26 million on “to be announced” (“TBA”) forward contracts as interest rates declined, partially offset bynet losses of $16 million on credit default swaps as credit spreads tightened and net losses of $42 million on currency derivatives used tohedge foreign denominated investments as the U.S. dollar weakened against the euro and other currencies.
Prudential Financial, Inc. 2013 Annual Report 57

During 2013, we recorded other-than-temporary impairments of $62 million in earnings, compared to other-than-temporary impairments of$99 million recorded in earnings in 2012. The following tables set forth, for the periods indicated, the composition of other-than-temporaryimpairments recorded in earnings attributable to the Closed Block Business by asset type, and for fixed maturity securities, by reason.
Year Ended December 31,
2013 2012
(in millions)Other-than-temporary impairments recorded in earnings—Closed Block Business(1)
Public fixed maturity securities . . . . . . . . . . . . . . . . . . . . . . . . . . . . . . . . . . . . . . . . . . . . . . . . . . . . . . . . . . . . . . . . . . . . . . . $28 $56Private fixed maturity securities . . . . . . . . . . . . . . . . . . . . . . . . . . . . . . . . . . . . . . . . . . . . . . . . . . . . . . . . . . . . . . . . . . . . . . 21 18
Total fixed maturity securities . . . . . . . . . . . . . . . . . . . . . . . . . . . . . . . . . . . . . . . . . . . . . . . . . . . . . . . . . . . . . . . . . . . 49 74Equity securities . . . . . . . . . . . . . . . . . . . . . . . . . . . . . . . . . . . . . . . . . . . . . . . . . . . . . . . . . . . . . . . . . . . . . . . . . . . . . . . . . . 3 21Other invested assets(2) . . . . . . . . . . . . . . . . . . . . . . . . . . . . . . . . . . . . . . . . . . . . . . . . . . . . . . . . . . . . . . . . . . . . . . . . . . . . 10 4
Total . . . . . . . . . . . . . . . . . . . . . . . . . . . . . . . . . . . . . . . . . . . . . . . . . . . . . . . . . . . . . . . . . . . . . . . . . . . . . . . . . . . . . . . $62 $99
(1) Excludes the portion of other-than-temporary impairments recorded in “Other comprehensive income (loss),” representing any difference between thefair value of the impaired debt security and the net present value of its projected future cash flows at the time of impairment.
(2) Includes other-than-temporary impairments relating to investments in joint ventures and partnerships.
Year Ended December 31,
2013 2012
(in millions)Other-than-temporary impairments on fixed maturity securities recorded in earnings—Closed Block Business(1)
Due to credit events or adverse conditions of the respective issuer(2) . . . . . . . . . . . . . . . . . . . . . . . . . . . . . . . . . . . . . . . . . $44 $72Due to other accounting guidelines . . . . . . . . . . . . . . . . . . . . . . . . . . . . . . . . . . . . . . . . . . . . . . . . . . . . . . . . . . . . . . . . . . . . 5 2
Total . . . . . . . . . . . . . . . . . . . . . . . . . . . . . . . . . . . . . . . . . . . . . . . . . . . . . . . . . . . . . . . . . . . . . . . . . . . . . . . . . . . . . . . $49 $74
(1) Excludes the portion of other-than-temporary impairment recorded in “Other comprehensive income (loss),” representing any difference between thefair value of the impaired debt security and the net present value of its projected future cash flows at the time of impairment.
(2) Represents circumstances where we believe credit events or other adverse conditions of the respective issuers have caused, or will lead to, a deficiencyin the contractual cash flows related to the investment. The amount of the impairment recorded in earnings is the difference between the amortized costof the debt security and the net present value of its projected future cash flows discounted at the effective interest rate implicit in the debt security priorto impairment.
Fixed maturity other-than-temporary impairments in 2013 were concentrated in asset-backed securities collateralized by sub-primemortgages and in the utility and consumer non-cyclical sectors within corporate securities. Fixed maturity security other-than-temporaryimpairments in 2012 were concentrated in asset-backed securities collateralized by sub-prime mortgages and the utility and capital goodssectors within corporate securities and reflect adverse financial conditions of the respective issuers.
Equity security other-than-temporary impairments in 2013 and 2012 were primarily due to circumstances where the decline in valuewas maintained for one year or greater.
2012 to 2011 Annual Comparison
Financial Services BusinessesThe Financial Services Businesses’ net realized investment losses were $1,684 million in 2012, compared to net realized investment
gains of $1,986 million in 2011.
Net realized losses on fixed maturity securities were $140 million in 2012, compared to net realized losses of $125 million in 2011, asset forth in the following table:
Year Ended December 31,
2012 2011
(in millions)Realized investment gains (losses), net—Fixed Maturity Securities—Financial Services Businesses
Gross realized investment gains:Gross gains on sales and maturities(1) . . . . . . . . . . . . . . . . . . . . . . . . . . . . . . . . . . . . . . . . . . . . . . . . . . . . . . . . . . . . . . $ 375 $ 527Private bond prepayment premiums . . . . . . . . . . . . . . . . . . . . . . . . . . . . . . . . . . . . . . . . . . . . . . . . . . . . . . . . . . . . . . . . 23 36
Total gross realized investment gains . . . . . . . . . . . . . . . . . . . . . . . . . . . . . . . . . . . . . . . . . . . . . . . . . . . . . . . . . . . . . . . . . . . 398 563
Gross realized investment losses:Net other-than-temporary impairments recognized in earnings(2) . . . . . . . . . . . . . . . . . . . . . . . . . . . . . . . . . . . . . . . . . (263) (431)Gross losses on sales and maturities(1) . . . . . . . . . . . . . . . . . . . . . . . . . . . . . . . . . . . . . . . . . . . . . . . . . . . . . . . . . . . . . . (247) (250)Credit related losses on sales . . . . . . . . . . . . . . . . . . . . . . . . . . . . . . . . . . . . . . . . . . . . . . . . . . . . . . . . . . . . . . . . . . . . . . (28) (7)
Total gross realized investment losses . . . . . . . . . . . . . . . . . . . . . . . . . . . . . . . . . . . . . . . . . . . . . . . . . . . . . . . . . . . . . . . . . . (538) (688)
Realized investment gains (losses), net—Fixed Maturity Securities . . . . . . . . . . . . . . . . . . . . . . . . . . . . . . . . . . . . . . . . . . . . . . . $(140) $(125)
Net gains (losses) on sales and maturities—Fixed Maturity Securities(1) . . . . . . . . . . . . . . . . . . . . . . . . . . . . . . . . . . . . . . . . . . . $ 128 $ 277
(1) Amounts exclude prepayment premiums, other-than-temporary impairments, and credit related losses through sales of investments pursuant to our creditrisk objectives.
(2) Excludes the portion of other-than-temporary impairments recorded in “Other comprehensive income (loss),” representing any difference between thefair value of the impaired debt security and the net present value of its projected future cash flows at the time of impairment.
58 Prudential Financial, Inc. 2013 Annual Report

Net gains on sales and maturities of fixed maturity securities of $128 million in 2012 were primarily within our InternationalInsurance, Retirement and Individual Annuities segments. Net gains on sales and maturities of fixed maturity securities of $277 million in2011 were primarily within our Retirement and Individual Annuities segments. These gains also included $35 million of gross gains relatedto the sale of asset-backed securities collateralized by sub-prime mortgages. Sales of fixed maturity securities in our Individual Annuitiessegment in both years were primarily due to transfers of investments out of our general account and into separate accounts relating to anautomatic rebalancing element embedded in the living benefit features of some of our variable annuity products. See below for additionalinformation regarding the other-than-temporary impairments of fixed maturity securities in 2012 and 2011.
Net realized losses on equity securities were $54 million in 2012, including other-than-temporary impairments of $104 million,partially offset by net gains on sales of equity securities of $50 million, primarily within our Corporate and Other operations. Net realizedlosses on equity securities were $120 million in 2011, including other-than-temporary impairments of $94 million and net losses on sales ofequity securities of $26 million. Net losses in 2011 were primarily within our International Insurance operations. See below for additionalinformation regarding the other-than-temporary impairments of equity securities in 2012 and 2011.
Net realized gains on commercial mortgage and other loans in 2012 were $92 million, primarily related to a net decrease in the loanloss reserves driven by payoffs and quality rating upgrades. Net realized gains on commercial mortgage and other loans in 2011 were $89million, primarily related to $32 million of mark-to-market gains on our interim loan portfolio, a net decrease of $30 million in the loanloss reserves driven by quality rating upgrades, and $27 million of gains within our Asset Management business.
Net realized losses on derivatives were $1,552 million in 2012, compared to net realized gains of $2,095 million in 2011. The net derivativelosses in 2012 primarily reflect net losses of $1,829 million on product related embedded derivatives and related hedge positions primarilyassociated with certain variable annuity contracts. Also contributing to the net derivative losses were net losses of $254 million on foreigncurrency forward contracts used to hedge portfolio assets in our Japan business primarily due to the weakening of the Japanese yen against theU.S. dollar, Australian dollar, euro, and British pound. Partially offsetting these loses were net gains of $121 million primarily representing riskfees earned on synthetic guaranteed investment contracts in our Retirement businesses which are accounted for as derivatives under U.S. GAAP,and net gains of $342 million on foreign currency forward contracts used to hedge the future income of non-U.S. businesses, primarily in Japan,due to the strengthening of the U.S. dollar against the Japanese yen. The net derivative gains in 2011 primarily reflect net gains of $1,375 millionon embedded derivatives and related hedge positions associated with certain variable annuity contracts. Also contributing to the net derivativegains were mark-to-market gains of $498 million on interest rate derivatives used to manage duration as interest rates declined, and net gains of$214 million on foreign currency forward contracts used in our Japan business to hedge portfolio assets primarily due to the strengthening of theJapanese yen against the U.S. dollar and Australian dollar. See “—Results of Operations for Financial Services Businesses by Segment—U.S.Retirement Solutions and Investment Management Division—Individual Annuities” for additional information regarding the product relatedembedded derivatives and related hedge positions associated with certain variable annuity contracts.
Net realized losses on other investments were $30 million in 2012 and included other-than-temporary impairments of $74 million on realestate and joint ventures and partnership investments, partially offset by a $41 million gain related to the sale of a real estate investment. Netrealized gains on other investments were $47 million in 2011 and primarily included a $64 million gain on the partial sale of a real estate seedinvestment, partially offset by $33 million of other-than-temporary impairments on real estate, joint ventures and partnership investments.
Related adjustments include the portions of “Realized investment gains (losses), net” that are included in adjusted operating incomeand the portions of “Asset management fees and other income” and “Net investment income” that are excluded from adjusted operatingincome. These adjustments are made to arrive at “Realized investment gains (losses), net, and related adjustments” which are excludedfrom adjusted operating income. Results for 2012 include a net negative related adjustment of $1,982 million, compared to a net positiverelated adjustment of $517 million for 2011. The adjustments in both years were primarily driven by the impact of foreign currencyexchange rate movements on certain non-yen denominated assets and liabilities within our Japanese insurance operations for which theforeign currency exposure is economically matched and offset in AOCI. For additional information, see “—Results of Operations forFinancial Services Businesses by Segment—International Insurance Division—Impact of foreign currency exchange rate movements onearnings—U.S. GAAP earnings impact of products denominated in non-local currencies” above.
Charges that relate to “Realized investment gains (losses), net, and related adjustments” are also excluded from adjusted operatingincome, and may be reflected as net charges or net benefits. Results for 2012 include net related benefits of $857 million, compared to netrelated charges of $1,656 million in 2011. The impacts in both years were primarily driven by the portion of amortization of deferred policyacquisition and other costs relating to changes in value of embedded derivatives and related hedge positions associated with certain variableannuity contracts. For additional information, see Note 22 to the Consolidated Financial Statements.
During 2012 we recorded other-than-temporary impairments of $441 million in earnings, compared to total other-than-temporaryimpairments of $558 million recorded in earnings in 2011. The following tables set forth, for the periods indicated, the composition ofother-than-temporary impairments recorded in earnings attributable to the Financial Services Businesses by asset type, and for fixedmaturity securities, by reason.
Year Ended December 31,
2012 2011
(in millions)Other-than-temporary impairments recorded in earnings—Financial Services Businesses(1)
Public fixed maturity securities . . . . . . . . . . . . . . . . . . . . . . . . . . . . . . . . . . . . . . . . . . . . . . . . . . . . . . . . . . . . . . . . . . . . . . . . $219 $314Private fixed maturity securities . . . . . . . . . . . . . . . . . . . . . . . . . . . . . . . . . . . . . . . . . . . . . . . . . . . . . . . . . . . . . . . . . . . . . . . 44 117
Total fixed maturity securities . . . . . . . . . . . . . . . . . . . . . . . . . . . . . . . . . . . . . . . . . . . . . . . . . . . . . . . . . . . . . . . . . . . . 263 431Equity securities . . . . . . . . . . . . . . . . . . . . . . . . . . . . . . . . . . . . . . . . . . . . . . . . . . . . . . . . . . . . . . . . . . . . . . . . . . . . . . . . . . . 104 94Other invested assets(2) . . . . . . . . . . . . . . . . . . . . . . . . . . . . . . . . . . . . . . . . . . . . . . . . . . . . . . . . . . . . . . . . . . . . . . . . . . . . . 74 33
Total . . . . . . . . . . . . . . . . . . . . . . . . . . . . . . . . . . . . . . . . . . . . . . . . . . . . . . . . . . . . . . . . . . . . . . . . . . . . . . . . . . . . . . . . $441 $558
Prudential Financial, Inc. 2013 Annual Report 59

(1) Excludes the portion of other-than-temporary impairments recorded in “Other comprehensive income (loss),” representing any difference between thefair value of the impaired debt security and the net present value of its projected future cash flows at the time of impairment.
(2) Includes other-than-temporary impairments relating to investments in joint ventures and partnerships and real estate investments.
Year Ended December 31,
2012 2011
(in millions)Other-than-temporary impairments on fixed maturity securities recorded in earnings—Financial Services
Businesses(1)Due to credit events or adverse conditions of the respective issuer(2) . . . . . . . . . . . . . . . . . . . . . . . . . . . . . . . . . . . . . . . . . . $108 $223Due to other accounting guidelines(3) . . . . . . . . . . . . . . . . . . . . . . . . . . . . . . . . . . . . . . . . . . . . . . . . . . . . . . . . . . . . . . . . . . 155 208
Total . . . . . . . . . . . . . . . . . . . . . . . . . . . . . . . . . . . . . . . . . . . . . . . . . . . . . . . . . . . . . . . . . . . . . . . . . . . . . . . . . . . . . . . . $263 $431
(1) Excludes the portion of other-than-temporary impairments recorded in “Other comprehensive income (loss),” representing any difference between thefair value of the impaired debt security and the net present value of its projected future cash flows at the time of impairment.
(2) Represents circumstances where we believe credit events or other adverse conditions of the respective issuers have caused, or will lead to, a deficiency in thecontractual cash flows related to the investment. The amount of the impairment recorded in earnings is the difference between the amortized cost of the debtsecurity and the net present value of its projected future cash flows discounted at the effective interest rate implicit in the debt security prior to impairment.
(3) Primarily represents circumstances where securities with losses from foreign currency exchange rate movements approach maturity or where we intendto sell the security or more likely than not will be required to sell the security before recovery of its amortized cost basis.
During 2012, we recorded other-than-temporary impairments in earnings related to securities with unrealized losses from foreigncurrency exchange rate movements that are approaching maturity. Fixed maturity other-than-temporary impairments in 2012 wereconcentrated in the consumer non-cyclical, technology, and utility sectors of our corporate securities and, to a lesser extent, within asset-backed securities collateralized by sub-prime mortgages. These other-than-temporary impairments were primarily related to securities withunrealized losses from foreign currency exchange rate movements that are approaching maturity or related to securities with liquidityconcerns, downgrades in credit, bankruptcy or other adverse financial conditions of the respective issuers. Fixed maturity other-than-temporary impairments in 2011 were concentrated in the utility, finance, and consumer non-cyclical sectors of our corporate securities aswell as asset-backed securities collateralized by sub-prime mortgages. Additionally, other-than-temporary impairments were driven byJapanese commercial mortgage-backed securities that reflect adverse financial conditions of the respective issuers, and foreign currencytranslation losses related to foreign denominated securities that are approaching maturity.
Equity security other-than-temporary impairments in 2012 and 2011 were primarily in our Japanese insurance operations where thesecurities’ decline in value has been was maintained for one year or greater or where we intended to sell the security.
Other invested assets other-than-temporary-impairments in 2012 and 2011 were mainly driven by a decline in value on certain realestate, joint ventures and partnership investments.
Closed Block BusinessFor the Closed Block Business, net realized investment gains were $243 million in 2012, compared to net realized investment gains of
$845 million in 2011.
Net realized gains on fixed maturity securities were $103 million in 2012, compared to net realized gains of $355 million in 2011, asset forth in the following table:
Year Ended December 31,
2012 2011
(in millions)Realized investment gains (losses), net—Fixed Maturity Securities—Closed Block Business
Gross realized investment gains:Gross gains on sales and maturities(1) . . . . . . . . . . . . . . . . . . . . . . . . . . . . . . . . . . . . . . . . . . . . . . . . . . . . . . . . . . . . . . $ 243 $ 516Private bond prepayment premiums . . . . . . . . . . . . . . . . . . . . . . . . . . . . . . . . . . . . . . . . . . . . . . . . . . . . . . . . . . . . . . . . 18 21
Total gross realized investment gains . . . . . . . . . . . . . . . . . . . . . . . . . . . . . . . . . . . . . . . . . . . . . . . . . . . . . . . . . . . . . . . . . . . 261 537
Gross realized investment losses:Net other-than-temporary impairments recognized in earnings(2) . . . . . . . . . . . . . . . . . . . . . . . . . . . . . . . . . . . . . . . . . (74) (104)Gross losses on sales and maturities(1) . . . . . . . . . . . . . . . . . . . . . . . . . . . . . . . . . . . . . . . . . . . . . . . . . . . . . . . . . . . . . . (56) (75)Credit related losses on sales . . . . . . . . . . . . . . . . . . . . . . . . . . . . . . . . . . . . . . . . . . . . . . . . . . . . . . . . . . . . . . . . . . . . . . (28) (3)
Total gross realized investment losses . . . . . . . . . . . . . . . . . . . . . . . . . . . . . . . . . . . . . . . . . . . . . . . . . . . . . . . . . . . . . . . . . . (158) (182)
Realized investment gains (losses), net—Fixed Maturity Securities . . . . . . . . . . . . . . . . . . . . . . . . . . . . . . . . . . . . . . . . . . . . . . . $ 103 $ 355
Net gains (losses) on sales and maturities—Fixed Maturity Securities(1) . . . . . . . . . . . . . . . . . . . . . . . . . . . . . . . . . . . . . . . . . . . $ 187 $ 441
(1) Amounts exclude prepayment premiums, other-than-temporary impairments, and credit related losses through sales of investments pursuant to our creditrisk objectives.
(2) Excludes the portion of other-than-temporary impairments recorded in “Other comprehensive income (loss),” representing any difference between thefair value of the impaired debt security and the net present value of its projected future cash flows at the time of impairment.
Net realized gains on equity securities were $78 million in 2012 and included net gains on sales of equity securities of $99 million,partially offset by other-than-temporary impairments of $21 million. Net realized gains on equity securities were $265 million in 2011 andincluded net gains on sales of equity securities of $283 million, partially offset by other-than-temporary impairments of $18 million. Seebelow for additional information regarding the other-than-temporary impairments of equity securities in 2012 and 2011.
60 Prudential Financial, Inc. 2013 Annual Report
Net realized gains on commercial mortgage and other loans in 2012 were $2 million related to a net decrease in the loan loss reserve.Net realized gains on commercial mortgage and other loans in 2011 were $33 million, primarily related to a net decrease in the loan lossreserve of $42 million, partially offset by net realized losses on related foreclosures.
Net realized gains on derivatives were $52 million in 2012, compared to net realized gains of $199 million in 2011. Derivative gainsin 2012 primarily reflect net gains of $80 million on interest rate derivatives primarily used to manage duration and net gains of $26 millionon “to be announced” (“TBA”) forward contracts as interest rates declined, partially offset by net losses of $16 million on credit defaultswaps as credit spreads tightened and net losses of $42 million on currency derivatives used to hedge foreign denominated investments asthe U.S. dollar weakened against the euro and other currencies. Derivative gains in 2011 primarily reflect net gains of $135 million oninterest rate derivatives used to manage duration, and $53 million on TBA forward contracts as interest rates declined. Also contributing tothese gains are net derivative gains of $23 million on currency derivatives used to hedge foreign denominated investments as the U.S.dollar strengthened against the euro. Partially offsetting these gains were net derivative losses of $11 million on embedded derivativesassociated with certain externally-managed investments in the European market.
During 2012, we recorded other-than-temporary impairments of $99 million in earnings, compared to $127 million in 2011. Thefollowing tables set forth, for the periods indicated, the composition of other-than-temporary impairments recorded in earnings attributableto the Closed Block Business by asset type, and for fixed maturity securities, by reason.
Year Ended December 31,
2012 2011
(in millions)Other-than-temporary impairments recorded in earnings—Closed Block Business(1)
Public fixed maturity securities . . . . . . . . . . . . . . . . . . . . . . . . . . . . . . . . . . . . . . . . . . . . . . . . . . . . . . . . . . . . . . . . . . . . . . . . $56 $ 90Private fixed maturity securities . . . . . . . . . . . . . . . . . . . . . . . . . . . . . . . . . . . . . . . . . . . . . . . . . . . . . . . . . . . . . . . . . . . . . . . 18 14
Total fixed maturity securities . . . . . . . . . . . . . . . . . . . . . . . . . . . . . . . . . . . . . . . . . . . . . . . . . . . . . . . . . . . . . . . . . . . . 74 104Equity securities . . . . . . . . . . . . . . . . . . . . . . . . . . . . . . . . . . . . . . . . . . . . . . . . . . . . . . . . . . . . . . . . . . . . . . . . . . . . . . . . . . . 21 18Other invested assets(2) . . . . . . . . . . . . . . . . . . . . . . . . . . . . . . . . . . . . . . . . . . . . . . . . . . . . . . . . . . . . . . . . . . . . . . . . . . . . . 4 5
Total . . . . . . . . . . . . . . . . . . . . . . . . . . . . . . . . . . . . . . . . . . . . . . . . . . . . . . . . . . . . . . . . . . . . . . . . . . . . . . . . . . . . . . . . $99 $127
(1) Excludes the portion of other-than-temporary impairments recorded in “Other comprehensive income (loss),” representing any difference between thefair value of the impaired debt security and the net present value of its projected future cash flows at the time of impairment.
(2) Includes other-than-temporary impairments relating to investments in joint ventures and partnerships.
Year Ended December 31,
2012 2011
(in millions)Other-than-temporary impairments on fixed maturity securities recorded in earnings—Closed Block Business(1)
Due to credit events or adverse conditions of the respective issuer(2) . . . . . . . . . . . . . . . . . . . . . . . . . . . . . . . . . . . . . . . . . . $72 $ 97Due to other accounting guidelines . . . . . . . . . . . . . . . . . . . . . . . . . . . . . . . . . . . . . . . . . . . . . . . . . . . . . . . . . . . . . . . . . . . . . 2 7
Total . . . . . . . . . . . . . . . . . . . . . . . . . . . . . . . . . . . . . . . . . . . . . . . . . . . . . . . . . . . . . . . . . . . . . . . . . . . . . . . . . . . . . . . . $74 $104
(1) Excludes the portion of other-than-temporary impairments recorded in “Other comprehensive income (loss),” representing any difference between thefair value of the impaired debt security and the net present value of its projected future cash flows at the time of impairment.
(2) Represents circumstances where we believe credit events or other adverse conditions of the respective issuers have caused, or will lead to, a deficiency in thecontractual cash flows related to the investment. The amount of the impairment recorded in earnings is the difference between the amortized cost of the debtsecurity and the net present value of its projected future cash flows discounted at the effective interest rate implicit in the debt security prior to impairment.
Fixed maturity other-than-temporary impairments of in 2012 were concentrated in asset-backed securities collateralized by sub-primemortgages, and in the utility and capital goods sectors within corporate securities. Other-than-temporary impairments in 2011 wereconcentrated in asset-backed securities collateralized by sub-prime mortgages, and the utility and consumer cyclical sectors withincorporate securities and reflect adverse financial conditions of the respective issuers.
Equity security other-than-temporary impairments in 2012 and 2011 were primarily due to circumstances where the decline in valuewas maintained for one year or greater.
General Account InvestmentsWe maintain diversified investment portfolios in our general account to support our liabilities to customers in our Financial Services
Businesses and the Closed Block Business, as well as our other general liabilities. Our general account does not include: (1) assets of ourderivative operations; (2) assets of our asset management operations, including assets managed for third parties; and (3) those assetsclassified as “Separate account assets” on our balance sheet.
The general account portfolios are managed pursuant to the distinct objectives and investment policy statements of the FinancialServices Businesses and the Closed Block Business. The primary investment objectives of the Financial Services Businesses include:
• hedging the market risk characteristics of the major product liabilities and other obligations of the Company;
• optimizing investment income yield within risk constraints over time; and
• for certain portfolios, optimizing total return, including both investment income yield and capital appreciation, within riskconstraints over time, while managing the market risk exposures associated with the corresponding product liabilities.
Prudential Financial, Inc. 2013 Annual Report 61

We pursue our objective to optimize investment income yield for the Financial Services Businesses over time through: (1) theinvestment of net operating cash flow, including new product premium inflows, and proceeds from investment sales, repayments andprepayments, into investments with attractive risk-adjusted yields, and (2) where appropriate, the sale of lower yielding investments, eitherto meet various cash flow needs or to manage the portfolio’s risk exposure profile with respect to duration, credit, currency and other riskfactors, while considering the impact on taxes and capital.
The primary investment objectives of the Closed Block Business include:
• providing for the reasonable dividend expectations of the participating policyholders within the Closed Block Business and theClass B shareholders; and
• optimizing total return, including both investment income yield and capital appreciation, within risk constraints, while managing themarket risk exposures associated with the major products in the Closed Block Business.
Our portfolio management approach, while emphasizing our investment income yield and asset/liability risk management objectives, alsotakes into account the capital and tax implications of portfolio activity, our assertions regarding our ability and intent to hold equity securities torecovery, and our lack of any intention or requirement to sell debt securities before anticipated recovery. For a further discussion of our policiesregarding other-than-temporary impairments, including our assertions regarding our ability and intent to hold equity securities to recovery andany intention or requirement to sell debt securities before anticipated recovery, see “—Fixed Maturity Securities—Other-than-TemporaryImpairments of Fixed Maturity Securities” and “—Equity Securities—Other-than-Temporary Impairments of Equity Securities,” below.
Management of InvestmentsThe Investment Committee of our Board of Directors oversees our proprietary investments, including our general account portfolios. It also
regularly reviews performance and risk positions. Our Chief Investment Officer Organization (“CIO Organization”) works with our Risk Managementgroup to develop the investment policies for the general account portfolios of our domestic and international insurance subsidiaries, and directs andoversees management of the general account portfolios within risk limits and exposure ranges approved annually by the Investment Committee.
The CIO Organization, including related functions within our insurance subsidiaries, works closely with product actuaries and RiskManagement to understand the characteristics of our products and their associated market risk exposures. This information is incorporated intothe development of target asset portfolios that hedge market risk exposures associated with the liability characteristics and establish investmentrisk exposures, within tolerances prescribed by Prudential’s investment risk limits, on which we expect to earn an attractive risk-adjusted return.We develop asset strategies for specific classes of product liabilities and attributed or accumulated surplus, each with distinct risk characteristics.Market risk exposures associated with the liabilities include interest rate risk which is addressed through the duration characteristics of the targetasset mix, and currency risk which is addressed by the currency profile of the target asset mix. In certain of our smaller markets, outside of theU.S. and Japan, capital markets limitations hinder our ability to hedge interest rate exposure to the same extent we do for our U.S. and Japanbusinesses and lead us to accept a higher degree of interest rate risk in these smaller portfolios. General account portfolios typically includeallocations to credit and other investment risks as a means to enhance investment yields and returns over time.
Most of our products can be categorized into the following three classes:• interest-crediting products for which the rates credited to customers are periodically adjusted to reflect market and competitive
forces and actual investment experience, such as fixed annuities and universal life insurance;• participating individual and experience-rated group products in which customers participate in actual investment and business
results through annual dividends, interest or return of premium; and• products with fixed or guaranteed terms, such as traditional whole life and endowment products, guaranteed investment contracts,
funding agreements and payout annuities.
Our total investment portfolio is composed of a number of operating portfolios. Each operating portfolio backs a specific set ofliabilities and the portfolios have a target asset mix that supports the liability characteristics, including duration, cash flow, liquidity needsand other criteria. As of December 31, 2013, the average duration of our general account investment portfolios attributable to the domesticFinancial Services Businesses, including the impact of derivatives, is between 6 and 7 years. As of December 31, 2013, the average durationof our general account portfolios attributable to our Japanese insurance operations, including the impact of derivatives, is approximately10 years, and represents a blend of yen-denominated and U.S. and Australian dollar-denominated investments, which have distinct averagedurations. Our asset/liability management process has enabled us to successfully manage our portfolios through several market cycles.
We implement our portfolio strategies primarily through investment in a broad range of fixed income assets, including governmentand agency securities, public and private corporate bonds and structured securities, and commercial mortgage loans. In addition, we holdsmall allocations of non-coupon assets, which include equity securities and other long-term investments such as joint ventures and limitedpartnerships, real estate held through direct ownership, and seed money investments in separate accounts.
We manage our public fixed maturity portfolio to a risk profile directed or overseen by the CIO Organization and Risk Managementgroups and to a profile that also reflects the local market environments impacting both our domestic and international insurance portfolios.The return that we earn on the portfolio will be reflected both as investment income and also as realized gains or losses on investments.
We use privately-placed corporate debt securities and commercial mortgage loans, which consist of well-underwritten mortgages ondiversified properties in terms of geography, property type and borrowers, to enhance the yield on our portfolio and to improve the overalldiversification of the portfolios. Private placements typically offer enhanced yields due to an illiquidity premium and generally offerenhanced credit protection in the form of covenants. Our origination capability offers the opportunity to lead transactions and gives us theopportunity for better terms, including covenants and call protection, and to take advantage of innovative deal structures.
Derivative strategies are employed in the context of our risk management framework to enhance our ability to manage interest rate andcurrency risk exposures of the asset portfolio relative to the liabilities and to manage credit and equity positions in the investmentportfolios. For a discussion of our risk management process, see “Quantitative and Qualitative Disclosures About Market Risk” below.
Our portfolio asset allocation reflects our emphasis on diversification across asset classes, sectors, and issuers. The CIO Organization, directlyand through related functions within the insurance subsidiaries, implements portfolio strategies primarily through various asset management unitswithin Prudential’s Asset Management segment. Activities of the Asset Management segment on behalf of the general account portfolios aredirected and overseen by the CIO Organization and monitored by Risk Management for compliance with investment risk limits.
62 Prudential Financial, Inc. 2013 Annual Report
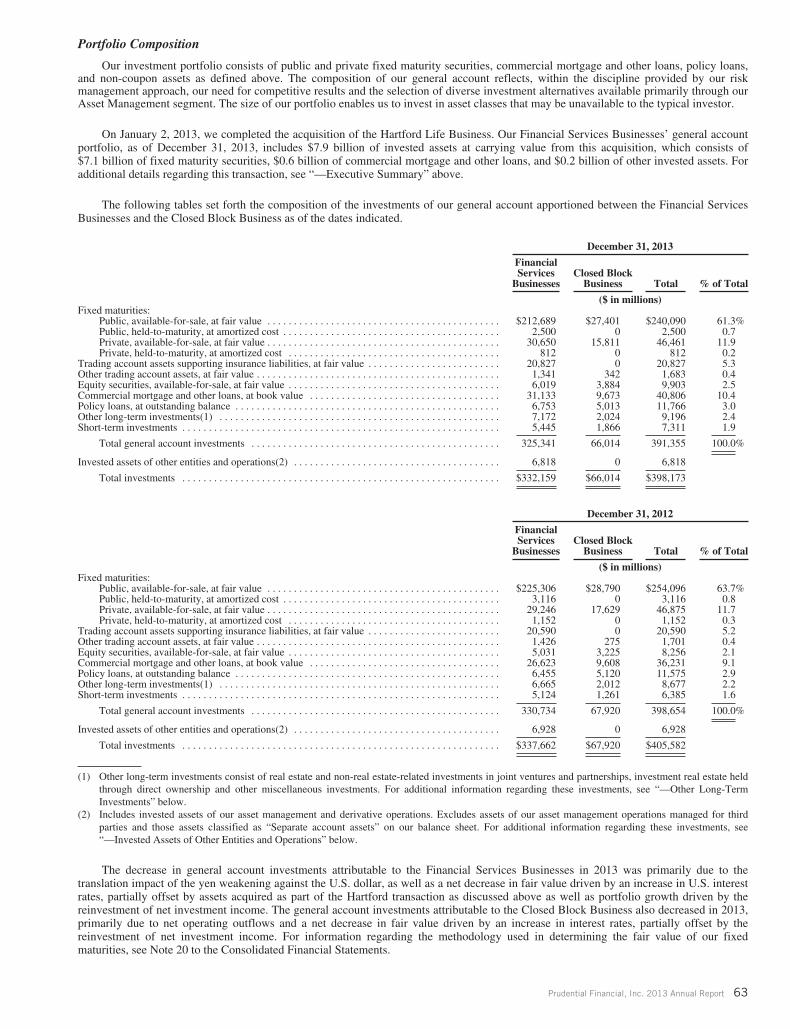
Portfolio Composition
Our investment portfolio consists of public and private fixed maturity securities, commercial mortgage and other loans, policy loans,and non-coupon assets as defined above. The composition of our general account reflects, within the discipline provided by our riskmanagement approach, our need for competitive results and the selection of diverse investment alternatives available primarily through ourAsset Management segment. The size of our portfolio enables us to invest in asset classes that may be unavailable to the typical investor.
On January 2, 2013, we completed the acquisition of the Hartford Life Business. Our Financial Services Businesses’ general accountportfolio, as of December 31, 2013, includes $7.9 billion of invested assets at carrying value from this acquisition, which consists of$7.1 billion of fixed maturity securities, $0.6 billion of commercial mortgage and other loans, and $0.2 billion of other invested assets. Foradditional details regarding this transaction, see “—Executive Summary” above.
The following tables set forth the composition of the investments of our general account apportioned between the Financial ServicesBusinesses and the Closed Block Business as of the dates indicated.
December 31, 2013
FinancialServices
BusinessesClosed Block
Business Total % of Total
($ in millions)Fixed maturities:
Public, available-for-sale, at fair value . . . . . . . . . . . . . . . . . . . . . . . . . . . . . . . . . . . . . . . . . . . . $212,689 $27,401 $240,090 61.3%Public, held-to-maturity, at amortized cost . . . . . . . . . . . . . . . . . . . . . . . . . . . . . . . . . . . . . . . . . 2,500 0 2,500 0.7Private, available-for-sale, at fair value . . . . . . . . . . . . . . . . . . . . . . . . . . . . . . . . . . . . . . . . . . . . 30,650 15,811 46,461 11.9Private, held-to-maturity, at amortized cost . . . . . . . . . . . . . . . . . . . . . . . . . . . . . . . . . . . . . . . . 812 0 812 0.2
Trading account assets supporting insurance liabilities, at fair value . . . . . . . . . . . . . . . . . . . . . . . . . 20,827 0 20,827 5.3Other trading account assets, at fair value . . . . . . . . . . . . . . . . . . . . . . . . . . . . . . . . . . . . . . . . . . . . . . 1,341 342 1,683 0.4Equity securities, available-for-sale, at fair value . . . . . . . . . . . . . . . . . . . . . . . . . . . . . . . . . . . . . . . . 6,019 3,884 9,903 2.5Commercial mortgage and other loans, at book value . . . . . . . . . . . . . . . . . . . . . . . . . . . . . . . . . . . . 31,133 9,673 40,806 10.4Policy loans, at outstanding balance . . . . . . . . . . . . . . . . . . . . . . . . . . . . . . . . . . . . . . . . . . . . . . . . . . 6,753 5,013 11,766 3.0Other long-term investments(1) . . . . . . . . . . . . . . . . . . . . . . . . . . . . . . . . . . . . . . . . . . . . . . . . . . . . . 7,172 2,024 9,196 2.4Short-term investments . . . . . . . . . . . . . . . . . . . . . . . . . . . . . . . . . . . . . . . . . . . . . . . . . . . . . . . . . . . . 5,445 1,866 7,311 1.9
Total general account investments . . . . . . . . . . . . . . . . . . . . . . . . . . . . . . . . . . . . . . . . . . . . . . . 325,341 66,014 391,355 100.0%
Invested assets of other entities and operations(2) . . . . . . . . . . . . . . . . . . . . . . . . . . . . . . . . . . . . . . . 6,818 0 6,818
Total investments . . . . . . . . . . . . . . . . . . . . . . . . . . . . . . . . . . . . . . . . . . . . . . . . . . . . . . . . . . . . $332,159 $66,014 $398,173
December 31, 2012
FinancialServices
BusinessesClosed Block
Business Total % of Total
($ in millions)Fixed maturities:
Public, available-for-sale, at fair value . . . . . . . . . . . . . . . . . . . . . . . . . . . . . . . . . . . . . . . . . . . . $225,306 $28,790 $254,096 63.7%Public, held-to-maturity, at amortized cost . . . . . . . . . . . . . . . . . . . . . . . . . . . . . . . . . . . . . . . . . 3,116 0 3,116 0.8Private, available-for-sale, at fair value . . . . . . . . . . . . . . . . . . . . . . . . . . . . . . . . . . . . . . . . . . . . 29,246 17,629 46,875 11.7Private, held-to-maturity, at amortized cost . . . . . . . . . . . . . . . . . . . . . . . . . . . . . . . . . . . . . . . . 1,152 0 1,152 0.3
Trading account assets supporting insurance liabilities, at fair value . . . . . . . . . . . . . . . . . . . . . . . . . 20,590 0 20,590 5.2Other trading account assets, at fair value . . . . . . . . . . . . . . . . . . . . . . . . . . . . . . . . . . . . . . . . . . . . . . 1,426 275 1,701 0.4Equity securities, available-for-sale, at fair value . . . . . . . . . . . . . . . . . . . . . . . . . . . . . . . . . . . . . . . . 5,031 3,225 8,256 2.1Commercial mortgage and other loans, at book value . . . . . . . . . . . . . . . . . . . . . . . . . . . . . . . . . . . . 26,623 9,608 36,231 9.1Policy loans, at outstanding balance . . . . . . . . . . . . . . . . . . . . . . . . . . . . . . . . . . . . . . . . . . . . . . . . . . 6,455 5,120 11,575 2.9Other long-term investments(1) . . . . . . . . . . . . . . . . . . . . . . . . . . . . . . . . . . . . . . . . . . . . . . . . . . . . . 6,665 2,012 8,677 2.2Short-term investments . . . . . . . . . . . . . . . . . . . . . . . . . . . . . . . . . . . . . . . . . . . . . . . . . . . . . . . . . . . . 5,124 1,261 6,385 1.6
Total general account investments . . . . . . . . . . . . . . . . . . . . . . . . . . . . . . . . . . . . . . . . . . . . . . . 330,734 67,920 398,654 100.0%
Invested assets of other entities and operations(2) . . . . . . . . . . . . . . . . . . . . . . . . . . . . . . . . . . . . . . . 6,928 0 6,928
Total investments . . . . . . . . . . . . . . . . . . . . . . . . . . . . . . . . . . . . . . . . . . . . . . . . . . . . . . . . . . . . $337,662 $67,920 $405,582
(1) Other long-term investments consist of real estate and non-real estate-related investments in joint ventures and partnerships, investment real estate heldthrough direct ownership and other miscellaneous investments. For additional information regarding these investments, see “—Other Long-TermInvestments” below.
(2) Includes invested assets of our asset management and derivative operations. Excludes assets of our asset management operations managed for thirdparties and those assets classified as “Separate account assets” on our balance sheet. For additional information regarding these investments, see“—Invested Assets of Other Entities and Operations” below.
The decrease in general account investments attributable to the Financial Services Businesses in 2013 was primarily due to thetranslation impact of the yen weakening against the U.S. dollar, as well as a net decrease in fair value driven by an increase in U.S. interestrates, partially offset by assets acquired as part of the Hartford transaction as discussed above as well as portfolio growth driven by thereinvestment of net investment income. The general account investments attributable to the Closed Block Business also decreased in 2013,primarily due to net operating outflows and a net decrease in fair value driven by an increase in interest rates, partially offset by thereinvestment of net investment income. For information regarding the methodology used in determining the fair value of our fixedmaturities, see Note 20 to the Consolidated Financial Statements.
Prudential Financial, Inc. 2013 Annual Report 63

We have substantial insurance operations in Japan, with 43% and 46% of our Financial Services Businesses’ general accountinvestments relating to our Japanese insurance operations as of December 31, 2013 and December 31, 2012, respectively.
The following table sets forth the composition of the investments of our Japanese insurance operations’ general account as of the datesindicated.
December 31,
2013 2012
(in millions)Fixed maturities:
Public, available-for-sale, at fair value . . . . . . . . . . . . . . . . . . . . . . . . . . . . . . . . . . . . . . . . . . . . . . . . . . . . . . . . . . . . . . . . . . . . . . . $112,501 $124,710Public, held-to-maturity, at amortized cost . . . . . . . . . . . . . . . . . . . . . . . . . . . . . . . . . . . . . . . . . . . . . . . . . . . . . . . . . . . . . . . . . . . . 2,500 3,116Private, available-for-sale, at fair value . . . . . . . . . . . . . . . . . . . . . . . . . . . . . . . . . . . . . . . . . . . . . . . . . . . . . . . . . . . . . . . . . . . . . . 6,762 6,252Private, held-to-maturity, at amortized cost . . . . . . . . . . . . . . . . . . . . . . . . . . . . . . . . . . . . . . . . . . . . . . . . . . . . . . . . . . . . . . . . . . . 812 1,152
Trading account assets supporting insurance liabilities, at fair value . . . . . . . . . . . . . . . . . . . . . . . . . . . . . . . . . . . . . . . . . . . . . . . . . . . . 1,925 1,838Other trading account assets, at fair value . . . . . . . . . . . . . . . . . . . . . . . . . . . . . . . . . . . . . . . . . . . . . . . . . . . . . . . . . . . . . . . . . . . . . . . . 884 1,195Equity securities, available-for-sale, at fair value . . . . . . . . . . . . . . . . . . . . . . . . . . . . . . . . . . . . . . . . . . . . . . . . . . . . . . . . . . . . . . . . . . . 2,557 2,126Commercial mortgage and other loans, at book value . . . . . . . . . . . . . . . . . . . . . . . . . . . . . . . . . . . . . . . . . . . . . . . . . . . . . . . . . . . . . . . 6,581 6,156Policy loans, at outstanding balance . . . . . . . . . . . . . . . . . . . . . . . . . . . . . . . . . . . . . . . . . . . . . . . . . . . . . . . . . . . . . . . . . . . . . . . . . . . . . 2,280 2,665Other long-term investments(1) . . . . . . . . . . . . . . . . . . . . . . . . . . . . . . . . . . . . . . . . . . . . . . . . . . . . . . . . . . . . . . . . . . . . . . . . . . . . . . . . 1,576 2,215Short-term investments . . . . . . . . . . . . . . . . . . . . . . . . . . . . . . . . . . . . . . . . . . . . . . . . . . . . . . . . . . . . . . . . . . . . . . . . . . . . . . . . . . . . . . . 541 318
Total Japanese general account investments . . . . . . . . . . . . . . . . . . . . . . . . . . . . . . . . . . . . . . . . . . . . . . . . . . . . . . . . . . . . . . . . . . . $138,919 $151,743
(1) Other long-term investments consist of real estate and non-real estate-related investments in joint ventures and partnerships, investment real estate heldthrough direct ownership, derivatives, and other miscellaneous investments.
The decrease in general account investments related to our Japanese insurance operations in 2013 was primarily attributable to thetranslation impact of the yen weakening against the U.S. dollar, partially offset by portfolio growth as a result of business inflows and thereinvestment of net investment income, as well as a net increase in fair value driven by declining interest rates on yen-denominated investments.
The functional currency of our Japanese insurance subsidiaries is the yen and, although the majority of the Japanese general account isinvested in yen-denominated investments, our Japanese insurance operations also hold significant investments denominated in U.S. andAustralian dollars.
As of December 31, 2013, our Japanese insurance operations had $42.6 billion, at fair value, of investments denominated in U.S. dollars,including $3.5 billion that were hedged to yen through third party derivative contracts and $29.9 billion that support liabilities denominated inU.S. dollars. As of December 31, 2012, our Japanese insurance operations had $44.9 billion, at fair value, of investments denominated in U.S.dollars, including $4.4 billion that were hedged to yen through third party derivative contracts and $31.6 billion that support liabilitiesdenominated in U.S. dollars. The $2.3 billion decrease in the fair value of U.S. dollar-denominated investments from December 31, 2012, isprimarily attributable to an increase in interest rates, partially offset by portfolio growth as a result of business inflows.
Our Japanese insurance operations had $8.5 billion and $8.6 billion, at fair value, of investments denominated in Australian dollarsthat support liabilities denominated in Australian dollars as of December 31, 2013 and December 31, 2012, respectively. The $0.1 billiondecrease in the fair value of Australian dollar-denominated investments from December 31, 2012, is primarily driven by increased interestrates and declining growth in the portfolio.
For additional information regarding U.S. and Australian dollar investments held in our Japanese insurance operations, see “—Resultsof Operations for Financial Services Businesses by Segment—International Insurance Division” above.
Investment ResultsThe following tables set forth the income yield and investment income for each major investment category of our general account for
the periods indicated. The yields are based on net investment income as reported under U.S. GAAP and as such do not include certaininterest related items, such as settlements of duration management swaps which are included in realized gains and losses.
Year Ended December 31, 2013
Financial ServicesBusinesses
Closed BlockBusiness Combined
Yield(1) Amount Yield(1) Amount Yield(1) Amount
($ in millions)Fixed maturities . . . . . . . . . . . . . . . . . . . . . . . . . . . . . . . . . . . . . . . . . . . . . . . . . . . . . . . . 3.79% $ 8,575 5.30% $2,002 4.01% $10,577Trading account assets supporting insurance liabilities . . . . . . . . . . . . . . . . . . . . . . . . . . 3.79 775 0.00 0 3.79 775Equity securities . . . . . . . . . . . . . . . . . . . . . . . . . . . . . . . . . . . . . . . . . . . . . . . . . . . . . . . . 6.19 256 3.40 82 5.16 338Commercial mortgage and other loans . . . . . . . . . . . . . . . . . . . . . . . . . . . . . . . . . . . . . . 5.04 1,403 5.85 552 5.24 1,955Policy loans . . . . . . . . . . . . . . . . . . . . . . . . . . . . . . . . . . . . . . . . . . . . . . . . . . . . . . . . . . . 4.82 316 6.01 295 5.33 611Short-term investments and cash equivalents . . . . . . . . . . . . . . . . . . . . . . . . . . . . . . . . . 0.22 30 0.95 7 0.25 37Other investments . . . . . . . . . . . . . . . . . . . . . . . . . . . . . . . . . . . . . . . . . . . . . . . . . . . . . . 7.04 553 10.22 228 7.75 781
Gross investment income before investment expenses . . . . . . . . . . . . . . . . . . . . . . 3.89 11,908 5.52 3,166 4.15 15,074Investment expenses . . . . . . . . . . . . . . . . . . . . . . . . . . . . . . . . . . . . . . . . . . . . . . . . (0.12) (308) (0.26) (150) (0.14) (458)
Investment income after investment expenses . . . . . . . . . . . . . . . . . . . . . . . . . 3.77% 11,600 5.26% 3,016 4.01% 14,616
Investment results of other entities and operations(2) . . . . . . . . . . . . . . . . . . . . . . . . . . . 113 0 113
Total investment income . . . . . . . . . . . . . . . . . . . . . . . . . . . . . . . . . . . . . . . . . . . . . . . . . $11,713 $3,016 $14,729
64 Prudential Financial, Inc. 2013 Annual Report

Year Ended December 31, 2012
Financial ServicesBusinesses
Closed BlockBusiness Combined
Yield(1) Amount Yield(1) Amount Yield(1) Amount
($ in millions)Fixed maturities . . . . . . . . . . . . . . . . . . . . . . . . . . . . . . . . . . . . . . . . . . . . . . . . . . . 3.72% $ 7,645 5.52% $2,143 4.01% $ 9,788Trading account assets supporting insurance liabilities . . . . . . . . . . . . . . . . . . . . . 3.98 778 0.00 0 3.98 778Equity securities . . . . . . . . . . . . . . . . . . . . . . . . . . . . . . . . . . . . . . . . . . . . . . . . . . . 6.14 249 3.34 84 5.07 333Commercial mortgage and other loans . . . . . . . . . . . . . . . . . . . . . . . . . . . . . . . . . . 5.48 1,375 6.38 589 5.72 1,964Policy loans . . . . . . . . . . . . . . . . . . . . . . . . . . . . . . . . . . . . . . . . . . . . . . . . . . . . . . 4.73 293 6.03 304 5.31 597Short-term investments and cash equivalents . . . . . . . . . . . . . . . . . . . . . . . . . . . . . 0.24 33 1.24 7 0.26 40Other investments . . . . . . . . . . . . . . . . . . . . . . . . . . . . . . . . . . . . . . . . . . . . . . . . . . 4.04 268 8.31 183 5.12 451
Gross investment income before investment expenses . . . . . . . . . . . . . . . . . 3.80 10,641 5.69 3,310 4.12 13,951Investment expenses . . . . . . . . . . . . . . . . . . . . . . . . . . . . . . . . . . . . . . . . . . . . (0.12) (273) (0.27) (157) (0.15) (430)
Investment income after investment expenses . . . . . . . . . . . . . . . . . . . . 3.68% 10,368 5.42% 3,153 3.97% 13,521
Investment results of other entities and operations(2) . . . . . . . . . . . . . . . . . . . . . . 140 0 140
Total investment income . . . . . . . . . . . . . . . . . . . . . . . . . . . . . . . . . . . . . . . . . . . . $10,508 $3,153 $13,661
Year Ended December 31, 2011
Financial ServicesBusinesses
Closed BlockBusiness Combined
Yield(1)(3) Amount Yield(1) Amount Yield(1)(3) Amount
($ in millions)Fixed maturities . . . . . . . . . . . . . . . . . . . . . . . . . . . . . . . . . . . . . . . . . . . . . . . . . . . 3.91% $7,063 5.67% $2,232 4.22% $ 9,295Trading account assets supporting insurance liabilities . . . . . . . . . . . . . . . . . . . . . 4.23 776 0.00 0 4.23 776Equity securities . . . . . . . . . . . . . . . . . . . . . . . . . . . . . . . . . . . . . . . . . . . . . . . . . . . 6.01 240 2.75 75 4.68 315Commercial mortgage and other loans . . . . . . . . . . . . . . . . . . . . . . . . . . . . . . . . . . 5.64 1,295 6.47 553 5.86 1,848Policy loans . . . . . . . . . . . . . . . . . . . . . . . . . . . . . . . . . . . . . . . . . . . . . . . . . . . . . . 4.75 277 6.22 322 5.44 599Short-term investments and cash equivalents . . . . . . . . . . . . . . . . . . . . . . . . . . . . . 0.39 49 0.73 4 0.40 53Other investments . . . . . . . . . . . . . . . . . . . . . . . . . . . . . . . . . . . . . . . . . . . . . . . . . . 3.77 243 8.81 174 4.97 417
Gross investment income before investment expenses . . . . . . . . . . . . . . . . . 3.96 9,943 5.77 3,360 4.31 13,303Investment expenses . . . . . . . . . . . . . . . . . . . . . . . . . . . . . . . . . . . . . . . . . . . . (0.12) (230) (0.25) (146) (0.14) (376)
Investment income after investment expenses . . . . . . . . . . . . . . . . . . . . 3.84% 9,713 5.52% 3,214 4.17% 12,927
Investment results of other entities and operations(2) . . . . . . . . . . . . . . . . . . . . . . 197 0 197
Total investment income . . . . . . . . . . . . . . . . . . . . . . . . . . . . . . . . . . . . . . . . . . . . $9,910 $3,214 $13,124
(1) Yields are based on quarterly average carrying values except for fixed maturities, equity securities and securities lending activity. Yields for fixedmaturities are based on amortized cost. Yields for equity securities are based on cost. Yields for fixed maturities and short-term investments and cashequivalents are calculated net of liabilities and rebate expenses corresponding to securities lending activity. Yields exclude investment income on assetsother than those included in invested assets. Prior period’s yields are presented on a basis consistent with the current period presentation.
(2) Includes investment income of our asset management operations and derivative operations, as described below under “—Invested Assets of OtherEntities and Operations”.
(3) Yields for the year ended December 31, 2011, are weighted for ten months of income and assets related to the Star and Edison Businesses.
See below for a discussion of the change in the Financial Services Businesses’ yields. The decrease in net investment income yieldattributable to the Closed Block Business’s portfolio for 2013, compared to 2012, was primarily due to the impact of lower interest rates onfloating rate investments due to rate resets and lower fixed income reinvestment rates.
The decrease in net investment income yield attributable to the Closed Block Business for 2012, compared to 2011, was primarily dueto the impact of lower interest rates on floating rate investments due to rate resets and lower fixed income reinvestment rates.
The following table sets forth the income yield and investment income for each major investment category of the Financial ServicesBusinesses’ general account, excluding the Japanese insurance operations’ portion of the general account which is presented separatelybelow, for the periods indicated. The yields are based on net investment income as reported under U.S. GAAP and as such do not includecertain interest related items, such as settlements of duration management swaps which are included in realized gains and losses.
Year Ended December 31,
2013 2012 2011
Yield(1) Amount Yield(1) Amount Yield(1) Amount
($ in millions)Fixed maturities . . . . . . . . . . . . . . . . . . . . . . . . . . . . . . . . . . . . . . . . . . . . . . . . . . . 4.65% $5,306 5.09% $4,328 5.44% $4,219Trading account assets supporting insurance liabilities . . . . . . . . . . . . . . . . . . . . . 3.99 741 4.18 742 4.45 742Equity securities . . . . . . . . . . . . . . . . . . . . . . . . . . . . . . . . . . . . . . . . . . . . . . . . . . . 7.30 174 8.70 184 9.04 167Commercial mortgage and other loans . . . . . . . . . . . . . . . . . . . . . . . . . . . . . . . . . . 5.27 1,145 5.87 1,138 6.06 1,083Policy loans . . . . . . . . . . . . . . . . . . . . . . . . . . . . . . . . . . . . . . . . . . . . . . . . . . . . . . 5.45 228 5.62 194 5.81 187Short-term investments and cash equivalents . . . . . . . . . . . . . . . . . . . . . . . . . . . . . 0.23 26 0.26 28 0.29 26Other investments . . . . . . . . . . . . . . . . . . . . . . . . . . . . . . . . . . . . . . . . . . . . . . . . . . 7.54 383 3.13 87 3.86 80
Gross investment income before investment expenses . . . . . . . . . . . . . . . . . 4.52 8,003 4.77 6,701 5.07 6,504Investment expenses . . . . . . . . . . . . . . . . . . . . . . . . . . . . . . . . . . . . . . . . . . . . (0.12) (152) (0.11) (89) (0.10) (71)
Investment income after investment expenses . . . . . . . . . . . . . . . . . . . . 4.40% 7,851 4.66% 6,612 4.97% 6,433
Investment results of other entities and operations(2) . . . . . . . . . . . . . . . . . . . . . . 113 140 197
Total investment income . . . . . . . . . . . . . . . . . . . . . . . . . . . . . . . . . . . . . . . . . . . . $7,964 $6,752 $6,630
Prudential Financial, Inc. 2013 Annual Report 65

(1) Yields are based on quarterly average carrying values except for fixed maturities, equity securities and securities lending activity. Yields for fixedmaturities are based on amortized cost. Yields for equity securities are based on cost. Yields for fixed maturities and short-term investments and cashequivalents are calculated net of liabilities and rebate expenses corresponding to securities lending activity. Yields exclude investment income on assetsother than those included in invested assets. Prior period’s yields are presented on a basis consistent with the current period presentation.
(2) Includes investment income of our asset management operations and derivative operations.
The decrease in net investment income yield attributable to the Financial Services Businesses’ general account, excluding the Japaneseoperations’ portfolio, for 2013, compared to 2012, was primarily the result of lower interest rates on floating rate investments due to rateresets and lower fixed maturity reinvestment rates. The decrease also reflects the addition of assets from the significant pension risktransfer transactions that closed in the fourth quarter of 2012, as well as the Hartford transaction discussed above, which reflect marketyields at the time of acquisition. These decreases were partially offset by higher income from non-coupon investments.
The decrease in net investment income yield attributable to the Financial Services Businesses’ general account, excluding the Japaneseoperations’ portfolio, for 2012, compared to 2011, was primarily the result of lower interest rates on floating rate investments due to rateresets, lower fixed maturity reinvestment rates, and the addition of asset from the pension risk transfer transactions which reflect marketyields at the time of acquisition.
The following table sets forth the income yield and investment income for each major investment category of our Japanese operations’general account for the periods indicated. The yields are based on net investment income as reported under U.S. GAAP and as such do notinclude certain interest related items, such as settlements of duration management swaps which are included in realized gains and losses.
Year Ended December 31,
2013 2012 2011
Yield(1) Amount Yield(1) Amount Yield(1)(2) Amount
($ in millions)Fixed maturities . . . . . . . . . . . . . . . . . . . . . . . . . . . . . . . . . . . . . . . . . . . . . . . . . . . . . . 2.91% $3,269 2.75% $3,317 2.75% $2,844Trading account assets supporting insurance liabilities . . . . . . . . . . . . . . . . . . . . . . . 1.81 34 2.04 36 2.02 34Equity securities . . . . . . . . . . . . . . . . . . . . . . . . . . . . . . . . . . . . . . . . . . . . . . . . . . . . . 4.69 82 3.36 65 3.42 73Commercial mortgage and other loans . . . . . . . . . . . . . . . . . . . . . . . . . . . . . . . . . . . . 4.21 258 4.15 237 4.16 212Policy loans . . . . . . . . . . . . . . . . . . . . . . . . . . . . . . . . . . . . . . . . . . . . . . . . . . . . . . . . . 3.70 88 3.60 99 3.44 90Short-term investments and cash equivalents . . . . . . . . . . . . . . . . . . . . . . . . . . . . . . . 0.19 4 0.16 5 0.68 23Other investments . . . . . . . . . . . . . . . . . . . . . . . . . . . . . . . . . . . . . . . . . . . . . . . . . . . . 6.12 170 4.71 181 3.72 163
Gross investment income before investment expenses . . . . . . . . . . . . . . . . . . . . 3.02 3,905 2.82 3,940 2.81 3,439Investment expenses . . . . . . . . . . . . . . . . . . . . . . . . . . . . . . . . . . . . . . . . . . . . . . (0.12) (156) (0.13) (184) (0.13) (159)
Total investment income . . . . . . . . . . . . . . . . . . . . . . . . . . . . . . . . . . . . . . . . . . . . . . . 2.90% $3,749 2.69% $3,756 2.68% $3,280
(1) Yields are based on quarterly average carrying values except for fixed maturities, equity securities and securities lending activity. Yields for fixedmaturities are based on amortized cost. Yields for equity securities are based on cost. Yields for fixed maturities and short-term investments and cashequivalents are calculated net of liabilities and rebate expenses corresponding to securities lending activity. Yields exclude investment income on assetsother than those included in invested assets. Prior period’s yields are presented on a basis consistent with the current period presentation.
(2) Yields for the year ended December 31, 2011, are weighted for ten months of income and assets related to the Star and Edison Businesses.
The increase in net investment income yield on the Japanese insurance portfolio for 2013, compared to 2012, was primarilyattributable to more favorable results from non-coupon investments and growth in higher-yielding assets supporting both U.S. andAustralian dollar-denominated products, partially offset by lower fixed maturity reinvestment rates in both the U.S. and Japan.
The increase in net investment income yield on the Japanese insurance portfolio for 2012, compared to 2011, was primarilyattributable to more favorable results from non-coupon investments and asset growth supporting both U.S. and Australian dollar-denominated products, partially offset by lower fixed maturity reinvestment rates in both the U.S. and Japan.
Both the U.S. dollar-denominated and Australian dollar-denominated fixed maturities that are not hedged to yen through third partyderivative contracts provide a yield that is substantially higher than the yield on comparable yen-denominated fixed maturities. The averageamortized cost of U.S. dollar-denominated fixed maturities that are not hedged to yen through third party derivative contracts wasapproximately $31.9 billion and $29.4 billion, for the years ended December 31, 2013 and 2012, respectively. The majority of U.S. dollar-denominated fixed maturities support liabilities that are denominated in U.S. dollars. The average amortized cost of Australian dollar-denominated fixed maturities that are not hedged to yen through third party derivative contracts was approximately $8.1 billion and $7.0billion, for the years ended December 31, 2013 and 2012, respectively. The Australian dollar-denominated fixed maturities supportliabilities that are denominated in Australian dollars.
For additional information regarding U.S. and Australian dollar investments held in our Japanese insurance operations, see “—Resultsof Operations for Financial Services Businesses by Segment—International Insurance Division” above.
66 Prudential Financial, Inc. 2013 Annual Report

Fixed Maturity Securities
Fixed Maturity Securities by Contractual Maturity Date
The following table sets forth the breakdown of the amortized cost of our fixed maturity securities portfolio in total by contractualmaturity as of December 31, 2013.
December 31, 2013
Financial Services Businesses Closed Block Business
AmortizedCost % of Total
AmortizedCost % of Total
($ in millions)Corporate & government securities:Maturing in 2014 . . . . . . . . . . . . . . . . . . . . . . . . . . . . . . . . . . . . . . . . . . . . . . . . . . . . . . . . . . . . . $ 7,936 3.4% $ 1,380 3.4%Maturing in 2015 . . . . . . . . . . . . . . . . . . . . . . . . . . . . . . . . . . . . . . . . . . . . . . . . . . . . . . . . . . . . . 8,019 3.5 1,879 4.6Maturing in 2016 . . . . . . . . . . . . . . . . . . . . . . . . . . . . . . . . . . . . . . . . . . . . . . . . . . . . . . . . . . . . . 9,579 4.1 1,188 2.9Maturing in 2017 . . . . . . . . . . . . . . . . . . . . . . . . . . . . . . . . . . . . . . . . . . . . . . . . . . . . . . . . . . . . . 10,658 4.6 1,453 3.6Maturing in 2018 . . . . . . . . . . . . . . . . . . . . . . . . . . . . . . . . . . . . . . . . . . . . . . . . . . . . . . . . . . . . . 12,607 5.5 1,985 4.9Maturing in 2019 . . . . . . . . . . . . . . . . . . . . . . . . . . . . . . . . . . . . . . . . . . . . . . . . . . . . . . . . . . . . . 10,041 4.3 1,501 3.7Maturing in 2020 . . . . . . . . . . . . . . . . . . . . . . . . . . . . . . . . . . . . . . . . . . . . . . . . . . . . . . . . . . . . . 10,057 4.4 1,840 4.5Maturing in 2021 . . . . . . . . . . . . . . . . . . . . . . . . . . . . . . . . . . . . . . . . . . . . . . . . . . . . . . . . . . . . . 10,527 4.6 2,091 5.1Maturing in 2022 . . . . . . . . . . . . . . . . . . . . . . . . . . . . . . . . . . . . . . . . . . . . . . . . . . . . . . . . . . . . . 9,680 4.2 1,878 4.6Maturing in 2023 . . . . . . . . . . . . . . . . . . . . . . . . . . . . . . . . . . . . . . . . . . . . . . . . . . . . . . . . . . . . . 8,695 3.8 1,938 4.8Maturing in 2024 . . . . . . . . . . . . . . . . . . . . . . . . . . . . . . . . . . . . . . . . . . . . . . . . . . . . . . . . . . . . . 5,793 2.5 1,287 3.2Maturing in 2025 and beyond . . . . . . . . . . . . . . . . . . . . . . . . . . . . . . . . . . . . . . . . . . . . . . . . . . . 104,289 45.1 13,421 33.1
Total corporate & government securities . . . . . . . . . . . . . . . . . . . . . . . . . . . . . . . . . . . . . . 207,881 90.0 31,841 78.4Asset-backed securities . . . . . . . . . . . . . . . . . . . . . . . . . . . . . . . . . . . . . . . . . . . . . . . . . . . . . . . . 7,591 3.3 3,747 9.2Commercial mortgage-backed securities . . . . . . . . . . . . . . . . . . . . . . . . . . . . . . . . . . . . . . . . . . 9,772 4.2 3,960 9.7Residential mortgage-backed securities . . . . . . . . . . . . . . . . . . . . . . . . . . . . . . . . . . . . . . . . . . . 5,872 2.5 1,080 2.7
Total fixed maturities . . . . . . . . . . . . . . . . . . . . . . . . . . . . . . . . . . . . . . . . . . . . . . . . . . . . . $231,116 100.0% $40,628 100.0%
Fixed Maturity Securities and Unrealized Gains and Losses by Industry Category
The following table sets forth the composition of the portion of our fixed maturity securities portfolio by industry category attributableto the Financial Services Businesses as of the dates indicated and the associated gross unrealized gains and losses.
Fixed Maturity Securities—Financial Services Businesses
December 31, 2013 December 31, 2012
Industry(1)Amortized
Cost
GrossUnrealizedGains(2)
GrossUnrealizedLosses(2)
FairValue
AmortizedCost
GrossUnrealizedGains(2)
GrossUnrealizedLosses(2)
FairValue
(in millions)Corporate securities:
Finance . . . . . . . . . . . . . . . . . . . . . . . . . . . . . . . . . $ 20,764 $ 1,338 $ 326 $ 21,776 $ 21,772 $ 1,279 $ 285 $ 22,766Consumer non-cyclical . . . . . . . . . . . . . . . . . . . . 21,965 1,888 653 23,200 21,727 1,898 269 23,356Utility . . . . . . . . . . . . . . . . . . . . . . . . . . . . . . . . . . 18,335 1,299 659 18,975 17,993 1,601 344 19,250Capital goods . . . . . . . . . . . . . . . . . . . . . . . . . . . . 10,025 901 266 10,660 10,251 896 144 11,003Consumer cyclical . . . . . . . . . . . . . . . . . . . . . . . . 10,202 788 257 10,733 9,927 756 147 10,536Foreign agencies . . . . . . . . . . . . . . . . . . . . . . . . . 4,810 792 74 5,528 5,706 732 8 6,430Energy . . . . . . . . . . . . . . . . . . . . . . . . . . . . . . . . . 8,705 650 284 9,071 7,923 745 83 8,585Communications . . . . . . . . . . . . . . . . . . . . . . . . . 6,160 590 208 6,542 7,552 610 119 8,043Basic industry . . . . . . . . . . . . . . . . . . . . . . . . . . . . 6,186 396 205 6,377 6,215 416 69 6,562Transportation . . . . . . . . . . . . . . . . . . . . . . . . . . . 5,712 477 116 6,073 5,288 478 43 5,723Technology . . . . . . . . . . . . . . . . . . . . . . . . . . . . . 3,589 286 103 3,772 4,656 279 77 4,858Industrial other . . . . . . . . . . . . . . . . . . . . . . . . . . . 2,440 205 52 2,593 2,261 196 3 2,454
Total corporate securities . . . . . . . . . . . . . . . . . . . . . . . 118,893 9,610 3,203 125,300 121,271 9,886 1,591 129,566Foreign government(3) . . . . . . . . . . . . . . . . . . . . . . . . 76,171 7,522 257 83,436 82,376 6,782 65 89,093Residential mortgage-backed . . . . . . . . . . . . . . . . . . . . 5,872 356 34 6,194 8,360 435 30 8,765Asset-backed securities(4) . . . . . . . . . . . . . . . . . . . . . . 7,591 218 173 7,636 8,209 202 407 8,004Commercial mortgage-backed . . . . . . . . . . . . . . . . . . . 9,772 360 104 10,028 7,413 595 14 7,994U.S. Government . . . . . . . . . . . . . . . . . . . . . . . . . . . . . 9,885 1,459 71 11,273 10,525 2,474 34 12,965State & Municipal(5) . . . . . . . . . . . . . . . . . . . . . . . . . . 2,932 223 130 3,025 2,303 378 5 2,676
Total(6) . . . . . . . . . . . . . . . . . . . . . . . . . . . . $231,116 $19,748 $3,972 $246,892 $240,457 $20,752 $2,146 $259,063
(1) Investment data has been classified based on standard industry categorizations for domestic public holdings and similar classifications by industry forall other holdings.
(2) Includes $265 million of gross unrealized gains and $24 million of gross unrealized losses as of December 31, 2013, compared to $310 million of grossunrealized gains and $67 million of gross unrealized losses as of December 31, 2012, on securities classified as held-to-maturity.
(3) As of December 31, 2013 and 2012, based on amortized cost, 80% and 81%, respectively, represent Japanese government bonds held by our Japaneseinsurance operations, with no other individual country representing more than 9% and 8%, respectively, of the balance.
(4) Includes securities collateralized by sub-prime mortgages. See “—Asset-Backed Securities” below.(5) Includes securities related to the Build America Bonds program.(6) Excluded from the table above are securities held outside the general account in other entities and operations. For additional information regarding investments
held outside the general account, see “—Invested Assets of Other Entities and Operations” below. Also excluded from the table above are fixed maturity securitiesclassified as trading. See “—Trading Account Assets Supporting Insurance Liabilities” and “—Other Trading Account Assets” for additional information.
Prudential Financial, Inc. 2013 Annual Report 67

The decrease in net unrealized gains from December 31, 2012 to December 31, 2013, was primarily due to a net increase inU.S. interest rates.
The following table sets forth the composition of the portion of our fixed maturity securities portfolio by industry category attributableto the Closed Block Business as of the dates indicated and the associated gross unrealized gains and losses.
Fixed Maturity Securities—Closed Block Business
December 31, 2013 December 31, 2012
Industry(1)Amortized
Cost
GrossUnrealized
Gains
GrossUnrealized
LossesFair
ValueAmortized
Cost
GrossUnrealized
Gains
GrossUnrealized
LossesFair
Value
(in millions)Corporate securities:
Utility . . . . . . . . . . . . . . . . . . . . . . . . . . . . . . . . . . . . $ 4,584 $ 499 $ 48 $ 5,035 $ 4,773 $ 862 $ 12 $ 5,623Consumer non-cyclical . . . . . . . . . . . . . . . . . . . . . . 4,693 480 47 5,126 4,419 750 5 5,164Finance . . . . . . . . . . . . . . . . . . . . . . . . . . . . . . . . . . . 4,001 294 15 4,280 3,728 442 17 4,153Consumer cyclical . . . . . . . . . . . . . . . . . . . . . . . . . . 3,272 317 18 3,571 3,003 477 10 3,470Capital goods . . . . . . . . . . . . . . . . . . . . . . . . . . . . . . 2,479 252 14 2,717 2,523 376 1 2,898Energy . . . . . . . . . . . . . . . . . . . . . . . . . . . . . . . . . . . 1,855 178 15 2,018 1,879 305 0 2,184Communications . . . . . . . . . . . . . . . . . . . . . . . . . . . 1,413 144 12 1,545 1,513 268 4 1,777Basic industry . . . . . . . . . . . . . . . . . . . . . . . . . . . . . . 1,303 90 23 1,370 1,324 186 3 1,507Transportation . . . . . . . . . . . . . . . . . . . . . . . . . . . . . 1,313 120 9 1,424 1,386 186 4 1,568Industrial other . . . . . . . . . . . . . . . . . . . . . . . . . . . . . 954 61 13 1,002 1,074 110 2 1,182Technology . . . . . . . . . . . . . . . . . . . . . . . . . . . . . . . 665 53 8 710 626 103 7 722Foreign agencies . . . . . . . . . . . . . . . . . . . . . . . . . . . 460 38 6 492 355 68 0 423
Total corporate securities . . . . . . . . . . . . . . . . . . . . . . . . . 26,992 2,526 228 29,290 26,603 4,133 65 30,671Asset-backed securities(2) . . . . . . . . . . . . . . . . . . . . . . . . 3,747 34 141 3,640 4,592 71 320 4,343Commercial mortgage-backed . . . . . . . . . . . . . . . . . . . . . 3,960 60 59 3,961 4,029 179 2 4,206U.S. Government . . . . . . . . . . . . . . . . . . . . . . . . . . . . . . . 3,824 279 26 4,077 3,401 966 0 4,367Residential mortgage-backed . . . . . . . . . . . . . . . . . . . . . . 1,080 55 6 1,129 1,520 97 3 1,614Foreign government(3) . . . . . . . . . . . . . . . . . . . . . . . . . . 361 55 8 408 345 103 2 446State & Municipal . . . . . . . . . . . . . . . . . . . . . . . . . . . . . . 664 51 7 708 647 126 1 772
Total(4) . . . . . . . . . . . . . . . . . . . . . . . . . . . . . . $40,628 $3,060 $475 $43,213 $41,137 $5,675 $393 $46,419
(1) Investment data has been classified based on standard industry categorizations for domestic public holdings and similar classifications by industry forall other holdings.
(2) Includes securities collateralized by sub-prime mortgages. See “—Asset-Backed Securities” below.(3) As of December 31, 2013 and 2012, based on amortized cost, no individual foreign country represented more than 11% and 13%, respectively.(4) The table above excludes fixed maturity securities classified as trading. See “—Other Trading Account Assets” for additional information.
The decrease in net unrealized gains from December 31, 2012 to December 31, 2013, was primarily due to a net increase in interestrates.
Asset-Backed SecuritiesIncluded within asset-backed securities attributable to both the Financial Services Businesses and the Closed Block Business are
securities collateralized by sub-prime mortgages. While there is no market standard definition, we define sub-prime mortgages asresidential mortgages that are originated to weaker quality obligors as indicated by weaker credit scores, as well as mortgages with higherloan-to-value ratios or limited documentation. The deterioration of the U.S. housing market since prices peaked in 2006 and higherunemployment levels over the past several years, coupled with relaxed underwriting standards for some originators of sub-prime mortgagesthrough 2007, have led to higher delinquency rates, particularly for those mortgages issued in 2006 and 2007. This has resulted in increasedattention given to potential deficiencies in lenders’ foreclosure documentation, causing delays in the foreclosure process. From theperspective of an investor in securities backed by sub-prime collateral, significant delays in foreclosure proceedings have resulted inincreased servicing costs which negatively affect the value of the impacted securities. Separately, as an investor in sub-prime securities, weare pursuing legal and other actions with respect to potential remedies arising from any potential deficiencies related to the original lendingand securitization practices. For additional information, see Note 23 to our Consolidated Financial Statements.
The following tables set forth the amortized cost and fair value of our asset-backed securities attributable to the Financial Services Businessesas of the dates indicated, by credit quality, and for asset-backed securities collateralized by sub-prime mortgages, by year of issuance (vintage).
Asset-Backed Securities at Amortized Cost—Financial Services Businesses
December 31, 2013
Lowest Rating Agency Rating
Vintage AAA AA A BBBBB andbelow
TotalAmortized
Cost
TotalDecember 31,
2012
(in millions)Collateralized by sub-prime mortgages:
2013—2008 . . . . . . . . . . . . . . . . . . . . . . . . . . . . . . . . . . . . . . . . . . . . . . . . . . . . . $ 0 $ 0 $ 0 $ 0 $ 0 $ 0 $ 02007 . . . . . . . . . . . . . . . . . . . . . . . . . . . . . . . . . . . . . . . . . . . . . . . . . . . . . . . . . . . 0 0 0 0 353 353 4302006 . . . . . . . . . . . . . . . . . . . . . . . . . . . . . . . . . . . . . . . . . . . . . . . . . . . . . . . . . . . 2 0 21 62 571 656 8282005 . . . . . . . . . . . . . . . . . . . . . . . . . . . . . . . . . . . . . . . . . . . . . . . . . . . . . . . . . . . 0 2 29 28 209 268 2932004 & Prior . . . . . . . . . . . . . . . . . . . . . . . . . . . . . . . . . . . . . . . . . . . . . . . . . . . . 0 3 29 27 547 606 691
Total collateralized by sub-prime mortgages . . . . . . . . . . . . . . . . . . . . . . . 2 5 79 117 1,680 1,883 2,242
68 Prudential Financial, Inc. 2013 Annual Report

December 31, 2013
Lowest Rating Agency Rating
Vintage AAA AA A BBBBB andbelow
TotalAmortized
Cost
TotalDecember 31,
2012
(in millions)Other asset-backed securities:
Collateralized loan obligations . . . . . . . . . . . . . . . . . . . . . . . . . . . . . . . . . . . . . . 2,314 333 7 0 0 2,654 1,858Collateralized by non-sub-prime mortgages . . . . . . . . . . . . . . . . . . . . . . . . . . . . 938 46 5 15 4 1,008 1,444Collateralized by credit cards . . . . . . . . . . . . . . . . . . . . . . . . . . . . . . . . . . . . . . . 452 0 35 10 0 497 695Collateralized by auto loans . . . . . . . . . . . . . . . . . . . . . . . . . . . . . . . . . . . . . . . . 567 0 0 0 1 568 694Other asset-backed securities(1) . . . . . . . . . . . . . . . . . . . . . . . . . . . . . . . . . . . . . 152 591 97 24 117 981 1,276
Total asset-backed securities(2) . . . . . . . . . . . . . . . . . . . . . . . . . . . . . . . . . . $4,425 $975 $223 $166 $1,802 $7,591 $8,209
(1) Includes asset-backed securities collateralized by education loans, aircraft, equipment leases, franchises, externally-managed investments in the Europeanmarket, and timeshares. Approximately 95% of the $401 million of education loans included above carry a Department of Education guaranty as ofDecember 31, 2013.
(2) Excluded from the table above are asset-backed securities held outside the general account in other entities and operations. Also excluded from the tableabove are asset-backed securities classified as trading.
Asset-Backed Securities at Fair Value—Financial Services Businesses
December 31, 2013
Lowest Rating Agency Rating
Vintage AAA AA A BBBBB andbelow
TotalFair Value
TotalDecember 31,
2012
(in millions)Collateralized by sub-prime mortgages:
2013—2008 . . . . . . . . . . . . . . . . . . . . . . . . . . . . . . . . . . . . . . . . . . . . . . . . . . . . . $ 0 $ 0 $ 0 $ 0 $ 0 $ 0 $ 02007 . . . . . . . . . . . . . . . . . . . . . . . . . . . . . . . . . . . . . . . . . . . . . . . . . . . . . . . . . . . 0 0 0 0 334 334 3392006 . . . . . . . . . . . . . . . . . . . . . . . . . . . . . . . . . . . . . . . . . . . . . . . . . . . . . . . . . . . 1 0 20 55 582 658 6982005 . . . . . . . . . . . . . . . . . . . . . . . . . . . . . . . . . . . . . . . . . . . . . . . . . . . . . . . . . . . 0 2 28 29 200 259 2512004 & Prior . . . . . . . . . . . . . . . . . . . . . . . . . . . . . . . . . . . . . . . . . . . . . . . . . . . . 0 3 29 26 519 577 594
Total collateralized by sub-prime mortgages . . . . . . . . . . . . . . . . . . . . . . . 1 5 77 110 1,635 1,828 1,882
Other asset-backed securities:Collateralized loan obligations . . . . . . . . . . . . . . . . . . . . . . . . . . . . . . . . . . . . . . 2,305 336 7 0 8 2,656 1,871Collateralized by non-sub-prime mortgages . . . . . . . . . . . . . . . . . . . . . . . . . . . . 994 47 5 14 4 1,064 1,524Collateralized by credit cards . . . . . . . . . . . . . . . . . . . . . . . . . . . . . . . . . . . . . . . 465 0 35 10 0 510 714Collateralized by auto loans . . . . . . . . . . . . . . . . . . . . . . . . . . . . . . . . . . . . . . . . 570 0 0 0 1 571 702Other asset-backed securities(1) . . . . . . . . . . . . . . . . . . . . . . . . . . . . . . . . . . . . . 154 594 104 26 129 1,007 1,311
Total asset-backed securities(2) . . . . . . . . . . . . . . . . . . . . . . . . . . . . . . . . . . $4,489 $982 $228 $160 $1,777 $7,636 $8,004
(1) Includes asset-backed securities collateralized by education loans, aircraft, equipment leases, franchises, externally-managed investments in the European market,and timeshares. Approximately 95% of the $392 million of education loans included above carry a Department of Education guaranty as of December 31, 2013.
(2) Excluded from the table above are asset-backed securities held outside the general account in other entities and operations. Also excluded from the tableabove are asset-backed securities classified as trading.
The tables above provide ratings as assigned by nationally recognized rating agencies as of December 31, 2013, including Standard &Poor’s, Moody’s and Fitch. In making our investment decisions, rather than relying solely on the rating agencies’ evaluations, we assigninternal ratings to our asset-backed securities based upon our dedicated asset-backed securities unit’s independent evaluation of theunderlying collateral and securitization structure, including any guarantees from monoline bond insurers.
On an amortized cost basis, asset-backed securities collateralized by sub-prime mortgages attributable to the Financial Services Businessesdecreased from $2.242 billion as of December 31, 2012, to $1.883 billion as of December 31, 2013, primarily reflecting sales, principalpaydowns and other-than-temporary impairments recognized. Gross unrealized losses related to our asset-backed securities collateralized by sub-prime mortgages attributable to the Financial Services Businesses were $144 million as of December 31, 2013, and $390 million as ofDecember 31, 2012. For additional information regarding other-than-temporary impairments of asset-backed securities collateralized by sub-prime mortgages, see “—Realized Investment Gains and Losses” above. For information regarding the methodology used in determining the fairvalue of our asset-backed securities collateralized by sub-prime mortgages, see Note 20 to the Consolidated Financial Statements.
The weighted average estimated subordination percentage of our asset-backed securities collateralized by sub-prime mortgagesattributable to the Financial Services Businesses, excluding those supported by guarantees from monoline bond insurers, was 28% as ofDecember 31, 2013. The subordination percentage represents the current weighted average estimated percentage of the capital structuresubordinated to our investment holding that is available to absorb losses before the security incurs the first dollar loss of principal. As ofDecember 31, 2013, based on amortized cost, approximately 58% of the asset-backed securities collateralized by sub-prime mortgagesattributable to the Financial Services Businesses have estimated credit subordination percentages of 20% or more, and 41% have estimatedcredit subordination percentages of 30% or more.
In addition to subordination, certain securities, referred to as front pay or second pay securities, benefit from the prioritization of principalcash flows within the senior tranches of the structure. In most instances, these shorter duration senior securities have priority to principal cashflows over other securities in the structure, including longer duration senior securities. Included within the $1.883 billion of asset-backedsecurities collateralized by sub-prime mortgages attributable to the Financial Services Businesses as of December 31, 2013, were $301 million ofsecurities, on an amortized cost basis, that represent front pay or second pay securities, depending on the overall structure of the securities.
Prudential Financial, Inc. 2013 Annual Report 69

The following tables set forth the amortized cost and fair value of our asset-backed securities attributable to the Closed Block Business as ofthe dates indicated, by credit quality, and for asset-backed securities collateralized by sub-prime mortgages, by year of issuance (vintage).
Asset-Backed Securities at Amortized Cost—Closed Block Business
December 31, 2013
Lowest Rating Agency Rating
Vintage AAA AA A BBBBB andbelow
TotalAmortized
Cost
TotalDecember 31,
2012
(in millions)Collateralized by sub-prime mortgages:
2013—2008 . . . . . . . . . . . . . . . . . . . . . . . . . . . . . . . . . . . . . . . . . . . . . . . . . . . . . $ 0 $ 0 $ 0 $ 0 $ 0 $ 0 $ 02007 . . . . . . . . . . . . . . . . . . . . . . . . . . . . . . . . . . . . . . . . . . . . . . . . . . . . . . . . . . . 0 3 0 20 216 239 3242006 . . . . . . . . . . . . . . . . . . . . . . . . . . . . . . . . . . . . . . . . . . . . . . . . . . . . . . . . . . . 2 84 0 6 481 573 7112005 . . . . . . . . . . . . . . . . . . . . . . . . . . . . . . . . . . . . . . . . . . . . . . . . . . . . . . . . . . . 7 14 63 15 87 186 2332004 & Prior . . . . . . . . . . . . . . . . . . . . . . . . . . . . . . . . . . . . . . . . . . . . . . . . . . . . 0 2 14 13 404 433 503
Total collateralized by sub-prime mortgages . . . . . . . . . . . . . . . . . . . . . . . 9 103 77 54 1,188 1,431 1,771
Other asset-backed securities:Collateralized by auto loans . . . . . . . . . . . . . . . . . . . . . . . . . . . . . . . . . . . . . . . . 687 0 0 0 0 687 892Collateralized loan obligations . . . . . . . . . . . . . . . . . . . . . . . . . . . . . . . . . . . . . . 553 107 0 0 0 660 599Collateralized by credit cards . . . . . . . . . . . . . . . . . . . . . . . . . . . . . . . . . . . . . . . 312 0 0 24 0 336 450Collateralized by education loans(1) . . . . . . . . . . . . . . . . . . . . . . . . . . . . . . . . . . 16 413 0 0 0 429 450Other asset-backed securities(2) . . . . . . . . . . . . . . . . . . . . . . . . . . . . . . . . . . . . . 88 50 52 0 14 204 430
Total asset-backed securities(3) . . . . . . . . . . . . . . . . . . . . . . . . . . . . . . . . . . $1,665 $673 $129 $78 $1,202 $3,747 $4,592
(1) Approximately 96% of the $429 million of education loans included above carry a Department of Education guaranty as of December 31, 2013.(2) Includes asset-backed securities collateralized by externally-managed investments in the European market, franchises, equipment leases, aircraft,
manufacturing and timeshares.(3) Excluded from the table above are asset-backed securities classified as trading.
Asset-Backed Securities at Fair Value—Closed Block Business
December 31, 2013
Lowest Rating Agency Rating
Vintage AAA AA A BBBBB andbelow
TotalFair Value
TotalDecember 31,
2012
(in millions)Collateralized by sub-prime mortgages:
2013—2008 . . . . . . . . . . . . . . . . . . . . . . . . . . . . . . . . . . . . . . . . . . . . . . . . . . . . . $ 0 $ 0 $ 0 $ 0 $ 0 $ 0 $ 02007 . . . . . . . . . . . . . . . . . . . . . . . . . . . . . . . . . . . . . . . . . . . . . . . . . . . . . . . . . . . 0 3 0 19 205 227 2692006 . . . . . . . . . . . . . . . . . . . . . . . . . . . . . . . . . . . . . . . . . . . . . . . . . . . . . . . . . . . 3 81 0 5 417 506 5432005 . . . . . . . . . . . . . . . . . . . . . . . . . . . . . . . . . . . . . . . . . . . . . . . . . . . . . . . . . . . 6 14 61 15 78 174 2052004 & Prior . . . . . . . . . . . . . . . . . . . . . . . . . . . . . . . . . . . . . . . . . . . . . . . . . . . . 0 2 13 13 378 406 442
Total collateralized by sub-prime mortgages . . . . . . . . . . . . . . . . . . . . . . . 9 100 74 52 1,078 1,313 1,459
Other asset-backed securities:Collateralized by auto loans . . . . . . . . . . . . . . . . . . . . . . . . . . . . . . . . . . . . . . . . 689 0 0 0 0 689 896Collateralized loan obligations . . . . . . . . . . . . . . . . . . . . . . . . . . . . . . . . . . . . . . 551 108 0 0 6 665 605Collateralized by credit cards . . . . . . . . . . . . . . . . . . . . . . . . . . . . . . . . . . . . . . . 314 0 0 23 0 337 454Collateralized by education loans(1) . . . . . . . . . . . . . . . . . . . . . . . . . . . . . . . . . . 16 409 0 0 0 425 453Other asset-backed securities(2) . . . . . . . . . . . . . . . . . . . . . . . . . . . . . . . . . . . . . 89 50 55 0 17 211 476
Total asset-backed securities(3) . . . . . . . . . . . . . . . . . . . . . . . . . . . . . . . . . . $1,668 $667 $129 $75 $1,101 $3,640 $4,343
(1) Approximately 96% of the $425 million of education loans included above carry a Department of Education guaranty as of December 31, 2013.(2) Includes asset-backed securities collateralized by externally-managed investments in the European market, franchises, equipment leases, aircraft,
manufacturing and timeshares.(3) Excluded from the table above are asset-backed securities classified as trading.
On an amortized cost basis, asset-backed securities collateralized by sub-prime mortgages attributable to the Closed Block Businessdecreased from $1.771 billion as of December 31, 2012, to $1.431 billion as of December 31, 2013, primarily reflecting sales, principalpaydowns and other-than-temporary impairments recognized. Gross unrealized losses related to our asset-backed securities collateralized bysub-prime mortgages attributable to the Closed Block Business were $127 million as of December 31, 2013, and $315 million as ofDecember 31, 2012. For additional information regarding other-than-temporary impairments of asset-backed securities collateralized by sub-prime mortgages, see “—Realized Investment Gains and Losses” above. For information regarding the methodology used in determining thefair value of our asset-backed securities collateralized by sub-prime mortgages, see Note 20 to the Consolidated Financial Statements.
The weighted average estimated subordination percentage of asset-backed securities collateralized by sub-prime mortgages attributable tothe Closed Block Business, excluding those supported by guarantees from monoline bond insurers, was 33% as of December 31, 2013. Thesubordination percentage represents the current weighted average estimated percentage of the capital structure subordinated to our investmentholding that is available to absorb losses before the security incurs the first dollar loss of principal. As of December 31, 2013, based on amortizedcost, approximately 70% of the asset-backed securities collateralized by sub-prime mortgages attributable to the Closed Block Business haveestimated credit subordination percentages of 20% or more, and 48% have estimated credit subordination percentages of 30% or more.
70 Prudential Financial, Inc. 2013 Annual Report

In addition to subordination, certain securities, referred to as front pay or second pay securities, benefit from the prioritization of principalcash flows within the senior tranches of the structure. In most instances, these shorter duration senior securities have priority to principal cashflows over other securities in the structure, including longer duration senior securities. Included within the $1.431 billion of asset-backedsecurities collateralized by sub-prime mortgages attributable to the Closed Block Business as of December 31, 2013, were $210 million ofsecurities, on an amortized cost basis, that represent front pay or second pay securities, depending on the overall structure of the securities.
Residential Mortgage-Backed SecuritiesThe following tables set forth the amortized cost of our residential mortgage-backed securities attributable to the Financial Services
Businesses and Closed Block Business as of the dates indicated.
Residential Mortgage-Backed Securities at Amortized Cost
December 31, 2013
Financial Services Businesses Closed Block Business
AmortizedCost % of Total
AmortizedCost % of Total
($ in millions)By security type:
Agency pass-through securities(1) . . . . . . . . . . . . . . . . . . . . . . . . . . . . . . . . . . . . . . . . . . . $5,770 98.3% $ 966 89.4%Collateralized mortgage obligations(2)(3) . . . . . . . . . . . . . . . . . . . . . . . . . . . . . . . . . . . . . 102 1.7 114 10.6
Total residential mortgage-backed securities . . . . . . . . . . . . . . . . . . . . . . . . . . . . . . . $5,872 100.0% $1,080 100.0%
Portion rated AA or higher(4) . . . . . . . . . . . . . . . . . . . . . . . . . . . . . . . . . . . . . . . . . . . . . . . . . . . $5,779 98.4% $ 966 89.4%
December 31, 2012
Financial Services Businesses Closed Block Business
AmortizedCost % of Total
AmortizedCost % of Total
($ in millions)By security type:
Agency pass-through securities(1) . . . . . . . . . . . . . . . . . . . . . . . . . . . . . . . . . . . . . . . . . . . $8,183 97.9% $1,364 89.7%Collateralized mortgage obligations(2)(3) . . . . . . . . . . . . . . . . . . . . . . . . . . . . . . . . . . . . . 177 2.1 156 10.3
Total residential mortgage-backed securities . . . . . . . . . . . . . . . . . . . . . . . . . . . . . . . $8,360 100.0% $1,520 100.0%
Portion rated AA or higher(4) . . . . . . . . . . . . . . . . . . . . . . . . . . . . . . . . . . . . . . . . . . . . . . . . . . . $8,247 98.7% $1,364 89.7%
(1) As of December 31, 2013, of these securities, for the Financial Services Businesses, $4.388 billion are supported by U.S. government and $1.382 billionare supported by foreign governments. As of December 31, 2012, of these securities, for the Financial Services Businesses, $6.359 billion weresupported by the U.S. government and $1.824 billion were supported by foreign governments. For the Closed Block Business, all of the securities aresupported by the U.S. government as of both December 31, 2013 and 2012.
(2) Includes alternative residential mortgage loans of $28 million and $36 million in the Financial Services Businesses, and $58 million and $76 million inthe Closed Block Business, as of December 31, 2013 and 2012, respectively.
(3) As of December 31, 2013, of these collateralized mortgage obligations, for the Financial Services Businesses, 9% have credit ratings of A or above,33% have BBB credit ratings and the remaining 58% have below investment grade ratings and, as of December 31, 2012, 57% have credit ratings of Aor above, 5% have BBB credit ratings and the remaining 38% have below investment grade ratings. As of December 31, 2013, for the Closed BlockBusiness, 14% have BBB credit ratings and 86% have below investment grade ratings and, as of December 31, 2012, 13% have BBB credit ratings and87% have below investment grade ratings.
(4) Based on lowest external rating agency rating.
Commercial Mortgage-Backed SecuritiesThe commercial real estate market was severely impacted by the financial crisis and the subsequent recession; however, market
fundamentals have bottomed and have shown signs of improvement since late 2010. Commercial real estate vacancy rates have declined fromtheir peak, rent growth has turned positive, and prices of commercial real estate have rebounded. Additionally, the elevated delinquency rate onmortgages in the commercial mortgage-backed securities market has decreased and refinancing activity is more robust, reflecting theimprovement in these fundamentals. The loans included in new issues reflect better underwriting and lower levels of leverage compared to 2007.
The following tables set forth the amortized cost and fair value of our commercial mortgage-backed securities attributable to theFinancial Services Businesses as of the dates indicated, by credit quality and by year of issuance (vintage).
Commercial Mortgage-Backed Securities at Amortized Cost—Financial Services Businesses
December 31, 2013
Lowest Rating Agency Rating(1)
Vintage AAA AA A BBBBB andbelow
TotalAmortized
Cost
TotalDecember 31,
2012
(in millions)2013 . . . . . . . . . . . . . . . . . . . . . . . . . . . . . . . . . . . . . . . . . . . . . . . . . . . . . . . . . . . . $2,445 $125 $ 0 $ 9 $0 $2,579 $ 02012—2009 . . . . . . . . . . . . . . . . . . . . . . . . . . . . . . . . . . . . . . . . . . . . . . . . . . . . . . 245 284 0 0 0 529 4042008—2007 . . . . . . . . . . . . . . . . . . . . . . . . . . . . . . . . . . . . . . . . . . . . . . . . . . . . . . 875 44 28 5 0 952 1,3582006 . . . . . . . . . . . . . . . . . . . . . . . . . . . . . . . . . . . . . . . . . . . . . . . . . . . . . . . . . . . . 3,018 103 7 4 0 3,132 2,7812005 . . . . . . . . . . . . . . . . . . . . . . . . . . . . . . . . . . . . . . . . . . . . . . . . . . . . . . . . . . . . 2,039 65 8 4 0 2,116 2,1132004 & Prior . . . . . . . . . . . . . . . . . . . . . . . . . . . . . . . . . . . . . . . . . . . . . . . . . . . . . . 368 72 23 0 1 464 757
Total commercial mortgage-backed securities(2)(3)(4) . . . . . . . . . . . . . . . . . . . . . $8,990 $693 $66 $22 $1 $9,772 $7,413
Prudential Financial, Inc. 2013 Annual Report 71

(1) The table above provides ratings as assigned by nationally recognized rating agencies as of December 31, 2013, including Standard & Poor’s, Moody’s,Fitch and Realpoint.
(2) Excluded from the table above are commercial mortgage-backed securities held outside the general account in other entities and operations. Alsoexcluded from the table above are commercial mortgage-backed securities classified as trading.
(3) Included in the table above, as of December 31, 2013, are downgraded super senior securities with amortized cost of $155 million in AA and$54 million in A.
(4) Included in the table above, as of December 31, 2013, are agency commercial mortgage-backed securities with amortized cost of $443 million, all rated AA.
Commercial Mortgage-Backed Securities at Fair Value—Financial Services Businesses
December 31, 2013
Lowest Rating Agency Rating(1)
Vintage AAA AA A BBBBB andbelow
TotalFair Value
TotalDecember 31,
2012
(in millions)2013 . . . . . . . . . . . . . . . . . . . . . . . . . . . . . . . . . . . . . . . . . . . . . . . . . . . . . . . . . . . . $2,372 $120 $ 0 $ 8 $1 $ 2,501 $ 02012—2009 . . . . . . . . . . . . . . . . . . . . . . . . . . . . . . . . . . . . . . . . . . . . . . . . . . . . . . 234 300 0 0 0 534 4372008—2007 . . . . . . . . . . . . . . . . . . . . . . . . . . . . . . . . . . . . . . . . . . . . . . . . . . . . . . 897 46 27 5 1 976 1,4472006 . . . . . . . . . . . . . . . . . . . . . . . . . . . . . . . . . . . . . . . . . . . . . . . . . . . . . . . . . . . . 3,161 111 7 4 0 3,283 3,0622005 . . . . . . . . . . . . . . . . . . . . . . . . . . . . . . . . . . . . . . . . . . . . . . . . . . . . . . . . . . . . 2,114 74 10 5 0 2,203 2,2612004 & Prior . . . . . . . . . . . . . . . . . . . . . . . . . . . . . . . . . . . . . . . . . . . . . . . . . . . . . . 412 91 28 0 0 531 787
Total commercial mortgage-backed securities(2)(3) . . . . . . . . . . . . . . . . . . . . . . . $9,190 $742 $72 $22 $2 $10,028 $7,994
(1) The table above provides ratings as assigned by nationally recognized rating agencies as of December 31, 2013, including Standard & Poor’s, Moody’s,Fitch and Realpoint.
(2) Excluded from the table above are commercial mortgage-backed securities held outside the general account in other entities and operations. Alsoexcluded from the table above are commercial mortgage-backed securities classified as trading.
(3) Included in the table above, as of December 31, 2013, are agency commercial mortgage-backed securities with fair value of $457 million, all rated AA.
Included in the tables above are commercial mortgage-backed securities collateralized by U.S. properties, all related to commercial mortgage-backed securities held by our Japanese insurance operations, with an amortized cost of $380 million in AAA, $93 million in AA, $26 million in Aand $8 million in BBB as of December 31, 2013, and $674 million in AAA, $116 million in AA, $40 million in A, and $9 million in BBB as ofDecember 31, 2012. Commercial mortgage-backed securities collateralized by non-U.S. properties are immaterial for both years.
The following table sets forth the amortized cost of our AAA commercial mortgage-backed securities attributable to the FinancialServices Businesses as of the dates indicated, by type and by year of issuance (vintage).
AAA Rated Commercial Mortgage-Backed Securities—Amortized Cost by Type and Vintage—Financial Services Businesses
December 31, 2013
Super Senior AAA Structures Other AAA
Vintage
SuperSenior
(shorterdurationtranches)
SuperSenior
(longestdurationtranches) Mezzanine Junior
OtherSenior
OtherSubordinate Other
Total AAASecurities atAmortized
Cost
(in millions)2013 . . . . . . . . . . . . . . . . . . . . . . . . . . . . . . . . . . . . $2,445 $ 0 $0 $ 0 $ 0 $ 0 $0 $2,4452012—2009 . . . . . . . . . . . . . . . . . . . . . . . . . . . . . . 226 10 0 0 0 7 2 2452008—2007 . . . . . . . . . . . . . . . . . . . . . . . . . . . . . . 872 3 0 0 0 0 0 8752006 . . . . . . . . . . . . . . . . . . . . . . . . . . . . . . . . . . . . 1,298 1,693 0 0 27 0 0 3,0182005 . . . . . . . . . . . . . . . . . . . . . . . . . . . . . . . . . . . . 246 1,767 0 4 0 22 0 2,0392004 & Prior . . . . . . . . . . . . . . . . . . . . . . . . . . . . . . 4 183 0 32 135 14 0 368
Total . . . . . . . . . . . . . . . . . . . . . . . . . . . . . . . . . . . . $5,091 $3,656 $0 $36 $162 $43 $2 $8,990
The following tables set forth the amortized cost and fair value of our commercial mortgage-backed securities attributable to theClosed Block Business as of the dates indicated, by credit quality and by year of issuance (vintage).
Commercial Mortgage-Backed Securities at Amortized Cost—Closed Block Business
December 31, 2013
Lowest Rating Agency Rating(1)
Vintage AAA AA A BBBBB andbelow
TotalAmortized
Cost
TotalDecember 31,
2012
(in millions)2013 . . . . . . . . . . . . . . . . . . . . . . . . . . . . . . . . . . . . . . . . . . . . . . . . . . . . . . . . . . . . . $ 942 $382 $0 $ 9 $0 $1,333 $ 02012—2009 . . . . . . . . . . . . . . . . . . . . . . . . . . . . . . . . . . . . . . . . . . . . . . . . . . . . . . . 334 118 0 0 0 452 8462008—2007 . . . . . . . . . . . . . . . . . . . . . . . . . . . . . . . . . . . . . . . . . . . . . . . . . . . . . . . 323 42 0 1 5 371 5532006 . . . . . . . . . . . . . . . . . . . . . . . . . . . . . . . . . . . . . . . . . . . . . . . . . . . . . . . . . . . . . 1,009 29 0 0 0 1,038 1,3012005 . . . . . . . . . . . . . . . . . . . . . . . . . . . . . . . . . . . . . . . . . . . . . . . . . . . . . . . . . . . . . 684 26 0 0 0 710 1,0912004 & Prior . . . . . . . . . . . . . . . . . . . . . . . . . . . . . . . . . . . . . . . . . . . . . . . . . . . . . . . 48 4 0 4 0 56 238
Total commercial mortgage-backed securities(2)(3) . . . . . . . . . . . . . . . . . . . . . . . . $3,340 $601 $0 $14 $5 $3,960 $4,029
72 Prudential Financial, Inc. 2013 Annual Report

(1) The table above provides ratings as assigned by nationally recognized rating agencies as of December 31, 2013, including Standard & Poor’s, Moody’s,Fitch and Realpoint.
(2) Included in the table above, as of December 31, 2013, are downgraded super senior securities with amortized cost of $55 million in AA.(3) Included in the table above, as of December 31, 2013, are agency commercial mortgage-backed securities with amortized cost of $20 million in AAA
and $542 million in AA.
Commercial Mortgage-Backed Securities at Fair Value—Closed Block Business
December 31, 2013
Lowest Rating Agency Rating(1)
Vintage AAA AA A BBBBB andbelow
TotalFair Value
TotalDecember 31,
2012
(in millions)2013 . . . . . . . . . . . . . . . . . . . . . . . . . . . . . . . . . . . . . . . . . . . . . . . . . . . . . . . . . . . . . $ 911 $375 $0 $ 8 $ 0 $1,294 $ 02012—2009 . . . . . . . . . . . . . . . . . . . . . . . . . . . . . . . . . . . . . . . . . . . . . . . . . . . . . . . 325 118 0 0 0 443 8682008—2007 . . . . . . . . . . . . . . . . . . . . . . . . . . . . . . . . . . . . . . . . . . . . . . . . . . . . . . . 326 41 0 1 13 381 5802006 . . . . . . . . . . . . . . . . . . . . . . . . . . . . . . . . . . . . . . . . . . . . . . . . . . . . . . . . . . . . . 1,032 30 0 0 0 1,062 1,3752005 . . . . . . . . . . . . . . . . . . . . . . . . . . . . . . . . . . . . . . . . . . . . . . . . . . . . . . . . . . . . . 698 27 0 0 0 725 1,1412004 & Prior . . . . . . . . . . . . . . . . . . . . . . . . . . . . . . . . . . . . . . . . . . . . . . . . . . . . . . . 48 4 0 4 0 56 242
Total commercial mortgage-backed securities(2) . . . . . . . . . . . . . . . . . . . . . . . . . . $3,340 $595 $0 $13 $13 $3,961 $4,206
(1) The table above provides ratings as assigned by nationally recognized rating agencies as of December 31, 2013, including Standard & Poor’s, Moody’s,Fitch and Realpoint.
(2) Included in the table above, as of December 31, 2013, are agency commercial mortgage-backed securities with fair value of $18 million in AAA and$534 million in AA.
The following table sets forth the amortized cost of our AAA commercial mortgage-backed securities attributable to the Closed BlockBusiness as of the dates indicated, by type and by year of issuance (vintage).
AAA Rated Commercial Mortgage-Backed Securities—Amortized Cost by Type and Vintage—Closed Block Business
December 31, 2013
Super Senior AAA Structures Other AAA
Vintage
SuperSenior
(shorterdurationtranches)
SuperSenior
(longestdurationtranches) Mezzanine Junior
OtherSenior
OtherSubordinate Other
Total AAASecurities atAmortized
Cost
(in millions)2013 . . . . . . . . . . . . . . . . . . . . . . . . . . . . . . . . . . . . $ 942 $ 0 $0 $0 $0 $0 $0 $ 9422012—2009 . . . . . . . . . . . . . . . . . . . . . . . . . . . . . . 314 0 0 0 0 0 0 3142008—2007 . . . . . . . . . . . . . . . . . . . . . . . . . . . . . . 323 0 0 0 0 0 0 3232006 . . . . . . . . . . . . . . . . . . . . . . . . . . . . . . . . . . . . 277 732 0 0 0 0 0 1,0092005 . . . . . . . . . . . . . . . . . . . . . . . . . . . . . . . . . . . . 354 330 0 0 0 0 0 6842004 & Prior . . . . . . . . . . . . . . . . . . . . . . . . . . . . . . 30 10 0 0 8 0 0 48
Total . . . . . . . . . . . . . . . . . . . . . . . . . . . . . . . . . . . . $2,240 $1,072 $0 $0 $8 $0 $0 $3,320
(1) Excluded from the table above, as of December 31, 2013, are agency commercial mortgage-backed securities with amortized cost of $20 million.
Fixed Maturity Securities Credit QualityThe Securities Valuation Office, or SVO, of the National Association of Insurance Commissioners, or NAIC, evaluates the
investments of insurers for statutory reporting purposes and assigns fixed maturity securities to one of six categories called “NAICDesignations.” In general, NAIC Designations of “1” highest quality, or “2” high quality, include fixed maturities considered investmentgrade, which include securities rated Baa3 or higher by Moody’s or BBB- or higher by Standard & Poor’s. NAIC Designations of “3”through “6” generally include fixed maturities referred to as below investment grade, which include securities rated Ba1 or lower byMoody’s and BB+ or lower by Standard & Poor’s. The NAIC Designations for commercial mortgage-backed securities and non-agencyresidential mortgage-backed securities, including our asset-backed securities collateralized by sub-prime mortgages, are based on securitylevel expected losses as modeled by an independent third party (engaged by the NAIC) and the statutory carrying value of the security,including any purchase discounts or impairment charges previously recognized.
As a result of time lags between the funding of investments, the finalization of legal documents, and the completion of the SVO filingprocess, the fixed maturity portfolio generally includes securities that have not yet been rated by the SVO as of each balance sheet date. Pendingreceipt of SVO ratings, the categorization of these securities by NAIC Designation is based on the expected ratings indicated by internal analysis.
Investments of our international insurance companies are not subject to NAIC guidelines. Investments of our Japanese insuranceoperations are regulated locally by the Financial Services Agency, an agency of the Japanese government. The Financial Services Agencyhas its own investment quality criteria and risk control standards. Our Japanese insurance companies comply with the Financial ServicesAgency’s credit quality review and risk monitoring guidelines. The credit quality ratings of the investments of our Japanese insurancecompanies are based on ratings assigned by nationally recognized credit rating agencies, including Moody’s, Standard & Poor’s, or ratingequivalents based on ratings assigned by Japanese credit ratings agencies.
Prudential Financial, Inc. 2013 Annual Report 73

The following table sets forth our fixed maturity portfolio by NAIC Designation attributable to the Financial Services Businesses as ofthe dates indicated.
Fixed Maturity Securities—Financial Services Businesses
(1)(2) December 31, 2013 December 31, 2012
NAIC DesignationAmortized
Cost
GrossUnrealizedGains(3)
GrossUnrealizedLosses(3)(4)
FairValue
AmortizedCost
GrossUnrealizedGains(3)
GrossUnrealizedLosses(3)(4)
FairValue
(in millions)1 $179,543 $15,520 $2,811 $192,252 $189,129 $16,564 $1,037 $204,6562 42,659 3,563 938 45,284 42,424 3,688 656 45,456
Subtotal High or Highest Quality Securities(5) . . . . . . 222,202 19,083 3,749 237,536 231,553 20,252 1,693 250,1123 6,321 412 152 6,581 6,086 301 233 6,1544 2,058 191 51 2,198 1,982 133 129 1,9865 322 31 16 337 650 27 74 6036 213 31 4 240 186 39 17 208
Subtotal Other Securities(6)(7) . . . . . . . . . . . . . . . . . . . 8,914 665 223 9,356 8,904 500 453 8,951
Total Fixed Maturities . . . . . . . . . . . . . . . . . . . . . $231,116 $19,748 $3,972 $246,892 $240,457 $20,752 $2,146 $259,063
(1) Reflects equivalent ratings for investments of the international insurance operations.(2) Includes, as of December 31, 2013 and 2012, 306 securities with amortized cost of $806 million (fair value, $831 million) and 104 securities with amortized
cost of $793 million (fair value, $847 million), respectively, that have been categorized based on expected NAIC Designations pending receipt of SVO ratings.(3) Includes $265 million of gross unrealized gains and $24 million gross unrealized losses as of December 31, 2013, compared to $310 million of gross
unrealized gains and $67 million of gross unrealized losses as of December 31, 2012, on securities classified as held-to-maturity.(4) As of December 31, 2013, includes gross unrealized losses of $181 million on public fixed maturities and $42 million on private fixed maturities
considered to be other than high or highest quality and, as of December 31, 2012, includes gross unrealized losses of $401 million on public fixedmaturities and $52 million on private fixed maturities considered to be other than high or highest quality.
(5) On an amortized cost basis, as of December 31, 2013, includes $196,058 million of public fixed maturities and $26,144 million of private fixedmaturities and, as of December 31, 2012, includes $206,966 million of public fixed maturities and $24,587 million of private fixed maturities.
(6) On an amortized cost basis, as of December 31, 2013, includes $5,710 million of public fixed maturities and $3,204 million of private fixed maturitiesand, as of December 31, 2012, includes $5,416 million of public fixed maturities and $3,488 million of private fixed maturities.
(7) On an amortized cost basis, as of December 31, 2013, securities considered below investment grade based on lowest of external rating agency ratings, totaled$10.5 billion, or 5% of the total fixed maturities, and include securities considered high or highest quality by the NAIC based on the rules described above.
The following table sets forth our fixed maturity portfolio by NAIC Designation attributable to the Closed Block Business as of thedates indicated.
Fixed Maturity Securities—Closed Block Business
(1) December 31, 2013 December 31, 2012
NAIC DesignationAmortized
Cost
GrossUnrealized
Gains
GrossUnrealizedLosses(2)
FairValue
AmortizedCost
GrossUnrealized
Gains
GrossUnrealizedLosses(2)
FairValue
(in millions)1 $23,521 $1,543 $307 $24,757 $23,197 $3,353 $114 $26,4362 14,166 1,359 118 15,407 14,581 2,091 58 16,614
Subtotal High or Highest Quality Securities(3) . . . . . . . . . . 37,687 2,902 425 40,164 37,778 5,444 172 43,0503 1,957 106 23 2,040 1,989 156 94 2,0514 760 24 21 763 1,015 35 92 9585 138 9 5 142 271 13 34 2506 86 19 1 104 84 27 1 110
Subtotal Other Securities(4)(5) . . . . . . . . . . . . . . . . . . . . . . 2,941 158 50 3,049 3,359 231 221 3,369
Total Fixed Maturities . . . . . . . . . . . . . . . . . . . . . . . . . $40,628 $3,060 $475 $43,213 $41,137 $5,675 $393 $46,419
(1) Includes, as of December 31, 2013 and 2012, 56 securities with amortized cost of $822 million (fair value, $837 million) and 51 securities with amortized costof $885 million (fair value, $941 million), respectively, that have been categorized based on expected NAIC Designations pending receipt of SVO ratings.
(2) As of December 31, 2013, includes gross unrealized losses of $35 million on public fixed maturities and $15 million on private fixed maturitiesconsidered to be other than high or highest quality and, as of December 31, 2012, includes gross unrealized losses of $207 million on public fixedmaturities and $14 million on private fixed maturities considered to be other than high or highest quality.
(3) On an amortized cost basis, as of December 31, 2013, includes $24,642 million of public fixed maturities and $13,045 million of private fixedmaturities and, as of December 31, 2012, includes $23,884 million of public fixed maturities and $13,894 million of private fixed maturities.
(4) On an amortized cost basis, as of December 31, 2013, includes $1,407 million of public fixed maturities and $1,534 million of private fixed maturitiesand, as of December 31, 2012, includes $1,603 million of public fixed maturities and $1,756 million of private fixed maturities.
(5) On an amortized cost basis, as of December 31, 2013, securities considered below investment grade based on lowest of external rating agency ratings, totaled$4.2 billion, or 10% of the total fixed maturities, and include securities considered high or highest quality by the NAIC based on the rules described above.
Credit Derivative Exposure to Public Fixed MaturitiesIn addition to the credit exposure from public fixed maturities noted above, we sell credit derivatives to enhance the return on our
investment portfolio by creating credit exposure similar to an investment in public fixed maturity cash instruments.
In a credit derivative, we may sell credit protection on an identified name or a broad based index, and in return receive a quarterlypremium. This premium or credit spread generally corresponds to the difference between the yield on the reference names (or indexunderlying reference names) public fixed maturity cash instruments and swap rates at the time the agreement is executed.
74 Prudential Financial, Inc. 2013 Annual Report

The majority of the underlying reference names in single name and index credit derivatives where we have sold credit protection, aswell as all the counterparties to these agreements, are investment grade credit quality and our credit derivatives have a remaining term tomaturity of two years or less. Credit derivative contracts are recorded at fair value with changes in fair value, including the premiumreceived, recorded in “Realized investment gains (losses), net.” The premium received for the credit derivatives we sell attributable to theFinancial Services Businesses was $3 million for both the years ended December 31, 2013 and 2012, and is included in adjusted operatingincome as an adjustment to “Realized investment gains (losses), net.”
As of December 31, 2013, the Financial Services Businesses had no outstanding sell protection credit derivatives. As of December 31,2012, the Financial Services Businesses had $1,065 million of outstanding notional amounts, reported at fair value as an asset of $2 million,where we have sold credit protection through credit derivatives. These amounts exclude a credit derivative related to surplus notes issued by asubsidiary of Prudential Insurance. See Note 21 to the Consolidated Financial Statements for additional information regarding this derivative.
As of both December 31, 2013 and 2012, the Closed Block Business had $5 million of outstanding notional amounts, respectively,each reported at fair value as an asset of less than $1 million of exposure where we have sold credit protection through credit derivatives.
In addition to selling credit protection, we have purchased credit protection using credit derivatives in order to hedge specific creditexposures in our investment portfolio. As of December 31, 2013 and 2012, the Financial Services Businesses had $1.124 billion and$1.370 billion of outstanding notional amounts, reported at fair value as a liability of $33 million and $27 million, respectively. As ofDecember 31, 2013 and 2012, the Closed Block Business had $275 million and $309 million of outstanding notional amounts, reported atfair value as a liability of $9 million and $8 million, respectively. The premium paid for the credit derivatives we purchase attributable tothe Financial Services Businesses was $29 million and $38 million for the years ended December 31, 2013 and 2012, respectively, and isincluded in adjusted operating income as an adjustment to “Realized investment gains (losses), net.” See Note 21 to the ConsolidatedFinancial Statements for additional information regarding credit derivatives and an overall description of our derivative activities.
Other-Than-Temporary Impairments of Fixed Maturity SecuritiesWe maintain separate monitoring processes for public and private fixed maturities and create watch lists to highlight securities that
require special scrutiny and management. Our public fixed maturity asset managers formally review all public fixed maturity holdings on aquarterly basis and more frequently when necessary to identify potential credit deterioration whether due to ratings downgrades,unexpected price variances, and/or company or industry specific concerns.
For private placements, our credit and portfolio management processes help ensure prudent controls over valuation and management.We have separate pricing and authorization processes to establish “checks and balances” for new investments. We apply consistentstandards of credit analysis and due diligence for all transactions, whether they originate through our own in-house origination staff orthrough agents. Our regional offices closely monitor the portfolios in their regions. We set all valuation standards centrally, and we assessthe fair value of all investments quarterly. Our private fixed maturity asset managers formally review all private fixed maturity holdings ona quarterly basis and more frequently when necessary to identify potential credit deterioration whether due to ratings downgrades,unexpected price variances, and/or company or industry specific concerns. For additional information regarding our policies regardingother-than-temporary impairments for fixed maturity securities, see Note 2 to the Consolidated Financial Statements.
Other-than-temporary impairments of general account fixed maturity securities attributable to the Financial Services Businesses thatwere recognized in earnings were $150 million and $253 million for the years ended December 31, 2013 and 2012, respectively. Includedin the other-than-temporary impairments of general account fixed maturities attributable to the Financial Services Businesses for the yearsended December 31, 2013 and 2012, were $35 million and $56 million, respectively, of other-than-temporary impairments on asset-backedsecurities collateralized by sub-prime mortgages.
Other-than-temporary impairments of fixed maturity securities attributable to the Closed Block Business that were recognized inearnings were $49 million and $74 million for the years ended December 31, 2013 and 2012, respectively. Included in the other-than-temporary impairments of fixed maturities attributable to the Closed Block Business for the years ended December 31, 2013 and 2012,were $19 million and $40 million, respectively, of other-than-temporary impairments on asset-backed securities collateralized by sub-primemortgages. For a further discussion of other-than-temporary impairments, see “—Realized Investment Gains and Losses” above.
Trading Account Assets Supporting Insurance LiabilitiesCertain products included in the Retirement and International Insurance segments are experience-rated, meaning that we expect the
investment results associated with these products will ultimately accrue to contractholders. The investments supporting these experience-rated products, excluding commercial mortgage and other loans, are primarily classified as trading and are reflected on the balance sheet as“Trading account assets supporting insurance liabilities, at fair value.” Realized and unrealized gains and losses for these investments arereported in “Asset management fees and other income,” and excluded from adjusted operating income. Investment income for theseinvestments is reported in “Net investment income,” and is included in adjusted operating income.
The following table sets forth the composition of this portfolio as of the dates indicated.December 31, 2013 December 31, 2012
AmortizedCost
FairValue
AmortizedCost
FairValue
(in millions)Short-term investments and cash equivalents . . . . . . . . . . . . . . . . . . . . . . . . . . . . . . . . . . . . . . . . . . . . . . . . . $ 697 $ 697 $ 938 $ 938Fixed maturities:
Corporate securities . . . . . . . . . . . . . . . . . . . . . . . . . . . . . . . . . . . . . . . . . . . . . . . . . . . . . . . . . . . . . . . . 12,109 12,616 11,076 12,107Commercial mortgage-backed securities . . . . . . . . . . . . . . . . . . . . . . . . . . . . . . . . . . . . . . . . . . . . . . . . 2,417 2,441 2,096 2,229Residential mortgage-backed securities . . . . . . . . . . . . . . . . . . . . . . . . . . . . . . . . . . . . . . . . . . . . . . . . . 1,857 1,830 1,965 2,026Asset-backed securities . . . . . . . . . . . . . . . . . . . . . . . . . . . . . . . . . . . . . . . . . . . . . . . . . . . . . . . . . . . . . . 1,096 1,107 1,179 1,116Foreign government bonds . . . . . . . . . . . . . . . . . . . . . . . . . . . . . . . . . . . . . . . . . . . . . . . . . . . . . . . . . . . 579 596 683 708U.S. government authorities and agencies and obligations of U.S. states . . . . . . . . . . . . . . . . . . . . . . . 303 341 369 426
Total fixed maturities . . . . . . . . . . . . . . . . . . . . . . . . . . . . . . . . . . . . . . . . . . . . . . . . . . . . . . . . . . . . . . . . . . . 18,361 18,931 17,368 18,612Equity securities . . . . . . . . . . . . . . . . . . . . . . . . . . . . . . . . . . . . . . . . . . . . . . . . . . . . . . . . . . . . . . . . . . . . . . . 913 1,199 943 1,040
Total trading account assets supporting insurance liabilities . . . . . . . . . . . . . . . . . . . . . . . . . . . . . $19,971 $20,827 $19,249 $20,590
Prudential Financial, Inc. 2013 Annual Report 75

As a percentage of amortized cost, 77% and 75% of the portfolio was publicly traded as of December 31, 2013 and 2012, respectively.As of both December 31, 2013 and 2012, 93% of the fixed maturity portfolio was considered high or highest quality based on NAIC orequivalent rating. As of December 31, 2013, $1.792 billion of the residential mortgage-backed securities were publicly traded agency pass-through securities, which are supported by implicit or explicit government guarantees, of which 99% have credit ratings of A or higher.Collateralized mortgage obligations, including approximately $53 million secured by “ALT-A” mortgages, represented the remaining$65 million of residential mortgage-backed securities, of which 37% have credit ratings of A or better and 63% are BBB and below. For adiscussion of changes in the fair value of our trading account assets supporting insurance liabilities, see “—Experience-RatedContractholder Liabilities, Trading Account Assets Supporting Insurance Liabilities and Other Related Investments” above.
Other Trading Account AssetsOther trading account assets consist primarily of certain financial instruments that contain an embedded derivative where we elected to
classify the entire instrument as a trading account asset rather than bifurcate. These instruments are carried at fair value, with realized andunrealized gains and losses reported in “Asset management fees and other income,” and excluded from adjusted operating income. Interestand dividend income from these investments is reported in “Net investment income,” and is included in adjusted operating income.
The following table sets forth the composition of our other trading account assets as of the dates indicated.
December 31, 2013 December 31, 2012
Financial ServicesBusinesses
Closed BlockBusiness
Financial ServicesBusinesses
Closed BlockBusiness
AmortizedCost
FairValue
AmortizedCost
FairValue
AmortizedCost
FairValue
AmortizedCost
FairValue
(in millions)Short-term investments and cash equivalents . . . . . . . $ 0 $ 0 $ 0 $ 0 $ 1 $ 1 $ 0 $ 0Fixed maturities . . . . . . . . . . . . . . . . . . . . . . . . . . . . . . 576 612 166 185 533 452 127 139Equity securities(1) . . . . . . . . . . . . . . . . . . . . . . . . . . . 646 729 138 157 933 973 123 136
Total other trading account assets . . . . . . . . . . . . $1,222 $1,341 $304 $342 $1,467 $1,426 $250 $275
(1) Included in equity securities are perpetual preferred stock securities that have characteristics of both debt and equity securities.
Included in the $576 million of fixed maturities attributable to the Financial Services Businesses as of December 31, 2013, on an amortizedcost basis, are $165 million of asset-backed securities, 62% of which have credit ratings of A or above, 20% have BBB credit ratings, and theremaining 18% have BB and below credit ratings. Included in the $166 million of fixed maturities attributable to the Closed Block Business as ofDecember 31, 2013, on an amortized cost basis, are $9 million of asset-backed securities, all of which have credit ratings of A or above.
Commercial Mortgage and Other Loans
Investment MixAs of December 31, 2013 and 2012, respectively, we held approximately 10% and 9% of our general account investments in
commercial mortgage and other loans. This percentage is net of a $212 million and $244 million allowance for losses as of December 31,2013 and 2012, respectively.
The following table sets forth the composition of our commercial mortgage and other loans portfolio, before the allowance for losses,as of the dates indicated.
December 31, 2013 December 31, 2012
FinancialServices
Businesses
ClosedBlock
Business
FinancialServices
Businesses
ClosedBlock
Business
(in millions)Commercial and agricultural mortgage loans . . . . . . . . . . . . . . . . . . . . . . . . . . . . . . . . . . . . . . . . . . . . . . . $29,164 $9,677 $24,139 $9,666Uncollateralized loans . . . . . . . . . . . . . . . . . . . . . . . . . . . . . . . . . . . . . . . . . . . . . . . . . . . . . . . . . . . . . . . . . 1,259 44 1,833 0Residential property loans . . . . . . . . . . . . . . . . . . . . . . . . . . . . . . . . . . . . . . . . . . . . . . . . . . . . . . . . . . . . . . 544 0 790 0Other collateralized loans . . . . . . . . . . . . . . . . . . . . . . . . . . . . . . . . . . . . . . . . . . . . . . . . . . . . . . . . . . . . . . 330 0 47 0
Total commercial mortgage and other loans(1) . . . . . . . . . . . . . . . . . . . . . . . . . . . . . . . . . . . . . . . . . . $31,297 $9,721 $26,809 $9,666
(1) Excluded from the table above are commercial mortgage loans held outside the general account in other entities and operations. For additionalinformation regarding commercial mortgage loans held outside the general account, see “—Invested Assets of Other Entities and Operations” below.
We originate commercial and agricultural mortgage loans using a dedicated investment staff and a network of independent companiesthrough our various regional offices. All loans are underwritten consistently to our standards using a proprietary quality rating system thathas been developed from our experience in real estate and mortgage lending.
Uncollateralized loans primarily represent reverse dual currency loans and corporate loans which do not meet the definition of asecurity under authoritative accounting guidance.
Residential property loans primarily include Japanese recourse loans. Upon default of these recourse loans we can make a claim against thepersonal assets of the property owner, in addition to the mortgaged property. These loans are also backed by third party guarantors.
Other collateralized loans attributable to the Financial Services Businesses primarily include collateralized structured loans andconsumer loans.
76 Prudential Financial, Inc. 2013 Annual Report

Composition of Commercial and Agricultural Mortgage LoansThe commercial real estate market was severely impacted by the financial crisis and the subsequent recession, though the flow of capital to
commercial real estate has been strong since 2010. Portfolio lenders have been actively originating loans, focusing primarily on higher qualityproperties in major markets, resulting in an increase in the liquidity and availability of capital in the commercial mortgage loan market. For mostproperty types, the market fundamentals are stable or improving. In addition, the commercial banks are active and there has been increased loanorigination activity by securitization lenders as commercial mortgage market spreads have generally tightened. These conditions have led togreater competition for portfolio lenders such as our general account, though underwriting remains conservative. Commercial real estatefundamentals continue to improve while employment growth has been modest, and delinquency rates on our commercial mortgage loans remainlow, from an historic standpoint, and are stable. For additional information, see “—Realized Investment Gains and Losses” above.
Our commercial and agricultural mortgage loan portfolio strategy emphasizes diversification by property type and geographiclocation. The following tables set forth the breakdown of the gross carrying values of our general account investments in commercial andagricultural mortgage loans by geographic region and property type as of the dates indicated.
December 31, 2013 December 31, 2012
Financial ServicesBusinesses
Closed BlockBusiness
Financial ServicesBusinesses
Closed BlockBusiness
GrossCarrying
Value% ofTotal
GrossCarrying
Value% ofTotal
GrossCarrying
Value% ofTotal
GrossCarrying
Value% ofTotal
($ in millions)Commercial and agricultural mortgage loans by region:U.S. Regions:
Pacific . . . . . . . . . . . . . . . . . . . . . . . . . . . . . . . . . . . . . . . . . . . . . . . . . . . $ 9,089 31.1% $3,230 33.4% $ 7,600 31.5% $3,423 35.4%South Atlantic . . . . . . . . . . . . . . . . . . . . . . . . . . . . . . . . . . . . . . . . . . . . . 5,671 19.4 1,711 17.7 4,846 20.1 1,814 18.8Middle Atlantic . . . . . . . . . . . . . . . . . . . . . . . . . . . . . . . . . . . . . . . . . . . . 3,855 13.3 1,924 19.9 3,706 15.3 2,050 21.2East North Central . . . . . . . . . . . . . . . . . . . . . . . . . . . . . . . . . . . . . . . . . . 2,678 9.2 725 7.4 2,000 8.3 570 5.9West South Central . . . . . . . . . . . . . . . . . . . . . . . . . . . . . . . . . . . . . . . . . 2,828 9.7 823 8.6 2,220 9.2 730 7.6Mountain . . . . . . . . . . . . . . . . . . . . . . . . . . . . . . . . . . . . . . . . . . . . . . . . . 1,448 5.0 278 2.9 1,254 5.2 350 3.6New England . . . . . . . . . . . . . . . . . . . . . . . . . . . . . . . . . . . . . . . . . . . . . . 1,026 3.5 412 4.2 638 2.6 323 3.3West North Central . . . . . . . . . . . . . . . . . . . . . . . . . . . . . . . . . . . . . . . . . 555 1.9 104 1.1 466 1.9 137 1.4East South Central . . . . . . . . . . . . . . . . . . . . . . . . . . . . . . . . . . . . . . . . . . 296 1.0 137 1.4 305 1.3 142 1.5
Subtotal-U.S. . . . . . . . . . . . . . . . . . . . . . . . . . . . . . . . . . . . . . . . . . . . . . . . . . . 27,446 94.1 9,344 96.6 23,035 95.4 9,539 98.7Asia . . . . . . . . . . . . . . . . . . . . . . . . . . . . . . . . . . . . . . . . . . . . . . . . . . . . . . . . . 723 2.5 0 0.0 648 2.7 0 0.0Other . . . . . . . . . . . . . . . . . . . . . . . . . . . . . . . . . . . . . . . . . . . . . . . . . . . . . . . . 995 3.4 333 3.4 456 1.9 127 1.3
Total commercial and agricultural mortgage loans . . . . . . . . . . . . . . . . . $29,164 100.0% $9,677 100.0% $24,139 100.0% $9,666 100.0%
December 31, 2013 December 31, 2012
Financial ServicesBusinesses
Closed BlockBusiness
Financial ServicesBusinesses
Closed BlockBusiness
GrossCarrying
Value% ofTotal
GrossCarrying
Value% ofTotal
GrossCarrying
Value% ofTotal
GrossCarrying
Value% ofTotal
($ in millions)Commercial and agricultural mortgage loans by property type:Industrial . . . . . . . . . . . . . . . . . . . . . . . . . . . . . . . . . . . . . . . . . . . . . . . . . . . . $ 5,778 19.8% $1,612 16.7% $ 5,832 24.1% $1,804 18.7%Retail . . . . . . . . . . . . . . . . . . . . . . . . . . . . . . . . . . . . . . . . . . . . . . . . . . . . . . 6,085 20.9 2,612 27.0 5,449 22.6 2,658 27.5Office . . . . . . . . . . . . . . . . . . . . . . . . . . . . . . . . . . . . . . . . . . . . . . . . . . . . . . 5,389 18.5 2,359 24.4 4,459 18.5 2,363 24.4Apartments/Multi-Family . . . . . . . . . . . . . . . . . . . . . . . . . . . . . . . . . . . . . . . 6,031 20.7 1,287 13.3 3,879 16.1 1,159 12.0Other . . . . . . . . . . . . . . . . . . . . . . . . . . . . . . . . . . . . . . . . . . . . . . . . . . . . . . . 2,806 9.6 653 6.7 2,203 9.1 598 6.2Agricultural properties . . . . . . . . . . . . . . . . . . . . . . . . . . . . . . . . . . . . . . . . . 1,598 5.4 585 6.0 1,468 6.1 645 6.7Hospitality . . . . . . . . . . . . . . . . . . . . . . . . . . . . . . . . . . . . . . . . . . . . . . . . . . 1,477 5.1 569 5.9 849 3.5 439 4.5
Total commercial and agricultural mortgage loans . . . . . . . . . . . . . . . $29,164 100.0% $9,677 100.0% $24,139 100.0% $9,666 100.0%
Loan-to-value and debt service coverage ratios are measures commonly used to assess the quality of commercial andagricultural mortgage loans. The loan-to-value ratio compares the amount of the loan to the fair value of the underlying propertycollateralizing the loan, and is commonly expressed as a percentage. Loan-to-value ratios greater than 100% indicate that the loanamount is greater than the collateral value. A smaller loan-to-value ratio indicates a greater excess of collateral value over the loanamount. The debt service coverage ratio compares a property’s net operating income to its debt service payments. Debt servicecoverage ratios less than 1.0 times indicate that property operations do not generate enough income to cover the loan’s current debtpayments. A larger debt service coverage ratio indicates a greater excess of net operating income over the debt service payments.
As of December 31, 2013, our general account investments in commercial and agricultural mortgage loans attributable to the FinancialServices Businesses had a weighted average debt service coverage ratio of 2.22 times, and a weighted average loan-to-value ratio of 57%. As ofDecember 31, 2013, approximately 96% of commercial and agricultural mortgage loans attributable to the Financial Services Businesses werefixed rate loans. As of December 31, 2013, our general account investments in commercial and agricultural mortgage loans attributable to theClosed Block Business had a weighted average debt service coverage ratio of 2.09 times, and a weighted average loan-to-value ratio of 52%. Asof December 31, 2013, approximately all of the commercial and agricultural mortgage loans attributable to the Closed Block Business were fixedrate loans. For those general account commercial and agricultural mortgage loans attributable to the Financial Services Businesses that wereoriginated in 2013, the weighted average debt service coverage ratio was 2.49 times and the weighted average loan-to-value ratio was 61%.
The values utilized in calculating these loan-to-value ratios are developed as part of our periodic review of the commercial and agriculturalmortgage loan portfolio, which includes an internal evaluation of the underlying collateral value. Our periodic review also includes a quality re-
Prudential Financial, Inc. 2013 Annual Report 77

rating process, whereby we update the internal quality rating originally assigned at underwriting based on the proprietary quality rating systemmentioned above. As discussed below, the internal quality rating is a key input in determining our allowance for loan losses.
For loans with collateral under construction, renovation or lease-up, a stabilized value and projected net operating income are used inthe calculation of the loan-to-value and debt service coverage ratios. Our commercial and agricultural mortgage loan portfolio attributable tothe Financial Services Businesses included approximately $0.7 billion and $0.5 billion of such loans as of December 31, 2013 and 2012,respectively, and our commercial and agricultural mortgage loan portfolio attributable to the Closed Block Business included approximately$0.1 billion of such loans as of both December 31, 2013 and 2012, respectively. All else being equal, these loans are inherently more riskythan those collateralized by properties that have already stabilized; however, improvement in the general risk profile of our overallcommercial mortgage loan portfolio has enabled us to pursue incremental volume in this area. As of December 31, 2013, there are no loan-specific reserves related to these loans attributable to either the Financial Services Businesses or the Closed Block Business. In addition,these pre-stabilized loans are included in the calculation of our portfolio reserve as discussed below. For information regarding similar loanswe hold as part of our commercial and agricultural mortgage operations, see “—Invested Assets of Other Entities and Operations” below.
The following tables set forth the gross carrying value of our general account investments in commercial and agricultural mortgageloans attributable to the Financial Services Businesses and the Closed Block Business as of the dates indicated by loan-to-value and debtservice coverage ratios.
Commercial and Agricultural Mortgage Loans by Loan-to-Value and Debt Service Coverage Ratios—Financial Services Businesses
December 31, 2013
Debt Service Coverage Ratio
Greaterthan1.2x
1.0xto
<1.2x
Lessthan1.0x
TotalCommercial
andAgricultural
MortgageLoans
Loan-to-Value Ratio (in millions)
0%—59.99% . . . . . . . . . . . . . . . . . . . . . . . . . . . . . . . . . . . . . . . . . . . . . . . . . . . . . . . . . . . . . . . . . . . . . . . . . . . . . . $15,202 $ 536 $144 $15,88260%—69.99% . . . . . . . . . . . . . . . . . . . . . . . . . . . . . . . . . . . . . . . . . . . . . . . . . . . . . . . . . . . . . . . . . . . . . . . . . . . . . 8,645 308 68 9,02170%—79.99% . . . . . . . . . . . . . . . . . . . . . . . . . . . . . . . . . . . . . . . . . . . . . . . . . . . . . . . . . . . . . . . . . . . . . . . . . . . . . 3,176 310 188 3,674Greater than 80% . . . . . . . . . . . . . . . . . . . . . . . . . . . . . . . . . . . . . . . . . . . . . . . . . . . . . . . . . . . . . . . . . . . . . . . . . . . 234 129 224 587
Total commercial and agricultural mortgage loans . . . . . . . . . . . . . . . . . . . . . . . . . . . . . . . . . . . . . . . . . . . . . $27,257 $1,283 $624 $29,164
Commercial and Agricultural Mortgage Loans by Loan-to-Value and Debt Service Coverage Ratios—Closed Block Business
December 31, 2013
Debt Service Coverage Ratio
Greaterthan1.2x
1.0xto
<1.2x
Lessthan1.0x
TotalCommercial
andAgricultural
MortgageLoans
Loan-to-Value Ratio (in millions)
0%—59.99% . . . . . . . . . . . . . . . . . . . . . . . . . . . . . . . . . . . . . . . . . . . . . . . . . . . . . . . . . . . . . . . . . . . . . . . . . . . . . . . $5,905 $198 $ 34 $6,13760%—69.99% . . . . . . . . . . . . . . . . . . . . . . . . . . . . . . . . . . . . . . . . . . . . . . . . . . . . . . . . . . . . . . . . . . . . . . . . . . . . . . 2,471 71 27 2,56970%—79.99% . . . . . . . . . . . . . . . . . . . . . . . . . . . . . . . . . . . . . . . . . . . . . . . . . . . . . . . . . . . . . . . . . . . . . . . . . . . . . . 674 112 29 815Greater than 80% . . . . . . . . . . . . . . . . . . . . . . . . . . . . . . . . . . . . . . . . . . . . . . . . . . . . . . . . . . . . . . . . . . . . . . . . . . . 78 30 48 156
Total commercial and agricultural mortgage loans . . . . . . . . . . . . . . . . . . . . . . . . . . . . . . . . . . . . . . . . . . . . . . $9,128 $411 $138 $9,677
The following table sets forth the breakdown of our commercial and agricultural mortgage loans by year of origination as ofDecember 31, 2013.
December 31, 2013
Financial Services Businesses Closed Block Business
Year of Origination
GrossCarrying
Value % of Total
GrossCarrying
Value % of Total
($ in millions)2013 . . . . . . . . . . . . . . . . . . . . . . . . . . . . . . . . . . . . . . . . . . . . . . . . . . . . . . . . . . . . . . . . . . . . . . . . $ 8,809 30.2% $1,502 15.5%2012 . . . . . . . . . . . . . . . . . . . . . . . . . . . . . . . . . . . . . . . . . . . . . . . . . . . . . . . . . . . . . . . . . . . . . . . . 4,732 16.2 1,817 18.82011 . . . . . . . . . . . . . . . . . . . . . . . . . . . . . . . . . . . . . . . . . . . . . . . . . . . . . . . . . . . . . . . . . . . . . . . . 4,711 16.2 1,406 14.52010 . . . . . . . . . . . . . . . . . . . . . . . . . . . . . . . . . . . . . . . . . . . . . . . . . . . . . . . . . . . . . . . . . . . . . . . . 2,813 9.6 1,020 10.52009 . . . . . . . . . . . . . . . . . . . . . . . . . . . . . . . . . . . . . . . . . . . . . . . . . . . . . . . . . . . . . . . . . . . . . . . . 856 2.9 335 3.52008 . . . . . . . . . . . . . . . . . . . . . . . . . . . . . . . . . . . . . . . . . . . . . . . . . . . . . . . . . . . . . . . . . . . . . . . . 1,573 5.4 545 5.62007 & Prior . . . . . . . . . . . . . . . . . . . . . . . . . . . . . . . . . . . . . . . . . . . . . . . . . . . . . . . . . . . . . . . . . 5,670 19.5 3,052 31.5
Total commercial and agricultural mortgage loans . . . . . . . . . . . . . . . . . . . . . . . . . . . . . . . . $29,164 100.0% $9,677 100.0%
78 Prudential Financial, Inc. 2013 Annual Report

Commercial Mortgage and Other Loans by Contractual Maturity DateThe following table sets forth the breakdown of our commercial mortgage and other loan portfolio by contractual maturity as of
December 31, 2013.
December 31, 2013
Financial Services Businesses Closed Block Business
AmortizedCost % of Total
AmortizedCost % of Total
($ in millions)VintageMaturing in 2014 . . . . . . . . . . . . . . . . . . . . . . . . . . . . . . . . . . . . . . . . . . . . . . . . . . . . . . . . . . . . . $ 712 2.4% $ 352 3.6%Maturing in 2015 . . . . . . . . . . . . . . . . . . . . . . . . . . . . . . . . . . . . . . . . . . . . . . . . . . . . . . . . . . . . . 2,057 6.6 510 5.3Maturing in 2016 . . . . . . . . . . . . . . . . . . . . . . . . . . . . . . . . . . . . . . . . . . . . . . . . . . . . . . . . . . . . . 3,479 11.1 888 9.1Maturing in 2017 . . . . . . . . . . . . . . . . . . . . . . . . . . . . . . . . . . . . . . . . . . . . . . . . . . . . . . . . . . . . . 2,728 8.7 673 6.9Maturing in 2018 . . . . . . . . . . . . . . . . . . . . . . . . . . . . . . . . . . . . . . . . . . . . . . . . . . . . . . . . . . . . . 4,385 14.0 1,254 12.9Maturing in 2019 . . . . . . . . . . . . . . . . . . . . . . . . . . . . . . . . . . . . . . . . . . . . . . . . . . . . . . . . . . . . . 2,142 6.8 609 6.3Maturing in 2020 . . . . . . . . . . . . . . . . . . . . . . . . . . . . . . . . . . . . . . . . . . . . . . . . . . . . . . . . . . . . . 3,393 10.8 1,050 10.8Maturing in 2021 . . . . . . . . . . . . . . . . . . . . . . . . . . . . . . . . . . . . . . . . . . . . . . . . . . . . . . . . . . . . . 2,554 8.2 971 10.0Maturing in 2022 . . . . . . . . . . . . . . . . . . . . . . . . . . . . . . . . . . . . . . . . . . . . . . . . . . . . . . . . . . . . . 1,916 6.1 983 10.1Maturing in 2023 . . . . . . . . . . . . . . . . . . . . . . . . . . . . . . . . . . . . . . . . . . . . . . . . . . . . . . . . . . . . . 2,411 7.7 682 7.0Maturing in 2024 . . . . . . . . . . . . . . . . . . . . . . . . . . . . . . . . . . . . . . . . . . . . . . . . . . . . . . . . . . . . . 661 2.1 334 3.4Maturing in 2025 and beyond . . . . . . . . . . . . . . . . . . . . . . . . . . . . . . . . . . . . . . . . . . . . . . . . . . . 4,859 15.5 1,415 14.6
Total commercial mortgage and other loans . . . . . . . . . . . . . . . . . . . . . . . . . . . . . . . . . . . . $31,297 100.0% $9,721 100.0%
Commercial Mortgage and Other Loan QualityOngoing review of the portfolio is performed and loans are placed on watch list status based on a predefined set of criteria, where they
are assigned to one of the following categories. We place loans on early warning status in cases where, based on our analysis of the loan’scollateral, the financial situation of the borrower or tenants or other market factors, we believe a loss of principal or interest could occur.We classify loans as closely monitored when we determine there is a collateral deficiency or other credit events that may lead to a potentialloss of principal or interest. Loans not in good standing are those loans where we have concluded that there is a high probability of loss ofprincipal, such as when the loan is in the process of foreclosure or the borrower is in bankruptcy. In our domestic operations, our workoutand special servicing professionals manage the loans on the watch list. As described below, in determining our allowance for losses weevaluate each loan on the watch list to determine if it is probable that amounts due according to the contractual terms of the loan agreementwill not be collected. In our international portfolios, we monitor delinquency in consumer loans on a pool basis and evaluate any servicingrelationship and guarantees the same way we do for commercial mortgage loans.
We establish an allowance for losses to provide for the risk of credit losses inherent in the lending process. The allowance includesloan specific reserves for loans that are determined to be impaired as a result of our loan review process, and a portfolio reserve forprobable incurred but not specifically identified losses for loans which are not on the watch list. We define an impaired loan as a loan forwhich we estimate it is probable that amounts due according to the contractual terms of the loan agreement will not be collected. The loanspecific portion of the loss allowance is based on our assessment as to ultimate collectability of loan principal and interest. Valuationallowances for an impaired loan are recorded based on the present value of expected future cash flows discounted at the loan’s effectiveinterest rate or based on the fair value of the collateral if the loan is collateral dependent. The portfolio reserve for incurred but notspecifically identified losses considers the current credit composition of the portfolio based on the internal quality ratings mentioned above.The portfolio reserves are determined using past loan experience, including historical credit migration, loss probability, and loss severityfactors by property type. These factors are reviewed and updated as appropriate. The valuation allowance for commercial mortgage andother loans can increase or decrease from period to period based on these factors.
Our general account investments in commercial mortgage and other loans attributable to the Financial Services Businesses, basedupon the recorded investment gross of allowance for credit losses, was $31,297 million and $26,809 million as of December 31, 2013 and2012, respectively. As a percentage of recorded investment gross of allowance, 99% of the assets were current for both periods.
Our general account investments in commercial mortgage and other loans attributable to the Closed Block Business, based upon therecorded investment gross of allowance for credit losses, was $9,721 million and $9,666 million as of December 31, 2013 and 2012,respectively. As a percentage of recorded investment gross of allowance, more than 99% of the assets were current for both periods.
The following table sets forth the change in valuation allowances for our commercial mortgage and other loan portfolio as of the datesindicated:
December 31, 2013 December 31, 2012
FinancialServices
Businesses
ClosedBlock
Business
FinancialServices
Businesses
ClosedBlock
Business
(in millions)Allowance, beginning of year . . . . . . . . . . . . . . . . . . . . . . . . . . . . . . . . . . . . . . . . . . . . . . . . . . . . . . . . . . . $186 $58 $250 $60
Addition to/(release of) allowance for losses . . . . . . . . . . . . . . . . . . . . . . . . . . . . . . . . . . . . . . . . . . . 10 (7) (11) (2)Charge-offs, net of recoveries . . . . . . . . . . . . . . . . . . . . . . . . . . . . . . . . . . . . . . . . . . . . . . . . . . . . . . . (27) (3) (51) 0Change in foreign exchange . . . . . . . . . . . . . . . . . . . . . . . . . . . . . . . . . . . . . . . . . . . . . . . . . . . . . . . . (5) 0 (2) 0
Allowance, end of period . . . . . . . . . . . . . . . . . . . . . . . . . . . . . . . . . . . . . . . . . . . . . . . . . . . . . . . . . . . . . . . $164 $48 $186 $58
Loan specific reserve . . . . . . . . . . . . . . . . . . . . . . . . . . . . . . . . . . . . . . . . . . . . . . . . . . . . . . . . . . . . . . $ 11 $ 3 $ 41 $ 7Portfolio reserve . . . . . . . . . . . . . . . . . . . . . . . . . . . . . . . . . . . . . . . . . . . . . . . . . . . . . . . . . . . . . . . . . . $153 $45 $145 $51
Prudential Financial, Inc. 2013 Annual Report 79

Equity Securities
Investment Mix
The equity securities attributable to the Financial Services Businesses consist principally of investments in common and preferredstock of publicly-traded companies, as well as mutual fund shares. The following table sets forth the composition of our equity securitiesportfolio attributable to the Financial Services Businesses and the associated gross unrealized gains and losses as of the dates indicated.
Equity Securities—Financial Services Businesses
December 31, 2013 December 31, 2012
Cost
GrossUnrealized
Gains
GrossUnrealized
LossesFair
Value Cost
GrossUnrealized
Gains
GrossUnrealized
LossesFair
Value
(in millions)Non-redeemable preferred stocks . . . . . . . . . . . . . . . . . . . . $ 32 $ 4 $ 1 $ 35 $ 15 $ 2 $ 0 $ 17Mutual fund common stocks(1) . . . . . . . . . . . . . . . . . . . . . 2,245 562 8 2,799 1,874 516 0 2,390Other common stocks . . . . . . . . . . . . . . . . . . . . . . . . . . . . . 2,277 920 12 3,185 2,392 274 42 2,624
Total equity securities(2) . . . . . . . . . . . . . . . . . . . . . . $4,554 $1,486 $21 $6,019 $4,281 $792 $42 $5,031
(1) Includes mutual fund shares representing our interest in the underlying assets of certain of our separate account investments supporting corporate-ownedlife insurance. These mutual funds invest primarily in high yield bonds.
(2) Amounts presented exclude hedge funds and other alternative investments which are reported in “Other long-term investments.”
The following table sets forth the composition of our equity securities portfolio attributable to the Closed Block Business and theassociated gross unrealized gains and losses as of the dates indicated.
Equity Securities—Closed Block Business
December 31, 2013 December 31, 2012
Cost
GrossUnrealized
Gains
GrossUnrealized
LossesFair
Value Cost
GrossUnrealized
Gains
GrossUnrealized
LossesFair
Value
(in millions)Non-redeemable preferred stocks . . . . . . . . . . . . . . . . . . . . $ 1 $ 1 $0 $ 2 $ 10 $ 2 $ 0 $ 12Mutual fund common stocks . . . . . . . . . . . . . . . . . . . . . . . 8 6 0 14 0 0 0 0Common stocks . . . . . . . . . . . . . . . . . . . . . . . . . . . . . . . . . 2,433 1,443 8 3,868 2,447 779 13 3,213
Total equity securities . . . . . . . . . . . . . . . . . . . . . . . . $2,442 $1,450 $8 $3,884 $2,457 $781 $13 $3,225
Other-Than-Temporary Impairments of Equity Securities
For those equity securities classified as available-for-sale, we record unrealized gains and losses to the extent cost is different fromestimated fair value. All securities with unrealized losses are subject to our review to identify other-than-temporary impairments in value.For additional information regarding our policies regarding other-than-temporary impairments for equity securities see Note 2 to theConsolidated Financial Statements.
Impairments of equity securities attributable to the Financial Services Businesses were $12 million and $104 million for the yearsended December 31, 2013 and 2012, respectively. Impairments of equity securities attributable to the Closed Block Business were$3 million and $21 million for years ended December 31, 2013 and 2012, respectively. For a further discussion of impairments,see “—Realized Investment Gains and Losses” above.
Other Long-Term InvestmentsThe following table sets forth the composition of “Other long-term investments,” which primarily consists of investments in joint
ventures and limited partnerships, other than operating joint ventures, as well as wholly-owned investment real estate and otherinvestments, as of the dates indicated.
December 31, 2013 December 31, 2012
FinancialServices
Businesses
ClosedBlock
Business
FinancialServices
Businesses
ClosedBlock
Business
(in millions)Joint ventures and limited partnerships:
Real estate-related . . . . . . . . . . . . . . . . . . . . . . . . . . . . . . . . . . . . . . . . . . . . . . . . . . . . . . . . . . . . . . . . $ 277 $ 481 $ 320 $ 504Non-real estate-related . . . . . . . . . . . . . . . . . . . . . . . . . . . . . . . . . . . . . . . . . . . . . . . . . . . . . . . . . . . . . 4,141 1,863 3,861 1,538
Real estate held through direct ownership(1) . . . . . . . . . . . . . . . . . . . . . . . . . . . . . . . . . . . . . . . . . . . . . . . 1,559 0 1,602 0Other(2) . . . . . . . . . . . . . . . . . . . . . . . . . . . . . . . . . . . . . . . . . . . . . . . . . . . . . . . . . . . . . . . . . . . . . . . . . . . . 1,195 (320) 882 (30)
Total other long-term investments . . . . . . . . . . . . . . . . . . . . . . . . . . . . . . . . . . . . . . . . . . . . . . . . . . . . $7,172 $2,024 $6,665 $2,012
(1) Primarily includes investments in office buildings within our Japanese insurance operations.(2) Primarily includes derivatives and member and activity stock held in the Federal Home Loan Banks of New York and Boston. For additional
information regarding our holdings in the Federal Home Loan Banks of New York and Boston, see Note 14 to the Consolidated Financial Statements.
80 Prudential Financial, Inc. 2013 Annual Report

Invested Assets of Other Entities and Operations“Invested Assets of Other Entities and Operations” includes investments held outside the general account and primarily represents
investments associated with our asset management and derivative operations. Our derivative operation acts on behalf of affiliates primarilyto manage interest rate, foreign currency, credit, and equity exposures. Assets within our asset management operations managed for thirdparties and those assets classified as “Separate account assets” on our balance sheet are not included.
The following table sets forth the composition of investments held outside the general account, based on the parameters describedabove, as of the dates indicated.
December 31,
2013 2012
(in millions)Fixed maturities:
Public, available-for-sale, at fair value . . . . . . . . . . . . . . . . . . . . . . . . . . . . . . . . . . . . . . . . . . . . . . . . . . . . . . . . . . . . . . . . . . . . . . . . . . . $ 242 $ 272Private, available-for-sale, at fair value . . . . . . . . . . . . . . . . . . . . . . . . . . . . . . . . . . . . . . . . . . . . . . . . . . . . . . . . . . . . . . . . . . . . . . . . . . 73 93
Other trading account assets, at fair value(1) . . . . . . . . . . . . . . . . . . . . . . . . . . . . . . . . . . . . . . . . . . . . . . . . . . . . . . . . . . . . . . . . . . . . . . . . . . 4,770 4,627Equity securities, available-for-sale, at fair value . . . . . . . . . . . . . . . . . . . . . . . . . . . . . . . . . . . . . . . . . . . . . . . . . . . . . . . . . . . . . . . . . . . . . . . 7 21Commercial mortgage and other loans, at book value(2) . . . . . . . . . . . . . . . . . . . . . . . . . . . . . . . . . . . . . . . . . . . . . . . . . . . . . . . . . . . . . . . . . 202 502Other long-term investments . . . . . . . . . . . . . . . . . . . . . . . . . . . . . . . . . . . . . . . . . . . . . . . . . . . . . . . . . . . . . . . . . . . . . . . . . . . . . . . . . . . . . . . 1,132 1,351Short-term investments . . . . . . . . . . . . . . . . . . . . . . . . . . . . . . . . . . . . . . . . . . . . . . . . . . . . . . . . . . . . . . . . . . . . . . . . . . . . . . . . . . . . . . . . . . . 392 62
Total investments . . . . . . . . . . . . . . . . . . . . . . . . . . . . . . . . . . . . . . . . . . . . . . . . . . . . . . . . . . . . . . . . . . . . . . . . . . . . . . . . . . . . . . . $6,818 $6,928
(1) Primarily related to assets associated with consolidated variable interest entities for which the Company is the investment manager as well as ourderivative operation used to manage interest rate, foreign currency, credit and equity exposures. For further information on these consolidated variableinterest entities, see Note 5 to the Consolidated Financial Statements.
(2) Book value is generally based on unpaid principal balance net of any allowance for losses, the lower of cost or fair value, or fair value, depending on the loan.
Commercial Mortgage and Other LoansOur asset management operations include our commercial mortgage operations, which provide mortgage origination, asset
management and servicing for our general account, institutional clients, and government sponsored entities such as Fannie Mae, the FederalHousing Administration, and Freddie Mac.
We also carry shorter-term interim loans for spread lending that are collateralized by assets generally under renovation or lease up. Allelse being equal, these interim loans are inherently more risky than those collateralized by properties that have already stabilized. Ourinterim loans are generally paid off through refinancing or the sale of the underlying collateral by the borrower.
The following table sets forth information regarding the interim loan portfolio held outside the general account in other entities andoperations as of the dates indicated.
December 31,
2013 2012
($ in millions)Interim Loan Portfolio:
Principal balance of loans outstanding . . . . . . . . . . . . . . . . . . . . . . . . . . . . . . . . . . . . . . . . . . . . . . . . . . . . . . . . . . . . . . . . . . . . . . . . . . . . . $ 23 $ 239Allowance for credit or valuation-related losses . . . . . . . . . . . . . . . . . . . . . . . . . . . . . . . . . . . . . . . . . . . . . . . . . . . . . . . . . . . . . . . . . . . . . $ 2 $ 14Weighted average loan-to-value ratio(1) . . . . . . . . . . . . . . . . . . . . . . . . . . . . . . . . . . . . . . . . . . . . . . . . . . . . . . . . . . . . . . . . . . . . . . . . . . . 95% 91%Weighted average debt service coverage ratio(1) . . . . . . . . . . . . . . . . . . . . . . . . . . . . . . . . . . . . . . . . . . . . . . . . . . . . . . . . . . . . . . . . . . . . 1.12 1.25
(1) A stabilized value and projected net operating income are used in the calculation of the loan-to-value and debt service coverage ratios.
As of December 31, 2013, we hold no commercial real estate held-for-sale related to foreclosed interim loans. The mortgage loans ofour commercial mortgage operations are included in “Commercial mortgage and other loans,” with related derivatives and other hedginginstruments primarily included in “Other trading account assets” and “Other long-term investments.”
Other Long-Term InvestmentsOther long-term investments primarily include strategic investments made as part of our asset management operations. We make these
strategic investments in real estate, as well as fixed income, public equity and real estate securities, including controlling interests. Certainof these investments are made primarily for purposes of co-investment in our managed funds and structured products. Other strategicinvestments are made with the intention to sell or syndicate to investors, including our general account, or for placement in funds andstructured products that we offer and manage (seed investments). As part of our asset management operations, we also make loans to ourmanaged funds that are secured by equity commitments from investors or assets of the funds. Other long-term investments also includecertain assets in consolidated investment funds where the company is deemed to exercise control over these funds.
Liquidity and Capital Resources
OverviewLiquidity refers to the ability to generate sufficient cash resources to meet the payment obligations of the Company. Capital refers to the
long term financial resources available to support the operations of our businesses, fund business growth, and provide a cushion to withstandadverse circumstances. Our ability to generate and maintain sufficient liquidity and capital depends on the profitability of our businesses,general economic conditions and our access to the capital markets and the alternate sources of liquidity and capital described herein.
Effective and prudent liquidity and capital management is a priority across the organization. Management monitors the liquidity ofPrudential Financial and its subsidiaries on a daily basis and projects borrowing and capital needs over a multi-year time horizon through ourquarterly planning process. We believe that cash flows from the sources of funds available to us are sufficient to satisfy the current liquidity
Prudential Financial, Inc. 2013 Annual Report 81

requirements of Prudential Financial and its subsidiaries, including under reasonably foreseeable stress scenarios. We have a capitalmanagement framework in place that governs the allocation of capital and approval of capital uses, and we forecast capital sources and useson a quarterly basis. We also employ a “Capital Protection Framework” to ensure the availability of capital resources to maintain adequatecapitalization on a consolidated basis and competitive risk-based capital ratios and solvency margins for our insurance subsidiaries undervarious stress scenarios.
On September 19, 2013, the Financial Stability Oversight Council made a final determination that Prudential Financial is a“Designated Financial Company” under the Dodd-Frank Act. As a Designated Financial Company, Prudential Financial is now subject tosupervision and examination by the Federal Reserve Bank of Boston and to stricter prudential regulatory standards, which include or willinclude requirements and limitations (some of which are the subject of ongoing rule-making) relating to risk-based capital, leverage,liquidity, stress-testing, overall risk management, resolution plans, early remediation; and may also include additional standards regardingcapital, public disclosure, short-term debt limits, and other related subjects. In addition, on July 18, 2013, the Financial Stability Board,consisting of representatives of national financial authorities of the G20 nations, identified the Company as a global systemically importantinsurer. See “—Executive Summary—Regulatory Developments” above, as well as “Business—Regulation” and “Risk Factors” includedin Prudential Financial’s 2013 Annual Report on Form 10-K for information on these recent actions and their impact.
During 2013, we took the following significant actions that impacted our liquidity and capital position:• We repositioned Prudential Financial’s capital structure through a $1.1 billion net reduction in senior notes outstanding and a $0.3
billion net increase in junior subordinated notes outstanding;• We repurchased $750 million of shares of our Common Stock and declared aggregate Common Stock dividends of $810 million;• We made an investment in our Individual Life business through our acquisition of the Hartford Life Business;• We augmented our alternative sources of liquidity by entering into a put option agreement giving Prudential Financial the right to
issue up to $1.5 billion of senior notes due November 2023 to a trust entity at any time over a ten-year period in return for principaland interest strips of U.S. Treasury securities;
• We obtained an additional $2.5 billion of capacity for the financing of non-economic reserves required to be held by our domesticinsurance subsidiaries under Regulation XXX and Guideline AXXX; and
• We extended the expiration dates of our three-year and five-year syndicated credit facilities to November 2016 and November2018, respectively.
CapitalOur capital management framework is primarily based on statutory risk-based capital and solvency margin measures. Due to our
diverse mix of businesses and applicable regulatory requirements, we apply certain refinements to the framework that are designed to moreappropriately reflect risks associated with our businesses on a consistent basis across the Company.
We seek to capitalize all of our subsidiaries and businesses in accordance with their ratings targets, and we believe PrudentialFinancial’s capitalization and use of financial leverage are consistent with those ratings targets. Our long-term senior debt rating targets forPrudential Financial are “A” for Standard & Poor’s Rating Services, or S&P, Moody’s Investors Service, Inc., or Moody’s, and FitchRatings Ltd., or Fitch, and “a” for A.M. Best Company, or A.M. Best. Our financial strength rating targets for our life insurance companiesare “AA/Aa/AA” for S&P, Moody’s and Fitch, respectively, and “A+” for A.M. Best. Currently, some of our ratings are below thesetargets. For a description of the potential impacts of ratings downgrades, see “—Ratings.”
Capital GovernanceOur capital management framework is ultimately reviewed and approved by our Board of Directors. The Board has adopted a capital
management policy that authorizes our Chairman and Chief Executive Officer and Vice Chairman to approve certain capital actions onbehalf of the Company and to further delegate authority with respect to capital actions to appropriate officers. Any capital commitment thatexceeds the authority granted to senior management under the capital management policy is separately authorized by the Board.
In addition, our Capital and Finance Committee (“CFC”) reviews the use and allocation of capital above certain threshold amounts topromote the efficient use of capital, consistent with our strategic objectives, ratings aspirations and other goals and targets. This managementcommittee provides a multi-disciplinary due diligence review of specific initiatives or transactions requiring the use of capital, including allmergers and acquisitions. The CFC also evaluates our annual capital and financing plan (and quarterly updates to this plan), as well as our capital,liquidity and financial position, borrowing plans, and related matters prior to the discussion of these items with the Board of Directors.
CapitalizationThe primary components of capitalization for the Financial Services Businesses consist of the equity we attribute to the Financial
Services Businesses and outstanding capital debt, including junior subordinated debt, of the Financial Services Businesses. As shown in thetable below, as of December 31, 2013, the Financial Services Businesses had $35.5 billion in capital, all of which was available to supportthe aggregate capital requirements of its three divisions and its Corporate and Other operations. Based on our assessment of thesebusinesses and operations, we believe this level of capital is consistent with our ratings targets.
December 31,
2013 2012
(in millions)Attributed Equity(1) . . . . . . . . . . . . . . . . . . . . . . . . . . . . . . . . . . . . . . . . . . . . . . . . . . . . . . . . . . . . . . . . . . . . . . . . . . . . . . . . . . . . . . . . . . . $25,299 $27,016Junior subordinated debt (i.e. hybrid securities) . . . . . . . . . . . . . . . . . . . . . . . . . . . . . . . . . . . . . . . . . . . . . . . . . . . . . . . . . . . . . . . . . . . . . . 4,884 4,594Other capital debt . . . . . . . . . . . . . . . . . . . . . . . . . . . . . . . . . . . . . . . . . . . . . . . . . . . . . . . . . . . . . . . . . . . . . . . . . . . . . . . . . . . . . . . . . . . . . 5,345 6,049
Total capital . . . . . . . . . . . . . . . . . . . . . . . . . . . . . . . . . . . . . . . . . . . . . . . . . . . . . . . . . . . . . . . . . . . . . . . . . . . . . . . . . . . . . . . . . . . . . $35,528 $37,659
(1) Excludes AOCI. This amount may be subject to volatility due to, among other things, the impact of foreign currency exchange rate movements on certainnon-yen denominated assets and liabilities within our Japanese insurance operations, for which the foreign currency exposure is economically matched andoffset in AOCI (see “—Results of Operations for Financial Services Businesses by Segment—International Insurance Division—Impact of foreign currencyexchange rate movements on earnings—U.S. GAAP earnings impact of products denominated in non-local currencies” for additional information).
82 Prudential Financial, Inc. 2013 Annual Report

Insurance Regulatory CapitalWe manage Prudential Insurance, Prudential of Japan, Gibraltar Life and our other domestic and international insurance subsidiaries
to regulatory capital levels consistent with our “AA” ratings targets.
The Risk-Based Capital, or RBC, ratio is a primary measure of the capital adequacy of Prudential Insurance, which includesbusinesses in both the Financial Services Businesses and the Closed Block Business, and our other domestic insurance subsidiaries. RBC iscalculated based on statutory financial statements and risk formulas consistent with the practices of the National Association of InsuranceCommissioners, or NAIC. RBC considers, among other things, risks related to the type and quality of the invested assets, insurance-relatedrisks associated with an insurer’s products and liabilities, interest rate risks and general business risks. RBC ratio calculations are intendedto assist insurance regulators in measuring an insurer’s solvency and ability to pay future claims. The reporting of RBC measures is notintended for the purpose of ranking any insurance company or for use in connection with any marketing, advertising or promotionalactivities but is available to the public.
Effective for the year ended December 31, 2013, the NAIC has adopted a change to the methodology for calculating RBC risk chargesassociated with commercial and agricultural mortgage loans. Prior to the adoption of this methodology change, the risk charges were calculatedbased on an insurance company’s portfolio level experience as compared to an industry average. The newly adopted change considers eachloan’s risk in the calculation of these risk charges. This methodology applies to each of Prudential Financial’s U.S. insurance subsidiaries.
The RBC ratios for Prudential Insurance and Prudential Annuities Life Assurance Corporation were 456% and 421%, respectively, asof December 31, 2012. As of December 31, 2013, the ratios for both of these subsidiaries were greater than 400%, including the impact ofthe aforementioned change in methodology for calculating RBC risk charges associated with commercial and agricultural mortgage loans.
Similar to the RBC ratios that are employed by U.S. insurance regulators, regulatory authorities in the international jurisdictions in whichwe operate generally establish some form of minimum solvency margin requirements for insurance companies based on local statutoryaccounting practices. These solvency margins are a primary measure of the capital adequacy of our international insurance operations.Maintenance of our solvency margins at certain levels is also important to our competitive positioning, as in certain jurisdictions, such as Japan,these solvency margins are required to be disclosed to the public and therefore impact the public perception of an insurer’s financial strength.
The solvency margins for Prudential of Japan and Gibraltar Life were 749% and 896%, respectively, as of March 31, 2013, the mostrecent statutory fiscal year-end. As of December 31, 2013, the solvency margins for both of these subsidiaries were greater than 700%.
All of our domestic and international insurance subsidiaries have capital levels that substantially exceed the minimum level requiredby applicable insurance regulations.
The regulatory capital levels of our domestic and international insurance subsidiaries can be materially impacted by interest rates,equity market and real estate market fluctuations, changes in the values of derivatives, the level of impairments recorded, credit qualitymigration of our investment portfolio, foreign exchange rate movements and business growth, among other items. In addition, particularlyfor our domestic insurance subsidiaries, the recapture of business subject to third-party reinsurance arrangements due to, for example,defaults by, or credit quality migration affecting, the third-party reinsurers could negatively impact regulatory capital.
Our regulatory capital levels are also affected by statutory accounting rules, which are subject to change by each applicable insuranceregulator. As discussed above in “—Executive Summary—Regulatory Developments,” the NY DFS has notified us that it does not agreewith our calculation of statutory reserves (including the applicable credit for reinsurance) for New York purposes in respect of certainvariable annuity products, and if we are ultimately required to establish material additional reserves on a New York statutory accountingbasis or post material amounts of additional collateral with respect to such variable annuity or other products, our ability to deploy capitalheld within our U.S. domestic insurance subsidiaries for other purposes could be affected.
We evaluate the regulatory capital of our domestic and international insurance operations under reasonably foreseeable stressscenarios and believe we have adequate resources to maintain our capital levels comfortably above regulatory requirements under thesescenarios. For further information on the calculation of RBC and solvency margin ratios, as well as regulatory minimums, see Note 15 tothe Consolidated Financial Statements.
Capital Protection FrameworkWe employ a “Capital Protection Framework” to ensure that sufficient capital resources are available to maintain adequate
capitalization on a consolidated basis and competitive RBC ratios and solvency margins for our insurance subsidiaries under various stressscenarios. The Capital Protection Framework incorporates the potential impacts from market related stresses, including equity markets, realestate, interest rates, credit losses, and foreign currency exchange rates. Potential sources of capital include on-balance sheet capital,derivatives, reinsurance and contingent sources of capital. Although we continue to enhance our approach, we believe we currently haveaccess to sufficient resources to maintain adequate capitalization and competitive RBC ratios and solvency margins under a range ofpotential stress scenarios. See “Business—Corporate and Other” included in Prudential Financial’s 2013 Annual Report on Form 10-K forfurther information on our Capital Protection Framework.
Captive Reinsurance CompaniesWe use captive reinsurance companies in our domestic insurance operations to more effectively manage our reserves and capital on an
economic basis and to enable the aggregation and transfer of risks. Our captive reinsurance companies assume business from affiliatesonly. To support the risks they assume, our captives are capitalized to a level we believe is consistent with the “AA” financial strengthrating targets of our insurance subsidiaries. All of our captive reinsurance companies are wholly-owned subsidiaries and are locateddomestically, typically in the state of domicile of the direct writing insurance subsidiary that cedes the majority of business to the captive.In addition to state insurance regulation, our captives are subject to internal policies governing their activities. Prudential Financial providessupport to these captives, typically through net worth maintenance agreements, and in the normal course of business will contribute capitalto the captives to support business growth and other needs. In addition, in connection with financing arrangements, Prudential Financialmay guarantee certain of the captives’ obligations.
Prudential Financial, Inc. 2013 Annual Report 83

Recently, the NAIC, the New York State Department of Financial Services and other regulators have increased their focus on lifeinsurers’ use of captive reinsurance companies. We cannot predict what, if any, changes may result from these reviews. If insurance lawsare changed in a way that restricts our use of captive reinsurance companies in the future, our ability to write certain products andefficiently manage their associated risks could be adversely affected and we may need to increase prices on certain products, modify certainproducts or find alternate financing sources, any of which could adversely affect our competitiveness, capital and financial position andresults of operations. Given the uncertainty of the ultimate outcome of these reviews, at this time we are unable to estimate their expectedeffects on our future capital and financial position and results of operations.
Our domestic life insurance subsidiaries are subject to a regulation entitled “Valuation of Life Insurance Policies Model Regulation,”commonly known as “Regulation XXX,” and a supporting guideline entitled “The Application of the Valuation of Life Insurance PoliciesModel Regulation,” commonly known as “Guideline AXXX.” The regulation and supporting guideline require insurers to establish statutoryreserves for term and universal life insurance policies with long-term premium guarantees that are consistent with the statutory reservesrequired for other individual life insurance policies with similar guarantees. Many market participants believe that these levels of reserves arenon-economic. We use captive reinsurance companies to implement reinsurance and capital management actions to satisfy these reserverequirements by financing the non-economic reserves through the issuance of surplus notes by the captives, which are treated as capital forstatutory purposes. See “—Financing Activities—Subsidiary borrowings—Financing of regulatory reserves associated with domestic lifeinsurance products” below for additional information on our financing activities related to Regulation XXX and Guideline AXXX.
We reinsure living benefit guarantees on certain variable annuity and retirement products from our domestic life insurance companiesto a captive reinsurance company, Pruco Reinsurance, Ltd., or Pruco Re. This enables us to aggregate these risks within Pruco Re andmanage them more efficiently through a hedging program. We believe Pruco Re currently maintains an adequate level of capital and accessto liquidity to support this hedging program. However, as discussed below under “Liquidity associated with other activities—Hedgingactivities associated with living benefit guarantees,” Pruco Re’s capital and liquidity needs can vary significantly due to, among otherthings, changes in equity markets, interest rates, mortality and policyholder behavior. Through our Capital Protection Framework, we holdon-balance sheet capital and maintain access to committed sources of capital that are available to meet these needs as they arise.
We reinsure 90% of the short-term risks of Prudential Insurance’s Closed Block Business to a captive reinsurance company domiciledin New Jersey. These short-term risks represent the impact of variations in experience of the Closed Block that are expected to berecovered over time as a result of corresponding adjustments to policyholder dividends. The reinsurance arrangement is intended toalleviate the short-term statutory surplus volatility within Prudential Insurance resulting from the Closed Block Business, includingvolatility caused by the impact of any unrealized mark-to-market losses and realized credit losses within its investment portfolio. Tosupport the captive’s funding obligations under the reinsurance arrangement, we maintain a $2.0 billion letter of credit facility withunaffiliated financial institutions through which the captive can obtain a letter of credit during an availability period expiring in October2015. Prudential Financial guarantees all obligations of the New Jersey captive under the facility, including its obligation to reimburse anydraws made under the letter of credit. Because experience of the Closed Block is ultimately passed along to policyholders over timethrough the annual policyholder dividend, we believe that a draw under the letter of credit is unlikely. Our ability to obtain a letter of creditunder the facility is subject to the continued satisfaction of customary conditions similar to those described under “Credit Facilities” below.
Shareholder Distributions
Share Repurchase Program and Shareholder DividendsIn June 2013, our Board of Directors authorized the Company to repurchase at management’s discretion up to $1.0 billion of its outstanding
Common Stock during the period from July 1, 2013 through June 30, 2014. This authorization supersedes the Board’s previous $1.0 billionrepurchase authority that covered the prior twelve-month period. A total of 6.6 million shares of our Common Stock were repurchased under theprior authorization for a total cost of $400 million. The timing and amount of any future share repurchases will be determined by managementbased on market conditions and other considerations, including increased capital needs of our businesses due to changes in regulatory capitalrequirements and opportunities for growth and acquisitions. Repurchases may be effected in the open market, through derivative, acceleratedrepurchase and other negotiated transactions and through plans designed to comply with Rule 10b5-1(c) under the Exchange Act.
In the first quarter of 2013, Prudential Financial moved to a quarterly Common Stock dividend schedule. Previously, Common Stockdividends were paid on an annual basis. The following table sets forth information about repurchases of shares of Prudential Financial’sCommon Stock, as well as declarations of Common Stock dividends, for each of the quarterly periods in 2013 and for the prior four years:
Dividend Amount Shares Repurchased
Quarterly period ended: Per Share Aggregate Shares Total Cost
(in millions, except per share data)December 31, 2013 . . . . . . . . . . . . . . . . . . . . . . . . . . . . . . . . . . . . . . . . . . . . . . . . . . . . . . . . . . . . . . . . . . . . $0.53 $247 2.9 $ 250September 30, 2013 . . . . . . . . . . . . . . . . . . . . . . . . . . . . . . . . . . . . . . . . . . . . . . . . . . . . . . . . . . . . . . . . . . . $0.40 $187 3.2 $ 250June 30, 2013 . . . . . . . . . . . . . . . . . . . . . . . . . . . . . . . . . . . . . . . . . . . . . . . . . . . . . . . . . . . . . . . . . . . . . . . . $0.40 $188 3.9 $ 250March 31, 2013 . . . . . . . . . . . . . . . . . . . . . . . . . . . . . . . . . . . . . . . . . . . . . . . . . . . . . . . . . . . . . . . . . . . . . . . $0.40 $188 — $ —
Dividend Amount Shares Repurchased
Year ended: Per Share Aggregate Shares Total Cost
(in millions, except per share data)December 31, 2012 . . . . . . . . . . . . . . . . . . . . . . . . . . . . . . . . . . . . . . . . . . . . . . . . . . . . . . . . . . . . . . . . . . . . $1.60 $749 11.5 $ 650December 31, 2011 . . . . . . . . . . . . . . . . . . . . . . . . . . . . . . . . . . . . . . . . . . . . . . . . . . . . . . . . . . . . . . . . . . . . $1.45 $689 19.8 $1,000December 31, 2010 . . . . . . . . . . . . . . . . . . . . . . . . . . . . . . . . . . . . . . . . . . . . . . . . . . . . . . . . . . . . . . . . . . . . $1.15 $564 — $ —December 31, 2009 . . . . . . . . . . . . . . . . . . . . . . . . . . . . . . . . . . . . . . . . . . . . . . . . . . . . . . . . . . . . . . . . . . . . $0.70 $327 — $ —
In addition, on February 11, 2014, Prudential Financial’s Board of Directors declared a cash dividend of $0.53 per share of CommonStock, payable on March 20, 2014. As a Designated Financial Company under Dodd-Frank, Prudential Financial expects to be subject tominimum risk-based capital and leverage requirements and to the submission of annual capital plans to the FRB. Prudential Financial’scompliance with these and other requirements under Dodd-Frank could limit its ability to pay Common Stock dividends and repurchaseshares in the future.
84 Prudential Financial, Inc. 2013 Annual Report

LiquidityLiquidity management and stress testing are performed on a legal entity basis as the ability to transfer funds between subsidiaries is
limited due in part to regulatory restrictions. Liquidity needs are determined through daily and quarterly cash flow forecasting at the holdingcompany and within our operating subsidiaries. A minimum cash balance of $1.3 billion is targeted to ensure that adequate liquidity isavailable at Prudential Financial to cover fixed expenses in the event that we experience reduced cash flows from our operating subsidiaries.This targeted minimum balance is reviewed and approved annually by the Finance Committee of the Board of Directors.
To mitigate the risk of having limited or no access to financing due to stressed market conditions, we generally prefund capital debt inadvance of maturity. We mitigate the refinancing risk associated with our debt that is used to fund operating needs by matching the term ofdebt with the assets financed. To ensure adequate liquidity in stress scenarios, stress testing is performed on a quarterly basis for our majoroperating subsidiaries. Liquidity risk is further mitigated by our access to the alternative sources of liquidity discussed below.
Liquidity of Prudential FinancialThe principal sources of funds available to Prudential Financial, the parent holding company, are dividends and returns of capital from
subsidiaries, repayments of operating loans from subsidiaries and cash and short-term investments. These sources of funds may besupplemented by Prudential Financial’s access to the capital markets as well as the “—Alternative Sources of Liquidity” described below.
The primary uses of funds at Prudential Financial include servicing debt, paying operating expenses, making capital contributions andloans to subsidiaries, paying declared shareholder dividends and repurchasing outstanding shares of Common Stock executed under Boardauthority.
As of December 31, 2013, Prudential Financial had cash and short-term investments of $5,555 million, a decrease of $3,008 millionfrom 2012. We maintain an intercompany liquidity account that is designed to optimize the use of cash by facilitating the lending andborrowing of funds between Prudential Financial and its subsidiaries on a daily basis. Excluding net borrowings from this intercompanyliquidity account, Prudential Financial had cash and short-term investments of $4,354 million as of December 31, 2013, a decrease of$1,073 million from December 31, 2012.
The following table sets forth Prudential Financial’s principal sources and uses of cash and short-term investments, excluding netborrowings from our intercompany liquidity account, for the periods indicated.
Year Ended December 31,
2013 2012
(in millions)Sources:
Dividends and/or returns of capital from subsidiaries(1) . . . . . . . . . . . . . . . . . . . . . . . . . . . . . . . . . . . . . . . . . . . . . . . . . . . . $ 3,007 $2,862Proceeds from the issuance of junior subordinated debt (hybrid securities) . . . . . . . . . . . . . . . . . . . . . . . . . . . . . . . . . . . . . . 1,210 3,075Proceeds from the issuance of long-term senior debt . . . . . . . . . . . . . . . . . . . . . . . . . . . . . . . . . . . . . . . . . . . . . . . . . . . . . . . 1,050 0Proceeds from stock-based compensation and exercise of stock options . . . . . . . . . . . . . . . . . . . . . . . . . . . . . . . . . . . . . . . . 538 308Net receipts under intercompany loan agreements(2)(3) . . . . . . . . . . . . . . . . . . . . . . . . . . . . . . . . . . . . . . . . . . . . . . . . . . . . 421 1,205Interest income from subsidiaries on intercompany agreements, net of interest paid . . . . . . . . . . . . . . . . . . . . . . . . . . . . . . 369 406Proceeds from short-term debt, net of repayments . . . . . . . . . . . . . . . . . . . . . . . . . . . . . . . . . . . . . . . . . . . . . . . . . . . . . . . . . 78 0Repayment of funding agreements from Prudential Insurance . . . . . . . . . . . . . . . . . . . . . . . . . . . . . . . . . . . . . . . . . . . . . . . . 0 525Net proceeds from external financing agreement(4) . . . . . . . . . . . . . . . . . . . . . . . . . . . . . . . . . . . . . . . . . . . . . . . . . . . . . . . . 0 244Other, net(5) . . . . . . . . . . . . . . . . . . . . . . . . . . . . . . . . . . . . . . . . . . . . . . . . . . . . . . . . . . . . . . . . . . . . . . . . . . . . . . . . . . . . . . 0 197
Total sources . . . . . . . . . . . . . . . . . . . . . . . . . . . . . . . . . . . . . . . . . . . . . . . . . . . . . . . . . . . . . . . . . . . . . . . . . . . . . . . . . . 6,673 8,822
Uses:Capital contributions to subsidiaries(6) . . . . . . . . . . . . . . . . . . . . . . . . . . . . . . . . . . . . . . . . . . . . . . . . . . . . . . . . . . . . . . . . . 1,760 1,912Maturities of long-term senior debt, excluding retail medium-term notes . . . . . . . . . . . . . . . . . . . . . . . . . . . . . . . . . . . . . . . 1,581 850Interest paid on external debt . . . . . . . . . . . . . . . . . . . . . . . . . . . . . . . . . . . . . . . . . . . . . . . . . . . . . . . . . . . . . . . . . . . . . . . . . 1,028 1,010Repayments of junior subordinated debt (hybrid securities) . . . . . . . . . . . . . . . . . . . . . . . . . . . . . . . . . . . . . . . . . . . . . . . . . 920 0Common Stock dividends(7) . . . . . . . . . . . . . . . . . . . . . . . . . . . . . . . . . . . . . . . . . . . . . . . . . . . . . . . . . . . . . . . . . . . . . . . . . 828 749Share repurchases(8) . . . . . . . . . . . . . . . . . . . . . . . . . . . . . . . . . . . . . . . . . . . . . . . . . . . . . . . . . . . . . . . . . . . . . . . . . . . . . . . . 738 650Repayment of retail medium-term notes . . . . . . . . . . . . . . . . . . . . . . . . . . . . . . . . . . . . . . . . . . . . . . . . . . . . . . . . . . . . . . . . . 615 1,741Net income tax payments . . . . . . . . . . . . . . . . . . . . . . . . . . . . . . . . . . . . . . . . . . . . . . . . . . . . . . . . . . . . . . . . . . . . . . . . . . . . 246 0Class B Stock dividends . . . . . . . . . . . . . . . . . . . . . . . . . . . . . . . . . . . . . . . . . . . . . . . . . . . . . . . . . . . . . . . . . . . . . . . . . . . . . 19 19Other, net . . . . . . . . . . . . . . . . . . . . . . . . . . . . . . . . . . . . . . . . . . . . . . . . . . . . . . . . . . . . . . . . . . . . . . . . . . . . . . . . . . . . . . . . . 11 0
Total uses . . . . . . . . . . . . . . . . . . . . . . . . . . . . . . . . . . . . . . . . . . . . . . . . . . . . . . . . . . . . . . . . . . . . . . . . . . . . . . . . . . . . 7,746 6,931
Net increase (decrease) in cash and short-term investments . . . . . . . . . . . . . . . . . . . . . . . . . . . . . . . . . . . . . . . . . . . . . . . . . . . . . . $(1,073) $1,891
(1) 2013 includes dividends and/or returns of capital of $1,642 million from international subsidiaries, $441 million from asset management subsidiaries,$338 million from an investment subsidiary, $391 million from Prudential Annuities Holding Company, of which $284 million was from PrudentialAnnuities Life Assurance Corporation, and $195 million from other subsidiaries. 2012 includes dividends and/or returns of capital of $865 million frominternational subsidiaries, $646 million from asset management subsidiaries, $600 million from Prudential Insurance, $408 million from PrudentialAnnuities Life Assurance Corporation, $230 million from Prudential Bank & Trust and $113 million from other subsidiaries.
(2) 2013 includes net repayments of $282 million by Pruco Life Insurance Company, $200 million by Prudential Annuities Life Assurance Corporation and$176 million by asset management subsidiaries, net proceeds of $351 million from the issuance of notes to Gibraltar Life and $108 million from theissuance of notes to Prudential of Japan, and net repayments of $47 million from other subsidiaries, offset by net borrowings of $743 million byPrucoRe. 2012 includes net proceeds of $395 million from the issuance of notes to Prudential of Japan, partially offset by a repayment of $20 million toPrudential Holdings, LLC. 2012 also includes net repayments of $558 million by asset management subsidiaries, $200 million by Prudential AnnuitiesLife Assurance Corporation, $188 million by Pruco Re and $42 million by other subsidiaries, partially offset by net borrowings of $164 million byPruco Life Insurance Company.
(3) Amounts for 2012 have been reclassified to conform to current period presentation, which excludes amounts related to our intercompany liquidity account.(4) Represents repayments in 2012 associated with transitional financing agreements provided in connection with the sale of the real estate brokerage
franchise and relocation business in 2011.
Prudential Financial, Inc. 2013 Annual Report 85

(5) 2012 primarily includes tax settlements pursuant to the tax allocation agreement between Prudential Financial and its subsidiaries, net of estimated taxpayments to the Internal Revenue Service.
(6) 2013 includes capital contributions of $712 million to Prudential Insurance, of which $615 million was paid to The Hartford in connection with ouracquisition of its life insurance business, $618 million to international subsidiaries, $309 million to Pruco Re, $25 million to asset managementsubsidiaries and $96 million to other subsidiaries. 2012 includes capital contributions of $1,431 million to Pruco Re, $406 million to internationalinsurance subsidiaries, $31 million to asset management subsidiaries and $44 million to other subsidiaries.
(7) 2013 includes cash payments made on dividends declared in prior periods.(8) 2013 excludes $12 million related to trades that settled in January 2014.
Restrictions on Dividends and Returns of Capital from SubsidiariesOur insurance companies are subject to limitations on the payment of dividends and other transfers of funds to Prudential Financial
and other affiliates under applicable insurance law and regulation. Also, more generally, the payment of dividends by any of oursubsidiaries is subject to declaration by their Board of Directors and can be affected by market conditions and other factors. See Note 15 tothe Consolidated Financial Statements for details on specific dividend restrictions.
Domestic insurance subsidiaries. Prudential Insurance is permitted to pay ordinary dividends based on calculations specified underNew Jersey insurance law, subject to prior notification to the New Jersey Department of Banking and Insurance, or NJDOBI. Anydistributions above this amount in any 12-month period are considered to be “extraordinary” dividends, and the approval of NJDOBI isrequired prior to payment. In May 2013, Prudential Insurance paid an ordinary dividend of $232 million to its parent, Prudential Holdings,LLC, which amount remained at Prudential Holdings. In June 2013, Prudential Insurance paid an ordinary dividend in the form of realproperty, with a value of $42 million, which was ultimately contributed to a subsidiary of Prudential Financial related to the development of anew office building located in Newark, New Jersey.
The laws regulating dividends of the states where our other domestic insurance companies are domiciled are similar, but not identical,to New Jersey’s. In 2013, Prudential Annuities Life Assurance Corporation paid extraordinary dividends of $284 million to PrudentialFinancial. In 2013, Prudential Retirement Insurance and Annuity Company paid an ordinary dividend of $226 million and an extraordinarydividend of $89 million to its parent, Prudential Insurance. In 2013, Pruco Life Insurance Company paid ordinary dividends of$423 million to its parent, Prudential Insurance.
International insurance subsidiaries. Our international insurance subsidiaries are subject to dividend restrictions from the regulatoryauthorities in the international jurisdictions in which they operate. Our most significant international insurance subsidiaries, Prudential ofJapan and Gibraltar Life, are permitted to pay common stock dividends based on calculations specified by Japanese insurance law, subjectto prior notification to the Financial Services Agency, or FSA. Dividends in excess of these amounts and other forms of capital distributionrequire the prior approval of the FSA. The current regulatory fiscal year end for both Prudential of Japan and Gibraltar Life is March 31,2014, at which time the common stock dividend amount permitted to be paid without prior approval from the FSA will be determinable.
Although Gibraltar Life may be able to pay common stock dividends under these regulatory restrictions, we do not anticipate receivingcommon stock dividends for several years as Gibraltar Life may return capital to Prudential Financial through other means, such as therepayment of subordinated debt or preferred stock obligations held by Prudential Financial or other affiliates. In 2013, Prudential of Japan paid adividend of ¥25.0 billion, or approximately $255 million, to its parent, Prudential Holdings of Japan. In 2013, Gibraltar Life repaid subordinateddebt of ¥6.7 billion, or approximately $68 million, paid a dividend of ¥16.9 billion, or approximately $170 million, on its preferred stock, andredeemed a portion of its preferred stock for ¥21.8 billion, or approximately $214 million, in each case to its parent, Prudential Holdings ofJapan. Additionally, Prudential of Korea paid a dividend of W70.0 billion or approximately $63 million to its parent, Prudential InternationalInsurance Holdings Ltd. Approximately $724 million of these distributions were ultimately sent to Prudential Financial.
Other subsidiaries. The ability of our asset management subsidiaries and the majority of our other operating subsidiaries to paydividends is largely unrestricted from a regulatory standpoint.
Liquidity of Insurance SubsidiariesWe manage the liquidity of our insurance operations to ensure stable, reliable and cost-effective sources of cash flows to meet all of
our obligations. Liquidity within each of our insurance subsidiaries is provided by a variety of sources, as described more fully below,including portfolios of liquid assets. The investment portfolios of our subsidiaries are integral to the overall liquidity of our insuranceoperations. We segment our investment portfolios and employ an asset/liability management approach specific to the requirements of eachof our product lines. This enhances the discipline applied in managing the liquidity, as well as the interest rate and credit risk profiles, ofeach portfolio in a manner consistent with the unique characteristics of the product liabilities. We use a projection process for cash flowsfrom operations to ensure sufficient liquidity is available to meet projected cash outflows, including claims.
Liquidity is measured against internally-developed benchmarks that take into account the characteristics of both the asset portfolio and theliabilities that they support. We consider attributes of the various categories of liquid assets (for example, type of asset and credit quality) incalculating internal liquidity measures to evaluate our insurance operations’ liquidity under various stress scenarios, including company-specificand market-wide events. We believe we have adequate liquidity in each of our insurance subsidiaries, including under these stress scenarios.
Cash FlowThe principal sources of liquidity for our insurance subsidiaries are premiums and certain annuity considerations, investment and fee
income, and investment maturities and sales associated with our insurance and annuity operations, as well as internal and externalborrowings. The principal uses of that liquidity include benefits, claims, dividends paid to policyholders, and payments to policyholdersand contractholders in connection with surrenders, withdrawals and net policy loan activity. Other uses of liquidity include commissions,general and administrative expenses, purchases of investments, hedging activity and payments in connection with financing activities.
In each of our major insurance subsidiaries, we believe that the cash flows from operations are adequate to satisfy current liquidityrequirements. The continued adequacy of this liquidity will depend upon factors such as future securities market conditions, changes in interestrate levels, policyholder perceptions of our financial strength, policyholder behavior, catastrophic events and the relative safety and attractivenessof competing products, each of which could lead to reduced cash inflows or increased cash outflows. Our insurance operations’ cash flows from
86 Prudential Financial, Inc. 2013 Annual Report

investment activities result from repayments of principal, proceeds from maturities and sales of invested assets and investment income, net ofamounts reinvested. The primary liquidity risks with respect to these cash flows are the risk of default by debtors or bond insurers, ourcounterparties’ willingness to extend repurchase and/or securities lending arrangements, commitments to invest and market volatility. We closelymanage these risks through our credit risk management process and regular monitoring of our liquidity position.
Domestic insurance operations. In managing the liquidity of our domestic insurance operations, we consider the risk of policyholderand contractholder withdrawals of funds earlier than our assumptions when selecting assets to support these contractual obligations. We usesurrender charges and other contract provisions to mitigate the extent, timing and profitability impact of withdrawals of funds bycustomers. The following table sets forth the liabilities for future policy benefits and policyholders’ account balances of certain of ourdomestic insurance subsidiaries as of the dates indicated.
December 31,
2013 2012
(in billions)Prudential Insurance . . . . . . . . . . . . . . . . . . . . . . . . . . . . . . . . . . . . . . . . . . . . . . . . . . . . . . . . . . . . . . . . . . . . . . . . . . . . . . . . . . . . . . . . . . . . . $160.0 $152.6PRIAC . . . . . . . . . . . . . . . . . . . . . . . . . . . . . . . . . . . . . . . . . . . . . . . . . . . . . . . . . . . . . . . . . . . . . . . . . . . . . . . . . . . . . . . . . . . . . . . . . . . . . . . . 24.3 24.1Other(1) . . . . . . . . . . . . . . . . . . . . . . . . . . . . . . . . . . . . . . . . . . . . . . . . . . . . . . . . . . . . . . . . . . . . . . . . . . . . . . . . . . . . . . . . . . . . . . . . . . . . . . . 5.5 12.7
Total future policy benefits and policyholders’ account balances . . . . . . . . . . . . . . . . . . . . . . . . . . . . . . . . . . . . . . . . . . . . . . . . . . . . . . $189.8 $189.4
(1) Includes Prudential Annuities Life Assurance Corporation (“PALAC”) and Pruco Life Insurance Company (“Pruco Life”). Amounts are reflected net ofreinsurance recoverables.
The liabilities presented above are primarily supported by invested assets in our general account. As noted above, when selecting assets tosupport these contractual obligations, we consider the risk of policyholder and contractholder withdrawals of funds earlier than our assumptions.As a result, assets will include both liquid assets, as discussed below, and other assets that we believe adequately support our liabilities.
For Prudential Insurance and other subsidiaries, the liabilities presented above primarily include annuity reserves and deposit liabilities andindividual life insurance policy reserves. Individual life insurance policies are less susceptible to withdrawal than our annuity contracts becausepolicyholders may incur surrender charges and be subject to a new underwriting process in order to obtain a new insurance policy. PrudentialInsurance’s reserves for group annuity contracts primarily relate to the significant pension risk transfer transactions that closed in the fourthquarter of 2012. These contracts are generally not subject to early withdrawal. For our individual annuity contracts, to encourage persistency,most of our variable and fixed annuities have surrender or withdrawal charges for a specified number of years. In addition, certain fixed annuitiesimpose a market value adjustment if the invested amount is not held to maturity. The living benefit features of our variable annuities alsoencourage persistency because the potential value of the living benefit is fully realized only if the contract persists.
For PRIAC, the liabilities presented above primarily include reserves for group annuity contracts. Although many of these contracts aresubject to discretionary withdrawal, withdrawals are typically at the market value of the underlying assets. Risk is further reduced by the highpersistency of clients driven in part by our strong competitive position in our target markets and contractual provisions such as deferred payouts.
Gross account withdrawals for our domestic insurance operations’ products in 2013 were consistent with our assumptions in asset/liability management, and the associated cash outflows did not have a material adverse impact on our overall liquidity.
International insurance operations. As with our domestic operations, in managing the liquidity of our international insuranceoperations, we consider the risk of policyholder and contractholder withdrawals of funds earlier than our assumptions in selecting assets tosupport these contractual obligations. The following table sets forth the total general account insurance-related liabilities (other thandividends payable to policyholders) of our international insurance subsidiaries, as of the dates indicated.
December 31,
2013 2012
(in billions)Prudential of Japan(1) . . . . . . . . . . . . . . . . . . . . . . . . . . . . . . . . . . . . . . . . . . . . . . . . . . . . . . . . . . . . . . . . . . . . . . . . . . . . . . . . . . . . . . . . . . . . $ 34.6 $ 36.4Gibraltar Life(2) . . . . . . . . . . . . . . . . . . . . . . . . . . . . . . . . . . . . . . . . . . . . . . . . . . . . . . . . . . . . . . . . . . . . . . . . . . . . . . . . . . . . . . . . . . . . . . . . 91.3 103.8All other international insurance subsidiaries(3) . . . . . . . . . . . . . . . . . . . . . . . . . . . . . . . . . . . . . . . . . . . . . . . . . . . . . . . . . . . . . . . . . . . . . . . 10.9 9.5
Total general account insurance-related liabilities (other than dividends payable to policyholders) . . . . . . . . . . . . . . . . . . . . . . . . . . . . $136.8 $149.7
(1) As of December 31, 2013 and 2012, $6.5 billion and $5.7 billion, respectively, of the insurance-related liabilities for Prudential of Japan are associatedwith U.S. dollar-denominated products that are coinsured to our domestic insurance operations and supported by U.S. dollar-denominated assets.
(2) Includes Prudential Gibraltar.(3) Represents our international insurance operations, excluding Japan.
The liabilities presented above are primarily supported by invested assets in our general account. When selecting assets to supportthese contractual obligations, we consider the risk of policyholder and contractholder withdrawals of funds earlier than our assumptions. Asa result, assets will include both liquid assets, as discussed below, and other assets that we believe adequately support our liabilities.
We believe most of the longer-term recurring pay individual life insurance policies sold by our Japanese operations do not havesignificant withdrawal risk because policyholders may incur surrender charges and must undergo a new underwriting process to obtain anew insurance policy. In addition, we utilize market value adjustment features to mitigate the profitability impact and timing ofwithdrawals of funds by customers. As of December 31, 2013, products with a market value adjustment feature represented $20.1 billion ofour Japan operations’ insurance-related liabilities.
Recently, Gibraltar Life has discontinued sales of its yen-denominated single premium reduced death benefit whole life product thathas a greater savings component. This product is more susceptible to increased levels of surrenders if interest rates increase in Japan, whichmay result in losses. As of December 31, 2013, yen-denominated single premium reduced death benefit whole life products represented$9.6 billion of our Japan operations’ insurance-related liabilities. Gibraltar Life also sells fixed annuities denominated in U.S. and
Prudential Financial, Inc. 2013 Annual Report 87

Australian dollars that may be subject to increased surrenders should these currencies appreciate in relation to the yen and interest rates inAustralia and the U.S. decline relative to Japan. As of December 31, 2013, fixed annuities denominated in U.S. and Australian dollarsrepresented $19.3 billion of our Japan operations’ insurance-related liabilities, of which $18.3 billion include a market value adjustmentfeature which mitigates the profitability impact from surrenders.
Liquid AssetsLiquid assets include cash and cash equivalents, short-term investments, fixed maturities that are not designated as held-to-maturity
and public equity securities. In addition to access to substantial investment portfolios, our insurance companies’ liquidity is managedthrough access to a variety of instruments available for funding and/or managing cash flow mismatches, including from time to time thosearising from claim levels in excess of projections. Our ability to utilize assets and liquidity between our subsidiaries is limited by regulatoryand other constraints. We believe that ongoing operations and the liquidity profile of our assets provide sufficient liquidity underreasonably foreseeable stress scenarios for each of our insurance subsidiaries.
The following table sets forth the fair value of certain of our domestic insurance operations’ portfolio of liquid assets, including cashand short-term investments, fixed maturity investments other than those designated as held-to-maturity, by NAIC or equivalent rating, andpublic equity securities, as of the dates indicated.
December 31, 2013
PrudentialInsurance PRIAC Other(1) Total
December 31,2012
(in billions)Cash and short-term investments . . . . . . . . . . . . . . . . . . . . . . . . . . . . . . . . . . . . . . . . . . . . . . . $ 6.9 $ 0.8 $0.6 $ 8.3 $ 7.4Fixed maturity investments:
High or highest quality . . . . . . . . . . . . . . . . . . . . . . . . . . . . . . . . . . . . . . . . . . . . . . . . . . . 121.9 19.0 8.3 149.2 158.6Other than high or highest quality . . . . . . . . . . . . . . . . . . . . . . . . . . . . . . . . . . . . . . . . . . 8.5 1.4 0.6 10.5 10.0
Subtotal . . . . . . . . . . . . . . . . . . . . . . . . . . . . . . . . . . . . . . . . . . . . . . . . . . . . . . . . . . . . . . . . . . 130.4 20.4 8.9 159.7 168.6Public equity securities . . . . . . . . . . . . . . . . . . . . . . . . . . . . . . . . . . . . . . . . . . . . . . . . . . . . . . 4.3 0.0 0.0 4.3 3.6
Total . . . . . . . . . . . . . . . . . . . . . . . . . . . . . . . . . . . . . . . . . . . . . . . . . . . . . . . . . . . . . . . . . . . . . $141.6 $21.2 $9.5 $172.3 $179.6
(1) Includes PALAC and Pruco Life.
The following table sets forth the fair value of our international insurance operations’ portfolio of liquid assets, including cash andshort-term investments, fixed maturity investments other than those designated as held-to-maturity, by NAIC or equivalent rating, andpublic equity securities, as of the dates indicated.
December 31, 2013
Prudentialof Japan
GibraltarLife(1)
AllOther(2) Total
December 31,2012
(in billions)Cash and short-term investments . . . . . . . . . . . . . . . . . . . . . . . . . . . . . . . . . . . . . . . . . . . . . $ 0.7 $ 2.2 $ 0.4 $ 3.3 $ 5.2Fixed maturity investments:
High or highest quality(3) . . . . . . . . . . . . . . . . . . . . . . . . . . . . . . . . . . . . . . . . . . . . . . 26.5 84.7 12.3 123.5 134.9Other than high or highest quality . . . . . . . . . . . . . . . . . . . . . . . . . . . . . . . . . . . . . . . . 0.4 2.2 0.2 2.8 2.5
Subtotal . . . . . . . . . . . . . . . . . . . . . . . . . . . . . . . . . . . . . . . . . . . . . . . . . . . . . . . . . . . . . . . . 26.9 86.9 12.5 126.3 137.4Public equity securities . . . . . . . . . . . . . . . . . . . . . . . . . . . . . . . . . . . . . . . . . . . . . . . . . . . . . 1.7 2.3 0.4 4.4 3.8
Total(4) . . . . . . . . . . . . . . . . . . . . . . . . . . . . . . . . . . . . . . . . . . . . . . . . . . . . . . . . . . . . . . . . . $29.3 $91.4 $13.3 $134.0 $146.4
(1) Includes Prudential Gibraltar.(2) Represents our international insurance operations, excluding Japan.(3) Of the $123.5 billion of fixed maturity investments that are not designated as held–to-maturity and considered high or highest quality as of
December 31, 2013, $86.5 billion, or 70%, were invested in government or government agency bonds.(4) The decline in liquid assets from December 31, 2012 was driven by depreciation of the yen relative to the U.S. dollar, partly offset by business growth.
Given the size and liquidity profile of our investment portfolios, we believe that claim experience, including policyholder withdrawalsand surrenders, varying from our projections does not constitute a significant liquidity risk. Our asset/liability management process takesinto account the expected maturity of investments and expected claim payments as well as the specific nature and risk profile of theliabilities. To the extent we need to pay claims in excess of projections, we may borrow temporarily or sell investments sooner thananticipated to pay these claims, which may result in increased borrowing costs or realized investment gains or losses affecting results ofoperations. The payment of claims and sale of investments earlier than anticipated would have an impact on the reported level of cash flowfrom operating, investing, and financing activities, respectively, in our financial statements. Historically, there has been no significantvariation between the expected maturities of our investments and the payment of claims.
Liquidity associated with other activities
Hedging activities associated with living benefit guaranteesAs discussed in “Captive Reinsurance Companies” above, we reinsure living benefit guarantees on certain variable annuity and
retirement products from our domestic life insurance companies to Pruco Re. This enables us to execute our living benefit hedging programprimarily within a single legal entity. As part of the living benefit hedging program, we enter into a range of exchange-traded, cleared andother over the counter equity and interest rate derivatives to hedge optional living benefit features accounted for as embedded derivativesagainst changes in certain capital market conditions such as interest rates and equity index levels. For a full discussion of our living benefitshedging program, see “—Results of Operations for Financial Services Businesses by Segment—U.S. Retirement Solutions and InvestmentManagement Division—Individual Annuities.” Pruco Re requires access to liquidity to meet its payment obligations under these hedging
88 Prudential Financial, Inc. 2013 Annual Report

arrangements, such as payments for periodic settlements, purchases, maturities, terminations and breakage. Pruco Re’s liquidity needs canvary materially due to, among other items, changes in interest rates, equity markets, mortality and policyholder behavior. Currently, wefund these liquidity needs with a combination of capital contributions and loans from Prudential Financial and other affiliates.
The living benefits hedging activity in Pruco Re may also result in collateral postings on derivatives to or from counterparties. The netcollateral position depends on changes in interest rates and equity markets related to the amount of the exposures hedged. Depending onmarket conditions, the collateral posting requirements can result in material liquidity needs. In addition, certain derivatives entered into onor after June 10, 2013, are subject to mandatory clearing requirements under the Dodd-Frank Act. These cleared derivatives typically haveadditional collateral requirements. As of December 31, 2013, the living benefit hedging derivatives were in a net posting position of $0.4billion compared to a net receive position of $4.4 billion as of December 31, 2012. The change in position was primarily driven by risinginterest rates and equity market appreciation.
Additionally, in certain cases, state insurance law requires reinsurers, such as Pruco Re, to collateralize their obligations under a reinsuranceagreement to permit the ceding company to claim statutory reinsurance reserve credit for the business ceded. Because our subsidiaries Pruco Lifeand, effective August 31, 2013, PALAC are domiciled in the State of Arizona (as is Pruco Re), they are able to claim reinsurance reserve creditfor business ceded to Pruco Re without the need for Pruco Re to post collateral. However, Pruco Re must post collateral with respect to businessceded to it by our subsidiary Pruco Life Insurance Company of New Jersey. We satisfy collateral posting requirements by depositing assets intostatutory reserve credit trusts. Funding needs for the statutory reserve credit trusts are separate and distinct from capital needs of Pruco Re.However, assets pledged to the statutory reserve credit trusts may include assets supporting the capital of Pruco Re provided that they meeteligibility requirements prescribed by the Arizona Department of Insurance. Reinsurance reserve credit requirements and the amount of assetsrequired to be pledged can vary substantially due to changes in equity markets, interest rates, actuarial assumptions and other factors. As ofDecember 31, 2013, the statutory reserve credit trusts required collateral of $7 million, a decrease of $2.2 billion from December 31, 2012,primarily due to the re-domestication of PALAC to the State of Arizona effective August 31, 2013.
Foreign exchange hedging activities
We employ various hedging strategies to manage potential exposure to foreign currency exchange rate movements, particularly thoseassociated with the Japanese yen. Our overall yen hedging strategy calibrates the hedge level to preserve the relative contribution of our yen-based business to the Company’s overall return on equity. For further information on our hedging strategies, see “—Results of Operations forFinancial Services Businesses by Segment—International Insurance Division.” Our hedging strategies, which include both internal andexternal hedging programs, may impact the liquidity positions of both Prudential Financial and our international insurance subsidiaries.
The internal-only hedges are between Prudential Financial (through a subsidiary) and certain of our yen-based entities and serve tohedge changes in the market value of U.S. dollar-denominated investments held on the books of these yen-based entities attributable tochanges in the yen-dollar exchange rate. These U.S. dollar-denominated investments are part of our hedging strategy to mitigate the impactof foreign currency exchange rate movements on our U.S. dollar-equivalent equity. Absent an internal hedge, changes in the market valueof these U.S. dollar-denominated investments attributable to changes in the yen-dollar exchange rate would create volatility in the solvencymargins of these subsidiaries. To minimize this volatility, we enter into inter-company hedges. Cash settlements from these hedgingactivities result in cash flows between Prudential Financial and these yen-based subsidiaries. The cash flows are dependent on changes inforeign currency exchange rates and the notional amount of the exposures hedged. During 2013, Prudential Financial received $831 millionof net cash settlements related to the internal hedge program, which were paid by the yen-based subsidiaries. As of December 31, 2013, themarket value of the internal hedges was an asset of $867 million due from the yen-based subsidiaries. A significant yen depreciation overan extended period of time could result in additional net cash inflows to Prudential Financial. Conversely, a significant yen appreciationcould result in net cash outflows from Prudential Financial.
Our external hedges primarily serve to hedge a portion of our prospective non-U.S. dollar-denominated earnings streams and, to alesser extent, our U.S. dollar-equivalent equity. The external hedges are between a subsidiary of Prudential Financial and external parties.Cash settlements on these activities result in cash flows between the Company and the external parties and are dependent on changes inforeign currency exchange rates and the notional amount of the exposures hedged. During 2013, the Company received $74 million of netcash settlements related to these external hedges. As of December 31, 2013, the net asset related to these external foreign currency hedgeswas $780 million. A significant depreciation in the yen and other foreign currencies could result in net cash inflows to the Company, whilea significant appreciation in the yen and other foreign currencies could result in net cash outflows from the Company.
Asset Management operations
The principal sources of liquidity for our fee-based asset management businesses include asset management fees and commercialmortgage origination and servicing fees. The principal uses of liquidity include general and administrative expenses and distributions ofdividends and returns of capital to Prudential Financial. The primary liquidity risks for our fee-based asset management businesses relate totheir profitability, which is impacted by market conditions and our investment management performance. We believe the cash flows fromour fee-based asset management businesses are adequate to satisfy the current liquidity requirements of these operations, as well asrequirements that could arise under reasonably foreseeable stress scenarios, which are monitored through the use of internal measures.
The principal sources of liquidity for our strategic investments and interim loans held in our asset management businesses are cashflows from investments, the ability to liquidate investments, and available borrowing lines from internal sources, including PrudentialFunding and Prudential Financial. The primary liquidity risks include the inability to sell assets in a timely manner, declines in the value ofassets and credit defaults. There were no material changes to the liquidity position of our asset management operations during 2013.
Alternative Sources of Liquidity
In addition to the sources of liquidity discussed throughout this section, Prudential Financial and certain subsidiaries have access to thealternative sources of liquidity described below:
Prudential Financial, Inc. 2013 Annual Report 89

Asset-based FinancingWe conduct asset-based or secured financing within our insurance and other subsidiaries, including transactions such as securities
lending, repurchase agreements and mortgage dollar rolls to earn spread income, to borrow funds, or to facilitate trading activity. Theseprograms are primarily driven by portfolio holdings of securities that are lendable based on counterparty demand for these securities in themarketplace. The collateral received in connection with these programs is primarily used to purchase securities in the short-term spreadportfolios of our insurance entities. Investments held in the short-term spread portfolios include cash and cash equivalents, short-terminvestments, mortgage loans and fixed maturities, including mortgage- and asset-backed securities, with a weighted average life at time ofpurchase by the short-term portfolios of four years or less. Floating rate assets comprise the majority of our short-term spread portfolio.These short-term portfolios are subject to specific investment policy statements, which among other things, do not allow for significantasset/liability interest rate duration mismatch.
The following table sets forth our liabilities under asset-based or secured financing programs attributable to the Financial ServicesBusinesses and Closed Block Business as of the dates indicated.
December 31, 2013 December 31, 2012
FinancialServices
Businesses
ClosedBlock
Business Consolidated
FinancialServices
Businesses
ClosedBlock
Business Consolidated
(in millions)Securities sold under agreements to repurchase . . . . . . . . . . . . . . . . . . $4,128 $3,770 $ 7,898 $3,436 $2,382 $5,818Cash collateral for loaned securities . . . . . . . . . . . . . . . . . . . . . . . . . . . 4,230 810 5,040 2,864 1,077 3,941Securities sold but not yet purchased . . . . . . . . . . . . . . . . . . . . . . . . . . 56 0 56 0 0 0
Total(1) . . . . . . . . . . . . . . . . . . . . . . . . . . . . . . . . . . . . . . . . . . . . . $8,414 $4,580 $12,994 $6,300 $3,459 $9,759
Portion of above securities that may be returned to the Companyovernight requiring immediate return of the cash collateral . . . . . . . $6,503 $2,273 $ 8,776 $4,536 $1,566 $6,102
Weighted average maturity, in days(2) . . . . . . . . . . . . . . . . . . . . . . . . . 39 71 25 67
(1) The daily weighted average outstanding for the twelve months ended December 31, 2013 and 2012, was $7,044 million and $6,695 million, for theFinancial Services Businesses and $4,219 million and $4,303 million, for the Closed Block Business, respectively.
(2) Excludes securities that may be returned to the Company overnight.
Outstanding liabilities under these programs increased $3.2 billion during 2013, as recent growth in our portfolio of invested assetswas utilized to take advantage of attractive financing and investment opportunities.
As of December 31, 2013, our domestic insurance entities had assets eligible for the asset-based or secured financing programs of$76.8 billion, of which $10.7 billion were on loan. Taking into account market conditions and outstanding loan balances as ofDecember 31, 2013, we believe approximately $20.7 billion of the remaining eligible assets are readily lendable, of which approximately$14.6 billion relates to the Financial Services Businesses.
In addition, as of December 31, 2013, our Closed Block Business had outstanding mortgage dollar rolls, under which we arecommitted to repurchase $718 million of mortgage-backed securities, or TBA forward contracts. These repurchase agreements do notqualify as secured borrowings and are accounted for as derivatives. These mortgage-backed securities are considered high or highestquality based on NAIC or equivalent rating.
Membership in the Federal Home Loan BanksPrudential Insurance is a member of the Federal Home Loan Bank of New York, or FHLBNY. Membership allows Prudential
Insurance access to the FHLBNY’s financial services, including the ability to obtain loans and to issue funding agreements as an alternativesource of liquidity that are collateralized by qualifying mortgage-related assets or U.S. Treasury securities. Based on regulatory limitations,as of December 31, 2013, Prudential Insurance had an estimated maximum borrowing capacity of $6.5 billion under the FHLBNY facility,of which $2.2 billion was outstanding.
PRIAC is a member of the Federal Home Loan Bank of Boston, or FHLBB, which provides PRIAC access to collateralized advancesfrom the FHLBB. Under Connecticut state insurance law, without the prior consent of the Connecticut Insurance Department (the “CTDepartment”), the amount of assets insurers may pledge to secure debt obligations is limited to the lesser of 5% of prior-year statutoryadmitted assets or 25% of prior-year statutory surplus, resulting in a maximum borrowing capacity for PRIAC under the FHLBB facility ofapproximately $230 million, none of which was outstanding as of December 31, 2013. Previously, the CT Department provided an advanceconsent to PRIAC, permitting it to pledge up to $2.6 billion in assets to secure FHLBB borrowings, resulting in a maximum borrowingcapacity under the facility of approximately $1.7 billion; however, this consent expired as of December 31, 2013.
Borrowings under these facilities are subject to the FHLBNY’s and the FHLBB’s discretion and require the availability of qualifyingassets at Prudential Insurance and PRIAC. For further information, see Note 14 to our Consolidated Financial Statements.
Commercial Paper ProgramsPrudential Financial and Prudential Funding, LLC, or Prudential Funding, a wholly-owned subsidiary of Prudential Insurance, have
commercial paper programs with an authorized issuance capacity of $3.0 billion and $7.0 billion, respectively. Prudential Financialcommercial paper borrowings generally have been used to fund the working capital needs of our subsidiaries. Prudential Funding commercialpaper borrowings generally have been used to fund the working capital needs of Prudential Insurance and its subsidiaries. Prudential Fundingalso lends to other subsidiaries of Prudential Financial up to limits agreed with NJDOBI. Prudential Funding maintains a support agreementwith Prudential Insurance whereby Prudential Insurance has agreed to maintain Prudential Funding’s positive tangible net worth at all times.Prudential Financial has also issued a subordinated guarantee covering Prudential Funding’s commercial paper program. As of December 31,2013, Prudential Financial and Prudential Funding had outstanding borrowings of $190 million and $460 million, respectively, under thesecommercial paper programs. For further information, see Note 14 to our Consolidated Financial Statements.
90 Prudential Financial, Inc. 2013 Annual Report

Credit FacilitiesWe have access to an aggregate of $3.75 billion of syndicated, unsecured committed credit facilities, which includes a $2 billion five-year
facility that has Prudential Financial as borrower and a $1.75 billion three-year facility that has both Prudential Financial and Prudential Fundingas borrowers. In November 2013, we agreed with the lenders to extend the expiration dates of the five-year facility to November 2018 and thethree-year facility to November 2016. The facilities may be used for general corporate purposes, including as backup liquidity for our commercialpaper programs. There were no outstanding borrowings under these credit facilities as of December 31, 2013 or as of February 27, 2014.
Prudential Financial expects that it may borrow under the five-year credit facility from time to time to fund its working capital needsand those of its subsidiaries. In addition, up to $300 million of the five-year facility may be drawn in the form of standby letters of creditthat can be used to meet the Company’s operating needs. The credit facilities contain representations and warranties, covenants and eventsof default that are customary for facilities of this type; however, borrowings under the facilities are not contingent on the Company’s creditratings nor subject to material adverse change clauses. Borrowings under the credit facilities require that the Company maintain at all timesconsolidated net worth, relating to the Financial Services Businesses only, of at least $18.985 billion (excluding AOCI and excludingequity of non-controlling interests). For further information, see Note 14 to our Consolidated Financial Statements.
Put Option Agreement for Senior Debt IssuanceIn November 2013, we entered into a ten-year put option agreement with a Delaware trust upon the completion of the sale of $1.5 billion of
trust securities by that Delaware trust in a Rule 144A private placement. The trust invested the proceeds from the sale of the trust securities in aportfolio of principal and interest strips of U.S. Treasury securities. The put option agreement provides Prudential Financial the right to sell to thetrust at any time up to $1.5 billion of 4.419% senior notes due November 2023 and receive in exchange a corresponding amount of the principaland interest strips of U.S. Treasury securities held by the trust. In return, we agreed to pay a semi-annual put premium to the trust at a rate of1.777% per annum applied to the unexercised portion of the put option. The put option agreement with the trust provides Prudential Financialwith a source of liquid assets. We will determine the use of proceeds from any exercise of the put option at the time of exercise. For example,proceeds could be used to meet general liquidity needs and/or to meet the capital requirements of our subsidiaries.
The put option described above will be exercised automatically in full upon our failure to make certain payments to the trust, such aspaying the put option premium or reimbursing the trust for its expenses, if our failure to pay is not cured within 30 days, and upon an eventinvolving our bankruptcy. We are also required to exercise the put option if our consolidated stockholders’ equity, calculated in accordancewith GAAP but excluding accumulated other comprehensive income (loss), falls below $7 billion, subject to adjustment in certain cases.We have a one-time right to unwind a prior voluntary exercise of the put option by repurchasing all of the senior notes then held by thetrust in exchange for principal and interest strips of U.S. Treasury securities. Finally, any of the 4.419% senior notes that we issue may beredeemed by us prior to their maturity at par or, if greater, a make-whole price, following a voluntary exercise in full of the put option.
Financing ActivitiesAs of December 31, 2013 and 2012, total short- and long-term debt of the Company on a consolidated basis was $26.2 billion and
$27.2 billion, respectively. The following table sets forth total consolidated borrowings of the Company as of the dates indicated. We may,from time to time, seek to redeem or repurchase our outstanding debt securities through open market purchases, individually negotiatedtransactions or otherwise. Any such repurchases will depend on prevailing market conditions, our liquidity position and other factors.
December 31, 2013 December 31, 2012
PrudentialFinancial
OtherSubsidiaries Consolidated
PrudentialFinancial
OtherSubsidiaries Consolidated
(in millions)General obligation short-term debt:
Commercial paper(1) . . . . . . . . . . . . . . . . . . . . . . . . . . . . . . . . . . . . . $ 190 $ 460 $ 650 $ 113 $ 359 $ 472Current portion of long-term debt and other(2)(3) . . . . . . . . . . . . . . . 1,531 413 1,944 1,734 203 1,937
Subtotal . . . . . . . . . . . . . . . . . . . . . . . . . . . . . . . . . . . . . . . . . . . . . . . . . . . 1,721 873 2,594 1,847 562 2,409
General obligation long-term debt:Senior debt(3)(4) . . . . . . . . . . . . . . . . . . . . . . . . . . . . . . . . . . . . . . . . 11,462 1,466 12,928 12,404 1,916 14,320Junior subordinated debt . . . . . . . . . . . . . . . . . . . . . . . . . . . . . . . . . . 4,884 0 4,884 4,594 0 4,594Surplus notes(5) . . . . . . . . . . . . . . . . . . . . . . . . . . . . . . . . . . . . . . . . . 0 4,141 4,141 0 4,140 4,140
Subtotal . . . . . . . . . . . . . . . . . . . . . . . . . . . . . . . . . . . . . . . . . . . . . . . . . . . 16,346 5,607 21,953 16,998 6,056 23,054
Total general obligations . . . . . . . . . . . . . . . . . . . . . . . . . . . . . . 18,067 6,480 24,547 18,845 6,618 25,463
Limited recourse borrowing(6):Current portion of long-term debt . . . . . . . . . . . . . . . . . . . . . . . . . . . 0 75 75 0 75 75Long-term debt . . . . . . . . . . . . . . . . . . . . . . . . . . . . . . . . . . . . . . . . . . 0 1,600 1,600 0 1,675 1,675
Total limited recourse borrowings . . . . . . . . . . . . . . . . . . . . . . . 0 1,675 1,675 0 1,750 1,750
Total borrowings . . . . . . . . . . . . . . . . . . . . . . . . . . . . . . . . . . . . . . . . . . . . $18,067 $8,155 $26,222 $18,845 $8,368 $27,213
(1) See “—Alternative Sources of Liquidity” above for a discussion on our use of commercial paper(2) Includes collateralized borrowings from the Federal Home Loan Bank of New York of $100 million at December 31, 2012. For additional information
on these borrowings, see Note 14 to the Consolidated Financial Statements.(3) Does not include $2,381 million and $1,780 million of medium-term notes of consolidated trust entities secured by funding agreements purchased with
the proceeds of such notes as of December 31, 2013 and 2012, respectively, or $1.9 billion of collateralized funding agreements issued to the FederalHome Loan Bank of New York at both December 31, 2013 and 2012. These notes and funding agreements are included in “Policyholders’ accountbalances.” For additional information on these obligations, see Notes 10 and 14 to the Consolidated Financial Statements
(4) Includes collateralized borrowings from the Federal Home Loan Bank of New York of $280 million at both December 31, 2013 and 2012. Foradditional information on these borrowings, see Note 14 to the Consolidated Financial Statements.
(5) Amounts are net of assets under set-off arrangements of $2,400 million and $1,000 million, as of December 31, 2013 and 2012, respectively(6) Limited and non-recourse borrowing represents outstanding debt of Prudential Holdings, LLC that is attributable to the Closed Block Business. See
“Prudential Holdings, LLC Notes” within Note 14 to the Consolidated Financial Statements for additional information.
Prudential Financial, Inc. 2013 Annual Report 91

As of December 31, 2013 and 2012, we were in compliance with all debt covenants related to the borrowings in the table above. Forfurther information on the terms of our short- and long-term debt obligations, see Note 14 to our Consolidated Financial Statements.
Based on the use of proceeds, we classify our borrowings as capital debt, investment-related debt, and debt related to specifiedbusinesses. Capital debt, which is debt utilized to meet the capital requirements of our businesses, was $10.2 billion and $10.6 billion as ofDecember 31, 2013 and 2012, respectively. Investment-related debt of $9.9 billion and $10.5 billion as of December 31, 2013 and 2012,respectively, consists of debt issued to finance specific investment assets or portfolios of investment assets, the proceeds from which willservice the debt. Specifically, this includes institutional spread lending investment portfolios, assets supporting reserve requirements underRegulation XXX and Guideline AXXX as described below, as well as institutional and insurance company portfolio cash flow timingdifferences. Our remaining borrowings are utilized for business funding to meet specific purposes, including funding new businessacquisition costs associated with our individual annuities business, operating needs associated with hedging our individual annuitiesproducts as discussed above and activities associated with our asset management business.
Prudential Financial BorrowingsLong-term borrowings are conducted primarily by the holding company, Prudential Financial. It borrows these funds to meet its capital and
other funding needs, as well as the capital and funding needs of its subsidiaries. Prudential Financial maintains a shelf registration statement withthe SEC that permits the issuance of public debt, equity and hybrid securities. As a “Well-Known Seasoned Issuer” under SEC rules, PrudentialFinancial’s shelf registration statement provides for automatic effectiveness upon filing and has no stated issuance capacity.
Prudential Financial primarily issues senior debt under its Medium-Term Note, Series D program that currently has an authorizedissuance capacity of $20.0 billion, of which approximately $8.5 billion remained available as of December 31, 2013. Prudential Financialalso maintains a retail medium-term notes program, including InterNotes®, that has an authorized issuance capacity of $5.0 billion, ofwhich approximately $4.7 billion remained available as of December 31, 2013. The weighted average interest rate on PrudentialFinancial’s senior notes, including the effect of interest rate hedging activity, was 5.39% and 5.27% for the years ended December 31, 2013and 2012, respectively, excluding the effect of debt issued to consolidated subsidiaries.
Prudential Financial has $4.9 billion of junior subordinated notes outstanding as of December 31, 2013, that are considered hybridsecurities and receive enhanced equity treatment from the rating agencies. See Note 14 to our Consolidated Financial Statements for adescription of the key terms of our junior subordinated notes.
Prudential Financial borrowings of $18.1 billion decreased $0.8 billion from December 31, 2012, driven by $1.6 billion of maturities ofmedium-term notes, the redemption of all of our $920 million 9.0% Junior Subordinated Notes due 2068 and the repayment of $615 millionaggregate principal amount of retail notes, partially offset by the issuance of $1.2 billion of junior subordinated debt and the issuance of$1.1 billion of medium-term notes. As of December 30, 2013, $292 million of retail notes remained outstanding with no option to redeem at par.
Subsidiary BorrowingsSubsidiary borrowings principally consist of surplus note issuances done within our insurance and captive reinsurance subsidiaries,
commercial paper borrowings by Prudential Funding and asset-based financing.
Financing of regulatory reserves associated with domestic life insurance products
As discussed above under “Capital—Insurance Subsidiaries—Captive Reinsurance Companies,” we use captive reinsurancecompanies to implement reinsurance and capital management actions, including financing regulatory non-economic reserves throughinternal and external solutions. These activities are described below.
From 2011 through 2013, we entered into agreements with external counterparties providing for the issuance and sale of up to an aggregateof $2.0 billion of ten-year surplus notes by one of our captive reinsurance subsidiaries. Under the agreements, the captive receives in exchangefor the surplus notes one or more credit-linked notes issued by a special purpose subsidiary of the Company in an aggregate principal amountequal to the surplus notes issued. The captive holds the credit-linked notes as assets supporting non-economic reserves required to be held by ourdomestic insurance subsidiaries under Regulation XXX in connection with the reinsurance of term life insurance policies through the captive.The principal amount of the outstanding credit-linked notes is redeemable by the captive in cash upon the occurrence of, and in an amountnecessary to remedy, a specified liquidity stress event affecting the captive. Under the agreements, the external counterparties have agreed tofund any such payment under the credit-linked notes in return for a fee. Prudential Financial has agreed to make capital contributions to thecaptive to reimburse it for investment losses in excess of specified amounts and has agreed to reimburse the external counterparties for anypayments under the credit-linked notes that are funded by those counterparties. As of December 31, 2013, an aggregate of $1.5 billion of surplusnotes were outstanding under these agreements and no such payments under the credit-linked notes have been required.
In December 2013, another captive reinsurance subsidiary entered into a twenty-year financing facility with external counterpartiesproviding for the issuance and sale of a surplus note in an aggregate principal amount of up to $2.0 billion in order to finance non-economic reserves required to be held by our domestic insurance subsidiaries under Guideline AXXX. The agreements contemplate thatadditional external counterparties may be added to this facility in the future which could increase the size of the facility to $3.0 billion.Similar to the agreements described above, the captive receives in exchange for the surplus note one or more credit linked notes issued by aspecial purpose affiliate in an aggregate principal amount equal to the surplus note. As above, the principal amount of the outstandingcredit-linked notes is redeemable by the captive in cash upon the occurrence of, and in an amount necessary to remedy, a specified liquiditystress event, and the external counterparties have agreed to fund any such payment. Prudential Financial has agreed to reimburse thecaptive for investment losses in excess of specified amounts; however, Prudential Financial has no other reimbursement obligations to theexternal counterparties under this facility. As of December 31, 2013, an aggregate of $900 million of surplus notes were outstanding underthe facility and no credit-linked note payments have been required.
Under each of the above transactions, because valid rights of set-off exist, interest and principal payments on the surplus notes and on thecredit-linked notes are settled on a net basis, and the surplus notes are reflected in the Company’s total consolidated borrowings on a net basis.
92 Prudential Financial, Inc. 2013 Annual Report

Other captive reinsurance subsidiaries have outstanding an additional $3.2 billion of surplus notes that were issued in 2006 through2008 with unaffiliated institutions to finance non-economic reserves required under Regulation XXX and Guideline AXXX. PrudentialFinancial has agreed to maintain the capital of these captives at or above a prescribed minimum level and has entered into arrangements(which are accounted for as derivative instruments) that require it to make certain payments in the event of deterioration in the value of thesurplus notes. As of both December 31, 2013 and 2012, there were no collateral postings made under these derivative instruments. Inaddition, another captive reinsurance subsidiary has issued an aggregate amount of $3.3 billion of notes to affiliates of the Company inorder to finance non-economic reserves under Guideline AXXX.
The surplus notes described above are subordinated to policyholder obligations, and the payment of principal on the surplus notes mayonly be made with prior insurance regulatory approval. The payment of interest on the surplus notes has been approved by the regulator,subject to its ability to withdraw that approval.
As we continue to underwrite term and universal life insurance business, including through the recently-acquired Hartford Life Business, weexpect to have additional borrowing needs to finance non-economic reserves required under Regulation XXX and Guideline AXXX. We believewe have sufficient financing resources in place to meet our financing needs under Guideline AXXX through 2014. We had sufficient financingresources in place to meet our financing needs under Regulation XXX in 2013, and we are currently pursuing a solution to address RegulationXXX financing needs generated by our sale of term life insurance policies during 2014 based on expected sales levels.
Ratings
Financial strength ratings (which are sometimes referred to as “claims-paying” ratings) and credit ratings are important factors affectingpublic confidence in an insurer and its competitive position in marketing products. Nationally Recognized Statistical Ratings Organizationscontinually review the financial performance and financial condition of the entities they rate, including Prudential Financial and its ratedsubsidiaries. Our credit ratings are also important for our ability to raise capital through the issuance of debt and for the cost of such financing.
A downgrade in the credit or financial strength ratings of Prudential Financial or its rated subsidiaries could potentially, among otherthings, limit our ability to market products, reduce our competitiveness, increase the number or value of policy surrenders and withdrawals,increase our borrowing costs and potentially make it more difficult to borrow funds, adversely affect the availability of financial guarantees,such as letters of credit, cause additional collateral requirements or other required payments under certain agreements, allow counterparties toterminate derivative agreements and/or hurt our relationships with creditors, distributors, or trading counterparties thereby potentiallynegatively affecting our profitability, liquidity, and/or capital. In addition, we consider our own risk of non-performance in determining thefair value of our liabilities. Therefore, changes in our credit or financial strength ratings may affect the fair value of our liabilities.
Financial strength ratings represent the opinions of rating agencies regarding the financial ability of an insurance company to meet itsobligations under an insurance policy. Credit ratings represent the opinions of rating agencies regarding an entity’s ability to repay itsindebtedness. The following table summarizes the ratings for Prudential Financial and certain of its subsidiaries as of February 27, 2014.
A.M.Best(1) S&P(2) Moody’s(3) Fitch(4)
Last review date . . . . . . . . . . . . . . . . . . . . . . . . . . . . . . . . . . . . . . . . . . . . . . . . . . . . . . . . . . . . . . . . . . . . . . . . . . 5/9/2013 12/11/2013 7/11/2013 7/25/2013Current outlook . . . . . . . . . . . . . . . . . . . . . . . . . . . . . . . . . . . . . . . . . . . . . . . . . . . . . . . . . . . . . . . . . . . . . . . . . . . Stable Stable(5) Stable Stable
Financial Strength Ratings:The Prudential Insurance Company of America . . . . . . . . . . . . . . . . . . . . . . . . . . . . . . . . . . . . . . . . . . . . . . . . . . . A+ AA- A1 A+Pruco Life Insurance Company . . . . . . . . . . . . . . . . . . . . . . . . . . . . . . . . . . . . . . . . . . . . . . . . . . . . . . . . . . . . . . . A+ AA- A1 A+Pruco Life Insurance Company of New Jersey . . . . . . . . . . . . . . . . . . . . . . . . . . . . . . . . . . . . . . . . . . . . . . . . . . . A+ AA- NR* A+Prudential Annuities Life Assurance Corporation . . . . . . . . . . . . . . . . . . . . . . . . . . . . . . . . . . . . . . . . . . . . . . . . . A+ AA- NR A+Prudential Retirement Insurance and Annuity Company . . . . . . . . . . . . . . . . . . . . . . . . . . . . . . . . . . . . . . . . . . . . A+ AA- A1 A+The Prudential Life Insurance Company Ltd. (Prudential of Japan) . . . . . . . . . . . . . . . . . . . . . . . . . . . . . . . . . . . . NR AA- NR NRGibraltar Life Insurance Company, Ltd. . . . . . . . . . . . . . . . . . . . . . . . . . . . . . . . . . . . . . . . . . . . . . . . . . . . . . . . . . NR AA- NR NRThe Prudential Gibraltar Financial Life Insurance Co. Ltd . . . . . . . . . . . . . . . . . . . . . . . . . . . . . . . . . . . . . . . . . . NR AA- NR NRPrudential Life Insurance Co. of Taiwan, Inc.(6) . . . . . . . . . . . . . . . . . . . . . . . . . . . . . . . . . . . . . . . . . . . . . . . . . . NR twAA+ NR NR
Credit Ratings:Prudential Financial, Inc.:
Short-term borrowings . . . . . . . . . . . . . . . . . . . . . . . . . . . . . . . . . . . . . . . . . . . . . . . . . . . . . . . . . . . . . . . . . . AMB-1 A-1 P-2 F2Long-term senior debt . . . . . . . . . . . . . . . . . . . . . . . . . . . . . . . . . . . . . . . . . . . . . . . . . . . . . . . . . . . . . . . . . . . a- A Baa1 BBB+Junior subordinated long-term debt . . . . . . . . . . . . . . . . . . . . . . . . . . . . . . . . . . . . . . . . . . . . . . . . . . . . . . . . bbb BBB+ Baa2 BBB-
The Prudential Insurance Company of America:Capital and surplus notes . . . . . . . . . . . . . . . . . . . . . . . . . . . . . . . . . . . . . . . . . . . . . . . . . . . . . . . . . . . . . . . . a A A3 A-
Prudential Funding, LLC:Short-term debt . . . . . . . . . . . . . . . . . . . . . . . . . . . . . . . . . . . . . . . . . . . . . . . . . . . . . . . . . . . . . . . . . . . . . . . . AMB-1 A-1+ P-1 F1Long-term senior debt . . . . . . . . . . . . . . . . . . . . . . . . . . . . . . . . . . . . . . . . . . . . . . . . . . . . . . . . . . . . . . . . . . . a+ AA- A2 A
PRICOA Global Funding I:Long-term senior debt . . . . . . . . . . . . . . . . . . . . . . . . . . . . . . . . . . . . . . . . . . . . . . . . . . . . . . . . . . . . . . . . . . . aa- AA- A1 A+
* “NR” indicates not rated.(1) A.M. Best Company , which we refer to as A.M. Best, financial strength ratings for insurance companies currently range from “A++ (superior)” to “S
(Suspended).” A.M. Best’s ratings reflect its opinion of an insurance company’s financial strength, operating performance and ability to meet its obligations topolicyholders. An A.M. Best long-term credit rating is an opinion of the ability of an obligor to pay interest and principal in accordance with the terms of theobligation. A.M. Best long-term credit ratings range from “aaa (exceptional)” to “d (in default),” with ratings from “aaa” to “bbb” considered as investmentgrade. An A.M. Best short-term credit rating reflects an opinion of the issuer’s fundamental credit quality. Ratings range from “AMB-1+,” which represents anexceptional ability to repay short-term debt obligations, to “AMB-4,” which correlates with a speculative (“bb”) long-term rating.
Prudential Financial, Inc. 2013 Annual Report 93

(2) Standard & Poor’s Rating Services, which we refer to as S&P, financial strength ratings currently range from “AAA (extremely strong)” to “R (regulatorysupervision).” These ratings reflect S&P’s opinion of an operating insurance company’s financial capacity to meet the obligations of its insurance policies inaccordance with their terms. A “+” or “-” indicates relative strength within a category. An S&P credit rating is a current opinion of the creditworthiness of anobligor with respect to a specific financial obligation, a specific class of financial obligations or a specific financial program. S&P’s long-term issue creditratings range from “AAA (extremely strong)” to “D (default).” S&P short-term ratings range from “A-1 (highest category)” to “D (default).”
(3) Moody’s Investors Service, Inc., which we refer to as Moody’s, insurance financial strength ratings currently range from “Aaa (exceptional)” to “C(lowest).” Moody’s insurance ratings reflect the ability of insurance companies to repay punctually senior policyholder claims and obligations. Numericmodifiers are used to refer to the ranking within the group—with 1 being the highest and 3 being the lowest. These modifiers are used to indicaterelative strength within a category. Moody’s credit ratings currently range from “Aaa (highest)” to “C (default).” Moody’s credit ratings grade debtaccording to its investment quality. Moody’s considers “A1,” “A2” and “A3” rated debt to be upper medium grade obligations, subject to low creditrisk. Moody’s short-term ratings are opinions of the ability of issuers to honor senior financial obligations and contracts. Prime ratings range from“Prime-1 (P-1),” which represents a superior ability for repayment of senior short-term debt obligations, to “Prime-3 (P-3),” which represents anacceptable ability for repayment of such obligations. Issuers rated “Not Prime” do not fall within any of the Prime rating categories.
(4) Fitch Ratings Ltd., which we refer to as Fitch, financial strength ratings currently range from “AAA (exceptionally strong)” to “C (distressed).” Fitch’sratings reflect its assessment of the likelihood of timely payment of policyholder and contractholder obligations. Fitch long-term credit ratings currentlyrange from “AAA (highest credit quality),” which denotes exceptionally strong capacity for timely payment of financial commitments, to “D (default).”Investment grade ratings range between “AAA” and “BBB.” Short-term ratings range from “F1 (highest credit quality)” to “C (high default risk).”Within long-term and short-term ratings, a “+” or a “–” may be appended to a rating to denote relative status within major rating categories.
(5) S&P has the ratings of our U.S.-domiciled entities on stable outlook and the ratings of our Japanese insurance entities on negative outlook as part ofS&P’s decision to put the sovereign debt ratings of Japan on negative outlook.
(6) This rating for Prudential Life Insurance Company of Taiwan, Inc. was issued on December 18, 2013 by Taiwan Ratings Corporation, a partner of S&P.
The ratings set forth above reflect current opinions of each rating agency. Each rating should be evaluated independently of any otherrating. These ratings are not directed toward shareholders and do not in any way reflect evaluations of the safety and security of theCommon Stock. These ratings are reviewed periodically and may be changed at any time by the rating agencies. As a result, there can beno assurance that we will maintain our current ratings in the future.
Rating agencies use an “outlook” statement for both industry sectors and individual companies. For an industry sector, a stableoutlook generally implies that over the next 12-18 months the rating agency expects ratings to remain unchanged among companies in thesector. Currently, Moody’s, A.M. Best, S&P and Fitch all have the U.S. life insurance industry on stable outlook. For a particular company,an outlook generally indicates a medium- or long-term trend (generally six months to two years) in credit fundamentals, which if continued,may lead to a rating change. These indicators are not necessarily a precursor of a rating change nor do they preclude a rating agency fromchanging a rating at any time without notice. Currently, Moody’s, A.M. Best and Fitch have all of the Company’s ratings on stable outlook;and S&P has the ratings of our U.S.-domiciled entities on stable outlook and the ratings of our Japanese insurance entities on negativeoutlook as part of S&P’s decision to put the sovereign debt ratings of Japan on negative outlook.
Requirements to post collateral or make other payments as a result of ratings downgrades under certain agreements, includingderivative agreements, can be satisfied in cash or by posting permissible securities held by the subsidiaries subject to the agreements. Aratings downgrade of three ratings levels from the ratings levels as of December 31, 2013 (relating to financial strength ratings in certaincases and credit ratings in other cases) would result in estimated additional collateral posting requirements or payments under suchagreements of approximately $68 million. The amount of collateral required to be posted for derivative agreements is also dependent on thefair value of the derivative positions as of the balance sheet date. For additional information regarding the potential impacts of a ratingsdowngrade on our derivative agreements see Note 21 to our Consolidated Financial Statements. In addition, a ratings downgrade by A.M.Best to “A-” for our domestic life insurance companies would require Prudential Insurance to post a letter of credit in the amount ofapproximately $1.6 billion, based on the level of statutory reserves related to the variable annuity business acquired from Allstate, that weestimate would result in annual cash outflows of approximately $9 million, or collateral posting in the form of cash or securities to be heldin a trust. We believe that the posting of such collateral would not be a material liquidity event for Prudential Insurance.
In view of the difficulties experienced in recent years by many financial institutions, the rating agencies have heightened the level ofscrutiny that they apply to such institutions, have increased the frequency and scope of their credit reviews, have requested additionalinformation from the companies that they rate, and may adjust upward the capital and other requirements employed in the rating agencymodels for maintenance of certain ratings levels, such as the financial strength ratings currently held by our life insurance subsidiaries. Inaddition, actions we might take to access third party financing or to realign our capital structure may in turn cause rating agencies toreevaluate our ratings.
The following is a summary of the significant changes or actions in our ratings and rating outlooks that have occurred from January 1,2013 through February 27, 2014.
On May 9, 2013, A.M. Best affirmed Prudential Financial’s long-term senior debt rating at “a-” and short-term debt rating at “AMB-1”. A.M. Best also affirmed the “A+” financial strength ratings of Prudential’s core subsidiaries, including Prudential Insurance, PrudentialAnnuities Life Assurance Corporation, and Prudential Retirement Insurance and Annuity Company, with stable outlooks.
On July 11, 2013, Moody’s upgraded the long-term senior debt rating of Prudential Financial from “Baa2” to “Baa1”. Moody’s alsoupgraded the financial strength ratings of our domestic subsidiaries including Prudential Insurance, Prudential Retirement Insurance andAnnuity Company, and Pruco Life Insurance Company from “A2” to “A1”. In addition, Moody’s upgraded Prudential Funding’s short-term debt rating from “P-2” to “P-1” and long-term debt rating from “A3” to “A2”. All ratings were assigned stable outlooks.
On July 25, 2013, Fitch affirmed Prudential Financial’s long-term senior debt rating at “A-”. Fitch also affirmed the financial strengthratings of our U.S. operating entities at “A+”.
On December 11, 2013, S&P affirmed the long-term senior debt rating of Prudential Financial at “A” and the financial strength ratingsof Prudential’s core subsidiaries at “AA-”. All U.S. ratings have stable outlooks, while our Japanese subsidiaries have negative outlooksdue to a negative outlook on the Japan sovereign rating.
94 Prudential Financial, Inc. 2013 Annual Report

Contractual Obligations
The table below summarizes the future estimated cash payments related to certain contractual obligations as of December 31, 2013.The estimated payments reflected in this table are based on management’s estimates and assumptions about these obligations. Becausethese estimates and assumptions are necessarily subjective, the actual cash outflows in future periods will vary, possibly materially, fromthose reflected in the table. In addition, we do not believe that our cash flow requirements can be adequately assessed based solely upon ananalysis of these obligations, as the table below does not contemplate all aspects of our cash inflows, such as the level of cash flowgenerated by certain of our investments, nor all aspects of our cash outflows.
Estimated Payments Due by Period
Total 2014 2015-2016 2017-20182018 andthereafter
(in millions)Short-term and long-term debt obligations(1) . . . . . . . . . . . . . . . . . . . . . . . . . . . . . . . . . . . $ 46,691 $ 3,880 $ 7,017 $ 6,171 $ 29,623Operating lease obligations(2) . . . . . . . . . . . . . . . . . . . . . . . . . . . . . . . . . . . . . . . . . . . . . . . 509 140 172 107 90Purchase obligations:
Commitments to purchase or fund investments(3) . . . . . . . . . . . . . . . . . . . . . . . . . . . . 5,461 3,704 829 455 473Commercial mortgage loan commitments(4) . . . . . . . . . . . . . . . . . . . . . . . . . . . . . . . . 2,365 1,379 405 160 421
Other liabilities:Insurance liabilities(5) . . . . . . . . . . . . . . . . . . . . . . . . . . . . . . . . . . . . . . . . . . . . . . . . . 1,251,950 47,928 79,721 81,810 1,042,491Other(6) . . . . . . . . . . . . . . . . . . . . . . . . . . . . . . . . . . . . . . . . . . . . . . . . . . . . . . . . . . . . 13,018 12,976 38 4 0
Total . . . . . . . . . . . . . . . . . . . . . . . . . . . . . . . . . . . . . . . . . . . . . . . . . . . . . . . . . . . $1,319,994 $70,007 $88,182 $88,707 $1,073,098
(1) The estimated payments due by period for long-term debt reflects the contractual maturities of principal, as disclosed in Note 14 to the ConsolidatedFinancial Statements, as well as estimated future interest payments. The payment of principal and estimated future interest for short-term debt are reflectedin estimated payments due in less than one year. The estimate for future interest payments includes the effect of derivatives that qualify for hedgeaccounting treatment. See Note 14 to the Consolidated Financial Statements for additional information concerning our short-term and long-term debt.
(2) The estimated payments due by period for operating leases reflect the future minimum lease payments under non-cancelable operating leases, asdisclosed in Note 23 to the Consolidated Financial Statements. We have no significant capital lease obligations.
(3) As discussed in Note 23 to the Consolidated Financial Statements, we have commitments to purchase or fund investments, some of which arecontingent upon events or circumstances not under our control, including those at the discretion of our counterparties. The timing of the fulfillment ofcertain of these commitments cannot be estimated, therefore the settlement of these obligations are reflected in estimated payments due in less than oneyear. Commitments to purchase or fund investments include $0.274 billion that we anticipate will ultimately be funded from our separate accounts.
(4) As discussed in Note 23 to the Consolidated Financial Statements, loan commitments of our commercial mortgage operations, which are legally bindingcommitments to extend credit to a counterparty, have been reflected in the contractual obligations table above principally based on the expiration date ofthe commitment; however, it is possible these loan commitments could be funded prior to their expiration. In certain circumstances the counterpartymay also extend the date of the expiration in exchange for a fee.
(5) The estimated payments due by period for insurance liabilities reflect future estimated cash payments to be made to policyholders and others for futurepolicy benefits, policyholders’ account balances, policyholder’s dividends, reinsurance payables and separate account liabilities, net of reinsurancerecoverables. These future estimated cash outflows are based on mortality, morbidity, lapse and other assumptions comparable with our experience,consider future premium receipts on current policies in force, and assume market growth and interest crediting consistent with assumptions used inamortizing deferred acquisition costs and value of business acquired. These cash outflows are undiscounted with respect to interest and, as a result, thesum of the cash outflows shown for all years in the table of $1,252 billion exceeds the corresponding liability amounts of $636 billion included in theConsolidated Financial Statements as of December 31, 2013. Separate account liabilities are legally insulated from general account obligations, and it isgenerally expected these liabilities will be fully funded by separate account assets and their related cash flows. We have made significant assumptions todetermine the future estimated cash outflows related to the underlying policies and contracts. Due to the significance of the assumptions used, actualcash outflows will differ, possibly materially, from these estimates.
(6) The estimated payments due by period for other liabilities includes securities sold under agreements to repurchase, cash collateral for loaned securities,liabilities for unrecognized tax benefits, bank customer liabilities, and other miscellaneous liabilities. Amounts presented in the table also exclude$3.302 billion of notes of consolidated VIE’s which recourse for these obligations is limited to the assets of the respective VIE and do not have recourseto the general credit of the company.
We also enter into agreements to purchase goods and services in the normal course of business; however, these purchase obligationsare not material to our consolidated results of operations or financial position as of December 31, 2013.
Off-Balance Sheet Arrangements
Guarantees and Other ContingenciesIn the course of our business, we provide certain guarantees and indemnities to third parties pursuant to which we may be contingently
required to make payments in the future. See “Commitments and Guarantees” within Note 23 to the Consolidated Financial Statements foradditional information.
Other Contingent CommitmentsWe also have other commitments, some of which are contingent upon events or circumstances not under our control, including those
at the discretion of our counterparties. See “Commitments and Guarantees” within Note 23 to the Consolidated Financial Statements foradditional information regarding these commitments. For further discussion of certain of these commitments that relate to our separateaccounts, also see “—Liquidity associated with other activities—Asset Management operations.”
Other Off-Balance Sheet ArrangementsIn November 2013, we entered into a put option agreement with a Delaware trust that gives Prudential Financial the right, at any time
over a ten-year period, to issue up to $1.5 billion of senior notes to the trust in return for principal and interest strips of U.S. Treasurysecurities that are held by the trust. See “Liquidity and Capital Resources—Alternative Sources of Liquidity” for more information on this
Prudential Financial, Inc. 2013 Annual Report 95

put option agreement. Other than this put option agreement, we do not have retained or contingent interests in assets transferred tounconsolidated entities, or variable interests in unconsolidated entities or other similar transactions, arrangements or relationships that serveas credit, liquidity or market risk support, that we believe are reasonably likely to have a material effect on our financial condition, changesin financial condition, revenues or expenses, results of operations, liquidity, capital expenditures or our access to or requirements for capitalresources. In addition, other than the put option agreement referred to above, we do not have relationships with any unconsolidated entitiesthat are contractually limited to narrow activities that facilitate our transfer of or access to associated assets.
Risk Management
OverviewWe employ a risk governance structure, overseen by senior management and our Board of Directors and managed by Enterprise Risk
Management (“ERM”), to provide a framework for evaluating the risks embedded in and across our businesses, managing these risks andidentifying current and future risk challenges and opportunities.
Risk Governance FrameworkEach of our businesses has a risk governance structure that is supported by a framework at the corporate level. Generally, our
businesses are authorized to make day-to-day risk decisions that are consistent with enterprise risk policies and limits, and subject toenterprise oversight. The governance structure described in this section is designed to support this framework.
Board of Directors’ Role in Risk ManagementOur Board of Directors oversees the Company’s risk profile and management’s processes for assessing and managing risk. Certain
specific categories of risk are assigned to Board committees that report back to the full Board, as summarized below:
• Audit Committee: oversees risks related to operational risks, financial controls, legal, regulatory and compliance risks, and theoverall risk management governance structure and risk management function.
• Finance Committee: oversees risks involving the Company’s capital structure, including borrowing, liquidity, allocation of capital,major capital transactions and expenditures, funding of benefit plans and statutory insurance reserves. It also oversees the strengthof the finance function. The Finance Committee approves the Company’s annual capital plan and operating plan, as recommendedby our Chief Financial Officer. The Finance Committee also receives regular updates on the sources and uses of capital relative toplan, as well as on our Capital Protection Framework.
• Investment Committee: oversees investment and market risk and the strength of the investment function. The InvestmentCommittee approves investment and market risk limits for Prudential Financial and for Prudential Insurance’s general accountbased on asset class, issuer, credit quality and geography.
• Compensation Committee: oversees our compensation programs so that incentives are aligned with appropriate risk taking.
Management CommitteesOur primary risk management committee is the Enterprise Risk Committee (“ERC”). The ERC is chaired by our Chief Risk Officer
and otherwise comprised of the Vice Chairman, Chief Operating Officers for the U.S. and International Businesses, General Counsel, ChiefFinancial Officer, Chief Investment Officer and Chief Actuary. The ERC’s mandate is to review significant risks that impact the Companyand approve our risk management policies and limits to keep the risk profile of the Company consistent with its strategy.
The ERC is supported by five Risk Oversight Committees, each of which is comprised of subject matter experts and dedicated to oneof the following risk types: investment risk, market risk, insurance risk, operational risk and model risk. These Risk Oversight Committeesreport their activities to the ERC, and significant matters or matters where there are unresolved points of view are reviewed and brought tothe ERC. The Risk Oversight Committees provide an opportunity to evaluate complex issues by subject matter experts within the variousrisk areas. They evaluate the adequacy and effectiveness of risk mitigation options, identify stakeholders of risks and issues, reviewmaterial risk assumptions for reasonability and consistency across the Company and, working with the different risk areas, developrecommendations for risk limits, among other responsibilities.
Each of our business units and significant corporate functions maintains its own risk committee. The business unit risk committees serve asa forum for leaders within each business unit to identify, assess and resolve risk and exposure issues and to review new products and initiatives,prior to such issues being reviewed by the Risk Oversight Committees and/or the ERC as appropriate. Corporate function risk committees assessand monitor risks associated with performing the relevant corporate functions, set standards and exercise oversight over specific risks.
Risk Identification and MonitoringBased on the array of financial and non-financial risks to which we are exposed, we have an authorization process for risk taking and
requirements for risk measurement and reporting. We use a variety of tools and processes to assess risk, such as quantitative tools formeasurable financial risks and qualitative assessments for non-financial risks, such as certain operational risks.
Beginning with the development of material new products or services, we complete a risk assessment which may lead to changes indesign features, terms, pricing, investment strategy or the use of other risk mitigation techniques to affect the risk/reward dynamics for theproduct or service. We also weigh risk decisions against the impact to our reputation and our ability to achieve our ratings objectives.
Risk ExposureWe classify our risks into five general categories: investment risk, market risk, insurance risk, operational risk (which includes legal,
regulatory and technology risk) and model risk. In addition, we are exposed to reputational risk, which underlies, and is a part of, each riskassessment.
For information on risk as it relates to our capital and liquidity, see “—Liquidity and Capital Resources.”
96 Prudential Financial, Inc. 2013 Annual Report

Investment Risk ManagementWe view investment risk as the risk of loss on fixed maturity investments due to default or deterioration in credit quality, or loss on
equity or real estate investments due to deterioration in value. Our exposure to investment risk is primarily comprised of:
• the risk that we will not receive contractual payments on a timely basis on fixed maturity investments (i.e., credit default risk);
• the risk that our fixed maturity investments lose value due to a deterioration of credit quality (for example, the probability of defaultrises or the likelihood of recovery on a default deteriorates);
• the risk that a counterparty on derivatives, securities lending, reinsurance or other transactions does not meet its contractualobligations to us; and
• the risk that values of our non-coupon, equity and/or real estate equity investments decline.
With general account fixed maturities of $290 billion as of December 31, 2013, Prudential Financial is exposed to significant creditrisk. Our Asset Management units have long experience managing public and private fixed income asset classes for both our generalaccount and for third party investors. To manage this risk, we have a set of risk limits in place, including enterprise-level risk limits set bythe Investment Committee of the Board of Directors. These limits are delineated into formal Investment Policy Statements which set limitson asset classes, permissible instruments, individual issuer, industry/sector and geographic exposures by individual legal entities, segmentsand business units. Compliance with most of these limits is measured on a daily basis, with some limits measured monthly or quarterly. Inaddition, our credit research departments closely monitor our credit exposures and maintain watch lists of exposures where there is a risk ofimpairment. If we have concerns about credit for a public exposure, we may sell some or all of that exposure or hedge the exposure withcredit derivatives. See “—General Account Investments” for further information on our general account portfolio, including thecomposition of our fixed maturity portfolio by industry category and credit quality.
We also monitor our equity, real estate equity and other non-coupon investment exposures on an ongoing basis, and our risk andportfolio management functions review these portfolios quarterly.
Market Risk ManagementMarket risk is defined as the risk of loss resulting from change in the value of assets, liabilities or derivative instruments as a result of
absolute or relative changes in factors affecting financial markets, such as changes in interest rates, equity prices, foreign currencyexchange rates and credit spreads.
Our exposure is primarily comprised of:
• Interest rate risk: our primary exposure arises within our insurance and annuities operations when changes in interest rates causechanges in asset and liability values that do not offset. For further information, see “—General Account Investments—Managementof Investments” above.
• Credit spread risk: our investment portfolio includes corporate debt issuance which, in addition to creating credit risk from potentialdefault and migration, introduces risk of value loss when market spreads widen.
• Equity price risk: our primary exposure arises within our Annuities segment when equity price changes move the value ofembedded derivatives associated with variable annuities’ living benefit features without creating offsetting changes in the value ofequity based derivatives hedging these benefits. Secondarily, we are exposed to risk from the impact of equity market price declinesthat are not actively hedged on guaranteed minimum death benefits and guaranteed minimum income benefits. In addition, we aresubject to changes in value on equity securities held in our general account and to lost fees from separate accounts and other fundsunder management when equity markets decline.
• Foreign currency exchange rate risk: with significant operations outside the U.S., particularly in Japan, our primary exposure arises whenchanges in foreign currency rates impact our U.S. dollar-equivalent earnings and equity in these operations. For further information, see“—International Insurance Division—Foreign Currency Exchange Rate Movements and Related Hedging Strategies” above. In addition,we are subject to changes in the value of investments denominated in foreign currencies held in our general account.
We actively monitor and manage concentration risks at the enterprise level to support diversification efforts. For additionalinformation on our exposure to market risk, including how this risk is managed, see Item 7A. “Quantitative and Qualitative DisclosuresAbout Market Risk.”
Insurance RiskWe define insurance risk as the risk of loss due to deviations in experience compared to our assumptions. Our exposure is primarily
comprised of:
• Mortality risk, or the risk that death claims are greater than expected, primarily within our Individual Life, Group Insurance andInternational Insurance segments;
• Longevity risk, or the risk that policyholders survive longer than expected, primarily within our Individual Annuities, Retirementand International Insurance segments;
• Morbidity risk, or the risk that health claims from sickness or disability are greater than expected, primarily within our GroupInsurance and International Insurance segments as well as from long term care policies within Divested Businesses; and
• Policyholder behavior risk, or the risk that our customers’ persistency experience or utilization experience differs from our expectations.
Underwriting insurance risk is a fundamental part of our business. We believe our scale provides for the benefits of diversification,both within an insurance risk type (potentially enhancing predictability of experience) and across insurance risk types (for example, tosome extent, mortality risk provides a natural hedge against longevity risk). Insurance risk mitigation begins with product design, as well as
Prudential Financial, Inc. 2013 Annual Report 97

underwriting and pricing standards at the business unit level with corporate oversight. In some cases, the availability and/or credibility ofpolicyholder behavior experience may be limited, which we strive to reflect in the product design and pricing of the product. We providecorporate oversight of the material insurance risk assumptions utilized in pricing and setting reserves.
Operational Risk
Operational risk is defined as the risk of direct or indirect loss resulting from inadequate or failed internal processes and systems,employee actions, or as the result of external events. Operational risks are broad in scope and evident in each business unit and corporatefunction. We are exposed to operational risk in many ways, including, but not limited to:
• Legal and regulatory compliance
• Improper sales practices
• Fraud (internal and external)
• Reputational risk
• Employee risk
• Technology risk, including system failures and processing errors
• Financial reporting errors
• Extreme events, such as loss of people and/or infrastructure caused by natural disasters, terrorism, disease, etc.
• Information risk
• Vendor risk
Each of our businesses and corporate functions is expected to manage its operational risks in compliance with enterprise standards.Our framework for identifying, evaluating, monitoring and managing operational risk includes: risk management committees; key riskindicators; risk and control assessments; loss event data collection and analysis; scenario analysis; and resolution of control issues. We alsohave enterprise policies and standards, including: Legal and Regulatory/Compliance Policies, such as those relating to sales practices andsupervision, fraud prevention, safeguarding of personal information, protection and use of material non-public information, personalconflicts of interest and outside business activities, anti-money laundering, and gifts and entertainment; Human Resources Policies, such asthose relating to hiring, training and terminating the employment of our associates and succession planning; and Information Technologypolicies, including those on systems development and information security. We also maintain policies and standards to support the effectivemanagement of operational risk, including those concerning new product development, business continuation and disaster recovery,enterprise crisis management, and vendor governance. Our Internal Audit Department independently audits key operational controls on aperiodic basis to assess the effectiveness of our framework.
We are also exposed to emerging risks, that is, those conditions, situations or trends that may significantly impact us in the future. By nature,these risks involve a high degree of uncertainty. ERM, together with our businesses, monitors and evaluates emerging risks on a regular basis.
Model Risk
Models are utilized by our businesses and corporate functions primarily in projecting future cash flows associated with pricingproducts, calculating reserves and valuing assets, as well as in evaluating risk and determining capital requirements, among other uses. Asour businesses continue to grow and evolve, the number and complexity of models we utilize expands, increasing our exposure to error inthe design, implementation or use of models, including the associated input data and assumptions. We are mitigating this risk byimplementing our Model Risk Policy, which outlines the governance and control requirements over the implementation and use of models,and through the activities of our Model Risk Oversight Committee which provides oversight and guidance on issues relating to model riskand the management of that risk.
For further information on the risks to which the Company is exposed, see “Risk Factors” included in Prudential Financial’s 2013Annual Report on Form 10-K.
98 Prudential Financial, Inc. 2013 Annual Report

QUANTITATIVE AND QUALITATIVE DISCLOSURES ABOUT MARKET RISK
Market RiskMarket risk is defined as the risk of loss resulting from change in the value of assets, liabilities or derivative instruments as a result of
absolute or relative changes in factors affecting financial markets, such as changes in interest rates, equity prices, foreign currencyexchange rates and credit spreads.
To varying degrees, the investment activities supporting all of our products and services generate exposure to market risk. Theprimary source of our exposure to market risk is “other than trading” activities conducted primarily in our insurance and annuityoperations. The market risk incurred and our strategies for managing this risk vary by product. The market risk associated with “trading”activities is immaterial.
For additional information regarding the potential impacts of interest rate and other market fluctuations, as well as general economic andmarket conditions on our businesses and profitability, see “Risk Factors” included in Prudential Financial’s 2013 Annual Report on Form 10-K.For additional information regarding the overall management of our general account investments and our asset mix strategies, see“Management’s Discussion and Analysis of Financial Condition and Results of Operations—General Account Investments—Management ofInvestments” above. For additional information regarding our liquidity and capital resources, which may be impacted by changing market risks,see “Management’s Discussion and Analysis of Financial Condition and Results of Operations—Liquidity and Capital Resources” above.
Market Risk ManagementRisk management includes the identification and measurement of various forms of risk, the establishment of risk thresholds and the creation
of processes intended to maintain risks within these thresholds while optimizing returns on the underlying assets or liabilities. Risk range limits areestablished for each type of market risk, and are approved by the Investment Committee of the Board of Directors and subject to ongoing review.
Our risk management process utilizes a variety of tools and techniques, including:
• Measures of price sensitivity to market changes (e.g., interest rates, equity index prices, foreign exchange, credit spreads)
• Value-at-Risk, or “VaR” measures
• Asset/liability management analytics
• Stress scenario testing
• Hedging programs
• Risk management governance, including policies, limits and a market risk oversight committee. For additional informationregarding our overall risk management framework and governance structure, see “Management’s Discussion and Analysis ofFinancial Condition and Results of Operations—Risk Management” above.
Market Risk MitigationRisk mitigation takes three primary forms:
1. Managing assets to liability-based limits on net exposure. For example, investment policies identify target durations for assetsbased on liability characteristics and asset portfolios are managed to ranges around them. This mitigates potential unanticipatedeconomic losses from interest rate movements.
2. Hedging non-strategic exposures. For example, our investment policies generally require hedging currency risk for all cash flowsnot offset by similarly denominated liabilities.
3. Management of portfolio concentration risk. For example, ongoing monitoring and management at the enterprise level of keyrate, currency and other concentration risks support diversification efforts to mitigate exposure to individual markets and sourcesof liquidity strain.
Market Risk Related to Interest RatesAssets that subject us to interest rate risk primarily include fixed maturity securities, commercial mortgage and other loans and policy
loans. Liabilities that subject us to interest rate risk primarily include policyholder account balances relating to interest-sensitive lifeinsurance, annuity and other investment-type contracts, as well as through outstanding short-term and long-term debt. Changes in interestrates create risk that the resulting changes in asset values will differ from the changes in the value of the liabilities relating to the underlyingor hedged products. Derivatives that subject us to interest rate risk primarily include interest rate swaps, forwards, futures and options.Additionally, changes in interest rates may impact other items including, but not limited to, the following:
• Net investment spread between the amounts that we are required to pay and the rate of return we are able to earn on investments forcertain products supported by general account investments
• Asset-based fees earned on assets under management or contractholder account values
• Estimated total gross profits and the amortization of deferred policy acquisition and other costs
• Net exposure to the guarantees provided under certain products
• Capital levels of our regulated entities
We use duration and convexity analyses to measure price sensitivity to interest rate changes. Duration measures the relative sensitivityof the fair value of a financial instrument to changes in interest rates. Convexity measures the rate of change of duration with respect tochanges in interest rates. We use asset/liability management and derivative strategies to manage our interest rate exposure by legal entity bymatching the relative sensitivity of asset and liability values to interest rate changes, or controlling “duration mismatch” of assets andliabilities. We have duration mismatch constraints tailored to the rate sensitivity of products in each entity. In certain markets, primarilyoutside the U.S. and Japan, capital market limitations that hinder our ability to acquire assets that approximate the duration of some of our
Prudential Financial, Inc. 2013 Annual Report 99

liabilities are considered in setting the limits. As of December 31, 2013 and 2012, the difference between the duration of assets and thetarget duration of liabilities in our duration-managed portfolios was within our limits. We consider risk-based capital and tax implicationsas well as current market conditions in our asset/liability management strategies.
We assess the impact of interest rate movements on the value of our financial assets, financial liabilities and derivatives usinghypothetical test scenarios that assume either upward or downward 100 basis point parallel shifts in the yield curve from prevailing interestrates, reflecting changes in either credit spreads or the risk-free rate. The following table sets forth the net estimated potential loss in fairvalue on these financial instruments from a hypothetical 100 basis point upward shift as of December 31, 2013 and 2012. This table ispresented on a gross basis and excludes offsetting impacts to insurance liabilities that are not considered financial liabilities under U.SGAAP. This scenario results in the greatest net exposure to interest rate risk of the hypothetical scenarios tested at those dates. While the testscenario is for illustrative purposes only and does not reflect our expectations regarding future interest rates or the performance of fixed-income markets, it is a near-term, reasonably possible hypothetical change that illustrates the potential impact of such events. These testscenarios do not measure the changes in value that could result from non-parallel shifts in the yield curve which we would expect to producedifferent changes in discount rates for different maturities. As a result, the actual loss in fair value from a 100 basis point change in interestrates could be different from that indicated by these calculations. The estimated changes in fair values do not include separate account assets.
As of December 31, 2013 As of December 31, 2012
NotionalFair
Value
HypotheticalChange in Fair
Value NotionalFair
Value
HypotheticalChange in Fair
Value
(in millions)Financial assets with interest rate risk:
Fixed maturities(1) . . . . . . . . . . . . . . . . . . . . . . . . . . . . . . . . . . . $314,015 $(25,834) $ 326,489 $(27,238)Commercial mortgage and other loans . . . . . . . . . . . . . . . . . . . 42,805 (1,850) 39,716 (1,658)Policy loans(2) . . . . . . . . . . . . . . . . . . . . . . . . . . . . . . . . . . . . . . 11,766 0 14,592 (902)Derivatives:
Swaps . . . . . . . . . . . . . . . . . . . . . . . . . . . . . . . . . . . . . . . . . $150,079 (2,228) (3,710) $132,661 3,766 (4,818)Futures . . . . . . . . . . . . . . . . . . . . . . . . . . . . . . . . . . . . . . . . 15,125 5 14 13,267 (166) 21Options . . . . . . . . . . . . . . . . . . . . . . . . . . . . . . . . . . . . . . . . 85,249 477 344 68,099 1,330 (188)Forwards . . . . . . . . . . . . . . . . . . . . . . . . . . . . . . . . . . . . . . . 15,306 206 (61) 15,937 (60) (31)Synthetic GICs(3) . . . . . . . . . . . . . . . . . . . . . . . . . . . . . . . 60,758 8 0 64,359 6 (2)Variable annuity and other living benefit feature
embedded derivatives(4) . . . . . . . . . . . . . . . . . . . . . . . . (441) 3,097 (3,348) 3,295Financial liabilities with interest rate risk(5):
Short-term and long-term debt . . . . . . . . . . . . . . . . . . . . . . . . . . (28,286) 2,392 (30,003) 2,473Limited recourse notes issued by consolidated VIEs(6) . . . . . . (39) 0 (224) 0Investment contracts . . . . . . . . . . . . . . . . . . . . . . . . . . . . . . . . . . (96,600) 3,410 (104,200) 3,730
Net estimated potential loss . . . . . . . . . . . . . . . . . . . . . . . . $(22,198) $(25,318)
(1) Includes fixed maturities classified as “trading account assets supporting insurance liabilities” and other fixed maturities classified as trading securitiesunder U.S. GAAP, but are held for “other than trading” activities in our segments that offer insurance, retirement and annuities products.
(2) In the fourth quarter of 2013, we implemented a change in valuation methodology regarding policy loans. For additional information, see Note 20 to theConsolidated Financial Statements.
(3) Prior period’s notional amount is presented on a basis consistent with the current period presentation.(4) Reflects only the gross change on the embedded derivatives, and excludes any offsetting impact of derivative instruments purchased to hedge such
changes.(5) Excludes approximately $248 billion and $249 billion as of December 31, 2013 and December 31, 2012, respectively, of insurance reserve and deposit
liabilities which are not considered financial liabilities. We believe that the interest rate sensitivities of these insurance liabilities would serve as anoffset to the net interest rate risk of the financial assets and liabilities, including investment contracts.
(6) See Note 5 to the Consolidated Financial Statements for additional information regarding consolidated variable interest entities (VIEs).
Our net estimated potential loss in fair value as of December 31, 2013 decreased from December 31, 2012, primarily reflecting adecrease in our fixed maturity securities portfolio in 2013, driven by the translation impact of the yen weakening against the U.S. dollar andan increase in U.S. interest rates, as well as a decrease in the fair value of derivatives also driven by an increase in U.S. interest rates. For adiscussion of changes in derivatives, see “Derivatives” below.
Under U.S. GAAP, the fair value of the embedded derivatives for certain variable annuity and other living benefit features, reflected inthe table above, includes the impact of the market’s perception of our own non-performance risk (“NPR”). The additional credit spreadover LIBOR rates incorporated into the discount rate as of December 31, 2013, to reflect NPR in the valuation of these embeddedderivatives, ranged from 8 to 109 basis points.
The following table provides a demonstration of the sensitivity of these embedded derivatives to our NPR credit spread by quantifyingthe adjustments that would be required assuming both a 50 basis point parallel increase and decrease in our NPR credit spreads. While theinformation below is for illustrative purposes only and does not reflect our expectations regarding our credit spreads, it is a near-term,reasonably possible change that illustrates the potential impact of such a change. This information considers only the direct effect ofchanges in our credit spread on operating results due to the change in these embedded derivatives, and not changes in any otherassumptions such as persistency, utilization and mortality, or the effect of these changes on DAC or other balances.
December 31, 2013 December 31, 2012
(Increase) /Decrease inEmbedded Derivative Liability
(Increase) /Decrease inEmbedded Derivative Liability
(in millions)Increase in credit spread by 50 basis points . . . . . . . . . . . . . . . . . . . . . . . . . . . . . . . . . $ 548 $ 933Decrease in credit spread by 50 basis points . . . . . . . . . . . . . . . . . . . . . . . . . . . . . . . . . $(769) $(1,177)
For an additional discussion of our variable annuity optional living benefit guarantees accounted for as embedded derivatives andrelated derivatives used to hedge the changes in fair value of these embedded derivatives, see “Market Risk Related to Certain Variable
100 Prudential Financial, Inc. 2013 Annual Report

Annuity Products” below. For additional information about the key estimates and assumptions used in our determination of fair value, seeNote 20 to the Consolidated Financial Statements below. For information on the impacts of a sustained low interest rate environment, see“Management’s Discussion and Analysis of Financial Condition and Results of Operations—Executive Summary—Industry Trends—Impact of a Low Interest Rate Environment” above.
Market Risk Related to Equity PricesWe have exposure to equity price risk through our investments in equity securities, equity-based derivatives and certain variable
annuity and other living benefit feature embedded derivatives. Our equity-based derivatives primarily hedge the equity price risk embeddedin the living benefit feature embedded derivatives, and are also part of our capital hedging program. Changes in equity prices create riskthat the resulting changes in asset values will differ from the changes in the value of the liabilities relating to the underlying or hedgedproducts. Additionally, changes in equity prices may impact other items including, but not limited to, the following:
• Asset-based fees earned on assets under management or contractholder account value• Estimated total gross profits and the amortization of deferred policy acquisition and other costs• Net exposure to the guarantees provided under certain products
We manage investment equity price risk against benchmarks in respective markets. We benchmark our return on equity holdingsagainst a blend of market indices, mainly the S&P 500 and Russell 2000 for U.S. equities. We benchmark foreign equities against theTokyo Price Index, or TOPIX, and the MSCI EAFE, a market index of European, Australian, and Far Eastern equities. We target pricesensitivities that approximate those of the benchmark indices.
We estimate our investment equity price risk from a hypothetical 10% decline in equity benchmark market levels and measure this risk interms of the decline in fair market value of equity securities we hold. The following table sets forth the net estimated potential loss in fair valuefrom such a decline as of December 31, 2013 and 2012. While these scenarios are for illustrative purposes only and do not reflect ourexpectations regarding future performance of equity markets or of our equity portfolio, they represent near term reasonably possible hypotheticalchanges that illustrate the potential impact of such events. These scenarios consider only the direct impact on fair value of declines in equitybenchmark market levels and not changes in asset-based fees recognized as revenue, changes in our estimates of total gross profits used as a basisfor amortizing deferred policy acquisition and other costs, or changes in any other assumptions such as market volatility or mortality, utilizationor persistency rates in our variable annuity contracts that could also impact the fair value of our living benefit features. In addition, thesescenarios do not reflect the impact of basis risk, such as potential differences in the performance of the investment funds underlying the variableannuity products relative to the market indices we use as a basis for developing our hedging strategy. The impact of basis risk could result inlarger differences between the change in fair value of the equity-based derivatives and the related living benefit features in comparison to thescenarios above. In calculating these amounts, we exclude separate account equity securities.
As of December 31, 2013 As of December 31, 2012
Notional Fair Value
HypotheticalChange inFair Value Notional Fair Value
HypotheticalChange inFair Value
(in millions)Equity securities(1) . . . . . . . . . . . . . . . . . . . . . . . . . . . . . . . . . . . . . . . . $12,287 $(1,229) $10,754 $(1,075)Equity-based derivatives(2) . . . . . . . . . . . . . . . . . . . . . . . . . . . . . . . . . $72,953 (78) 1,170 $55,054 248 1,504Variable annuity and other living benefit feature embedded
derivatives(2)(3) . . . . . . . . . . . . . . . . . . . . . . . . . . . . . . . . . . . . . . . . (441) (852) (3,348) (1,052)
Net estimated potential loss . . . . . . . . . . . . . . . . . . . . . . . . . . . . . $ (911) $ (623)
(1) Includes equity securities classified as “trading account assets supporting insurance liabilities” and other equity securities classified as trading securitiesunder U.S. GAAP, but are held for “other than trading” activities in our segments that offer insurance, retirement and annuities products.
(2) The notional and fair value of equity-based derivatives and the fair value of variable annuity and other living benefit feature embedded derivatives arealso reflected in amounts under “Market Risk Related to Interest Rates” above, and are not cumulative.
(3) Reflects only the gross change on the embedded derivatives, and excludes any offsetting impact of derivative instruments purchased to hedge suchchanges.
Net estimated potential loss increased by $288 million. The estimated equity price risk associated with the living benefit featuresaccounted for as embedded derivatives decreased due to a decline in the value of the liability; however, this was more than offset by acorresponding change in equity-based derivatives used to hedge these features. For a discussion of changes in derivatives, see“Derivatives” below. For an additional discussion of our variable annuity optional living benefit guarantees accounted for as embeddedderivatives and related derivatives used to hedge the changes in fair value of these embedded derivatives, see “Market Risk Related toCertain Variable Annuity Products” below. For additional information regarding our capital hedging program, see “Management’sDiscussion and Analysis of Financial Condition and Results of Operations—Liquidity and Capital Resources” below.
Market Risk Related to Foreign Currency Exchange RatesAs a U.S.-based company with significant business operations outside the U.S., particularly in Japan, we are exposed to foreign
currency exchange rate risk related to these operations, as well as to our general account investment portfolio and other proprietary-investment portfolios.
For our international insurance operations, changes in foreign currency exchange rates create risk that we may experience volatility inthe U.S. dollar-equivalent earnings and equity of these operations. We actively manage this risk through various hedging strategies,including the use of foreign currency hedges and through holding U.S. dollar-denominated securities in the investment portfolios of certainof these operations. Separately, our Japanese insurance operations offer a variety of non-yen denominated products which are supported byinvestments in corresponding currencies. While these non-yen denominated assets are economically matched, the accounting differs forchanges in the value of these assets and liabilities due to moves in foreign currency exchange rates, resulting in volatility in reportedU.S. GAAP earnings. For further information, see “Management’s Discussion and Analysis of Financial Condition and Results ofOperations—International Insurance Division—Impact of foreign currency exchange rate movements on earnings—U.S. GAAP earningsimpact of products denominated in non-local currencies” above.
Prudential Financial, Inc. 2013 Annual Report 101

For our domestic general account investment portfolios supporting our U.S. insurance operations and other proprietary-investmentportfolios, our foreign currency exchange rate risk arises primarily from investments that are denominated in foreign currencies. Wemanage this risk by hedging substantially all domestic foreign currency-denominated fixed-income investments into U.S. dollars. Wegenerally do not hedge all of the foreign currency risk of our investments in equity securities of unaffiliated foreign entities.
We manage our foreign currency exchange rate risks within specified limits, and by using VaR-based analysis. This statisticaltechnique estimates, at a specified confidence level, the potential pre-tax loss in portfolio market value that could occur over an assumedtime horizon due to adverse market movements. For the unhedged portions of our equity investment in international subsidiaries and theforeign currency-denominated investments held in our domestic general account portfolio, we estimate the hypothetical decline in VaR, aswell as the average VaR, each measured at a 95% confidence level and using a one-month time horizon. These calculations use historicalprice volatilities and correlation data at a 95% confidence level. The following table sets forth these measures as of the periods indicated.
As of December 31, 2013 As of December 31, 2012
FairValue
EstimatedVaR
AverageVaR
FairValue
EstimatedVaR
AverageVaR
(in millions)Unhedged portion of equity investment in international subsidiaries and foreign
currency-denominated investments in domestic general account portfolio(1) . . . . . $5,202 $(99) $(115) $4,373 $(79) $(101)
(1) Excludes assets and liabilities subject to the impact of foreign exchange rate movements that are hedged with externally-purchased derivatives or areeconomically matched, as discussed above.
The increase in VaR as of December 31, 2013 was driven by a higher level of foreign exchange rate volatility. For derivatives used tohedge the anticipated level of U.S. dollar-equivalent earnings of our international operations, the estimated hypothetical decline in VaR,measured at a 95% confidence level and using a one-month time horizon, was $68 million and $81 million as of December 31, 2013 andDecember 31, 2012, respectively. For additional information, see “Management’s Discussion and Analysis of Financial Condition andResults of Operations—General Account Investments—Portfolio Composition” and “Management’s Discussion and Analysis of FinancialCondition and Results of Operations—Results of Operations for Financial Services Businesses by Segment—International InsuranceDivision” above.
Although VaR models are a recognized tool for risk management, they have inherent limitations, including reliance on historical datathat may not be indicative of future market conditions or trading patterns. Accordingly, VaR models should not be viewed as a predictor offuture results. We may incur losses that could be materially in excess of the amounts indicated by the models on a particular trading day orover a period of time, and there have been instances when results have fallen outside the values generated by our VaR models. A VaRmodel does not estimate the greatest possible loss. The results of these models and analysis thereof are subject to the judgment of our riskmanagement personnel.
DerivativesWe use derivative financial instruments primarily to reduce market risk from changes in interest rates, equity prices and foreign
currency exchange rates, including their use to alter interest rate or foreign currency exposures arising from mismatches between assets andliabilities. Our derivatives primarily include swaps, futures, options and forward contracts that are exchange-traded or contracted in theover-the-counter market.
Our derivatives also include interest rate guarantees we provide on our synthetic GIC products. Synthetic GICs simulate theperformance of traditional insurance-related GICs but are accounted for as derivatives under U.S. GAAP due to the fact that thepolicyholders own the underlying assets, and we only provide a book value “wrap” on the customers’ funds, which are held in a client-owned trust. Since these wraps provide payment of guaranteed principal and interest to the customer, changes in interest rates create riskthat declines in the market value of customers’ funds would increase our net exposure to these guarantees; however, this risk is minimaldue to several mitigating factors. Our obligation is limited to payments that are in excess of the existing customers’ fund value.Additionally, we have the ability to periodically reset crediting rates, subject to a 0% minimum floor, as well as the ability to increaseprices. Further, our contract provisions provide that, although participants may withdraw funds at book value, contractholder withdrawalsmay only occur at market value immediately, or at book value over time. These factors, among others, result in these contractsexperiencing minimal changes in fair value, despite a more significant notional value.
Our derivatives also include those that are embedded in certain financial instruments, and primarily relate to certain optional livingbenefit features associated with our variable annuity products, as discussed in more detail in “Market Risk Related to Certain VariableAnnuity Products” below.
The notional amount of derivative instruments increased $33 billion in 2013, from $294 billion as of December 31, 2012 to $327billion as of December 31, 2013. The increase was primarily related to our variable annuity hedging activities and our capital hedgeprogram. For additional information on our derivative activities, see Note 21 to the Consolidated Financial Statements below.
Market Risk Related to Certain Variable Annuity ProductsThe primary risk exposures of our variable annuity contracts relate to actual deviations from, or changes to, the assumptions used in
the original pricing of these products, including capital markets assumptions, such as equity market returns, interest rates and marketvolatility and actuarial assumptions. For our capital markets assumptions, we hedge or limit our exposure to the risk created by capitalmarkets fluctuations through a combination of product design elements, such as an automatic rebalancing element and inclusion of certainoptional living benefits in our living benefits hedging program. Certain variable annuity optional living benefit features are accounted for asan embedded derivative and recorded at fair value. The market risk sensitivities associated with U.S. GAAP values of both the embeddedderivatives and the related derivatives used to hedge the changes in fair value of these embedded derivatives are provided under “MarketRisk Related to Interest Rates” and “Market Risk Related to Equity Prices” above.
For additional information regarding our risk management strategies, including our living benefit hedging program and other productdesign elements, see “Management’s Discussion and Analysis of Financial Condition and Results of Operations—Results of Operations forFinancial Services Businesses by Segment—Individual Annuities” above.
102 Prudential Financial, Inc. 2013 Annual Report

CONSOLIDATED FINANCIAL STATEMENTS
Management’s Annual Report on Internal Control Over Financial Reporting
Management of Prudential Financial, Inc. (together with its consolidated subsidiaries, the “Company”) is responsible for establishingand maintaining adequate internal control over financial reporting. Management conducted an assessment of the effectiveness, as ofDecember 31, 2013, of the Company’s internal control over financial reporting, based on the framework established in Internal Control—Integrated Framework (1992) issued by the Committee of Sponsoring Organizations of the Treadway Commission (COSO). Based on ourassessment under that framework, management concluded that the Company’s internal control over financial reporting was effective as ofDecember 31, 2013.
Our internal control over financial reporting is a process designed by or under the supervision of our principal executive and principalfinancial officers to provide reasonable assurance regarding the reliability of financial reporting and the preparation of financial statementsfor external purposes in accordance with generally accepted accounting principles. Our internal control over financial reporting includespolicies and procedures that (1) pertain to the maintenance of records that, in reasonable detail, accurately and fairly reflect transactions anddispositions of assets; (2) provide reasonable assurance that transactions are recorded as necessary to permit preparation of financialstatements in accordance with generally accepted accounting principles, and that receipts and expenditures are being made only inaccordance with authorizations of management and the directors of the Company; and (3) provide reasonable assurance regardingprevention or timely detection of unauthorized acquisition, use, or disposition of the Company’s assets that could have a material effect onour financial statements.
Because of its inherent limitations, internal control over financial reporting may not prevent or detect misstatements. Also, projectionsof any evaluation of effectiveness to future periods are subject to the risk that controls may become inadequate because of changes inconditions, or that the degree of compliance with the policies or procedures may deteriorate.
The effectiveness of the Company’s internal control over financial reporting as of December 31, 2013 has been audited byPricewaterhouseCoopers LLP, an independent registered public accounting firm, as stated in their report appearing herein.
February 27, 2014
Prudential Financial, Inc. 2013 Annual Report 103

Report of Independent Registered Public Accounting Firm
To the Board of Directors and Stockholders ofPrudential Financial, Inc.:
In our opinion, the accompanying consolidated statements of financial position and the related consolidated statements of operations,comprehensive income, equity and cash flows present fairly, in all material respects, the financial position of Prudential Financial, Inc. andits subsidiaries at December 31, 2013 and December 31, 2012, and the results of their operations and their cash flows for each of the threeyears in the period ended December 31, 2013 in conformity with accounting principles generally accepted in the United States of America.Also in our opinion, the Company maintained, in all material respects, effective internal control over financial reporting as of December 31,2013, based on criteria established in the Internal Control—Integrated Framework (1992) issued by the Committee of SponsoringOrganizations of the Treadway Commission (“COSO”). The Company’s management is responsible for these financial statements andfinancial statement schedules, for maintaining effective internal control over financial reporting and for its assessment of the effectivenessof internal control over financial reporting, included in Management’s Annual Report on Internal Control over Financial Reporting. Ourresponsibility is to express opinions on these financial statements, on the financial statement schedules, and on the Company’s internalcontrol over financial reporting based on our integrated audits. We conducted our audits in accordance with the standards of the PublicCompany Accounting Oversight Board (United States). Those standards require that we plan and perform the audits to obtain reasonableassurance about whether the financial statements are free of material misstatement and whether effective internal control over financialreporting was maintained in all material respects. Our audits of the financial statements included examining, on a test basis, evidencesupporting the amounts and disclosures in the financial statements, assessing the accounting principles used and significant estimates madeby management, and evaluating the overall financial statement presentation. Our audit of internal control over financial reporting includedobtaining an understanding of internal control over financial reporting, assessing the risk that a material weakness exists, and testing andevaluating the design and operating effectiveness of internal control based on the assessed risk. Our audits also included performing suchother procedures as we considered necessary in the circumstances. We believe that our audits provide a reasonable basis for our opinions.
Our audits were conducted for the purpose of forming an opinion on the consolidated financial statements taken as a whole. Theaccompanying supplemental combining financial information is presented for the purposes of additional analysis of the consolidatedfinancial statements rather than to present the financial position and results of operations of the individual components. Such supplementalinformation has been subjected to the auditing procedures applied in the audits of the consolidated financial statements and, in our opinion,is fairly stated in all material respects in relation to the consolidated financial statements taken as a whole.
As discussed in Note 2 to the consolidated financial statements, in 2013 the Company changed, retrospectively, the manner in which itaccounts for performance-based incentive fee revenue.
A company’s internal control over financial reporting is a process designed to provide reasonable assurance regarding the reliability offinancial reporting and the preparation of financial statements for external purposes in accordance with generally accepted accountingprinciples. A company’s internal control over financial reporting includes those policies and procedures that (i) pertain to the maintenanceof records that, in reasonable detail, accurately and fairly reflect the transactions and dispositions of the assets of the company; (ii) providereasonable assurance that transactions are recorded as necessary to permit preparation of financial statements in accordance with generallyaccepted accounting principles, and that receipts and expenditures of the company are being made only in accordance with authorizationsof management and directors of the company; and (iii) provide reasonable assurance regarding prevention or timely detection ofunauthorized acquisition, use, or disposition of the company’s assets that could have a material effect on the financial statements.
Because of its inherent limitations, internal control over financial reporting may not prevent or detect misstatements. Also, projections ofany evaluation of effectiveness to future periods are subject to the risk that controls may become inadequate because of changes inconditions, or that the degree of compliance with the policies or procedures may deteriorate.
New York, New YorkFebruary 27, 2014
104 Prudential Financial, Inc. 2013 Annual Report

PRUDENTIAL FINANCIAL, INC.
Consolidated Statements of Financial PositionDecember 31, 2013 and 2012 (in millions, except share amounts)
2013 2012
ASSETSFixed maturities, available-for-sale, at fair value (amortized cost: 2013 – $268,727; 2012 – $277,654)(1) . . . . . . . . . . . . . . . . . $286,866 $301,336Fixed maturities, held-to-maturity, at amortized cost (fair value: 2013 – $3,553; 2012 – $4,511)(1) . . . . . . . . . . . . . . . . . . . . . . 3,312 4,268Trading account assets supporting insurance liabilities, at fair value(1) . . . . . . . . . . . . . . . . . . . . . . . . . . . . . . . . . . . . . . . . . . . . . 20,827 20,590Other trading account assets, at fair value(1) . . . . . . . . . . . . . . . . . . . . . . . . . . . . . . . . . . . . . . . . . . . . . . . . . . . . . . . . . . . . . . . . . 6,453 6,328Equity securities, available-for-sale, at fair value (cost: 2013 – $7,003; 2012 – $6,759) . . . . . . . . . . . . . . . . . . . . . . . . . . . . . . . . 9,910 8,277Commercial mortgage and other loans (includes $158 and $162 measured at fair value under the fair value option at
December 31, 2013 and December 31, 2012, respectively)(1) . . . . . . . . . . . . . . . . . . . . . . . . . . . . . . . . . . . . . . . . . . . . . . . . . . 41,008 36,733Policy loans . . . . . . . . . . . . . . . . . . . . . . . . . . . . . . . . . . . . . . . . . . . . . . . . . . . . . . . . . . . . . . . . . . . . . . . . . . . . . . . . . . . . . . . . . . . 11,766 11,575Other long-term investments (includes $873 and $465 measured at fair value under the fair value option at December 31,
2013 and December 31, 2012, respectively)(1) . . . . . . . . . . . . . . . . . . . . . . . . . . . . . . . . . . . . . . . . . . . . . . . . . . . . . . . . . . . . . 10,328 10,028Short-term investments . . . . . . . . . . . . . . . . . . . . . . . . . . . . . . . . . . . . . . . . . . . . . . . . . . . . . . . . . . . . . . . . . . . . . . . . . . . . . . . . . . 7,703 6,447
Total investments . . . . . . . . . . . . . . . . . . . . . . . . . . . . . . . . . . . . . . . . . . . . . . . . . . . . . . . . . . . . . . . . . . . . . . . . . . . . . . 398,173 405,582Cash and cash equivalents(1) . . . . . . . . . . . . . . . . . . . . . . . . . . . . . . . . . . . . . . . . . . . . . . . . . . . . . . . . . . . . . . . . . . . . . . . . . . . . . 11,439 18,100Accrued investment income(1) . . . . . . . . . . . . . . . . . . . . . . . . . . . . . . . . . . . . . . . . . . . . . . . . . . . . . . . . . . . . . . . . . . . . . . . . . . . . 3,089 3,127Deferred policy acquisition costs . . . . . . . . . . . . . . . . . . . . . . . . . . . . . . . . . . . . . . . . . . . . . . . . . . . . . . . . . . . . . . . . . . . . . . . . . . 16,512 14,100Value of business acquired . . . . . . . . . . . . . . . . . . . . . . . . . . . . . . . . . . . . . . . . . . . . . . . . . . . . . . . . . . . . . . . . . . . . . . . . . . . . . . . 3,675 3,248Other assets(1) . . . . . . . . . . . . . . . . . . . . . . . . . . . . . . . . . . . . . . . . . . . . . . . . . . . . . . . . . . . . . . . . . . . . . . . . . . . . . . . . . . . . . . . . . 13,833 11,824Separate account assets . . . . . . . . . . . . . . . . . . . . . . . . . . . . . . . . . . . . . . . . . . . . . . . . . . . . . . . . . . . . . . . . . . . . . . . . . . . . . . . . . . 285,060 253,254
TOTAL ASSETS . . . . . . . . . . . . . . . . . . . . . . . . . . . . . . . . . . . . . . . . . . . . . . . . . . . . . . . . . . . . . . . . . . . . . . . . . . . . . . $731,781 $709,235
LIABILITIES AND EQUITYLIABILITIESFuture policy benefits . . . . . . . . . . . . . . . . . . . . . . . . . . . . . . . . . . . . . . . . . . . . . . . . . . . . . . . . . . . . . . . . . . . . . . . . . . . . . . . . . . . $206,859 $216,050Policyholders’ account balances(1) . . . . . . . . . . . . . . . . . . . . . . . . . . . . . . . . . . . . . . . . . . . . . . . . . . . . . . . . . . . . . . . . . . . . . . . . . 136,657 134,413Policyholders’ dividends . . . . . . . . . . . . . . . . . . . . . . . . . . . . . . . . . . . . . . . . . . . . . . . . . . . . . . . . . . . . . . . . . . . . . . . . . . . . . . . . . 5,515 7,507Securities sold under agreements to repurchase . . . . . . . . . . . . . . . . . . . . . . . . . . . . . . . . . . . . . . . . . . . . . . . . . . . . . . . . . . . . . . . 7,898 5,818Cash collateral for loaned securities . . . . . . . . . . . . . . . . . . . . . . . . . . . . . . . . . . . . . . . . . . . . . . . . . . . . . . . . . . . . . . . . . . . . . . . . 5,040 3,941Income taxes . . . . . . . . . . . . . . . . . . . . . . . . . . . . . . . . . . . . . . . . . . . . . . . . . . . . . . . . . . . . . . . . . . . . . . . . . . . . . . . . . . . . . . . . . . 5,422 8,512Short-term debt . . . . . . . . . . . . . . . . . . . . . . . . . . . . . . . . . . . . . . . . . . . . . . . . . . . . . . . . . . . . . . . . . . . . . . . . . . . . . . . . . . . . . . . . 2,669 2,484Long-term debt . . . . . . . . . . . . . . . . . . . . . . . . . . . . . . . . . . . . . . . . . . . . . . . . . . . . . . . . . . . . . . . . . . . . . . . . . . . . . . . . . . . . . . . . 23,553 24,729Other liabilities(1) . . . . . . . . . . . . . . . . . . . . . . . . . . . . . . . . . . . . . . . . . . . . . . . . . . . . . . . . . . . . . . . . . . . . . . . . . . . . . . . . . . . . . . 13,925 11,838Notes issued by consolidated variable interest entities (includes $3,254 and $1,406 measured at fair value under the fair value
option at December 31, 2013 and December 31, 2012, respectively)(1) . . . . . . . . . . . . . . . . . . . . . . . . . . . . . . . . . . . . . . . . . . 3,302 1,577Separate account liabilities . . . . . . . . . . . . . . . . . . . . . . . . . . . . . . . . . . . . . . . . . . . . . . . . . . . . . . . . . . . . . . . . . . . . . . . . . . . . . . . 285,060 253,254
Total liabilities . . . . . . . . . . . . . . . . . . . . . . . . . . . . . . . . . . . . . . . . . . . . . . . . . . . . . . . . . . . . . . . . . . . . . . . . . . . . . . . . . 695,900 670,123
COMMITMENTS AND CONTINGENT LIABILITIES (See Note 23)
EQUITYPreferred Stock ($.01 par value; 10,000,000 shares authorized; none issued) . . . . . . . . . . . . . . . . . . . . . . . . . . . . . . . . . . . . . . . . 0 0Common Stock ($.01 par value; 1,500,000,000 shares authorized; 660,111,319 and 660,111,307 shares issued at
December 31, 2013 and December 31, 2012, respectively) . . . . . . . . . . . . . . . . . . . . . . . . . . . . . . . . . . . . . . . . . . . . . . . . . . . . 6 6Class B Stock ($.01 par value; 10,000,000 shares authorized; 2,000,000 shares issued and outstanding at December 31, 2013
and December 31, 2012, respectively) . . . . . . . . . . . . . . . . . . . . . . . . . . . . . . . . . . . . . . . . . . . . . . . . . . . . . . . . . . . . . . . . . . . . 0 0Additional paid-in capital . . . . . . . . . . . . . . . . . . . . . . . . . . . . . . . . . . . . . . . . . . . . . . . . . . . . . . . . . . . . . . . . . . . . . . . . . . . . . . . . 24,475 24,380Common Stock held in treasury, at cost (199,056,067 and 197,077,940 shares at December 31, 2013 and December 31, 2012,
respectively) . . . . . . . . . . . . . . . . . . . . . . . . . . . . . . . . . . . . . . . . . . . . . . . . . . . . . . . . . . . . . . . . . . . . . . . . . . . . . . . . . . . . . . . . (12,415) (12,163)Accumulated other comprehensive income (loss) . . . . . . . . . . . . . . . . . . . . . . . . . . . . . . . . . . . . . . . . . . . . . . . . . . . . . . . . . . . . . . 8,681 10,214Retained earnings . . . . . . . . . . . . . . . . . . . . . . . . . . . . . . . . . . . . . . . . . . . . . . . . . . . . . . . . . . . . . . . . . . . . . . . . . . . . . . . . . . . . . . 14,531 16,066
Total Prudential Financial, Inc. equity . . . . . . . . . . . . . . . . . . . . . . . . . . . . . . . . . . . . . . . . . . . . . . . . . . . . . . . . . . . . . . . . . . 35,278 38,503
Noncontrolling interests . . . . . . . . . . . . . . . . . . . . . . . . . . . . . . . . . . . . . . . . . . . . . . . . . . . . . . . . . . . . . . . . . . . . . . . . . . . . . . . . . 603 609
Total equity . . . . . . . . . . . . . . . . . . . . . . . . . . . . . . . . . . . . . . . . . . . . . . . . . . . . . . . . . . . . . . . . . . . . . . . . . . . . . . . . . . . . . . . 35,881 39,112
TOTAL LIABILITIES AND EQUITY . . . . . . . . . . . . . . . . . . . . . . . . . . . . . . . . . . . . . . . . . . . . . . . . . . . . . . . . . . . . . . . . $731,781 $709,235
(1) See Note 5 for details of balances associated with variable interest entities.
See Notes to Consolidated Financial Statements
Prudential Financial, Inc. 2013 Annual Report 105

PRUDENTIAL FINANCIAL, INC.
Consolidated Statements of OperationsYears Ended December 31, 2013, 2012 and 2011 (in millions, except per share amounts)
2013 2012 2011
REVENUESPremiums . . . . . . . . . . . . . . . . . . . . . . . . . . . . . . . . . . . . . . . . . . . . . . . . . . . . . . . . . . . . . . . . . . . . . . . . . . . . . . . . . . . . . . . . $26,237 $65,354 $24,301Policy charges and fee income . . . . . . . . . . . . . . . . . . . . . . . . . . . . . . . . . . . . . . . . . . . . . . . . . . . . . . . . . . . . . . . . . . . . . . . 5,415 4,489 3,924Net investment income . . . . . . . . . . . . . . . . . . . . . . . . . . . . . . . . . . . . . . . . . . . . . . . . . . . . . . . . . . . . . . . . . . . . . . . . . . . . . 14,729 13,661 13,124Asset management fees and other income . . . . . . . . . . . . . . . . . . . . . . . . . . . . . . . . . . . . . . . . . . . . . . . . . . . . . . . . . . . . . . . 286 2,784 4,905Realized investment gains (losses), net:
Other-than-temporary impairments on fixed maturity securities . . . . . . . . . . . . . . . . . . . . . . . . . . . . . . . . . . . . . (1,055) (1,611) (2,202)Other-than-temporary impairments on fixed maturity securities transferred to Other Comprehensive
Income . . . . . . . . . . . . . . . . . . . . . . . . . . . . . . . . . . . . . . . . . . . . . . . . . . . . . . . . . . . . . . . . . . . . . . . . . . . . . . . . 856 1,274 1,667Other realized investment gains (losses), net . . . . . . . . . . . . . . . . . . . . . . . . . . . . . . . . . . . . . . . . . . . . . . . . . . . . (5,007) (1,104) 3,366
Total realized investment gains (losses), net . . . . . . . . . . . . . . . . . . . . . . . . . . . . . . . . . . . . . . . . . . . . . . . . . (5,206) (1,441) 2,831
Total revenues . . . . . . . . . . . . . . . . . . . . . . . . . . . . . . . . . . . . . . . . . . . . . . . . . . . . . . . . . . . . . . . . . . . . . . . . . . . . . . . . 41,461 84,847 49,085
BENEFITS AND EXPENSESPolicyholders’ benefits . . . . . . . . . . . . . . . . . . . . . . . . . . . . . . . . . . . . . . . . . . . . . . . . . . . . . . . . . . . . . . . . . . . . . . . . . . . . . 26,733 65,131 23,614Interest credited to policyholders’ account balances . . . . . . . . . . . . . . . . . . . . . . . . . . . . . . . . . . . . . . . . . . . . . . . . . . . . . . . 3,111 4,234 4,484Dividends to policyholders . . . . . . . . . . . . . . . . . . . . . . . . . . . . . . . . . . . . . . . . . . . . . . . . . . . . . . . . . . . . . . . . . . . . . . . . . . 2,050 2,176 2,723Amortization of deferred policy acquisition costs . . . . . . . . . . . . . . . . . . . . . . . . . . . . . . . . . . . . . . . . . . . . . . . . . . . . . . . . . 240 1,504 2,695General and administrative expenses . . . . . . . . . . . . . . . . . . . . . . . . . . . . . . . . . . . . . . . . . . . . . . . . . . . . . . . . . . . . . . . . . . 11,011 11,094 10,605
Total benefits and expenses . . . . . . . . . . . . . . . . . . . . . . . . . . . . . . . . . . . . . . . . . . . . . . . . . . . . . . . . . . . . . . . . . . . . . . 43,145 84,139 44,121
INCOME (LOSS) FROM CONTINUING OPERATIONS BEFORE INCOME TAXES AND EQUITY INEARNINGS OF OPERATING JOINT VENTURES . . . . . . . . . . . . . . . . . . . . . . . . . . . . . . . . . . . . . . . . . . . . . . . . . (1,684) 708 4,964
Income taxes:Current . . . . . . . . . . . . . . . . . . . . . . . . . . . . . . . . . . . . . . . . . . . . . . . . . . . . . . . . . . . . . . . . . . . . . . . . . . . . . . . . . . . . . . 34 1,088 447Deferred . . . . . . . . . . . . . . . . . . . . . . . . . . . . . . . . . . . . . . . . . . . . . . . . . . . . . . . . . . . . . . . . . . . . . . . . . . . . . . . . . . . . . (1,092) (875) 1,068
Total income tax expense (benefit) . . . . . . . . . . . . . . . . . . . . . . . . . . . . . . . . . . . . . . . . . . . . . . . . . . . . . . . . . . . . (1,058) 213 1,515
INCOME (LOSS) FROM CONTINUING OPERATIONS BEFORE EQUITY IN EARNINGS OFOPERATING JOINT VENTURES . . . . . . . . . . . . . . . . . . . . . . . . . . . . . . . . . . . . . . . . . . . . . . . . . . . . . . . . . . . . . . . . (626) 495 3,449
Equity in earnings of operating joint ventures, net of taxes . . . . . . . . . . . . . . . . . . . . . . . . . . . . . . . . . . . . . . . . . . . . . . . . . 59 60 182
INCOME (LOSS) FROM CONTINUING OPERATIONS . . . . . . . . . . . . . . . . . . . . . . . . . . . . . . . . . . . . . . . . . . . . . . (567) 555 3,631Income (loss) from discontinued operations, net of taxes . . . . . . . . . . . . . . . . . . . . . . . . . . . . . . . . . . . . . . . . . . . . . . . . . . . 7 15 35
NET INCOME (LOSS) . . . . . . . . . . . . . . . . . . . . . . . . . . . . . . . . . . . . . . . . . . . . . . . . . . . . . . . . . . . . . . . . . . . . . . . . . . . . (560) 570 3,666Less: Income (loss) attributable to noncontrolling interests . . . . . . . . . . . . . . . . . . . . . . . . . . . . . . . . . . . . . . . . . . . . . . . . . 107 50 34
NET INCOME (LOSS) ATTRIBUTABLE TO PRUDENTIAL FINANCIAL, INC . . . . . . . . . . . . . . . . . . . . . . . . . . $ (667) $ 520 $ 3,632
EARNINGS PER SHARE (See Note 16)Financial Services Businesses
Basic earnings per share—Common Stock:Income (loss) from continuing operations attributable to Prudential Financial, Inc. . . . . . . . . . . . . . . . . . . . . . . $ (1.57) $ 1.02 $ 7.14Income (loss) from discontinued operations, net of taxes . . . . . . . . . . . . . . . . . . . . . . . . . . . . . . . . . . . . . . . . . . . 0.02 0.04 0.07
Net income (loss) attributable to Prudential Financial, Inc. . . . . . . . . . . . . . . . . . . . . . . . . . . . . . . . . . . . . . . . . . $ (1.55) $ 1.06 $ 7.21
Diluted earnings per share—Common Stock:Income (loss) from continuing operations attributable to Prudential Financial, Inc. . . . . . . . . . . . . . . . . . . . . . . $ (1.57) $ 1.01 $ 7.05Income (loss) from discontinued operations, net of taxes . . . . . . . . . . . . . . . . . . . . . . . . . . . . . . . . . . . . . . . . . . . 0.02 0.04 0.07
Net income (loss) attributable to Prudential Financial, Inc. . . . . . . . . . . . . . . . . . . . . . . . . . . . . . . . . . . . . . . . . . $ (1.55) $ 1.05 $ 7.12
Dividends declared per share of Common Stock . . . . . . . . . . . . . . . . . . . . . . . . . . . . . . . . . . . . . . . . . . . . . . . . . . . . . $ 1.73 $ 1.60 $ 1.45
Closed Block BusinessBasic and Diluted earnings per share—Class B Stock:
Income (loss) from continuing operations attributable to Prudential Financial, Inc. . . . . . . . . . . . . . . . . . . . . . . $ 22.00 $ 11.50 $ 61.00Income (loss) from discontinued operations, net of taxes . . . . . . . . . . . . . . . . . . . . . . . . . . . . . . . . . . . . . . . . . . . 0.00 (1.00) 0.00
Net income (loss) attributable to Prudential Financial, Inc. . . . . . . . . . . . . . . . . . . . . . . . . . . . . . . . . . . . . . . . . . $ 22.00 $ 10.50 $ 61.00
Dividends declared per share of Class B Stock . . . . . . . . . . . . . . . . . . . . . . . . . . . . . . . . . . . . . . . . . . . . . . . . . . . . . . . $ 9.625 $ 9.625 $ 9.625
See Notes to Consolidated Financial Statements
106 Prudential Financial, Inc. 2013 Annual Report

PRUDENTIAL FINANCIAL, INC.
Consolidated Statements of Comprehensive IncomeYears Ended December 31, 2013, 2012 and 2011 (in millions)
2013 2012 2011
NET INCOME (LOSS) . . . . . . . . . . . . . . . . . . . . . . . . . . . . . . . . . . . . . . . . . . . . . . . . . . . . . . . . . $ (560) $ 570 $3,666Other comprehensive income (loss), before tax:
Foreign currency translation adjustments for the period . . . . . . . . . . . . . . . . . . . . . . . . . . . . . (1,487) (263) 315Net unrealized investment gains (losses) . . . . . . . . . . . . . . . . . . . . . . . . . . . . . . . . . . . . . . . . . (1,528) 8,632 3,834Defined benefit pension and postretirement unrecognized periodic benefit . . . . . . . . . . . . . . 874 (699) (297)
Total . . . . . . . . . . . . . . . . . . . . . . . . . . . . . . . . . . . . . . . . . . . . . . . . . . . . . . . . . . . . . . . . . (2,141) 7,670 3,852
Less:Income tax expense (benefit) related to other comprehensive income (loss) . . . . . . . . . (582) 2,667 1,301
Other comprehensive income (loss), net of taxes . . . . . . . . . . . . . . . . . . . . . . . . . . . . . . . . . . . . . . (1,559) 5,003 2,551
Comprehensive Income (loss) . . . . . . . . . . . . . . . . . . . . . . . . . . . . . . . . . . . . . . . . . . . . . . . . . . . . . (2,119) 5,573 6,217Less: Comprehensive income (loss) attributable to noncontrolling interests . . . . . . . . . . . . . 81 84 (10)
Comprehensive income (loss) attributable to Prudential Financial, Inc. . . . . . . . . . . . . . . . . . $(2,200) $5,489 $6,227
See Notes to Consolidated Financial Statements
Prudential Financial, Inc. 2013 Annual Report 107

PRUDENTIAL FINANCIAL, INC.
Consolidated Statements of Equity(1)Years Ended December 31, 2013, 2012 and 2011 (in millions)
CommonStock
AdditionalPaid-inCapital
RetainedEarnings
CommonStock
Held InTreasury
AccumulatedOther
ComprehensiveIncome (Loss)
TotalPrudential
Financial, Inc.Equity
NoncontrollingInterests
TotalEquity
Balance, December 31, 2010 . . . . . . . . . . . . . . . . $6 $24,223 $13,829 $(11,173) $ 2,650 $29,535 $ 513 $30,048Impact of adoption of accounting changes . . . . . . (189) (189) (41) (230)Common Stock acquired . . . . . . . . . . . . . . . . . . . . (999) (999) (999)Common Stock issued . . . . . . . . . . . . . . . . . . . . . .Contributions from noncontrolling interests . . . . . 9 9Distributions to noncontrolling interests . . . . . . . . (15) (15)Consolidations/(deconsolidations) of
noncontrolling interests . . . . . . . . . . . . . . . . . . . 53 53Stock-based compensation programs . . . . . . . . . . . 70 (58) 252 264 264Dividends declared on Common Stock . . . . . . . . . . (689) (689) (689)Dividends declared on Class B Stock . . . . . . . . . . (19) (19) (19)Comprehensive income:
Net income . . . . . . . . . . . . . . . . . . . . . . . . . . . 3,632 3,632 34 3,666Other comprehensive income, net of tax . . . . 2,595 2,595 (44) 2,551
Total comprehensive income (loss) . . . . . . . . . . . . 6,227 (10) 6,217
Balance, December 31, 2011 . . . . . . . . . . . . . . . . 6 24,293 16,506 (11,920) 5,245 34,130 509 34,639Common Stock acquired . . . . . . . . . . . . . . . . . . . . (650) (650) (650)Common Stock issued . . . . . . . . . . . . . . . . . . . . . .Contributions from noncontrolling interests . . . . . 4 4Distributions to noncontrolling interests . . . . . . . . (85) (85)Consolidations/(deconsolidations) of
noncontrolling interests . . . . . . . . . . . . . . . . . . . 97 97Stock-based compensation programs . . . . . . . . . . . 87 (192) 407 302 302Dividends declared on Common Stock . . . . . . . . . . (749) (749) (749)Dividends declared on Class B Stock . . . . . . . . . . (19) (19) (19)Comprehensive income:
Net income . . . . . . . . . . . . . . . . . . . . . . . . . . . 520 520 50 570Other comprehensive income, net of tax . . . . 4,969 4,969 34 5,003
Total comprehensive income (loss) . . . . . . . . . . . . 5,489 84 5,573
Balance, December 31, 2012 . . . . . . . . . . . . . . . . 6 24,380 16,066 (12,163) 10,214 38,503 609 39,112Common Stock acquired . . . . . . . . . . . . . . . . . . . . (750) (750) (750)Common Stock issued . . . . . . . . . . . . . . . . . . . . . .Contributions from noncontrolling interests . . . . . 4 4Distributions to noncontrolling interests . . . . . . . . (113) (113)Consolidations/(deconsolidations) of
noncontrolling interests . . . . . . . . . . . . . . . . . . . 22 22Stock-based compensation programs . . . . . . . . . . . 95 (39) 498 554 554Dividends declared on Common Stock . . . . . . . . . . (810) (810) (810)Dividends declared on Class B Stock . . . . . . . . . . (19) (19) (19)Comprehensive income:
Net income . . . . . . . . . . . . . . . . . . . . . . . . . . . (667) (667) 107 (560)Other comprehensive income, net of tax . . . . (1,533) (1,533) (26) (1,559)
Total comprehensive income (loss) . . . . . . . . . . . . (2,200) 81 (2,119)
Balance, December 31, 2013 . . . . . . . . . . . . . . . . $6 $24,475 $14,531 $(12,415) $ 8,681 $35,278 $ 603 $35,881
(1) Class B Stock is not presented as the amounts are immaterial.
See Notes to Consolidated Financial Statements
108 Prudential Financial, Inc. 2013 Annual Report
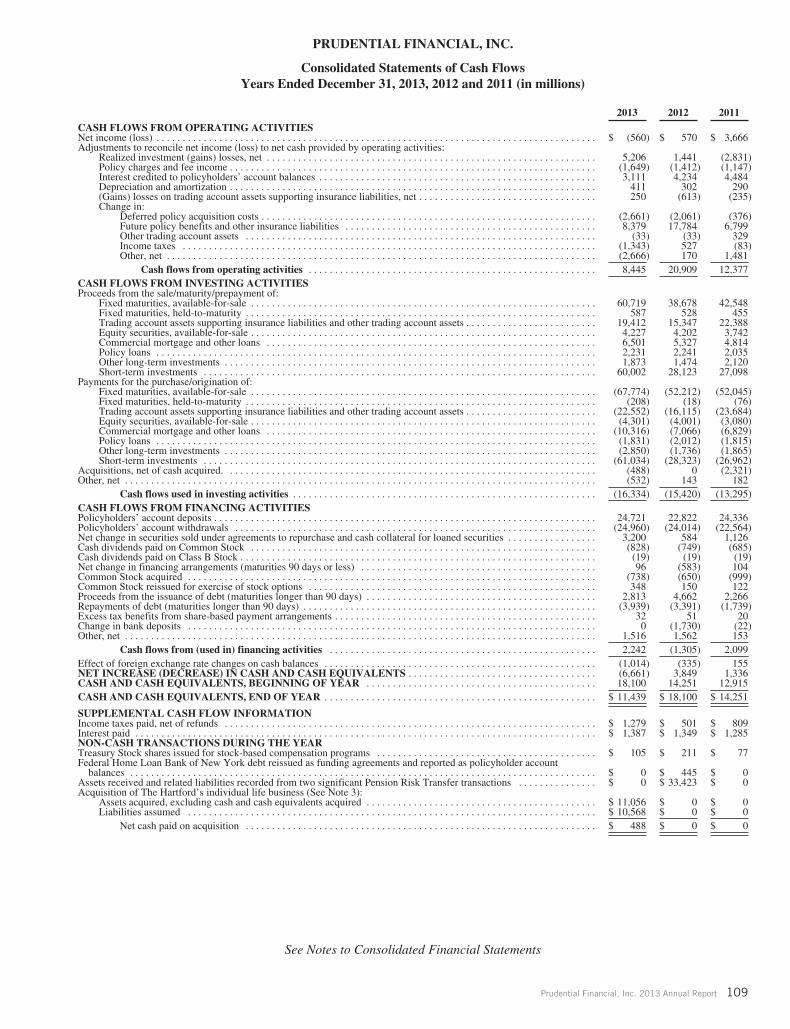
PRUDENTIAL FINANCIAL, INC.
Consolidated Statements of Cash FlowsYears Ended December 31, 2013, 2012 and 2011 (in millions)
2013 2012 2011
CASH FLOWS FROM OPERATING ACTIVITIESNet income (loss) . . . . . . . . . . . . . . . . . . . . . . . . . . . . . . . . . . . . . . . . . . . . . . . . . . . . . . . . . . . . . . . . . . . . . . . . . . . . . . . . . . . . $ (560) $ 570 $ 3,666Adjustments to reconcile net income (loss) to net cash provided by operating activities:
Realized investment (gains) losses, net . . . . . . . . . . . . . . . . . . . . . . . . . . . . . . . . . . . . . . . . . . . . . . . . . . . . . . . . . . . . . . . 5,206 1,441 (2,831)Policy charges and fee income . . . . . . . . . . . . . . . . . . . . . . . . . . . . . . . . . . . . . . . . . . . . . . . . . . . . . . . . . . . . . . . . . . . . . . (1,649) (1,412) (1,147)Interest credited to policyholders’ account balances . . . . . . . . . . . . . . . . . . . . . . . . . . . . . . . . . . . . . . . . . . . . . . . . . . . . . 3,111 4,234 4,484Depreciation and amortization . . . . . . . . . . . . . . . . . . . . . . . . . . . . . . . . . . . . . . . . . . . . . . . . . . . . . . . . . . . . . . . . . . . . . . 411 302 290(Gains) losses on trading account assets supporting insurance liabilities, net . . . . . . . . . . . . . . . . . . . . . . . . . . . . . . . . . . 250 (613) (235)Change in:
Deferred policy acquisition costs . . . . . . . . . . . . . . . . . . . . . . . . . . . . . . . . . . . . . . . . . . . . . . . . . . . . . . . . . . . . . . . . (2,661) (2,061) (376)Future policy benefits and other insurance liabilities . . . . . . . . . . . . . . . . . . . . . . . . . . . . . . . . . . . . . . . . . . . . . . . . 8,379 17,784 6,799Other trading account assets . . . . . . . . . . . . . . . . . . . . . . . . . . . . . . . . . . . . . . . . . . . . . . . . . . . . . . . . . . . . . . . . . . . (33) (33) 329Income taxes . . . . . . . . . . . . . . . . . . . . . . . . . . . . . . . . . . . . . . . . . . . . . . . . . . . . . . . . . . . . . . . . . . . . . . . . . . . . . . . (1,343) 527 (83)Other, net . . . . . . . . . . . . . . . . . . . . . . . . . . . . . . . . . . . . . . . . . . . . . . . . . . . . . . . . . . . . . . . . . . . . . . . . . . . . . . . . . . (2,666) 170 1,481
Cash flows from operating activities . . . . . . . . . . . . . . . . . . . . . . . . . . . . . . . . . . . . . . . . . . . . . . . . . . . . . . . 8,445 20,909 12,377CASH FLOWS FROM INVESTING ACTIVITIESProceeds from the sale/maturity/prepayment of:
Fixed maturities, available-for-sale . . . . . . . . . . . . . . . . . . . . . . . . . . . . . . . . . . . . . . . . . . . . . . . . . . . . . . . . . . . . . . . . . . 60,719 38,678 42,548Fixed maturities, held-to-maturity . . . . . . . . . . . . . . . . . . . . . . . . . . . . . . . . . . . . . . . . . . . . . . . . . . . . . . . . . . . . . . . . . . . 587 528 455Trading account assets supporting insurance liabilities and other trading account assets . . . . . . . . . . . . . . . . . . . . . . . . . 19,412 15,347 22,388Equity securities, available-for-sale . . . . . . . . . . . . . . . . . . . . . . . . . . . . . . . . . . . . . . . . . . . . . . . . . . . . . . . . . . . . . . . . . . 4,227 4,202 3,742Commercial mortgage and other loans . . . . . . . . . . . . . . . . . . . . . . . . . . . . . . . . . . . . . . . . . . . . . . . . . . . . . . . . . . . . . . . 6,501 5,327 4,814Policy loans . . . . . . . . . . . . . . . . . . . . . . . . . . . . . . . . . . . . . . . . . . . . . . . . . . . . . . . . . . . . . . . . . . . . . . . . . . . . . . . . . . . . 2,231 2,241 2,035Other long-term investments . . . . . . . . . . . . . . . . . . . . . . . . . . . . . . . . . . . . . . . . . . . . . . . . . . . . . . . . . . . . . . . . . . . . . . . 1,873 1,474 2,120Short-term investments . . . . . . . . . . . . . . . . . . . . . . . . . . . . . . . . . . . . . . . . . . . . . . . . . . . . . . . . . . . . . . . . . . . . . . . . . . . 60,002 28,123 27,098
Payments for the purchase/origination of:Fixed maturities, available-for-sale . . . . . . . . . . . . . . . . . . . . . . . . . . . . . . . . . . . . . . . . . . . . . . . . . . . . . . . . . . . . . . . . . . (67,774) (52,212) (52,045)Fixed maturities, held-to-maturity . . . . . . . . . . . . . . . . . . . . . . . . . . . . . . . . . . . . . . . . . . . . . . . . . . . . . . . . . . . . . . . . . . . (208) (18) (76)Trading account assets supporting insurance liabilities and other trading account assets . . . . . . . . . . . . . . . . . . . . . . . . . (22,552) (16,115) (23,684)Equity securities, available-for-sale . . . . . . . . . . . . . . . . . . . . . . . . . . . . . . . . . . . . . . . . . . . . . . . . . . . . . . . . . . . . . . . . . . (4,301) (4,001) (3,080)Commercial mortgage and other loans . . . . . . . . . . . . . . . . . . . . . . . . . . . . . . . . . . . . . . . . . . . . . . . . . . . . . . . . . . . . . . . (10,316) (7,066) (6,829)Policy loans . . . . . . . . . . . . . . . . . . . . . . . . . . . . . . . . . . . . . . . . . . . . . . . . . . . . . . . . . . . . . . . . . . . . . . . . . . . . . . . . . . . . (1,831) (2,012) (1,815)Other long-term investments . . . . . . . . . . . . . . . . . . . . . . . . . . . . . . . . . . . . . . . . . . . . . . . . . . . . . . . . . . . . . . . . . . . . . . . (2,850) (1,736) (1,865)Short-term investments . . . . . . . . . . . . . . . . . . . . . . . . . . . . . . . . . . . . . . . . . . . . . . . . . . . . . . . . . . . . . . . . . . . . . . . . . . . (61,034) (28,323) (26,962)
Acquisitions, net of cash acquired. . . . . . . . . . . . . . . . . . . . . . . . . . . . . . . . . . . . . . . . . . . . . . . . . . . . . . . . . . . . . . . . . . . . . . . (488) 0 (2,321)Other, net . . . . . . . . . . . . . . . . . . . . . . . . . . . . . . . . . . . . . . . . . . . . . . . . . . . . . . . . . . . . . . . . . . . . . . . . . . . . . . . . . . . . . . . . . . (532) 143 182
Cash flows used in investing activities . . . . . . . . . . . . . . . . . . . . . . . . . . . . . . . . . . . . . . . . . . . . . . . . . . . . . . . . . . (16,334) (15,420) (13,295)CASH FLOWS FROM FINANCING ACTIVITIESPolicyholders’ account deposits . . . . . . . . . . . . . . . . . . . . . . . . . . . . . . . . . . . . . . . . . . . . . . . . . . . . . . . . . . . . . . . . . . . . . . . . . 24,721 22,822 24,336Policyholders’ account withdrawals . . . . . . . . . . . . . . . . . . . . . . . . . . . . . . . . . . . . . . . . . . . . . . . . . . . . . . . . . . . . . . . . . . . . . (24,960) (24,014) (22,564)Net change in securities sold under agreements to repurchase and cash collateral for loaned securities . . . . . . . . . . . . . . . . . 3,200 584 1,126Cash dividends paid on Common Stock . . . . . . . . . . . . . . . . . . . . . . . . . . . . . . . . . . . . . . . . . . . . . . . . . . . . . . . . . . . . . . . . . . (828) (749) (685)Cash dividends paid on Class B Stock . . . . . . . . . . . . . . . . . . . . . . . . . . . . . . . . . . . . . . . . . . . . . . . . . . . . . . . . . . . . . . . . . . . . (19) (19) (19)Net change in financing arrangements (maturities 90 days or less) . . . . . . . . . . . . . . . . . . . . . . . . . . . . . . . . . . . . . . . . . . . . . 96 (583) 104Common Stock acquired . . . . . . . . . . . . . . . . . . . . . . . . . . . . . . . . . . . . . . . . . . . . . . . . . . . . . . . . . . . . . . . . . . . . . . . . . . . . . . (738) (650) (999)Common Stock reissued for exercise of stock options . . . . . . . . . . . . . . . . . . . . . . . . . . . . . . . . . . . . . . . . . . . . . . . . . . . . . . . 348 150 122Proceeds from the issuance of debt (maturities longer than 90 days) . . . . . . . . . . . . . . . . . . . . . . . . . . . . . . . . . . . . . . . . . . . . 2,813 4,662 2,266Repayments of debt (maturities longer than 90 days) . . . . . . . . . . . . . . . . . . . . . . . . . . . . . . . . . . . . . . . . . . . . . . . . . . . . . . . . (3,939) (3,391) (1,739)Excess tax benefits from share-based payment arrangements . . . . . . . . . . . . . . . . . . . . . . . . . . . . . . . . . . . . . . . . . . . . . . . . . . 32 51 20Change in bank deposits . . . . . . . . . . . . . . . . . . . . . . . . . . . . . . . . . . . . . . . . . . . . . . . . . . . . . . . . . . . . . . . . . . . . . . . . . . . . . . 0 (1,730) (22)Other, net . . . . . . . . . . . . . . . . . . . . . . . . . . . . . . . . . . . . . . . . . . . . . . . . . . . . . . . . . . . . . . . . . . . . . . . . . . . . . . . . . . . . . . . . . . 1,516 1,562 153
Cash flows from (used in) financing activities . . . . . . . . . . . . . . . . . . . . . . . . . . . . . . . . . . . . . . . . . . . . . . . . . . . 2,242 (1,305) 2,099Effect of foreign exchange rate changes on cash balances . . . . . . . . . . . . . . . . . . . . . . . . . . . . . . . . . . . . . . . . . . . . . . . . . . . . (1,014) (335) 155NET INCREASE (DECREASE) IN CASH AND CASH EQUIVALENTS . . . . . . . . . . . . . . . . . . . . . . . . . . . . . . . . . . . . (6,661) 3,849 1,336CASH AND CASH EQUIVALENTS, BEGINNING OF YEAR . . . . . . . . . . . . . . . . . . . . . . . . . . . . . . . . . . . . . . . . . . . . 18,100 14,251 12,915CASH AND CASH EQUIVALENTS, END OF YEAR . . . . . . . . . . . . . . . . . . . . . . . . . . . . . . . . . . . . . . . . . . . . . . . . . . . . $ 11,439 $ 18,100 $ 14,251
SUPPLEMENTAL CASH FLOW INFORMATIONIncome taxes paid, net of refunds . . . . . . . . . . . . . . . . . . . . . . . . . . . . . . . . . . . . . . . . . . . . . . . . . . . . . . . . . . . . . . . . . . . . . . . $ 1,279 $ 501 $ 809Interest paid . . . . . . . . . . . . . . . . . . . . . . . . . . . . . . . . . . . . . . . . . . . . . . . . . . . . . . . . . . . . . . . . . . . . . . . . . . . . . . . . . . . . . . . . $ 1,387 $ 1,349 $ 1,285NON-CASH TRANSACTIONS DURING THE YEARTreasury Stock shares issued for stock-based compensation programs . . . . . . . . . . . . . . . . . . . . . . . . . . . . . . . . . . . . . . . . . . $ 105 $ 211 $ 77Federal Home Loan Bank of New York debt reissued as funding agreements and reported as policyholder account
balances . . . . . . . . . . . . . . . . . . . . . . . . . . . . . . . . . . . . . . . . . . . . . . . . . . . . . . . . . . . . . . . . . . . . . . . . . . . . . . . . . . . . . . . . . $ 0 $ 445 $ 0Assets received and related liabilities recorded from two significant Pension Risk Transfer transactions . . . . . . . . . . . . . . . $ 0 $ 33,423 $ 0Acquisition of The Hartford’s individual life business (See Note 3):
Assets acquired, excluding cash and cash equivalents acquired . . . . . . . . . . . . . . . . . . . . . . . . . . . . . . . . . . . . . . . . . . . . $ 11,056 $ 0 $ 0Liabilities assumed . . . . . . . . . . . . . . . . . . . . . . . . . . . . . . . . . . . . . . . . . . . . . . . . . . . . . . . . . . . . . . . . . . . . . . . . . . . . . . $ 10,568 $ 0 $ 0
Net cash paid on acquisition . . . . . . . . . . . . . . . . . . . . . . . . . . . . . . . . . . . . . . . . . . . . . . . . . . . . . . . . . . . . . . . . . . . $ 488 $ 0 $ 0
See Notes to Consolidated Financial Statements
Prudential Financial, Inc. 2013 Annual Report 109

PRUDENTIAL FINANCIAL, INC.
Notes to Consolidated Financial Statements
1. BUSINESS AND BASIS OF PRESENTATION
Prudential Financial, Inc. (“Prudential Financial”) and its subsidiaries (collectively, “Prudential” or the “Company”) provide a widerange of insurance, investment management, and other financial products and services to both individual and institutional customersthroughout the United States and in many other countries. Principal products and services provided include life insurance, annuities,retirement-related services, mutual funds, and investment management. The Company has organized its principal operations into theFinancial Services Businesses and the Closed Block Business. The Financial Services Businesses operate through three operating divisions:U.S. Retirement Solutions and Investment Management, U.S. Individual Life and Group Insurance, and International Insurance. TheCompany’s businesses that are not sufficiently material to warrant separate disclosure and divested businesses, are included in Corporateand Other operations within the Financial Services Businesses. The Closed Block Business, which includes the Closed Block (see Note 12),is managed separately from the Financial Services Businesses. The Closed Block Business was established on the date of demutualizationand includes the Company’s in force participating insurance and annuity products and assets that are used for the payment of benefits andpolicyholders’ dividends on these products, as well as other assets and equity that support these products and related liabilities. Inconnection with the demutualization, the Company ceased offering these participating products.
Demutualization
On December 18, 2001 (the “date of demutualization”), The Prudential Insurance Company of America (“Prudential Insurance”)converted from a mutual life insurance company to a stock life insurance company and became an indirect, wholly-owned subsidiary ofPrudential Financial. At the time of demutualization Prudential Financial issued two classes of common stock, both of which remainoutstanding. The Common Stock, which is publicly traded, reflects the performance of the Financial Services Businesses, and the Class BStock, which was issued through a private placement, reflects the performance of the Closed Block Business.
Basis of Presentation
The Consolidated Financial Statements include the accounts of Prudential Financial, entities over which the Company exercises control,including majority-owned subsidiaries and minority-owned entities such as limited partnerships in which the Company is the general partner,and variable interest entities in which the Company is considered the primary beneficiary. See Note 5 for more information on theCompany’s consolidated variable interest entities. The Consolidated Financial Statements have been prepared in accordance with accountingprinciples generally accepted in the United States of America (“U.S. GAAP”). Intercompany balances and transactions have been eliminated.
The Company’s Gibraltar Life Insurance Company, Ltd. (“Gibraltar Life”) consolidated operations, including the previously-acquiredAIG Star Life Insurance Co., Ltd., AIG Edison Life Insurance Company, AIG Financial Assurance Japan K.K., and AIG Edison ServiceCo., Ltd. (collectively the “Star and Edison Businesses”) use a November 30 fiscal year end for purposes of inclusion in the Company’sConsolidated Financial Statements. Therefore, the Consolidated Financial Statements as of December 31, 2013 and 2012 include the assetsand liabilities of Gibraltar Life as of November 30, 2013 and 2012, respectively, and for the years ended December 31, 2013, 2012 and2011, include Gibraltar Life’s results of operations for the twelve months ended November 30, 2013, 2012 and 2011, respectively.
Use of Estimates
The preparation of financial statements in conformity with U.S. GAAP requires management to make estimates and assumptions thataffect the reported amounts of assets and liabilities and disclosure of contingent assets and liabilities as of the date of the financialstatements and the reported amounts of revenues and expenses during the reporting period. Actual results could differ from those estimates.
The most significant estimates include those used in determining deferred policy acquisition costs and related amortization; value ofbusiness acquired and its amortization; amortization of sales inducements; measurement of goodwill and any related impairment; valuationof investments including derivatives and the recognition of other-than-temporary impairments; future policy benefits including guarantees;pension and other postretirement benefits; provision for income taxes and valuation of deferred tax assets; and reserves for contingentliabilities, including reserves for losses in connection with unresolved legal matters.
Out of Period Adjustments
As previously disclosed in its Annual Report on Form 10-K for the year ended December 31, 2012, during 2012, the Companyrecorded out of period adjustments resulting in an aggregate net decrease of $170 million to “Income from continuing operations beforeincome taxes and equity in earnings of operating joint ventures” for the year ended December 31, 2012. These adjustments primarilyresulted from 1) a decline in the value of a real estate-related investment, where, based on a review of the underlying collateral and arelated guarantee, the Company determined that impairments of $75 million should be recognized, of which $61 million should have beenrecorded in prior years; 2) an increase of $61 million in reserves for estimated payments arising from use of new Social Security MasterDeath File matching criteria to identify deceased policy and contract holders which should have been reflected in the third quarter of 2011;and 3) an increase of $54 million in recorded liabilities for certain employee benefits based on a review of the consistency of recognition ofsuch liabilities across the Company which should have been recorded in prior years. Management evaluated the adjustments and concludedthey were not material to any previously reported quarterly or annual financial statements. For additional information on the impact ofthese adjustments to our operating segments, see Note 22.
Reclassifications
Certain amounts in prior years have been reclassified to conform to the current year presentation.
110 Prudential Financial, Inc. 2013 Annual Report

PRUDENTIAL FINANCIAL, INC.
Notes to Consolidated Financial Statements
2. SIGNIFICANT ACCOUNTING POLICIES AND PRONOUNCEMENTS
Share-Based PaymentsThe Company recognizes the cost resulting from all share-based payments in accordance with the authoritative guidance on
accounting for stock based compensation and applies the fair value-based measurement method in accounting for share-based paymenttransactions with employees except for equity instruments held by employee share ownership plans. The Company accounts for excess taxbenefits in additional paid-in capital as a single “pool” available to all share-based compensation awards. The Company does not recognizeexcess tax benefits in additional paid-in capital until the benefits result in a reduction in taxes payable. The Company has elected the “tax-law ordering methodology” and has adopted a convention that considers excess tax benefits to be the last portion of a net operating losscarryforward to be utilized.
The Company accounts for non-employee stock options using the fair value method in accordance with authoritative guidance andrelated interpretations on accounting for equity instruments that are issued to other than employees for acquiring, or in conjunction withselling, goods or services.
Earnings Per ShareAs discussed in Note 1, the Company has outstanding two separate classes of common stock. Basic earnings per share is computed by
dividing available income attributable to each of the two groups of common shareholders by the respective weighted average number ofcommon shares outstanding for the period. Diluted earnings per share includes the effect of all dilutive potential common shares that wereoutstanding during the period.
As discussed under “Share-Based Payments” above, the Company accounts for excess tax benefits in additional paid-in capital as asingle “pool” available to all share-based compensation awards. The Company reflects in assumed proceeds, based on application of thetreasury stock method, the excess tax benefits that would be recognized in additional paid-in capital upon exercise or release of the award.
Investments and Investment-Related LiabilitiesThe Company’s principal investments are fixed maturities; equity securities; commercial mortgage and other loans; policy loans; other
long-term investments, including joint ventures (other than operating joint ventures), limited partnerships, and real estate; and short-terminvestments. Investments and investment-related liabilities also include securities repurchase and resale agreements and securities lendingtransactions. The accounting policies related to each are as follows:
Fixed maturities are comprised of bonds, notes and redeemable preferred stock. Fixed maturities classified as “available-for-sale” arecarried at fair value. See Note 20 for additional information regarding the determination of fair value. Fixed maturities that the Companyhas both the positive intent and ability to hold to maturity are carried at amortized cost and classified as “held-to-maturity.” The amortizedcost of fixed maturities is adjusted for amortization of premiums and accretion of discounts to maturity. Interest income, as well as therelated amortization of premium and accretion of discount, is included in “Net investment income” under the effective yield method. Formortgage-backed and asset-backed securities, the effective yield is based on estimated cash flows, including interest rate and prepaymentassumptions based on data from widely accepted third-party data sources or internal estimates. In addition to interest rate and prepaymentassumptions, cash flow estimates also vary based on other assumptions regarding the underlying collateral, including default rates andchanges in value. These assumptions can significantly impact income recognition and the amount of other-than-temporary impairmentsrecognized in earnings and other comprehensive income. For high credit quality mortgage-backed and asset-backed securities (those ratedAA or above), cash flows are provided quarterly, and the amortized cost and effective yield of the security are adjusted as necessary toreflect historical prepayment experience and changes in estimated future prepayments. The adjustments to amortized cost are recorded as acharge or credit to net investment income in accordance with the retrospective method. For mortgage-backed and asset-backed securitiesrated below AA, or those for which an other than temporary impairment has been recorded, the effective yield is adjusted prospectively forany changes in estimated cash flows. See the discussion below on realized investment gains and losses for a description of the accountingfor impairments. Unrealized gains and losses on fixed maturities classified as “available-for-sale,” net of tax, and the effect on deferredpolicy acquisition costs, value of business acquired, deferred sales inducements (“DSI”), future policy benefits and policyholders’dividends that would result from the realization of unrealized gains and losses, are included in “Accumulated other comprehensive income(loss)” (“AOCI”).
“Trading account assets supporting insurance liabilities, at fair value” includes invested assets that support certain products included inthe Retirement segment, as well as certain products included in the International Insurance segment, which are experience rated, meaningthat the investment results associated with these products are expected to ultimately accrue to contractholders. Realized and unrealizedgains and losses for these investments are reported in “Asset management fees and other income.” Interest and dividend income from theseinvestments is reported in “Net investment income.”
“Other trading account assets, at fair value” consist primarily of fixed maturities, equity securities, including certain perpetualpreferred stock, and certain derivatives. Realized and unrealized gains and losses on these investments are reported in “Asset managementfees and other income,” and interest and dividend income from these investments is reported in “Net investment income.” Realized andunrealized gains and losses, and interest and dividend income on investments related to the Company’s former global commodities groupare reported in “Income from discontinued operations, net of taxes.” See “Derivative Financial Instruments” below for additionalinformation regarding the accounting for derivatives.
“Equity securities available-for-sale, at fair value” are comprised of common stock, mutual fund shares and non-redeemable preferredstock, and are carried at fair value. The associated unrealized gains and losses, net of tax, and the effect on deferred policy acquisitioncosts, value of business acquired, DSI, future policy benefits and policyholders’ dividends that would result from the realization of
Prudential Financial, Inc. 2013 Annual Report 111

PRUDENTIAL FINANCIAL, INC.
Notes to Consolidated Financial Statements
2. SIGNIFICANT ACCOUNTING POLICIES AND PRONOUNCEMENTS (continued)
unrealized gains and losses, are included in AOCI. The cost of equity securities is written down to fair value when a decline in value isconsidered to be other-than-temporary. See the discussion below on realized investment gains and losses for a description of the accountingfor impairments. Dividends from these investments are recognized in “Net investment income” when earned.
“Commercial mortgage and other loans” consist of commercial mortgage loans, agricultural loans, loans backed by residentialproperties, as well as certain other collateralized and uncollateralized loans. Loans backed by residential properties primarily includerecourse loans held by the Company’s international insurance businesses. Uncollateralized loans primarily represent reverse dual currencyloans and corporate loans held by the Company’s international insurance businesses.
Commercial mortgage and other loans originated and held for investment are generally carried at unpaid principal balance, net ofunamortized deferred loan origination fees and expenses, and net of an allowance for losses. Commercial mortgage loans originated withinthe Company’s commercial mortgage operations include loans held for sale which are reported at the lower of cost or fair value; loans heldfor investment which are reported at amortized cost net of unamortized deferred loan origination fees and expenses, and net of anallowance for losses; and loans reported at fair value under the fair value option. Commercial mortgage and other loans acquired, includingthose related to the acquisition of a business, are recorded at fair value when purchased, reflecting any premiums or discounts to unpaidprincipal balances.
Interest income, as well as prepayment fees and the amortization of the related premiums or discounts, related to commercialmortgage and other loans, are included in “Net investment income.”
Impaired loans include those loans for which it is probable that amounts due will not all be collected according to the contractual termsof the loan agreement. The Company defines “past due” as principal or interest not collected at least 30 days past the scheduled contractualdue date. Interest received on loans that are past due, including impaired and non-impaired loans as well as loans that were previouslymodified in a troubled debt restructuring, is either applied against the principal or reported as net investment income based on the Company’sassessment as to the collectability of the principal. See Note 4 for additional information about the Company’s past due loans.
The Company discontinues accruing interest on loans after the loans become 90 days delinquent as to principal or interest payments,or earlier when the Company has doubts about collectability. When the Company discontinues accruing interest on a loan, any accrued butuncollectible interest on the loan and other loans backed by the same collateral, if any, is charged to interest income in the same period.Generally, a loan is restored to accrual status only after all delinquent interest and principal are brought current and, in the case of loanswhere the payment of interest has been interrupted for a substantial period, or the loan has been modified, a regular payment performancehas been established.
The Company reviews the performance and credit quality of the commercial mortgage and other loan portfolio on an on-going basis.Loans are placed on watch list status based on a predefined set of criteria and are assigned one of three categories. Loans are placed on “earlywarning” status in cases where, based on the Company’s analysis of the loan’s collateral, the financial situation of the borrower or tenants orother market factors, it is believed a loss of principal or interest could occur. Loans are classified as “closely monitored” when it isdetermined that there is a collateral deficiency or other credit events that may lead to a potential loss of principal or interest. Loans “not ingood standing” are those loans where the Company has concluded that there is a high probability of loss of principal, such as when the loan isdelinquent or in the process of foreclosure. As described below, in determining the allowance for losses, the Company evaluates each loan onthe watch list to determine if it is probable that amounts due will not be collected according to the contractual terms of the loan agreement.
Loan-to-value and debt service coverage ratios are measures commonly used to assess the quality of commercial mortgage loans. Theloan-to-value ratio compares the amount of the loan to the fair value of the underlying property collateralizing the loan, and is commonlyexpressed as a percentage. Loan-to-value ratios greater than 100% indicate that the loan amount exceeds the collateral value. A smaller loan-to-value ratio indicates a greater excess of collateral value over the loan amount. The debt service coverage ratio compares a property’s netoperating income to its debt service payments. Debt service coverage ratios less than 1.0 times indicate that property operations do notgenerate enough income to cover the loan’s current debt payments. A larger debt service coverage ratio indicates a greater excess of netoperating income over the debt service payments. The values utilized in calculating these ratios are developed as part of the Company’speriodic review of the commercial mortgage loan and agricultural loan portfolio, which includes an internal appraisal of the underlyingcollateral value. The Company’s periodic review also includes a quality re-rating process, whereby the internal quality rating originallyassigned at underwriting is updated based on current loan, property and market information using a proprietary quality rating system. Theloan-to-value ratio is the most significant of several inputs used to establish the internal credit rating of a loan which in turn drives theallowance for losses. Other key factors considered in determining the internal credit rating include debt service coverage ratios, amortization,loan term, estimated market value growth rate and volatility for the property type and region. See Note 4 for additional information related tothe loan-to-value ratios and debt service coverage ratios related to the Company’s commercial mortgage and agricultural loan portfolios.
Loans backed by residential properties and uncollateralized loans are also reviewed periodically. Each loan is assigned an internal orexternal credit rating. Internal credit ratings take into consideration various factors including financial ratios and qualitative assessmentsbased on non-financial information. In cases where there are personal or third party guarantors, the credit quality of the guarantor is alsoreviewed. These factors are used in developing the allowance for losses. Based on the diversity of the loans in these categories and theirimmateriality, the Company has not disclosed the credit quality indicators related to these loans in Note 4.
For those loans not reported at fair value, the allowance for losses includes a loan specific reserve for each impaired loan that has aspecifically identified loss and a portfolio reserve for probable incurred but not specifically identified losses. For impaired commercialmortgage and other loans the allowances for losses are determined based on the present value of expected future cash flows discounted atthe loan’s effective interest rate, or based upon the fair value of the collateral if the loan is collateral dependent. The portfolio reserves for
112 Prudential Financial, Inc. 2013 Annual Report

PRUDENTIAL FINANCIAL, INC.
Notes to Consolidated Financial Statements
2. SIGNIFICANT ACCOUNTING POLICIES AND PRONOUNCEMENTS (continued)
probable incurred but not specifically identified losses in the commercial mortgage and agricultural loan portfolios consider the currentcredit composition of the portfolio based on an internal quality rating, (as described above). The portfolio reserves are determined usingpast loan experience, including historical credit migration, loss probability and loss severity factors by property type. These factors arereviewed each quarter and updated as appropriate.
The allowance for losses on commercial mortgage and other loans can increase or decrease from period to period based on the factorsnoted above. “Realized investment gains (losses), net” includes changes in the allowance for losses and changes in value for loansaccounted for under the fair value option. “Realized investment gains (losses), net” also includes gains and losses on sales, certainrestructurings, and foreclosures.
When a commercial mortgage or other loan is deemed to be uncollectible, any specific valuation allowance associated with the loan isreversed and a direct write down to the carrying amount of the loan is made. The carrying amount of the loan is not adjusted for subsequentrecoveries in value.
Commercial mortgage and other loans are occasionally restructured in a troubled debt restructuring. These restructurings generallyinclude one or more of the following: full or partial payoffs outside of the original contract terms; changes to interest rates; extensions ofmaturity; or additions or modifications to covenants. Additionally, the Company may accept assets in full or partial satisfaction of the debtas part of a troubled debt restructuring. When restructurings occur, they are evaluated individually to determine whether the restructuring ormodification constitutes a “troubled debt restructuring” as defined by authoritative accounting guidance. If the borrower is experiencingfinancial difficulty and the Company has granted a concession, the restructuring, including those that involve a partial payoff or the receiptof assets in full satisfaction of the debt is deemed to be a troubled debt restructuring. Based on the Company’s credit review processdescribed above, these loans generally would have been deemed impaired prior to the troubled debt restructuring, and specific allowancesfor losses would have been established prior to the determination that a troubled debt restructuring has occurred.
In a troubled debt restructuring where the Company receives assets in full satisfaction of the debt, any specific valuation allowance isreversed and a direct write down of the loan is recorded for the amount of the allowance, and any additional loss, net of recoveries, or anygain is recorded for the difference between the fair value of the assets received and the recorded investment in the loan. When assets arereceived in partial settlement, the same process is followed, and the remaining loan is evaluated prospectively for impairment based on thecredit review process noted above. When a loan is restructured in a troubled debt restructuring, the impairment of the loan is remeasuredusing the modified terms and the loan’s original effective yield, and the allowance for loss is adjusted accordingly. Subsequent to themodification, income is recognized prospectively based on the modified terms of the loans in accordance with the income recognitionpolicy noted above. Additionally, the loan continues to be subject to the credit review process noted above.
In situations where a loan has been restructured in a troubled debt restructuring and the loan has subsequently defaulted, this factor isconsidered when evaluating the loan for a specific allowance for losses in accordance with the credit review process noted above.
See Note 4 for additional information about commercial mortgage and other loans that have been restructured in a troubled debtrestructuring.
“Policy loans” are carried at unpaid principal balances. Interest income on policy loans is recognized in net investment income at thecontract interest rate when earned. Policy loans are fully collateralized by the cash surrender value of the associated insurance policies.
Securities repurchase and resale agreements and securities loaned transactions are used primarily to earn spread income, to borrowfunds, or to facilitate trading activity. As part of securities repurchase agreements or securities loaned transactions, the Company transfersU.S. and foreign debt and equity securities, as well as U.S. government and government agency securities, and receives cash as collateral.As part of securities resale agreements, the Company invests cash and receives as collateral U.S. government securities or other debtsecurities. For securities repurchase agreements and securities loaned transactions used to earn spread income, the cash received is typicallyinvested in cash equivalents, short-term investments or fixed maturities.
Securities repurchase and resale agreements that satisfy certain criteria are treated as secured borrowing or secured lendingarrangements. These agreements are carried at the amounts at which the securities will be subsequently resold or reacquired, as specified inthe respective transactions. For securities purchased under agreements to resell, the Company’s policy is to take possession or control of thesecurities either directly or through a third party custodian. These securities are valued daily and additional securities or cash collateral isreceived, or returned, when appropriate to protect against credit exposure. Securities to be resold are the same, or substantially the same, asthe securities received. For securities sold under agreements to repurchase, the market value of the securities to be repurchased ismonitored, and additional collateral is obtained where appropriate, to protect against credit exposure. Securities to be repurchased are thesame, or substantially the same, as those sold. Income and expenses related to these transactions executed within the insurance companiesused to earn spread income are reported as “Net investment income;” however, for transactions used for funding purposes, the associatedborrowing cost is reported as interest expense (included in “General and administrative expenses”). Income and expenses related to thesetransactions executed within the Company’s derivative operations are reported in “Asset management fees and other income.” Income andexpenses related to these transactions executed within the Company’s former global commodities group are reported in “Income fromdiscontinued operations, net of taxes.”
Securities loaned transactions are treated as financing arrangements and are recorded at the amount of cash received. The Companyobtains collateral in an amount equal to 102% and 105% of the fair value of the domestic and foreign securities, respectively. TheCompany monitors the market value of the securities loaned on a daily basis with additional collateral obtained as necessary. Substantiallyall of the Company’s securities loaned transactions are with large brokerage firms. Income and expenses associated with securities loanedtransactions used to earn spread income are reported as “Net investment income;” however, for securities loaned transactions used forfunding purposes the associated rebate is reported as interest expense (included in “General and administrative expenses”).
Prudential Financial, Inc. 2013 Annual Report 113

PRUDENTIAL FINANCIAL, INC.
Notes to Consolidated Financial Statements
2. SIGNIFICANT ACCOUNTING POLICIES AND PRONOUNCEMENTS (continued)
“Other long-term investments” consist of the Company’s investments in joint ventures and limited partnerships, other than operatingjoint ventures, as well as wholly-owned investment real estate and other investments. Joint venture and partnership interests are eitheraccounted for using the equity method of accounting or under the cost method when the Company’s partnership interest is so minor(generally less than 3%) that it exercises virtually no influence over operating and financial policies. The Company’s income frominvestments in joint ventures and partnerships accounted for using the equity method or the cost method, other than the Company’sinvestment in operating joint ventures, is included in “Net investment income.” The carrying value of these investments is written down, orimpaired, to fair value when a decline in value is considered to be other-than-temporary. In applying the equity method or the cost method(including assessment for other-than-temporary impairment), the Company uses financial information provided by the investee, generallyon a one to three month lag. The Company consolidates joint ventures and limited partnerships in certain other instances where it is deemedto exercise control, or is considered the primary beneficiary of a variable interest entity. See Note 5 for additional information aboutvariable interest entities.
The Company’s wholly-owned investment real estate consists of real estate which the Company has the intent to hold for theproduction of income as well as real estate held for sale. Real estate which the Company has the intent to hold for the production of incomeis carried at depreciated cost less any writedowns to fair value for impairment losses and is reviewed for impairment whenever events orcircumstances indicate that the carrying value may not be recoverable. Real estate held for sale is carried at the lower of depreciated cost orfair value less estimated selling costs and is not further depreciated once classified as such. An impairment loss is recognized when thecarrying value of the investment real estate exceeds the estimated undiscounted future cash flows (excluding interest charges) from theinvestment. At that time, the carrying value of the investment real estate is written down to fair value. Decreases in the carrying value ofinvestment real estate held for the production of income due to other-than-temporary impairments are recorded in “Realized investmentgains (losses), net.” Depreciation on real estate held for the production of income is computed using the straight-line method over theestimated lives of the properties, and is included in “Net investment income.” In the period a real estate investment is deemed held for saleand meets all of the discontinued operation criteria, the Company reports all related net investment income and any resulting investmentgains and losses as discontinued operations for all periods presented.
“Short-term investments” primarily consist of highly liquid debt instruments with a maturity of twelve months or less and greater thanthree months when purchased, other than those debt instruments meeting this definition that are included in “Trading account assetssupporting insurance liabilities, at fair value.” These investments are generally carried at fair value and include certain money marketinvestments, short-term debt securities issued by government sponsored entities and other highly liquid debt instruments. Short-terminvestments held in the Company’s former broker-dealer operations were marked-to-market through “Income from discontinuedoperations, net of taxes.”
Realized investment gains (losses) are computed using the specific identification method with the exception of some of theCompany’s International Insurance businesses’ portfolios, where the average cost method is used. Realized investment gains and losses aregenerated from numerous sources, including the sale of fixed maturity securities, equity securities, investments in joint ventures and limitedpartnerships and other types of investments, as well as adjustments to the cost basis of investments for net other-than-temporaryimpairments recognized in earnings. Realized investment gains and losses are also generated from prepayment premiums received onprivate fixed maturity securities, allowance for losses on commercial mortgage and other loans, fair value changes on commercial mortgageloans carried at fair value, and fair value changes on embedded derivatives and free-standing derivatives that do not qualify for hedgeaccounting treatment. Realized investment gains and losses related to the Company’s former global commodities group are reported in“Income from discontinued operations, net of taxes.” See “Derivative Financial Instruments” below for additional information regardingthe accounting for derivatives.
The Company’s available-for-sale and held-to-maturity securities with unrealized losses are reviewed quarterly to identify other-than-temporary impairments in value. In evaluating whether a decline in value is other-than-temporary, the Company considers several factorsincluding, but not limited to the following: (1) the extent and the duration of the decline; (2) the reasons for the decline in value (creditevent, currency or interest-rate related, including general credit spread widening); and (3) the financial condition of and near-term prospectsof the issuer. With regard to available-for-sale equity securities, the Company also considers the ability and intent to hold the investmentfor a period of time to allow for a recovery of value. When it is determined that a decline in value of an equity security is other-than-temporary, the carrying value of the equity security is reduced to its fair value, with a corresponding charge to earnings.
An other-than-temporary impairment is recognized in earnings for a debt security in an unrealized loss position when the Companyeither (a) has the intent to sell the debt security or (b) more likely than not will be required to sell the debt security before its anticipatedrecovery. For all debt securities in unrealized loss positions that do not meet either of these two criteria, the Company analyzes its ability torecover the amortized cost by comparing the net present value of projected future cash flows with the amortized cost of the security. Thenet present value is calculated by discounting the Company’s best estimate of projected future cash flows at the effective interest rateimplicit in the debt security prior to impairment. The Company may use the estimated fair value of collateral as a proxy for the net presentvalue if it believes that the security is dependent on the liquidation of collateral for recovery of its investment. If the net present value isless than the amortized cost of the investment, an other-than-temporary impairment is recognized. In addition to the above mentionedcircumstances, the Company also recognizes an other-than-temporary impairment in earnings when a non-functional currency denominatedsecurity in an unrealized loss position due to currency exchange rates approaches maturity.
When an other-than-temporary impairment of a debt security has occurred, the amount of the other-than-temporary impairmentrecognized in earnings depends on whether the Company intends to sell the security or more likely than not will be required to sell thesecurity before recovery of its amortized cost basis. If the debt security meets either of these two criteria or the unrealized losses due tochanges in foreign currency exchange rates are not expected to be recovered before maturity, the other-than-temporary impairmentrecognized in earnings is equal to the entire difference between the security’s amortized cost basis and its fair value at the impairment
114 Prudential Financial, Inc. 2013 Annual Report

PRUDENTIAL FINANCIAL, INC.
Notes to Consolidated Financial Statements
2. SIGNIFICANT ACCOUNTING POLICIES AND PRONOUNCEMENTS (continued)
measurement date. For other-than-temporary impairments of debt securities that do not meet these criteria, the net amount recognized inearnings is equal to the difference between the amortized cost of the debt security and its net present value calculated as described above.Any difference between the fair value and the net present value of the debt security at the impairment measurement date is recorded in“Other comprehensive income (loss).” Unrealized gains or losses on securities for which an other-than-temporary impairment has beenrecognized in earnings is tracked as a separate component of AOCI.
For debt securities, the split between the amount of an other-than-temporary impairment recognized in other comprehensive income andthe net amount recognized in earnings is driven principally by assumptions regarding the amount and timing of projected cash flows. Formortgage-backed and asset-backed securities, cash flow estimates consider the payment terms of the underlying assets backing a particularsecurity, including interest rate and prepayment assumptions based on data from widely accepted third-party data sources or internal estimates.In addition to interest rate and prepayment assumptions, cash flow estimates also include other assumptions regarding the underlying collateralincluding default rates and recoveries, which vary based on the asset type and geographic location, as well as the vintage year of the security.For structured securities, the payment priority within the tranche structure is also considered. For all other debt securities, cash flow estimatesare driven by assumptions regarding probability of default and estimates regarding timing and amount of recoveries associated with a default.The Company has developed these estimates using information based on its historical experience as well as using market observable data, suchas industry analyst reports and forecasts, sector credit ratings and other data relevant to the collectability of a security, such as the generalpayment terms of the security and the security’s position within the capital structure of the issuer.
The new cost basis of an impaired security is not adjusted for subsequent increases in estimated fair value. In periods subsequent tothe recognition of an other-than-temporary impairment, the impaired security is accounted for as if it had been purchased on themeasurement date of the impairment. For debt securities, the discount (or reduced premium) based on the new cost basis may be accretedinto net investment income in future periods, including increases in cash flow on a prospective basis. In certain cases where there aredecreased cash flow expectations, the security is reviewed for further cash flow impairments.
Unrealized investment gains and losses are also considered in determining certain other balances, including deferred policy acquisitioncosts, the value of business acquired, DSI, certain future policy benefits, policyholders’ dividends and deferred tax assets or liabilities.These balances are adjusted, as applicable, for the impact of unrealized gains or losses on investments as if these gains or losses had beenrealized, with corresponding credits or charges included in AOCI. Each of these balances is discussed in greater detail below.
Cash and Cash EquivalentsCash and cash equivalents include cash on hand, amounts due from banks, certain money market investments and other debt
instruments with maturities of three months or less when purchased, other than cash equivalents that are included in “Trading accountassets supporting insurance liabilities, at fair value.”
Deferred Policy Acquisition CostsCosts that vary with and that are directly related to the successful acquisition of new and renewal insurance and annuity business are
deferred to the extent such costs are deemed recoverable from future profits. Such DAC primarily includes commissions, costs of policyissuance and underwriting, and certain other expenses that are directly related to successfully negotiated contracts. See below under“Adoption of New Accounting Pronouncements” for a discussion of the authoritative guidance adopted effective January 1, 2012,regarding which costs relating to the acquisition of new or renewal insurance contracts qualify for deferral. In each reporting period,capitalized DAC is amortized to “Amortization of deferred policy acquisition costs,” net of the accrual of imputed interest on DACbalances. DAC is subject to periodic recoverability testing. DAC, for applicable products, is adjusted for the impact of unrealized gains orlosses on investments as if these gains or losses had been realized, with corresponding credits or charges included in AOCI.
For traditional participating life insurance included in the Closed Block, DAC is amortized over the expected life of the contracts (up to45 years) in proportion to gross margins based on historical and anticipated future experience, which is evaluated regularly. The effect ofchanges in estimated gross margins on unamortized DAC is reflected in “Amortization of deferred policy acquisition costs” in the periodsuch estimated gross margins are revised. Deferred policy acquisition costs related to interest-sensitive and variable life products and fixedand variable deferred annuity products are generally deferred and amortized over the expected life of the contracts (periods ranging from 25to 99 years) in proportion to gross profits arising principally from investment margins, mortality and expense margins, and surrender charges,based on historical and anticipated future experience, which is updated periodically. The Company uses a reversion to the mean approach forequities to derive future equity return assumptions. However, if the projected equity return calculated using this approach is greater than themaximum equity return assumption, the maximum equity return is utilized. In addition to the gross profit components previously mentioned,the impact of the embedded derivatives associated with certain optional living benefit features of the Company’s variable annuity contractsand related hedging activities are also included in actual gross profits used as the basis for calculating current period amortization and, incertain instances, in management’s estimate of total gross profits used for setting the amortization rate. The effect of changes to total grossprofits on unamortized DAC is reflected in “Amortization of deferred policy acquisition costs” in the period such total gross profits arerevised. DAC related to non-participating traditional individual life insurance is amortized in proportion to gross premiums.
For group annuity contracts (other than single premium group annuities), acquisition costs are generally deferred and amortized overthe expected life of the contracts in proportion to gross profits. For group corporate-, bank- and trust-owned life insurance contracts,acquisition costs are deferred and amortized in proportion to lives insured. For single premium immediate annuities with life contingencies,and single premium group annuities and single premium structured settlements with life contingencies, all acquisition costs are charged toexpense immediately because generally all premiums are received at the inception of the contract. For funding agreement notes contracts,single premium structured settlement contracts without life contingencies, and single premium immediate annuities without life
Prudential Financial, Inc. 2013 Annual Report 115

PRUDENTIAL FINANCIAL, INC.
Notes to Consolidated Financial Statements
2. SIGNIFICANT ACCOUNTING POLICIES AND PRONOUNCEMENTS (continued)
contingencies, acquisition expenses are deferred and amortized over the expected life of the contracts using the interest method. For othergroup life and disability insurance contracts and guaranteed investment contracts, acquisition costs are expensed as incurred.
For some products, policyholders can elect to modify product benefits, features, rights or coverages by exchanging a contract for anew contract or by amendment, endorsement, or rider to a contract, or by the election of a feature or coverage within a contract. Thesetransactions are known as internal replacements. If policyholders surrender traditional life insurance policies in exchange for life insurancepolicies that do not have fixed and guaranteed terms, the Company immediately charges to expense the remaining unamortized DAC on thesurrendered policies. For other internal replacement transactions, except those that involve the addition of a nonintegrated contract featurethat does not change the existing base contract, the unamortized DAC is immediately charged to expense if the terms of the new policiesare not substantially similar to those of the former policies. If the new terms are substantially similar to those of the earlier policies, theDAC is retained with respect to the new policies and amortized over the expected life of the new policies.
Value of Business AcquiredAs a result of certain acquisitions and the application of purchase accounting, the Company reports a financial asset representing the
value of business acquired (“VOBA”). VOBA includes an explicit adjustment to reflect the cost of capital attributable to the acquiredinsurance contracts. VOBA represents an adjustment to the stated value of inforce insurance contract liabilities to present them at fairvalue, determined as of the acquisition date. VOBA balances are subject to recoverability testing, in the manner in which it was acquired.The Company has established a VOBA asset primarily for its acquired traditional life insurance products, accident and health products withfixed benefits, deferred annuity contracts, and defined contribution and defined benefit businesses. As of December 31, 2013, the majorityof the VOBA balance relates to the 2011 acquisition of the Star and Edison Businesses and the January 2013 acquisition of The Hartford’sindividual life insurance business. The Company generally amortizes VOBA over the effective life of the acquired contracts in “Generaland administrative expenses.” For acquired traditional life insurance products and accident and health products with fixed benefits, VOBAis amortized in proportion to estimated gross premiums or in proportion to the face amount of insurance in force, as applicable. Foracquired annuity and non-traditional life insurance contracts, VOBA is amortized in proportion to gross profits arising principally frominvestment margins, mortality and expense margins, and surrender charges, based on historical and anticipated future experience, which isupdated periodically. For acquired defined contribution and defined benefit businesses, the majority of VOBA is amortized in proportion toestimated gross profits arising principally from investment spreads and fees in excess of actual expense based upon historical and estimatedfuture experience, which is updated periodically. The effect of changes in total gross profits on unamortized VOBA is reflected in theperiod such total gross profits are revised. VOBA, for applicable products, is adjusted for the impact of unrealized gains or losses oninvestments as if these gains or losses had been realized, with corresponding credits or charges included in AOCI. See Note 8 for additionalinformation regarding VOBA and Note 3 for additional information regarding the acquisition of the Star and Edison Businesses and TheHartford’s individual life insurance business.
Separate Account Assets and LiabilitiesSeparate account assets are reported at fair value and represent segregated funds that are invested for certain policyholders, pension
funds and other customers. The assets consist primarily of equity securities, fixed maturities, real estate-related investments, real estatemortgage loans, short-term investments and derivative instruments. The assets of each account are legally segregated and are not subject toclaims that arise out of any other business of the Company. Investment risks associated with market value changes are borne by thecustomers, except to the extent of minimum guarantees made by the Company with respect to certain accounts. See Note 11 for additionalinformation regarding separate account arrangements with contractual guarantees. Separate account liabilities primarily represent thecontractholder’s account balance in separate account assets and to a lesser extent borrowings of the separate account, and will be equal andoffsetting to total separate account assets. The investment income and realized investment gains or losses from separate account assetsgenerally accrue to the policyholders and are not included in the Company’s results of operations. Mortality, policy administration andsurrender charges assessed against the accounts are included in “Policy charges and fee income.” Asset management fees charged to theaccounts are included in “Asset management fees and other income.” Seed money that the Company invests in separate accounts isreported in the appropriate general account asset line. Investment income and realized investment gains or losses from seed money investedin separate accounts accrues to the Company and is included in the Company’s results of operations.
Other Assets and Other LiabilitiesOther assets consist primarily of prepaid pension benefit costs, certain restricted assets, trade receivables, value of business acquired,
goodwill and other intangible assets, DSI, the Company’s investments in operating joint ventures, which include the Company’s previouslyheld indirect investment in China Pacific Insurance (Group) Co., Ltd. (“China Pacific Group”), property and equipment, reinsurancerecoverables, and receivables resulting from sales of securities that had not yet settled at the balance sheet date. Other liabilities consistprimarily of trade payables, pension and other employee benefit liabilities, derivative liabilities, reinsurance payables, and payablesresulting from purchases of securities that had not yet settled at the balance sheet date.
Property and equipment are carried at cost less accumulated depreciation. Depreciation is determined using the straight-line methodover the estimated useful lives of the related assets, which generally range from 3 to 40 years.
As a result of certain acquisitions, the Company recognizes an asset for goodwill representing the excess of cost over the net fair valueof the assets acquired and liabilities assumed. Goodwill is assigned to reporting units at the date the goodwill is initially recorded. Areporting unit is an operating segment or a unit one level below the operating segment, if discrete financial information is prepared andregularly reviewed by management at that level. Once goodwill has been assigned to reporting units, it no longer retains its association witha particular acquisition, and all of the activities within a reporting unit, whether acquired or organically grown, are available to support thevalue of the goodwill.
116 Prudential Financial, Inc. 2013 Annual Report

PRUDENTIAL FINANCIAL, INC.
Notes to Consolidated Financial Statements
2. SIGNIFICANT ACCOUNTING POLICIES AND PRONOUNCEMENTS (continued)
The Company tests goodwill for impairment annually as of December 31 and more frequently if an event occurs or circumstanceschange that would more likely than not reduce the fair value of a reporting unit below its carrying amount. The fundamental goodwillimpairment analysis is a two-step test that is performed at the reporting unit level. The first step, used to identify potential impairment,involves comparing each reporting unit’s fair value to its carrying value including goodwill. If the fair value of a reporting unit exceeds itscarrying value, the applicable goodwill is considered not to be impaired. If the carrying value exceeds fair value, there is an indication of apotential impairment and the second step of the test is performed to measure the amount of impairment.
The second step involves calculating an implied fair value of goodwill for each reporting unit for which the first step indicatedimpairment. The implied fair value of goodwill is determined in the same manner as the amount of goodwill recognized in a businesscombination, which is the excess of the fair value of the reporting unit, as determined in the first step, over the aggregate fair values of theindividual assets, liabilities and identifiable intangibles as if the reporting unit was being acquired in a business combination. If the impliedfair value of goodwill in the “pro forma” business combination accounting as described above exceeds the goodwill assigned to the reportingunit, there is no impairment. If the goodwill assigned to a reporting unit exceeds the implied fair value of the goodwill, an impairment chargeis recorded in “General and administrative expenses” for the excess. An impairment loss recognized cannot exceed the amount of goodwillassigned to a reporting unit, and the loss establishes a new basis in the goodwill. Subsequent reversal of goodwill impairment losses is notpermitted. Management is required to make significant estimates in determining the fair value of a reporting unit including, but not limitedto: projected earnings, comparative market multiples, and the risk rate at which future net cash flows are discounted.
In accordance with accounting guidance, the Company may first perform a qualitative goodwill assessment to determine whetherevents or circumstances lead to a determination that it is more likely than not that the fair value of a reporting unit is less than its carryingamount. Factors such as macroeconomic conditions; industry and market considerations; cost factors and other are used to assess thevalidity of goodwill. If, after assessing the totality of events or circumstances, the Company determines it is not more likely than not thatthe fair value of a reporting unit is less than its carrying amount, then performing the two-step goodwill impairment test, as describedabove, is not necessary. If, however, the Company concludes otherwise, then the Company must perform the first step of the two-stepimpairment test by comparing the reporting unit’s fair value with its carrying value including goodwill. If the carrying value exceeds fairvalue, then the Company must perform the second step of the goodwill impairment test to measure the impairment loss, if any.
See Note 9 for additional information regarding goodwill.
The Company offers various types of sales inducements to policyholders related to fixed and variable deferred annuity contracts. TheCompany defers sales inducements and amortizes them over the anticipated life of the policy using the same methodology and assumptionsused to amortize DAC. Sales inducements balances are subject to periodic recoverability testing. The Company records amortization ofDSI in “Interest credited to policyholders’ account balances.” DSI, for applicable products, is adjusted for the impact of unrealized gains orlosses on investments as if these gains or losses had been realized, with corresponding credits or charges included in AOCI. See Note 11for additional information regarding sales inducements.
The majority of the Company’s reinsurance recoverables and payables are receivables and corresponding payables associated with thereinsurance arrangements used to effect the Company’s acquisition of the retirement businesses of CIGNA and The Hartford’s individuallife business. The remaining amounts relate to other reinsurance arrangements entered into by the Company. For each of its reinsurancecontracts, the Company determines if the contract provides indemnification against loss or liability relating to insurance risk in accordancewith applicable accounting standards. The Company reviews all contractual features, particularly those that may limit the amount ofinsurance risk to which the reinsurer is subject or features that delay the timely reimbursement of claims. See Note 13 for additionalinformation about the Company’s reinsurance arrangements.
Identifiable intangible assets are recorded net of accumulated amortization. The Company tests identifiable intangible assets forimpairment on an annual basis as of December 31 of each year or whenever events or circumstances suggest that the carrying value of anidentifiable intangible asset may exceed the sum of the undiscounted cash flows expected to result from its use and eventual disposition. Ifthis condition exists and the carrying value of an identifiable intangible asset exceeds its fair value, the excess is recognized as animpairment and is recorded as a charge against net income. Measuring intangibles requires the use of estimates. Significant estimatesinclude the projected net cash flow attributable to the intangible asset and the risk rate at which future net cash flows are discounted forpurposes of estimating fair value, as applicable. Identifiable intangible assets primarily include customer relationships and mortgageservicing rights. See Note 9 for additional information regarding identifiable intangible assets.
Investments in operating joint ventures are generally accounted for under the equity method. The carrying value of these investmentsis written down, or impaired, to fair value when a decline in value is considered to be other-than-temporary. See Note 7 for additionalinformation on investments in operating joint ventures.
Future Policy BenefitsThe Company’s liability for future policy benefits is primarily comprised of the present value of estimated future payments to or on
behalf of policyholders, where the timing and amount of payment depends on policyholder mortality or morbidity, less the present value offuture net premiums. For individual traditional participating life insurance products, the mortality and interest rate assumptions applied arethose used to calculate the policies’ guaranteed cash surrender values. For life insurance, other than individual traditional participating lifeinsurance, and annuity and disability products, expected mortality and morbidity is generally based on Company experience, industry dataand/or other factors. Interest rate assumptions are based on factors such as market conditions and expected investment returns. Althoughmortality and morbidity and interest rate assumptions are “locked-in” upon the issuance of new insurance or annuity business with fixedand guaranteed terms, significant changes in experience or assumptions may require the Company to provide for expected future losses ona product by establishing premium deficiency reserves. Premium deficiency reserves are established, if necessary, when the liability for
Prudential Financial, Inc. 2013 Annual Report 117

PRUDENTIAL FINANCIAL, INC.
Notes to Consolidated Financial Statements
2. SIGNIFICANT ACCOUNTING POLICIES AND PRONOUNCEMENTS (continued)
future policy benefits plus the present value of expected future gross premiums are determined to be insufficient to provide for expectedfuture policy benefits and expenses. Premium deficiency reserves do not include a provision for the risk of adverse deviation. Indetermining if a premium deficiency related to short-duration contracts exists, the Company considers, among other factors, anticipatedinvestment income. Any adjustments to future policy benefit reserves related to net unrealized gains on securities classified as available-for-sale are included in AOCI. See Note 10 for additional information regarding future policy benefits.
The Company’s liability for future policy benefits also includes a liability for unpaid claims and claim adjustment expenses. TheCompany does not establish claim liabilities until a loss has been incurred. However, unpaid claims and claim adjustment expensesincludes estimates of claims that the Company believes have been incurred but have not yet been reported as of the balance sheet date. TheCompany’s liability for future policy benefits also includes net liabilities for guarantee benefits related to certain nontraditional long-duration life and annuity contracts, which are discussed more fully in Note 11, and certain unearned revenues.
Policyholders’ Account BalancesThe Company’s liability for policyholders’ account balances represents the contract value that has accrued to the benefit of the
policyholder as of the balance sheet date. This liability is primarily associated with the accumulated account deposits, plus interest credited,less policyholder withdrawals and other charges assessed against the account balance. These policyholders’ account balances also includeprovision for benefits under non-life contingent payout annuities and certain unearned revenues. See Note 10 for additional informationregarding policyholders’ account balances.
Policyholders’ DividendsThe Company’s liability for policyholders’ dividends includes its dividends payable to policyholders and its policyholder dividend
obligation associated with the participating policies included in the Closed Block. The dividends payable for participating policies includedin the Closed Block are determined at the end of each year for the following year by the Board of Directors of Prudential Insurance basedon its statutory results, capital position, ratings, and the emerging experience of the Closed Block. The policyholder dividend obligationrepresents amounts expected to be paid to Closed Block policyholders as an additional policyholder dividend unless otherwise offset byfuture Closed Block performance . The policyholder dividend obligation also includes amounts relating to net unrealized gains on securitiesclassified as available-for-sale. For additional information on the policyholder dividend obligation, see Note 12. The dividends payable forpolicies other than the participating policies included in the Closed Block include dividends payable in accordance with certain group andindividual insurance policies.
Contingent LiabilitiesAmounts related to contingent liabilities are accrued if it is probable that a liability has been incurred and an amount is reasonably
estimable. Management evaluates whether there are incremental legal or other costs directly associated with the ultimate resolution of thematter that are reasonably estimable and, if so, they are included in the accrual.
Insurance Revenue and Expense RecognitionPremiums from individual life products, other than interest-sensitive and variable life contracts, and health insurance and long-term
care products are recognized when due. When premiums are due over a significantly shorter period than the period over which benefits areprovided, any gross premium in excess of the net premium (i.e., the portion of the gross premium required to provide for all expected futurebenefits and expenses) is generally deferred and recognized into revenue in a constant relationship to insurance in force. Benefits arerecorded as an expense when they are incurred. A liability for future policy benefits is recorded when premiums are recognized using thenet level premium method.
Premiums from non-participating group annuities with life contingencies, single premium structured settlements with life contingenciesand single premium immediate annuities with life contingencies are recognized when due. When premiums are due over a significantlyshorter period than the period over which benefits are provided, any gross premium in excess of the net premium is deferred and recognizedinto revenue in a constant relationship to the amount of expected future benefit payments. Benefits are recorded as an expense when they areincurred. A liability for future policy benefits is recorded when premiums are recognized using the net premium method.
Certain individual annuity contracts provide the holder a guarantee that the benefit received upon death or annuitization will be no lessthan a minimum prescribed amount. These benefits are accounted for as insurance contracts and are discussed in further detail in Note 11.The Company also provides contracts with certain living benefits which are considered embedded derivatives. These contracts arediscussed in further detail in Note 11.
Amounts received as payment for interest-sensitive or variable group and individual life contracts, deferred fixed or variable annuities,structured settlements and other contracts without life contingencies, and participating group annuities are reported as deposits to“Policyholders’ account balances” and/or “Separate account liabilities.” Revenues from these contracts are reflected in “Policy charges andfee income” consisting primarily of fees assessed during the period against the policyholders’ account balances for mortality and otherbenefit charges, policy administration charges and surrender charges. In addition to fees, the Company earns investment income from theinvestment of deposits in the Company’s general account portfolio. Fees assessed that represent compensation to the Company for services tobe provided in future periods and certain other fees are generally deferred and amortized into revenue over the life of the related contracts inproportion to estimated gross profits. Benefits and expenses for these products include claims in excess of related account balances, expensesof contract administration, interest credited to policyholders’ account balances and amortization of DAC, DSI and VOBA.
118 Prudential Financial, Inc. 2013 Annual Report

PRUDENTIAL FINANCIAL, INC.
Notes to Consolidated Financial Statements
2. SIGNIFICANT ACCOUNTING POLICIES AND PRONOUNCEMENTS (continued)
For group life, other than interest-sensitive and variable group life contracts, and disability insurance, premiums are generallyrecognized over the period to which the premiums relate in proportion to the amount of insurance protection provided. Claim and claimadjustment expenses are recognized when incurred.
Premiums, benefits and expenses are stated net of reinsurance ceded to other companies, except for amounts associated with certainmodified coinsurance contracts which are reflected in the Company’s financial statements based on the application of the deposit method ofaccounting.
Asset Management Fees and Other Income
“Asset management fees and other income” principally include asset management fees and securities commission revenues, which arerecognized in the period in which the services are performed. Realized and unrealized gains or losses from investments classified as“trading” such as “Trading account assets supporting insurance liabilities” and “Other trading account assets,” short-term investments thatare marked-to-market through other income, and from consolidated entities that follow specialized investment company fair valueaccounting are also included in “Asset management fees and other income.”
“Asset management fees and other income” also includes $(4.1) billion, $(1.8) billion and $1.0 billion for the years ended December31, 2013, 2012 and 2011, respectively, primarily related to the remeasurement of foreign currency denominated assets and liabilities, asdiscussed in more detail under “Foreign Currency” below.
In 2013, the Company adopted retrospectively a discretionary change in accounting principle for recognition of performance basedincentive fee revenue. In certain asset management fee arrangements, the Company is entitled to receive performance based incentive feeswhen the return on assets under management exceeds certain benchmark returns or other performance targets. The Company may berequired to return all, or part, of such performance based incentive fee depending on future performance of these assets relative toperformance benchmarks. Under the newly adopted accounting principle, the Company records performance based incentive fee revenuewhen the contractual terms of the asset management fee arrangement have been satisfied such that the performance fee is no longer subjectto clawback or contingency. Under this principle the Company records a deferred performance based incentive fee liability to the extent itreceives cash related to the performance based incentive fee prior to meeting the revenue recognition criteria delineated above.
Under the prior accounting principle, the Company accrued performance based incentive fee revenue quarterly based on measuringfund performance to date versus the performance benchmark stated in the investment management agreement, as if the contracts containingthe fee arrangements were terminated as of the applicable balance sheet date. Certain performance based incentive fees were also subject tofuture adjustment based on cumulative fund performance in relation to these specified benchmarks.
The new method is recognized as preferable in authoritative accounting literature. In addition, the Company believes that new methodimproves the quality of earnings by eliminating the potential that revenue will be recognized in one quarter and reversed in a future quarter.Finally, the Company believes that the new accounting principle provides a more meaningful comparison to competitors.
The following tables present: 1) pro-forma amounts as of, or for the year ended, December 31, 2013 under the prior accountingmethod, the effect on those amounts of the change in account principle, and amounts as reported in the Company’s Consolidated FinancialStatements; and 2) amounts as of, or for the years ended December 31, 2012 and 2011, as previously reported, the effect on those amountsof the change in accounting principle, and amounts as reported in the Company’s Consolidated Financial Statements.
Consolidated Statement of Financial Position:December 31, 2013
PreviousAccounting
Method
Effect ofChange in
AccountingPrinciple
AsReported
(in millions)ASSETSOther assets . . . . . . . . . . . . . . . . . . . . . . . . . . . . . . . . . . . . . . . . . . . . . . . . . . . . . . . . . . . . . . . . . . . $ 13,893 $ (60) $ 13,833TOTAL ASSETS . . . . . . . . . . . . . . . . . . . . . . . . . . . . . . . . . . . . . . . . . . . . . . . . . . . . . . . . . . . . . . 731,841 (60) 731,781
LIABILITIES AND EQUITYLIABILITIESIncome taxes . . . . . . . . . . . . . . . . . . . . . . . . . . . . . . . . . . . . . . . . . . . . . . . . . . . . . . . . . . . . . . . . . . 5,462 (40) 5,422Other liabilities . . . . . . . . . . . . . . . . . . . . . . . . . . . . . . . . . . . . . . . . . . . . . . . . . . . . . . . . . . . . . . . . 13,749 176 13,925Total liabilities . . . . . . . . . . . . . . . . . . . . . . . . . . . . . . . . . . . . . . . . . . . . . . . . . . . . . . . . . . . . . . . . . 695,764 136 695,900
EQUITYRetained earnings . . . . . . . . . . . . . . . . . . . . . . . . . . . . . . . . . . . . . . . . . . . . . . . . . . . . . . . . . . . . . . 14,602 (71) 14,531Total Prudential Financial, Inc. equity . . . . . . . . . . . . . . . . . . . . . . . . . . . . . . . . . . . . . . . . . . . . . . 35,349 (71) 35,278Noncontrolling interests . . . . . . . . . . . . . . . . . . . . . . . . . . . . . . . . . . . . . . . . . . . . . . . . . . . . . . . . . 728 (125) 603Total equity . . . . . . . . . . . . . . . . . . . . . . . . . . . . . . . . . . . . . . . . . . . . . . . . . . . . . . . . . . . . . . . . . . . 36,077 (196) 35,881TOTAL LIABILITIES AND EQUITY . . . . . . . . . . . . . . . . . . . . . . . . . . . . . . . . . . . . . . . . . . . . $731,841 $ (60) $731,781
Prudential Financial, Inc. 2013 Annual Report 119

PRUDENTIAL FINANCIAL, INC.
Notes to Consolidated Financial Statements
2. SIGNIFICANT ACCOUNTING POLICIES AND PRONOUNCEMENTS (continued)December 31, 2012
AsPreviouslyReported
Effect ofChange in
AccountingPrinciple
AsCurrentlyReported
(in millions)ASSETSOther assets . . . . . . . . . . . . . . . . . . . . . . . . . . . . . . . . . . . . . . . . . . . . . . . . . . . . . . . . . . . . . . . . . . . $ 11,887 $ (63) $ 11,824TOTAL ASSETS . . . . . . . . . . . . . . . . . . . . . . . . . . . . . . . . . . . . . . . . . . . . . . . . . . . . . . . . . . . . . . 709,298 (63) 709,235
LIABILITIES AND EQUITYLIABILITIESIncome taxes . . . . . . . . . . . . . . . . . . . . . . . . . . . . . . . . . . . . . . . . . . . . . . . . . . . . . . . . . . . . . . . . . . 8,551 (39) 8,512Other liabilities . . . . . . . . . . . . . . . . . . . . . . . . . . . . . . . . . . . . . . . . . . . . . . . . . . . . . . . . . . . . . . . . 11,683 155 11,838Total liabilities . . . . . . . . . . . . . . . . . . . . . . . . . . . . . . . . . . . . . . . . . . . . . . . . . . . . . . . . . . . . . . . . . 670,007 116 670,123
EQUITYRetained earnings . . . . . . . . . . . . . . . . . . . . . . . . . . . . . . . . . . . . . . . . . . . . . . . . . . . . . . . . . . . . . . . 16,138 (72) 16,066Total Prudential Financial, Inc. equity . . . . . . . . . . . . . . . . . . . . . . . . . . . . . . . . . . . . . . . . . . . . . . . 38,575 (72) 38,503Noncontrolling interests . . . . . . . . . . . . . . . . . . . . . . . . . . . . . . . . . . . . . . . . . . . . . . . . . . . . . . . . . . 716 (107) 609Total equity . . . . . . . . . . . . . . . . . . . . . . . . . . . . . . . . . . . . . . . . . . . . . . . . . . . . . . . . . . . . . . . . . . . 39,291 (179) 39,112TOTAL LIABILITIES AND EQUITY . . . . . . . . . . . . . . . . . . . . . . . . . . . . . . . . . . . . . . . . . . . . $709,298 $ (63) $709,235
Consolidated Statement of Operations:
Year Ended December 31, 2013
PreviousAccounting
Method
Effect ofChange in
AccountingPrinciple
AsReported
(in millions)REVENUESAsset management fees and other income . . . . . . . . . . . . . . . . . . . . . . . . . . . . . . . . . . . . . . . . . . . . . . . . . . . . . . . . . $ 304 $ (18) $ 286
Total revenues . . . . . . . . . . . . . . . . . . . . . . . . . . . . . . . . . . . . . . . . . . . . . . . . . . . . . . . . . . . . . . . . . . . . . . . . . . . 41,479 (18) 41,461INCOME (LOSS) FROM CONTINUING OPERATIONS BEFORE INCOME TAXES AND EQUITY IN
EARNINGS OF OPERATING JOINT VENTURES . . . . . . . . . . . . . . . . . . . . . . . . . . . . . . . . . . . . . . . . . . . . (1,666) (18) (1,684)Income taxes:
Deferred . . . . . . . . . . . . . . . . . . . . . . . . . . . . . . . . . . . . . . . . . . . . . . . . . . . . . . . . . . . . . . . . . . . . . . . . . . . . . . . (1,091) (1) (1,092)Income tax expense . . . . . . . . . . . . . . . . . . . . . . . . . . . . . . . . . . . . . . . . . . . . . . . . . . . . . . . . . . . . . . . . . . . (1,057) (1) (1,058)
INCOME (LOSS) FROM CONTINUING OPERATIONS BEFORE EQUITY IN EARNINGS OFOPERATING JOINT VENTURES . . . . . . . . . . . . . . . . . . . . . . . . . . . . . . . . . . . . . . . . . . . . . . . . . . . . . . . . . . (609) (17) (626)
INCOME (LOSS) FROM CONTINUING OPERATIONS . . . . . . . . . . . . . . . . . . . . . . . . . . . . . . . . . . . . . . . . . (550) (17) (567)NET INCOME (LOSS) . . . . . . . . . . . . . . . . . . . . . . . . . . . . . . . . . . . . . . . . . . . . . . . . . . . . . . . . . . . . . . . . . . . . . . (543) (17) (560)
Less: Income (loss) attributable to noncontrolling interests . . . . . . . . . . . . . . . . . . . . . . . . . . . . . . . . . . . . . . . . 125 (18) 107NET INCOME (LOSS) ATTRIBUTABLE TO PRUDENTIAL FINANCIAL, INC. . . . . . . . . . . . . . . . . . . . . $ (668) $ 1 $ (667)EARNINGS PER SHAREFinancial Services Businesses
Basic earnings per share—Common Stock:Income (loss) from continuing operations attributable to Prudential Financial, Inc. . . . . . . . . . . . . . . . . . $ (1.57) $0.00 $ (1.57)Net income (loss) attributable to Prudential Financial, Inc. . . . . . . . . . . . . . . . . . . . . . . . . . . . . . . . . . . . . $ (1.55) $0.00 $ (1.55)
Diluted earnings per share—Common Stock:Income (loss) from continuing operations attributable to Prudential Financial, Inc. . . . . . . . . . . . . . . . . . $ (1.57) $0.00 $ (1.57)Net income (loss) attributable to Prudential Financial, Inc. . . . . . . . . . . . . . . . . . . . . . . . . . . . . . . . . . . . . $ (1.55) $0.00 $ (1.55)
120 Prudential Financial, Inc. 2013 Annual Report
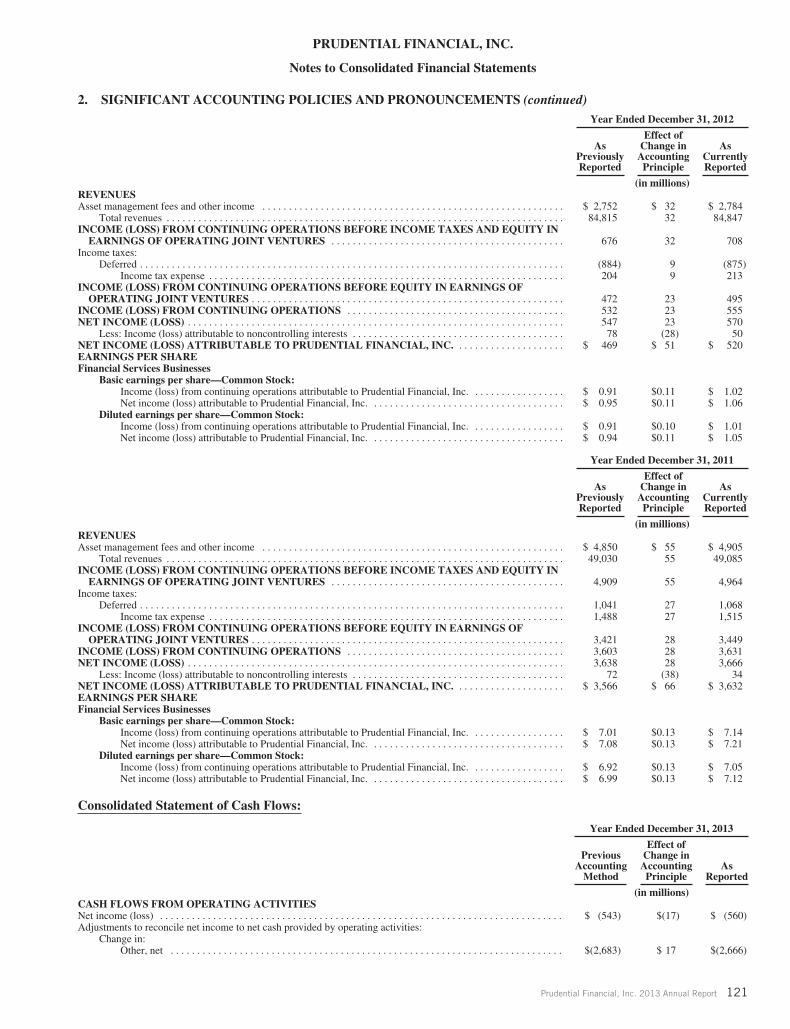
PRUDENTIAL FINANCIAL, INC.
Notes to Consolidated Financial Statements
2. SIGNIFICANT ACCOUNTING POLICIES AND PRONOUNCEMENTS (continued)Year Ended December 31, 2012
AsPreviouslyReported
Effect ofChange in
AccountingPrinciple
AsCurrentlyReported
(in millions)REVENUESAsset management fees and other income . . . . . . . . . . . . . . . . . . . . . . . . . . . . . . . . . . . . . . . . . . . . . . . . . . . . . . . . . $ 2,752 $ 32 $ 2,784
Total revenues . . . . . . . . . . . . . . . . . . . . . . . . . . . . . . . . . . . . . . . . . . . . . . . . . . . . . . . . . . . . . . . . . . . . . . . . . . . 84,815 32 84,847INCOME (LOSS) FROM CONTINUING OPERATIONS BEFORE INCOME TAXES AND EQUITY IN
EARNINGS OF OPERATING JOINT VENTURES . . . . . . . . . . . . . . . . . . . . . . . . . . . . . . . . . . . . . . . . . . . . 676 32 708Income taxes:
Deferred . . . . . . . . . . . . . . . . . . . . . . . . . . . . . . . . . . . . . . . . . . . . . . . . . . . . . . . . . . . . . . . . . . . . . . . . . . . . . . . . (884) 9 (875)Income tax expense . . . . . . . . . . . . . . . . . . . . . . . . . . . . . . . . . . . . . . . . . . . . . . . . . . . . . . . . . . . . . . . . . . . 204 9 213
INCOME (LOSS) FROM CONTINUING OPERATIONS BEFORE EQUITY IN EARNINGS OFOPERATING JOINT VENTURES . . . . . . . . . . . . . . . . . . . . . . . . . . . . . . . . . . . . . . . . . . . . . . . . . . . . . . . . . . . 472 23 495
INCOME (LOSS) FROM CONTINUING OPERATIONS . . . . . . . . . . . . . . . . . . . . . . . . . . . . . . . . . . . . . . . . . 532 23 555NET INCOME (LOSS) . . . . . . . . . . . . . . . . . . . . . . . . . . . . . . . . . . . . . . . . . . . . . . . . . . . . . . . . . . . . . . . . . . . . . . . 547 23 570
Less: Income (loss) attributable to noncontrolling interests . . . . . . . . . . . . . . . . . . . . . . . . . . . . . . . . . . . . . . . . 78 (28) 50NET INCOME (LOSS) ATTRIBUTABLE TO PRUDENTIAL FINANCIAL, INC. . . . . . . . . . . . . . . . . . . . . $ 469 $ 51 $ 520EARNINGS PER SHAREFinancial Services Businesses
Basic earnings per share—Common Stock:Income (loss) from continuing operations attributable to Prudential Financial, Inc. . . . . . . . . . . . . . . . . . $ 0.91 $0.11 $ 1.02Net income (loss) attributable to Prudential Financial, Inc. . . . . . . . . . . . . . . . . . . . . . . . . . . . . . . . . . . . . $ 0.95 $0.11 $ 1.06
Diluted earnings per share—Common Stock:Income (loss) from continuing operations attributable to Prudential Financial, Inc. . . . . . . . . . . . . . . . . . $ 0.91 $0.10 $ 1.01Net income (loss) attributable to Prudential Financial, Inc. . . . . . . . . . . . . . . . . . . . . . . . . . . . . . . . . . . . . $ 0.94 $0.11 $ 1.05
Year Ended December 31, 2011
AsPreviouslyReported
Effect ofChange in
AccountingPrinciple
AsCurrentlyReported
(in millions)REVENUESAsset management fees and other income . . . . . . . . . . . . . . . . . . . . . . . . . . . . . . . . . . . . . . . . . . . . . . . . . . . . . . . . . $ 4,850 $ 55 $ 4,905
Total revenues . . . . . . . . . . . . . . . . . . . . . . . . . . . . . . . . . . . . . . . . . . . . . . . . . . . . . . . . . . . . . . . . . . . . . . . . . . . 49,030 55 49,085INCOME (LOSS) FROM CONTINUING OPERATIONS BEFORE INCOME TAXES AND EQUITY IN
EARNINGS OF OPERATING JOINT VENTURES . . . . . . . . . . . . . . . . . . . . . . . . . . . . . . . . . . . . . . . . . . . . 4,909 55 4,964Income taxes:
Deferred . . . . . . . . . . . . . . . . . . . . . . . . . . . . . . . . . . . . . . . . . . . . . . . . . . . . . . . . . . . . . . . . . . . . . . . . . . . . . . . . 1,041 27 1,068Income tax expense . . . . . . . . . . . . . . . . . . . . . . . . . . . . . . . . . . . . . . . . . . . . . . . . . . . . . . . . . . . . . . . . . . . 1,488 27 1,515
INCOME (LOSS) FROM CONTINUING OPERATIONS BEFORE EQUITY IN EARNINGS OFOPERATING JOINT VENTURES . . . . . . . . . . . . . . . . . . . . . . . . . . . . . . . . . . . . . . . . . . . . . . . . . . . . . . . . . . . 3,421 28 3,449
INCOME (LOSS) FROM CONTINUING OPERATIONS . . . . . . . . . . . . . . . . . . . . . . . . . . . . . . . . . . . . . . . . . 3,603 28 3,631NET INCOME (LOSS) . . . . . . . . . . . . . . . . . . . . . . . . . . . . . . . . . . . . . . . . . . . . . . . . . . . . . . . . . . . . . . . . . . . . . . . 3,638 28 3,666
Less: Income (loss) attributable to noncontrolling interests . . . . . . . . . . . . . . . . . . . . . . . . . . . . . . . . . . . . . . . . 72 (38) 34NET INCOME (LOSS) ATTRIBUTABLE TO PRUDENTIAL FINANCIAL, INC. . . . . . . . . . . . . . . . . . . . . $ 3,566 $ 66 $ 3,632EARNINGS PER SHAREFinancial Services Businesses
Basic earnings per share—Common Stock:Income (loss) from continuing operations attributable to Prudential Financial, Inc. . . . . . . . . . . . . . . . . . $ 7.01 $0.13 $ 7.14Net income (loss) attributable to Prudential Financial, Inc. . . . . . . . . . . . . . . . . . . . . . . . . . . . . . . . . . . . . $ 7.08 $0.13 $ 7.21
Diluted earnings per share—Common Stock:Income (loss) from continuing operations attributable to Prudential Financial, Inc. . . . . . . . . . . . . . . . . . $ 6.92 $0.13 $ 7.05Net income (loss) attributable to Prudential Financial, Inc. . . . . . . . . . . . . . . . . . . . . . . . . . . . . . . . . . . . . $ 6.99 $0.13 $ 7.12
Consolidated Statement of Cash Flows:
Year Ended December 31, 2013
PreviousAccounting
Method
Effect ofChange in
AccountingPrinciple
AsReported
(in millions)CASH FLOWS FROM OPERATING ACTIVITIESNet income (loss) . . . . . . . . . . . . . . . . . . . . . . . . . . . . . . . . . . . . . . . . . . . . . . . . . . . . . . . . . . . . . . . . . . . . . . . . . . . . $ (543) $(17) $ (560)Adjustments to reconcile net income to net cash provided by operating activities:
Change in:Other, net . . . . . . . . . . . . . . . . . . . . . . . . . . . . . . . . . . . . . . . . . . . . . . . . . . . . . . . . . . . . . . . . . . . . . . . . . . $(2,683) $ 17 $(2,666)
Prudential Financial, Inc. 2013 Annual Report 121

PRUDENTIAL FINANCIAL, INC.
Notes to Consolidated Financial Statements
2. SIGNIFICANT ACCOUNTING POLICIES AND PRONOUNCEMENTS (continued)Year Ended December 31, 2012
AsPreviouslyReported
Effect ofChange in
AccountingPrinciple
AsCurrentlyReported
(in millions)CASH FLOWS FROM OPERATING ACTIVITIESNet income (loss) . . . . . . . . . . . . . . . . . . . . . . . . . . . . . . . . . . . . . . . . . . . . . . . . . . . . . . . . . . . . . . . . . . . . . . . . . . . . . $547 $ 23 $570Adjustments to reconcile net income to net cash provided by operating activities:
Change in:Other, net . . . . . . . . . . . . . . . . . . . . . . . . . . . . . . . . . . . . . . . . . . . . . . . . . . . . . . . . . . . . . . . . . . . . . . . . . . . $193 $(23) $170
Year Ended December 31, 2011
AsPreviouslyReported
Effect ofChange in
AccountingPrinciple
AsCurrentlyReported
(in millions)CASH FLOWS FROM OPERATING ACTIVITIESNet income (loss) . . . . . . . . . . . . . . . . . . . . . . . . . . . . . . . . . . . . . . . . . . . . . . . . . . . . . . . . . . . . . . . . . . . . . . . . . . . . . $3,638 $ 28 $3,666Adjustments to reconcile net income to net cash provided by operating activities:
Change in:Other, net . . . . . . . . . . . . . . . . . . . . . . . . . . . . . . . . . . . . . . . . . . . . . . . . . . . . . . . . . . . . . . . . . . . . . . . . . . . $1,509 $(28) $1,481
Foreign CurrencyAssets and liabilities of foreign operations and subsidiaries reported in currencies other than U.S. dollars are translated at the exchange
rate in effect at the end of the period. Revenues, benefits and other expenses are translated at the average rate prevailing during the period.The effects of translating the statements of operations and financial position of non-U.S. entities with functional currencies other than theU.S. dollar are included, net of related qualifying hedge gains and losses and income taxes, in AOCI. Gains and losses resulting from theremeasurement of foreign currency transactions are reported in either AOCI or current earnings in “Asset management fees and otherincome” depending on the nature of the related foreign currency denominated asset or liability.
Derivative Financial InstrumentsDerivatives are financial instruments whose values are derived from interest rates, foreign exchange rates, financial indices, values of
securities or commodities, credit spreads, market volatility, expected returns, and liquidity. Values can also be affected by changes inestimates and assumptions, including those related to counterparty behavior and non-performance risk used in valuation models. Derivativefinancial instruments generally used by the Company include swaps, futures, forwards and options and may be exchange-traded orcontracted in the over-the-counter (“OTC”) market. Derivative positions are carried at fair value, generally by obtaining quoted marketprices or through the use of valuation models.
Derivatives are used to manage the interest rate and currency characteristics of assets or liabilities and to mitigate volatility ofexpected non-U.S. earnings and net investments in foreign operations resulting from changes in currency exchange rates. Additionally,derivatives may be used to seek to reduce exposure to interest rate, credit, foreign currency and equity risks associated with assets held orexpected to be purchased or sold, and liabilities incurred or expected to be incurred. As discussed in detail below and in Note 21, allrealized and unrealized changes in fair value of derivatives are recorded in current earnings, with the exception of the effective portion ofcash flow hedges and effective hedges of net investments in foreign operations. Cash flows from derivatives are reported in the operating,investing, or financing activities sections in the Consolidated Statements of Cash Flows based on the nature and purpose of the derivative.
Derivatives were also used in a derivative broker-dealer capacity in the Company’s global commodities group to meet the needs ofclients by structuring transactions that allow clients to manage their exposure to interest rates, foreign exchange rates, indices and prices ofsecurities and commodities. The Company’s global commodities group was sold on July 1, 2011. See Note 3 for further details. Realizedand unrealized changes in fair value of derivatives used in these dealer-related operations are included in “Income from discontinuedoperations, net of taxes” in the periods in which the changes occur. Cash flows from such derivatives are reported in the operating activitiessection of the Consolidated Statements of Cash Flows.
Derivatives are recorded either as assets, within “Other trading account assets, at fair value” or “Other long-term investments,” or asliabilities, within “Other liabilities,” except for embedded derivatives which are recorded with the associated host contract. The Companynets the fair value of all derivative financial instruments with counterparties for which a master netting arrangement has been executed.
The Company designates derivatives as either (1) a hedge of the fair value of a recognized asset or liability or unrecognized firmcommitment (“fair value” hedge); (2) a hedge of a forecasted transaction or of the variability of cash flows to be received or paid related toa recognized asset or liability (“cash flow” hedge); (3) a foreign-currency fair value or cash flow hedge (“foreign currency” hedge); (4) ahedge of a net investment in a foreign operation; or (5) a derivative that does not qualify for hedge accounting.
To qualify for hedge accounting treatment, a derivative must be highly effective in mitigating the designated risk of the hedged item.Effectiveness of the hedge is formally assessed at inception and throughout the life of the hedging relationship. Even if a derivativequalifies for hedge accounting treatment, there may be an element of ineffectiveness of the hedge. Under such circumstances, theineffective portion is recorded in “Realized investment gains (losses), net.”
122 Prudential Financial, Inc. 2013 Annual Report
PRUDENTIAL FINANCIAL, INC.
Notes to Consolidated Financial Statements
2. SIGNIFICANT ACCOUNTING POLICIES AND PRONOUNCEMENTS (continued)
The Company formally documents at inception all relationships between hedging instruments and hedged items, as well as its risk-management objective and strategy for undertaking various hedge transactions. This process includes linking all derivatives designated asfair value, cash flow, or foreign currency hedges to specific assets and liabilities on the balance sheet or to specific firm commitments orforecasted transactions. Hedges of a net investment in a foreign operation are linked to the specific foreign operation.
When a derivative is designated as a fair value hedge and is determined to be highly effective, changes in its fair value, along withchanges in the fair value of the hedged asset or liability (including losses or gains on firm commitments), are reported on a net basis in theincome statement, generally in “Realized investment gains (losses), net.” When swaps are used in hedge accounting relationships, periodicsettlements are recorded in the same income statement line as the related settlements of the hedged items.
When a derivative is designated as a cash flow hedge and is determined to be highly effective, changes in its fair value are recorded inAOCI until earnings are affected by the variability of cash flows being hedged (e.g., when periodic settlements on a variable-rate asset orliability are recorded in earnings). At that time, the related portion of deferred gains or losses on the derivative instrument is reclassifiedand reported in the income statement line item associated with the hedged item.
When a derivative is designated as a foreign currency hedge and is determined to be highly effective, changes in its fair value arerecorded either in current period earnings if the hedge transaction is a fair value hedge (e.g., a hedge of a recognized foreign currency assetor liability) or in AOCI if the hedge transaction is a cash flow hedge (e.g., a foreign currency denominated forecasted transaction). When aderivative is used as a hedge of a net investment in a foreign operation, its change in fair value, to the extent effective as a hedge, isrecorded in the cumulative translation adjustment account within AOCI.
If it is determined that a derivative no longer qualifies as an effective fair value or cash flow hedge or management removes the hedgedesignation, the derivative will continue to be carried on the balance sheet at its fair value, with changes in fair value recognized currentlyin “Realized investment gains (losses), net.” In this scenario, the hedged asset or liability under a fair value hedge will no longer beadjusted for changes in fair value and the existing basis adjustment is amortized to the income statement line associated with the asset orliability. The component of AOCI related to discontinued cash flow hedges is reclassified to the income statement line associated with thehedged cash flows consistent with the earnings impact of the original hedged cash flows.
When hedge accounting is discontinued because the hedged item no longer meets the definition of a firm commitment, or because it isprobable that the forecasted transaction will not occur by the end of the specified time period, the derivative will continue to be carried onthe balance sheet at its fair value, with changes in fair value recognized currently in “Realized investment gains (losses), net.” Any asset orliability that was recorded pursuant to recognition of the firm commitment is removed from the balance sheet and recognized currently in“Realized investment gains (losses), net.” Gains and losses that were in AOCI pursuant to the hedge of a forecasted transaction arerecognized immediately in “Realized investment gains (losses), net.”
If a derivative does not qualify for hedge accounting, all changes in its fair value, including net receipts and payments, are included in“Realized investment gains (losses), net” without considering changes in the fair value of the economically associated assets or liabilities.
The Company is a party to financial instruments that contain derivative instruments that are “embedded” in the financial instruments.At inception, the Company assesses whether the economic characteristics of the embedded instrument are clearly and closely related to theeconomic characteristics of the remaining component of the financial instrument (i.e., the host contract) and whether a separate instrumentwith the same terms as the embedded instrument would meet the definition of a derivative instrument. When it is determined that (1) theembedded instrument possesses economic characteristics that are not clearly and closely related to the economic characteristics of the hostcontract, and (2) a separate instrument with the same terms would qualify as a derivative instrument, the embedded instrument qualifies asan embedded derivative that is separated from the host contract, carried at fair value, and changes in its fair value are included in “Realizedinvestment gains (losses), net.” For certain financial instruments that contain an embedded derivative that otherwise would need to bebifurcated and reported at fair value, the Company may elect to classify the entire instrument as a trading account asset and report it within“Other trading account assets, at fair value.”
Short-Term and Long-Term DebtLiabilities for short-term and long-term debt are primarily carried at an amount equal to unpaid principal balance, net of unamortized
discount or premium. Original-issue discount or premium and debt-issue costs are recognized as a component of interest expense over theperiod the debt is expected to be outstanding, using the interest method of amortization. Short-term debt is debt coming due in the nexttwelve months, including that portion of debt otherwise classified as long-term. The short-term debt caption may exclude short-term debtitems the Company intends to refinance on a long-term basis in the near term. See Note 14 for additional information regarding short-termand long-term debt.
Income TaxesThe Company and its includible domestic subsidiaries file a consolidated federal income tax return that includes both life insurance
companies and non-life insurance companies. Non-includible domestic subsidiaries file separate individual corporate tax returns.Subsidiaries operating outside the U.S. are taxed, and income tax expense is recorded, based on applicable foreign statutes. See Note 19 fora discussion of certain non-U.S. jurisdictions for which the Company assumes repatriation of earnings to the U.S.
Deferred income taxes are recognized, based on enacted rates, when assets and liabilities have different values for financial statementand tax reporting purposes. A valuation allowance is recorded to reduce a deferred tax asset to the amount expected to be realized.
Prudential Financial, Inc. 2013 Annual Report 123
PRUDENTIAL FINANCIAL, INC.
Notes to Consolidated Financial Statements
2. SIGNIFICANT ACCOUNTING POLICIES AND PRONOUNCEMENTS (continued)
Items required by tax regulations to be included in the tax return may differ from the items reflected in the financial statements. As aresult, the effective tax rate reflected in the financial statements may be different than the actual rate applied on the tax return. Some ofthese differences are permanent such as expenses that are not deductible in the Company’s tax return, and some differences are temporary,reversing over time, such as valuation of insurance reserves. Temporary differences create deferred tax assets and liabilities. Deferred taxassets generally represent items that can be used as a tax deduction or credit in future years for which the Company has already recordedthe tax benefit in the Company’s income statement. Deferred tax liabilities generally represent tax expense recognized in the Company’sfinancial statements for which payment has been deferred, or expenditures for which the Company has already taken a deduction in theCompany’s tax return but have not yet been recognized in the Company’s financial statements.
The application of U.S. GAAP requires the Company to evaluate the recoverability of the Company’s deferred tax assets and establisha valuation allowance if necessary to reduce the Company’s deferred tax assets to an amount that is more likely than not to be realized.Considerable judgment is required in determining whether a valuation allowance is necessary, and if so, the amount of such valuationallowance. In evaluating the need for a valuation allowance the Company may consider many factors, including: (1) the nature of thedeferred tax assets and liabilities; (2) whether they are ordinary or capital; (3) in which tax jurisdictions they were generated and the timingof their reversal; (4) taxable income in prior carryback years as well as projected taxable earnings exclusive of reversing temporarydifferences and carryforwards; (5) the length of time that carryovers can be utilized in the various taxing jurisdictions; (6) any unique taxrules that would impact the utilization of the deferred tax assets; and (7) any tax planning strategies that the Company would employ toavoid a tax benefit from expiring unused. Although realization is not assured, management believes it is more likely than not that thedeferred tax assets, net of valuation allowances, will be realized.
U.S. GAAP prescribes a comprehensive model for how a company should recognize, measure, present, and disclose in its financialstatements uncertain tax positions that a company has taken or expects to take on tax returns. The application of this guidance is a two-stepprocess, the first step being recognition. The Company determines whether it is more likely than not, based on the technical merits, that thetax position will be sustained upon examination. If a tax position does not meet the more likely than not recognition threshold, the benefitof that position is not recognized in the financial statements. The second step is measurement. The Company measures the tax position asthe largest amount of benefit that is greater than 50 percent likely of being realized upon ultimate resolution with a taxing authority that hasfull knowledge of all relevant information. This measurement considers the amounts and probabilities of the outcomes that could berealized upon ultimate settlement using the facts, circumstances, and information available at the reporting date.
The Company’s liability for income taxes includes the liability for unrecognized tax benefits, interest and penalties which relate to taxyears still subject to review by the Internal Revenue Service (“IRS”) or other taxing jurisdictions. Audit periods remain open for reviewuntil the statute of limitations has passed. Generally, for tax years which produce net operating losses, capital losses or tax creditcarryforwards (“tax attributes”), the statute of limitations does not close, to the extent of these tax attributes, until the expiration of thestatute of limitations for the tax year in which they are fully utilized. The completion of review or the expiration of the statute of limitationsfor a given audit period could result in an adjustment to the liability for income taxes. The Company classifies all interest and penaltiesrelated to tax uncertainties as income tax expense. See Note 19 for additional information regarding income taxes.
Adoption of New Accounting PronouncementsIn December 2013, the FASB issued updated guidance establishing a single definition of a public entity for use in financial accounting
and reporting guidance. This new guidance is effective for all current and future reporting periods and did not have a significant effect onthe Company’s consolidated financial position, results of operations, or financial statement disclosures.
In July 2013, the FASB issued new guidance regarding derivatives. The guidance permits the Fed Funds Effective Swap Rate (orOvernight Index Swap Rate) to be used as a U.S. benchmark interest rate for hedge accounting, in addition to the United States Treasuryrate and London Inter-Bank Offered Rate (“LIBOR”). The guidance also removes the restriction on using different benchmark rates forsimilar hedges. The guidance is effective for qualifying new or redesignated hedging relationships entered into on or after July 17, 2013,and should be applied prospectively. Adoption of the guidance did not have a significant effect on the Company’s consolidated financialposition, results of operations, and financial statement disclosures.
In February 2013, the FASB issued updated guidance regarding the presentation of comprehensive income. Under the guidance, anentity is required to separately present information about significant items reclassified out of accumulated other comprehensive income bycomponent as well as changes in accumulated other comprehensive income balances by component in either the financial statements or thenotes to the financial statements. The guidance does not change the items that are reported in other comprehensive income, does not changewhen an item of other comprehensive income must be reclassified to net income, and does not amend any existing requirements forreporting net income or other comprehensive income. The guidance is effective for the first interim or annual reporting period beginningafter December 15, 2012, and should be applied prospectively. The disclosures required by this guidance are included in Note 15.
In December 2011 and January 2013, the Financial Accounting Standards Board (“FASB”) issued updated guidance regarding thedisclosure of recognized derivative instruments (including bifurcated embedded derivatives), repurchase agreements and securitiesborrowing/lending transactions that are offset in the statement of financial position or are subject to an enforceable master nettingarrangement or similar agreement (irrespective of whether they are offset in the statement of financial position). This new guidancerequires an entity to disclose information on both a gross and net basis about instruments and transactions within the scope of this guidance.This new guidance is effective for interim or annual reporting periods beginning on or after January 1, 2013, and should be appliedretrospectively for all comparative periods presented. The disclosures required by this guidance are included in Note 21.
In December 2012, the Company adopted retrospectively a change in method of applying an accounting principle for the Company’spension plans. The change in accounting method relates to the calculation of market related value of pension plan assets, used to determinenet periodic pension cost. The impact of this change in accounting method on net income for the year ended December 31, 2012, was an
124 Prudential Financial, Inc. 2013 Annual Report

PRUDENTIAL FINANCIAL, INC.
Notes to Consolidated Financial Statements
2. SIGNIFICANT ACCOUNTING POLICIES AND PRONOUNCEMENTS (continued)
increase of $96 million ($0.21 diluted earnings per share of Common stock). In addition, this change resulted in a cumulative increase of$144 million in retained earnings previously reported for December 31, 2009, with a corresponding decrease in AOCI. For additionalinformation on the change in accounting method for the Company’s pension plans, see Note 18.
Effective January 1, 2012, the Company adopted, retrospectively, new authoritative guidance to address diversity in practice regardingthe interpretation of which costs relating to the acquisition of new or renewal insurance contracts qualify for deferral. Under the amendedguidance, acquisition costs are to include only those costs that are directly related to the acquisition or renewal of insurance contracts byapplying a model similar to the accounting for loan origination costs. An entity may defer incremental direct costs of contract acquisitionwith independent third parties or employees that are essential to the contract transaction, as well as the portion of employee compensation,including payroll fringe benefits and other costs directly related to underwriting, policy issuance and processing, medical inspection, andcontract selling for successfully negotiated contracts. Prior period financial information presented in these financial statements has beenadjusted to reflect the retrospective adoption of the amended guidance. Retained earnings and AOCI previously reported for December 31,2009, were reduced $2,358 million and $90 million, respectively, as a result of this retrospective adoption. The lower level of costs nowqualifying for deferral will be only partially offset by a lower level of amortization of “Deferred policy acquisition costs”, and, as such, willinitially result in lower earnings in future periods, primarily within the International Insurance and Individual Annuities segments. Theimpact to the International Insurance segment largely reflects lower deferrals of allocated costs of its proprietary distribution system, whilethe impact to the Individual Annuities segment mainly reflects lower deferrals of its wholesaler costs. This amended guidance is effectivefor fiscal years, and interim periods within those years, beginning after December 15, 2011, and permits, but does not require, retrospectiveapplication. The Company adopted this guidance effective January 1, 2012, and applied the retrospective method of adoption. While theadoption of this amended guidance changes the timing of when certain costs are reflected in the Company’s results of operations, it has noeffect on the total acquisition costs to be recognized over time and has no impact on the Company’s cash flows.
In September 2011, the Financial Accounting Standards Board (“FASB”) issued updated guidance regarding the application of thegoodwill impairment test. The updated guidance allows an entity to first perform a qualitative assessment to determine whether theexistence of events or circumstances leads to a determination that it is more likely than not that the fair value of a reporting unit is less thanits carrying amount. If, after assessing the totality of events or circumstances, an entity determines it is not more likely than not that the fairvalue of a reporting unit is less than its carrying amount, then performing the two-step impairment test is not necessary. However, if anentity concludes otherwise, then it must perform the first step of the two-step impairment test by calculating the fair value of the reportingunit and comparing the fair value with the carrying amount of the reporting unit. If the carrying amount of a reporting unit exceeds its fairvalue, then the entity is required to perform the second step of the goodwill impairment test to measure the impairment loss, if any. Anentity has the option to bypass the qualitative assessment for any reporting unit in any period and to proceed directly to performing the firststep of the two-step goodwill impairment test. An entity may resume performing the qualitative assessment in any subsequent period. Theupdated guidance is effective for annual and interim goodwill impairment tests performed for fiscal years beginning after December 15,2011. The Company’s early adoption of this guidance, as permitted, effective December 31, 2011, had no impact on the Company’sconsolidated financial position, results of operations, and financial statement disclosures.
In June 2011, the FASB issued updated guidance regarding the presentation of comprehensive income. The updated guidanceeliminates the option to present components of other comprehensive income as part of the statement of changes in stockholders’ equity.Under the updated guidance, an entity has the option to present the total of comprehensive income, the components of net income, and thecomponents of other comprehensive income either in a single continuous statement of comprehensive income or in two separate butconsecutive statements. The updated guidance does not change the items that are reported in other comprehensive income or when an itemof other comprehensive income must be reclassified to net income. The Company opted to present the total of comprehensive income, thecomponents of net income, and the components of other comprehensive income in two separate but consecutive statements. TheConsolidated Financial Statements included herein reflect the adoption of this updated guidance.
In May 2011, the FASB issued updated guidance regarding the fair value measurements and disclosure requirements. The updatedguidance clarifies existing guidance related to the application of fair value measurement methods and requires expanded disclosures. Thisnew guidance is effective for the first interim or annual reporting period beginning after December 15, 2011, and should be appliedprospectively. The expanded disclosures required by this guidance are included in Note 20. Adoption of this guidance did not have asignificant effect on the Company’s consolidated financial position or results of operations.
In April 2011, the FASB issued updated guidance regarding the assessment of effective control for repurchase agreements. This newguidance is effective for the first interim or annual reporting period beginning on or after December 15, 2011, and should be appliedprospectively to transactions or modifications of existing transactions that occur on or after the effective date. The Company’s adoption ofthis guidance did not have a significant effect on the Company’s consolidated financial position, results of operations, and financial statementdisclosures.
In April 2011, the FASB issued updated guidance clarifying which restructurings constitute troubled debt restructurings. It is intendedto assist creditors in their evaluation of whether conditions exist that constitute a troubled debt restructuring. This new guidance is effectivefor the first interim or annual reporting period beginning on or after June 15, 2011, and should be applied retrospectively to the beginningof the annual reporting period of adoption. The Company’s adoption of this guidance in the third quarter of 2011 did not have a significanteffect on the Company’s consolidated financial position, results of operations, or financial statement disclosures.
Future Adoption of New Accounting PronouncementsIn March 2013, the FASB issued updated guidance regarding the recognition in net income of the cumulative translation adjustment
upon the sale or loss of control of a business or group of assets residing in a foreign subsidiary, or a loss of control of a foreign investment.The guidance is effective for the first interim or annual reporting period beginning after December 15, 2013, and should be appliedprospectively. The amendments require an entity that ceases to have a controlling financial interest in a subsidiary or group of assets within
Prudential Financial, Inc. 2013 Annual Report 125

PRUDENTIAL FINANCIAL, INC.
Notes to Consolidated Financial Statements
2. SIGNIFICANT ACCOUNTING POLICIES AND PRONOUNCEMENTS (continued)
a foreign entity to release any related cumulative translation adjustment into net income only if the sale or transfer results in the completeor substantially complete liquidation of the foreign entity in which the subsidiary or group of assets had resided. For an equity methodinvestment that is a foreign entity, the partial sale guidance still applies. As such, a pro rata portion of the cumulative translation adjustmentshould be released into net income upon a partial sale of such an equity method investment. This guidance is not expected to have asignificant effect on the Company’s consolidated financial position, results of operations, and financial statement disclosures.
In June 2013, the FASB issued updated guidance clarifying the characteristics of an investment company and requiring newdisclosures. Under the guidance, all entities regulated under the Investment Company Act of 1940 automatically qualify as investmentcompanies, while all other entities need to consider both the fundamental and typical characteristics of an investment company indetermining whether they qualify as investment companies. This new guidance is effective for interim or annual reporting periods thatbegin after December 15, 2013, and should be applied prospectively. This guidance is not expected to have a significant effect on theCompany’s consolidated financial position, results of operations, and financial statement disclosures.
In July 2013, the FASB issued updated guidance regarding the presentation of unrecognized tax benefits when net operating losscarryforwards, similar tax losses, or tax credit carryforwards exist. This new guidance is effective for interim or annual reporting periodsthat begin after December 15, 2013, and should be applied prospectively, with early application permitted. This guidance is not expected tohave a significant effect on the Company’s consolidated financial position, results of operations, and financial statement disclosures.
In January 2014, the FASB issued updated guidance regarding investments in flow-through limited liability entities that manage orinvest in affordable housing projects that qualify for the low-income housing tax credit. Under the guidance, an entity is permitted to makean accounting policy election to amortize the initial cost of its investment in proportion to the tax credits and other tax benefits received andrecognize the net investment performance in the statement of operations as a component of income tax expense (benefit) if certainconditions are met. The new guidance is effective for annual periods and interim reporting periods within those annual periods, beginningafter December 15, 2014, and should be applied retrospectively to all periods presented. The Company is currently assessing the impact ofthe guidance on the Company’s consolidated financial position, results of operations, and financial statement disclosures.
In January 2014, the FASB issued updated guidance for troubled debt restructurings clarifying when an in substance repossession orforeclosure occurs, and when a creditor is considered to have received physical possession of residential real estate property collateralizinga consumer mortgage loan. The new guidance is effective for annual periods and interim periods within those annual periods, beginningafter December 15, 2014. This guidance can be elected for prospective adoption or by using a modified retrospective transition method.This guidance is not expected to have a significant impact on the Company’s consolidated financial position, results of operations, orfinancial statement disclosures.
In January 2014, the FASB issued updated guidance specifying that an operating entity in a service concession arrangement within thescope of this guidance should not account for the service concession arrangement as a lease. The new guidance is effective for annualperiods, and interim periods within those annual periods, beginning after December 15, 2014, and should be applied on a modifiedretrospective basis. This guidance is not expected to have a significant impact on the Company’s consolidated financial position, results ofoperations, or financial statement disclosures.
3. ACQUISITIONS AND DISPOSITIONS
Acquisition of UniAsia Life AssuranceOn January 2, 2014, the Company completed the acquisition of UniAsia Life Assurance Berhad, an established life insurance
company in Malaysia, through the formation of a joint venture with Bank Simpanan Nasional (“BSN”), a bank owned by the Malaysiangovernment. The joint venture paid cash consideration of approximately $160 million, 70% of which was provided by Prudential Insuranceand 30% of which was provided by BSN. This acquisition is part of the Company’s strategic initiative to further expand its business inSoutheast Asian markets.
Acquisition of The Hartford’s Individual Life Insurance BusinessOn January 2, 2013, the Company acquired The Hartford’s individual life insurance business through a reinsurance transaction. Under
the agreement, the Company paid The Hartford cash consideration of $615 million, primarily in the form of a ceding commission toprovide reinsurance for approximately 700,000 life insurance policies with net retained face amount in force of approximately $141 billion.The acquisition increased the Company’s scale in the U.S. individual life insurance market, particularly universal life products, andprovided complementary distribution opportunities through expanded wirehouse and bank distribution channels.
The assets and liabilities assumed have been included in the Company’s Consolidated Financial Statements as of the acquisition date.After adjustments, total assets assumed were $11.2 billion, which includes $1.4 billion of value of business acquired and $0.1 billion of cash,and total liabilities assumed were $10.6 billion. There is no goodwill, including tax deductible goodwill, associated with the acquisition.
Acquisition of AIG Star Life Insurance Co., Ltd., AIG Edison Life Insurance Company and Related Entities from AIGOn February 1, 2011, Prudential Financial completed the acquisition from American International Group, Inc. (“AIG”) of AIG Star
Life Insurance Co., Ltd. (“Star”), AIG Edison Life Insurance Company (“Edison”), AIG Financial Assurance Japan K.K., and AIG EdisonService Co., Ltd. (collectively, the “Star and Edison Businesses”) pursuant to the stock purchase agreement dated September 30, 2010,between Prudential Financial and AIG. The total purchase price was $4,709 million, comprised of $4,213 million in cash and $496 millionin assumed third party debt, substantially all of which is expected to be repaid, over time, with excess capital of the acquired entities. Theacquisition of these businesses included the purchase by the Company of all of the shares of these entities, which became indirect wholly-owned subsidiaries of the Company. All acquired entities were Japanese corporations and their businesses were in Japan, increasing the
126 Prudential Financial, Inc. 2013 Annual Report

PRUDENTIAL FINANCIAL, INC.
Notes to Consolidated Financial Statements
3. ACQUISITIONS AND DISPOSITIONS (continued)
Company’s scale in the Japanese insurance market. On January 1, 2012, Star and Edison were merged into Gibraltar Life. Goodwillresulting from the acquisition of the Star and Edison Businesses amounted to $173 million, none of which is tax deductible.
The following supplemental information presents selected unaudited pro forma information for the Company assuming the acquisitionhad occurred as of January 1, 2011. This pro forma information does not purport to represent what the Company’s actual results ofoperations would have been if the acquisition had occurred as of the date indicated or what such results would be for any future periods,and does not reflect the impact of future events that may occur.
Year Ended December 31,
2011
(in millions, except per share amount)Total revenues . . . . . . . . . . . . . . . . . . . . . . . . . . . . . . . . . . . . . . . . . . . . . . . . . . . . . . . . . . . . . . . . . . . . . . . . . . . . . . . $50,405Income from continuing operations . . . . . . . . . . . . . . . . . . . . . . . . . . . . . . . . . . . . . . . . . . . . . . . . . . . . . . . . . . . . . . . $ 3,796Net income attributable to Prudential Financial, Inc. . . . . . . . . . . . . . . . . . . . . . . . . . . . . . . . . . . . . . . . . . . . . . . . . . $ 3,797Earnings per share
Financial Services BusinessesBasic earnings per share—Common Stock:
Income from continuing operations attributable to Prudential Financial, Inc. . . . . . . . . . . . . . . . . . . $ 7.48Net income attributable to Prudential Financial, Inc. . . . . . . . . . . . . . . . . . . . . . . . . . . . . . . . . . . . . . $ 7.56
Diluted earnings per share—Common Stock:Income from continuing operations attributable to Prudential Financial, Inc. . . . . . . . . . . . . . . . . . . $ 7.39Net income attributable to Prudential Financial, Inc. . . . . . . . . . . . . . . . . . . . . . . . . . . . . . . . . . . . . . $ 7.46
Closed Block BusinessBasic and Diluted earnings per share—Class B Stock:
Income from continuing operations attributable to Prudential Financial, Inc. . . . . . . . . . . . . . . . . . . $ 61.00Net income attributable to Prudential Financial, Inc. . . . . . . . . . . . . . . . . . . . . . . . . . . . . . . . . . . . . . $ 61.00
Sale of Wealth Management Solutions Business
In April 2013, the Company signed a definitive agreement to sell its wealth management solutions business to Envestnet Inc. Thetransaction, which does not have a material impact to the Company’s financial results, closed on July 1, 2013. Due to the existence of anongoing contractual relationship between the Company and these operations, this disposition did not qualify for discontinued operationstreatment under U.S. GAAP. See Note 22 for additional information.
Sale of Real Estate Brokerage Franchise and Relocation Services Business
On December 6, 2011, the Company sold its real estate brokerage franchise and relocation services business (“PRERS”) to BrookfieldAsset Management, Inc. The Prudential Real Estate Financial Services Company of America Inc. (“PREFSA”), a finance subsidiary of theCompany with investments in a limited number of real estate brokerage franchises, was excluded from the transaction. The proceeds fromthe sale, before transaction related expenses, were $108 million and resulted in a pre-tax gain of $49 million and an after tax gain of $62million.
Under the sale agreement, the real estate brokerage franchisees may continue to use the Company’s trademark, based on the terms oftheir respective franchise agreements. In addition, the Company had agreed to provide certain Brookfield affiliates with transitionalfinancing for the transferred relocation services business. This transitional financing was terminated on October 26, 2012.
PRERS did not qualify for discontinued operations treatment under U.S. GAAP due to the financing provided to Brookfield and theretained equity in PREFSA.
Discontinued Operations
Income from discontinued operations, including charges upon disposition, for the years ended December 31, are as follows:
2013 2012 2011
(in millions)Real estate investments sold or held for sale(1) . . . . . . . . . . . . . . . . . . . . . . . . . . . . . . . . . . . . . . . . . . . . . . . . . . . . . $ 9 $22 $37Global commodities business(2) . . . . . . . . . . . . . . . . . . . . . . . . . . . . . . . . . . . . . . . . . . . . . . . . . . . . . . . . . . . . . . . . . 1 0 16Other . . . . . . . . . . . . . . . . . . . . . . . . . . . . . . . . . . . . . . . . . . . . . . . . . . . . . . . . . . . . . . . . . . . . . . . . . . . . . . . . . . . . . . 0 1 0
Income from discontinued operations before income taxes . . . . . . . . . . . . . . . . . . . . . . . . . . . . . . . . . . . . . . . . 10 23 53Income tax expense . . . . . . . . . . . . . . . . . . . . . . . . . . . . . . . . . . . . . . . . . . . . . . . . . . . . . . . . . . . . . . . . . . . 3 8 18
Income from discontinued operations, net of taxes . . . . . . . . . . . . . . . . . . . . . . . . . . . . . . . . . . . . . . . . . . . . . . . $ 7 $15 $35
(1) Reflects the income from discontinued real estate investments.
Prudential Financial, Inc. 2013 Annual Report 127

PRUDENTIAL FINANCIAL, INC.
Notes to Consolidated Financial Statements
3. ACQUISITIONS AND DISPOSITIONS (continued)
(2) In 2011, the Company completed the sale of all the issued and outstanding shares of capital stock of the subsidiaries that conduct its global commoditiesbusiness (the “Global Commodities Business”) and certain assets that are primarily used in connection with the Global Commodities Business toJefferies Group, Inc. (“Jefferies”). Subsidiaries included in the sale were Prudential Bache Commodities, LLC, Prudential Bache Securities, LLC, BacheCommodities Limited, and Bache Commodities (Hong Kong) Ltd. The Company received cash proceeds of $422 million. Included in the table abovefor the year ended December 31, 2011, are after-tax losses of $17 million recorded in connection with the sale of these operations, consisting of pre-taxlosses of $18 million and income tax benefit of $1 million.
Charges recorded in connection with the disposals of businesses include estimates that are subject to subsequent adjustment.
The Company’s Consolidated Statements of Financial Position include total assets and total liabilities related to discontinuedbusinesses as follows:
December 31, 2013 December 31, 2012
(in millions)Total assets . . . . . . . . . . . . . . . . . . . . . . . . . . . . . . . . . . . . . . . . . . . . . . . . . . . . . . . . . . . . . . . . . . $15 $13Total liabilities . . . . . . . . . . . . . . . . . . . . . . . . . . . . . . . . . . . . . . . . . . . . . . . . . . . . . . . . . . . . . . . . $ 7 $ 0
4. INVESTMENTS
Fixed Maturities and Equity Securities
The following tables provide information relating to fixed maturities and equity securities (excluding investments classified as trading)as of the dates indicated:
December 31, 2013
AmortizedCost
GrossUnrealized
Gains
GrossUnrealized
LossesFair
Value
Other-than-temporary
Impairmentsin AOCI(3)
(in millions)Fixed maturities, available-for-saleU.S. Treasury securities and obligations of U.S. government
authorities and agencies . . . . . . . . . . . . . . . . . . . . . . . . . . . . . $ 13,754 $ 1,742 $ 96 $ 15,400 $ 0Obligations of U.S. states and their political subdivisions . . . . . 3,598 274 137 3,735 0Foreign government bonds . . . . . . . . . . . . . . . . . . . . . . . . . . . . . 75,595 7,459 266 82,788 1Corporate securities . . . . . . . . . . . . . . . . . . . . . . . . . . . . . . . . . . 145,091 12,095 3,408 153,778 (4)Asset-backed securities(1) . . . . . . . . . . . . . . . . . . . . . . . . . . . . . 10,691 214 316 10,589 (755)Commercial mortgage-backed securities . . . . . . . . . . . . . . . . . . 13,633 403 163 13,873 0Residential mortgage-backed securities(2) . . . . . . . . . . . . . . . . . 6,365 379 41 6,703 (7)
Total fixed maturities, available-for-sale . . . . . . . . . . . . . . $268,727 $22,566 $4,427 $286,866 $(765)
Equity securities, available-for-sale . . . . . . . . . . . . . . . . . . . . $ 7,003 $ 2,931 $ 24 $ 9,910
December 31, 2013
AmortizedCost
GrossUnrealized
Gains
GrossUnrealized
LossesFair
Value
(in millions)Fixed maturities, held-to-maturityForeign government bonds . . . . . . . . . . . . . . . . . . . . . . . $ 938 $117 $ 0 $1,055Corporate securities(4) . . . . . . . . . . . . . . . . . . . . . . . . . . 904 50 24 930Asset-backed securities(1) . . . . . . . . . . . . . . . . . . . . . . . . 693 46 0 739Commercial mortgage-backed securities . . . . . . . . . . . . . 166 18 0 184Residential mortgage-backed securities(2) . . . . . . . . . . . 611 34 0 645
Total fixed maturities, held-to-maturity(4) . . . . . . . $3,312 $265 $24 $3,553
(1) Includes credit-tranched securities collateralized by sub-prime mortgages, auto loans, credit cards, education loans and other assettypes.
(2) Includes publicly-traded agency pass-through securities and collateralized mortgage obligations.(3) Represents the amount of other-than-temporary impairment losses in AOCI, which were not included in earnings. Amount excludes
$875 million of net unrealized gains on impaired available-for-sale securities and $1 million on impaired held-to-maturity securitiesrelating to changes in the value of such securities subsequent to the impairment measurement date.
(4) Excludes notes with amortized cost of $2,400 million (fair value, $2,461 million) which have been offset with the associated payablesunder a netting agreement.
128 Prudential Financial, Inc. 2013 Annual Report

PRUDENTIAL FINANCIAL, INC.
Notes to Consolidated Financial Statements
4. INVESTMENTS (continued)December 31, 2012
AmortizedCost
GrossUnrealized
Gains
GrossUnrealized
LossesFair
Value
Other-than-temporary
Impairmentsin AOCI(3)
(in millions)Fixed maturities, available-for-saleU.S. Treasury securities and obligations of U.S. government
authorities and agencies . . . . . . . . . . . . . . . . . . . . . . . . . . . . . $ 13,973 $ 3,448 $ 35 $ 17,386 $ 0Obligations of U.S. states and their political subdivisions . . . . . 2,952 505 5 3,452 0Foreign government bonds . . . . . . . . . . . . . . . . . . . . . . . . . . . . . 81,578 6,778 66 88,290 1Corporate securities . . . . . . . . . . . . . . . . . . . . . . . . . . . . . . . . . . 146,924 13,996 1,589 159,331 (2)Asset-backed securities(1) . . . . . . . . . . . . . . . . . . . . . . . . . . . . . 11,846 221 731 11,336 (964)Commercial mortgage-backed securities . . . . . . . . . . . . . . . . . . 11,228 726 17 11,937 5Residential mortgage-backed securities(2) . . . . . . . . . . . . . . . . . 9,153 484 33 9,604 (11)
Total fixed maturities, available-for-sale . . . . . . . . . . . . . . $277,654 $26,158 $2,476 $301,336 $(971)
Equity securities, available-for-sale . . . . . . . . . . . . . . . . . . . . $ 6,759 $ 1,573 $ 55 $ 8,277
December 31, 2012
AmortizedCost
GrossUnrealized
Gains
GrossUnrealized
LossesFair
Value
(in millions)Fixed maturities, held-to-maturityForeign government bonds . . . . . . . . . . . . . . . . . . . . . . . . . . . . . $1,142 $108 $ 0 $1,250Corporate securities(4) . . . . . . . . . . . . . . . . . . . . . . . . . . . . . . . . 1,065 37 67 1,035Asset-backed securities(1) . . . . . . . . . . . . . . . . . . . . . . . . . . . . . 1,001 66 0 1,067Commercial mortgage-backed securities . . . . . . . . . . . . . . . . . . 302 49 0 351Residential mortgage-backed securities(2) . . . . . . . . . . . . . . . . . 758 50 0 808
Total fixed maturities, held-to-maturity(4) . . . . . . . . . . . . . $4,268 $310 $67 $4,511
(1) Includes credit-tranched securities collateralized by sub-prime mortgages, auto loans, credit cards, education loans, and other asset types.(2) Includes publicly-traded agency pass-through securities and collateralized mortgage obligations.(3) Represents the amount of other-than-temporary impairment losses in AOCI, which were not included in earnings. Amount excludes $778 million of net
unrealized gains on impaired available-for-sale securities and $1 million of net unrealized gains on impaired held-to-maturity securities relating tochanges in the value of such securities subsequent to the impairment measurement date.
(4) Excludes notes with amortized cost of $1,500 million (fair value, $1,660 million) which have been offset with the associated payables under a nettingagreement.
The amortized cost and fair value of fixed maturities by contractual maturities at December 31, 2013, are as follows:
Available-for-Sale Held-to-Maturity
AmortizedCost
FairValue
AmortizedCost
FairValue
(in millions)Due in one year or less . . . . . . . . . . . . . . . . . . . . . . . . . . . . . . . . . . . . . . . . . . . . . . . . . . . $ 9,160 $ 9,591 $ 0 $ 0Due after one year through five years . . . . . . . . . . . . . . . . . . . . . . . . . . . . . . . . . . . . . . . 47,219 51,622 55 56Due after five years through ten years . . . . . . . . . . . . . . . . . . . . . . . . . . . . . . . . . . . . . . . 57,745 62,682 323 331Due after ten years(1) . . . . . . . . . . . . . . . . . . . . . . . . . . . . . . . . . . . . . . . . . . . . . . . . . . . . 123,914 131,806 1,464 1,597Asset-backed securities . . . . . . . . . . . . . . . . . . . . . . . . . . . . . . . . . . . . . . . . . . . . . . . . . . . 10,691 10,589 693 739Commercial mortgage-backed securities . . . . . . . . . . . . . . . . . . . . . . . . . . . . . . . . . . . . . 13,633 13,873 166 184Residential mortgage-backed securities . . . . . . . . . . . . . . . . . . . . . . . . . . . . . . . . . . . . . . 6,365 6,703 611 646
Total . . . . . . . . . . . . . . . . . . . . . . . . . . . . . . . . . . . . . . . . . . . . . . . . . . . . . . . . . . . . . $268,727 $286,866 $3,312 $3,553
(1) Excludes notes with amortized cost of $2,400 million (fair value, $2,461 million) which have been offset with the associated payables under a nettingagreement.
Actual maturities may differ from contractual maturities because issuers may have the right to call or prepay obligations. Asset-backed, commercial mortgage-backed, and residential mortgage-backed securities are shown separately in the table above, as they are notdue at a single maturity date.
Prudential Financial, Inc. 2013 Annual Report 129

PRUDENTIAL FINANCIAL, INC.
Notes to Consolidated Financial Statements
4. INVESTMENTS (continued)
The following table depicts the sources of fixed maturity proceeds and related investment gains (losses), as well as losses onimpairments of both fixed maturities and equity securities:
2013 2012 2011
(in millions)Fixed maturities, available-for-sale
Proceeds from sales . . . . . . . . . . . . . . . . . . . . . . . . . . . . . . . . . . . . . . . . . . . . . . . . . . . . . . . . . . . . . . . . . $37,248 $15,919 $24,834Proceeds from maturities/repayments . . . . . . . . . . . . . . . . . . . . . . . . . . . . . . . . . . . . . . . . . . . . . . . . . . . 23,573 21,897 17,660Gross investment gains from sales, prepayments, and maturities . . . . . . . . . . . . . . . . . . . . . . . . . . . . . . 1,571 659 1,100Gross investment losses from sales and maturities . . . . . . . . . . . . . . . . . . . . . . . . . . . . . . . . . . . . . . . . . (1,465) (359) (335)
Fixed maturities, held-to-maturityGross investment gains from prepayments . . . . . . . . . . . . . . . . . . . . . . . . . . . . . . . . . . . . . . . . . . . . . . . $ 0 $ 0 $ 0Proceeds from maturities/repayments . . . . . . . . . . . . . . . . . . . . . . . . . . . . . . . . . . . . . . . . . . . . . . . . . . . 583 530 457
Equity securities, available-for-saleProceeds from sales . . . . . . . . . . . . . . . . . . . . . . . . . . . . . . . . . . . . . . . . . . . . . . . . . . . . . . . . . . . . . . . . . $ 4,235 $ 4,189 $ 3,750Gross investment gains from sales . . . . . . . . . . . . . . . . . . . . . . . . . . . . . . . . . . . . . . . . . . . . . . . . . . . . . 554 422 506Gross investment losses from sales . . . . . . . . . . . . . . . . . . . . . . . . . . . . . . . . . . . . . . . . . . . . . . . . . . . . . (94) (273) (249)
Fixed maturity and equity security impairmentsNet writedowns for other-than-temporary impairment losses on fixed maturities recognized in
earnings(1) . . . . . . . . . . . . . . . . . . . . . . . . . . . . . . . . . . . . . . . . . . . . . . . . . . . . . . . . . . . . . . . . . . . . . . $ (200) $ (337) $ (535)Writedowns for impairments on equity securities . . . . . . . . . . . . . . . . . . . . . . . . . . . . . . . . . . . . . . . . . . (15) (125) (112)
(1) Excludes the portion of other-than-temporary impairments recorded in “Other comprehensive income (loss),” representing any difference between thefair value of the impaired debt security and the net present value of its projected future cash flows at the time of impairment.
As discussed in Note 2, a portion of certain other-than-temporary impairment (“OTTI”) losses on fixed maturity securities arerecognized in “Other comprehensive income (loss)” (“OCI”). For these securities, the net amount recognized in earnings (“credit lossimpairments”) represents the difference between the amortized cost of the security and the net present value of its projected future cashflows discounted at the effective interest rate implicit in the debt security prior to impairment. Any remaining difference between the fairvalue and amortized cost is recognized in OCI. The following table sets forth the amount of pre-tax credit loss impairments on fixedmaturity securities held by the Company as of the dates indicated, for which a portion of the OTTI loss was recognized in OCI, and thecorresponding changes in such amounts.
Credit losses recognized in earnings on fixed maturity securities held by the Company for which a portion of theOTTI loss was recognized in OCI
Year Ended December 31,
2013 2012
(in millions)Balance, beginning of period . . . . . . . . . . . . . . . . . . . . . . . . . . . . . . . . . . . . . . . . . . . . . . . . . . . . . . . . . . . . . . . . . . . . $1,166 $1,475Credit loss impairments previously recognized on securities which matured, paid down, prepaid or were sold
during the period . . . . . . . . . . . . . . . . . . . . . . . . . . . . . . . . . . . . . . . . . . . . . . . . . . . . . . . . . . . . . . . . . . . . . . . . . . . . (314) (384)Credit loss impairments previously recognized on securities impaired to fair value during the period(1) . . . . . . . . . (4) (88)Credit loss impairment recognized in the current period on securities not previously impaired . . . . . . . . . . . . . . . . . 9 33Additional credit loss impairments recognized in the current period on securities previously impaired . . . . . . . . . . . 74 94Increases due to the passage of time on previously recorded credit losses . . . . . . . . . . . . . . . . . . . . . . . . . . . . . . . . . 52 63Accretion of credit loss impairments previously recognized due to an increase in cash flows expected to be
collected . . . . . . . . . . . . . . . . . . . . . . . . . . . . . . . . . . . . . . . . . . . . . . . . . . . . . . . . . . . . . . . . . . . . . . . . . . . . . . . . . . (15) (27)
Balance, end of period . . . . . . . . . . . . . . . . . . . . . . . . . . . . . . . . . . . . . . . . . . . . . . . . . . . . . . . . . . . . . . . . . . . . . . . . . $ 968 $1,166
(1) Represents circumstances where the Company determined in the current period that it intends to sell the security or it is more likely than not that it willbe required to sell the security before recovery of the security’s amortized cost.
130 Prudential Financial, Inc. 2013 Annual Report

PRUDENTIAL FINANCIAL, INC.
Notes to Consolidated Financial Statements
4. INVESTMENTS (continued)
Trading Account Assets Supporting Insurance Liabilities
The following table sets forth the composition of “Trading account assets supporting insurance liabilities” as of the dates indicated:
December 31, 2013 December 31, 2012
AmortizedCost
FairValue
AmortizedCost
FairValue
(in millions)Short-term investments and cash equivalents . . . . . . . . . . . . . . . . . . . . . . . . . . . . . . . . . . $ 697 $ 697 $ 938 $ 938Fixed maturities:
Corporate securities . . . . . . . . . . . . . . . . . . . . . . . . . . . . . . . . . . . . . . . . . . . . . . . . . 12,109 12,616 11,076 12,107Commercial mortgage-backed securities . . . . . . . . . . . . . . . . . . . . . . . . . . . . . . . . . 2,417 2,441 2,096 2,229Residential mortgage-backed securities(1) . . . . . . . . . . . . . . . . . . . . . . . . . . . . . . . . 1,857 1,830 1,965 2,026Asset-backed securities(2) . . . . . . . . . . . . . . . . . . . . . . . . . . . . . . . . . . . . . . . . . . . . 1,096 1,107 1,179 1,116Foreign government bonds . . . . . . . . . . . . . . . . . . . . . . . . . . . . . . . . . . . . . . . . . . . . 579 596 683 708U.S. government authorities and agencies and obligations of U.S. states . . . . . . . . 303 341 369 426
Total fixed maturities . . . . . . . . . . . . . . . . . . . . . . . . . . . . . . . . . . . . . . . . . . . . . . . . . . . . 18,361 18,931 17,368 18,612
Equity securities . . . . . . . . . . . . . . . . . . . . . . . . . . . . . . . . . . . . . . . . . . . . . . . . . . . . . . . . 913 1,199 943 1,040
Total trading account assets supporting insurance liabilities . . . . . . . . . . . . . . . . . . . . . . $19,971 $20,827 $19,249 $20,590
(1) Includes publicly-traded agency pass-through securities and collateralized mortgage obligations.(2) Includes credit-tranched securities collateralized by sub-prime mortgages, auto loans, credit cards, education loans and other asset types.
The net change in unrealized gains / (losses) from trading account assets supporting insurance liabilities still held at period end,recorded within “Asset management fees and other income” was $(485) million, $689 million and $209 million during the years endedDecember 31, 2013, 2012 and 2011, respectively.
Other Trading Account Assets
The following table sets forth the composition of the “Other trading account assets” as of the dates indicated:
December 31, 2013 December 31, 2012
AmortizedCost
FairValue
AmortizedCost
FairValue
(in millions)Short-term investments and cash equivalents . . . . . . . . . . . . . . . . . . . . . . . . . . . . . . . . . . . . $ 105 $ 106 $ 42 $ 42Fixed maturities . . . . . . . . . . . . . . . . . . . . . . . . . . . . . . . . . . . . . . . . . . . . . . . . . . . . . . . . . . 4,653 4,723 2,196 2,132Equity securities . . . . . . . . . . . . . . . . . . . . . . . . . . . . . . . . . . . . . . . . . . . . . . . . . . . . . . . . . . 1,051 1,177 1,363 1,437Other . . . . . . . . . . . . . . . . . . . . . . . . . . . . . . . . . . . . . . . . . . . . . . . . . . . . . . . . . . . . . . . . . . . 3 7 3 6
Subtotal . . . . . . . . . . . . . . . . . . . . . . . . . . . . . . . . . . . . . . . . . . . . . . . . . . . . . . . . . . . . . $5,812 6,013 $3,604 3,617
Derivative instruments . . . . . . . . . . . . . . . . . . . . . . . . . . . . . . . . . . . . . . . . . . . . . . . . . . . . . 440 2,711
Total other trading account assets . . . . . . . . . . . . . . . . . . . . . . . . . . . . . . . . . . . . . . . . . . . . $6,453 $6,328
The net change in unrealized gains / (losses) from other trading account assets, excluding derivative instruments, still held at periodend, recorded within “Asset management fees and other income” was $188 million, $264 million and $63 million during the years endedDecember 31, 2013, 2012 and 2011, respectively.
Concentrations of Financial Instruments
The Company monitors its concentrations of financial instruments on an on-going basis, and mitigates credit risk by maintaining adiversified investment portfolio which limits exposure to any one issuer.
Prudential Financial, Inc. 2013 Annual Report 131

PRUDENTIAL FINANCIAL, INC.
Notes to Consolidated Financial Statements
4. INVESTMENTS (continued)
As of both December 31, 2013 and 2012, the Company’s exposure to concentrations of credit risk of single issuers greater than 10%of the Company’s stockholders’ equity included securities of the U.S. government, certain U.S. government agencies and certain securitiesguaranteed by the U.S. government, as well as the securities disclosed below.
December 31, 2013 December 31, 2012
AmortizedCost
FairValue
AmortizedCost
FairValue
(in millions)Investments in Japanese government and government agency securities:Fixed maturities, available-for-sale . . . . . . . . . . . . . . . . . . . . . . . . . . . . . . . . . . . . . . . . . $59,775 $65,389 $66,590 $70,997Fixed maturities, held-to-maturity . . . . . . . . . . . . . . . . . . . . . . . . . . . . . . . . . . . . . . . . . . 916 1,032 1,118 1,223Trading account assets supporting insurance liabilities . . . . . . . . . . . . . . . . . . . . . . . . . . 451 458 513 524Other trading account assets . . . . . . . . . . . . . . . . . . . . . . . . . . . . . . . . . . . . . . . . . . . . . . . 38 39 39 40Short-term investments . . . . . . . . . . . . . . . . . . . . . . . . . . . . . . . . . . . . . . . . . . . . . . . . . . . 0 0 0 0Cash equivalents . . . . . . . . . . . . . . . . . . . . . . . . . . . . . . . . . . . . . . . . . . . . . . . . . . . . . . . . 107 107 1,637 1,637
Total . . . . . . . . . . . . . . . . . . . . . . . . . . . . . . . . . . . . . . . . . . . . . . . . . . . . . . . . . . . . . $61,287 $67,025 $69,897 $74,421
Investments in South Korean government and government agency securities:Fixed maturities, available-for-sale . . . . . . . . . . . . . . . . . . . . . . . . . . . . . . . . . . . . . . . . . $ 6,672 $ 7,277 $ 5,837 $ 6,883Fixed maturities, held-to-maturity . . . . . . . . . . . . . . . . . . . . . . . . . . . . . . . . . . . . . . . . . . 0 0 0 0Trading account assets supporting insurance liabilities . . . . . . . . . . . . . . . . . . . . . . . . . . 61 61 62 63Other trading account assets . . . . . . . . . . . . . . . . . . . . . . . . . . . . . . . . . . . . . . . . . . . . . . . 0 0 2 2Short-term investments . . . . . . . . . . . . . . . . . . . . . . . . . . . . . . . . . . . . . . . . . . . . . . . . . . . 0 0 0 0Cash equivalents . . . . . . . . . . . . . . . . . . . . . . . . . . . . . . . . . . . . . . . . . . . . . . . . . . . . . . . . 0 0 0 0
Total . . . . . . . . . . . . . . . . . . . . . . . . . . . . . . . . . . . . . . . . . . . . . . . . . . . . . . . . . . . . . $ 6,733 $ 7,338 $ 5,901 $ 6,948
Commercial Mortgage and Other Loans
The Company’s commercial mortgage and other loans are comprised as follows, as of the dates indicated:
December 31, 2013 December 31, 2012
Amount(in millions)
% ofTotal
Amount(in millions)
% ofTotal
Commercial and agricultural mortgage loans by property type:Office . . . . . . . . . . . . . . . . . . . . . . . . . . . . . . . . . . . . . . . . . . . . . . . . . . . . . . . . . . . . . . . . . . $ 7,762 19.9% $ 6,890 20.1%Retail . . . . . . . . . . . . . . . . . . . . . . . . . . . . . . . . . . . . . . . . . . . . . . . . . . . . . . . . . . . . . . . . . . 8,698 22.3 8,190 23.9Apartments/Multi-Family . . . . . . . . . . . . . . . . . . . . . . . . . . . . . . . . . . . . . . . . . . . . . . . . . . 7,492 19.2 5,235 15.3Industrial . . . . . . . . . . . . . . . . . . . . . . . . . . . . . . . . . . . . . . . . . . . . . . . . . . . . . . . . . . . . . . . 7,390 18.9 7,636 22.3Hospitality . . . . . . . . . . . . . . . . . . . . . . . . . . . . . . . . . . . . . . . . . . . . . . . . . . . . . . . . . . . . . . 2,050 5.2 1,322 3.9Other . . . . . . . . . . . . . . . . . . . . . . . . . . . . . . . . . . . . . . . . . . . . . . . . . . . . . . . . . . . . . . . . . . 3,464 8.9 2,841 8.3
Total commercial mortgage loans . . . . . . . . . . . . . . . . . . . . . . . . . . . . . . . . . . . . . . . . . . . . 36,856 94.4 32,114 93.8Agricultural property loans . . . . . . . . . . . . . . . . . . . . . . . . . . . . . . . . . . . . . . . . . . . . . . . . . 2,183 5.6 2,122 6.2
Total commercial and agricultural mortgage loans by property type . . . . . . . . . . . . . . . . . 39,039 100.0% 34,236 100.0%
Valuation allowance . . . . . . . . . . . . . . . . . . . . . . . . . . . . . . . . . . . . . . . . . . . . . . . . . . . . . . (195) (229)
Total net commercial mortgage and agricultural loans by property type . . . . . . . . . . . . . . 38,844 34,007
Other loansUncollateralized loans . . . . . . . . . . . . . . . . . . . . . . . . . . . . . . . . . . . . . . . . . . . . . . . . . . . . . 1,306 1,836Residential property loans . . . . . . . . . . . . . . . . . . . . . . . . . . . . . . . . . . . . . . . . . . . . . . . . . . 544 790Other collateralized loans . . . . . . . . . . . . . . . . . . . . . . . . . . . . . . . . . . . . . . . . . . . . . . . . . . 335 140
Total other loans . . . . . . . . . . . . . . . . . . . . . . . . . . . . . . . . . . . . . . . . . . . . . . . . . . . . . . . . . 2,185 2,766Valuation allowance . . . . . . . . . . . . . . . . . . . . . . . . . . . . . . . . . . . . . . . . . . . . . . . . . . . . . . (21) (40)
Total net other loans . . . . . . . . . . . . . . . . . . . . . . . . . . . . . . . . . . . . . . . . . . . . . . . . . . . . . . 2,164 2,726
Total commercial mortgage and other loans(1) . . . . . . . . . . . . . . . . . . . . . . . . . . . . . . . . . . $41,008 $36,733
(1) Includes loans held at fair value.
The commercial mortgage and agricultural property loans are geographically dispersed throughout the United States, Canada and Asiawith the largest concentrations in California (26%), New York (9%) and Texas (9%) at December 31, 2013.
132 Prudential Financial, Inc. 2013 Annual Report

PRUDENTIAL FINANCIAL, INC.
Notes to Consolidated Financial Statements
4. INVESTMENTS (continued)
Activity in the allowance for losses for all commercial mortgage and other loans, as of the dates indicated, is as follows:
CommercialMortgage
Loans
AgriculturalProperty
Loans
ResidentialProperty
Loans
OtherCollateralized
LoansUncollateralized
Loans Total
(in millions)Allowance for losses, beginning of year, 2012 . . . . . . . . . . . . . . . . . . . . . $294 $19 $16 $18 $20 $367Addition to / (release of) allowance of losses . . . . . . . . . . . . . . . . . . . . . . . (20) 1 (4) (6) (2) (31)Charge-offs, net of recoveries . . . . . . . . . . . . . . . . . . . . . . . . . . . . . . . . . . (65) 0 0 0 0 (65)Change in foreign exchange . . . . . . . . . . . . . . . . . . . . . . . . . . . . . . . . . . . . 0 0 (1) 0 (1) (2)
Total Ending Balance, 2012 . . . . . . . . . . . . . . . . . . . . . . . . . . . . . . . . $209 $20 $11 $12 $17 $269
CommercialMortgage
Loans
AgriculturalProperty
Loans
ResidentialProperty
Loans
OtherCollateralized
LoansUncollateralized
Loans Total
(in millions)Allowance for losses, beginning of year, 2013 . . . . . . . . . . . . . . . . . . . . . $209 $20 $11 $12 $17 $269Addition to / (release of) allowance of losses . . . . . . . . . . . . . . . . . . . . . . . 12 (7) (3) (9) (2) (9)Charge-offs, net of recoveries . . . . . . . . . . . . . . . . . . . . . . . . . . . . . . . . . . (33) (6) 0 0 0 (39)Change in foreign exchange . . . . . . . . . . . . . . . . . . . . . . . . . . . . . . . . . . . . 0 0 (2) 0 (3) (5)
Total Ending Balance, 2013 . . . . . . . . . . . . . . . . . . . . . . . . . . . . . . . . $188 $ 7 $ 6 $ 3 $12 $216
The following tables set forth the allowance for credit losses and the recorded investment in commercial mortgage and other loans, forthe years ended December 31:
2013
CommercialMortgage
Loans
AgriculturalProperty
Loans
ResidentialProperty
Loans
OtherCollateralized
LoansUncollateralized
Loans Total
(in millions)Allowance for Credit Losses:Ending balance: individually evaluated for impairment . . . . . . . . . . . . . $ 16 $ 0 $ 0 $ 3 $ 0 $ 19Ending balance: collectively evaluated for impairment . . . . . . . . . . . . . 172 7 6 0 12 197Ending balance: loans acquired with deteriorated credit quality . . . . . . 0 0 0 0 0 0
Total ending balance . . . . . . . . . . . . . . . . . . . . . . . . . . . . . . . . . . . . $ 188 $ 7 $ 6 $ 3 $ 12 $ 216
Recorded Investment:(1)Ending balance gross of reserves: individually evaluated for
impairment . . . . . . . . . . . . . . . . . . . . . . . . . . . . . . . . . . . . . . . . . . . . . $ 429 $ 5 $ 0 $ 7 $ 2 $ 443Ending balance gross of reserves: collectively evaluated for
impairment . . . . . . . . . . . . . . . . . . . . . . . . . . . . . . . . . . . . . . . . . . . . . 36,427 2,178 544 328 1,304 40,781Ending balance gross of reserves: loans acquired with deteriorated
credit quality . . . . . . . . . . . . . . . . . . . . . . . . . . . . . . . . . . . . . . . . . . . . 0 0 0 0 0 0
Total ending balance, gross of reserves . . . . . . . . . . . . . . . . . . . . . $36,856 $2,183 $544 $335 $1,306 $41,224
(1) Recorded investment reflects the balance sheet carrying value gross of related allowance.
2012
CommercialMortgage
Loans
AgriculturalProperty
Loans
ResidentialProperty
Loans
OtherCollateralized
LoansUncollateralized
Loans Total
(in millions)Allowance for Credit Losses:Ending balance: individually evaluated for impairment . . . . . . . . . . . . . $ 49 $ 12 $ 0 $ 12 $ 0 $ 73Ending balance: collectively evaluated for impairment . . . . . . . . . . . . . 160 8 11 0 17 196Ending balance: loans acquired with deteriorated credit quality . . . . . . 0 0 0 0 0 0
Total ending balance . . . . . . . . . . . . . . . . . . . . . . . . . . . . . . . . . . . . $ 209 $ 20 $ 11 $ 12 $ 17 $ 269
Recorded Investment:(1)Ending balance gross of reserves: individually evaluated for
impairment . . . . . . . . . . . . . . . . . . . . . . . . . . . . . . . . . . . . . . . . . . . . . $ 1,011 $ 49 $ 0 $ 93 $ 3 $ 1,156Ending balance gross of reserves: collectively evaluated for
impairment . . . . . . . . . . . . . . . . . . . . . . . . . . . . . . . . . . . . . . . . . . . . . 31,103 2,073 790 47 1,833 35,846Ending balance gross of reserves: loans acquired with deteriorated
credit quality . . . . . . . . . . . . . . . . . . . . . . . . . . . . . . . . . . . . . . . . . . . . 0 0 0 0 0 0
Total ending balance, gross of reserves . . . . . . . . . . . . . . . . . . . . . $32,114 $2,122 $790 $140 $1,836 $37,002
Prudential Financial, Inc. 2013 Annual Report 133
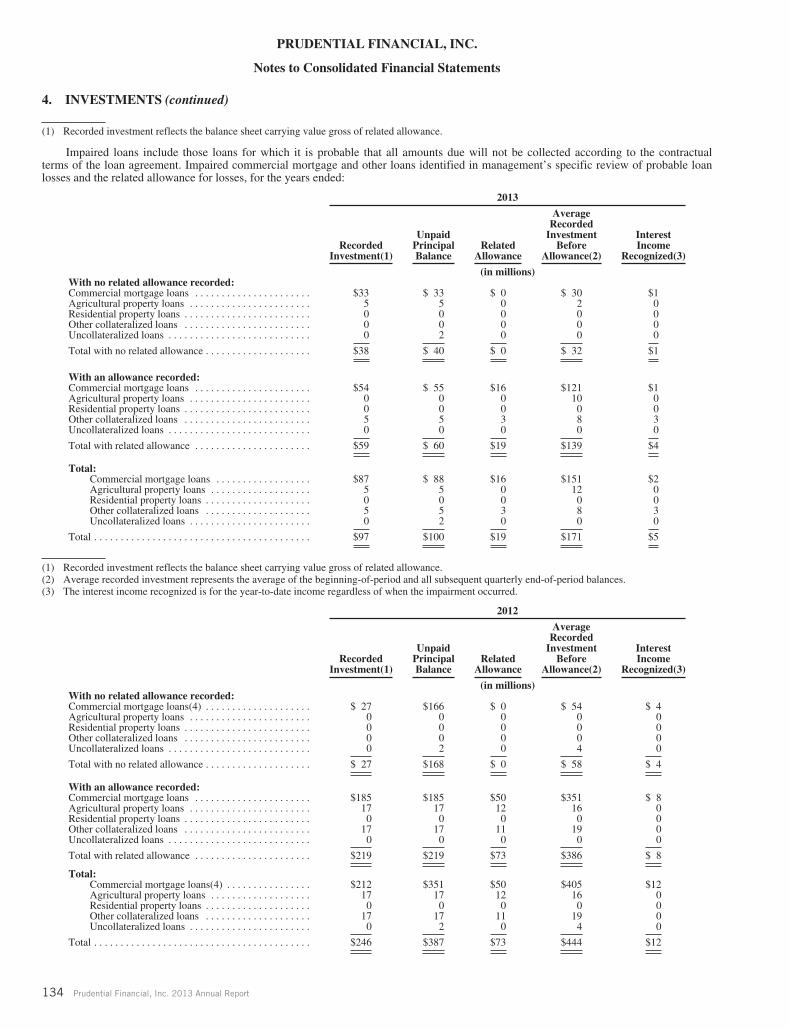
PRUDENTIAL FINANCIAL, INC.
Notes to Consolidated Financial Statements
4. INVESTMENTS (continued)
(1) Recorded investment reflects the balance sheet carrying value gross of related allowance.
Impaired loans include those loans for which it is probable that all amounts due will not be collected according to the contractualterms of the loan agreement. Impaired commercial mortgage and other loans identified in management’s specific review of probable loanlosses and the related allowance for losses, for the years ended:
2013
RecordedInvestment(1)
UnpaidPrincipalBalance
RelatedAllowance
AverageRecorded
InvestmentBefore
Allowance(2)
InterestIncome
Recognized(3)
(in millions)With no related allowance recorded:Commercial mortgage loans . . . . . . . . . . . . . . . . . . . . . . $33 $ 33 $ 0 $ 30 $1Agricultural property loans . . . . . . . . . . . . . . . . . . . . . . . 5 5 0 2 0Residential property loans . . . . . . . . . . . . . . . . . . . . . . . . 0 0 0 0 0Other collateralized loans . . . . . . . . . . . . . . . . . . . . . . . . 0 0 0 0 0Uncollateralized loans . . . . . . . . . . . . . . . . . . . . . . . . . . . 0 2 0 0 0
Total with no related allowance . . . . . . . . . . . . . . . . . . . . $38 $ 40 $ 0 $ 32 $1
With an allowance recorded:Commercial mortgage loans . . . . . . . . . . . . . . . . . . . . . . $54 $ 55 $16 $121 $1Agricultural property loans . . . . . . . . . . . . . . . . . . . . . . . 0 0 0 10 0Residential property loans . . . . . . . . . . . . . . . . . . . . . . . . 0 0 0 0 0Other collateralized loans . . . . . . . . . . . . . . . . . . . . . . . . 5 5 3 8 3Uncollateralized loans . . . . . . . . . . . . . . . . . . . . . . . . . . . 0 0 0 0 0
Total with related allowance . . . . . . . . . . . . . . . . . . . . . . $59 $ 60 $19 $139 $4
Total:Commercial mortgage loans . . . . . . . . . . . . . . . . . . $87 $ 88 $16 $151 $2Agricultural property loans . . . . . . . . . . . . . . . . . . . 5 5 0 12 0Residential property loans . . . . . . . . . . . . . . . . . . . . 0 0 0 0 0Other collateralized loans . . . . . . . . . . . . . . . . . . . . 5 5 3 8 3Uncollateralized loans . . . . . . . . . . . . . . . . . . . . . . . 0 2 0 0 0
Total . . . . . . . . . . . . . . . . . . . . . . . . . . . . . . . . . . . . . . . . . $97 $100 $19 $171 $5
(1) Recorded investment reflects the balance sheet carrying value gross of related allowance.(2) Average recorded investment represents the average of the beginning-of-period and all subsequent quarterly end-of-period balances.(3) The interest income recognized is for the year-to-date income regardless of when the impairment occurred.
2012
RecordedInvestment(1)
UnpaidPrincipalBalance
RelatedAllowance
AverageRecorded
InvestmentBefore
Allowance(2)
InterestIncome
Recognized(3)
(in millions)With no related allowance recorded:Commercial mortgage loans(4) . . . . . . . . . . . . . . . . . . . . $ 27 $166 $ 0 $ 54 $ 4Agricultural property loans . . . . . . . . . . . . . . . . . . . . . . . 0 0 0 0 0Residential property loans . . . . . . . . . . . . . . . . . . . . . . . . 0 0 0 0 0Other collateralized loans . . . . . . . . . . . . . . . . . . . . . . . . 0 0 0 0 0Uncollateralized loans . . . . . . . . . . . . . . . . . . . . . . . . . . . 0 2 0 4 0
Total with no related allowance . . . . . . . . . . . . . . . . . . . . $ 27 $168 $ 0 $ 58 $ 4
With an allowance recorded:Commercial mortgage loans . . . . . . . . . . . . . . . . . . . . . . $185 $185 $50 $351 $ 8Agricultural property loans . . . . . . . . . . . . . . . . . . . . . . . 17 17 12 16 0Residential property loans . . . . . . . . . . . . . . . . . . . . . . . . 0 0 0 0 0Other collateralized loans . . . . . . . . . . . . . . . . . . . . . . . . 17 17 11 19 0Uncollateralized loans . . . . . . . . . . . . . . . . . . . . . . . . . . . 0 0 0 0 0
Total with related allowance . . . . . . . . . . . . . . . . . . . . . . $219 $219 $73 $386 $ 8
Total:Commercial mortgage loans(4) . . . . . . . . . . . . . . . . $212 $351 $50 $405 $12Agricultural property loans . . . . . . . . . . . . . . . . . . . 17 17 12 16 0Residential property loans . . . . . . . . . . . . . . . . . . . . 0 0 0 0 0Other collateralized loans . . . . . . . . . . . . . . . . . . . . 17 17 11 19 0Uncollateralized loans . . . . . . . . . . . . . . . . . . . . . . . 0 2 0 4 0
Total . . . . . . . . . . . . . . . . . . . . . . . . . . . . . . . . . . . . . . . . . $246 $387 $73 $444 $12
134 Prudential Financial, Inc. 2013 Annual Report

PRUDENTIAL FINANCIAL, INC.
Notes to Consolidated Financial Statements
4. INVESTMENTS (continued)
(1) Recorded investment reflects the balance sheet carrying value gross of related allowance.(2) Average recorded investment represents the average of the beginning-of-period and all subsequent quarterly end-of-period balances.(3) The interest income recognized is for the year-to-date income regardless of when the impairments occurred.(4) Includes the impact of loans acquired from the Star Business for which the balance sheet carrying value had been previously written down.
The net carrying value of commercial and other loans held for sale by the Company as of December 31, 2013 and 2012, was $158million and $114 million, respectively. In all of these transactions, the Company pre-arranges that it will sell the loan to an investor. As ofDecember 31, 2013 and 2012, all of the Company’s commercial and other loans held for sale were collateralized, with collateral primarilyconsisting of office buildings, retail properties, apartment complexes and industrial buildings.
The following tables set forth the credit quality indicators as of December 31, 2013, based upon the recorded investment gross ofallowance for credit losses.
Commercial mortgage loans
Debt Service Coverage Ratio—December 31, 2013
Greater than1.2X 1.0X to <1.2X
Less than1.0X Total
(in millions)Loan-to-Value Ratio0%-59.99% . . . . . . . . . . . . . . . . . . . . . . . . . . . . . . . . . . . . . . . . . . . . . . . . . . . . . . $19,089 $ 597 $179 $19,86560%-69.99% . . . . . . . . . . . . . . . . . . . . . . . . . . . . . . . . . . . . . . . . . . . . . . . . . . . . . 11,101 379 95 11,57570%-79.99% . . . . . . . . . . . . . . . . . . . . . . . . . . . . . . . . . . . . . . . . . . . . . . . . . . . . . 4,005 422 216 4,643Greater than 80% . . . . . . . . . . . . . . . . . . . . . . . . . . . . . . . . . . . . . . . . . . . . . . . . . 325 173 275 773
Total commercial mortgage loans . . . . . . . . . . . . . . . . . . . . . . . . . . . . . . . . . . . . $34,520 $1,571 $765 $36,856
Agricultural property loans
Debt Service Coverage Ratio—December 31, 2013
Greater than1.2X 1.0X to <1.2X
Less than1.0X Total
(in millions)Loan-to-Value Ratio0%-59.99% . . . . . . . . . . . . . . . . . . . . . . . . . . . . . . . . . . . . . . . . . . . . . . . . . . . . . . . $2,023 $137 $0 $2,16060%-69.99% . . . . . . . . . . . . . . . . . . . . . . . . . . . . . . . . . . . . . . . . . . . . . . . . . . . . . . 23 0 0 2370%-79.99% . . . . . . . . . . . . . . . . . . . . . . . . . . . . . . . . . . . . . . . . . . . . . . . . . . . . . . 0 0 0 0Greater than 80% . . . . . . . . . . . . . . . . . . . . . . . . . . . . . . . . . . . . . . . . . . . . . . . . . . 0 0 0 0
Total agricultural property loans . . . . . . . . . . . . . . . . . . . . . . . . . . . . . . . . . . . . . . $2,046 $137 $0 $2,183
Total commercial and agricultural mortgage loans
Debt Service Coverage Ratio—December 31, 2013
Greater than1.2X 1.0X to <1.2X
Less than1.0X Total
(in millions)Loan-to-Value Ratio0%-59.99% . . . . . . . . . . . . . . . . . . . . . . . . . . . . . . . . . . . . . . . . . . . . . . . . . . . . . . $21,112 $ 734 $179 $22,02560%-69.99% . . . . . . . . . . . . . . . . . . . . . . . . . . . . . . . . . . . . . . . . . . . . . . . . . . . . . 11,124 379 95 11,59870%-79.99% . . . . . . . . . . . . . . . . . . . . . . . . . . . . . . . . . . . . . . . . . . . . . . . . . . . . . 4,005 422 216 4,643Greater than 80% . . . . . . . . . . . . . . . . . . . . . . . . . . . . . . . . . . . . . . . . . . . . . . . . . 325 173 275 773
Total commercial and agricultural mortgage loans . . . . . . . . . . . . . . . . . . . $36,566 $1,708 $765 $39,039
The following tables set forth the credit quality indicators as of December 31, 2012, based upon the recorded investment gross ofallowance for credit losses.
Commercial mortgage loans
Debt Service Coverage Ratio—December 31, 2012
Greater than1.2X 1.0X to <1.2X
Less than1.0X Total
(in millions)Loan-to-Value Ratio0%-59.99% . . . . . . . . . . . . . . . . . . . . . . . . . . . . . . . . . . . . . . . . . . . . . . . . . . . . . . $15,089 $ 487 $ 188 $15,76460%-69.99% . . . . . . . . . . . . . . . . . . . . . . . . . . . . . . . . . . . . . . . . . . . . . . . . . . . . . 9,263 801 36 10,10070%-79.99% . . . . . . . . . . . . . . . . . . . . . . . . . . . . . . . . . . . . . . . . . . . . . . . . . . . . . 3,689 776 217 4,682Greater than 80% . . . . . . . . . . . . . . . . . . . . . . . . . . . . . . . . . . . . . . . . . . . . . . . . . 219 770 579 1,568
Total commercial mortgage loans . . . . . . . . . . . . . . . . . . . . . . . . . . . . . . . . . . . . $28,260 $2,834 $1,020 $32,114
Prudential Financial, Inc. 2013 Annual Report 135

PRUDENTIAL FINANCIAL, INC.
Notes to Consolidated Financial Statements
4. INVESTMENTS (continued)Agricultural property loans
Debt Service Coverage Ratio—December 31, 2012
Greater than1.2X 1.0X to <1.2X
Less than1.0X Total
(in millions)Loan-to-Value Ratio0%-59.99% . . . . . . . . . . . . . . . . . . . . . . . . . . . . . . . . . . . . . . . . . . . . . . . . . . . . . . . $1,635 $186 $44 $1,86560%-69.99% . . . . . . . . . . . . . . . . . . . . . . . . . . . . . . . . . . . . . . . . . . . . . . . . . . . . . . 213 0 0 21370%-79.99% . . . . . . . . . . . . . . . . . . . . . . . . . . . . . . . . . . . . . . . . . . . . . . . . . . . . . . 0 0 0 0Greater than 80% . . . . . . . . . . . . . . . . . . . . . . . . . . . . . . . . . . . . . . . . . . . . . . . . . . 0 0 44 44
Total agricultural property loans . . . . . . . . . . . . . . . . . . . . . . . . . . . . . . . . . . . . . . $1,848 $186 $88 $2,122
Total commercial and agricultural mortgage loans
Debt Service Coverage Ratio—December 31, 2012
Greater than1.2X 1.0X to <1.2X
Less than1.0X Total
(in millions)Loan-to-Value Ratio0%-59.99% . . . . . . . . . . . . . . . . . . . . . . . . . . . . . . . . . . . . . . . . . . . . . . . . . . . . . . $16,724 $ 673 $ 232 $17,62960%-69.99% . . . . . . . . . . . . . . . . . . . . . . . . . . . . . . . . . . . . . . . . . . . . . . . . . . . . . 9,476 801 36 10,31370%-79.99% . . . . . . . . . . . . . . . . . . . . . . . . . . . . . . . . . . . . . . . . . . . . . . . . . . . . . 3,689 776 217 4,682Greater than 80% . . . . . . . . . . . . . . . . . . . . . . . . . . . . . . . . . . . . . . . . . . . . . . . . . 219 770 623 1,612
Total commercial and agricultural mortgage loans . . . . . . . . . . . . . . . . . . . $30,108 $3,020 $1,108 $34,236
The following tables provide an aging of past due commercial mortgage and other loans as of the dates indicated, based upon therecorded investment gross of allowance for credit losses, as well as the amount of commercial mortgage loans on nonaccrual status as ofthe dates indicated.
December 31, 2013
Current30-59 DaysPast Due
60-89 DaysPast Due
GreaterThan 90Days -
Accruing
GreaterThan 90
Days - NotAccruing
Total PastDue
TotalCommercial
Mortgageand Other
Loans
NonAccrualStatus
(in millions)Commercial mortgage loans . . . . . . . . . . . . . . . . . . . $36,821 $16 $0 $0 $19 $35 $36,856 $154Agricultural property loans . . . . . . . . . . . . . . . . . . . . 2,182 0 0 0 1 1 2,183 2Residential property loans . . . . . . . . . . . . . . . . . . . . . 520 11 3 0 10 24 544 10Other collateralized loans . . . . . . . . . . . . . . . . . . . . . 334 0 0 0 1 1 335 5Uncollateralized loans . . . . . . . . . . . . . . . . . . . . . . . . 1,306 0 0 0 0 0 1,306 2
Total . . . . . . . . . . . . . . . . . . . . . . . . . . . . . . . . . . $41,163 $27 $3 $0 $31 $61 $41,224 $173
December 31, 2012
Current30-59 DaysPast Due
60-89 DaysPast Due
GreaterThan 90Days -
Accruing
GreaterThan 90
Days - NotAccruing
Total PastDue
TotalCommercial
Mortgageand Other
Loans
NonAccrualStatus
(in millions)Commercial mortgage loans . . . . . . . . . . . . . . . . . $31,943 $43 $91 $0 $37 $171 $32,114 $190Agricultural property loans . . . . . . . . . . . . . . . . . . 2,077 0 0 0 45 45 2,122 49Residential property loans . . . . . . . . . . . . . . . . . . 759 12 5 0 14 31 790 14Other collateralized loans . . . . . . . . . . . . . . . . . . . 139 0 0 0 1 1 140 17Uncollateralized loans . . . . . . . . . . . . . . . . . . . . . 1,836 0 0 0 0 0 1,836 3
Total . . . . . . . . . . . . . . . . . . . . . . . . . . . . . . . $36,754 $55 $96 $0 $97 $248 $37,002 $273
See Note 2 for further discussion regarding nonaccrual status loans.
For the years ended December 31, 2013 and 2012, there were $718 million and $47 million of commercial mortgage and other loansacquired, other than those through direct origination. For the years ended December 31, 2013 and 2012, there were $93 million and $0million of commercial mortgage and other loans sold, other than those classified as held-for-sale.
The Company’s commercial mortgage and other loans may occasionally be involved in a troubled debt restructuring. As of bothDecember 31, 2013 and December 31, 2012, the Company had no significant commitments to fund to borrowers that have been involved ina troubled debt restructuring. For the years ended December 31, 2013 and 2012, there was an adjusted pre-modification outstanding
136 Prudential Financial, Inc. 2013 Annual Report

PRUDENTIAL FINANCIAL, INC.
Notes to Consolidated Financial Statements
4. INVESTMENTS (continued)
recorded investment of $117 million and $20 million, respectively, and post-modification outstanding recorded investment of $114 millionand $18 million, respectively, related to commercial mortgage loans. No payment defaults on commercial mortgage and other loans weremodified as a troubled debt restructuring within the 12 months preceding each respective period. See Note 2 for additional informationrelating to the accounting for troubled debt restructurings.
Other Long-Term InvestmentsThe following table sets forth the composition of “Other long-term investments” at December 31 for the years indicated.
2013 2012
(in millions)Joint ventures and limited partnerships:
Real estate-related . . . . . . . . . . . . . . . . . . . . . . . . . . . . . . . . . . . . . . . . . . . . . . . . . . . . . . . . . . . . . . . . . . . . . . . . $ 1,104 $ 1,250Non-real estate-related . . . . . . . . . . . . . . . . . . . . . . . . . . . . . . . . . . . . . . . . . . . . . . . . . . . . . . . . . . . . . . . . . . . . . 6,141 5,623
Total joint ventures and limited partnerships . . . . . . . . . . . . . . . . . . . . . . . . . . . . . . . . . . . . . . . . . . . . . . . . . . . . . . . . 7,245 6,873Real estate held through direct ownership . . . . . . . . . . . . . . . . . . . . . . . . . . . . . . . . . . . . . . . . . . . . . . . . . . . . . . . . . . . . . . 2,051 2,108Other . . . . . . . . . . . . . . . . . . . . . . . . . . . . . . . . . . . . . . . . . . . . . . . . . . . . . . . . . . . . . . . . . . . . . . . . . . . . . . . . . . . . . . . . . . 1,032 1,047
Total other long-term investments . . . . . . . . . . . . . . . . . . . . . . . . . . . . . . . . . . . . . . . . . . . . . . . . . . . . . . . . . . . . $10,328 $10,028
In certain investment structures, the Company’s asset management business invests with other co-investors in an investment fundreferred to as a feeder fund. In these structures, the invested capital of several feeder funds is pooled together and used to purchaseownership interests in another fund, referred to as a master fund. The master fund utilizes this invested capital and, in certain cases, otherdebt financing, to purchase various classes of assets on behalf of its investors. Specialized industry accounting for investment companiescalls for the feeder fund to reflect its investment in the master fund as a single net asset equal to its proportionate share of the net assets ofthe master fund, regardless of its level of interest in the master fund. In cases where the Company consolidates the feeder fund, it retains thefeeder fund’s net asset presentation and reports the consolidated feeder fund’s proportionate share of the net assets of the master fund in“Other long-term investments,” with any unaffiliated investors’ noncontrolling interest in the feeder fund reported in “Other liabilities” or“Noncontrolling interests.” The consolidated feeder funds’ investments in these master funds, reflected on this net asset basis, totaled $52million and $97 million as of December 31, 2013 and 2012, respectively. The unaffiliated interest in the consolidated feeder funds was $0and $2 million as of December 31, 2013 and 2012, respectively, and the master funds had gross assets of $972 million and $1,049 million,respectively, and gross liabilities of $794 million and $791 million, respectively, which are not included on the Company’s balance sheet.
Equity Method InvestmentsThe following tables set forth summarized combined financial information for significant joint ventures and limited partnership
interests accounted for under the equity method, including the Company’s investments in operating joint ventures that are described inmore detail in Note 7. Changes between periods in the tables below reflect changes in the activities within the joint ventures and limitedpartnerships, as well as changes in the Company’s level of investment in such entities.
At December 31,
2013 2012
(in millions)STATEMENT OF FINANCIAL POSITIONTotal assets(1) . . . . . . . . . . . . . . . . . . . . . . . . . . . . . . . . . . . . . . . . . . . . . . . . . . . . . . . . . . . . . . . . . . . . . . . . . . . . . . . . . . . $51,588 $41,418
Total liabilities(2) . . . . . . . . . . . . . . . . . . . . . . . . . . . . . . . . . . . . . . . . . . . . . . . . . . . . . . . . . . . . . . . . . . . . . . . . . . . . . . . . . $10,868 $ 8,786Partners’ capital . . . . . . . . . . . . . . . . . . . . . . . . . . . . . . . . . . . . . . . . . . . . . . . . . . . . . . . . . . . . . . . . . . . . . . . . . . . . . . . . . . 40,720 32,632
Total liabilities and partners’ capital . . . . . . . . . . . . . . . . . . . . . . . . . . . . . . . . . . . . . . . . . . . . . . . . . . . . . . . . . . . . . . $51,588 $41,418
Total liabilities and partners’ capital included above . . . . . . . . . . . . . . . . . . . . . . . . . . . . . . . . . . . . . . . . . . . . . . . . . . . . . $ 3,765 $ 3,778Equity in limited partnership interests not included above . . . . . . . . . . . . . . . . . . . . . . . . . . . . . . . . . . . . . . . . . . . . . . . . . 350 453
Carrying value . . . . . . . . . . . . . . . . . . . . . . . . . . . . . . . . . . . . . . . . . . . . . . . . . . . . . . . . . . . . . . . . . . . . . . . . . . . . . . . $ 4,115 $ 4,231
(1) Assets consist primarily of investments in real estate, investments in securities and other miscellaneous assets.(2) Liabilities consist primarily of third party-borrowed funds, securities repurchase agreements and other miscellaneous liabilities.
Years ended December 31,
2013 2012 2011
(in millions)STATEMENTS OF OPERATIONSTotal revenue(1) . . . . . . . . . . . . . . . . . . . . . . . . . . . . . . . . . . . . . . . . . . . . . . . . . . . . . . . . . . . . . . . . . . . . . . . . . . $4,013 $ 4,556 $2,611Total expenses(2) . . . . . . . . . . . . . . . . . . . . . . . . . . . . . . . . . . . . . . . . . . . . . . . . . . . . . . . . . . . . . . . . . . . . . . . . . (943) (1,573) (925)
Net earnings (losses) . . . . . . . . . . . . . . . . . . . . . . . . . . . . . . . . . . . . . . . . . . . . . . . . . . . . . . . . . . . . . . . . . . $3,070 $ 2,983 $1,686
Equity in net earnings (losses) included above . . . . . . . . . . . . . . . . . . . . . . . . . . . . . . . . . . . . . . . . . . . . . . . . . . $ 255 $ 188 $ 377Equity in net earnings (losses) of limited partnership interests not included above . . . . . . . . . . . . . . . . . . . . . . 77 34 40
Total equity in net earnings (losses) . . . . . . . . . . . . . . . . . . . . . . . . . . . . . . . . . . . . . . . . . . . . . . . . . . . . . . . $ 332 $ 222 $ 417
Prudential Financial, Inc. 2013 Annual Report 137

PRUDENTIAL FINANCIAL, INC.
Notes to Consolidated Financial Statements
4. INVESTMENTS (continued)
(1) Revenue consists of income from investments in real estate, investments in securities and other income.(2) Expenses consist primarily of interest expense, management fees, salary expenses and other expenses.
Net Investment Income
Net investment income for the years ended December 31, was from the following sources:
2013 2012 2011
(in millions)Fixed maturities, available-for-sale . . . . . . . . . . . . . . . . . . . . . . . . . . . . . . . . . . . . . . . . . . . . . . . . . . . . . . . . . $10,541 $ 9,800 $ 9,374Fixed maturities, held-to-maturity . . . . . . . . . . . . . . . . . . . . . . . . . . . . . . . . . . . . . . . . . . . . . . . . . . . . . . . . . . 125 135 140Equity securities, available-for-sale . . . . . . . . . . . . . . . . . . . . . . . . . . . . . . . . . . . . . . . . . . . . . . . . . . . . . . . . 337 332 315Trading account assets . . . . . . . . . . . . . . . . . . . . . . . . . . . . . . . . . . . . . . . . . . . . . . . . . . . . . . . . . . . . . . . . . . . 963 890 889Commercial mortgage and other loans . . . . . . . . . . . . . . . . . . . . . . . . . . . . . . . . . . . . . . . . . . . . . . . . . . . . . . 1,985 2,014 1,926Policy loans . . . . . . . . . . . . . . . . . . . . . . . . . . . . . . . . . . . . . . . . . . . . . . . . . . . . . . . . . . . . . . . . . . . . . . . . . . . 611 597 598Short-term investments and cash equivalents . . . . . . . . . . . . . . . . . . . . . . . . . . . . . . . . . . . . . . . . . . . . . . . . . 40 46 58Other long-term investments . . . . . . . . . . . . . . . . . . . . . . . . . . . . . . . . . . . . . . . . . . . . . . . . . . . . . . . . . . . . . . 710 320 231
Gross investment income . . . . . . . . . . . . . . . . . . . . . . . . . . . . . . . . . . . . . . . . . . . . . . . . . . . . . . . . . . . . 15,312 14,134 13,531Less: investment expenses . . . . . . . . . . . . . . . . . . . . . . . . . . . . . . . . . . . . . . . . . . . . . . . . . . . . . . . . . . . . . . . . (583) (473) (407)
Net investment income . . . . . . . . . . . . . . . . . . . . . . . . . . . . . . . . . . . . . . . . . . . . . . . . . . . . . . . . . . . . . . $14,729 $13,661 $13,124
Carrying value for non-income producing assets included $132 million in trading account assets supporting insurance liabilities, $11million in fixed maturities and less than $1 million in commercial mortgage and other loans as of December 31, 2013. Non-incomeproducing assets represent investments that have not produced income for the twelve months preceding December 31, 2013.
Realized Investment Gains (Losses), Net
Realized investment gains (losses), net, for the years ended December 31, were from the following sources:
2013 2012 2011
(in millions)Fixed maturities . . . . . . . . . . . . . . . . . . . . . . . . . . . . . . . . . . . . . . . . . . . . . . . . . . . . . . . . . . . . . . . . . . . . . . . . . $ (93) $ (37) $ 230Equity securities . . . . . . . . . . . . . . . . . . . . . . . . . . . . . . . . . . . . . . . . . . . . . . . . . . . . . . . . . . . . . . . . . . . . . . . . . 444 24 145Commercial mortgage and other loans . . . . . . . . . . . . . . . . . . . . . . . . . . . . . . . . . . . . . . . . . . . . . . . . . . . . . . . . 79 94 122Investment real estate . . . . . . . . . . . . . . . . . . . . . . . . . . . . . . . . . . . . . . . . . . . . . . . . . . . . . . . . . . . . . . . . . . . . . 2 (20) (20)Joint ventures and limited partnerships . . . . . . . . . . . . . . . . . . . . . . . . . . . . . . . . . . . . . . . . . . . . . . . . . . . . . . . . 34 (2) 26Derivatives(1) . . . . . . . . . . . . . . . . . . . . . . . . . . . . . . . . . . . . . . . . . . . . . . . . . . . . . . . . . . . . . . . . . . . . . . . . . . . (5,688) (1,500) 2,294Other . . . . . . . . . . . . . . . . . . . . . . . . . . . . . . . . . . . . . . . . . . . . . . . . . . . . . . . . . . . . . . . . . . . . . . . . . . . . . . . . . . 16 0 34
Realized investment gains (losses), net . . . . . . . . . . . . . . . . . . . . . . . . . . . . . . . . . . . . . . . . . . . . . . . . . . . $(5,206) $(1,441) $2,831
(1) Includes embedded derivatives as well as the offset of hedged items in qualifying effective hedge relationships prior to maturity or termination.
Net Unrealized Investment Gains (Losses) on Investments by Asset Class
The table below presents net unrealized gains (losses) on investments by asset class as of the dates indicated:
2013 2012 2011
(in millions)Fixed maturity securities on which an OTTI loss has been recognized . . . . . . . . . . . . . . . . . . . . . . . . . . . . . $ 110 $ (194) $ (1,003)Fixed maturity securities, available-for-sale-all other . . . . . . . . . . . . . . . . . . . . . . . . . . . . . . . . . . . . . . . . . . . 18,029 23,876 15,227Equity securities, available-for-sale . . . . . . . . . . . . . . . . . . . . . . . . . . . . . . . . . . . . . . . . . . . . . . . . . . . . . . . . 2,907 1,518 613Derivatives designated as cash flow hedges(1) . . . . . . . . . . . . . . . . . . . . . . . . . . . . . . . . . . . . . . . . . . . . . . . . (446) (257) (86)Other investments(2) . . . . . . . . . . . . . . . . . . . . . . . . . . . . . . . . . . . . . . . . . . . . . . . . . . . . . . . . . . . . . . . . . . . . 4 14 (6)
Net unrealized gains (losses) on investments . . . . . . . . . . . . . . . . . . . . . . . . . . . . . . . . . . . . . . . . . . . . . $20,604 $24,957 $14,745
(1) See Note 21 for more information on cash flow hedges.(2) As of December 31, 2013, includes $18 million of net unrealized losses on held-to-maturity securities that were previously transferred from available-
for-sale. Also includes net unrealized gains on certain joint ventures that are strategic in nature and are included in “Other assets.”
138 Prudential Financial, Inc. 2013 Annual Report

PRUDENTIAL FINANCIAL, INC.
Notes to Consolidated Financial Statements
4. INVESTMENTS (continued)
Duration of Gross Unrealized Loss Positions for Fixed Maturities and Equity SecuritiesThe following table shows the fair value and gross unrealized losses aggregated by investment category and length of time that
individual fixed maturity securities and equity securities have been in a continuous unrealized loss position, at December 31:
2013
Less than twelve months Twelve months or more Total
Fair Value
GrossUnrealized
Losses Fair Value
GrossUnrealized
Losses Fair Value
GrossUnrealized
Losses
(in millions)Fixed maturities(1)U.S. Treasury securities and obligations of U.S. government
authorities and agencies . . . . . . . . . . . . . . . . . . . . . . . . . . . . . . . . . . $ 3,913 $ 95 $ 6 $ 1 $ 3,919 $ 96Obligations of U.S. states and their political subdivisions . . . . . . . . . . 1,187 129 43 8 1,230 137Foreign government bonds . . . . . . . . . . . . . . . . . . . . . . . . . . . . . . . . . . 3,260 211 438 55 3,698 266Corporate securities . . . . . . . . . . . . . . . . . . . . . . . . . . . . . . . . . . . . . . . 29,574 1,618 14,094 1,814 43,668 3,432Commercial mortgage-backed securities . . . . . . . . . . . . . . . . . . . . . . . 4,267 128 605 35 4,872 163Asset-backed securities . . . . . . . . . . . . . . . . . . . . . . . . . . . . . . . . . . . . 3,007 42 2,556 274 5,563 316Residential mortgage-backed securities . . . . . . . . . . . . . . . . . . . . . . . . 1,590 34 239 7 1,829 41
Total . . . . . . . . . . . . . . . . . . . . . . . . . . . . . . . . . . . . . . . . . . . . . . . $46,798 $2,257 $17,981 $2,194 $64,779 $4,451
Equity securities, available-for-sale . . . . . . . . . . . . . . . . . . . . . . . . . $ 586 $ 24 $ 1 $ 0 $ 587 $ 24
(1) Includes $210 million of fair value and $24 million of gross unrealized losses at December 31, 2013, on securities classified as held-to-maturity, aportion of which is not reflected in AOCI.
2012
Less than twelve months Twelve months or more Total
Fair Value
GrossUnrealized
Losses Fair Value
GrossUnrealized
Losses Fair Value
GrossUnrealized
Losses
(in millions)Fixed maturities(1)U.S. Treasury securities and obligations of
U.S. government authorities and agencies . . $ 2,191 $ 33 $ 42 $ 2 $ 2,233 $ 35Obligations of U.S. states and their political
subdivisions . . . . . . . . . . . . . . . . . . . . . . . . . . 343 5 5 0 348 5Foreign government bonds . . . . . . . . . . . . . . . . 5,426 55 167 11 5,593 66Corporate securities . . . . . . . . . . . . . . . . . . . . . . 25,051 599 7,961 1,057 33,012 1,656Commercial mortgage-backed securities . . . . . 525 3 185 14 710 17Asset-backed securities . . . . . . . . . . . . . . . . . . . 911 11 3,545 720 4,456 731Residential mortgage-backed securities . . . . . . 773 4 259 29 1,032 33
Total . . . . . . . . . . . . . . . . . . . . . . . . . . . . . $35,220 $710 $12,164 $1,833 $47,384 $2,543
Equity securities, available-for-sale . . . . . . . . $ 961 $ 55 $ 0 $ 0 $ 961 $ 55
(1) Includes $526 million of fair value and $67 million of gross unrealized losses at December 31, 2012, on securities classified as held-to-maturity, aportion of which is not reflected in AOCI.
The gross unrealized losses at December 31, 2013 and 2012, are composed of $4,178 million and $1,866 million related to high orhighest quality securities based on NAIC or equivalent rating and $274 million and $677 million related to other than high or highestquality securities based on NAIC or equivalent rating. At December 31, 2013, the $2,194 million of gross unrealized losses of twelvemonths or more were concentrated in the consumer non-cyclical, utility, and capital goods sectors of the Company’s corporate securities.At December 31, 2012, the $1,833 million of gross unrealized losses of twelve months or more were concentrated in asset-backedsecurities, and in the finance and consumer cyclical sectors of the Company’s corporate securities. In accordance with its policy describedin Note 2, the Company concluded that an adjustment to earnings for other-than-temporary impairments for these securities was notwarranted at either December 31, 2013 and 2012. These conclusions are based on a detailed analysis of the underlying credit and cashflows on each security. The gross unrealized losses are primarily attributable to foreign currency movements, credit spread widening andincreased liquidity discounts. At December 31, 2013, the Company does not intend to sell the securities and it is not more likely than notthat the Company will be required to sell the securities before the anticipated recovery of its remaining amortized cost basis.
At December 31, 2013, $4 million of the gross unrealized losses represented declines of greater than 20%, all of which had been inthat position for less than six months. At December 31, 2012, $6 million of the gross unrealized losses represented declines of greater than
Prudential Financial, Inc. 2013 Annual Report 139

PRUDENTIAL FINANCIAL, INC.
Notes to Consolidated Financial Statements
4. INVESTMENTS (continued)
20%, $4 million of which had been in that position for less than six months. In accordance with its policy described in Note 2, theCompany concluded that an adjustment for other-than-temporary impairments for these equity securities was not warranted at eitherDecember 31, 2013 and 2012.
Securities Pledged, Restricted Assets and Special DepositsThe Company pledges as collateral investment securities it owns to unaffiliated parties through certain transactions, including
securities lending, securities sold under agreements to repurchase, collateralized borrowings and postings of collateral with derivativecounterparties. At December 31, 2013, the carrying value of investments pledged to third parties as reported in the Consolidated Statementsof Financial Position included the following:
2013 2012
(in millions)Fixed maturities . . . . . . . . . . . . . . . . . . . . . . . . . . . . . . . . . . . . . . . . . . . . . . . . . . . . . . . . . . . . . . . . . . . . . . . . . . . . . . . . . . $14,648 $12,134Trading account assets supporting insurance liabilities . . . . . . . . . . . . . . . . . . . . . . . . . . . . . . . . . . . . . . . . . . . . . . . . . . . . 606 542Other trading account assets . . . . . . . . . . . . . . . . . . . . . . . . . . . . . . . . . . . . . . . . . . . . . . . . . . . . . . . . . . . . . . . . . . . . . . . . 105 38Separate account assets . . . . . . . . . . . . . . . . . . . . . . . . . . . . . . . . . . . . . . . . . . . . . . . . . . . . . . . . . . . . . . . . . . . . . . . . . . . . 3,488 3,435Equity securities . . . . . . . . . . . . . . . . . . . . . . . . . . . . . . . . . . . . . . . . . . . . . . . . . . . . . . . . . . . . . . . . . . . . . . . . . . . . . . . . . . 174 70
Total securities pledged . . . . . . . . . . . . . . . . . . . . . . . . . . . . . . . . . . . . . . . . . . . . . . . . . . . . . . . . . . . . . . . . . . . . . . . . $19,021 $16,219
As of December 31, 2013, the carrying amount of the associated liabilities supported by the pledged collateral was $16,822 million.Of this amount, $7,898 million was “Securities sold under agreements to repurchase,” $3,603 million was “Separate account liabilities,”$5,040 million was “Cash collateral for loaned securities,” and $281 million was “Long-term debt.” As of December 31, 2012, the carryingamount of the associated liabilities supported by the pledged collateral was $15,621 million. Of this amount, $5,818 million was “Securitiessold under agreements to repurchase,” $3,535 million was “Separate account liabilities,” $3,941 million was “Cash collateral for loanedsecurities,” $280 million was “Long-term debt,” $100 million was “Short-term debt,” and $1,947 million was “Policyholders’ accountbalances.”
In the normal course of its business activities, the Company accepts collateral that can be sold or repledged. The primary sources ofthis collateral are securities in customer accounts and securities purchased under agreements to resell. The fair value of this collateral wasapproximately $193 million and $2,996 million at December 31, 2013 and 2012, respectively, all of which, for both periods, had eitherbeen sold or repledged.
Assets of $211 million and $80 million at December 31, 2013 and 2012, respectively, were on deposit with governmental authoritiesor trustees, including certain restricted cash balances and securities. Additionally, assets carried at $594 million and $594 million atDecember 31, 2013 and 2012, were held in voluntary trusts established primarily to fund guaranteed dividends to certain policyholders andto fund certain employee benefits. Securities restricted as to sale amounted to $186 million and $183 million at December 31, 2013 and2012, respectively. These amounts include member and activity-based stock associated with memberships in the Federal Home Loan Banksof New York and Boston. Restricted cash and securities of $162 million and $67 million at December 31, 2013 and 2012, respectively,were included in “Other assets.”
5. VARIABLE INTEREST ENTITIES
In the normal course of its activities, the Company enters into relationships with various special purpose entities and other entities that aredeemed to be variable interest entities (“VIEs”). A VIE is an entity that either (1) has equity investors that lack certain essential characteristicsof a controlling financial interest (including the ability to control activities of the entity, the obligation to absorb the entity’s expected lossesand the right to receive the entity’s expected residual returns) or (2) lacks sufficient equity to finance its own activities without financialsupport provided by other entities, which in turn would be expected to absorb at least some of the expected losses of the VIE.
If the Company determines that it is the VIE’s “primary beneficiary” it consolidates the VIE. There are currently two models fordetermining whether or not the Company is the “primary beneficiary” of a VIE. The first relates to those VIEs that have the characteristicsof an investment company and for which certain other conditions are true. These conditions are that (1) the Company does not have theimplicit or explicit obligation to fund losses of the VIE and (2) the VIE is not a securitization entity, asset-backed financing entity or anentity that was formerly considered a qualified special-purpose entity. In this model the Company is the primary beneficiary if it stands toabsorb a majority of the VIE’s expected losses or to receive a majority of the VIE’s expected residual returns.
For all other VIEs, the Company is the primary beneficiary if the Company has (1) the power to direct the activities of the VIE thatmost significantly impact the economic performance of the entity and (2) the obligation to absorb losses of the entity that could bepotentially significant to the VIE or the right to receive benefits from the entity that could be potentially significant.
Consolidated Variable Interest EntitiesThe Company is the investment manager of certain asset-backed investment vehicles (commonly referred to as collateralized debt
obligations, or “CDOs”) and certain other vehicles for which the Company earns fee income for investment management services,
140 Prudential Financial, Inc. 2013 Annual Report

PRUDENTIAL FINANCIAL, INC.
Notes to Consolidated Financial Statements
5. VARIABLE INTEREST ENTITIES (continued)
including certain investment structures in which the Company’s asset management business invests with other co-investors in investmentfunds referred to as feeder funds. The Company sells or syndicates investments through these vehicles, principally as part of the strategicinvesting activity of the Company’s asset management businesses. Additionally, the Company may invest in securities issued by thesevehicles. CDOs raise capital by issuing debt securities, and use the proceeds to purchase investments, typically interest-bearing financialinstruments. The Company has analyzed these relationships and determined that for certain CDO’s and other investment structures it is theprimary beneficiary and consolidates these entities. This analysis includes a review of (1) the Company’s rights and responsibilities asinvestment manager, (2) fees received by the Company and (3) other interests (if any) held by the Company. The assets of these VIEs arerestricted and must be used first to settle liabilities of the VIE. Additionally, the Company is not required to provide, and has not provided,material financial or other support to any of these VIEs.
Additionally, the Company is the primary beneficiary of certain VIEs in which the Company has invested, as part of its investmentactivities, but for which it is not the investment manager. These include structured investments issued by a VIE that manages yen-denominatedinvestments coupled with cross-currency coupon swap agreements thereby creating synthetic dual currency investments. The Company’sinvolvement in the structuring of these investments combined with its economic interest indicates that the Company is the primary beneficiary.The Company has not provided material financial support or other support that was not contractually required to these VIEs.
The table below reflects the carrying amount and balance sheet caption in which the assets and liabilities of consolidated VIEs arereported. The liabilities primarily comprise obligations under debt instruments issued by the VIEs that are non-recourse to the Company.The creditors of these VIE do not have recourse to the Company in excess of the assets contained within the VIE.
Consolidated VIE’s forWhich the Company is the
Investment Manager Other Consolidated VIE’s
December 31, December 31,
2013 2012 2013 2012
(in millions)Fixed maturities, available-for-sale . . . . . . . . . . . . . . . . . . . . . . . . . . . . . . . . . . . . . . $ 68 $ 87 $ 108 $ 115Fixed maturities, held-to-maturity . . . . . . . . . . . . . . . . . . . . . . . . . . . . . . . . . . . . . . 0 0 871 1,059Trading account assets supporting insurance liabilities . . . . . . . . . . . . . . . . . . . . . . 0 0 11 8Other trading account assets . . . . . . . . . . . . . . . . . . . . . . . . . . . . . . . . . . . . . . . . . . . 3,832 1,409 0 0Commercial mortgage and other loans . . . . . . . . . . . . . . . . . . . . . . . . . . . . . . . . . . . 23 127 300 0Other long-term investments . . . . . . . . . . . . . . . . . . . . . . . . . . . . . . . . . . . . . . . . . . . 0 22 87 53Cash and cash equivalents . . . . . . . . . . . . . . . . . . . . . . . . . . . . . . . . . . . . . . . . . . . . . 566 9 (3) 0Accrued investment income . . . . . . . . . . . . . . . . . . . . . . . . . . . . . . . . . . . . . . . . . . . 19 0 4 3Other assets . . . . . . . . . . . . . . . . . . . . . . . . . . . . . . . . . . . . . . . . . . . . . . . . . . . . . . . . 132 1 0 0
Total assets of consolidated VIEs . . . . . . . . . . . . . . . . . . . . . . . . . . . . . . . . . . . $4,640 $1,655 $1,378 $1,238
Notes issued by consolidated VIEs . . . . . . . . . . . . . . . . . . . . . . . . . . . . . . . . . . . . . . $3,302 1,577 0 0Other liabilities . . . . . . . . . . . . . . . . . . . . . . . . . . . . . . . . . . . . . . . . . . . . . . . . . . . . . 631 0 1 1
Total liabilities of consolidated VIEs . . . . . . . . . . . . . . . . . . . . . . . . . . . . . . . . $3,933 $1,577 $ 1 $ 1
As included in the table above, notes issued by consolidated VIEs are classified in the line item on the Consolidated Statements ofFinancial Position titled, “Notes issued by consolidated VIEs.” Recourse is limited to the assets of the respective VIE and does not extendto the general credit of Prudential Financial. As of December 31, 2013, the maturities of these obligations were over five years.
In addition, not reflected in the table above, the Company has created a trust that is a VIE, to facilitate Prudential Insurance’s FundingAgreement Notes Issuance Program (“FANIP”). The trust issues medium-term notes secured by funding agreements issued to the trust byPrudential Insurance with the proceeds of such notes. The trust is the beneficiary of an indemnity agreement with the Company thatprovides that the Company is responsible for costs related to the notes issued with limited exception. As a result, the Company hasdetermined that it is the primary beneficiary of the trust, which is therefore consolidated.
The funding agreements represent an intercompany transaction that is eliminated upon consolidation. However, in recognition of thesecurity interest in such funding agreements, the trust’s medium-term note liability of $2,381 million and $1,780 million at December 31,2013 and 2012, respectively, is classified within “Policyholders’ account balances.” Creditors of the trust have recourse to PrudentialInsurance if the trust fails to make contractual payments on the medium-term notes. The Company has not provided material financial orother support to the trust that was not contractually required.
Unconsolidated Variable Interest Entities
The Company has determined that it is not the primary beneficiary of certain VIEs for which it is the investment manager, includingcertain CDOs and other investment structures, as it does not have both (1) the power to direct the activities of the VIE that mostsignificantly impact the economic performance of the entity and (2) the obligation to absorb losses of the entity that could be potentiallysignificant to the VIE or the right to receive benefits from the entity that could be potentially significant. The Company’s maximum
Prudential Financial, Inc. 2013 Annual Report 141

PRUDENTIAL FINANCIAL, INC.
Notes to Consolidated Financial Statements
5. VARIABLE INTEREST ENTITIES (continued)
exposure to loss resulting from its relationship with unconsolidated VIEs for which it is the investment manager is limited to its investmentin the VIEs, which was $489 million and $602 million at December 31, 2013 and 2012, respectively. These investments are reflected in“Fixed maturities, available-for-sale,” “Other trading account assets, at fair value” and “Other long-term investments.” The fair value ofassets held within these unconsolidated VIEs was $9,426 million and $9,240 million as of December 31, 2013 and 2012, respectively. TheCompany provided a guarantee to an unconsolidated VIE under which it was exposed to potential losses in the amount of $64 as ofDecember 31, 2012. As of July 10, 2013, the Company is no longer providing this guarantee. There are no liabilities associated with theseunconsolidated VIEs on the Company’s balance sheet.
In the normal course of its activities, the Company will invest in joint ventures and limited partnerships. These ventures include hedgefunds, private equity funds and real estate-related funds and may or may not be VIEs. The Company’s maximum exposure to loss on theseinvestments, both VIEs and non-VIEs, is limited to the amount of its investment. The Company has determined that it is not required toconsolidate these entities because either (1) it does not control them or (2) it does not have the obligation to absorb losses of the entities thatcould be potentially significant to the entities or the right to receive benefits from the entities that could be potentially significant. TheCompany classifies these investments as “Other long-term investments” and its maximum exposure to loss associated with these entitieswas $7,244 million and $6,873 million as of December 31, 2013 and 2012, respectively.
In addition, in the normal course of its activities, the Company will invest in structured investments including VIEs for which it is notthe investment manager. These structured investments typically invest in fixed income investments and are managed by third parties andinclude asset-backed securities, commercial mortgage-backed securities and residential mortgage-backed securities. The Company’smaximum exposure to loss on these structured investments, both VIEs and non-VIEs, is limited to the amount of its investment. See Note 4for details regarding the carrying amounts and classification of these assets. The Company has not provided material financial or othersupport that was not contractually required to these structures. The Company has determined that it is not the primary beneficiary of thesestructures due to the fact that it does not control these entities.
During the fourth quarter of 2013, the Company sold its investments in certain structured investments consisting of asset-backedsecurities issued by VIEs that manage investments in the European market. The Company recognized a $34 million gain on the sale, and isno longer exposed to losses related to these investments. Prior to the fourth quarter of 2013, the Company had a variable interest in theseVIEs, which represented less than 50% of the only class of variable interests issued by the VIEs. As of December 31, 2012, the marketvalue of these VIEs was approximately $2.1 billion, and the Company’s maximum exposure to loss from these interests was $314 million.
6. DEFERRED POLICY ACQUISITION COSTS
The balances of and changes in deferred policy acquisition costs as of and for the years ended December 31, are as follows:
2013 2012 2011
(in millions)Balance, beginning of year . . . . . . . . . . . . . . . . . . . . . . . . . . . . . . . . . . . . . . . . . . . . . . . . . . . . . . . . . . . . . . . $14,100 $12,517 $12,328
Capitalization of commissions, sales and issue expenses . . . . . . . . . . . . . . . . . . . . . . . . . . . . . . . . . . . . 2,902 3,565 3,070Amortization—Impact of assumption and experience unlocking and true-ups . . . . . . . . . . . . . . . . . . . 328 328 (52)Amortization—All other . . . . . . . . . . . . . . . . . . . . . . . . . . . . . . . . . . . . . . . . . . . . . . . . . . . . . . . . . . . . . (568) (1,832) (2,643)Change in unrealized investment gains and losses . . . . . . . . . . . . . . . . . . . . . . . . . . . . . . . . . . . . . . . . . 492 (168) (346)Foreign currency translation and other . . . . . . . . . . . . . . . . . . . . . . . . . . . . . . . . . . . . . . . . . . . . . . . . . . (742) (310) 160
Balance, end of year . . . . . . . . . . . . . . . . . . . . . . . . . . . . . . . . . . . . . . . . . . . . . . . . . . . . . . . . . . . . . . . . . . . . $16,512 $14,100 $12,517
7. INVESTMENTS IN OPERATING JOINT VENTURES
The Company has made investments in certain joint ventures that are strategic in nature and made other than for the sole purpose ofgenerating investment income. These investments are accounted for under the equity method of accounting and are included in “Otherassets” in the Company’s Consolidated Statements of Financial Position. The earnings from these investments are included on an after-taxbasis in “Equity in earnings of operating joint ventures, net of taxes” in the Company’s Consolidated Statements of Operations. Thesummarized financial information for the Company’s operating joint ventures has been included in the summarized combined financialinformation for all significant equity method investments shown in Note 4.
The following table sets forth information related to the Company’s investments in operating joint ventures as of and for the yearsended December 31:
2013 2012 2011
(in millions)Investment in operating joint ventures . . . . . . . . . . . . . . . . . . . . . . . . . . . . . . . . . . . . . . . . . . . . . . . . . . . . . . . . . . . . $361 $393 $402Dividends received from operating joint ventures . . . . . . . . . . . . . . . . . . . . . . . . . . . . . . . . . . . . . . . . . . . . . . . . . . . $ 31 $ 41 $ 49After-tax equity earnings of operating joint ventures(1) . . . . . . . . . . . . . . . . . . . . . . . . . . . . . . . . . . . . . . . . . . . . . . . $ 59 $ 60 $182
(1) Includes gains associated with sales of the Company’s previous investment, through a consortium, in China Pacific Group, for which the Company’sremaining shares were sold in January, 2013. For the years ended December 31, 2013, 2012 and 2011, the Company recognized pre-tax gains of $66million, $60 million and $237 million, respectively, from sales of this investment.
142 Prudential Financial, Inc. 2013 Annual Report

PRUDENTIAL FINANCIAL, INC.
Notes to Consolidated Financial Statements
7. INVESTMENTS IN OPERATING JOINT VENTURES (continued)
The Company has made investments in operating joint ventures as part of its Asset Management and International Insurance segmentsand its Corporate and Other operations. The Company transacts with certain of these operating joint ventures in the normal course ofbusiness, on terms equivalent to those that prevail in arm’s length transactions. For the years ended December 31, 2013, 2012 and 2011, theCompany recognized $30 million, $22 million and $15 million, respectively, of asset management fee income from these transactions.
The Company holds a 26% investment in a life insurance joint venture in India. On December 18, 2013, the Company formed a newjoint venture by entering into an agreement that effectively replaced our previous joint venture partner with Dewan Housing FinanceCorporation, Ltd (“DHFL”). In accordance with the terms of the new agreement, both DHFL and the Company contributed additionalassets into the joint venture.
On October 20, 2011, the Company entered into an agreement to sell its stake in Afore XXI, S.A. de C.V., a private pension fundmanager in Mexico, to Banorte, a major bank based in Mexico. The transaction was completed on December 2, 2011 and resulted in a pre-tax gain of $96 million to the Asset Management segment. This gain is reflected in “Asset management fees and other income” of theCompany’s Consolidated Statements of Operations.
8. VALUE OF BUSINESS ACQUIRED
The balances of and changes in VOBA as of and for the years ended December 31, are as follows:
2013(1) 2012 2011
(in millions)Balance, beginning of year . . . . . . . . . . . . . . . . . . . . . . . . . . . . . . . . . . . . . . . . . . . . . . . . . . . . . . . . . . . . . . . . . $3,248 $3,845 $ 484
Acquisitions . . . . . . . . . . . . . . . . . . . . . . . . . . . . . . . . . . . . . . . . . . . . . . . . . . . . . . . . . . . . . . . . . . . . . . . . . 1,370 0 3,769Amortization—Impact of assumption and experience unlocking and true-ups . . . . . . . . . . . . . . . . . . . . . . 59 (31) (23)Amortization—All other . . . . . . . . . . . . . . . . . . . . . . . . . . . . . . . . . . . . . . . . . . . . . . . . . . . . . . . . . . . . . . . (509) (520) (555)Change in unrealized investment gains and losses . . . . . . . . . . . . . . . . . . . . . . . . . . . . . . . . . . . . . . . . . . . (55) 90 (74)Interest(2) . . . . . . . . . . . . . . . . . . . . . . . . . . . . . . . . . . . . . . . . . . . . . . . . . . . . . . . . . . . . . . . . . . . . . . . . . . . 105 62 65Foreign currency translation . . . . . . . . . . . . . . . . . . . . . . . . . . . . . . . . . . . . . . . . . . . . . . . . . . . . . . . . . . . . (543) (198) 179
Balance, end of year . . . . . . . . . . . . . . . . . . . . . . . . . . . . . . . . . . . . . . . . . . . . . . . . . . . . . . . . . . . . . . . . . . . . . . . $3,675 $3,248 $3,845
(1) The VOBA balances at December 31, 2013 were $224 million, $44 million, $2,036 million, $0 million, and $1,373 million related to the insurancetransactions associated with the CIGNA, Prudential Annuities Holding Co., Gibraltar Life Insurance Company, LTD (“Gibraltar Life”, representing thebalances associated with the Edison Inc. and Star Inc. acquisitions), Aoba Life and The Hartford, respectively. The weighted average remainingexpected life of VOBA varies by product. The weighted average remaining expected lives were approximately 13, 5, 8, 6, and 10 years for the VOBArelated to CIGNA, Prudential Annuities Holding Co., Gibraltar Life., Aoba Life, and The Hartford, respectively.
(2) The interest accrual rates vary by product. The interest rates for 2013 were 6.40%, 6.14%, 1.28% to 2.87%, 2.60%, and 3.00% to 6.17% for the VOBArelated to CIGNA, Prudential Annuities Holding Co., Gibraltar Life, Aoba Life, and The Hartford, respectively. The interest rates for 2012 were 6.40%,6.18%, 1.28% to 2.87%, and 2.60% for the VOBA related to CIGNA, Prudential Annuities Holding Co., Gibraltar Life, and Aoba Life, respectively.The interest rates for 2011 were 7.10%, 4.81%, 1.28% to 2.87%, 1.28% to 2.87%, and 2.60% for the VOBA related to CIGNA, Prudential AnnuitiesHolding Co., Edison Inc, Star Inc., and Aoba Life, respectively.
The following table provides estimated future amortization, net of interest, for the periods indicated.
2014 2015 2016 2017 2018
(in millions)Estimated future VOBA amortization . . . . . . . . . . . . . . . . . . . . . . . . . . . . . . . . . . . . . . . . . . . . . . . $373 $329 $296 $269 $247
Prudential Financial, Inc. 2013 Annual Report 143

PRUDENTIAL FINANCIAL, INC.
Notes to Consolidated Financial Statements
9. GOODWILL AND OTHER INTANGIBLES
The changes in the book value of goodwill by area are as follows:
AssetManagement Retirement
InternationalInsurance Total
(in millions)Balance at December 31, 2010:
Gross Goodwill . . . . . . . . . . . . . . . . . . . . . . . . . . . . . . . . . . . . . . . . . . . . . . . $239 $444 $ 24 $707Accumulated Impairment Losses . . . . . . . . . . . . . . . . . . . . . . . . . . . . . . . . . 0 0 0 0
Net Goodwill . . . . . . . . . . . . . . . . . . . . . . . . . . . . . . . . . . . . . . . . . . . . . . . . . 239 444 24 707
2011 Activity:Acquisitions . . . . . . . . . . . . . . . . . . . . . . . . . . . . . . . . . . . . . . . . . . . . . . 0 0 184 184Other(1) . . . . . . . . . . . . . . . . . . . . . . . . . . . . . . . . . . . . . . . . . . . . . . . . . (1) 0 (2) (3)
Balance at December 31, 2011:Gross Goodwill . . . . . . . . . . . . . . . . . . . . . . . . . . . . . . . . . . . . . . . . . . . . . . . 238 444 206 888Accumulated Impairment Losses . . . . . . . . . . . . . . . . . . . . . . . . . . . . . . . . . 0 0 0 0
Net Goodwill . . . . . . . . . . . . . . . . . . . . . . . . . . . . . . . . . . . . . . . . . . . . . . . . . 238 444 206 888
2012 Activity:Other(1) . . . . . . . . . . . . . . . . . . . . . . . . . . . . . . . . . . . . . . . . . . . . . . . . . 0 0 (15) (15)
Balance at December 31, 2012:Gross Goodwill . . . . . . . . . . . . . . . . . . . . . . . . . . . . . . . . . . . . . . . . . . . . . . . 238 444 191 873Accumulated Impairment Losses . . . . . . . . . . . . . . . . . . . . . . . . . . . . . . . . . 0 0 0 0
Net Goodwill . . . . . . . . . . . . . . . . . . . . . . . . . . . . . . . . . . . . . . . . . . . . . . . . . 238 444 191 873
2013 Activity:Other(1) . . . . . . . . . . . . . . . . . . . . . . . . . . . . . . . . . . . . . . . . . . . . . . . . . 2 0 (36) (34)
Balance at December 31, 2013:Gross Goodwill . . . . . . . . . . . . . . . . . . . . . . . . . . . . . . . . . . . . . . . . . . . . . . . 240 444 155 839Accumulated Impairment Losses . . . . . . . . . . . . . . . . . . . . . . . . . . . . . . . . . 0 0 0 0
Net Goodwill . . . . . . . . . . . . . . . . . . . . . . . . . . . . . . . . . . . . . . . . . . . . . . . . . $240 $444 $155 $839
(1) Other represents foreign currency translation and purchase price adjustments.
The Company tests goodwill for impairment annually as of December 31 and more frequently if an event occurs or circumstanceschange that would more likely than not reduce the fair value of a reporting unit below its carrying amount, as discussed in further detail inNote 2.
The Company performed goodwill impairment testing for all reporting units that had goodwill at December 31, 2013 and 2012, and noimpairments were recorded.
Other IntangiblesOther intangible balances at December 31, are as follows:
2013 2012
GrossCarryingAmount
AccumulatedAmortization
NetCarryingAmount
GrossCarryingAmount
AccumulatedAmortization
NetCarryingAmount
(in millions)Subject to amortization:
Mortgage servicing rights . . . . . . . . . . . . . . $ 420 $(231) $189 $ 358 $(192) $166Customer relationships . . . . . . . . . . . . . . . . 285 (188) 97 287 (173) 114Other . . . . . . . . . . . . . . . . . . . . . . . . . . . . . . 43 (29) 14 51 (24) 27
Not subject to amortization . . . . . . . . . . . . . . . . . N/A N/A 3 N/A N/A 4
Total . . . . . . . . . . . . . . . . . . . . . . . . . . $303 $311
The fair values of net mortgage servicing rights were $200 million and $170 million at December 31, 2013 and 2012, respectively.Amortization expense for other intangibles was $61 million, $56 million and $50 million for the years ending December 31, 2013, 2012and 2011, respectively. Amortization expense for other intangibles is expected to be approximately $48 million in 2014, $45 million in2015, $38 million in 2016, $31 million in 2017 and $26 million in 2018. The amortization expense amounts listed above for 2013, 2012and 2011 do not include impairments recorded for mortgage servicing rights or other intangibles. See the non-recurring fair valuemeasurements section of Note 20 for more information regarding these impairments.
144 Prudential Financial, Inc. 2013 Annual Report

PRUDENTIAL FINANCIAL, INC.
Notes to Consolidated Financial Statements
10. POLICYHOLDERS’ LIABILITIES
Future Policy Benefits
Future policy benefits at December 31, are as follows:
2013 2012
(in millions)Life insurance(1) . . . . . . . . . . . . . . . . . . . . . . . . . . . . . . . . . . . . . . . . . . . . . . . . . . . . . . . . . . . . . . . . . . . . . . . . . . . . . . . $142,952 $146,378Individual and group annuities and supplementary contracts(1) . . . . . . . . . . . . . . . . . . . . . . . . . . . . . . . . . . . . . . . . . . . 55,445 58,477Other contract liabilities(1) . . . . . . . . . . . . . . . . . . . . . . . . . . . . . . . . . . . . . . . . . . . . . . . . . . . . . . . . . . . . . . . . . . . . . . . 5,490 8,275
Subtotal future policy benefits excluding unpaid claims and claim adjustment expenses . . . . . . . . . . . . . . . . . . . . 203,887 213,130Unpaid claims and claim adjustment expenses . . . . . . . . . . . . . . . . . . . . . . . . . . . . . . . . . . . . . . . . . . . . . . . . . . . . . . . . 2,972 2,920
Total future policy benefits . . . . . . . . . . . . . . . . . . . . . . . . . . . . . . . . . . . . . . . . . . . . . . . . . . . . . . . . . . . . . . . . . . . $206,859 $216,050
(1) Prior period amounts have been reclassified to conform to current period presentation.
Life insurance liabilities include reserves for death and endowment policy benefits, terminal dividends and certain health benefits.Individual and group annuities and supplementary contracts liabilities include reserves for life contingent immediate annuities and lifecontingent group annuities. Other contract liabilities include unearned revenue and certain other reserves for group, annuities andindividual life and health products.
Future policy benefits for individual participating traditional life insurance are based on the net level premium method, calculatedusing the guaranteed mortality and nonforfeiture interest rates which range from 2.5% to 7.5%. Participating insurance represented 5% ofdirect individual life insurance in force at both December 31, 2013 and 2012, and 14%, 11% and 17% of direct individual life insurancepremiums for 2013, 2012 and 2011, respectively.
Future policy benefits for individual non-participating traditional life insurance policies, group and individual long-term care policiesand individual health insurance policies are generally equal to the aggregate of (1) the present value of future benefit payments and relatedexpenses, less the present value of future net premiums, and (2) any premium deficiency reserves. Assumptions as to mortality, morbidityand persistency are based on the Company’s experience, industry data, and/or other factors, when the basis of the reserve is established.Interest rates used in the determination of the present values range from 1.0% to 14.0%; less than 1% of the reserves are based on aninterest rate in excess of 8%.
Future policy benefits for individual and group annuities and supplementary contracts are generally equal to the aggregate of (1) thepresent value of expected future payments, and (2) any premium deficiency reserves. Assumptions as to mortality are based on theCompany’s experience, industry data, and/or other factors, when the basis of the reserve is established. The interest rates used in thedetermination of the present values range from 0.5% to 11.3%; less than 1% of the reserves are based on an interest rate in excess of 8%.
Future policy benefits for other contract liabilities are generally equal to the present value of expected future payments based on theCompany’s experience, except for example, certain group insurance coverages for which future policy benefits are equal to gross unearnedpremium reserves. The interest rates used in the determination of the present values range from 0.1% to 6.5%.
The Company’s liability for future policy benefits is also inclusive of liabilities for guaranteed benefits related to certain nontraditionallong-duration life and annuity contracts. Liabilities for guaranteed benefits with embedded derivative features are primarily in othercontract liabilities. The remaining liabilities for guaranteed benefits are primarily reflected with the underlying contract. See Note 11 foradditional information regarding liabilities for guaranteed benefits related to certain nontraditional long-duration life and annuity contracts.
Premium deficiency reserves included in “Future policy benefits” are established, if necessary, when the liability for future policybenefits plus the present value of expected future gross premiums are determined to be insufficient to provide for expected future policybenefits and expenses. Premium deficiency reserves have been recorded for the group single premium annuity business, which consists oflimited-payment, long duration traditional, non-participating annuities; structured settlements; single premium immediate annuities withlife contingencies; long term care, and for certain individual health policies.
Unpaid claims and claim adjustment expenses primarily reflect the Company’s estimate of future disability claim payments andexpenses as well as estimates of claims incurred but not yet reported as of the balance sheet dates related to group disability products.Unpaid claim liabilities that are discounted use interest rates ranging from 3.0% to 6.4%.
Prudential Financial, Inc. 2013 Annual Report 145

PRUDENTIAL FINANCIAL, INC.
Notes to Consolidated Financial Statements
10. POLICYHOLDERS’ LIABILITIES (continued)
Policyholders’ Account Balances
Policyholders’ account balances at December 31, are as follows:
2013 2012
(in millions)Individual annuities . . . . . . . . . . . . . . . . . . . . . . . . . . . . . . . . . . . . . . . . . . . . . . . . . . . . . . . . . . . . . . . . . . . . . . . . . . . . . $ 35,947 $ 41,026Group annuities . . . . . . . . . . . . . . . . . . . . . . . . . . . . . . . . . . . . . . . . . . . . . . . . . . . . . . . . . . . . . . . . . . . . . . . . . . . . . . . . 27,294 27,782Guaranteed investment contracts and guaranteed interest accounts . . . . . . . . . . . . . . . . . . . . . . . . . . . . . . . . . . . . . . . . 14,898 16,255Funding agreements . . . . . . . . . . . . . . . . . . . . . . . . . . . . . . . . . . . . . . . . . . . . . . . . . . . . . . . . . . . . . . . . . . . . . . . . . . . . . 4,370 3,793Interest-sensitive life contracts . . . . . . . . . . . . . . . . . . . . . . . . . . . . . . . . . . . . . . . . . . . . . . . . . . . . . . . . . . . . . . . . . . . . . 32,136 23,962Dividend accumulation and other . . . . . . . . . . . . . . . . . . . . . . . . . . . . . . . . . . . . . . . . . . . . . . . . . . . . . . . . . . . . . . . . . . 22,012 21,595
Total policyholders’ account balances . . . . . . . . . . . . . . . . . . . . . . . . . . . . . . . . . . . . . . . . . . . . . . . . . . . . . . . . . . . $136,657 $134,413
Policyholders’ account balances primarily represent an accumulation of account deposits plus credited interest less withdrawals,expense charges and mortality charges, if applicable. These policyholders’ account balances also include provisions for benefits under non-life contingent payout annuities. Included in “Funding agreements” at December 31, 2013 and 2012 are $2,380 million and $1,788 million,respectively, related to the Company’s Funding Agreement Notes Issuance Program (“FANIP”). Under this program, which has amaximum authorized amount of $15 billion, a Delaware statutory trust issues medium-term notes to investors that are secured by fundingagreements issued to the trust by Prudential Insurance. The outstanding notes have fixed or floating interest rates that range from 0.5% to5.5% and original maturities ranging from two to ten years. Included in the amounts at December 31, 2013 and 2012 is the medium-termnote liability, which is carried at amortized cost, of $2,381 million and $1,780 million, respectively, as well as the fair value of qualifyingderivative financial instruments associated with these notes of ($1) million and $8 million, respectively. For additional details on theFANIP program, see Note 5.
Also included in “Funding agreements” are collateralized funding agreements issued to the Federal Home Loan Bank of New York(“FHLBNY”) of $1,947 million, as of both December 31, 2013 and 2012. These obligations, which are carried at amortized cost, havefixed or floating interest rates that range from 0.7% to 3.5% and original maturities ranging from three to eight years. For additional detailson the FHLBNY program, see Note 14. Included in interest-sensitive life contracts at December 31, 2013 are $8 billion related to theCompany assuming universal life contracts acquired from The Hartford’s individual life insurance business on January 2, 2013. Interestcrediting rates range from 0% to 23.0% for interest-sensitive life contracts and from 0% to 13.4% for contracts other than interest-sensitivelife. Less than 1% of policyholders’ account balances have interest crediting rates in excess of 8%.
11. CERTAIN NONTRADITIONAL LONG-DURATION CONTRACTS
The Company issues traditional variable annuity contracts through its separate accounts for which investment income and investmentgains and losses accrue directly to, and investment risk is borne by, the contractholder. The Company also issues variable annuity contractswith general and separate account options where the Company contractually guarantees to the contractholder a return of no less than totaldeposits made to the contract less any partial withdrawals (“return of net deposits”). In certain of these variable annuity contracts, theCompany also contractually guarantees to the contractholder a return of no less than (1) total deposits made to the contract less any partialwithdrawals plus a minimum return (“minimum return”), and/or (2) the highest contract value on a specified date minus any withdrawals(“contract value”). These guarantees include benefits that are payable in the event of death, annuitization or at specified dates during theaccumulation period and withdrawal and income benefits payable during specified periods. The Company also issues annuity contracts withmarket value adjusted investment options (“MVAs”), which provide for a return of principal plus a fixed rate of return if held-to-maturity, or,alternatively, a “market adjusted value” if surrendered prior to maturity or if funds are reallocated to other investment options. The marketvalue adjustment may result in a gain or loss to the Company, depending on crediting rates or an indexed rate at surrender, as applicable. TheCompany also issues fixed deferred annuity contracts without MVA that have a guaranteed credited rate and annuity benefit.
In addition, the Company issues certain variable life, variable universal life and universal life contracts where the Companycontractually guarantees to the contractholder a death benefit even when there is insufficient value to cover monthly mortality and expensecharges, whereas otherwise the contract would typically lapse (“no lapse guarantee”). Variable life and variable universal life contracts areoffered with general and separate account options.
The assets supporting the variable portion of both traditional variable annuities and certain variable contracts with guarantees arecarried at fair value and reported as “Separate account assets” with an equivalent amount reported as “Separate account liabilities.”Amounts assessed against the contractholders for mortality, administration, and other services are included within revenue in “Policycharges and fee income” and changes in liabilities for minimum guarantees are generally included in “Policyholders’ benefits.”
For those guarantees of benefits that are payable in the event of death, the net amount at risk is generally defined as the currentguaranteed minimum death benefit in excess of the current account balance at the balance sheet date. The Company’s primary riskexposures for these contracts relates to actual deviations from, or changes to, the assumptions used in the original pricing of these products,including fixed income and equity market returns, contract lapses and contractholder mortality.
146 Prudential Financial, Inc. 2013 Annual Report

PRUDENTIAL FINANCIAL, INC.
Notes to Consolidated Financial Statements
11. CERTAIN NONTRADITIONAL LONG-DURATION CONTRACTS (continued)
For guarantees of benefits that are payable at annuitization, the net amount at risk is generally defined as the present value of theminimum guaranteed annuity payments available to the contractholder determined in accordance with the terms of the contract in excess ofthe current account balance. The Company’s primary risk exposures for these contracts relates to actual deviations from, or changes to, theassumptions used in the original pricing of these products, including fixed income and equity market returns, timing of annuitization,contract lapses and contractholder mortality.
For guarantees of benefits that are payable at withdrawal, the net amount at risk is generally defined as the present value of theminimum guaranteed withdrawal payments available to the contractholder determined in accordance with the terms of the contract inexcess of the current account balance. For guarantees of accumulation balances, the net amount at risk is generally defined as theguaranteed minimum accumulation balance minus the current account balance. The Company’s primary risk exposures for these contractsrelates to actual deviations from, or changes to, the assumptions used in the original pricing of these products, including equity marketreturns, interest rates, market volatility or contractholder behavior used in the original pricing of these products.
The Company’s contracts with guarantees may offer more than one type of guarantee in each contract; therefore, the amounts listedmay not be mutually exclusive. The liabilities related to the net amount at risk are reflected within “Future policy benefits.” As ofDecember 31, 2013 and 2012, the Company had the following guarantees associated with these contracts, by product and guarantee type:
December 31, 2013 December 31, 2012
In the Event ofDeath
At Annuitization/Accumulation(1)
In the Event ofDeath
At Annuitization/Accumulation(1)
($ in millions)Annuity Contracts
Return of net depositsAccount value . . . . . . . . . . . . . . . . . . . . . . . . . . . . . . . . . . . $113,527 $ 181 $ 98,207 $ 196Net amount at risk . . . . . . . . . . . . . . . . . . . . . . . . . . . . . . . . $ 465 $ 0 $ 829 $ 33Average attained age of contractholders . . . . . . . . . . . . . . . 63 years 62 years 62 years 62 years
Minimum return or contract valueAccount value . . . . . . . . . . . . . . . . . . . . . . . . . . . . . . . . . . . $ 37,801 $ 127,530 $ 34,299 $ 109,845Net amount at risk . . . . . . . . . . . . . . . . . . . . . . . . . . . . . . . . $ 2,817 $ 2,892 $ 4,209 $ 5,072Average attained age of contractholders . . . . . . . . . . . . . . . 66 years 63 years 65 years 62 yearsAverage period remaining until earliest expected
annuitization . . . . . . . . . . . . . . . . . . . . . . . . . . . . . . . . . . N/A 0.33 year N/A 0.50 year
(1) Includes income and withdrawal benefits as described herein.
December 31,
2013 2012
In the Event of Death
($ in millions)Variable Life, Variable Universal Life and Universal Life Contracts
No lapse guaranteesSeparate account value . . . . . . . . . . . . . . . . . . . . . . . . . . . . . . . . . . . . . . . . . . . . . . . . . . . . . . . . . . . . . . . . . . . . . . . . . . . . . . . . . . . . . $ 7,546 $ 3,406General account value . . . . . . . . . . . . . . . . . . . . . . . . . . . . . . . . . . . . . . . . . . . . . . . . . . . . . . . . . . . . . . . . . . . . . . . . . . . . . . . . . . . . . . $ 11,155 $ 4,960Net amount at risk . . . . . . . . . . . . . . . . . . . . . . . . . . . . . . . . . . . . . . . . . . . . . . . . . . . . . . . . . . . . . . . . . . . . . . . . . . . . . . . . . . . . . . . . . $194,344 $ 89,881Average attained age of contractholders . . . . . . . . . . . . . . . . . . . . . . . . . . . . . . . . . . . . . . . . . . . . . . . . . . . . . . . . . . . . . . . . . . . . . . . . 54 years 48 years
Account balances of variable annuity contracts with guarantees were invested in separate account investment options as follows:
2013 2012
(in millions)Equity funds . . . . . . . . . . . . . . . . . . . . . . . . . . . . . . . . . . . . . . . . . . . . . . . . . . . . . . . . . . . . . . . . . . . . . . . . . . . . . . . . . . . $ 90,199 $ 73,813Bond funds . . . . . . . . . . . . . . . . . . . . . . . . . . . . . . . . . . . . . . . . . . . . . . . . . . . . . . . . . . . . . . . . . . . . . . . . . . . . . . . . . . . . 46,235 40,815Balanced funds . . . . . . . . . . . . . . . . . . . . . . . . . . . . . . . . . . . . . . . . . . . . . . . . . . . . . . . . . . . . . . . . . . . . . . . . . . . . . . . . . 652 524Money market funds . . . . . . . . . . . . . . . . . . . . . . . . . . . . . . . . . . . . . . . . . . . . . . . . . . . . . . . . . . . . . . . . . . . . . . . . . . . . 6,528 7,763
Total . . . . . . . . . . . . . . . . . . . . . . . . . . . . . . . . . . . . . . . . . . . . . . . . . . . . . . . . . . . . . . . . . . . . . . . . . . . . . . . . . . . . . $143,614 $122,915
In addition to the amounts invested in separate account investment options above, $7,714 million at December 31, 2013, and $9,590million at December 31, 2012, of account balances of variable annuity contracts with guarantees, inclusive of contracts with MVA features,were invested in general account investment options. For the years ended December 31, 2013, 2012 and 2011, there were no transfers ofassets, other than cash, from the general account to any separate account, and accordingly no gains or losses recorded.
Prudential Financial, Inc. 2013 Annual Report 147

PRUDENTIAL FINANCIAL, INC.
Notes to Consolidated Financial Statements
11. CERTAIN NONTRADITIONAL LONG-DURATION CONTRACTS (continued)
Liabilities For Guarantee Benefits
The table below summarizes the changes in general account liabilities for guarantees. The liabilities for guaranteed minimum deathbenefits (“GMDB”), and guaranteed minimum income benefits (“GMIB”) are included in “Future policy benefits” and the related changesin the liabilities are included in “Policyholders’ benefits.” Guaranteed minimum accumulation benefits (“GMAB”), guaranteed minimumwithdrawal benefits (“GMWB”), and guaranteed minimum income and withdrawal benefits (“GMIWB”) features are considered to bebifurcated embedded derivatives and are recorded at fair value within “Future policy benefits”. Changes in the fair value of thesederivatives, including changes in the Company’s own risk of non-performance, along with any fees attributed or payments made relating tothe derivative, are recorded in “Realized investment gains (losses), net.” See Note 20 for additional information regarding the methodologyused in determining the fair value of these embedded derivatives. The Company maintains a portfolio of derivative investments that serveas a partial hedge of the risks associated with these products, for which the changes in fair value are also recorded in “Realized investmentgains (losses), net.” This portfolio of derivative investments does not qualify for hedge accounting treatment under U.S. GAAP.
GMDB GMIB
GMAB/GMWB/GMIWB
Variable Life,Variable
Universal Lifeand
Universal Life Annuity Annuity Annuity
(in millions)Balance at December 31, 2010 . . . . . . . . . . . . . . . . . . . . . . . . . . . . . . . . . . . . . . . . . . . . . . . . . . . . . . . . . $ 202 $ 188 $114 $ (204)
Incurred guarantee benefits—Impact of assumption and experience unlocking and true-ups(1) . . . 8 94 5 0Incurred guarantee benefits—All other(1) . . . . . . . . . . . . . . . . . . . . . . . . . . . . . . . . . . . . . . . . . . . . 71 147 26 3,061Paid guarantee benefits and other . . . . . . . . . . . . . . . . . . . . . . . . . . . . . . . . . . . . . . . . . . . . . . . . . . . (2) (113) (42) 0Other(2) . . . . . . . . . . . . . . . . . . . . . . . . . . . . . . . . . . . . . . . . . . . . . . . . . . . . . . . . . . . . . . . . . . . . . . . 9 3 302 29
Balance at December 31, 2011 . . . . . . . . . . . . . . . . . . . . . . . . . . . . . . . . . . . . . . . . . . . . . . . . . . . . . . . . . 288 319 405 2,886
Incurred guarantee benefits—Impact of assumption and experience unlocking and true-ups(1) . . . 18 73 48 0Incurred guarantee benefits—All other(1) . . . . . . . . . . . . . . . . . . . . . . . . . . . . . . . . . . . . . . . . . . . . 85 199 54 463Paid guarantee benefits and other . . . . . . . . . . . . . . . . . . . . . . . . . . . . . . . . . . . . . . . . . . . . . . . . . . . (14) (104) (32) 0Other . . . . . . . . . . . . . . . . . . . . . . . . . . . . . . . . . . . . . . . . . . . . . . . . . . . . . . . . . . . . . . . . . . . . . . . . . (6) 1 (16) (1)
Balance at December 31, 2012 . . . . . . . . . . . . . . . . . . . . . . . . . . . . . . . . . . . . . . . . . . . . . . . . . . . . . . . . . 371 488 459 3,348
Incurred guarantee benefits—Impact of assumption and experience unlocking and true-ups(1) . . . (26) (140) (27) 0Incurred guarantee benefits—All other(1) . . . . . . . . . . . . . . . . . . . . . . . . . . . . . . . . . . . . . . . . . . . . 123 175 37 (2,904)Paid guarantee benefits . . . . . . . . . . . . . . . . . . . . . . . . . . . . . . . . . . . . . . . . . . . . . . . . . . . . . . . . . . . (4) (75) (23) 0Other(3) . . . . . . . . . . . . . . . . . . . . . . . . . . . . . . . . . . . . . . . . . . . . . . . . . . . . . . . . . . . . . . . . . . . . . . . 1,331 13 (49) (3)
Balance at December 31, 2013 . . . . . . . . . . . . . . . . . . . . . . . . . . . . . . . . . . . . . . . . . . . . . . . . . . . . . . . . . $1,795 $ 461 $397 $ 441
(1) Incurred guarantee benefits include the portion of assessments established as additions to reserves as well as changes in estimates affecting the reserves.Also includes changes in the fair value of features considered to be derivatives.
(2) Primarily represents amounts acquired from Star and Edison.(3) GMDB primarily includes amounts acquired from The Hartford on January 2, 2013.
The GMDB liability is determined each period end by estimating the accumulated value of a portion of the total assessments to dateless the accumulated value of the guaranteed death benefits in excess of the account balance. The GMIB liability associated with variableannuities is determined each period by estimating the accumulated value of a portion of the total assessments to date less the accumulatedvalue of the projected income benefits in excess of the account balance. The portion of assessments used is chosen such that, at issue thepresent value of expected death benefits or expected income benefits in excess of the projected account balance and the portion of thepresent value of total expected assessments over the lifetime of the contracts are equal. The GMIB liability associated with fixed annuitiesis determined each period by estimating the present value of projected income benefits in excess of the account balance. The Companyregularly evaluates the estimates used and adjusts the GMDB and GMIB liability balances, with an associated charge or credit to earnings,if actual experience or other evidence suggests that earlier estimates should be revised.
The GMAB features provide the contractholder with a guaranteed return of initial account value or an enhanced value if applicable.The most significant of the Company’s GMAB features are the guaranteed return option (“GRO”) features, which includes an automaticrebalancing element that reduces the Company’s exposure to these guarantees. The GMAB liability is calculated as the present value offuture expected payments to customers less the present value of assessed rider fees attributable to the embedded derivative feature.
The GMWB features provide the contractholder with access to a guaranteed remaining balance if the account value is reduced to zerothrough a combination of market declines and withdrawals. The guaranteed remaining balance is generally equal to the protected valueunder the contract, which is initially established as the greater of the account value or cumulative deposits when withdrawals commence,less cumulative withdrawals. The contractholder also has the option, after a specified time period, to reset the guaranteed remaining balance
148 Prudential Financial, Inc. 2013 Annual Report

PRUDENTIAL FINANCIAL, INC.
Notes to Consolidated Financial Statements
11. CERTAIN NONTRADITIONAL LONG-DURATION CONTRACTS (continued)
to the then-current account value, if greater. The contractholder accesses the guaranteed remaining balance through payments over time,subject to maximum annual limits. The GMWB liability is calculated as the present value of future expected payments to customers less thepresent value of assessed rider fees attributable to the embedded derivative feature.
The GMIWB features, taken collectively, provide a contractholder two optional methods to receive guaranteed minimum payments overtime, a “withdrawal” option or an “income” option. The withdrawal option (which was available under only one of the GMIWBs theCompany no longer offers) guarantees that a contractholder can withdraw an amount each year until the cumulative withdrawals reach a totalguaranteed balance. The income option (which varies among the Company’s GMIWBs) in general guarantees the contractholder the abilityto withdraw an amount each year for life (or for joint lives, in the case of any spousal version of the benefit) where such amount is equal to apercentage of a protected value under the benefit. The contractholder also has the potential to increase this annual amount, based on certainsubsequent increases in account value that may occur. The GMIWB can be elected by the contractholder upon issuance of an appropriatedeferred variable annuity contract or at any time following contract issue prior to annuitization. Certain GMIWB features include anautomatic rebalancing element that reduces the Company’s exposure to these guarantees. The GMIWB liability is calculated as the presentvalue of future expected payments to customers less the present value of assessed rider fees attributable to the embedded derivative feature.
Sales Inducements
The Company defers sales inducements and amortizes them over the anticipated life of the policy using the same methodology andassumptions used to amortize deferred policy acquisition costs. These deferred sales inducements are included in “Other assets.” TheCompany offers various types of sales inducements including: (1) a bonus whereby the policyholder’s initial account balance is increasedby an amount equal to a specified percentage of the customer’s initial deposit; (2) additional credits after a certain number of years acontract is held; and (3) enhanced interest crediting rates that are higher than the normal general account interest rate credited in certainproduct lines. Changes in deferred sales inducements, reported as “Interest credited to policyholders’ account balances,” are as follows:
SalesInducements
(in millions)Balance at December 31, 2010 . . . . . . . . . . . . . . . . . . . . . . . . . . . . . . . . . . . . . . . . . . . . . . . . . . . . . . . . . . . . . . . . . . . . . . . . . . . . $1,348
Capitalization . . . . . . . . . . . . . . . . . . . . . . . . . . . . . . . . . . . . . . . . . . . . . . . . . . . . . . . . . . . . . . . . . . . . . . . . . . . . . . . . . . . . . . 359Amortization—Impact of assumption and experience unlocking and true-ups . . . . . . . . . . . . . . . . . . . . . . . . . . . . . . . . . . . (81)Amortization—All other . . . . . . . . . . . . . . . . . . . . . . . . . . . . . . . . . . . . . . . . . . . . . . . . . . . . . . . . . . . . . . . . . . . . . . . . . . . . . (645)Change in unrealized investment gains and losses . . . . . . . . . . . . . . . . . . . . . . . . . . . . . . . . . . . . . . . . . . . . . . . . . . . . . . . . . 20
Balance at December 31, 2011 . . . . . . . . . . . . . . . . . . . . . . . . . . . . . . . . . . . . . . . . . . . . . . . . . . . . . . . . . . . . . . . . . . . . . . . . . . . . 1,001
Capitalization . . . . . . . . . . . . . . . . . . . . . . . . . . . . . . . . . . . . . . . . . . . . . . . . . . . . . . . . . . . . . . . . . . . . . . . . . . . . . . . . . . . . . . 259Amortization—Impact of assumption and experience unlocking and true-ups . . . . . . . . . . . . . . . . . . . . . . . . . . . . . . . . . . . 189Amortization—All other . . . . . . . . . . . . . . . . . . . . . . . . . . . . . . . . . . . . . . . . . . . . . . . . . . . . . . . . . . . . . . . . . . . . . . . . . . . . . (109)Change in unrealized investment gains and losses . . . . . . . . . . . . . . . . . . . . . . . . . . . . . . . . . . . . . . . . . . . . . . . . . . . . . . . . . 17
Balance at December 31, 2012 . . . . . . . . . . . . . . . . . . . . . . . . . . . . . . . . . . . . . . . . . . . . . . . . . . . . . . . . . . . . . . . . . . . . . . . . . . . . 1,357
Capitalization . . . . . . . . . . . . . . . . . . . . . . . . . . . . . . . . . . . . . . . . . . . . . . . . . . . . . . . . . . . . . . . . . . . . . . . . . . . . . . . . . . . . . . 53Amortization—Impact of assumption and experience unlocking and true-ups . . . . . . . . . . . . . . . . . . . . . . . . . . . . . . . . . . . 27Amortization—All other . . . . . . . . . . . . . . . . . . . . . . . . . . . . . . . . . . . . . . . . . . . . . . . . . . . . . . . . . . . . . . . . . . . . . . . . . . . . . 340Change in unrealized investment gains and losses and other . . . . . . . . . . . . . . . . . . . . . . . . . . . . . . . . . . . . . . . . . . . . . . . . . 36
Balance at December 31, 2013 . . . . . . . . . . . . . . . . . . . . . . . . . . . . . . . . . . . . . . . . . . . . . . . . . . . . . . . . . . . . . . . . . . . . . . . . . . . . $1,813
12. CLOSED BLOCK
On the date of demutualization, Prudential Insurance established a Closed Block for certain individual life insurance policies andannuities issued by Prudential Insurance in the U.S. The recorded assets and liabilities were allocated to the Closed Block at their historicalcarrying amounts. The Closed Block forms the principal component of the Closed Block Business. See Note 22 for financial information onthe Closed Block Business, which includes Surplus and Related Assets, the IHC debt, as discussed in Note 14, and other related liabilities.
The policies included in the Closed Block are specified individual life insurance policies and individual annuity contracts that were inforce on the effective date of the Plan of Reorganization and for which Prudential Insurance is currently paying or expects to payexperience-based policy dividends. Assets have been allocated to the Closed Block in an amount that has been determined to produce cashflows which, together with revenues from policies included in the Closed Block, are expected to be sufficient to support obligations andliabilities relating to these policies, including provision for payment of benefits, certain expenses, and taxes and to provide for continuationof the policyholder dividend scales in effect in 2000, assuming experience underlying such scales continues. To the extent that, over time,cash flows from the assets allocated to the Closed Block and claims and other experience related to the Closed Block are, in the aggregate,more or less favorable than what was assumed when the Closed Block was established, total dividends paid to Closed Block policyholdersmay be greater than or less than the total dividends that would have been paid to these policyholders if the policyholder dividend scales ineffect in 2000 had been continued. Any cash flows in excess of amounts assumed will be available for distribution over time to ClosedBlock policyholders and will not be available to stockholders. If the Closed Block has insufficient funds to make guaranteed policy benefitpayments, such payments will be made from assets outside of the Closed Block. The Closed Block will continue in effect as long as anypolicy in the Closed Block remains in force unless, with the consent of the New Jersey insurance regulator, it is terminated earlier.
Prudential Financial, Inc. 2013 Annual Report 149

PRUDENTIAL FINANCIAL, INC.
Notes to Consolidated Financial Statements
12. CLOSED BLOCK (continued)
The excess of Closed Block Liabilities over Closed Block Assets at the date of the demutualization (adjusted to eliminate the impactof related amounts in AOCI) represented the estimated maximum future earnings at that date from the Closed Block expected to result fromoperations attributed to the Closed Block after income taxes. In establishing the Closed Block, the Company developed an actuarialcalculation of the timing of such maximum future earnings. If actual cumulative earnings of the Closed Block from inception through theend of any given period are greater than the expected cumulative earnings, only the expected earnings will be recognized in income. Anyexcess of actual cumulative earnings over expected cumulative earnings will represent undistributed accumulated earnings attributable topolicyholders, which are recorded as a policyholder dividend obligation. The policyholder dividend obligation represents amounts to bepaid to Closed Block policyholders as an additional policyholder dividend unless otherwise offset by future Closed Block performance thatis less favorable than originally expected. If the actual cumulative earnings of the Closed Block from its inception through the end of anygiven period are less than the expected cumulative earnings of the Closed Block, the Company will recognize only the actual earnings inincome. However, the Company may reduce policyholder dividend scales, which would be intended to increase future actual earnings untilthe actual cumulative earnings equaled the expected cumulative earnings.
As of December 31, 2013 and 2012, the Company recognized a policyholder dividend obligation of $887 million and $885 million,respectively, to Closed Block policyholders for the excess of actual cumulative earnings over the expected cumulative earnings.Additionally, accumulated net unrealized investment gains that have arisen subsequent to the establishment of the Closed Block have beenreflected as a policyholder dividend obligation of $3,624 million and $5,478 million at December 31, 2013 and 2012, respectively, to bepaid to Closed Block policyholders unless offset by future experience, with an offsetting amount reported in AOCI. See the table below forchanges in the components of the policyholder dividend obligation for the years ended December 31, 2013 and 2012.
On December 13, 2011 and December 11, 2012, Prudential Insurance’s Board of Directors approved a continuation of the ClosedBlock dividend scales for 2012 and 2013, respectively. On December 5, 2013, Prudential Insurance’s Board of Directors acted to increasethe 2014 dividends payable on Closed Block policies. This action resulted in an approximately $33 million increase in the liability forpolicyholders dividends recognized for the year ended December 31, 2013.
Closed Block Liabilities and Assets designated to the Closed Block at December 31, as well as maximum future earnings to berecognized from Closed Block Liabilities and Closed Block Assets, are as follows:
2013 2012
(in millions)Closed Block Liabilities
Future policy benefits . . . . . . . . . . . . . . . . . . . . . . . . . . . . . . . . . . . . . . . . . . . . . . . . . . . . . . . . . . . . . . . . . . . . . . . . . $50,258 $50,839Policyholders’ dividends payable . . . . . . . . . . . . . . . . . . . . . . . . . . . . . . . . . . . . . . . . . . . . . . . . . . . . . . . . . . . . . . . . 907 887Policyholders’ dividend obligation . . . . . . . . . . . . . . . . . . . . . . . . . . . . . . . . . . . . . . . . . . . . . . . . . . . . . . . . . . . . . . . 4,511 6,363Policyholders’ account balances . . . . . . . . . . . . . . . . . . . . . . . . . . . . . . . . . . . . . . . . . . . . . . . . . . . . . . . . . . . . . . . . . 5,359 5,426Other Closed Block liabilities . . . . . . . . . . . . . . . . . . . . . . . . . . . . . . . . . . . . . . . . . . . . . . . . . . . . . . . . . . . . . . . . . . . 4,281 3,366
Total Closed Block Liabilities . . . . . . . . . . . . . . . . . . . . . . . . . . . . . . . . . . . . . . . . . . . . . . . . . . . . . . . . . . . . . . . 65,316 66,881
Closed Block AssetsFixed maturities, available-for-sale, at fair value . . . . . . . . . . . . . . . . . . . . . . . . . . . . . . . . . . . . . . . . . . . . . . . . . . . . . 39,169 41,980Other trading account assets, at fair value . . . . . . . . . . . . . . . . . . . . . . . . . . . . . . . . . . . . . . . . . . . . . . . . . . . . . . . . . . 291 224Equity securities, available-for-sale, at fair value . . . . . . . . . . . . . . . . . . . . . . . . . . . . . . . . . . . . . . . . . . . . . . . . . . . . 3,884 3,225Commercial mortgage and other loans . . . . . . . . . . . . . . . . . . . . . . . . . . . . . . . . . . . . . . . . . . . . . . . . . . . . . . . . . . . . 8,762 8,747Policy loans . . . . . . . . . . . . . . . . . . . . . . . . . . . . . . . . . . . . . . . . . . . . . . . . . . . . . . . . . . . . . . . . . . . . . . . . . . . . . . . . . 5,013 5,120Other long-term investments . . . . . . . . . . . . . . . . . . . . . . . . . . . . . . . . . . . . . . . . . . . . . . . . . . . . . . . . . . . . . . . . . . . . 2,085 2,094Short-term investments . . . . . . . . . . . . . . . . . . . . . . . . . . . . . . . . . . . . . . . . . . . . . . . . . . . . . . . . . . . . . . . . . . . . . . . . 1,790 1,194
Total investments . . . . . . . . . . . . . . . . . . . . . . . . . . . . . . . . . . . . . . . . . . . . . . . . . . . . . . . . . . . . . . . . . . . . . . . . . 60,994 62,584Cash and cash equivalents . . . . . . . . . . . . . . . . . . . . . . . . . . . . . . . . . . . . . . . . . . . . . . . . . . . . . . . . . . . . . . . . . . . . . . 544 511Accrued investment income . . . . . . . . . . . . . . . . . . . . . . . . . . . . . . . . . . . . . . . . . . . . . . . . . . . . . . . . . . . . . . . . . . . . . 542 550Other Closed Block assets . . . . . . . . . . . . . . . . . . . . . . . . . . . . . . . . . . . . . . . . . . . . . . . . . . . . . . . . . . . . . . . . . . . . . . 296 262
Total Closed Block Assets . . . . . . . . . . . . . . . . . . . . . . . . . . . . . . . . . . . . . . . . . . . . . . . . . . . . . . . . . . . . . . . . . . 62,376 63,907
Excess of reported Closed Block Liabilities over Closed Block Assets . . . . . . . . . . . . . . . . . . . . . . . . . . . . . . . . . . . . . . . 2,940 2,974Portion of above representing accumulated other comprehensive income:
Net unrealized investment gains (losses) . . . . . . . . . . . . . . . . . . . . . . . . . . . . . . . . . . . . . . . . . . . . . . . . . . . . . . . 3,615 5,467Allocated to policyholder dividend obligation . . . . . . . . . . . . . . . . . . . . . . . . . . . . . . . . . . . . . . . . . . . . . . . . . . . (3,624) (5,478)
Future earnings to be recognized from Closed Block Assets and Closed Block Liabilities . . . . . . . . . . . . . . . . . . . . . . . . $ 2,931 $ 2,963
150 Prudential Financial, Inc. 2013 Annual Report

PRUDENTIAL FINANCIAL, INC.
Notes to Consolidated Financial Statements
12. CLOSED BLOCK (continued)
Information regarding the policyholder dividend obligation is as follows:
2013 2012
(in millions)Balance, January 1 . . . . . . . . . . . . . . . . . . . . . . . . . . . . . . . . . . . . . . . . . . . . . . . . . . . . . . . . . . . . . . . . . . . . . . . . . . . . . . . . . $ 6,363 $4,609
Impact from earnings allocable to policyholder dividend obligation . . . . . . . . . . . . . . . . . . . . . . . . . . . . . . . . . . . . . . . 2 123Change in net unrealized investment gains (losses) allocated to policyholder dividend obligation . . . . . . . . . . . . . . . (1,854) 1,631
Balance, December 31 . . . . . . . . . . . . . . . . . . . . . . . . . . . . . . . . . . . . . . . . . . . . . . . . . . . . . . . . . . . . . . . . . . . . . . . . . . . . . . $ 4,511 $6,363
Closed Block revenues and benefits and expenses for the years ended December 31, were as follows:
2013 2012 2011
(in millions)Revenues
Premiums . . . . . . . . . . . . . . . . . . . . . . . . . . . . . . . . . . . . . . . . . . . . . . . . . . . . . . . . . . . . . . . . . . . . . . . . . . . . $2,728 $2,817 $2,918Net investment income . . . . . . . . . . . . . . . . . . . . . . . . . . . . . . . . . . . . . . . . . . . . . . . . . . . . . . . . . . . . . . . . . 2,796 2,919 2,976Realized investment gains (losses), net . . . . . . . . . . . . . . . . . . . . . . . . . . . . . . . . . . . . . . . . . . . . . . . . . . . . . 230 243 855Other income . . . . . . . . . . . . . . . . . . . . . . . . . . . . . . . . . . . . . . . . . . . . . . . . . . . . . . . . . . . . . . . . . . . . . . . . . 57 31 38
Total Closed Block revenues . . . . . . . . . . . . . . . . . . . . . . . . . . . . . . . . . . . . . . . . . . . . . . . . . . . . . . . . . 5,811 6,010 6,787
Benefits and ExpensesPolicyholders’ benefits . . . . . . . . . . . . . . . . . . . . . . . . . . . . . . . . . . . . . . . . . . . . . . . . . . . . . . . . . . . . . . . . . 3,334 3,445 3,482Interest credited to policyholders’ account balances . . . . . . . . . . . . . . . . . . . . . . . . . . . . . . . . . . . . . . . . . . . 136 137 139Dividends to policyholders . . . . . . . . . . . . . . . . . . . . . . . . . . . . . . . . . . . . . . . . . . . . . . . . . . . . . . . . . . . . . . 1,910 2,021 2,571General and administrative expenses . . . . . . . . . . . . . . . . . . . . . . . . . . . . . . . . . . . . . . . . . . . . . . . . . . . . . . 467 492 519
Total Closed Block benefits and expenses . . . . . . . . . . . . . . . . . . . . . . . . . . . . . . . . . . . . . . . . . . . . . . 5,847 6,095 6,711
Closed Block revenues, net of Closed Block benefits and expenses, before income taxes and discontinuedoperations . . . . . . . . . . . . . . . . . . . . . . . . . . . . . . . . . . . . . . . . . . . . . . . . . . . . . . . . . . . . . . . . . . . . . . . . . . . . . (36) (85) 76
Income tax expense (benefit) . . . . . . . . . . . . . . . . . . . . . . . . . . . . . . . . . . . . . . . . . . . . . . . . . . . . . . . . . . . . . . . . . (57) (103) 67
Closed Block revenues, net of Closed Block benefits and expenses and income taxes, before discontinuedoperations . . . . . . . . . . . . . . . . . . . . . . . . . . . . . . . . . . . . . . . . . . . . . . . . . . . . . . . . . . . . . . . . . . . . . . . . . . . . . 21 18 9
Income (loss) from discontinued operations, net of taxes . . . . . . . . . . . . . . . . . . . . . . . . . . . . . . . . . . . . . . . . . . . 0 (2) 0
Closed Block revenues, net of Closed Block benefits and expenses, income taxes and discontinuedoperations . . . . . . . . . . . . . . . . . . . . . . . . . . . . . . . . . . . . . . . . . . . . . . . . . . . . . . . . . . . . . . . . . . . . . . . . . . . . . $ 21 $ 16 $ 9
13. REINSURANCE
The Company participates in reinsurance with third parties primarily to provide additional capacity for future growth, tolimit the maximum net loss potential arising from large risks and in acquiring or disposing of businesses.
On January 2, 2013, the Company acquired The Hartford’s individual life insurance business through a reinsurance transaction. Underthe agreement, the Company provided reinsurance for approximately 700,000 life insurance policies with net retained face amount in forceof approximately $141 billion. The Company acquired the general account business through a coinsurance arrangement and, for certaintypes of general account policies, a modified coinsurance arrangement. The Company acquired the separate account business through amodified coinsurance arrangement.
Since 2011, the Company has entered into several reinsurance agreements to assume pension liabilities in the United Kingdom. Underthese arrangements, the Company assumes the longevity risk associated with the pension benefits of certain named beneficiaries.
In 2006, the Company acquired the variable annuity business of The Allstate Corporation (“Allstate”) through a reinsurancetransaction. The reinsurance arrangements with Allstate include a coinsurance arrangement associated with the general account liabilitiesassumed and a modified coinsurance arrangement associated with the separate account liabilities assumed. The reinsurance payable, whichrepresents the Company’s obligation under the modified coinsurance arrangement, is netted with the reinsurance receivable in theCompany’s Consolidated Statement of Financial Position.
In 2004, the Company acquired the retirement business of CIGNA and as a result, entered into various reinsurance arrangements. TheCompany still has indemnity coinsurance and modified coinsurance without assumption arrangements in effect related to this acquisition.
For the domestic business, life and disability reinsurance is accomplished through various plans of reinsurance, primarily yearlyrenewable term, per person excess, excess of loss, and coinsurance. The Company currently reinsures 90% of the mortality risk for most newindividual life products. Placement of reinsurance is accomplished primarily on an automatic basis with some specific risks reinsured on afacultative basis. The Company has historically retained up to $30 million per life, but has reduced its retention limit to $20 million per life in2013. In addition, the Company has reinsured 73% of the Closed Block Business with unaffiliated third parties through various modifiedcoinsurance arrangements. The Company accounts for these modified coinsurance arrangements using the deposit method of accounting.
Prudential Financial, Inc. 2013 Annual Report 151
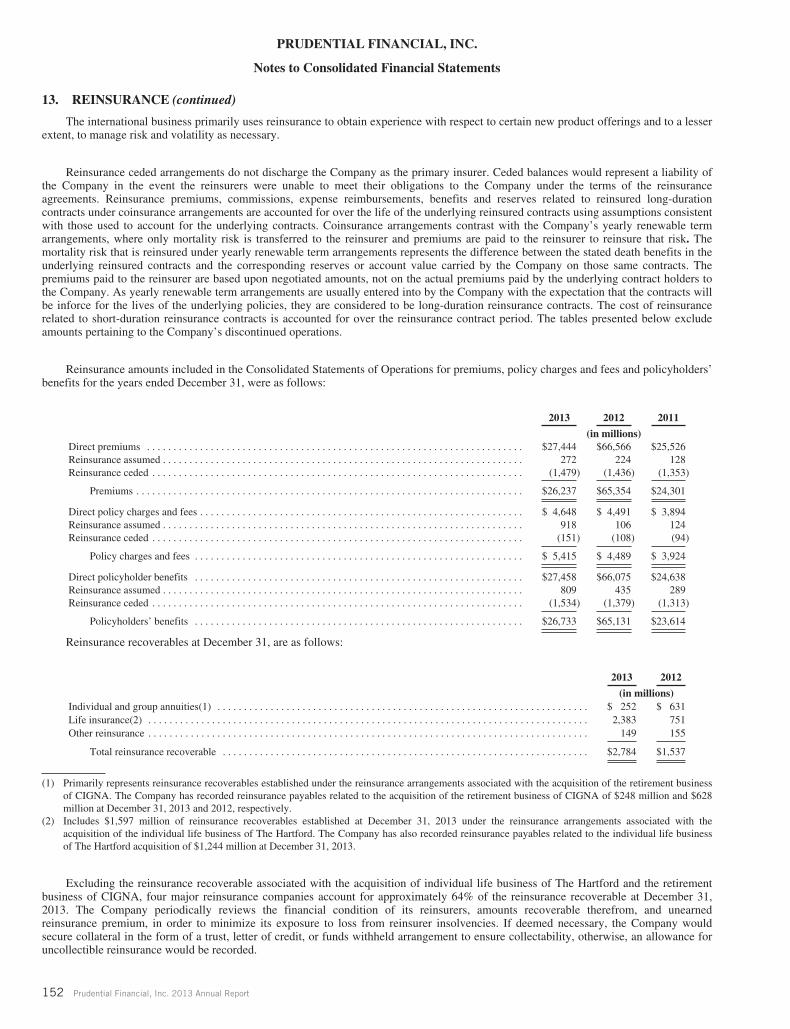
PRUDENTIAL FINANCIAL, INC.
Notes to Consolidated Financial Statements
13. REINSURANCE (continued)
The international business primarily uses reinsurance to obtain experience with respect to certain new product offerings and to a lesserextent, to manage risk and volatility as necessary.
Reinsurance ceded arrangements do not discharge the Company as the primary insurer. Ceded balances would represent a liability ofthe Company in the event the reinsurers were unable to meet their obligations to the Company under the terms of the reinsuranceagreements. Reinsurance premiums, commissions, expense reimbursements, benefits and reserves related to reinsured long-durationcontracts under coinsurance arrangements are accounted for over the life of the underlying reinsured contracts using assumptions consistentwith those used to account for the underlying contracts. Coinsurance arrangements contrast with the Company’s yearly renewable termarrangements, where only mortality risk is transferred to the reinsurer and premiums are paid to the reinsurer to reinsure that risk. Themortality risk that is reinsured under yearly renewable term arrangements represents the difference between the stated death benefits in theunderlying reinsured contracts and the corresponding reserves or account value carried by the Company on those same contracts. Thepremiums paid to the reinsurer are based upon negotiated amounts, not on the actual premiums paid by the underlying contract holders tothe Company. As yearly renewable term arrangements are usually entered into by the Company with the expectation that the contracts willbe inforce for the lives of the underlying policies, they are considered to be long-duration reinsurance contracts. The cost of reinsurancerelated to short-duration reinsurance contracts is accounted for over the reinsurance contract period. The tables presented below excludeamounts pertaining to the Company’s discontinued operations.
Reinsurance amounts included in the Consolidated Statements of Operations for premiums, policy charges and fees and policyholders’benefits for the years ended December 31, were as follows:
2013 2012 2011
(in millions)Direct premiums . . . . . . . . . . . . . . . . . . . . . . . . . . . . . . . . . . . . . . . . . . . . . . . . . . . . . . . . . . . . . . . . . . . . . . . $27,444 $66,566 $25,526Reinsurance assumed . . . . . . . . . . . . . . . . . . . . . . . . . . . . . . . . . . . . . . . . . . . . . . . . . . . . . . . . . . . . . . . . . . . . 272 224 128Reinsurance ceded . . . . . . . . . . . . . . . . . . . . . . . . . . . . . . . . . . . . . . . . . . . . . . . . . . . . . . . . . . . . . . . . . . . . . . (1,479) (1,436) (1,353)
Premiums . . . . . . . . . . . . . . . . . . . . . . . . . . . . . . . . . . . . . . . . . . . . . . . . . . . . . . . . . . . . . . . . . . . . . . . . . $26,237 $65,354 $24,301
Direct policy charges and fees . . . . . . . . . . . . . . . . . . . . . . . . . . . . . . . . . . . . . . . . . . . . . . . . . . . . . . . . . . . . . $ 4,648 $ 4,491 $ 3,894Reinsurance assumed . . . . . . . . . . . . . . . . . . . . . . . . . . . . . . . . . . . . . . . . . . . . . . . . . . . . . . . . . . . . . . . . . . . . 918 106 124Reinsurance ceded . . . . . . . . . . . . . . . . . . . . . . . . . . . . . . . . . . . . . . . . . . . . . . . . . . . . . . . . . . . . . . . . . . . . . . (151) (108) (94)
Policy charges and fees . . . . . . . . . . . . . . . . . . . . . . . . . . . . . . . . . . . . . . . . . . . . . . . . . . . . . . . . . . . . . . $ 5,415 $ 4,489 $ 3,924
Direct policyholder benefits . . . . . . . . . . . . . . . . . . . . . . . . . . . . . . . . . . . . . . . . . . . . . . . . . . . . . . . . . . . . . . $27,458 $66,075 $24,638Reinsurance assumed . . . . . . . . . . . . . . . . . . . . . . . . . . . . . . . . . . . . . . . . . . . . . . . . . . . . . . . . . . . . . . . . . . . . 809 435 289Reinsurance ceded . . . . . . . . . . . . . . . . . . . . . . . . . . . . . . . . . . . . . . . . . . . . . . . . . . . . . . . . . . . . . . . . . . . . . . (1,534) (1,379) (1,313)
Policyholders’ benefits . . . . . . . . . . . . . . . . . . . . . . . . . . . . . . . . . . . . . . . . . . . . . . . . . . . . . . . . . . . . . . $26,733 $65,131 $23,614
Reinsurance recoverables at December 31, are as follows:
2013 2012
(in millions)Individual and group annuities(1) . . . . . . . . . . . . . . . . . . . . . . . . . . . . . . . . . . . . . . . . . . . . . . . . . . . . . . . . . . . . . . . . . . . . . . $ 252 $ 631Life insurance(2) . . . . . . . . . . . . . . . . . . . . . . . . . . . . . . . . . . . . . . . . . . . . . . . . . . . . . . . . . . . . . . . . . . . . . . . . . . . . . . . . . . . 2,383 751Other reinsurance . . . . . . . . . . . . . . . . . . . . . . . . . . . . . . . . . . . . . . . . . . . . . . . . . . . . . . . . . . . . . . . . . . . . . . . . . . . . . . . . . . . 149 155
Total reinsurance recoverable . . . . . . . . . . . . . . . . . . . . . . . . . . . . . . . . . . . . . . . . . . . . . . . . . . . . . . . . . . . . . . . . . . . . . $2,784 $1,537
(1) Primarily represents reinsurance recoverables established under the reinsurance arrangements associated with the acquisition of the retirement businessof CIGNA. The Company has recorded reinsurance payables related to the acquisition of the retirement business of CIGNA of $248 million and $628million at December 31, 2013 and 2012, respectively.
(2) Includes $1,597 million of reinsurance recoverables established at December 31, 2013 under the reinsurance arrangements associated with theacquisition of the individual life business of The Hartford. The Company has also recorded reinsurance payables related to the individual life businessof The Hartford acquisition of $1,244 million at December 31, 2013.
Excluding the reinsurance recoverable associated with the acquisition of individual life business of The Hartford and the retirementbusiness of CIGNA, four major reinsurance companies account for approximately 64% of the reinsurance recoverable at December 31,2013. The Company periodically reviews the financial condition of its reinsurers, amounts recoverable therefrom, and unearnedreinsurance premium, in order to minimize its exposure to loss from reinsurer insolvencies. If deemed necessary, the Company wouldsecure collateral in the form of a trust, letter of credit, or funds withheld arrangement to ensure collectability, otherwise, an allowance foruncollectible reinsurance would be recorded.
152 Prudential Financial, Inc. 2013 Annual Report

PRUDENTIAL FINANCIAL, INC.
Notes to Consolidated Financial Statements
14. SHORT-TERM AND LONG-TERM DEBT
Short-term DebtShort-term debt at December 31 is as follows:
2013 2012
(in millions)Commercial paper:
Prudential Financial . . . . . . . . . . . . . . . . . . . . . . . . . . . . . . . . . . . . . . . . . . . . . . . . . . . . . . . . . . . . . . . . . . . . . . . . . . . . . $ 190 $ 113Prudential Funding, LLC . . . . . . . . . . . . . . . . . . . . . . . . . . . . . . . . . . . . . . . . . . . . . . . . . . . . . . . . . . . . . . . . . . . . . . . . . 460 359
Subtotal commercial paper . . . . . . . . . . . . . . . . . . . . . . . . . . . . . . . . . . . . . . . . . . . . . . . . . . . . . . . . . . . . . . . . . . . . . . . . . . . . 650 472Other notes payable(1) . . . . . . . . . . . . . . . . . . . . . . . . . . . . . . . . . . . . . . . . . . . . . . . . . . . . . . . . . . . . . . . . . . . . . . . . . . . . . . . 0 100Current portion of long-term debt(2) . . . . . . . . . . . . . . . . . . . . . . . . . . . . . . . . . . . . . . . . . . . . . . . . . . . . . . . . . . . . . . . . . . . . 2,019 1,912
Total short-term debt(3) . . . . . . . . . . . . . . . . . . . . . . . . . . . . . . . . . . . . . . . . . . . . . . . . . . . . . . . . . . . . . . . . . . . . . . $2,669 $2,484
Supplemental short-term debt information:Portion of commercial paper borrowings due overnight . . . . . . . . . . . . . . . . . . . . . . . . . . . . . . . . . . . . . . . . . . . . . . . . . $ 466 $ 156Daily average commercial paper outstanding . . . . . . . . . . . . . . . . . . . . . . . . . . . . . . . . . . . . . . . . . . . . . . . . . . . . . . . . . $1,309 $1,194Weighted average maturity of outstanding commercial paper, in days . . . . . . . . . . . . . . . . . . . . . . . . . . . . . . . . . . . . . . 18 21Weighted average interest rate on outstanding short-term debt(4) . . . . . . . . . . . . . . . . . . . . . . . . . . . . . . . . . . . . . . . . . 0.17% 0.28%
(1) Includes collateralized borrowings from the Federal Home Loan Bank of New York of $100 million at December 31, 2012, discussed in more detailbelow.
(2) Includes limited and non-recourse borrowings of Prudential Holdings, LLC attributable to the Closed Block Business of $75 million at bothDecember 31, 2013 and 2012.
(3) Includes Prudential Financial debt of $1,721 million and $1,847 million at December 31, 2013 and 2012, respectively.(4) Excludes the current portion of long-term debt.
At December 31, 2013 and 2012, the Company was in compliance with all covenants related to the above debt.
Commercial Paper
Prudential Financial has a commercial paper program with an authorized capacity of $3.0 billion. Prudential Financial commercialpaper borrowings have been generally used to fund the working capital needs of Prudential Financial’s subsidiaries and provide short-termliquidity at Prudential Financial.
Prudential Funding, LLC (“Prudential Funding”), a wholly-owned subsidiary of Prudential Insurance, has a commercial paperprogram, with an authorized capacity of $7.0 billion. Prudential Funding commercial paper borrowings have generally served as anadditional source of financing to meet the working capital needs of Prudential Insurance and its subsidiaries. Prudential Funding also lendsto other subsidiaries of Prudential Financial up to limits agreed with the New Jersey Department of Banking and Insurance (“NJDOBI”).Prudential Funding maintains a support agreement with Prudential Insurance whereby Prudential Insurance has agreed to maintainPrudential Funding’s tangible net worth at a positive level. Additionally, Prudential Financial has issued a subordinated guarantee coveringPrudential Funding’s $7.0 billion commercial paper program.
Federal Home Loan Bank of New York
Prudential Insurance is a member of the Federal Home Loan Bank of New York (“FHLBNY”). Membership allows PrudentialInsurance access to the FHLBNY’s financial services, including the ability to obtain collateralized loans and to issue collateralized fundingagreements. Under applicable law, the funding agreements issued to the FHLBNY have priority claim status above debt holders ofPrudential Insurance. FHLBNY borrowings and funding agreements are collateralized by qualifying mortgage-related assets or U.S.Treasury securities, the fair value of which must be maintained at certain specified levels relative to outstanding borrowings. FHLBNYmembership requires Prudential Insurance to own member stock and borrowings require the purchase of activity-based stock in an amountequal to 4.5% of outstanding borrowings. Under FHLBNY guidelines, if Prudential Insurance’s financial strength ratings decline belowA/A2/A Stable by S&P/Moody’s/Fitch, respectively, and the FHLBNY does not receive written assurances from the NJDOBI regardingPrudential Insurance’s solvency, new borrowings from the FHLBNY would be limited to a term of 90 days or less. Currently there are norestrictions on the term of borrowings from the FHLBNY. All FHLBNY stock purchased by Prudential Insurance is classified as restrictedgeneral account investments within “Other long-term investments,” and the carrying value of these investments was $168 million and $170million as of December 31, 2013 and 2012, respectively.
NJDOBI permits Prudential Insurance to pledge collateral to the FHLBNY in an amount of up to 5% of its prior year-end statutory netadmitted assets, excluding separate account assets. Based on Prudential Insurance’s statutory net admitted assets as of December 31, 2012,the 5% limitation equates to a maximum amount of pledged assets of $8.1 billion and an estimated maximum borrowing capacity (aftertaking into account required collateralization levels and purchases of activity-based stock) of approximately $6.5 billion. Nevertheless,FHLBNY borrowings are subject to the FHLBNY’s discretion and to the availability of qualifying assets at Prudential Insurance.
As of December 31, 2013, Prudential Insurance had pledged assets with a fair value of $2.7 billion supporting aggregate outstandingcollateralized advances and funding agreements of $2.2 billion. As of December 31, 2013, an outstanding advance of $280 million is in
Prudential Financial, Inc. 2013 Annual Report 153

PRUDENTIAL FINANCIAL, INC.
Notes to Consolidated Financial Statements
14. SHORT-TERM AND LONG-TERM DEBT (continued)
“Long-term debt” and matures in December 2015, and outstanding funding agreements, totaling $1,947 million are included in“Policyholders’ account balances.” The fair value of qualifying assets that were available to Prudential Insurance but not pledged amountedto $3.1 billion as of December 31, 2013.
Federal Home Loan Bank of Boston
Prudential Retirement Insurance and Annuity Company (“PRIAC”) is a member of the Federal Home Loan Bank of Boston(“FHLBB”). Membership allows PRIAC access to collateralized advances which will be classified in “Short-term debt” or “Long-termdebt,” depending on the maturity date of the obligation. PRIAC’s membership in FHLBB requires the ownership of member stock andborrowings from FHLBB require the purchase of activity-based stock in an amount between 3.0% and 4.5% of outstanding borrowingsdepending on the maturity date of the obligation. As of December 31, 2013, PRIAC had no advances outstanding under the FHLBBfacility.
Under Connecticut state insurance law, without the prior consent of the Connecticut Insurance Department (“CTID”), the amount ofassets insurers may pledge to secure debt obligations is limited to the lesser of 5% of prior-year statutory admitted assets or 25% of prior-year statutory surplus, resulting in a maximum borrowing capacity for PRIAC under the FHLBB facility of approximately $230 million,none of which was outstanding as of December 31, 2013. Previously, the CTID provided a temporary advance consent to PRIAC,permitting it to pledge up to $2.6 billion in qualifying assets to secure FHLBB borrowings, resulting in a maximum borrowing capacityunder the facility of approximately $1.7 billion; however, this consent expired as of December 31, 2013.
Credit Facilities
The Company’s syndicated, unsecured committed credit facilities at December 31 are as follows:
BorrowerOriginal
TermExpiration
Date Capacity Outstanding
(in millions)Prudential Financial(1) . . . . . . . . . . . . . . . . . . . . . . . . . . . . . . . . . . . . . . . . . . . . . . . 5-year Nov-2018 $2,000 $0Prudential Financial and Prudential Funding(1) . . . . . . . . . . . . . . . . . . . . . . . . . . . . 3-year Nov-2016 1,750 0
$3,750 $0
(1) In November 2013, amendments to these facilities extended their terms by approximately 2 years. The expiration dates above reflect that extension.
The above credit facilities may be used for general corporate purposes, including as backup liquidity for the Company’s commercialpaper programs discussed above. As of December 31, 2013, there were no outstanding borrowings under either credit facility. PrudentialFinancial expects that it may borrow under the five-year credit facility from time to time to fund its working capital needs and those of itssubsidiaries. In addition, up to $300 million of the five-year facility may be drawn in the form of standby letters of credit that can be usedto meet the Company’s operating needs.
The credit facilities contain representations and warranties, covenants and events of default that are customary for facilities of thistype; however, borrowings under the facilities are not contingent on the Company’s credit ratings nor subject to material adverse changeclauses. Borrowings under the credit facilities are conditioned on the continued satisfaction of other customary conditions, including themaintenance at all times of consolidated net worth, relating to the Company’s Financial Services Businesses only, of at least $18.985billion, which for this purpose is calculated as U.S. GAAP equity, excluding AOCI and excluding equity of noncontrolling interests. As ofDecember 31, 2013 and 2012, the consolidated net worth of the Company’s Financial Services Businesses exceeded the minimum amountrequired to borrow under the credit facilities.
In addition to the above credit facilities, the Company had access to $379 million of certain other lines of credit at December 31, 2013,of which $335 million was for the sole use of certain real estate separate accounts. The separate account facilities include loan-to-valueratio requirements and other financial covenants and recourse on obligations under these facilities is limited to the assets of the applicableseparate account. At December 31, 2013, $38 million of these credit facilities were used. The Company also has access to uncommittedlines of credit from financial institutions.
Put Option Agreement for Senior Debt Issuance
In November 2013, Prudential Financial entered into a ten-year put option agreement with a Delaware trust upon the completion of thesale of $1.5 billion of trust securities by that Delaware trust in a Rule 144A private placement. The trust invested the proceeds from the saleof the trust securities in a portfolio of principal and interest strips of U.S. Treasury securities. The put option agreement provides PrudentialFinancial the right to sell to the trust at any time up to $1.5 billion of 4.419% senior notes due November 2023 and receive in exchange acorresponding amount of the principal and interest strips of U.S. Treasury securities held by the trust. In return, the Company agreed to paya semi-annual put premium to the trust at a rate of 1.777% per annum applied to the unexercised portion of the put option. The put optionagreement with the trust provides Prudential Financial with a source of liquid assets.
The put option described above will be exercised automatically in full upon the Company’s failure to make certain payments to the trust,such as paying the put option premium or reimbursing the trust for its expenses, if the Company’s failure to pay is not cured within 30 days,
154 Prudential Financial, Inc. 2013 Annual Report

PRUDENTIAL FINANCIAL, INC.
Notes to Consolidated Financial Statements
14. SHORT-TERM AND LONG-TERM DEBT (continued)
and upon an event involving its bankruptcy. The Company is also required to exercise the put option if its consolidated stockholders’ equity,calculated in accordance with GAAP but excluding AOCI, falls below $7 billion, subject to adjustment in certain cases. The Company has aone-time right to unwind a prior voluntary exercise of the put option by repurchasing all of the senior notes then held by the trust in exchangefor principal and interest strips of U.S. Treasury securities. Finally, any of the 4.419% senior notes that Prudential Financial issues may beredeemed prior to their maturity at par or, if greater, a make-whole price, following a voluntary exercise in full of the put option.
Long-term DebtLong-term debt at December 31 is as follows:
MaturityDates Rate(1)
December 31,
2013 2012
(in millions)Fixed-rate notes:
Surplus notes . . . . . . . . . . . . . . . . . . . . . . . . . . . . . . . . . . . . . . . . . . . . . . . . . . . . 2015-2025 5.36%-8.30% $ 941 $ 940Surplus notes subject to set-off arrangements . . . . . . . . . . . . . . . . . . . . . . . . . . . 2021-2033 3.52%-5.26% 2,400 1,000Senior notes(2) . . . . . . . . . . . . . . . . . . . . . . . . . . . . . . . . . . . . . . . . . . . . . . . . . . . 2014-2043 2.21%-11.31% 12,151 13,537
Floating-rate notes:Surplus notes . . . . . . . . . . . . . . . . . . . . . . . . . . . . . . . . . . . . . . . . . . . . . . . . . . . . 2016-2052 0.51%-3.52% 3,200 3,200USD-denominated senior notes . . . . . . . . . . . . . . . . . . . . . . . . . . . . . . . . . . . . . . 2014-2023 1.02%-4.91% 677 293Foreign currency-denominated senior notes . . . . . . . . . . . . . . . . . . . . . . . . . . . . (3) 0.84%-3.13% 100 490
Junior subordinated notes . . . . . . . . . . . . . . . . . . . . . . . . . . . . . . . . . . . . . . . . . . . . . . 2042-2068 5.20%-8.88% 4,884 4,594Prudential Holdings, LLC notes (the “IHC debt”):
Series A . . . . . . . . . . . . . . . . . . . . . . . . . . . . . . . . . . . . . . . . . . . . . . . . . . . . . . . . 2017(4) 1.12%-1.18% 238 285Series B . . . . . . . . . . . . . . . . . . . . . . . . . . . . . . . . . . . . . . . . . . . . . . . . . . . . . . . . 2023(4) 7.245% 777 777Series C . . . . . . . . . . . . . . . . . . . . . . . . . . . . . . . . . . . . . . . . . . . . . . . . . . . . . . . . 2023(4) 8.695% 585 613
Subtotal . . . . . . . . . . . . . . . . . . . . . . . . . . . . . . . . . . . . . . . . . . . . . . . . . . . . . . . . . . . . 25,953 25,729
Less: assets under set-off arrangements(5) . . . . . . . . . . . . . . . . . . . . . . . . . . . . . . . . . 2,400 1,000
Total long-term debt(6) . . . . . . . . . . . . . . . . . . . . . . . . . . . . . . . . . . . . . . . . $23,553 $24,729
(1) Range of interest rates are for the year ended December 31, 2013.(2) Includes collateralized borrowings from the Federal Home Loan Bank of New York of $280 million at both December 31, 2013 and 2012.(3) Includes $61 million of perpetual debt that has no stated maturity. Maturities on the remaining debt range from 2014 to 2017.(4) Annual scheduled repayments of principal for the Series A and Series C notes began in 2013. Annual scheduled repayments of principal for the Series B
notes begin in 2018.(5) Assets under set-off arrangements represent a reduction in the amount of fixed-rate surplus notes included in long-term debt, resulting from an
arrangement where valid rights of set-off exist and it is the intent of both parties to settle on a net basis under legally enforceable arrangements.(6) Includes Prudential Financial debt of $16,346 million and $16,998 million at December 31, 2013 and 2012, respectively.
At December 31, 2013 and 2012, the Company was in compliance with all debt covenants related to the borrowings in the table above.
The following table presents the contractual maturities of the Company’s long-term debt as of December 31, 2013:
Calendar Year
2015 2016 2017 20182019 andthereafter Total
(in millions)Long-term debt . . . . . . . . . . . . . . . . . . . . . . . . . . . . . . . . . . . . . . . . . . . . . . . . . . . . . . . . . . . . . $3,457 $1,477 $1,733 $2,580 $14,306 $23,553
Surplus Notes
As of December 31, 2013, Prudential Insurance had $941 million of fixed-rate surplus notes outstanding. These notes are subordinatedto other Prudential Insurance borrowings and policyholder obligations, and the payment of interest and principal may only be made withthe prior approval of NJDOBI. NJDOBI could prohibit the payment of the interest and principal on the surplus notes if certain statutorycapital requirements are not met. At December 31, 2013 and 2012, the Company met these statutory capital requirements.
Prudential Insurance’s fixed-rate surplus notes include $500 million of exchangeable surplus notes issued in a private placement in2009 with an interest rate of 5.36% per annum and due September 2019. The surplus notes are exchangeable at the option of the holder, inwhole but not in part, for shares of Prudential Financial Common Stock beginning in September 2014, or earlier upon a fundamentalbusiness combination involving Prudential Financial or a continuing payment default. The initial exchange rate for the surplus notes is10.1235 shares of Common Stock per each $1,000 principal amount of surplus notes, which represents an initial exchange price per shareof Common Stock of $98.78; however, the exchange rate is subject to customary anti-dilution adjustments. The exchange rate is also
Prudential Financial, Inc. 2013 Annual Report 155

PRUDENTIAL FINANCIAL, INC.
Notes to Consolidated Financial Statements
14. SHORT-TERM AND LONG-TERM DEBT (continued)
subject to a make-whole decrease in the event of an exchange prior to maturity (except upon a fundamental business combination or acontinuing payment default), that will result in a reduction in the number of shares issued upon exchange (per $1,000 principal amount ofsurplus notes) determined by dividing a prescribed cash reduction value (which will decline over the life of the surplus notes, from $102.62for an exercise on September 18, 2014, to zero for an exercise at maturity) by the price of the Common Stock at the time of exchange. Inaddition, the exchange rate is subject to a customary make-whole increase in connection with an exchange of the surplus notes upon afundamental business combination where 10% or more of the consideration in that business combination consists of cash, other property orsecurities that are not listed on a U.S. national securities exchange. These exchangeable surplus notes are not redeemable by PrudentialInsurance prior to maturity, except in connection with a fundamental business combination involving Prudential Financial, in which casethe surplus notes will be redeemable by Prudential Insurance, subject to the noteholders’ right to exchange the surplus notes instead, at paror, if greater, a make-whole redemption price.
From 2011 through 2013, a captive reinsurance subsidiary of Prudential Insurance entered into agreements providing for the issuanceand sale of up to $2.0 billion of ten-year fixed-rate surplus notes. Under the agreements, the captive receives in exchange for the surplusnotes one or more credit-linked notes issued by a special purpose subsidiary of the Company in an aggregate principal amount equal to thesurplus notes issued. The captive holds the credit-linked notes as assets supporting non-economic reserves required to be held by theCompany’s domestic insurance subsidiaries under Regulation XXX in connection with the reinsurance of term life insurance policiesthrough the captive. The principal amount of the outstanding credit-linked notes is redeemable by the captive in cash upon the occurrenceof, and in an amount necessary to remedy, a specified liquidity stress event affecting the captive. Under the agreements, externalcounterparties have agreed to fund any such payment under the credit-linked notes in return for a fee. Prudential Financial has agreed tomake capital contributions to the captive to reimburse it for investment losses in excess of specified amounts and has agreed to reimbursethe external counterparties for any payments under the credit-linked notes that are funded by those counterparties. As of December 31,2013, an aggregate of $1,500 million of surplus notes were outstanding under these agreements and no such payments under the credit-linked notes have been required.
In December 2013, another captive reinsurance subsidiary entered into a twenty-year financing facility with external counterpartiesproviding for the issuance and sale of a surplus note in an aggregate principal amount of up to $2 billion in order to finance non-economicreserves required to be held by the Company’s domestic insurance subsidiaries under Guideline AXXX. The agreements contemplate thatadditional external counterparties may be added to this facility in the future which could increase the size of the facility to $3 billion.Similar to the agreements described above, the captive receives in exchange for the surplus note one or more credit linked notes issued by aspecial purpose affiliate in an aggregate principal amount equal to the surplus note. As above, the principal amount of the outstandingcredit-linked notes is redeemable by the captive in cash upon the occurrence of, and in an amount necessary to remedy, a specified liquiditystress event, and the external counterparties have agreed to fund any such payment. Prudential Financial has agreed to reimburse thecaptive for investment losses in excess of specified amounts; however, Prudential Financial has no other reimbursement obligations to theexternal counterparties under this facility. As of December 31, 2013, an aggregate of $900 million of surplus notes were outstanding underthe facility and no credit-linked note payments have been required.
Under each of the above transactions for the captive reinsurance subsidiaries, because valid rights of set-off exist, interest andprincipal payments on the surplus notes and on the credit-linked notes are settled on a net basis, and the surplus notes are reflected in theCompany’s total consolidated borrowings on a net basis.
Other captive reinsurance subsidiaries have outstanding $3.2 billion of surplus notes that were issued in 2006 through 2008 withunaffiliated institutions to finance reserves required under Regulation XXX and Guideline AXXX. Prudential Financial has agreed tomaintain the capital of these captives at or above a prescribed minimum level and has entered into arrangements (which are accounted foras derivative instruments) that require it to make certain payments in the event of deterioration in the value of the surplus notes. As ofDecember 31, 2013 and 2012, there were no collateral postings made under these derivative instruments.
The surplus notes for the captive reinsurance subsidiaries described above are subordinated to policyholder obligations, and thepayment of principal on the surplus notes may only be made with prior approval of the Arizona Department of Insurance. The payment ofinterest on the surplus notes has been approved by the Arizona Department of Insurance, subject to its ability to withdraw that approval.
Senior Notes
Medium-term notes. Prudential Financial maintains a Medium-Term Note, Series D program under its shelf registration statementwith an authorized issuance capacity of $20 billion. As of December 31, 2013, the outstanding balance of medium-term notes under thisprogram was $12.7 billion, a decrease of $0.5 billion from December 31, 2012, due to maturities of $1.6 billion, offset by $1.1 billion ofissuances as presented in the below table.
Issue Date Face Value Interest Rate Maturity Date
(in millions)August 15, 2013 . . . . . . . . . . . . . . . . . . . . . . . . . . . . . . . . . . . . . . . . . . . . . . . . . . . . . . . . . . . . . . . . . . . . $350 2.300% August 15, 2018August 15, 2013 . . . . . . . . . . . . . . . . . . . . . . . . . . . . . . . . . . . . . . . . . . . . . . . . . . . . . . . . . . . . . . . . . . . . $350 LIBOR + 0.78% August 15, 2018August 15, 2013 . . . . . . . . . . . . . . . . . . . . . . . . . . . . . . . . . . . . . . . . . . . . . . . . . . . . . . . . . . . . . . . . . . . . $350 5.100% August 15, 2043
Retail medium-term notes. Prudential Financial also maintains a retail medium-term notes program, including the InterNotes®
program, under its shelf registration statement with an authorized issuance capacity of $5.0 billion. As of December 31, 2013, the
156 Prudential Financial, Inc. 2013 Annual Report
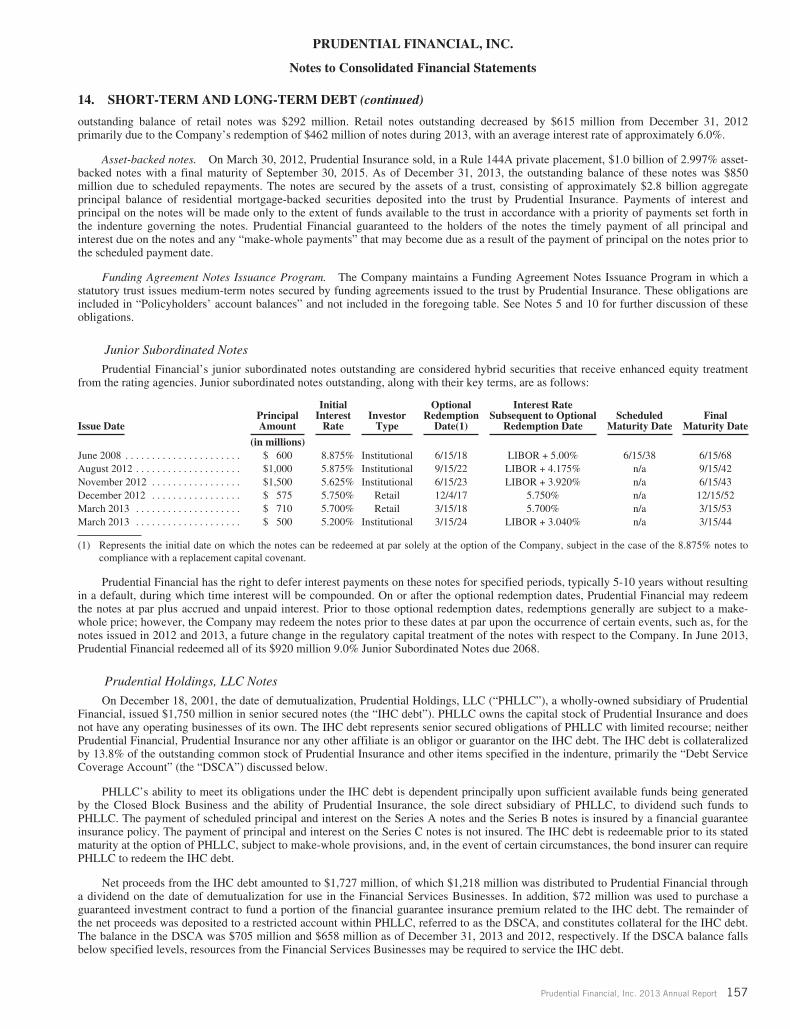
PRUDENTIAL FINANCIAL, INC.
Notes to Consolidated Financial Statements
14. SHORT-TERM AND LONG-TERM DEBT (continued)
outstanding balance of retail notes was $292 million. Retail notes outstanding decreased by $615 million from December 31, 2012primarily due to the Company’s redemption of $462 million of notes during 2013, with an average interest rate of approximately 6.0%.
Asset-backed notes. On March 30, 2012, Prudential Insurance sold, in a Rule 144A private placement, $1.0 billion of 2.997% asset-backed notes with a final maturity of September 30, 2015. As of December 31, 2013, the outstanding balance of these notes was $850million due to scheduled repayments. The notes are secured by the assets of a trust, consisting of approximately $2.8 billion aggregateprincipal balance of residential mortgage-backed securities deposited into the trust by Prudential Insurance. Payments of interest andprincipal on the notes will be made only to the extent of funds available to the trust in accordance with a priority of payments set forth inthe indenture governing the notes. Prudential Financial guaranteed to the holders of the notes the timely payment of all principal andinterest due on the notes and any “make-whole payments” that may become due as a result of the payment of principal on the notes prior tothe scheduled payment date.
Funding Agreement Notes Issuance Program. The Company maintains a Funding Agreement Notes Issuance Program in which astatutory trust issues medium-term notes secured by funding agreements issued to the trust by Prudential Insurance. These obligations areincluded in “Policyholders’ account balances” and not included in the foregoing table. See Notes 5 and 10 for further discussion of theseobligations.
Junior Subordinated Notes
Prudential Financial’s junior subordinated notes outstanding are considered hybrid securities that receive enhanced equity treatmentfrom the rating agencies. Junior subordinated notes outstanding, along with their key terms, are as follows:
Issue DatePrincipalAmount
InitialInterest
RateInvestor
Type
OptionalRedemption
Date(1)
Interest RateSubsequent to Optional
Redemption DateScheduled
Maturity DateFinal
Maturity Date
(in millions)June 2008 . . . . . . . . . . . . . . . . . . . . . . $ 600 8.875% Institutional 6/15/18 LIBOR + 5.00% 6/15/38 6/15/68August 2012 . . . . . . . . . . . . . . . . . . . . $1,000 5.875% Institutional 9/15/22 LIBOR + 4.175% n/a 9/15/42November 2012 . . . . . . . . . . . . . . . . . $1,500 5.625% Institutional 6/15/23 LIBOR + 3.920% n/a 6/15/43December 2012 . . . . . . . . . . . . . . . . . $ 575 5.750% Retail 12/4/17 5.750% n/a 12/15/52March 2013 . . . . . . . . . . . . . . . . . . . . $ 710 5.700% Retail 3/15/18 5.700% n/a 3/15/53March 2013 . . . . . . . . . . . . . . . . . . . . $ 500 5.200% Institutional 3/15/24 LIBOR + 3.040% n/a 3/15/44
(1) Represents the initial date on which the notes can be redeemed at par solely at the option of the Company, subject in the case of the 8.875% notes tocompliance with a replacement capital covenant.
Prudential Financial has the right to defer interest payments on these notes for specified periods, typically 5-10 years without resultingin a default, during which time interest will be compounded. On or after the optional redemption dates, Prudential Financial may redeemthe notes at par plus accrued and unpaid interest. Prior to those optional redemption dates, redemptions generally are subject to a make-whole price; however, the Company may redeem the notes prior to these dates at par upon the occurrence of certain events, such as, for thenotes issued in 2012 and 2013, a future change in the regulatory capital treatment of the notes with respect to the Company. In June 2013,Prudential Financial redeemed all of its $920 million 9.0% Junior Subordinated Notes due 2068.
Prudential Holdings, LLC Notes
On December 18, 2001, the date of demutualization, Prudential Holdings, LLC (“PHLLC”), a wholly-owned subsidiary of PrudentialFinancial, issued $1,750 million in senior secured notes (the “IHC debt”). PHLLC owns the capital stock of Prudential Insurance and doesnot have any operating businesses of its own. The IHC debt represents senior secured obligations of PHLLC with limited recourse; neitherPrudential Financial, Prudential Insurance nor any other affiliate is an obligor or guarantor on the IHC debt. The IHC debt is collateralizedby 13.8% of the outstanding common stock of Prudential Insurance and other items specified in the indenture, primarily the “Debt ServiceCoverage Account” (the “DSCA”) discussed below.
PHLLC’s ability to meet its obligations under the IHC debt is dependent principally upon sufficient available funds being generatedby the Closed Block Business and the ability of Prudential Insurance, the sole direct subsidiary of PHLLC, to dividend such funds toPHLLC. The payment of scheduled principal and interest on the Series A notes and the Series B notes is insured by a financial guaranteeinsurance policy. The payment of principal and interest on the Series C notes is not insured. The IHC debt is redeemable prior to its statedmaturity at the option of PHLLC, subject to make-whole provisions, and, in the event of certain circumstances, the bond insurer can requirePHLLC to redeem the IHC debt.
Net proceeds from the IHC debt amounted to $1,727 million, of which $1,218 million was distributed to Prudential Financial througha dividend on the date of demutualization for use in the Financial Services Businesses. In addition, $72 million was used to purchase aguaranteed investment contract to fund a portion of the financial guarantee insurance premium related to the IHC debt. The remainder ofthe net proceeds was deposited to a restricted account within PHLLC, referred to as the DSCA, and constitutes collateral for the IHC debt.The balance in the DSCA was $705 million and $658 million as of December 31, 2013 and 2012, respectively. If the DSCA balance fallsbelow specified levels, resources from the Financial Services Businesses may be required to service the IHC debt.
Prudential Financial, Inc. 2013 Annual Report 157

PRUDENTIAL FINANCIAL, INC.
Notes to Consolidated Financial Statements
14. SHORT-TERM AND LONG-TERM DEBT (continued)
Summarized consolidated financial data for PHLLC is presented below.
As of December 31,
2013 2012
(in millions)Consolidated Statements of Financial Position:
Total assets . . . . . . . . . . . . . . . . . . . . . . . . . . . . . . . . . . . . . . . . . . . . . . . . . . . . . . . . . . . . . . . . . . . . . . . . . . . . . . . . $514,094 $473,317
Total liabilities . . . . . . . . . . . . . . . . . . . . . . . . . . . . . . . . . . . . . . . . . . . . . . . . . . . . . . . . . . . . . . . . . . . . . . . . . . . . . $494,537 $452,668Total member’s equity . . . . . . . . . . . . . . . . . . . . . . . . . . . . . . . . . . . . . . . . . . . . . . . . . . . . . . . . . . . . . . . . . . . 19,553 20,640Noncontrolling interests . . . . . . . . . . . . . . . . . . . . . . . . . . . . . . . . . . . . . . . . . . . . . . . . . . . . . . . . . . . . . . . . . . 4 9
Total equity . . . . . . . . . . . . . . . . . . . . . . . . . . . . . . . . . . . . . . . . . . . . . . . . . . . . . . . . . . . . . . . . . . . . . . . . . . . . . . . 19,557 20,649
Total liabilities and equity . . . . . . . . . . . . . . . . . . . . . . . . . . . . . . . . . . . . . . . . . . . . . . . . . . . . . . . . . . . . . . . . . . . . $514,094 $473,317
Years Ended December 31,
2013 2012 2011
(in millions)Consolidated Statements of Operations:
Total revenues . . . . . . . . . . . . . . . . . . . . . . . . . . . . . . . . . . . . . . . . . . . . . . . . . . . . . . . . . . . . . . . . . . . . . $23,487 $56,195 $25,241Total benefits and expenses . . . . . . . . . . . . . . . . . . . . . . . . . . . . . . . . . . . . . . . . . . . . . . . . . . . . . . . . . . . 22,073 55,332 24,206
Income from continuing operations before income taxes and equity in earnings of operating jointventures . . . . . . . . . . . . . . . . . . . . . . . . . . . . . . . . . . . . . . . . . . . . . . . . . . . . . . . . . . . . . . . . . . . . . . . . 1,414 863 1,035
Net income . . . . . . . . . . . . . . . . . . . . . . . . . . . . . . . . . . . . . . . . . . . . . . . . . . . . . . . . . . . . . . . . . . . . . . . 1,367 883 813Less: Income (loss) attributable to noncontrolling interests . . . . . . . . . . . . . . . . . . . . . . . . . . . . . . . . . . 1 (1) (13)
Net income attributable to Prudential Holdings, LLC. . . . . . . . . . . . . . . . . . . . . . . . . . . . . . . . . . . . . . . $ 1,366 $ 884 $ 826
Consolidated Statements of Cash Flows:Cash flows from operating activities . . . . . . . . . . . . . . . . . . . . . . . . . . . . . . . . . . . . . . . . . . . . . . . . . . . . $ 2,464 $ 2,758 $ 5,060Cash flows used in investing activities . . . . . . . . . . . . . . . . . . . . . . . . . . . . . . . . . . . . . . . . . . . . . . . . . . (8,218) (4,620) (4,741)Cash flows from (used in) financing activities . . . . . . . . . . . . . . . . . . . . . . . . . . . . . . . . . . . . . . . . . . . . 5,129 1,111 603Effect of foreign exchange in cash and cash equivalents . . . . . . . . . . . . . . . . . . . . . . . . . . . . . . . . . . . . (6) (7) (15)
Net increase (decrease) in cash and cash equivalents . . . . . . . . . . . . . . . . . . . . . . . . . . . . . . . . . . . . . . . $ (631) $ (758) $ 907
Prudential Financial is a holding company and is a legal entity separate and distinct from its subsidiaries. The rights of PrudentialFinancial to participate in any distribution of assets of any subsidiary, including upon its liquidation or reorganization, are subject to theprior claims of creditors of that subsidiary, except to the extent that Prudential Financial may itself be a creditor of that subsidiary and itsclaims are recognized. PHLLC and its subsidiaries have entered into covenants and arrangements with third parties in connection with theissuance of the IHC debt which are intended to confirm their separate, “bankruptcy-remote” status, by assuring that the assets of PHLLCand its subsidiaries are not available to creditors of Prudential Financial or its other subsidiaries, except and to the extent that PrudentialFinancial and its other subsidiaries are, as shareholders or creditors of PHLLC and its subsidiaries, or would be, entitled to those assets.
At December 31, 2013, the Company was in compliance with all IHC debt covenants.
Interest Expense
In order to modify exposure to interest rate and currency exchange rate movements, the Company utilizes derivative instruments,primarily interest rate swaps, in conjunction with some of its debt issues. The impact of these derivative instruments are not reflected in therates presented in the tables above. For those derivative instruments that qualify for hedge accounting treatment, interest expense wasincreased by $23 million, $16 million and $12 million for the years ended December 31, 2013, 2012 and 2011, respectively. See Note 21for additional information on the Company’s use of derivative instruments.
Interest expense for short-term and long-term debt was $1,419 million, $1,389 million and $1,315 million for the years endedDecember 31, 2013, 2012 and 2011, respectively. This includes interest expense of $6 million, $8 million and $17 million for the yearsended December 31, 2013, 2012 and 2011, respectively, reported in “Net investment income.”
158 Prudential Financial, Inc. 2013 Annual Report

PRUDENTIAL FINANCIAL, INC.
Notes to Consolidated Financial Statements
15. EQUITY
The Company has outstanding two classes of common stock: the Common Stock and the Class B Stock. The changes in the number ofshares issued, held in treasury and outstanding are as follows for the periods indicated:
Common Stock Class B Stock
IssuedHeld In
Treasury OutstandingIssued and
Outstanding
(in millions)Balance, December 31, 2010 . . . . . . . . . . . . . . . . . . . . . . . . . . . . . . . . . . . . . . . . . . . . . . . . . . . . . . . . 660.1 176.3 483.8 2.0Common Stock issued . . . . . . . . . . . . . . . . . . . . . . . . . . . . . . . . . . . . . . . . . . . . . . . . . . . . . . . . . . . . . . 0.0 0.0 0.0 0.0Common Stock acquired . . . . . . . . . . . . . . . . . . . . . . . . . . . . . . . . . . . . . . . . . . . . . . . . . . . . . . . . . . . . 0.0 19.8 (19.8) 0.0Stock-based compensation programs(1) . . . . . . . . . . . . . . . . . . . . . . . . . . . . . . . . . . . . . . . . . . . . . . . . 0.0 (4.0) 4.0 0.0
Balance, December 31, 2011 . . . . . . . . . . . . . . . . . . . . . . . . . . . . . . . . . . . . . . . . . . . . . . . . . . . . . . . . 660.1 192.1 468.0 2.0Common Stock issued . . . . . . . . . . . . . . . . . . . . . . . . . . . . . . . . . . . . . . . . . . . . . . . . . . . . . . . . . . . . . . 0.0 0.0 0.0 0.0Common Stock acquired . . . . . . . . . . . . . . . . . . . . . . . . . . . . . . . . . . . . . . . . . . . . . . . . . . . . . . . . . . . . 0.0 11.5 (11.5) 0.0Stock-based compensation programs(1) . . . . . . . . . . . . . . . . . . . . . . . . . . . . . . . . . . . . . . . . . . . . . . . . 0.0 (6.5) 6.5 0.0
Balance, December 31, 2012 . . . . . . . . . . . . . . . . . . . . . . . . . . . . . . . . . . . . . . . . . . . . . . . . . . . . . . . . 660.1 197.1 463.0 2.0Common Stock issued . . . . . . . . . . . . . . . . . . . . . . . . . . . . . . . . . . . . . . . . . . . . . . . . . . . . . . . . . . . . . . 0.0 0.0 0.0 0.0Common Stock acquired . . . . . . . . . . . . . . . . . . . . . . . . . . . . . . . . . . . . . . . . . . . . . . . . . . . . . . . . . . . . 0.0 10.0 (10.0) 0.0Stock-based compensation programs(1) . . . . . . . . . . . . . . . . . . . . . . . . . . . . . . . . . . . . . . . . . . . . . . . . 0.0 (8.1) 8.1 0.0
Balance, December 31, 2013 . . . . . . . . . . . . . . . . . . . . . . . . . . . . . . . . . . . . . . . . . . . . . . . . . . . . . . . . 660.1 199.0 461.1 2.0
(1) Represents net shares issued from treasury pursuant to the Company’s stock-based compensation program.
Common Stock and Class B Stock
On the date of demutualization, Prudential Financial completed an initial public offering of its Common Stock at an initial publicoffering price of $27.50 per share. The shares of Common Stock issued were in addition to shares of Common Stock the Companydistributed to policyholders as part of the demutualization. The Common Stock is traded on the New York Stock Exchange under thesymbol “PRU.” Also on the date of demutualization, Prudential Financial completed the sale, through a private placement, of 2.0 millionshares of Class B Stock at a price of $87.50 per share. The Class B Stock is a separate class of common stock which is not publicly traded.The Common Stock reflects the performance of the Financial Services Businesses and the Class B Stock reflects the performance of theClosed Block Business.
Holders of Common Stock have no interest in a separate legal entity representing the Financial Services Businesses and holders of theClass B Stock have no interest in a separate legal entity representing the Closed Block Business and holders of each class of common stockare subject to all of the risks associated with an investment in the Company.
In the event of a liquidation, dissolution or winding-up of the Company, holders of Common Stock and holders of Class B Stockwould be entitled to receive a proportionate share of the net assets of the Company that remain after paying all liabilities and the liquidationpreferences of any preferred stock.
Common Stock Held in Treasury
Common Stock held in treasury is accounted for at average cost. Gains resulting from the reissuance of “Common Stock held intreasury” are credited to “Additional paid-in capital.” Losses resulting from the reissuance of “Common Stock held in treasury” are chargedfirst to “Additional paid-in capital” to the extent the Company has previously recorded gains on treasury share transactions, then to“Retained earnings.”
In June 2012, Prudential Financial’s Board of Directors authorized the Company to repurchase at management’s discretion up to $1.0billion of its outstanding Common Stock through June 2013. Under this authorization, 6.6 million shares of the Company’s Common Stockwere repurchased at a total cost of $400 million, of which 3.9 million shares were repurchased in the first six months of 2013 at a total costof $250 million.
In June 2013, Prudential Financial’s Board of Directors authorized the Company to repurchase at management’s discretion up to $1.0billion of its outstanding Common Stock through June 2014. As of December 31, 2013, 6.1 million shares of the Company’s CommonStock were repurchased under this authorization at a total cost of $500 million.
The timing and amount of share repurchases are determined by management based upon market conditions and other considerations,and repurchases may be effected in the open market, through derivative, accelerated repurchase and other negotiated transactions and throughprearranged trading plans complying with Rule 10b5-1(c) under the Exchange Act. Numerous factors could affect the timing and amount ofany future repurchases under the share repurchase authorization, including increased capital needs of the Company due to changes inregulatory capital requirements, opportunities for growth and acquisitions, and the effect of adverse market conditions on the segments.
Prudential Financial, Inc. 2013 Annual Report 159
PRUDENTIAL FINANCIAL, INC.
Notes to Consolidated Financial Statements
15. EQUITY (continued)
Stock Conversion Rights of the Class B StockPrudential Financial may, at its option, at any time, exchange all outstanding shares of Class B Stock into such number of shares of
Common Stock as have an aggregate average market value equal to 120% of the appraised fair market value of the outstanding shares ofClass B Stock.
Holders of Class B Stock will be permitted to convert their shares of Class B Stock into such number of shares of Common Stock ashave an aggregate average market value equal to 100% of the appraised fair market value of the outstanding shares of Class B Stock (1) inthe holder’s sole discretion, beginning on January 1, 2016, and (2) at any time in the event that (a) the Class B Stock is no longer treated asequity of Prudential Financial for federal income tax purposes or (b) the New Jersey Department of Banking and Insurance changes theregulation of the Closed Block, the Closed Block Business, the Class B Stock or the IHC debt in a manner that materially adversely affectsthe “CB Distributable Cash Flow” (described below); provided, however, that a holder of Class B Stock may not convert its shares if suchholder would become, upon such conversion, the beneficial owner (as defined under the Securities Exchange Act of 1934) of over 9.9% ofthe total outstanding voting power of Prudential Financial’s voting securities. In the event a holder of shares of Class B Stock requests toconvert shares pursuant to clause (2)(a) in the preceding sentence, Prudential Financial may elect, instead of effecting such conversion, toincrease the Target Dividend Amount of the Class B Stock from $9.625 to $12.6875 per share per annum, retroactively from the time ofissuance of the Class B Stock.
Preferred StockAs of December 31, 2013 and 2012, the Company had no preferred stock outstanding. The Company previously maintained a
shareholder rights plan; however, the rights plan expired on December 18, 2011.
DividendsThe declaration and payment of dividends on the Common Stock is limited by New Jersey corporate law, pursuant to which Prudential
Financial is prohibited from paying a Common Stock dividend if, after giving effect to that dividend, either (a) the Company would beunable to pay its debts as they become due in the usual course of its business or (b) the Company’s total assets would be less than itsliabilities. This limitation is applied both as if the Financial Services Businesses were a separate corporation and on a consolidated basisafter taking into account dividends on the Class B Stock. In addition, the terms of the Company’s outstanding junior subordinated debtinclude a “dividend stopper” provision that restricts the payment of dividends on the Common Stock and Class B Stock if interest paymentsare not made on the junior subordinated debt. The terms of the Class B Stock also restrict dividends on the Common Stock in certaincircumstances as described below. Further, as a Designated Financial Company under Dodd-Frank, Prudential Financial is to be subject tominimum risk-based capital and leverage requirements and to the submission of annual capital plans to the Board of Governors of theFederal Reserve System. Prudential Financial’s compliance with these and other requirements under the Dodd-Frank Act could limit itsability to pay Common Stock dividends in the future.
As of December 31, 2013, the Company’s U.S. GAAP retained earnings were $14,531 million. Other than the above limitations, thisamount is free of restrictions for the payment of Common Stock dividends. However, Common Stock dividends will be dependent upon thefinancial condition, results of operations, cash needs, future prospects and other factors relating to the Financial Services Businesses,including cash available to Prudential Financial, the parent holding company. The principal sources of funds available to PrudentialFinancial are dividends and returns of capital from its subsidiaries, repayments of operating loans from its subsidiaries and cash and short-term investments. The primary uses of funds at Prudential Financial include servicing its debt, operating expenses, capital contributions andloans to subsidiaries, the payment of declared shareholder dividends and repurchases of outstanding shares of Common Stock if executedunder Board authority. As of December 31, 2013, Prudential Financial had cash and short term investments, excluding amounts held in anintercompany liquidity account, of $4,354 million.
Future cash available at Prudential Financial to support the payment of future Common Stock dividends is dependent on the receipt ofdividends or other funds from its subsidiaries, the majority of which are subject to comprehensive regulation, including limitations on theirpayment of dividends and other transfers of funds, which are discussed below.
With respect to Prudential Insurance, the Company’s primary domestic insurance subsidiary, New Jersey insurance law provides that,except in the case of extraordinary dividends (as described below), all dividends or other distributions paid by Prudential Insurance may bepaid only from unassigned surplus, as determined pursuant to statutory accounting principles, less cumulative unrealized investment gainsand losses and revaluation of assets as of the prior calendar year-end. As of December 31, 2013, Prudential Insurance’s unassigned surpluswas $4,439 million, and it recorded applicable adjustments for cumulative unrealized investment gains of $2,304 million. PrudentialInsurance must give prior notification to the New Jersey Department of Banking and Insurance (“NJDOBI”) of its intent to pay any suchdividend or distribution. Also, if any dividend, together with other dividends or distributions made within the preceding twelve months,exceeds the greater of (i) 10% of Prudential Insurance’s statutory surplus as of the preceding December 31 ($938 million as ofDecember 31, 2013) or (ii) its statutory net gain from operations excluding realized investment gains and losses for the twelve-monthperiod ending on the preceding December 31 ($1,252 million for the year ended December 31, 2013), the dividend is considered to be an“extraordinary dividend” and requires the prior approval of NJDOBI. Under New Jersey insurance law, Prudential Insurance is permitted topay a dividend of $1,252 million in 2014 without prior approval of NJDOBI.
The laws regulating dividends of the states where the Company’s other domestic insurance subsidiaries are domiciled are similar, but notidentical, to New Jersey’s. Prudential Annuities Life Assurance Corporation (“PALAC”), an Arizona-domiciled insurer that is a direct subsidiaryof Prudential Financial, is permitted to pay a dividend of $143 million in 2014 with prior notification to the Arizona Department of Insurance.
160 Prudential Financial, Inc. 2013 Annual Report

PRUDENTIAL FINANCIAL, INC.
Notes to Consolidated Financial Statements
15. EQUITY (continued)
The Company’s international insurance operations are subject to dividend restrictions from the regulatory authorities in thejurisdictions in which they operate. With respect to The Prudential Life Insurance Company Ltd. (“Prudential of Japan”) and Gibraltar Life,the Company’s most significant international insurance subsidiaries, both of which are domiciled in Japan, Japan insurance law providesthat common stock dividends may be paid in an amount of up to 83% of prior fiscal year statutory after-tax earnings, after certain reservingthresholds are met, including providing for policyholder dividends. If statutory retained earnings exceed 100% of statutory paid-in-capital,100% of prior year statutory after-tax earnings may be paid, after reserving thresholds are met. Dividends in excess of these amounts andother forms of capital distribution require the prior approval of the Japan Financial Services Agency (“FSA”). Additionally, Prudential ofJapan and Gibraltar Life must give prior notification to the FSA of their intent to pay any dividend or distribution. In 2013, Prudential ofJapan paid a dividend of ¥25.0 billion, or $255 million, of which approximately $249 million was ultimately paid to Prudential Financial.Prudential of Japan has met the statutory retained earnings level necessary to dividend up to 100% of prior year statutory after-tax earnings.Prudential of Japan’s and Gibraltar Life’s current regulatory fiscal year will end March 31, 2014, at which time the common stock dividendamount permitted to be paid without prior approval from the FSA will be determinable. Although Gibraltar Life may be able to paycommon stock dividends under applicable legal and regulatory restrictions, Gibraltar Life does not anticipate paying common stockdividends for several years as it anticipates returning capital through other means, such as the repayment of subordinated debt or preferredstock obligations held by Prudential Financial or affiliates. The prior approval of the FSA is required for such capital distributions.
In addition, although prior regulatory approval may not be required by law for the payment of dividends up to the limitationsdescribed above, in practice, the Company would typically discuss any dividend payments with the applicable regulatory authority prior topayment. Additionally, the payment of dividends by the Company’s subsidiaries is subject to declaration by their Board of Directors andmay be affected by market conditions and other factors.
The declaration and payment of dividends on the Class B Stock depends upon the financial performance of the Closed Block Businessand, as the Closed Block matures, the holders of the Class B Stock will receive the surplus of the Closed Block Business no longer requiredto support the Closed Block for regulatory purposes. In addition, dividends on the Class B Stock are payable in an aggregate amount peryear at least equal to the lesser of (1) a Target Dividend Amount of $19.25 million or (2) the “CB Distributable Cash Flow” for such year,which is a measure of the net cash flows of the Closed Block Business. Notwithstanding this formula, as with any common stock,Prudential Financial retains the flexibility to suspend dividends on the Class B Stock; however, if CB Distributable Cash Flow exists andPrudential Financial chooses not to pay dividends on the Class B Stock in an aggregate amount at least equal to the lesser of the CBDistributable Cash Flow or the Target Dividend Amount for any period, then cash dividends cannot be paid on the Common Stock withrespect to such period.
Statutory Net Income, Capital and Surplus
The Company’s domestic insurance subsidiaries are required to prepare statutory financial statements in accordance with statutoryaccounting practices prescribed or permitted by the insurance department of the state of domicile. These subsidiaries do not utilize prescribedor permitted practices that vary materially from the statutory accounting practices prescribed by the National Association of InsuranceCommissioners (“NAIC”). Statutory accounting practices primarily differ from U.S. GAAP by charging policy acquisition costs to expenseas incurred, establishing future policy benefit liabilities using different actuarial assumptions as well as valuing investments and certain assetsand accounting for deferred taxes on a different basis. Statutory net income (loss) of Prudential Insurance amounted to $1,358 million, $1,382million and $826 million for the years ended December 31, 2013, 2012 and 2011, respectively. Statutory capital and surplus of PrudentialInsurance amounted to $9,383 million and $8,699 million at December 31, 2013 and 2012, respectively. Statutory net income (loss) ofPALAC amounted to $406 million, $217 million and $177 million for the years ended December 31, 2013, 2012 and 2011, respectively.Statutory capital and surplus of PALAC amounted to $443 million and $448 million at December 31, 2013 and 2012, respectively.
The Risk Based Capital (“RBC”) ratio is a primary measure by which the Company and its insurance regulators evaluate the capitaladequacy of Prudential Insurance and the Company’s other domestic insurance subsidiaries. The RBC ratio for Prudential Insuranceincludes both the Financial Services Businesses and Closed Block Business. RBC is determined by NAIC- prescribed formulas thatconsider, among other things, risks related to the type and quality of the invested assets, insurance-related risks associated with an insurer’sproducts and liabilities, interest rate risks and general business risks. If a subsidiary’s Total Adjusted Capital (“TAC”), as calculated in amanner prescribed by the NAIC, falls below the Company Action Level RBC, corrective action is required. As of December 31, 2013,Prudential Insurance and PALAC both had Total Adjusted Capital levels in excess of 4.0 times the regulatory required minimums thatwould require corrective action.
The Company’s international insurance subsidiaries prepare financial statements in accordance with local regulatory requirements,and they do not utilize regulatory accounting practices that vary materially from the applicable prescribed regulatory accounting practices.These statutory accounting practices differ from U.S. GAAP primarily by charging policy acquisition costs to expense as incurred andestablishing future policy benefit liabilities using different actuarial assumptions, as well as valuing investments and certain assets andaccounting for deferred taxes on a different basis.
The FSA utilizes a solvency margin ratio to evaluate the capital adequacy of Japanese insurance companies. The solvency margin ratioconsiders the level of solvency margin capital to a solvency margin risk amount, which is calculated in a similar manner to RBC. As ofDecember 31, 2013, Prudential of Japan and Gibraltar Life both had solvency margin capital in excess of 3.5 times the regulatory requiredminimums that would require corrective action.
Prudential Financial, Inc. 2013 Annual Report 161

PRUDENTIAL FINANCIAL, INC.
Notes to Consolidated Financial Statements
15. EQUITY (continued)
All of the Company’s domestic and international insurance subsidiaries have capital and surplus levels that exceed their respectiveregulatory minimum requirements.
Accumulated Other Comprehensive Income (Loss)The balance of and changes in each component of “Accumulated other comprehensive income (loss) attributable to Prudential
Financial, Inc.” for the years ended December 31, are as follows:
Accumulated Other Comprehensive Income (Loss)Attributable to Prudential Financial, Inc.
Foreign CurrencyTranslationAdjustment
Net UnrealizedInvestment Gains
(Losses)(1)
Pension andPostretirement
Unrecognized NetPeriodic Benefit
(Cost)
Total AccumulatedOther
ComprehensiveIncome (Loss)
(in millions)Balance, December 31, 2010 . . . . . . . . . . . . . . . $ 866 $ 3,245 $(1,461) $ 2,650Change in other comprehensive income before
reclassifications . . . . . . . . . . . . . . . . . . . . . . . . 309 4,169 (385) 4,093Amounts reclassified from AOCI . . . . . . . . . . . . 50 (335) 88 (197)Income tax benefit (expense) . . . . . . . . . . . . . . . (118) (1,274) 91 (1,301)
Balance, December 31, 2011 . . . . . . . . . . . . . . . 1,107 5,805 (1,667) 5,245Change in other comprehensive income before
reclassifications . . . . . . . . . . . . . . . . . . . . . . . . (303) 8,596 (800) 7,493Amounts reclassified from AOCI . . . . . . . . . . . . 6 36 101 143Income tax benefit (expense) . . . . . . . . . . . . . . . 118 (3,035) 250 (2,667)
Balance, December 31, 2012 . . . . . . . . . . . . . . . 928 11,402 (2,116) 10,214Change in other comprehensive income before
reclassifications . . . . . . . . . . . . . . . . . . . . . . . . (1,465) (1,239) 749 (1,955)Amounts reclassified from AOCI . . . . . . . . . . . . 4 (289) 125 (160)Income tax benefit (expense) . . . . . . . . . . . . . . . 420 470 (308) 582
Balance, December 31, 2013 . . . . . . . . . . . . . . . $ (113) $10,344 $(1,550) $ 8,681
(1) Includes cash flow hedges of ($446) million, ($257) million and ($86) million as of December 31, 2013, 2012, and 2011, respectively.
Reclassifications out of Accumulated Other Comprehensive Income (Loss)Year Ended
December 31, 2013Affected line item in Consolidated
Statements of Operations
(in millions)Amounts reclassified from AOCI(1)(2):Foreign currency translation adjustment:
Foreign currency translation adjustment . . . . . . . . . . . . . . . . . . . . . . . . . . . $ 0 Realized investment gains (losses), netForeign currency translation adjustment . . . . . . . . . . . . . . . . . . . . . . . . . . . (4) Other income
Total foreign currency translation adjustment . . . . . . . . . . . . . . . . . . . (4)Net unrealized investment gains (losses):
Cash flow hedges—Interest Rate . . . . . . . . . . . . . . . . . . . . . . . . . . . . . . . . . (24) (3)Cash flow hedges—Currency/Interest rate . . . . . . . . . . . . . . . . . . . . . . . . . (104) (3)Net unrealized investment gains (losses) on available-for-sale
securities . . . . . . . . . . . . . . . . . . . . . . . . . . . . . . . . . . . . . . . . . . . . . . . . . 351Net unrealized investment gains (losses)—all other . . . . . . . . . . . . . . . . . . 66
Total net unrealized investment gains (losses) . . . . . . . . . . . . . . . . . . 289 (4)Amortization of defined benefit items:
Prior service cost . . . . . . . . . . . . . . . . . . . . . . . . . . . . . . . . . . . . . . . . . . . . . 22 (5)Actuarial gain (loss) . . . . . . . . . . . . . . . . . . . . . . . . . . . . . . . . . . . . . . . . . . . (147) (5)
Total amortization of defined benefit items . . . . . . . . . . . . . . . . . . . . . (125)
Total reclassifications for the period . . . . . . . . . . . . . . . . . . . . . . $ 160
(1) All amounts are shown before tax.(2) Positive amounts indicate gains/benefits reclassified out of AOCI. Negative amounts indicate losses/costs reclassified out of AOCI.(3) See Note 21 for additional information on cash flow hedges.(4) See table below for additional information on unrealized investment gains (losses), including the impact on deferred policy acquisition and other costs,
future policy benefits and policyholders’ dividends.(5) See Note 18 for information on employee benefit plans.
162 Prudential Financial, Inc. 2013 Annual Report

PRUDENTIAL FINANCIAL, INC.
Notes to Consolidated Financial Statements
15. EQUITY (continued)
Net Unrealized Investment Gains (Losses)
Net unrealized investment gains and losses on securities classified as available-for-sale and certain other long-term investments andother assets are included in the Company’s Consolidated Statements of Financial Position as a component of AOCI. Changes in theseamounts include reclassification adjustments to exclude from “Other comprehensive income (loss)” those items that are included as part of“Net income” for a period that had been part of “Other comprehensive income (loss)” in earlier periods. The amounts for the periodsindicated below, split between amounts related to fixed maturity securities on which an OTTI loss has been recognized, and all other netunrealized investment gains and losses, are as follows:
Net Unrealized Investment Gains and Losses on Fixed Maturity Securities on which an OTTI loss has been recognized
Net UnrealizedGains (Losses)on Investments
DeferredPolicy
AcquisitionCosts,
DeferredSales
Inducements,and
Value ofBusinessAcquired
Future PolicyBenefits and
Policyholders’AccountBalances
Policyholders’Dividends
DeferredIncome
Tax(Liability)
Benefit
AccumulatedOther
ComprehensiveIncome (Loss)Related To Net
UnrealizedInvestment
Gains (Losses)
(in millions)Balance, December 31, 2010 . . . . . . . . . . . . . . . . . . . . . . . . $ (849) $ 18 $ (5) $ 334 $ 175 $(327)Net investment gains (losses) on investments arising during
the period . . . . . . . . . . . . . . . . . . . . . . . . . . . . . . . . . . . . . (474) 166 (308)Reclassification adjustment for (gains) losses included in
net income . . . . . . . . . . . . . . . . . . . . . . . . . . . . . . . . . . . . 375 (131) 244Reclassification adjustment for OTTI losses excluded from
net income(1) . . . . . . . . . . . . . . . . . . . . . . . . . . . . . . . . . . (55) 19 (36)Impact of net unrealized investment (gains) losses on
deferred policy acquisition costs, deferred salesinducements and value of business acquired . . . . . . . . . . (5) 2 (3)
Impact of net unrealized investment (gains) losses onfuture policy benefits and policyholders’ accountbalances . . . . . . . . . . . . . . . . . . . . . . . . . . . . . . . . . . . . . . 19 (7) 12
Impact of net unrealized investment (gains) losses onpolicyholders’ dividends . . . . . . . . . . . . . . . . . . . . . . . . . 132 (46) 86
Balance, December 31, 2011 . . . . . . . . . . . . . . . . . . . . . . . . $(1,003) $ 13 $ 14 $ 466 $ 178 $(332)Net investment gains (losses) on investments arising during
the period . . . . . . . . . . . . . . . . . . . . . . . . . . . . . . . . . . . . . 590 (207) 383Reclassification adjustment for (gains) losses included in
net income . . . . . . . . . . . . . . . . . . . . . . . . . . . . . . . . . . . . 312 (109) 203Reclassification adjustment for OTTI losses excluded from
net income(1) . . . . . . . . . . . . . . . . . . . . . . . . . . . . . . . . . . (93) 33 (60)Impact of net unrealized investment (gains) losses on
deferred policy acquisition costs, deferred salesinducements and value of business acquired . . . . . . . . . . (10) 4 (6)
Impact of net unrealized investment (gains) losses onfuture policy benefits and policyholders’ accountbalances . . . . . . . . . . . . . . . . . . . . . . . . . . . . . . . . . . . . . . (11) 5 (6)
Impact of net unrealized investment (gains) losses onpolicyholders’ dividends . . . . . . . . . . . . . . . . . . . . . . . . . (327) 114 (213)
Balance, December 31, 2012 . . . . . . . . . . . . . . . . . . . . . . . . $ (194) $ 3 $ 3 $ 139 $ 18 $ (31)Net investment gains (losses) on investments arising during
the period . . . . . . . . . . . . . . . . . . . . . . . . . . . . . . . . . . . . . 242 (85) 157Reclassification adjustment for (gains) losses included in
net income . . . . . . . . . . . . . . . . . . . . . . . . . . . . . . . . . . . . 70 (25) 45Reclassification adjustment for OTTI losses excluded from
net income(1) . . . . . . . . . . . . . . . . . . . . . . . . . . . . . . . . . . (8) 3 (5)Impact of net unrealized investment (gains) losses on
deferred policy acquisition costs, deferred salesinducements and value of business acquired . . . . . . . . . . (8) 3 (5)
Impact of net unrealized investment (gains) losses onfuture policy benefits and policyholders’ accountbalances . . . . . . . . . . . . . . . . . . . . . . . . . . . . . . . . . . . . . . 1 1
Impact of net unrealized investment (gains) losses onpolicyholders’ dividends . . . . . . . . . . . . . . . . . . . . . . . . . (75) 26 (49)
Balance, December 31, 2013 . . . . . . . . . . . . . . . . . . . . . . . . $ 110 $ (5) $ 4 $ 64 $ (60) $ 113
Prudential Financial, Inc. 2013 Annual Report 163

PRUDENTIAL FINANCIAL, INC.
Notes to Consolidated Financial Statements
15. EQUITY (continued)
(1) Represents “transfers in” related to the portion of OTTI losses recognized during the period that were not recognized in earnings for securities with noprior OTTI loss.
All Other Net Unrealized Investment Gains and Losses in AOCI
Net UnrealizedGains (Losses)
on Investments(1)
DeferredPolicy
AcquisitionCosts,
DeferredSales
Inducements,and
Value ofBusinessAcquired
Future PolicyBenefits and
Policyholders’AccountBalances
Policyholders’Dividends
DeferredIncome
Tax(Liability)
Benefit
AccumulatedOther
ComprehensiveIncome (Loss)Related To Net
UnrealizedInvestment
Gains (Losses)
(in millions)Balance, December 31, 2010 . . . . . . . . . . . . . . . . . . . . . . . $ 9,261 $ (766) $ (901) $(2,454) $(1,568) $ 3,572Net investment gains (losses) on investments arising
during the period . . . . . . . . . . . . . . . . . . . . . . . . . . . . . . . 7,142 (2,449) 4,693Reclassification adjustment for (gains) losses included in
net income . . . . . . . . . . . . . . . . . . . . . . . . . . . . . . . . . . . . (710) 250 (460)Reclassification adjustment for OTTI losses excluded
from net income(2) . . . . . . . . . . . . . . . . . . . . . . . . . . . . . 55 (19) 36Impact of net unrealized investment (gains) losses on
deferred policy acquisition costs, deferred salesinducements and value of business acquired . . . . . . . . . (413) 141 (272)
Impact of net unrealized investment (gains) losses onfuture policy benefits and policyholders’ accountbalances . . . . . . . . . . . . . . . . . . . . . . . . . . . . . . . . . . . . . . (369) 129 (240)
Impact of net unrealized investment (gains) losses onpolicyholders’ dividends . . . . . . . . . . . . . . . . . . . . . . . . . (1,865) 673 (1,192)
Balance, December 31, 2011 . . . . . . . . . . . . . . . . . . . . . . . $15,748 $(1,179) $(1,270) $(4,319) $(2,843) $ 6,137Net investment gains (losses) on investments arising
during the period . . . . . . . . . . . . . . . . . . . . . . . . . . . . . . . 9,586 (3,373) 6,213Reclassification adjustment for (gains) losses included in
net income . . . . . . . . . . . . . . . . . . . . . . . . . . . . . . . . . . . . (276) 97 (179)Reclassification adjustment for OTTI losses excluded
from net income(2) . . . . . . . . . . . . . . . . . . . . . . . . . . . . . 93 (32) 61Impact of net unrealized investment (gains) losses on
deferred policy acquisition costs, deferred salesinducements and value of business acquired . . . . . . . . . (49) 17 (32)
Impact of net unrealized investment (gains) losses onfuture policy benefits and policyholders’ accountbalances . . . . . . . . . . . . . . . . . . . . . . . . . . . . . . . . . . . . . . 126 (43) 83
Impact of net unrealized investment (gains) losses onpolicyholders’ dividends . . . . . . . . . . . . . . . . . . . . . . . . . (1,308) 458 (850)
Balance, December 31, 2012 . . . . . . . . . . . . . . . . . . . . . . . $25,151 $(1,228) $(1,144) $(5,627) $(5,719) $11,433Net investment gains (losses) on investments arising
during the period . . . . . . . . . . . . . . . . . . . . . . . . . . . . . . . (4,306) 1,443 (2,863)Reclassification adjustment for (gains) losses included in
net income . . . . . . . . . . . . . . . . . . . . . . . . . . . . . . . . . . . . (359) 126 (233)Reclassification adjustment for OTTI losses excluded
from net income(2) . . . . . . . . . . . . . . . . . . . . . . . . . . . . . 8 (3) 5Impact of net unrealized investment (gains) losses on
deferred policy acquisition costs, deferred salesinducements and value of business acquired . . . . . . . . . 509 (178) 331
Impact of net unrealized investment (gains) losses onfuture policy benefits and policyholders’ accountbalances . . . . . . . . . . . . . . . . . . . . . . . . . . . . . . . . . . . . . . 465 (164) 301
Impact of net unrealized investment (gains) losses onpolicyholders’ dividends . . . . . . . . . . . . . . . . . . . . . . . . . 1,933 (676) 1,257
Balance, December 31, 2013 . . . . . . . . . . . . . . . . . . . . . . . $20,494 $ (719) $ (679) $(3,694) $(5,171) $10,231
164 Prudential Financial, Inc. 2013 Annual Report

PRUDENTIAL FINANCIAL, INC.
Notes to Consolidated Financial Statements
15. EQUITY (continued)
(1) Includes cash flow hedges. See Note 21 for information on cash flow hedges.(2) Represents “transfers out” related to the portion of OTTI losses recognized during the period that were not recognized in earnings for securities with no
prior OTTI loss.
16. EARNINGS PER SHARE
The Company has outstanding two separate classes of common stock. The Common Stock reflects the performance of the FinancialServices Businesses and the Class B Stock reflects the performance of the Closed Block Business. Accordingly, earnings per share iscalculated separately for each of these two classes of common stock.
Net income for the Financial Services Businesses and the Closed Block Business is determined in accordance with U.S. GAAP andincludes general and administrative expenses charged to each of the respective businesses based on the Company’s methodology for theallocation of such expenses. Cash flows between the Financial Services Businesses and the Closed Block Business related to administrativeexpenses are determined by a policy servicing fee arrangement that is based upon insurance and policies in force and statutory cashpremiums. To the extent reported administrative expenses vary from these cash flow amounts, the differences are recorded, on an after taxbasis, as direct equity adjustments to the equity balances of the businesses. The direct equity adjustments modify the earnings available toeach of the classes of common stock for earnings per share purposes.
Common StockA reconciliation of the numerators and denominators of the basic and diluted per share computations for the years ended
December 31, is as follows:
2013 2012 2011
Income
WeightedAverageShares
Per ShareAmount Income
WeightedAverageShares
Per ShareAmount Income
WeightedAverageShares
Per ShareAmount
(in millions, except per share amounts)Basic earnings per shareIncome (loss) from continuing operations attributable to
the Financial Services Businesses . . . . . . . . . . . . . . . . $(613) $512 $3,485Direct equity adjustment . . . . . . . . . . . . . . . . . . . . . . . . . 2 20 24Less: Income attributable to noncontrolling interests . . . 107 50 34Less: Dividends and undistributed earnings allocated to
participating unvested share-based payment awards . . 8 7 46
Income (loss) from continuing operations attributable tothe Financial Services Businesses available to holdersof Common Stock after direct equity adjustment . . . . . $(726) 463.1 $(1.57) $475 465.6 $1.02 $3,429 480.2 $7.14
Effect of dilutive securities and compensationprograms(1)
Add: Dividends and undistributed earnings allocated toparticipating unvested share-based payment awards—Basic . . . . . . . . . . . . . . . . . . . . . . . . . . . . . . . . . . . . . . . $ 8 $ 7 $ 46
Less: Dividends and undistributed earnings allocated toparticipating unvested share-based payment awards—Diluted . . . . . . . . . . . . . . . . . . . . . . . . . . . . . . . . . . . . . 8 7 46
Stock options . . . . . . . . . . . . . . . . . . . . . . . . . . . . . . . . . . 0.0 1.9 2.9Deferred and long-term compensation programs . . . . . . . 0.0 0.6 0.5Exchangeable Surplus Notes . . . . . . . . . . . . . . . . . . . . . . 0 0.0 0 0.0 17 5.1
Diluted earnings per share(1)(2)Income (loss) from continuing operations attributable to
the Financial Services Businesses available to holdersof Common Stock after direct equity adjustment . . . . . $(726) 463.1 $(1.57) $475 468.1 $1.01 $3,446 488.7 $7.05
(1) For the twelve months ended December 31, 2013, weighted average shares for basic earnings per share is also used for calculating diluted earnings pershare because dilutive shares and dilutive earnings per share are not applicable when a loss from continuing operations is reported. As a result of theloss from continuing operations available to holders of Common Stock after direct equity adjustment for the twelve months ended December 31, 2013,all potential stock options and compensation programs were considered antidilutive.
(2) For the twelve months ended December 31, 2012, weighted average shares used for calculating diluted earnings per share excludes the potential sharesthat would be issued related to the exchangeable surplus notes since the hypothetical impact of these shares was antidilutive. In calculating dilutedearnings per share under the if-converted method, the potential shares that would be issued related to the exchangeable surplus notes assuming ahypothetical exchange, weighted for the period the notes are outstanding, is added to the denominator, and interest expense, net of tax, is added to thenumerator, if the overall effect is dilutive.
Prudential Financial, Inc. 2013 Annual Report 165

PRUDENTIAL FINANCIAL, INC.
Notes to Consolidated Financial Statements
16. EARNINGS PER SHARE (continued)
Unvested share-based payment awards that contain nonforfeitable rights to dividends are participating securities and included in thecomputation of earnings per share pursuant to the two-class method. Under this method, earnings of the Financial Services Businessesattributable to Prudential Financial, Inc. are allocated between Common Stock and the participating awards, as if the awards were a secondclass of stock. During periods of income from continuing operations available to holders of Common Stock after direct equity adjustment,the calculation of earnings per share exclude the income attributable to participating securities in the numerator and the dilutive impact ofthese securities from the denominator. In the event of loss from continuing operations available to holders of Common Stock after directequity adjustment, undistributed earnings are not allocated to participating securities and the denominator excludes the dilutive impact ofthese securities as they do not share in the losses of the Company. Undistributed earnings allocated to participating unvested share-basedpayment awards for the years ended December 31, 2013, 2012 and 2011, as applicable, were based on 4.4 million, 4.6 million and6.5 million of such awards, respectively, weighted for the period they were outstanding.
Stock options and shares related to deferred and long-term compensation programs that are considered antidilutive are excluded fromthe computation of dilutive earnings per share. Stock options are considered antidilutive based on application of the treasury stock methodor in the event of loss from continuing operations available to holders of Common Stock after direct equity adjustment. Shares related todeferred and long-term compensation programs are considered antidilutive in the event of loss from continuing operations available toholders of Common Stock after direct equity adjustment. For the years ended December 31, the number of stock options and shares relatedto deferred and long-term compensation programs that were considered antidilutive and were excluded from the computation of dilutedearnings per share, weighted for the portion of the period they were outstanding, are as follows:
2013 2012 2011
Shares
ExercisePrice Per
Share Shares
ExercisePrice Per
Share Shares
ExercisePrice Per
Share
(in millions, except per share amounts, based onweighted average)
Antidilutive stock options based on application of the treasury stock method . . . . . . . . . . . . . . . . 6.6 $73.51 13.3 $69.80 10.8 $73.01Antidilutive stock options due to loss from continuing operations available to holders of
Common Stock after direct equity adjustment . . . . . . . . . . . . . . . . . . . . . . . . . . . . . . . . . . . . . . 12.2 0.0 0.0Antidilutive shares due to loss from continuing operations available to holders of Common
Stock after direct equity adjustment . . . . . . . . . . . . . . . . . . . . . . . . . . . . . . . . . . . . . . . . . . . . . . 5.2 0.0 0.0
Total antidilutive stock options and shares . . . . . . . . . . . . . . . . . . . . . . . . . . . . . . . . . . . . . . . 24.0 13.3 10.8
In September 2009, the Company issued $500 million of surplus notes with an interest rate of 5.36% per annum which are exchangeableat the option of the note holders for shares of Common Stock. The initial exchange rate for the surplus notes was 10.1235 shares of CommonStock per each $1,000 principal amount of surplus notes, which represents an initial exchange price per share of Common Stock of $98.78;however, the exchange rate is subject to customary anti-dilution adjustments. In calculating diluted earnings per share under the if-convertedmethod, the potential shares that would be issued assuming a hypothetical exchange, weighted for the period the notes are outstanding, areadded to the denominator, and interest expense, net of tax, is added to the numerator, if the overall effect is dilutive.
As discussed in Note 15, Prudential Financial may, at its option, at any time, subject to a notification period, exchange all outstandingshares of Class B Stock into such number of shares of Common Stock as have an aggregate average market value equal to 120% of theappraised fair market value of the outstanding shares of Class B Stock. Holders of Class B Stock will be permitted to convert their shares ofClass B Stock into such number of shares of Common Stock as have an aggregate average market value equal to 100% of the appraised fairmarket value of the outstanding shares of Class B Stock in the holder’s sole discretion, beginning on January 1, 2016, or earlier uponcertain specified events. Any conversion may have a dilutive effect on holders of Common Stock.
Class B Stock
Income from continuing operations per share of Class B Stock for the years ended December 31, are presented below. There are nopotentially dilutive shares associated with the Class B Stock.
2013 2012 2011
Income
WeightedAverageShares
Per ShareAmount Income
WeightedAverageShares
Per ShareAmount Income
WeightedAverageShares
Per ShareAmount
(in millions, except per share amounts)Basic earnings per shareIncome (loss) from continuing operations attributable to
the Closed Block Business . . . . . . . . . . . . . . . . . . . . . . $46 $43 $146Less: Direct equity adjustment . . . . . . . . . . . . . . . . . . . . . 2 20 24
Income (loss) from continuing operations attributable tothe Closed Block Business available to holders ofClass B Stock after direct equity adjustment . . . . . . . . $44 2.0 $22.00 $23 2.0 $11.50 $122 2.0 $61.00
166 Prudential Financial, Inc. 2013 Annual Report

PRUDENTIAL FINANCIAL, INC.
Notes to Consolidated Financial Statements
17. SHARE-BASED PAYMENTS
Omnibus Incentive Plan
The Prudential Financial, Inc. Omnibus Incentive Plan (as subsequently amended and restated, the “Omnibus Plan”) provides stockbased awards including stock options, stock appreciation rights, restricted stock shares, restricted stock units, stock settled performanceshares, and cash settled performance units. Dividend equivalents are generally provided on restricted stock shares and restricted stock unitsoutstanding as of the record date. Dividend equivalents are generally accrued on target performance shares and units outstanding as of therecord date. These dividend equivalents are paid only on the shares and units released up to a maximum of the target number of shares andunits awarded. Generally, the requisite service period is the vesting period. As of December 31, 2013, 14,220,662 authorized shares remainavailable for grant under the Omnibus Plan.
Compensation Costs
Compensation cost for employee stock options is based on the fair values estimated on the grant date, using the approach andassumptions described below. Compensation cost for restricted stock units, performance shares and performance units granted toemployees is measured by the share price of the underlying Common Stock at the date of grant.
The fair value of each stock option award is estimated using a binomial option-pricing model on the date of grant for stock optionsissued to employees. The weighted average grant date assumptions used in the binomial option valuation model are as follows:
2013 2012 2011
Expected volatility . . . . . . . . . . . . . . . . . . . . . . . . . . . . . . . . . . . . . . . . . . . . . . . . . . . . . . . . . . . . . . . 36.44% 41.80% 39.86%Expected dividend yield . . . . . . . . . . . . . . . . . . . . . . . . . . . . . . . . . . . . . . . . . . . . . . . . . . . . . . . . . . . 3.00% 3.00% 2.00%Expected term . . . . . . . . . . . . . . . . . . . . . . . . . . . . . . . . . . . . . . . . . . . . . . . . . . . . . . . . . . . . . . . . . . . 5.52 years 5.44 years 5.28 yearsRisk-free interest rate . . . . . . . . . . . . . . . . . . . . . . . . . . . . . . . . . . . . . . . . . . . . . . . . . . . . . . . . . . . . . 1.01% 0.93% 2.48%
Expected volatilities are based on historical volatility of the Company’s Common Stock and implied volatilities from traded optionson the Company’s Common Stock. The Company uses historical data and expectations of future exercise patterns to estimate optionexercises and employee terminations within the valuation model. The expected term of options granted represents the period of time thatoptions granted are expected to be outstanding. The risk-free rate for periods associated with the expected term of the option is based on theU.S. Treasury yield curve in effect at the time of grant.
The following chart summarizes the compensation cost recognized and the related income tax benefit for stock options, restrictedstock units, performance shares and performance units for the years ended December 31:
2013 2012 2011
TotalCompensation Cost
RecognizedIncome Tax
Benefit
TotalCompensation Cost
RecognizedIncome Tax
Benefit
TotalCompensation Cost
RecognizedIncome Tax
Benefit
(in millions)Employee stock options . . . . . . . . . . . . . . . . . . $ 43 $15 $ 45 $16 $ 44 $16Employee restricted stock units . . . . . . . . . . . . 88 32 84 30 83 30Employee performance shares and
performance units . . . . . . . . . . . . . . . . . . . . . 86 31 26 9 14 5
Total . . . . . . . . . . . . . . . . . . . . . . . . . . . . . $217 $78 $155 $55 $141 $51
Compensation costs for all stock based compensation plans capitalized in deferred acquisition costs for the years ended December 31,2013, 2012 and 2011 were de minimis.
Stock Options
Each stock option granted has an exercise price no less than the fair market value of the Company’s Common Stock on the date ofgrant and has a maximum term of 10 years. Generally, one third of the option grant vests in each of the first three years.
Prudential Financial, Inc. 2013 Annual Report 167

PRUDENTIAL FINANCIAL, INC.
Notes to Consolidated Financial Statements
17. SHARE-BASED PAYMENTS (continued)
A summary of the status of the Company’s stock option grants is as follows:
Employee Stock Options
SharesWeighted Average
Exercise Price
Outstanding at December 31, 2012 . . . . . . . . . . . . . . . . . . . . . . . . . . . . . . . . . . . . . . . . . . . . . . . . . . . . . . . 18,617,380 $60.59Granted . . . . . . . . . . . . . . . . . . . . . . . . . . . . . . . . . . . . . . . . . . . . . . . . . . . . . . . . . . . . . . . . . . . . . . . . 3,094,117 57.16Exercised . . . . . . . . . . . . . . . . . . . . . . . . . . . . . . . . . . . . . . . . . . . . . . . . . . . . . . . . . . . . . . . . . . . . . . . (5,662,522) 50.82Forfeited . . . . . . . . . . . . . . . . . . . . . . . . . . . . . . . . . . . . . . . . . . . . . . . . . . . . . . . . . . . . . . . . . . . . . . . (83,243) 58.83Expired . . . . . . . . . . . . . . . . . . . . . . . . . . . . . . . . . . . . . . . . . . . . . . . . . . . . . . . . . . . . . . . . . . . . . . . . (971,283) 72.81
Outstanding at December 31, 2013 . . . . . . . . . . . . . . . . . . . . . . . . . . . . . . . . . . . . . . . . . . . . . . . . . . . . . . . 14,994,449 $62.79
Vested and expected to vest at December 31, 2013 . . . . . . . . . . . . . . . . . . . . . . . . . . . . . . . . . . . . . . . . . . 14,782,007 $62.87
Exercisable at December 31, 2013 . . . . . . . . . . . . . . . . . . . . . . . . . . . . . . . . . . . . . . . . . . . . . . . . . . . . . . . 9,491,924 $65.16
The weighted average grant date fair value of employee stock options granted during the years ended December 31, 2013, 2012 and2011 was $13.72, $16.36 and $20.21, respectively.
The total intrinsic value (i.e., market price of the stock less the option exercise price) of employee stock options exercised during theyears ended December 31, 2013, 2012 and 2011 was $146 million, $66 million, and $49 million, respectively.
The weighted average remaining contractual term and the aggregate intrinsic value of stock options outstanding, vested and expectedto vest and exercisable as of December 31, 2013 is as follows:
December 31, 2013
Employee Stock Options
Weighted AverageRemaining
Contractual TermAggregate
Intrinsic Value
(in years) (in millions)Outstanding . . . . . . . . . . . . . . . . . . . . . . . . . . . . . . . . . . . . . . . . . . . . . . . . . . . . . . . . . . . . . . . . . . . . . . 5.61 $441
Vested and expected to vest . . . . . . . . . . . . . . . . . . . . . . . . . . . . . . . . . . . . . . . . . . . . . . . . . . . . . . . . . 5.56 $434
Exercisable . . . . . . . . . . . . . . . . . . . . . . . . . . . . . . . . . . . . . . . . . . . . . . . . . . . . . . . . . . . . . . . . . . . . . . 4.08 $257
Restricted Stock Units, Performance Share Awards and Performance Unit Awards
A restricted stock unit is an unfunded, unsecured right to receive a share of Common Stock at the end of a specified period of time,which is subject to forfeiture and transfer restrictions. Generally, the restrictions will lapse on the third anniversary of the date of grant.Performance shares and performance units are awards denominated in Common Stock. The number of units is determined over theperformance period, and may be adjusted based on the satisfaction of certain performance goals. Performance share awards are payable inCommon Stock. Performance unit awards are payable in cash.
A summary of the Company’s restricted stock units and performance shares and performance unit awards is as follows:
RestrictedStockUnits
WeightedAverage GrantDate Fair Value
PerformanceShare and
PerformanceUnit Awards(1)
WeightedAverage GrantDate Fair Value
Restricted at December 31, 2012(2) . . . . . . . . . . . . . . . . . . . . . . . . . . . . 4,367,161 $56.87 933,372 $53.33Granted(2) . . . . . . . . . . . . . . . . . . . . . . . . . . . . . . . . . . . . . . . . . . . 1,613,079 57.94 392,220 92.22Forfeited . . . . . . . . . . . . . . . . . . . . . . . . . . . . . . . . . . . . . . . . . . . . . (124,883) 58.69 (15,438) 63.77Performance adjustment(3) . . . . . . . . . . . . . . . . . . . . . . . . . . . . . . 38,370 57.00Released . . . . . . . . . . . . . . . . . . . . . . . . . . . . . . . . . . . . . . . . . . . . . (1,491,251) 48.92 (335,534) 57.00
Restricted at December 31, 2013(2) . . . . . . . . . . . . . . . . . . . . . . . . . . . . 4,364,106 $59.93 1,012,990 $92.22
(1) Performance share and performance unit awards reflect the target awarded, reduced for cancellations and releases to date. The actual number of units tobe awarded at the end of each performance period will range between 0% and 150% of the target number of awards granted, based upon a measure ofthe reported performance for the Company’s Financial Services Businesses relative to stated goals.
168 Prudential Financial, Inc. 2013 Annual Report

PRUDENTIAL FINANCIAL, INC.
Notes to Consolidated Financial Statements
17. SHARE-BASED PAYMENTS (continued)
(2) For performance share and performance unit awards issued after January 1, 2010, the grant date is the same as the date the grant vests. The features ofthe grant are such that a mutual understanding of the key terms and conditions of the award between the employee and employer have not been reacheduntil the grant is vested. Consequently, the weighted average grant date fair value as of December 31, 2013 and December 31, 2012 is the year endclosing stock price of Prudential Financial’s common stock.
(3) Represents the change in shares issued based upon the attainment of performance goals for the Company’s Financial Services Businesses.
The fair market value of restricted stock units, performance shares and performance units released for the years ended December 31,2013, 2012 and 2011 was $106 million, $196 million and $75 million, respectively.
The weighted average grant date fair value for restricted stock units granted during the years ended December 31, 2013, 2012 and2011 was $57.94, $58.89 and $63.39, respectively. The weighted average grant date fair value for performance shares and performanceunits granted during the years ended December 31, 2013, 2012 and 2011 was $92.22, $53.33 and $50.12, respectively.
The number of restricted stock units, performance shares and performance units expected to vest at December 31, 2013 is 5,346,669.
Unrecognized Compensation Cost
Unrecognized compensation cost for stock options as of December 31, 2013 was $17 million with a weighted average recognitionperiod of 1.61 years. Unrecognized compensation cost for restricted stock units, performance shares and performance units as ofDecember 31, 2013 was $84 million with a weighted average recognition period of 1.66 years.
Tax Benefits Realized
The tax benefit realized for exercises of stock options during the years ended December 31, 2013, 2012 and 2011 was $51 million,$21 million and $18 million, respectively.
The tax benefit realized upon vesting of restricted stock units, performance shares and performance units for the years endedDecember 31, 2013, 2012 and 2011 was $38 million, $69 million and $26 million, respectively.
Settlement of Awards
The Company’s policy is to issue shares from Common Stock held in treasury upon exercise of stock options, the release of restrictedstock units and performance shares. The Company began settling performance units in cash beginning in 2013. The amount of cash used tosettle performance units in 2013 was $10 million.
18. EMPLOYEE BENEFIT PLANS
Pension and Other Postretirement Plans
The Company has funded and non-funded non-contributory defined benefit pension plans, which cover substantially all of itsemployees. For some employees, benefits are based on final average earnings and length of service, while benefits for other employees arebased on an account balance that takes into consideration age, service and earnings during their career.
The Company provides certain health care and life insurance benefits for its retired employees, their beneficiaries and covereddependents (“other postretirement benefits”). The health care plan is contributory; the life insurance plan is non-contributory. Substantiallyall of the Company’s U.S. employees may become eligible to receive other postretirement benefits if they retire after age 55 with at least 10years of service or under certain circumstances after age 50 with at least 20 years of continuous service. The Company has elected toamortize its transition obligation for other postretirement benefits over 20 years.
On December 6, 2013, the Company transferred $340 million of assets within the qualified pension plan under Section 420 of theInternal Revenue Code from assets supporting pension benefits to assets supporting retiree medical and life benefits. The transfer resultedin a reduction to the prepaid benefit cost for the qualified pension plan and an offsetting decrease in the accrued benefit liability for thepostretirement plan with no net effect on stockholders’ equity on the Company’s consolidated financial position. The transfer had noimpact on the Company’s consolidated results of operations, but will reduce the future cash contributions required to be made to thepostretirement plan.
Prudential Financial, Inc. 2013 Annual Report 169

PRUDENTIAL FINANCIAL, INC.
Notes to Consolidated Financial Statements
18. EMPLOYEE BENEFIT PLANS (continued)
Prepaid benefits costs and accrued benefit liabilities are included in “Other assets” and “Other liabilities,” respectively, in theCompany’s Consolidated Statements of Financial Position. The status of these plans as of December 31, 2013 and 2012 is summarizedbelow:
Pension Benefits
OtherPostretirement
Benefits
2013 2012 2013 2012
(in millions)Change in benefit obligationBenefit obligation at the beginning of period . . . . . . . . . . . . . . . . . . . . . . . . . . . . . . . . . . . . . . $(12,042) $(11,113) $(2,372) $(2,277)Acquisition/Divestiture . . . . . . . . . . . . . . . . . . . . . . . . . . . . . . . . . . . . . . . . . . . . . . . . . . . . . . . 0 0 (3) 0Service cost . . . . . . . . . . . . . . . . . . . . . . . . . . . . . . . . . . . . . . . . . . . . . . . . . . . . . . . . . . . . . . . . (252) (243) (17) (14)Interest cost . . . . . . . . . . . . . . . . . . . . . . . . . . . . . . . . . . . . . . . . . . . . . . . . . . . . . . . . . . . . . . . . (437) (474) (89) (101)Plan participants’ contributions . . . . . . . . . . . . . . . . . . . . . . . . . . . . . . . . . . . . . . . . . . . . . . . . . 0 0 (28) (27)Medicare Part D subsidy receipts . . . . . . . . . . . . . . . . . . . . . . . . . . . . . . . . . . . . . . . . . . . . . . . 0 0 (12) (18)Amendments . . . . . . . . . . . . . . . . . . . . . . . . . . . . . . . . . . . . . . . . . . . . . . . . . . . . . . . . . . . . . . . (2) 62 0 0Annuity purchase . . . . . . . . . . . . . . . . . . . . . . . . . . . . . . . . . . . . . . . . . . . . . . . . . . . . . . . . . . . . 1 1 0 0Actuarial gains/(losses), net . . . . . . . . . . . . . . . . . . . . . . . . . . . . . . . . . . . . . . . . . . . . . . . . . . . . 844 (1,098) 220 (134)Settlements . . . . . . . . . . . . . . . . . . . . . . . . . . . . . . . . . . . . . . . . . . . . . . . . . . . . . . . . . . . . . . . . . 5 120 0 0Special termination benefits . . . . . . . . . . . . . . . . . . . . . . . . . . . . . . . . . . . . . . . . . . . . . . . . . . . (2) (8) 0 0Benefits paid . . . . . . . . . . . . . . . . . . . . . . . . . . . . . . . . . . . . . . . . . . . . . . . . . . . . . . . . . . . . . . . 691 599 200 200Foreign currency changes and other . . . . . . . . . . . . . . . . . . . . . . . . . . . . . . . . . . . . . . . . . . . . . 308 112 (1) (1)
Benefit obligation at end of period . . . . . . . . . . . . . . . . . . . . . . . . . . . . . . . . . . . . . . . . . . . . . . $(10,886) $(12,042) $(2,102) $(2,372)
Change in plan assetsFair value of plan assets at beginning of period . . . . . . . . . . . . . . . . . . . . . . . . . . . . . . . . . . . . $ 12,686 $ 11,812 $ 1,329 $ 1,344Actual return on plan assets . . . . . . . . . . . . . . . . . . . . . . . . . . . . . . . . . . . . . . . . . . . . . . . . . . . . 266 1,097 244 140Annuity purchase . . . . . . . . . . . . . . . . . . . . . . . . . . . . . . . . . . . . . . . . . . . . . . . . . . . . . . . . . . . . (1) (1) 0 0Employer contributions . . . . . . . . . . . . . . . . . . . . . . . . . . . . . . . . . . . . . . . . . . . . . . . . . . . . . . . 206 496 18 18Plan participants’ contributions . . . . . . . . . . . . . . . . . . . . . . . . . . . . . . . . . . . . . . . . . . . . . . . . . 0 0 28 27Disbursement for settlements . . . . . . . . . . . . . . . . . . . . . . . . . . . . . . . . . . . . . . . . . . . . . . . . . . (5) (120) 0 0Benefits paid . . . . . . . . . . . . . . . . . . . . . . . . . . . . . . . . . . . . . . . . . . . . . . . . . . . . . . . . . . . . . . . (691) (599) (200) (200)Foreign currency changes and other . . . . . . . . . . . . . . . . . . . . . . . . . . . . . . . . . . . . . . . . . . . . . (52) 1 (14) 0Effect of Section 420 transfer . . . . . . . . . . . . . . . . . . . . . . . . . . . . . . . . . . . . . . . . . . . . . . . . . . (340) 0 340 0
Fair value of plan assets at end of period . . . . . . . . . . . . . . . . . . . . . . . . . . . . . . . . . . . . . . . . . $ 12,069 $ 12,686 $ 1,745 $ 1,329
Funded status at end of period . . . . . . . . . . . . . . . . . . . . . . . . . . . . . . . . . . . . . . . . . . . . . . . . $ 1,183 $ 644 $ (357) $(1,043)
Amounts recognized in the Statements of Financial PositionPrepaid benefit cost . . . . . . . . . . . . . . . . . . . . . . . . . . . . . . . . . . . . . . . . . . . . . . . . . . . . . . . . . . $ 3,354 $ 3,130 $ 0 $ 0Accrued benefit liability . . . . . . . . . . . . . . . . . . . . . . . . . . . . . . . . . . . . . . . . . . . . . . . . . . . . . . (2,171) (2,486) (357) (1,043)
Net amount recognized . . . . . . . . . . . . . . . . . . . . . . . . . . . . . . . . . . . . . . . . . . . . . . . . . . . . . . . $ 1,183 $ 644 $ (357) $(1,043)
Items recorded in “Accumulated other comprehensive income (loss)” not yetrecognized as a component of net periodic (benefit) cost:
Transition obligation . . . . . . . . . . . . . . . . . . . . . . . . . . . . . . . . . . . . . . . . . . . . . . . . . . . . . . . . . $ 0 $ 0 $ 0 $ 0Prior service cost . . . . . . . . . . . . . . . . . . . . . . . . . . . . . . . . . . . . . . . . . . . . . . . . . . . . . . . . . . . . (56) (81) (19) (30)Net actuarial loss . . . . . . . . . . . . . . . . . . . . . . . . . . . . . . . . . . . . . . . . . . . . . . . . . . . . . . . . . . . . 2,065 2,548 463 893
Net amount not recognized . . . . . . . . . . . . . . . . . . . . . . . . . . . . . . . . . . . . . . . . . . . . . . . . . . . . $ 2,009 $ 2,467 $ 444 $ 863
Accumulated benefit obligation . . . . . . . . . . . . . . . . . . . . . . . . . . . . . . . . . . . . . . . . . . . . . . . . . $(10,374) $(11,502) $(2,102) $(2,372)
In addition to the plan assets above, the Company in 2007 established an irrevocable trust, commonly referred to as a “rabbi trust,” forthe purpose of holding assets of the Company to be used to satisfy its obligations with respect to certain non-qualified retirement plans($918 million and $998 million benefit obligation at December 31, 2013 and 2012, respectively). Assets held in the rabbi trust are availableto the general creditors of the Company in the event of insolvency or bankruptcy. The Company may from time to time in its discretionmake contributions to the trust to fund accrued benefits payable to participants in one or more of the plans, and, in the case of a change incontrol of the Company, as defined in the trust agreement, the Company will be required to make contributions to the trust to fund theaccrued benefits, vested and unvested, payable on a pretax basis to participants in the plans. The Company made a discretionary payment of$95 million and $0 million to the trust in 2013 and 2012, respectively. As of December 31, 2013 and 2012, the assets in the trust had acarrying value of $561 million and $445 million, respectively.
170 Prudential Financial, Inc. 2013 Annual Report

PRUDENTIAL FINANCIAL, INC.
Notes to Consolidated Financial Statements
18. EMPLOYEE BENEFIT PLANS (continued)
The Company also maintains a separate rabbi trust for the purpose of holding assets of the Company to be used to satisfy itsobligations with respect to certain other non-qualified retirement plans ($73 million and $80 million benefit obligation at December 31,2013 and 2012, respectively), as well as certain cash-based deferred compensation arrangements. As of December 31, 2013 and 2012, theassets in the trust had a carrying value of $116 million and $135 million, respectively.
Pension benefits for foreign plans comprised 16% of the ending benefit obligation for both 2013 and 2012, respectively. Foreignpension plans comprised 5% of the ending fair value of plan assets for both 2013 and 2012. There are no material foreign postretirementplans.
Information for pension plans with a projected benefit obligation in excess of plan assets
2013 2012
(in millions)Projected benefit obligation . . . . . . . . . . . . . . . . . . . . . . . . . . . . . . . . . . . . . . . . . . . . . . . . . . . . . . . . . . . . . . . . . . . . . . . . . . . $2,457 $2,820Fair value of plan assets . . . . . . . . . . . . . . . . . . . . . . . . . . . . . . . . . . . . . . . . . . . . . . . . . . . . . . . . . . . . . . . . . . . . . . . . . . . . . . $ 286 $ 334
Information for pension plans with an accumulated benefit obligation in excess of plan assets
2013 2012
(in millions)Accumulated benefit obligation . . . . . . . . . . . . . . . . . . . . . . . . . . . . . . . . . . . . . . . . . . . . . . . . . . . . . . . . . . . . . . . . . . . . . . . . $2,258 $2,603Fair value of plan assets . . . . . . . . . . . . . . . . . . . . . . . . . . . . . . . . . . . . . . . . . . . . . . . . . . . . . . . . . . . . . . . . . . . . . . . . . . . . . . $ 258 $ 311
In 2013 and 2012 the pension plans purchased annuity contracts from Prudential Insurance for $1 million. The approximate futureannual benefit payment payable by Prudential Insurance for all annuity contracts was $21 million and $18 million as of December 31, 2013and 2012, respectively.
There were pension plan amendments in 2013 and 2012. In 2013 the benefit obligation for pension benefits increased $2 million forimmediately vesting employees due to the Section 420 transfer. In 2012 the benefit obligation for pension benefits decreased $62 million toreduce future pension benefits associated with the cash balance feature of certain domestic plans and changes in benefit structures forJapanese plans. There were no postretirement plan amendments in 2013 and 2012.
Components of Net Periodic Benefit Cost
The Company uses market related value to determine components of net periodic (benefit) cost. Market related value recognizescertain changes in fair value of plan assets over a period of five years. Changes in the fair value of U.S Equities, International Equities,Real Estate and Other Assets are recognized over a five year period. However, the fair value for Fixed Maturity assets (including short terminvestments) are recognized immediately for the purposes of market related value.
Net periodic (benefit) cost included in “General and administrative expenses” in the Company’s Consolidated Statements ofOperations for the years ended December 31, includes the following components:
Pension BenefitsOther Postretirement
Benefits
2013 2012 2011 2013 2012 2011
(in millions)Service cost . . . . . . . . . . . . . . . . . . . . . . . . . . . . . . . . . . . . . . . . . . . . . . . . . . . . . . . . $ 252 $ 243 $ 218 $ 17 $ 14 $ 11Interest cost . . . . . . . . . . . . . . . . . . . . . . . . . . . . . . . . . . . . . . . . . . . . . . . . . . . . . . . . 437 474 486 89 101 110Expected return on plan assets . . . . . . . . . . . . . . . . . . . . . . . . . . . . . . . . . . . . . . . . . (769) (809) (756) (87) (87) (98)Amortization of transition obligation . . . . . . . . . . . . . . . . . . . . . . . . . . . . . . . . . . . . 0 0 0 0 1 1Amortization of prior service cost . . . . . . . . . . . . . . . . . . . . . . . . . . . . . . . . . . . . . . (10) 13 23 (12) (12) (12)Amortization of actuarial (gain) loss, net . . . . . . . . . . . . . . . . . . . . . . . . . . . . . . . . . 91 45 40 56 54 36Settlements . . . . . . . . . . . . . . . . . . . . . . . . . . . . . . . . . . . . . . . . . . . . . . . . . . . . . . . . 0 9 5 0 0 0Curtailments . . . . . . . . . . . . . . . . . . . . . . . . . . . . . . . . . . . . . . . . . . . . . . . . . . . . . . . 0 0 (18) 0 0 0Special termination benefits(1) . . . . . . . . . . . . . . . . . . . . . . . . . . . . . . . . . . . . . . . . . 2 7 4 0 0 0
Net periodic (benefit) cost(2) . . . . . . . . . . . . . . . . . . . . . . . . . . . . . . . . . . . . . . . . . . $ 3 $ (18) $ 2 $ 63 $ 71 $ 48
(1) Certain employees were provided special termination benefits under non-qualified plans in the form of unreduced early retirement benefits as a result oftheir involuntary termination.
(2) Includes net periodic (benefit) cost for pensions of $0 million, $0 million and ($18) million for 2013, 2012 and 2011, respectively, that have beenclassified as discontinued operations.
Prudential Financial, Inc. 2013 Annual Report 171

PRUDENTIAL FINANCIAL, INC.
Notes to Consolidated Financial Statements
18. EMPLOYEE BENEFIT PLANS (continued)
Changes in Accumulated Other Comprehensive Income
The amounts recorded in “Accumulated other comprehensive income (loss)” as of the end of the period, which have not yet beenrecognized as a component of net periodic (benefit) cost, and the related changes in these items during the period that are recognized in“Other Comprehensive Income” are as follows:
Pension BenefitsOther Postretirement
Benefits
TransitionObligation
PriorService
Cost
NetActuarial (Gain)
LossTransitionObligation
PriorService
Cost
NetActuarial (Gain)
Loss
(in millions)Balance, December 31, 2010 . . . . . . . . . . . . . . . . . . . . . . . . . . . . $0 $ 87 $1,674 $ 1 $(54) $ 622
Amortization for the period . . . . . . . . . . . . . . . . . . . . . . . . . . 0 (23) (40) (1) 12 (36)Deferrals for the period . . . . . . . . . . . . . . . . . . . . . . . . . . . . . 0 (72) 187 0 0 277Impact of foreign currency changes and other . . . . . . . . . . . 0 (1) (6) 1 0 (2)
Balance, December 31, 2011 . . . . . . . . . . . . . . . . . . . . . . . . . . . . 0 (9) 1,815 1 (42) 861
Amortization for the period . . . . . . . . . . . . . . . . . . . . . . . . . . 0 (13) (45) (1) 12 (54)Deferrals for the period . . . . . . . . . . . . . . . . . . . . . . . . . . . . . 0 (62) 810 0 0 81Impact of foreign currency changes and other . . . . . . . . . . . 0 3 (32) 0 0 5
Balance, December 31, 2012 . . . . . . . . . . . . . . . . . . . . . . . . . . . . 0 (81) 2,548 0 (30) 893
Amortization for the period . . . . . . . . . . . . . . . . . . . . . . . . . . 0 10 (91) 0 12 (56)Deferrals for the period . . . . . . . . . . . . . . . . . . . . . . . . . . . . . 0 2 (341) 0 0 (377)Impact of foreign currency changes and other . . . . . . . . . . . 0 13 (51) 0 (1) 3
Balance, December 31, 2013 . . . . . . . . . . . . . . . . . . . . . . . . . . . . $0 $(56) $2,065 $ 0 $(19) $ 463
The amounts included in “Accumulated other comprehensive income (loss)” expected to be recognized as components of net periodic(benefit) cost in 2014 are as follows:
PensionBenefits
OtherPostretirement
Benefits
(in millions)Amortization of prior service cost . . . . . . . . . . . . . . . . . . . . . . . . . . . . . . . . . . . . . . . . . . . . . . . . . . . . . . . . . . . . . $(10) $(11)Amortization of actuarial (gain) loss, net . . . . . . . . . . . . . . . . . . . . . . . . . . . . . . . . . . . . . . . . . . . . . . . . . . . . . . . . 86 25
Total . . . . . . . . . . . . . . . . . . . . . . . . . . . . . . . . . . . . . . . . . . . . . . . . . . . . . . . . . . . . . . . . . . . . . . . . . . . . . . . . $ 76 $ 14
The Company’s assumptions related to the calculation of the domestic benefit obligation (end of period) and the determination of netperiodic (benefit) cost (beginning of period) are presented in the table below:
Pension Benefits Other Postretirement Benefits
2013 2012 2011 2013 2012 2011
Weighted-average assumptionsDiscount rate (beginning of period) . . . . . . . . . . . . . . . . . . . . . . . . . . . . 4.05% 4.85% 5.60% 3.85% 4.60% 5.35%Discount rate (end of period) . . . . . . . . . . . . . . . . . . . . . . . . . . . . . . . . . 4.95% 4.05% 4.85% 4.75% 3.85% 4.60%Rate of increase in compensation levels (beginning of period) . . . . . . . 4.50% 4.50% 4.50% N/A N/A N/ARate of increase in compensation levels (end of period) . . . . . . . . . . . . 4.50% 4.50% 4.50% N/A N/A N/AExpected return on plan assets (beginning of period) . . . . . . . . . . . . . . . 6.25% 6.75% 7.00% 7.00% 7.00% 7.00%Health care cost trend rates (beginning of period) . . . . . . . . . . . . . . . . . N/A N/A N/A 5.00-7.50% 5.00-7.50% 5.00-7.50%Health care cost trend rates (end of period) . . . . . . . . . . . . . . . . . . . . . . N/A N/A N/A 5.00-7.08% 5.00-7.50% 5.00-7.50%For 2013, 2012 and 2011, the ultimate health care cost trend rate after
gradual decrease until: 2019, 2017, 2017, (beginning of period) . . . . N/A N/A N/A 5.00% 5.00% 5.00%For 2013, 2012 and 2011, the ultimate health care cost trend rate after
gradual decrease until: 2019, 2019, 2017 (end of period) . . . . . . . . . N/A N/A N/A 5.00% 5.00% 5.00%
The domestic discount rate used to value the pension and postretirement obligations at December 31, 2013 and December 31, 2012 isbased upon the value of a portfolio of Aa investments whose cash flows would be available to pay the benefit obligation’s cash flows whendue. The portfolio is selected from a compilation of approximately 515 Aa-rated bonds across the full range of maturities. Since yields canvary widely at each maturity point, the Company generally avoids using the highest and lowest yielding bonds at the maturity points, so as
172 Prudential Financial, Inc. 2013 Annual Report

PRUDENTIAL FINANCIAL, INC.
Notes to Consolidated Financial Statements
18. EMPLOYEE BENEFIT PLANS (continued)
to avoid relying on bonds that might be mispriced or misrated. This refinement process generally results in having a distribution from the10th to 90th percentile. The Aa portfolio is then selected and, accordingly, its value is a measure of the benefit obligation at December 31,2013 and December 31, 2012. A single equivalent discount rate is calculated to equate the value of the Aa portfolio to the cash flows forthe benefit obligation. The result is rounded to the nearest 5 basis points and the benefit obligation is recalculated using the roundeddiscount rate.
The pension and postretirement expected long-term rates of return on plan assets for 2013 were determined based upon an approachthat considered an expectation of the allocation of plan assets during the measurement period of 2013. Expected returns are estimated byasset class as noted in the discussion of investment policies and strategies below. Expected returns on asset classes are developed using abuilding-block approach that is forward looking and are not strictly based upon historical returns. The building blocks for equity returnsinclude inflation, real return, a term premium, an equity risk premium, capital appreciation, effect of active management, expenses and theeffect of rebalancing. The building blocks for fixed maturity returns include inflation, real return, a term premium, credit spread, capitalappreciation, effect of active management, expenses and the effect of rebalancing.
The Company applied the same approach to the determination of the expected rate of return on plan assets in 2014. The expected rateof return for 2014 is 6.25% and 7.00% for pension and postretirement, respectively.
The assumptions for foreign pension plans are based on local markets. There are no material foreign postretirement plans.
Assumed health care cost trend rates have a significant effect on the amounts reported for the health care plan. A one-percentage pointincrease and decrease in assumed health care cost trend rates would have the following effects:
Other PostretirementBenefits
(in millions)One percentage point increaseIncrease in total service and interest costs . . . . . . . . . . . . . . . . . . . . . . . . . . . . . . . . . . . . . . . . . . . . . . . . . . . . . . . . . . . . $ 8Increase in postretirement benefit obligation . . . . . . . . . . . . . . . . . . . . . . . . . . . . . . . . . . . . . . . . . . . . . . . . . . . . . . . . . . 151
One percentage point decreaseDecrease in total service and interest costs . . . . . . . . . . . . . . . . . . . . . . . . . . . . . . . . . . . . . . . . . . . . . . . . . . . . . . . . . . . . $ 6Decrease in postretirement benefit obligation . . . . . . . . . . . . . . . . . . . . . . . . . . . . . . . . . . . . . . . . . . . . . . . . . . . . . . . . . 121
Plan AssetsThe investment goal of the domestic pension plan assets is to generate an above benchmark return on a diversified portfolio of stocks,
bonds and other investments. The cash requirements of the pension obligation, which include a traditional formula principally representingpayments to annuitants and a cash balance formula that allows lump sum payments and annuity payments, are designed to be met by thebonds and short term investments in the portfolio. The pension plan risk management practices include guidelines for asset concentration,credit rating and liquidity. The pension plan does not invest in leveraged derivatives. Derivatives such as futures contracts are used toreduce transaction costs and change asset concentration, while interest rate swaps and futures are used to adjust duration.
The investment goal of the domestic postretirement plan assets is to generate an above benchmark return on a diversified portfolio ofstocks, bonds, and other investments, while meeting the cash requirements for the postretirement obligation that includes a medical benefitincluding prescription drugs, a dental benefit, and a life benefit. The postretirement plans risk management practices include guidelines forasset concentration, credit rating, liquidity, and tax efficiency. The postretirement plan does not invest in leveraged derivatives. Derivativessuch as futures contracts are used to reduce transaction costs and change asset concentration, while interest rate swaps and futures are usedto adjust duration.
The plan fiduciaries for the Company’s pension and postretirement plans have developed guidelines for asset allocations reflecting apercentage of total assets by asset class, which are reviewed on an annual basis. Asset allocation targets as of December 31, 2013 are asfollows:
Pension Postretirement
Minimum Maximum Minimum Maximum
Asset CategoryU.S. Equities . . . . . . . . . . . . . . . . . . . . . . . . . . . . . . . . . . . . . . . . . . . . . . . . . . . . . . . 4% 19% 42% 55%International Equities . . . . . . . . . . . . . . . . . . . . . . . . . . . . . . . . . . . . . . . . . . . . . . . . 4% 20% 1% 9%Fixed Maturities . . . . . . . . . . . . . . . . . . . . . . . . . . . . . . . . . . . . . . . . . . . . . . . . . . . . 51% 70% 1% 46%Short-term Investments . . . . . . . . . . . . . . . . . . . . . . . . . . . . . . . . . . . . . . . . . . . . . . . 0% 14% 0% 51%Real Estate . . . . . . . . . . . . . . . . . . . . . . . . . . . . . . . . . . . . . . . . . . . . . . . . . . . . . . . . . 2% 11% 0% 0%Other . . . . . . . . . . . . . . . . . . . . . . . . . . . . . . . . . . . . . . . . . . . . . . . . . . . . . . . . . . . . . 0% 14% 0% 0%
To implement the investment strategy, plan assets are invested in funds that primarily invest in securities that correspond to one of theasset categories under the investment guidelines. However, at any point in time, some of the assets in a fund may be of a different naturethan the specified asset category.
Prudential Financial, Inc. 2013 Annual Report 173

PRUDENTIAL FINANCIAL, INC.
Notes to Consolidated Financial Statements
18. EMPLOYEE BENEFIT PLANS (continued)
Assets held with Prudential Insurance are in either pooled separate accounts or single client separate accounts. Pooled separateaccounts hold assets for multiple investors. Each investor owns a “unit of account.” Single client separate accounts hold assets for only oneinvestor, the domestic qualified pension plan and each security in the fund is treated as individually owned. Assets held with a bank areeither in common/collective trusts or single client trusts. Common or collective trusts hold assets for more than one investor. Each investorowns a “unit of account.” Single client trusts hold assets for only one investor, the domestic qualified pension plan and each security in thefund is treated as individually owned.
There were no investments in Prudential Financial Common Stock as of December 31, 2013 and December 31, 2012 for either thepension or postretirement plans.
The authoritative guidance around fair value established a framework for measuring fair value. Fair value is disclosed using a fairvalue hierarchy that prioritizes the inputs to valuation techniques used to measure fair value, as described in Note 20.
The following describes the valuation methodologies used for pension and postretirement plans assets measured at fair value.
Insurance Company Pooled Separate Accounts, Common or Collective Trusts, and United Kingdom Insurance Pooled Funds—Insurance company pooled separate accounts are invested via group annuity contracts issued by Prudential Insurance. Assets arerepresented by a “unit of account.” The redemption value of those units is based on a per unit value whose value is the result of theaccumulated values of underlying investments. The underlying investments are valued in accordance with the corresponding valuationmethod for the investments held.
Equities—See Note 20 for a discussion of the valuation methodologies for equity securities.
U.S. Government Securities (both Federal and State & Other), Non–U.S. Government Securities, and Corporate Debt—See Note 20for a discussion of the valuation methodologies for fixed maturity securities.
Interest Rate Swaps—See Note 20 for a discussion of the valuation methodologies for derivative instruments.
Guaranteed Investment Contract—The value is based on contract cash flows and available market rates for similar investments.
Registered Investment Companies (Mutual Funds)—Securities are priced at the net asset value (“NAV”) of shares.
Unrealized Gain (Loss) on Investment of Securities Lending Collateral—This value is the contractual position relative to theinvestment of securities lending collateral.
Real Estate—The values are determined through an independent appraisal process. The estimate of fair value is based on threeapproaches; (1) current cost of reproducing the property less deterioration and functional/economic obsolescence; (2) discounting a seriesof income streams and reversion at a specific yield or by directly capitalizing a single year income estimate by an appropriate factor; and(3) value indicated by recent sales of comparable properties in the market. Each approach requires the exercise of subjective judgment.
Short-term Investments—Securities are valued initially at cost and thereafter adjusted for amortization of any discount or premium(i.e., amortized cost). Amortized cost approximates fair value.
Partnerships—The value of interests owned in partnerships is based on valuations of the underlying investments that include privateplacements, structured debt, real estate, equities, fixed maturities, commodities and other investments.
Hedge Funds—The value of interests in hedge funds is based on the underlying investments that include equities, debt and otherinvestments.
Variable Life Insurance Policies—These assets are held in group and individual variable life insurance policies issued by PrudentialInsurance. Group policies are invested in Insurance Company Pooled Separate Accounts. Individual policies are invested in RegisteredInvestment Companies (Mutual Funds). The value of interest in these policies is the cash surrender value of the policies based on theunderlying investments.
174 Prudential Financial, Inc. 2013 Annual Report

PRUDENTIAL FINANCIAL, INC.
Notes to Consolidated Financial Statements
18. EMPLOYEE BENEFIT PLANS (continued)
Pension plan asset allocations in accordance with the investment guidelines are as follows:
As of December 31, 2013
Level 1 Level 2 Level 3 Total
(in millions)U.S. Equities:
Pooled separate accounts(1) . . . . . . . . . . . . . . . . . . . . . . . . . . . . . . . . . . . . . . . . . . . . . . . . . . . . . . $ 0 $1,170 $ 0 $ 1,170
Common/collective trusts(1) . . . . . . . . . . . . . . . . . . . . . . . . . . . . . . . . . . . . . . . . . . . . . . . . . . . . . . 0 81 0 81
Subtotal . . . . . . . . . . . . . . . . . . . . . . . . . . . . . . . . . . . . . . . . . . . . . . . . . . . . . . . . . . . . . . 1,251
International Equities:
Pooled separate accounts(2) . . . . . . . . . . . . . . . . . . . . . . . . . . . . . . . . . . . . . . . . . . . . . . . . . . . . . . 0 349 0 349
Common/collective trusts(3) . . . . . . . . . . . . . . . . . . . . . . . . . . . . . . . . . . . . . . . . . . . . . . . . . . . . . . 0 40 0 40
United Kingdom insurance pooled funds(4) . . . . . . . . . . . . . . . . . . . . . . . . . . . . . . . . . . . . . . . . . . 0 50 0 50
Subtotal . . . . . . . . . . . . . . . . . . . . . . . . . . . . . . . . . . . . . . . . . . . . . . . . . . . . . . . . . . . . . . 439
Fixed Maturities:
Pooled separate accounts(5) . . . . . . . . . . . . . . . . . . . . . . . . . . . . . . . . . . . . . . . . . . . . . . . . . . . . . . 0 1,085 32 1,117
Common/collective trusts(6) . . . . . . . . . . . . . . . . . . . . . . . . . . . . . . . . . . . . . . . . . . . . . . . . . . . . . . 0 506 0 506
U.S. government securities (federal):
Mortgage-backed . . . . . . . . . . . . . . . . . . . . . . . . . . . . . . . . . . . . . . . . . . . . . . . . . . . . . . . . . . 0 2 0 2
Other U.S. government securities . . . . . . . . . . . . . . . . . . . . . . . . . . . . . . . . . . . . . . . . . . . . . . 0 1,005 0 1,005
U.S. government securities (state & other) . . . . . . . . . . . . . . . . . . . . . . . . . . . . . . . . . . . . . . . . . . . 0 636 0 636
Non-U.S. government securities . . . . . . . . . . . . . . . . . . . . . . . . . . . . . . . . . . . . . . . . . . . . . . . . . . . 0 17 0 17
United Kingdom insurance pooled funds(7) . . . . . . . . . . . . . . . . . . . . . . . . . . . . . . . . . . . . . . . . . . 0 266 0 266
Corporate Debt:
Corporate bonds(8) . . . . . . . . . . . . . . . . . . . . . . . . . . . . . . . . . . . . . . . . . . . . . . . . . . . . . . . . . 0 3,660 16 3,676
Asset-backed . . . . . . . . . . . . . . . . . . . . . . . . . . . . . . . . . . . . . . . . . . . . . . . . . . . . . . . . . . . . . . 0 24 0 24
Collateralized Mortgage Obligations(9) . . . . . . . . . . . . . . . . . . . . . . . . . . . . . . . . . . . . . . . . . 0 137 0 137
Interest rate swaps (Notional amount: $623) . . . . . . . . . . . . . . . . . . . . . . . . . . . . . . . . . . . . . . . . . 0 (3) 0 (3)
Guaranteed investment contract . . . . . . . . . . . . . . . . . . . . . . . . . . . . . . . . . . . . . . . . . . . . . . . . . . . 0 28 0 28
Other(10) . . . . . . . . . . . . . . . . . . . . . . . . . . . . . . . . . . . . . . . . . . . . . . . . . . . . . . . . . . . . . . . . . . . . . 717 0 66 783
Unrealized gain (loss) on investment of securities lending collateral(11) . . . . . . . . . . . . . . . . . . . 0 (39) 0 (39)
Subtotal . . . . . . . . . . . . . . . . . . . . . . . . . . . . . . . . . . . . . . . . . . . . . . . . . . . . . . . . . . . . . . 8,155
Short-term Investments:
Pooled separate accounts . . . . . . . . . . . . . . . . . . . . . . . . . . . . . . . . . . . . . . . . . . . . . . . . . . . . . . . . 0 78 0 78
United Kingdom insurance pooled funds . . . . . . . . . . . . . . . . . . . . . . . . . . . . . . . . . . . . . . . . . . . . 0 1 0 1
Subtotal . . . . . . . . . . . . . . . . . . . . . . . . . . . . . . . . . . . . . . . . . . . . . . . . . . . . . . . . . . . . . . 79
Real Estate:
Pooled separate accounts(12) . . . . . . . . . . . . . . . . . . . . . . . . . . . . . . . . . . . . . . . . . . . . . . . . . . . . . 0 0 356 356
Partnerships . . . . . . . . . . . . . . . . . . . . . . . . . . . . . . . . . . . . . . . . . . . . . . . . . . . . . . . . . . . . . . . . . . . 0 0 320 320
Subtotal . . . . . . . . . . . . . . . . . . . . . . . . . . . . . . . . . . . . . . . . . . . . . . . . . . . . . . . . . . . . . . 676
Other:
Partnerships . . . . . . . . . . . . . . . . . . . . . . . . . . . . . . . . . . . . . . . . . . . . . . . . . . . . . . . . . . . . . . . . . . . 0 0 374 374
Hedge funds . . . . . . . . . . . . . . . . . . . . . . . . . . . . . . . . . . . . . . . . . . . . . . . . . . . . . . . . . . . . . . . . . . 0 0 1,095 1,095
Subtotal . . . . . . . . . . . . . . . . . . . . . . . . . . . . . . . . . . . . . . . . . . . . . . . . . . . . . . . . . . . . . . 1,469
Total . . . . . . . . . . . . . . . . . . . . . . . . . . . . . . . . . . . . . . . . . . . . . . . . . . . . . . . . . . . . $717 $9,093 $2,259 $12,069
Prudential Financial, Inc. 2013 Annual Report 175

PRUDENTIAL FINANCIAL, INC.
Notes to Consolidated Financial Statements
18. EMPLOYEE BENEFIT PLANS (continued)As of December 31, 2012
Level 1 Level 2 Level 3 Total
(in millions)U.S. Equities:
Pooled separate accounts(1) . . . . . . . . . . . . . . . . . . . . . . . . . . . . . . . . . . . . . . . . . . . . . . . . . . . . . . . . . . . . . . . . $ 0 $ 1,143 $ 0 $ 1,143Common/collective trusts(1) . . . . . . . . . . . . . . . . . . . . . . . . . . . . . . . . . . . . . . . . . . . . . . . . . . . . . . . . . . . . . . . 0 82 0 82
Subtotal . . . . . . . . . . . . . . . . . . . . . . . . . . . . . . . . . . . . . . . . . . . . . . . . . . . . . . . . . . . . . . . . . . . . . . . . 1,225International Equities:
Pooled separate accounts(2) . . . . . . . . . . . . . . . . . . . . . . . . . . . . . . . . . . . . . . . . . . . . . . . . . . . . . . . . . . . . . . . . 0 278 0 278Common/collective trusts(3) . . . . . . . . . . . . . . . . . . . . . . . . . . . . . . . . . . . . . . . . . . . . . . . . . . . . . . . . . . . . . . . 0 103 0 103United Kingdom insurance pooled funds(4) . . . . . . . . . . . . . . . . . . . . . . . . . . . . . . . . . . . . . . . . . . . . . . . . . . . 0 69 0 69
Subtotal . . . . . . . . . . . . . . . . . . . . . . . . . . . . . . . . . . . . . . . . . . . . . . . . . . . . . . . . . . . . . . . . . . . . . . . . 450
Fixed Maturities:Pooled separate accounts(5) . . . . . . . . . . . . . . . . . . . . . . . . . . . . . . . . . . . . . . . . . . . . . . . . . . . . . . . . . . . . . . . . 0 1,076 32 1,108Common/collective trusts(6) . . . . . . . . . . . . . . . . . . . . . . . . . . . . . . . . . . . . . . . . . . . . . . . . . . . . . . . . . . . . . . . 0 567 0 567U.S. government securities (federal):
Mortgage-backed . . . . . . . . . . . . . . . . . . . . . . . . . . . . . . . . . . . . . . . . . . . . . . . . . . . . . . . . . . . . . . . . . . . . 0 3 0 3Other U.S. government securities . . . . . . . . . . . . . . . . . . . . . . . . . . . . . . . . . . . . . . . . . . . . . . . . . . . . . . . . 0 1,154 0 1,154
U.S. government securities (state & other) . . . . . . . . . . . . . . . . . . . . . . . . . . . . . . . . . . . . . . . . . . . . . . . . . . . . 0 747 0 747Non-U.S. government securities . . . . . . . . . . . . . . . . . . . . . . . . . . . . . . . . . . . . . . . . . . . . . . . . . . . . . . . . . . . . 0 14 0 14United Kingdom insurance pooled funds(7) . . . . . . . . . . . . . . . . . . . . . . . . . . . . . . . . . . . . . . . . . . . . . . . . . . . 0 221 0 221Corporate Debt:
Corporate bonds(8) . . . . . . . . . . . . . . . . . . . . . . . . . . . . . . . . . . . . . . . . . . . . . . . . . . . . . . . . . . . . . . . . . . . 0 3,882 12 3,894Asset-backed . . . . . . . . . . . . . . . . . . . . . . . . . . . . . . . . . . . . . . . . . . . . . . . . . . . . . . . . . . . . . . . . . . . . . . . 0 17 0 17Collateralized Mortgage Obligations(9) . . . . . . . . . . . . . . . . . . . . . . . . . . . . . . . . . . . . . . . . . . . . . . . . . . . 0 293 0 293
Interest rate swaps (Notional amount: $978) . . . . . . . . . . . . . . . . . . . . . . . . . . . . . . . . . . . . . . . . . . . . . . . . . . . 0 (4) 0 (4)Guaranteed investment contract . . . . . . . . . . . . . . . . . . . . . . . . . . . . . . . . . . . . . . . . . . . . . . . . . . . . . . . . . . . . . 0 22 0 22Other(10) . . . . . . . . . . . . . . . . . . . . . . . . . . . . . . . . . . . . . . . . . . . . . . . . . . . . . . . . . . . . . . . . . . . . . . . . . . . . . . 735 (4) 58 789Unrealized gain (loss) on investment of securities lending collateral(13) . . . . . . . . . . . . . . . . . . . . . . . . . . . . . 0 (44) 0 (44)
Subtotal . . . . . . . . . . . . . . . . . . . . . . . . . . . . . . . . . . . . . . . . . . . . . . . . . . . . . . . . . . . . . . . . . . . . . . . . 8,781
Short-term Investments:Pooled separate accounts . . . . . . . . . . . . . . . . . . . . . . . . . . . . . . . . . . . . . . . . . . . . . . . . . . . . . . . . . . . . . . . . . . 0 418 0 418United Kingdom insurance pooled funds . . . . . . . . . . . . . . . . . . . . . . . . . . . . . . . . . . . . . . . . . . . . . . . . . . . . . . 0 0 0 0
Subtotal . . . . . . . . . . . . . . . . . . . . . . . . . . . . . . . . . . . . . . . . . . . . . . . . . . . . . . . . . . . . . . . . . . . . . . . . 418
Real Estate:Pooled separate accounts(12) . . . . . . . . . . . . . . . . . . . . . . . . . . . . . . . . . . . . . . . . . . . . . . . . . . . . . . . . . . . . . . . 0 0 322 322Partnerships . . . . . . . . . . . . . . . . . . . . . . . . . . . . . . . . . . . . . . . . . . . . . . . . . . . . . . . . . . . . . . . . . . . . . . . . . . . . 0 0 185 185
Subtotal . . . . . . . . . . . . . . . . . . . . . . . . . . . . . . . . . . . . . . . . . . . . . . . . . . . . . . . . . . . . . . . . . . . . . . . . 507
Other:Partnerships . . . . . . . . . . . . . . . . . . . . . . . . . . . . . . . . . . . . . . . . . . . . . . . . . . . . . . . . . . . . . . . . . . . . . . . . . . . . 0 0 598 598Hedge funds . . . . . . . . . . . . . . . . . . . . . . . . . . . . . . . . . . . . . . . . . . . . . . . . . . . . . . . . . . . . . . . . . . . . . . . . . . . . 0 0 707 707
Subtotal . . . . . . . . . . . . . . . . . . . . . . . . . . . . . . . . . . . . . . . . . . . . . . . . . . . . . . . . . . . . . . . . . . . . . . . . 1,305
Total . . . . . . . . . . . . . . . . . . . . . . . . . . . . . . . . . . . . . . . . . . . . . . . . . . . . . . . . . . . . . . . . . . . . . . $735 $10,037 $1,914 $12,686
(1) These categories invest in U.S. equity funds whose objective is to track or outperform various indexes.(2) This category invests in a large cap international equity funds whose objective is to track an index.(3) This category invests in international equity funds, primarily large cap, whose objective is to outperform various indexes.(4) This category invests in an international equity fund whose objective is to track an index.(5) This category invests in bond funds, primarily highly rated private placement securities.(6) This category invests in bond funds, primarily highly rated public securities whose objective is to outperform an index.(7) This category invests in bond funds, primarily highly rated corporate securities.(8) This category invests in highly rated corporate securities.(9) This category invests in highly rated Collateralized Mortgage Obligations.(10) Primarily cash and cash equivalents, short term investments, payables and receivables, and open future contract positions (including fixed income
collateral).(11) The contractual net value of the investment of securities lending collateral invested in primarily short-term bond funds is $701 million and the liability
for securities lending collateral is $740 million.(12) This category invests in commercial real estate and real estate securities funds, whose objective is to outperform an index.(13) The contractual net value of the investment of securities lending collateral invested in primarily short-term bond funds is $682 million and the liability
for securities lending collateral is $726 million.
176 Prudential Financial, Inc. 2013 Annual Report

PRUDENTIAL FINANCIAL, INC.
Notes to Consolidated Financial Statements
18. EMPLOYEE BENEFIT PLANS (continued)
Changes in Fair Value of Level 3 Pension Assets
Year Ended December 31, 2013
FixedMaturities–
PooledSeparateAccounts
FixedMaturities–
Corporate Debt–Corporate
Bonds
FixedMaturities–
Other
Real Estate–Pooled
SeparateAccounts
(in millions)Fair Value, beginning of period . . . . . . . . . . . . . . . . . . . . . . . . . . . . . . . . . . . . . . . . $32 $12 $58 $322
Actual Return on Assets:Relating to assets still held at the reporting date . . . . . . . . . . . . . . . . . . . . . 0 0 0 46Relating to assets sold during the period . . . . . . . . . . . . . . . . . . . . . . . . . 0 0 0 0
Purchases, sales and settlements . . . . . . . . . . . . . . . . . . . . . . . . . . . . . . . . . . . . 0 4 8 (12)Transfers in and /or out of Level 3 . . . . . . . . . . . . . . . . . . . . . . . . . . . . . . . . . . 0 0 0 0
Fair Value, end of period . . . . . . . . . . . . . . . . . . . . . . . . . . . . . . . . . . . . . . . . . . . . . $32 $16 $66 $356
Year Ended December 31, 2013
Real Estate–Partnerships
Other–Partnerships
Other–HedgeFund
(in millions)Fair Value, beginning of period . . . . . . . . . . . . . . . . . . . . . . . . . . . . . . . . . . . . . . . . . . . . . . . . . . . . . . . . $185 $ 598 $ 707
Actual Return on Assets:Relating to assets still held at the reporting date . . . . . . . . . . . . . . . . . . . . . . . . . . . . . . . . . . . 35 48 106Relating to assets sold during the period . . . . . . . . . . . . . . . . . . . . . . . . . . . . . . . . . . . . . . . . . 0 0 4
Purchases, sales and settlements . . . . . . . . . . . . . . . . . . . . . . . . . . . . . . . . . . . . . . . . . . . . . . . . . . . 100 7 (1)Transfers in and /or out of Level 3(1) . . . . . . . . . . . . . . . . . . . . . . . . . . . . . . . . . . . . . . . . . . . . . . . 0 (279) 279
Fair Value, end of period . . . . . . . . . . . . . . . . . . . . . . . . . . . . . . . . . . . . . . . . . . . . . . . . . . . . . . . . . . . . . $320 $ 374 $1,095
Year Ended December 31, 2012
FixedMaturities–
PooledSeparateAccounts
FixedMaturities–Corporate
Debt–Corporate
Bonds
FixedMaturities–
Other
Real Estate–Pooled
SeparateAccounts
(in millions)Fair Value, beginning of period . . . . . . . . . . . . . . . . . . . . . . . . . . . . . . . . . . . . . . . . . . . $20 $12 $62 $318
Actual Return on Assets:Relating to assets still held at the reporting date . . . . . . . . . . . . . . . . . . . . . . . . 2 (1) 0 40Relating to assets sold during the period . . . . . . . . . . . . . . . . . . . . . . . . . . . . 0 0 0 (1)
Purchases, sales and settlements . . . . . . . . . . . . . . . . . . . . . . . . . . . . . . . . . . . . . . . 10 0 (4) (35)Transfers in and /or out of Level 3 . . . . . . . . . . . . . . . . . . . . . . . . . . . . . . . . . . . . . 0 1 0 0
Fair Value, end of period . . . . . . . . . . . . . . . . . . . . . . . . . . . . . . . . . . . . . . . . . . . . . . . . $32 $12 $58 $322
Year Ended December 31, 2012
Real Estate–Partnerships
Other–Partnerships
Other–HedgeFund
(in millions)Fair Value, beginning of period . . . . . . . . . . . . . . . . . . . . . . . . . . . . . . . . . . . . . . . . . . . . . . . . . . . . . . . . . . . . . $105 $552 $678
Actual Return on Assets:Relating to assets still held at the reporting date . . . . . . . . . . . . . . . . . . . . . . . . . . . . . . . . . . . . . . . . 5 32 57Relating to assets sold during the period . . . . . . . . . . . . . . . . . . . . . . . . . . . . . . . . . . . . . . . . . . . . . . 0 0 0
Purchases, sales and settlements . . . . . . . . . . . . . . . . . . . . . . . . . . . . . . . . . . . . . . . . . . . . . . . . . . . . . . . . 75 14 (28)Transfers in and /or out of Level 3 . . . . . . . . . . . . . . . . . . . . . . . . . . . . . . . . . . . . . . . . . . . . . . . . . . . . . . . 0 0 0
Fair Value, end of period . . . . . . . . . . . . . . . . . . . . . . . . . . . . . . . . . . . . . . . . . . . . . . . . . . . . . . . . . . . . . . . . . . $185 $598 $707
(1) The transfers in and out of Level 3 represent a reclassification of certain fund assets from Partnerships to Hedge Funds.
Prudential Financial, Inc. 2013 Annual Report 177

PRUDENTIAL FINANCIAL, INC.
Notes to Consolidated Financial Statements
18. EMPLOYEE BENEFIT PLANS (continued)
Postretirement plan asset allocations in accordance with the investment guidelines are as follows:
As of December 31, 2013
Level 1 Level 2 Level 3 Total
(in millions)U.S. Equities:
Variable Life Insurance Policies(1) . . . . . . . . . . . . . . . . . . . . . . . . . . . . . . . . . . . . . . . . . . . . $ 0 $ 634 $ 0 $ 634Common trusts(2) . . . . . . . . . . . . . . . . . . . . . . . . . . . . . . . . . . . . . . . . . . . . . . . . . . . . . . . . . . 0 136 0 136Equities . . . . . . . . . . . . . . . . . . . . . . . . . . . . . . . . . . . . . . . . . . . . . . . . . . . . . . . . . . . . . . . . . . 110 0 0 110
Subtotal . . . . . . . . . . . . . . . . . . . . . . . . . . . . . . . . . . . . . . . . . . . . . . . . . . . . . . . . . . 880
International Equities:Variable Life Insurance Policies(3) . . . . . . . . . . . . . . . . . . . . . . . . . . . . . . . . . . . . . . . . . . . . 0 64 0 64Common trusts(4) . . . . . . . . . . . . . . . . . . . . . . . . . . . . . . . . . . . . . . . . . . . . . . . . . . . . . . . . . . 0 23 0 23
Subtotal . . . . . . . . . . . . . . . . . . . . . . . . . . . . . . . . . . . . . . . . . . . . . . . . . . . . . . . . . . 87
Fixed Maturities:Common trusts(5) . . . . . . . . . . . . . . . . . . . . . . . . . . . . . . . . . . . . . . . . . . . . . . . . . . . . . . . . . . 0 29 0 29U.S. government securities (federal):
Mortgage-Backed . . . . . . . . . . . . . . . . . . . . . . . . . . . . . . . . . . . . . . . . . . . . . . . . . . 0 7 0 7Other U.S. government securities . . . . . . . . . . . . . . . . . . . . . . . . . . . . . . . . . . . . . . 0 289 0 289
U.S. government securities (state & other) . . . . . . . . . . . . . . . . . . . . . . . . . . . . . . . . . . . . . . . 0 3 0 3Non-U.S. government securities . . . . . . . . . . . . . . . . . . . . . . . . . . . . . . . . . . . . . . . . . . . . . . . 0 4 0 4Corporate Debt:
Corporate bonds(6) . . . . . . . . . . . . . . . . . . . . . . . . . . . . . . . . . . . . . . . . . . . . . . . . . . . . . 0 235 1 236Asset-Backed . . . . . . . . . . . . . . . . . . . . . . . . . . . . . . . . . . . . . . . . . . . . . . . . . . . . . . . . . 0 56 5 61Collateralized Mortgage Obligations(7) . . . . . . . . . . . . . . . . . . . . . . . . . . . . . . . . . . . . . 0 35 0 35
Interest rate swaps (Notional amount: $861) . . . . . . . . . . . . . . . . . . . . . . . . . . . . . . . . . . . . . 0 (7) 0 (7)Other(8) . . . . . . . . . . . . . . . . . . . . . . . . . . . . . . . . . . . . . . . . . . . . . . . . . . . . . . . . . . . . . . . . . . 74 0 (6) 68Unrealized gain (loss) on investment of securities lending collateral(9) . . . . . . . . . . . . . . . . 0 0 0 0
Subtotal . . . . . . . . . . . . . . . . . . . . . . . . . . . . . . . . . . . . . . . . . . . . . . . . . . . . . . . . . . 725
Short-term Investments:Variable Life Insurance Policies . . . . . . . . . . . . . . . . . . . . . . . . . . . . . . . . . . . . . . . . . . . . . . . 0 0 0 0Registered investment companies . . . . . . . . . . . . . . . . . . . . . . . . . . . . . . . . . . . . . . . . . . . . . . 53 0 0 53
Subtotal . . . . . . . . . . . . . . . . . . . . . . . . . . . . . . . . . . . . . . . . . . . . . . . . . . . . . . . . . . 53
Total . . . . . . . . . . . . . . . . . . . . . . . . . . . . . . . . . . . . . . . . . . . . . . . . . . . . . . . . $237 $1,508 $ 0 $1,745
178 Prudential Financial, Inc. 2013 Annual Report

PRUDENTIAL FINANCIAL, INC.
Notes to Consolidated Financial Statements
18. EMPLOYEE BENEFIT PLANS (continued)As of December 31, 2012
Level 1 Level 2 Level 3 Total
(in millions)U.S. Equities:
Variable Life Insurance Policies(1) . . . . . . . . . . . . . . . . . . . . . . . . . . . . . . . . . . . . . . . . . . . . $ 0 $ 493 $ 0 $ 493Common trusts(2) . . . . . . . . . . . . . . . . . . . . . . . . . . . . . . . . . . . . . . . . . . . . . . . . . . . . . . . . . . 0 100 0 100Equities . . . . . . . . . . . . . . . . . . . . . . . . . . . . . . . . . . . . . . . . . . . . . . . . . . . . . . . . . . . . . . . . . . 104 0 0 104
Subtotal . . . . . . . . . . . . . . . . . . . . . . . . . . . . . . . . . . . . . . . . . . . . . . . . . . . . . . . . . . 697
International Equities:Variable Life Insurance Policies(3) . . . . . . . . . . . . . . . . . . . . . . . . . . . . . . . . . . . . . . . . . . . . 0 52 0 52Common trusts(4) . . . . . . . . . . . . . . . . . . . . . . . . . . . . . . . . . . . . . . . . . . . . . . . . . . . . . . . . . . 0 18 0 18
Subtotal . . . . . . . . . . . . . . . . . . . . . . . . . . . . . . . . . . . . . . . . . . . . . . . . . . . . . . . . . . 70
Fixed Maturities:Common trusts(5) . . . . . . . . . . . . . . . . . . . . . . . . . . . . . . . . . . . . . . . . . . . . . . . . . . . . . . . . . . 0 29 0 29U.S. government securities (federal):
Mortgage-Backed . . . . . . . . . . . . . . . . . . . . . . . . . . . . . . . . . . . . . . . . . . . . . . . . . . 0 12 0 12Other U.S. government securities . . . . . . . . . . . . . . . . . . . . . . . . . . . . . . . . . . . . . . 0 138 0 138
U.S. government securities (state & other) . . . . . . . . . . . . . . . . . . . . . . . . . . . . . . . . . . . . . . . 0 3 0 3Non-U.S. government securities . . . . . . . . . . . . . . . . . . . . . . . . . . . . . . . . . . . . . . . . . . . . . . . 0 8 0 8Corporate Debt:
Corporate bonds(6) . . . . . . . . . . . . . . . . . . . . . . . . . . . . . . . . . . . . . . . . . . . . . . . . . . . . . 0 195 2 197Asset-Backed . . . . . . . . . . . . . . . . . . . . . . . . . . . . . . . . . . . . . . . . . . . . . . . . . . . . . . . . . 0 57 0 57Collateralized Mortgage Obligations(7) . . . . . . . . . . . . . . . . . . . . . . . . . . . . . . . . . . . . . 0 70 0 70
Interest rate swaps (Notional amount: $681) . . . . . . . . . . . . . . . . . . . . . . . . . . . . . . . . . . . . . 0 (8) 0 (8)Other(8) . . . . . . . . . . . . . . . . . . . . . . . . . . . . . . . . . . . . . . . . . . . . . . . . . . . . . . . . . . . . . . . . . . 47 0 (4) 43Unrealized gain (loss) on investment of securities lending collateral(10) . . . . . . . . . . . . . . . 0 0 0 0
Subtotal . . . . . . . . . . . . . . . . . . . . . . . . . . . . . . . . . . . . . . . . . . . . . . . . . . . . . . . . . . 549
Short-term Investments:Variable Life Insurance Policies . . . . . . . . . . . . . . . . . . . . . . . . . . . . . . . . . . . . . . . . . . . . . . . 0 1 0 1Registered investment companies . . . . . . . . . . . . . . . . . . . . . . . . . . . . . . . . . . . . . . . . . . . . . . 12 0 0 12
Subtotal . . . . . . . . . . . . . . . . . . . . . . . . . . . . . . . . . . . . . . . . . . . . . . . . . . . . . . . . . . 13
Total . . . . . . . . . . . . . . . . . . . . . . . . . . . . . . . . . . . . . . . . . . . . . . . . . . . . . . . . $163 $1,168 $(2) $1,329
(1) This category invests in U.S. equity funds, primarily large cap equities whose objective is to track an index via pooled separate accounts and registeredinvestment companies.
(2) This category invests in U.S. equity funds, primarily large cap equities.(3) This category invests in international equity funds, primarily large cap international equities whose objective is to track an index.(4) This category fund invests in large cap international equity fund whose objective is to outperform an index.(5) This category invests in U.S. bonds funds.(6) This category invests in highly rated corporate bonds.(7) This category invests in highly rated Collateralized Mortgage Obligations.(8) Cash and cash equivalents, short term investments, payables and receivables and open future contract positions (including fixed income collateral).(9) In 2013 the contractual net value of the investment of securities lending collateral invested in primarily short-term bond funds is $16 million and the
liability for securities lending collateral is $16 million.(10) In 2012 the contractual net value of the investment of securities lending collateral invested in primarily short-term bond funds is $44 million and the
liability for securities lending collateral is $44 million.
Prudential Financial, Inc. 2013 Annual Report 179

PRUDENTIAL FINANCIAL, INC.
Notes to Consolidated Financial Statements
18. EMPLOYEE BENEFIT PLANS (continued)
Changes in Fair Value of Level 3 Postretirement Assets
Year Ended December 31, 2013
FixedMaturities–
Corporate Debt–Corporate
Bonds
FixedMaturities–
Corporate Debt–Asset
Backed
FixedMaturities–
Other
(in millions)Fair Value, beginning of period . . . . . . . . . . . . . . . . . . . . . . . . . . . . . . . . . . . . . . . . . . . . . . . . . . . . . . $ 2 $0 $(4)
Actual Return on Assets:Relating to assets still held at the reporting date . . . . . . . . . . . . . . . . . . . . . . . . . . . . . . . . . 0 0 0Relating to assets sold during the period . . . . . . . . . . . . . . . . . . . . . . . . . . . . . . . . . . . . . . . 0 0 0
Purchases, sales and settlements . . . . . . . . . . . . . . . . . . . . . . . . . . . . . . . . . . . . . . . . . . . . . . . . . (1) 5 (2)Transfers in and /or out of Level 3 . . . . . . . . . . . . . . . . . . . . . . . . . . . . . . . . . . . . . . . . . . . . . . . . 0 0 0
Fair Value, end of period . . . . . . . . . . . . . . . . . . . . . . . . . . . . . . . . . . . . . . . . . . . . . . . . . . . . . . . . . . . $ 1 $5 $(6)
Year Ended December 31, 2012
FixedMaturities–
Corporate Debt–Corporate
Bonds
FixedMaturities–
Other
(in millions)Fair Value, beginning of period . . . . . . . . . . . . . . . . . . . . . . . . . . . . . . . . . . . . . . . . . . . . . . . . . . . . . . . . . . . . . . . . . . . . . . . $2 $ 2
Actual Return on Assets:Relating to assets still held at the reporting date . . . . . . . . . . . . . . . . . . . . . . . . . . . . . . . . . . . . . . . . . . . . . . . . . . 0 0Relating to assets sold during the period . . . . . . . . . . . . . . . . . . . . . . . . . . . . . . . . . . . . . . . . . . . . . . . . . . . . . . . . 0 0
Purchases, sales and settlements . . . . . . . . . . . . . . . . . . . . . . . . . . . . . . . . . . . . . . . . . . . . . . . . . . . . . . . . . . . . . . . . . . 0 (6)Transfers in and /or out of Level 3 . . . . . . . . . . . . . . . . . . . . . . . . . . . . . . . . . . . . . . . . . . . . . . . . . . . . . . . . . . . . . . . . . 0 0
Fair Value, end of period . . . . . . . . . . . . . . . . . . . . . . . . . . . . . . . . . . . . . . . . . . . . . . . . . . . . . . . . . . . . . . . . . . . . . . . . . . . . $2 $(4)
A summary of pension and postretirement plan asset allocation as of the year ended December 31, are as follows:
Pension Percentage of Plan AssetsPostretirement Percentage of Plan
Assets
2013 2012 2013 2012
Asset CategoryU.S. Equities . . . . . . . . . . . . . . . . . . . . . . . . . . . . . . . . . . . . . . . . . 10% 10% 50% 52%International Equities . . . . . . . . . . . . . . . . . . . . . . . . . . . . . . . . . . . 4 4 5 5Fixed Maturities . . . . . . . . . . . . . . . . . . . . . . . . . . . . . . . . . . . . . . . 67 69 39 40Short-term Investments . . . . . . . . . . . . . . . . . . . . . . . . . . . . . . . . . 1 3 6 3Real Estate . . . . . . . . . . . . . . . . . . . . . . . . . . . . . . . . . . . . . . . . . . . 6 4 0 0Other . . . . . . . . . . . . . . . . . . . . . . . . . . . . . . . . . . . . . . . . . . . . . . . 12 10 0 0
Total . . . . . . . . . . . . . . . . . . . . . . . . . . . . . . . . . . . . . . . . . . . . . . . . 100% 100% 100% 100%
The expected benefit payments for the Company’s pension and postretirement plans, as well as the expected Medicare Part D subsidyreceipts related to the Company’s postretirement plan, for the years indicated are as follows:
Pension BenefitPayments
OtherPostretirement
Benefit Payments
OtherPostretirement
Benefits–Medicare Part
D SubsidyReceipts
(in millions)2014 . . . . . . . . . . . . . . . . . . . . . . . . . . . . . . . . . . . . . . . . . . . . . . . . . . . . . . . . . . . . . . . . . . . . . . . . . $ 617 $ 186 $ 152015 . . . . . . . . . . . . . . . . . . . . . . . . . . . . . . . . . . . . . . . . . . . . . . . . . . . . . . . . . . . . . . . . . . . . . . . . . 627 185 152016 . . . . . . . . . . . . . . . . . . . . . . . . . . . . . . . . . . . . . . . . . . . . . . . . . . . . . . . . . . . . . . . . . . . . . . . . . 648 184 162017 . . . . . . . . . . . . . . . . . . . . . . . . . . . . . . . . . . . . . . . . . . . . . . . . . . . . . . . . . . . . . . . . . . . . . . . . . 665 183 162018 . . . . . . . . . . . . . . . . . . . . . . . . . . . . . . . . . . . . . . . . . . . . . . . . . . . . . . . . . . . . . . . . . . . . . . . . . 687 182 162019-2023 . . . . . . . . . . . . . . . . . . . . . . . . . . . . . . . . . . . . . . . . . . . . . . . . . . . . . . . . . . . . . . . . . . . . 3,754 872 82
Total . . . . . . . . . . . . . . . . . . . . . . . . . . . . . . . . . . . . . . . . . . . . . . . . . . . . . . . . . . . . . . . . . . . . . . . . . $6,998 $1,792 $160
180 Prudential Financial, Inc. 2013 Annual Report

PRUDENTIAL FINANCIAL, INC.
Notes to Consolidated Financial Statements
18. EMPLOYEE BENEFIT PLANS (continued)
The Company anticipates that it will make cash contributions in 2014 of approximately $130 million to the pension plans andapproximately $10 million to the postretirement plans.
Postemployment Benefits
The Company accrues postemployment benefits for income continuance and health and life benefits provided to former or inactiveemployees who are not retirees. The net accumulated liability for these benefits at December 31, 2013 and 2012 was $68 million and $41million, respectively, and is included in “Other liabilities.”
Other Employee Benefits
The Company sponsors voluntary savings plans for employees (401(k) plans). The plans provide for salary reduction contributions byemployees and matching contributions by the Company of up to 4% of annual salary. The matching contributions by the Companyincluded in “General and administrative expenses” were $57 million, $54 million and $54 million for the years ended December 31, 2013,2012 and 2011, respectively.
19. INCOME TAXES
The components of income tax expense (benefit) for the years ended December 31 were as follows:
2013 2012 2011
(in millions)Current tax expense (benefit)
U.S. . . . . . . . . . . . . . . . . . . . . . . . . . . . . . . . . . . . . . . . . . . . . . . . . . . . . . . . . . . . . . . . . . . . . . . . . . . . . . . . . . . . . . . . . . . . . . $ (292) $ 674 $ 73State and local . . . . . . . . . . . . . . . . . . . . . . . . . . . . . . . . . . . . . . . . . . . . . . . . . . . . . . . . . . . . . . . . . . . . . . . . . . . . . . . . . . . . . 16 27 2Foreign . . . . . . . . . . . . . . . . . . . . . . . . . . . . . . . . . . . . . . . . . . . . . . . . . . . . . . . . . . . . . . . . . . . . . . . . . . . . . . . . . . . . . . . . . . . 310 387 372
Total . . . . . . . . . . . . . . . . . . . . . . . . . . . . . . . . . . . . . . . . . . . . . . . . . . . . . . . . . . . . . . . . . . . . . . . . . . . . . . . . . . . . . . . . . . . . . 34 1,088 447
Deferred tax expense (benefit)U.S. . . . . . . . . . . . . . . . . . . . . . . . . . . . . . . . . . . . . . . . . . . . . . . . . . . . . . . . . . . . . . . . . . . . . . . . . . . . . . . . . . . . . . . . . . . . . . 44 (437) 771State and local . . . . . . . . . . . . . . . . . . . . . . . . . . . . . . . . . . . . . . . . . . . . . . . . . . . . . . . . . . . . . . . . . . . . . . . . . . . . . . . . . . . . . 0 (5) 12Foreign . . . . . . . . . . . . . . . . . . . . . . . . . . . . . . . . . . . . . . . . . . . . . . . . . . . . . . . . . . . . . . . . . . . . . . . . . . . . . . . . . . . . . . . . . . . (1,136) (433) 285
Total . . . . . . . . . . . . . . . . . . . . . . . . . . . . . . . . . . . . . . . . . . . . . . . . . . . . . . . . . . . . . . . . . . . . . . . . . . . . . . . . . . . . . . . . . . . . . (1,092) (875) 1,068
Total income tax expense (benefit) on continuing operations before equity in earnings of operating joint ventures . . . . . . . . . . . (1,058) 213 1,515Income tax expense on equity in earnings of operating joint ventures . . . . . . . . . . . . . . . . . . . . . . . . . . . . . . . . . . . . . . . . . . . . . . 19 19 79Income tax expense on discontinued operations . . . . . . . . . . . . . . . . . . . . . . . . . . . . . . . . . . . . . . . . . . . . . . . . . . . . . . . . . . . . . . . 3 8 18Income tax expense (benefit) reported in equity related to:
Other comprehensive income . . . . . . . . . . . . . . . . . . . . . . . . . . . . . . . . . . . . . . . . . . . . . . . . . . . . . . . . . . . . . . . . . . . . . . . . . (582) 2,667 1,301Stock-based compensation programs . . . . . . . . . . . . . . . . . . . . . . . . . . . . . . . . . . . . . . . . . . . . . . . . . . . . . . . . . . . . . . . . . . . (32) (56) (19)
Total income taxes . . . . . . . . . . . . . . . . . . . . . . . . . . . . . . . . . . . . . . . . . . . . . . . . . . . . . . . . . . . . . . . . . . . . . . . . . . . . . . . . . . . . . . $(1,650) $2,851 $2,894
The Company’s actual income tax expense on continuing operations before equity in earnings of operating joint ventures for the yearsended December 31 differs from the expected amount computed by applying the statutory federal income tax rate of 35% to income fromcontinuing operations before income taxes and equity in earnings of operating joint ventures for the following reasons:
2013 2012 2011
(in millions)Expected federal income tax expense (benefit) . . . . . . . . . . . . . . . . . . . . . . . . . . . . . . . . . . . . . . . . . . . . . . . . . . . . . . . . . . . . . . . . . $ (589) $ 248 $1,737Non-taxable investment income . . . . . . . . . . . . . . . . . . . . . . . . . . . . . . . . . . . . . . . . . . . . . . . . . . . . . . . . . . . . . . . . . . . . . . . . . . . . (319) (302) (247)Low income housing and other tax credits . . . . . . . . . . . . . . . . . . . . . . . . . . . . . . . . . . . . . . . . . . . . . . . . . . . . . . . . . . . . . . . . . . . . (105) (78) (80)Reversal of acquisition opening balance sheet deferred tax items . . . . . . . . . . . . . . . . . . . . . . . . . . . . . . . . . . . . . . . . . . . . . . . . . . 55 384 221Medicare Part D . . . . . . . . . . . . . . . . . . . . . . . . . . . . . . . . . . . . . . . . . . . . . . . . . . . . . . . . . . . . . . . . . . . . . . . . . . . . . . . . . . . . . . . . (43) (1) (2)Minority interest . . . . . . . . . . . . . . . . . . . . . . . . . . . . . . . . . . . . . . . . . . . . . . . . . . . . . . . . . . . . . . . . . . . . . . . . . . . . . . . . . . . . . . . . (37) (17) (11)Foreign taxes at other than U.S. rate . . . . . . . . . . . . . . . . . . . . . . . . . . . . . . . . . . . . . . . . . . . . . . . . . . . . . . . . . . . . . . . . . . . . . . . . . (36) (51) (37)State taxes . . . . . . . . . . . . . . . . . . . . . . . . . . . . . . . . . . . . . . . . . . . . . . . . . . . . . . . . . . . . . . . . . . . . . . . . . . . . . . . . . . . . . . . . . . . . . 10 15 0Other . . . . . . . . . . . . . . . . . . . . . . . . . . . . . . . . . . . . . . . . . . . . . . . . . . . . . . . . . . . . . . . . . . . . . . . . . . . . . . . . . . . . . . . . . . . . . . . . . 6 15 (66)
Total income tax expense (benefit) on continuing operations before equity in earnings of operating joint ventures . . . . . . . $(1,058) $ 213 $1,515
The dividends received deduction (“DRD”) reduces the amount of dividend income subject to U.S. tax and is the primary componentof the non-taxable investment income shown in the table above, and, as such, is a significant component of the difference between theCompany’s effective tax rate and the federal statutory tax rate of 35%. The DRD for the current period was estimated using information
Prudential Financial, Inc. 2013 Annual Report 181

PRUDENTIAL FINANCIAL, INC.
Notes to Consolidated Financial Statements
19. INCOME TAXES (continued)
from 2012 and current year results, and was adjusted to take into account the current year’s equity market performance. The actual currentyear DRD can vary from the estimate based on factors such as, but not limited to, changes in the amount of dividends received that areeligible for the DRD, changes in the amount of distributions received from mutual fund investments, changes in the account balances ofvariable life and annuity contracts, and the Company’s taxable income before the DRD.
In August 2007, the IRS released Revenue Ruling 2007-54, which included, among other items, guidance on the methodology to befollowed in calculating the DRD related to variable life insurance and annuity contracts. In September 2007, the IRS released RevenueRuling 2007-61. Revenue Ruling 2007-61 suspended Revenue Ruling 2007-54 and informed taxpayers that the U.S. Treasury Departmentand the IRS intend to address through new guidance the issues considered in Revenue Ruling 2007-54, including the methodology to befollowed in determining the DRD related to variable life insurance and annuity contracts. In May 2010, the IRS issued an Industry DirectorDirective (“IDD”) confirming that the methodology for calculating the DRD set forth in Revenue Ruling 2007-54 should not be followed.The IDD also confirmed that the IRS guidance issued before Revenue Ruling 2007-54, which guidance the Company relied upon incalculating its DRD, should be used to determine the DRD. In February 2014, the IRS released Revenue Ruling 2014-7, which modifiedand superseded Revenue Ruling 2007-54, by removing the provisions of Revenue Ruling 2007-54 related to the methodology to befollowed in calculating the DRD and obsoleting Revenue Ruling 2007-61. However, there remains the possibility that the IRS and the U.S.Treasury will address, through subsequent guidance, the issues related to the calculation of the DRD. For the last several years, the revenueproposals included in the Obama Administration’s budgets included a proposal that would change the method used to determine theamount of the DRD. A change in the DRD, including the possible retroactive or prospective elimination of this deduction through guidanceor legislation, could increase actual tax expense and reduce the Company’s consolidated net income. These activities had no impact on theCompany’s 2011, 2012 or 2013 results.
The Medicare Part D subsidy provided by the government is not subject to tax. However, the amount a company can otherwise deductfor retiree health care expenses must be reduced by the amount of the Medicare Part D subsidy received and not taxed in that year,effectively making the subsidy taxable. During 2013, the Company transferred $340 million of assets within the qualified pension planunder Section 420 of the Internal Revenue Code from assets supporting pension benefits to assets supporting retiree medical and lifebenefits. As a result, the Company reduced the projected amount of retiree health care payments that would not be deductible related tofuture receipts by the Company of the Medicare Part D subsidy and recognized a $43 million tax benefit in “Income from continuingoperations before equity in earnings of operating joint ventures.”
Total income tax expense includes additional tax expense related to the realization of deferred tax assets recorded in the Statement ofFinancial Position as of the acquisition date for Prudential Gibraltar and the Star and Edison Businesses. As of December 31, 2013,additional U.S. GAAP tax expense related to the utilization of opening balance sheet deferred tax assets has been fully recognized betweenthe Statement of Operations and Other Comprehensive Income as follows:
PrudentialGibraltar
Star andEdison
Businesses Total
(in millions)Opening balance sheet deferred tax assets after valuation allowance that will result in additional tax expense . . . . . . . . . $ 56 $678 $734Additional tax expense (benefit) recognized in the Statement of Operations:
2009 . . . . . . . . . . . . . . . . . . . . . . . . . . . . . . . . . . . . . . . . . . . . . . . . . . . . . . . . . . . . . . . . . . . . . . . . . . . . . . . . . . . . . . . 13 0 132010 . . . . . . . . . . . . . . . . . . . . . . . . . . . . . . . . . . . . . . . . . . . . . . . . . . . . . . . . . . . . . . . . . . . . . . . . . . . . . . . . . . . . . . . 6 0 62011 . . . . . . . . . . . . . . . . . . . . . . . . . . . . . . . . . . . . . . . . . . . . . . . . . . . . . . . . . . . . . . . . . . . . . . . . . . . . . . . . . . . . . . . (29) 252 2232012 . . . . . . . . . . . . . . . . . . . . . . . . . . . . . . . . . . . . . . . . . . . . . . . . . . . . . . . . . . . . . . . . . . . . . . . . . . . . . . . . . . . . . . . 51 333 3842013 . . . . . . . . . . . . . . . . . . . . . . . . . . . . . . . . . . . . . . . . . . . . . . . . . . . . . . . . . . . . . . . . . . . . . . . . . . . . . . . . . . . . . . . 15 40 55
Subtotal . . . . . . . . . . . . . . . . . . . . . . . . . . . . . . . . . . . . . . . . . . . . . . . . . . . . . . . . . . . . . . . . . . . . . . . . . . . . . . . . . 56 625 681Additional tax expense recognized in Other Comprehensive Income . . . . . . . . . . . . . . . . . . . . . . . . . . . . . . . . . . . . . . . . . 0 53 53
Unrecognized balance of additional tax expense . . . . . . . . . . . . . . . . . . . . . . . . . . . . . . . . . . . . . . . . . . . . . . . . . . . . . . . . . $ 0 $ 0 $ 0
On January 1, 2012, the Star and Edison Businesses merged into Gibraltar Life. The majority of additional U.S. tax expenserecognized in 2012 is a result of the merger. During the first quarter of 2013, the Company changed its repatriation assumption forGibraltar Life and Prudential Gibraltar. As a result, the Company recorded an additional U.S. tax expense of $108 million in the firstquarter of 2013. Future losses in pre-tax income of Gibraltar Life, such as that caused by the impact of foreign currency exchange ratemovements on certain non-yen denominated assets and liabilities, may reduce the amount of additional tax expense recognized in theConsolidated Statements of Operations and increase the amount of additional tax expense recognized in Other Comprehensive Income.
182 Prudential Financial, Inc. 2013 Annual Report

PRUDENTIAL FINANCIAL, INC.
Notes to Consolidated Financial Statements
19. INCOME TAXES (continued)
Deferred tax assets and liabilities at December 31 resulted from the items listed in the following table:
2013 2012
(in millions)Deferred tax assets
Insurance reserves . . . . . . . . . . . . . . . . . . . . . . . . . . . . . . . . . . . . . . . . . . . . . . . . . . . . . . . . . . . . . . . . . . . . . . . . . . . . . . . . . . . . . . . . . $ 2,760 $ 3,952Policyholders’ dividends . . . . . . . . . . . . . . . . . . . . . . . . . . . . . . . . . . . . . . . . . . . . . . . . . . . . . . . . . . . . . . . . . . . . . . . . . . . . . . . . . . . . 1,797 2,433Net operating and capital loss carryforwards . . . . . . . . . . . . . . . . . . . . . . . . . . . . . . . . . . . . . . . . . . . . . . . . . . . . . . . . . . . . . . . . . . . . 358 866Employee benefits . . . . . . . . . . . . . . . . . . . . . . . . . . . . . . . . . . . . . . . . . . . . . . . . . . . . . . . . . . . . . . . . . . . . . . . . . . . . . . . . . . . . . . . . . 477 718Investments . . . . . . . . . . . . . . . . . . . . . . . . . . . . . . . . . . . . . . . . . . . . . . . . . . . . . . . . . . . . . . . . . . . . . . . . . . . . . . . . . . . . . . . . . . . . . . 1,510 0Other . . . . . . . . . . . . . . . . . . . . . . . . . . . . . . . . . . . . . . . . . . . . . . . . . . . . . . . . . . . . . . . . . . . . . . . . . . . . . . . . . . . . . . . . . . . . . . . . . . . 472 343
Deferred tax assets before valuation allowance . . . . . . . . . . . . . . . . . . . . . . . . . . . . . . . . . . . . . . . . . . . . . . . . . . . . . . . . . . . . . . . . . . 7,374 8,312Valuation allowance . . . . . . . . . . . . . . . . . . . . . . . . . . . . . . . . . . . . . . . . . . . . . . . . . . . . . . . . . . . . . . . . . . . . . . . . . . . . . . . . . . . . . . . (235) (280)
Deferred tax assets after valuation allowance . . . . . . . . . . . . . . . . . . . . . . . . . . . . . . . . . . . . . . . . . . . . . . . . . . . . . . . . . . . . . . . . . . . . 7,139 8,032
Deferred tax liabilitiesNet unrealized investment gains . . . . . . . . . . . . . . . . . . . . . . . . . . . . . . . . . . . . . . . . . . . . . . . . . . . . . . . . . . . . . . . . . . . . . . . . . . . . . . 7,147 8,451Deferred policy acquisition costs . . . . . . . . . . . . . . . . . . . . . . . . . . . . . . . . . . . . . . . . . . . . . . . . . . . . . . . . . . . . . . . . . . . . . . . . . . . . . 4,208 3,559Investments . . . . . . . . . . . . . . . . . . . . . . . . . . . . . . . . . . . . . . . . . . . . . . . . . . . . . . . . . . . . . . . . . . . . . . . . . . . . . . . . . . . . . . . . . . . . . . 0 1,753Unremitted foreign earnings . . . . . . . . . . . . . . . . . . . . . . . . . . . . . . . . . . . . . . . . . . . . . . . . . . . . . . . . . . . . . . . . . . . . . . . . . . . . . . . . . 679 1,216Value of business acquired . . . . . . . . . . . . . . . . . . . . . . . . . . . . . . . . . . . . . . . . . . . . . . . . . . . . . . . . . . . . . . . . . . . . . . . . . . . . . . . . . . 1,204 1,029
Deferred tax liabilities . . . . . . . . . . . . . . . . . . . . . . . . . . . . . . . . . . . . . . . . . . . . . . . . . . . . . . . . . . . . . . . . . . . . . . . . . . . . . . . . . . . . . . 13,238 16,008
Net deferred tax liability . . . . . . . . . . . . . . . . . . . . . . . . . . . . . . . . . . . . . . . . . . . . . . . . . . . . . . . . . . . . . . . . . . . . . . . . . . . . . . . . . . . . . . . . $ (6,099) $ (7,976)
The application of U.S. GAAP requires the Company to evaluate the recoverability of deferred tax assets and establish a valuationallowance if necessary to reduce the deferred tax asset to an amount that is more likely than not expected to be realized. Considerablejudgment is required in determining whether a valuation allowance is necessary, and if so, the amount of such valuation allowance. Inevaluating the need for a valuation allowance the Company considers many factors, including: (1) the nature of the deferred tax assets andliabilities; (2) whether they are ordinary or capital; (3) in which tax jurisdictions they were generated and the timing of their reversal;(4) taxable income in prior carryback years as well as projected taxable earnings exclusive of reversing temporary differences andcarryforwards; (5) the length of time that carryovers can be utilized in the various taxing jurisdictions; (6) any unique tax rules that wouldimpact the utilization of the deferred tax assets; and (7) any tax planning strategies that the Company would employ to avoid a tax benefitfrom expiring unused. Although realization is not assured, management believes it is more likely than not that the deferred tax assets, net ofvaluation allowances, will be realized.
A valuation allowance has been recorded related to tax benefits associated with state and local and foreign deferred tax assets.Adjustments to the valuation allowance are made to reflect changes in management’s assessment of the amount of the deferred tax assetthat is realizable and the amount of deferred tax asset actually realized during the year. The valuation allowance includes amounts recordedin connection with deferred tax assets at December 31 as follows:
2013 2012
(in millions)Valuation allowance related to state and local deferred tax assets . . . . . . . . . . . . . . . . . . . . . . . . . . . . . . . . . . . . . . . . . . . . . . . . . . . . . . . . . . . . $208 $250Valuation allowance related to foreign operations deferred tax assets . . . . . . . . . . . . . . . . . . . . . . . . . . . . . . . . . . . . . . . . . . . . . . . . . . . . . . . . . $ 27 $ 30
The following table sets forth the federal, state and foreign operating and capital loss carryforwards for tax purposes, at December 31:
2013 2012
(in millions)Federal net operating and capital loss carryforwards . . . . . . . . . . . . . . . . . . . . . . . . . . . . . . . . . . . . . . . . . . . . . . . . . . . . . . . . . . . . . . . . . . . . $ 0 $ 274State net operating and capital loss carryforwards(1) . . . . . . . . . . . . . . . . . . . . . . . . . . . . . . . . . . . . . . . . . . . . . . . . . . . . . . . . . . . . . . . . . . . . $3,945 $4,574Foreign operating loss carryforwards(2) . . . . . . . . . . . . . . . . . . . . . . . . . . . . . . . . . . . . . . . . . . . . . . . . . . . . . . . . . . . . . . . . . . . . . . . . . . . . . . $ 505 $1,731
(1) Expires between 2014 and 2033.(2) $481 million expires between 2018 and 2022 and $24 million has an unlimited carryforward.
The Company provides for U.S. income taxes on unremitted foreign earnings of its operations in Japan, and certain operations inIndia, Germany, and Taiwan. In addition, beginning in 2012, the Company provides for U.S. income taxes on a portion of current yearforeign earnings for its insurance operations in Korea. Unremitted foreign earnings from operations in other foreign jurisdictions areconsidered to be permanently reinvested. In 2011 the Company sold various foreign entities that were a part of the global commoditiesgroup and the relocation business. Consequently, their earnings were no longer considered permanently reinvested and the Company
Prudential Financial, Inc. 2013 Annual Report 183

PRUDENTIAL FINANCIAL, INC.
Notes to Consolidated Financial Statements
19. INCOME TAXES (continued)
recognized an income tax expense of $6 million related to the sale of global commodities group in “Income from discontinued operations,net of taxes” and income tax benefit of $11 million related to the sale of the relocation business. Except for the change in repatriationassumption with respect to a portion of current year foreign earnings for insurance operations in Korea, the Company made no materialchanges with respect to its repatriation assumptions during 2012. During the first quarter of 2013, we determined that in addition to U.S.GAAP earnings, we would repatriate an additional amount from Gibraltar Life and Prudential Gibraltar, but that such additional amountwould not exceed the deferred tax assets recorded in the Statement of Financial Position as of the acquisition date for Prudential Gibraltarand the Star and Edison Businesses. Consequently we recognized an additional U.S. tax expense of $108 million in “Income fromcontinuing operations before equity in earnings of operating joint ventures” during 2013.
The following table sets forth the undistributed earnings of foreign subsidiaries, where the Company assumes permanent reinvestmentof such and for which U.S. deferred taxes have not been provided, as of the periods indicated. Determining the tax liability that would ariseif these earnings were remitted is not practicable.
At December 31,
2013 2012 2011
(in millions)Undistributed earnings of foreign subsidiaries (assuming permanent reinvestment) . . . . . . . . . . . . . . . . . . . . . . . . . . . . . . . . . . . . $1,973 $1,747 $2,145
The Company’s income (loss) from continuing operations before income taxes and equity in earnings of operating joint venturesincludes income from domestic operations of $1,274 million, $1,138 million and $1,919 million, and income (loss) from foreign operationsof $(2,958) million, $(430) million and $3,045 million for the years ended December 31, 2013, 2012 and 2011, respectively.
The Company’s liability for income taxes includes the liability for unrecognized tax benefits and interest that relate to tax years stillsubject to review by the Internal Revenue Service (“IRS”) or other taxing authorities. The completion of review or the expiration of theFederal statute of limitations for a given audit period could result in an adjustment to the liability for income taxes.
The Company’s unrecognized tax benefits for the years ended December 31 are as follows:
2013 2012 2011
(in millions)Balance at January 1, . . . . . . . . . . . . . . . . . . . . . . . . . . . . . . . . . . . . . . . . . . . . . . . . . . . . . . . . . . . . . . . . . . . . . . . . . . . . . . . . . . . . . . . $19 $ 90 $ 552Increases in unrecognized tax benefits—prior years . . . . . . . . . . . . . . . . . . . . . . . . . . . . . . . . . . . . . . . . . . . . . . . . . . . . . . . . . . . . . . . 0 16 96(Decreases) in unrecognized tax benefits—prior years . . . . . . . . . . . . . . . . . . . . . . . . . . . . . . . . . . . . . . . . . . . . . . . . . . . . . . . . . . . . . (7) (4) (152)Increases in unrecognized tax benefits—current year . . . . . . . . . . . . . . . . . . . . . . . . . . . . . . . . . . . . . . . . . . . . . . . . . . . . . . . . . . . . . . 0 0 0(Decreases) in unrecognized tax benefits—current year . . . . . . . . . . . . . . . . . . . . . . . . . . . . . . . . . . . . . . . . . . . . . . . . . . . . . . . . . . . . 0 0 0Settlements with taxing authorities . . . . . . . . . . . . . . . . . . . . . . . . . . . . . . . . . . . . . . . . . . . . . . . . . . . . . . . . . . . . . . . . . . . . . . . . . . . . . (1) (83) (406)
Balance at December 31, . . . . . . . . . . . . . . . . . . . . . . . . . . . . . . . . . . . . . . . . . . . . . . . . . . . . . . . . . . . . . . . . . . . . . . . . . . . . . . . . . . . . $11 $ 19 $ 90
Unrecognized tax benefits that, if recognized, would favorably impact the effective rate . . . . . . . . . . . . . . . . . . . . . . . . . . . . . . . . . . $11 $ 19 $ 38
The Company does not anticipate any significant changes within the next 12 months to its total unrecognized tax benefits related totax years for which the statute of limitations has not expired.
The Company classifies all interest and penalties related to tax uncertainties as income tax expense (benefit). The amounts recognizedin the consolidated financial statements for tax-related interest and penalties for the years ended December 31 are as follows:
2013 2012 2011
(in millions)Interest and penalties recognized in the consolidated statements of operations . . . . . . . . . . . . . . . . . . . . . . . . . . . . . . . . . . . . . . . . . . . $1 $4 $13
2013 2012
(in millions)Interest and penalties recognized in liabilities in the consolidated statements of financial position . . . . . . . . . . . . . . . . . . . . . . . . . . . . . . . . . . $6 $8
Listed below are the tax years that remain subject to examination by major tax jurisdiction, at December 31, 2013:
Major Tax Jurisdiction Open Tax Years
United States . . . . . . . . . . . . . . . . . . . . 2004—2013Japan . . . . . . . . . . . . . . . . . . . . . . . . . . Fiscal years ended March 31, 2009—2013Korea . . . . . . . . . . . . . . . . . . . . . . . . . . Fiscal years ended March 31, 2009—2013 and the period ended December 31, 2013
During 2004 through 2006, the Company entered into two transactions that involved, among other things, the payment of foreignincome taxes that were credited against the Company’s U.S. tax liability. On May 23, 2011, the IRS issued notices of proposed adjustmentsdisallowing the foreign tax credits claimed and related transaction expenses. The total amount of the proposed adjustments for the
184 Prudential Financial, Inc. 2013 Annual Report

PRUDENTIAL FINANCIAL, INC.
Notes to Consolidated Financial Statements
19. INCOME TAXES (continued)
transactions was approximately $200 million of tax and penalties. During the fourth quarter of 2011, the Company reached agreement withthe IRS on the resolution of the proposed foreign tax credits disallowance. The impact to the 2011 results attributable to the settlement wasan increase to tax expense of approximately $93 million. The settlement of the foreign tax credit transactions for 2004 through 2006marked the conclusion of the IRS audits for those years. As a result, all unrecognized tax positions plus interest relating to tax years prior to2007 were recognized in 2011. As such, 2011 benefited from a reduction to the liability for unrecognized tax benefits of $70 million,including the impact from the foreign tax credit disallowance.
For tax years 2007 through 2013, the Company is participating in the IRS’s Compliance Assurance Program (“CAP”). Under CAP,the IRS assigns an examination team to review completed transactions contemporaneously during these tax years in order to reachagreement with the Company on how they should be reported in the tax returns. If disagreements arise, accelerated resolutions programsare available to resolve the disagreements in a timely manner before the tax returns are filed. It is management’s expectation this programwill shorten the time period between the filing of the Company’s federal income tax returns and the IRS’s completion of its examination ofthe returns.
Certain of the Company’s affiliates in Japan file a consolidated tax return, while others file separate tax returns. The Company’saffiliates in Japan are subject to audits by the local taxing authority. The general statute of limitations is five years from when the return isfiled. During 2011, the Tokyo Regional Taxation Bureau concluded a routine tax audit of the tax returns of Edison Life InsuranceCompany Ltd. for its tax years ended March 31, 2009 to March 31, 2010. During 2013 the Tokyo Regional Taxation Bureau conducted aroutine tax audit of the tax returns of the Company’s affiliates in Japan for their tax years ended March 31, 2009 to March 31, 2012. Theseactivities had no material impact on the Company’s 2011, 2012 or 2013 results.
The Company’s affiliates in South Korea file separate tax returns and are subject to audits by the local taxing authority. The generalstatute of limitations is five years from when the return is filed.
20. FAIR VALUE OF ASSETS AND LIABILITIES
Fair Value Measurement—Fair value represents the price that would be received to sell an asset or paid to transfer a liability in anorderly transaction between market participants at the measurement date. The authoritative fair value guidance establishes a framework formeasuring fair value that includes a hierarchy used to classify the inputs used in measuring fair value. The level in the fair value hierarchywithin which the fair value measurement falls is determined based on the lowest level input that is significant to the fair valuemeasurement. The levels of the fair value hierarchy are as follows:
Level 1—Fair value is based on unadjusted quoted prices in active markets that are accessible to the Company for identical assets orliabilities. The Company’s Level 1 assets and liabilities primarily include certain cash equivalents and short term investments, equitysecurities and derivative contracts that trade on an active exchange market.
Level 2—Fair value is based on significant inputs, other than quoted prices included in Level 1, that are observable for the asset orliability, either directly or indirectly, for substantially the full term of the asset or liability through corroboration with observable marketdata. Level 2 inputs include quoted market prices in active markets for similar assets and liabilities, quoted market prices in markets thatare not active for identical or similar assets or liabilities, and other market observable inputs. The Company’s Level 2 assets and liabilitiesinclude: fixed maturities (corporate public and private bonds, most government securities, certain asset-backed and mortgage-backedsecurities, etc.), certain equity securities (mutual funds, which do not actively trade and are priced based on a net asset value), certaincommercial mortgage loans, short-term investments and certain cash equivalents (primarily commercial paper), and certain over-the-counter derivatives.
Level 3—Fair value is based on at least one or more significant unobservable inputs for the asset or liability. The assets and liabilitiesin this category may require significant judgment or estimation in determining the fair value. The Company’s Level 3 assets and liabilitiesprimarily include: certain private fixed maturities and equity securities, certain manually priced public equity securities and fixedmaturities, certain highly structured over-the-counter derivative contracts, certain commercial mortgage loans, certain consolidated realestate funds for which the Company is the general partner, and embedded derivatives resulting from certain products with guaranteedbenefits.
Prudential Financial, Inc. 2013 Annual Report 185

PRUDENTIAL FINANCIAL, INC.
Notes to Consolidated Financial Statements
20. FAIR VALUE OF ASSETS AND LIABILITIES (continued)
Assets and Liabilities by Hierarchy Level—The tables below present the balances of assets and liabilities measured at fair value ona recurring basis, as of the dates indicated.
As of December 31, 2013
Level 1 Level 2 Level 3 Netting(1) Total
(in millions)Fixed maturities, available-for-sale:U.S. Treasury securities and obligations of U.S. government authorities and agencies . . . . . . . . $ 0 $ 15,400 $ 0 $ $ 15,400Obligations of U.S. states and their political subdivisions . . . . . . . . . . . . . . . . . . . . . . . . . . . . . . . 0 3,735 0 3,735Foreign government bonds . . . . . . . . . . . . . . . . . . . . . . . . . . . . . . . . . . . . . . . . . . . . . . . . . . . . . . . 0 82,787 1 82,788Corporate securities . . . . . . . . . . . . . . . . . . . . . . . . . . . . . . . . . . . . . . . . . . . . . . . . . . . . . . . . . . . . 0 152,449 1,329 153,778Asset-backed securities . . . . . . . . . . . . . . . . . . . . . . . . . . . . . . . . . . . . . . . . . . . . . . . . . . . . . . . . . . 0 7,147 3,442 10,589Commercial mortgage-backed securities . . . . . . . . . . . . . . . . . . . . . . . . . . . . . . . . . . . . . . . . . . . . 0 13,708 165 13,873Residential mortgage-backed securities . . . . . . . . . . . . . . . . . . . . . . . . . . . . . . . . . . . . . . . . . . . . . 0 6,695 8 6,703
Subtotal . . . . . . . . . . . . . . . . . . . . . . . . . . . . . . . . . . . . . . . . . . . . . . . . . . . . . . . . . . . . . . . . . . 0 281,921 4,945 286,866Trading account assets:(2)U.S. Treasury securities and obligations of U.S. government authorities and agencies . . . . . . . . 0 266 0 266Obligations of U.S. states and their political subdivisions . . . . . . . . . . . . . . . . . . . . . . . . . . . . . . . 0 190 0 190Foreign government bonds . . . . . . . . . . . . . . . . . . . . . . . . . . . . . . . . . . . . . . . . . . . . . . . . . . . . . . . 0 643 0 643Corporate securities . . . . . . . . . . . . . . . . . . . . . . . . . . . . . . . . . . . . . . . . . . . . . . . . . . . . . . . . . . . . 0 16,865 115 16,980Asset-backed securities . . . . . . . . . . . . . . . . . . . . . . . . . . . . . . . . . . . . . . . . . . . . . . . . . . . . . . . . . . 0 876 403 1,279Commercial mortgage-backed securities . . . . . . . . . . . . . . . . . . . . . . . . . . . . . . . . . . . . . . . . . . . . 0 2,466 0 2,466Residential mortgage-backed securities . . . . . . . . . . . . . . . . . . . . . . . . . . . . . . . . . . . . . . . . . . . . . 0 1,828 2 1,830Equity securities . . . . . . . . . . . . . . . . . . . . . . . . . . . . . . . . . . . . . . . . . . . . . . . . . . . . . . . . . . . . . . . 1,309 225 842 2,376All other(3) . . . . . . . . . . . . . . . . . . . . . . . . . . . . . . . . . . . . . . . . . . . . . . . . . . . . . . . . . . . . . . . . . . . 591 7,899 6 (7,246) 1,250
Subtotal . . . . . . . . . . . . . . . . . . . . . . . . . . . . . . . . . . . . . . . . . . . . . . . . . . . . . . . . . . . . . . . . . . 1,900 31,258 1,368 (7,246) 27,280Equity securities, available-for-sale . . . . . . . . . . . . . . . . . . . . . . . . . . . . . . . . . . . . . . . . . . . . . . . . 6,938 2,668 304 9,910Commercial mortgage and other loans . . . . . . . . . . . . . . . . . . . . . . . . . . . . . . . . . . . . . . . . . . . . . . 0 158 0 158Other long-term investments . . . . . . . . . . . . . . . . . . . . . . . . . . . . . . . . . . . . . . . . . . . . . . . . . . . . . 19 109 1,396 5 1,529Short-term investments . . . . . . . . . . . . . . . . . . . . . . . . . . . . . . . . . . . . . . . . . . . . . . . . . . . . . . . . . . 6,139 1,046 0 7,185Cash equivalents . . . . . . . . . . . . . . . . . . . . . . . . . . . . . . . . . . . . . . . . . . . . . . . . . . . . . . . . . . . . . . . 2,461 4,521 0 6,982Other assets . . . . . . . . . . . . . . . . . . . . . . . . . . . . . . . . . . . . . . . . . . . . . . . . . . . . . . . . . . . . . . . . . . . 3 209 4 216
Subtotal excluding separate account assets . . . . . . . . . . . . . . . . . . . . . . . . . . . . . . . . . . . . . . 17,460 321,890 8,017 (7,241) 340,126Separate account assets(4) . . . . . . . . . . . . . . . . . . . . . . . . . . . . . . . . . . . . . . . . . . . . . . . . . . . . . . . 49,182 213,275 22,603 285,060
Total assets . . . . . . . . . . . . . . . . . . . . . . . . . . . . . . . . . . . . . . . . . . . . . . . . . . . . . . . . . . . . . . . $66,642 $535,165 $30,620 $(7,241) $625,186
Future policy benefits(5) . . . . . . . . . . . . . . . . . . . . . . . . . . . . . . . . . . . . . . . . . . . . . . . . . . . . . . . . . $ 0 $ 0 $ 441 $ $ 441Other liabilities . . . . . . . . . . . . . . . . . . . . . . . . . . . . . . . . . . . . . . . . . . . . . . . . . . . . . . . . . . . . . . . . 1 9,458 5 (7,257) 2,207Notes of consolidated VIEs . . . . . . . . . . . . . . . . . . . . . . . . . . . . . . . . . . . . . . . . . . . . . . . . . . . . . . 0 0 3,254 3,254
Total liabilities . . . . . . . . . . . . . . . . . . . . . . . . . . . . . . . . . . . . . . . . . . . . . . . . . . . . . . . . . . . . $ 1 $ 9,458 $ 3,700 $(7,257) $ 5,902
186 Prudential Financial, Inc. 2013 Annual Report
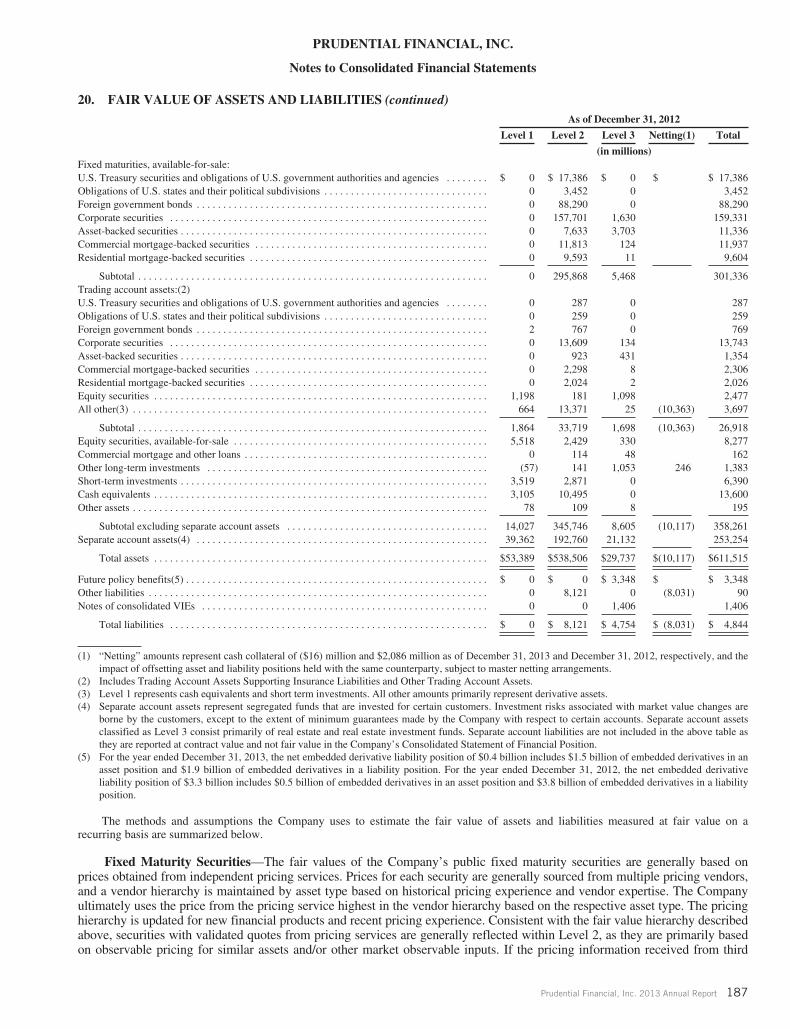
PRUDENTIAL FINANCIAL, INC.
Notes to Consolidated Financial Statements
20. FAIR VALUE OF ASSETS AND LIABILITIES (continued)As of December 31, 2012
Level 1 Level 2 Level 3 Netting(1) Total
(in millions)Fixed maturities, available-for-sale:U.S. Treasury securities and obligations of U.S. government authorities and agencies . . . . . . . . $ 0 $ 17,386 $ 0 $ $ 17,386Obligations of U.S. states and their political subdivisions . . . . . . . . . . . . . . . . . . . . . . . . . . . . . . . 0 3,452 0 3,452Foreign government bonds . . . . . . . . . . . . . . . . . . . . . . . . . . . . . . . . . . . . . . . . . . . . . . . . . . . . . . . 0 88,290 0 88,290Corporate securities . . . . . . . . . . . . . . . . . . . . . . . . . . . . . . . . . . . . . . . . . . . . . . . . . . . . . . . . . . . . 0 157,701 1,630 159,331Asset-backed securities . . . . . . . . . . . . . . . . . . . . . . . . . . . . . . . . . . . . . . . . . . . . . . . . . . . . . . . . . . 0 7,633 3,703 11,336Commercial mortgage-backed securities . . . . . . . . . . . . . . . . . . . . . . . . . . . . . . . . . . . . . . . . . . . . 0 11,813 124 11,937Residential mortgage-backed securities . . . . . . . . . . . . . . . . . . . . . . . . . . . . . . . . . . . . . . . . . . . . . 0 9,593 11 9,604
Subtotal . . . . . . . . . . . . . . . . . . . . . . . . . . . . . . . . . . . . . . . . . . . . . . . . . . . . . . . . . . . . . . . . . . 0 295,868 5,468 301,336Trading account assets:(2)U.S. Treasury securities and obligations of U.S. government authorities and agencies . . . . . . . . 0 287 0 287Obligations of U.S. states and their political subdivisions . . . . . . . . . . . . . . . . . . . . . . . . . . . . . . . 0 259 0 259Foreign government bonds . . . . . . . . . . . . . . . . . . . . . . . . . . . . . . . . . . . . . . . . . . . . . . . . . . . . . . . 2 767 0 769Corporate securities . . . . . . . . . . . . . . . . . . . . . . . . . . . . . . . . . . . . . . . . . . . . . . . . . . . . . . . . . . . . 0 13,609 134 13,743Asset-backed securities . . . . . . . . . . . . . . . . . . . . . . . . . . . . . . . . . . . . . . . . . . . . . . . . . . . . . . . . . . 0 923 431 1,354Commercial mortgage-backed securities . . . . . . . . . . . . . . . . . . . . . . . . . . . . . . . . . . . . . . . . . . . . 0 2,298 8 2,306Residential mortgage-backed securities . . . . . . . . . . . . . . . . . . . . . . . . . . . . . . . . . . . . . . . . . . . . . 0 2,024 2 2,026Equity securities . . . . . . . . . . . . . . . . . . . . . . . . . . . . . . . . . . . . . . . . . . . . . . . . . . . . . . . . . . . . . . . 1,198 181 1,098 2,477All other(3) . . . . . . . . . . . . . . . . . . . . . . . . . . . . . . . . . . . . . . . . . . . . . . . . . . . . . . . . . . . . . . . . . . . 664 13,371 25 (10,363) 3,697
Subtotal . . . . . . . . . . . . . . . . . . . . . . . . . . . . . . . . . . . . . . . . . . . . . . . . . . . . . . . . . . . . . . . . . . 1,864 33,719 1,698 (10,363) 26,918Equity securities, available-for-sale . . . . . . . . . . . . . . . . . . . . . . . . . . . . . . . . . . . . . . . . . . . . . . . . 5,518 2,429 330 8,277Commercial mortgage and other loans . . . . . . . . . . . . . . . . . . . . . . . . . . . . . . . . . . . . . . . . . . . . . . 0 114 48 162Other long-term investments . . . . . . . . . . . . . . . . . . . . . . . . . . . . . . . . . . . . . . . . . . . . . . . . . . . . . (57) 141 1,053 246 1,383Short-term investments . . . . . . . . . . . . . . . . . . . . . . . . . . . . . . . . . . . . . . . . . . . . . . . . . . . . . . . . . . 3,519 2,871 0 6,390Cash equivalents . . . . . . . . . . . . . . . . . . . . . . . . . . . . . . . . . . . . . . . . . . . . . . . . . . . . . . . . . . . . . . . 3,105 10,495 0 13,600Other assets . . . . . . . . . . . . . . . . . . . . . . . . . . . . . . . . . . . . . . . . . . . . . . . . . . . . . . . . . . . . . . . . . . . 78 109 8 195
Subtotal excluding separate account assets . . . . . . . . . . . . . . . . . . . . . . . . . . . . . . . . . . . . . . 14,027 345,746 8,605 (10,117) 358,261Separate account assets(4) . . . . . . . . . . . . . . . . . . . . . . . . . . . . . . . . . . . . . . . . . . . . . . . . . . . . . . . 39,362 192,760 21,132 253,254
Total assets . . . . . . . . . . . . . . . . . . . . . . . . . . . . . . . . . . . . . . . . . . . . . . . . . . . . . . . . . . . . . . . $53,389 $538,506 $29,737 $(10,117) $611,515
Future policy benefits(5) . . . . . . . . . . . . . . . . . . . . . . . . . . . . . . . . . . . . . . . . . . . . . . . . . . . . . . . . . $ 0 $ 0 $ 3,348 $ $ 3,348Other liabilities . . . . . . . . . . . . . . . . . . . . . . . . . . . . . . . . . . . . . . . . . . . . . . . . . . . . . . . . . . . . . . . . 0 8,121 0 (8,031) 90Notes of consolidated VIEs . . . . . . . . . . . . . . . . . . . . . . . . . . . . . . . . . . . . . . . . . . . . . . . . . . . . . . 0 0 1,406 1,406
Total liabilities . . . . . . . . . . . . . . . . . . . . . . . . . . . . . . . . . . . . . . . . . . . . . . . . . . . . . . . . . . . . $ 0 $ 8,121 $ 4,754 $ (8,031) $ 4,844
(1) “Netting” amounts represent cash collateral of ($16) million and $2,086 million as of December 31, 2013 and December 31, 2012, respectively, and theimpact of offsetting asset and liability positions held with the same counterparty, subject to master netting arrangements.
(2) Includes Trading Account Assets Supporting Insurance Liabilities and Other Trading Account Assets.(3) Level 1 represents cash equivalents and short term investments. All other amounts primarily represent derivative assets.(4) Separate account assets represent segregated funds that are invested for certain customers. Investment risks associated with market value changes are
borne by the customers, except to the extent of minimum guarantees made by the Company with respect to certain accounts. Separate account assetsclassified as Level 3 consist primarily of real estate and real estate investment funds. Separate account liabilities are not included in the above table asthey are reported at contract value and not fair value in the Company’s Consolidated Statement of Financial Position.
(5) For the year ended December 31, 2013, the net embedded derivative liability position of $0.4 billion includes $1.5 billion of embedded derivatives in anasset position and $1.9 billion of embedded derivatives in a liability position. For the year ended December 31, 2012, the net embedded derivativeliability position of $3.3 billion includes $0.5 billion of embedded derivatives in an asset position and $3.8 billion of embedded derivatives in a liabilityposition.
The methods and assumptions the Company uses to estimate the fair value of assets and liabilities measured at fair value on arecurring basis are summarized below.
Fixed Maturity Securities—The fair values of the Company’s public fixed maturity securities are generally based onprices obtained from independent pricing services. Prices for each security are generally sourced from multiple pricing vendors,and a vendor hierarchy is maintained by asset type based on historical pricing experience and vendor expertise. The Companyultimately uses the price from the pricing service highest in the vendor hierarchy based on the respective asset type. The pricinghierarchy is updated for new financial products and recent pricing experience. Consistent with the fair value hierarchy describedabove, securities with validated quotes from pricing services are generally reflected within Level 2, as they are primarily basedon observable pricing for similar assets and/or other market observable inputs. If the pricing information received from third
Prudential Financial, Inc. 2013 Annual Report 187

PRUDENTIAL FINANCIAL, INC.
Notes to Consolidated Financial Statements
20. FAIR VALUE OF ASSETS AND LIABILITIES (continued)
party pricing services is not reflective of market activity or other inputs observable in the market, the Company may challengethe price through a formal process with the pricing service. If the pricing service updates the price to be more consistent with thepresented market observations, the security remains within Level 2.
Internally-developed valuations or indicative broker quotes are also used to determine fair value in circumstances where vendorpricing is not available, or where the Company ultimately concludes that pricing information received from the independent pricing serviceis not reflective of market activity. If the Company concludes the values from both pricing services and brokers are not reflective of marketactivity, it may over-ride the information with an internally-developed valuation. As of December 31, 2013 and December 31, 2012, over-rides on a net basis were not material. Pricing service over-rides, internally-developed valuations and indicative broker quotes are generallyincluded in Level 3 in the fair value hierarchy.
The fair value of private fixed maturities, which are comprised of investments in private placement securities, originated by internalprivate asset managers, are primarily determined using a discounted cash flow model. If the fair value is determined using pricing inputsthat are observable in the market, the securities have been reflected within Level 2; otherwise a Level 3 classification is used.
Trading Account Assets—Trading account assets consist primarily of fixed maturity securities, equity securities and derivativeswhose fair values are determined consistent with similar instruments described above under “Fixed Maturity Securities” and below under“Equity Securities” and “Derivative Instruments.”
Equity Securities—Equity securities consist principally of investments in common and preferred stock of publicly traded companies,perpetual preferred stock, privately traded securities, as well as mutual fund shares. The fair values of most publicly traded equity securitiesare based on quoted market prices in active markets for identical assets and are classified within Level 1 in the fair value hierarchy.Estimated fair values for most privately traded equity securities are determined using discounted cash flow, earnings multiple and othervaluation models that require a substantial level of judgment around inputs and therefore are classified within Level 3. The fair values ofmutual fund shares that transact regularly (but do not trade in active markets because they are not publicly available) are based ontransaction prices of identical fund shares and are classified within Level 2 in the fair value hierarchy. The fair values of perpetual preferredstock are based on inputs obtained from independent pricing services that are primarily based on indicative broker quotes. As a result, thefair values of perpetual preferred stock are classified as Level 3.
Commercial Mortgage and Other Loans—The fair value of commercial mortgage loans held for investment and accounted forusing the fair value option are determined based on the present value of the expected future cash flows discounted at the appropriate U.S.Treasury rate, adjusted for the current market spread for similar quality loans. The quality ratings for these loans, a primary determinant ofthe appropriate credit spread and a significant component of the pricing input, are based on internally-developed estimates. As a result,these loans are included in Level 3 in the fair value hierarchy.
The fair value of other loans held and accounted for using the fair value option is determined utilizing pricing indicators from thewhole loan market, where investors are committed to purchase these loans at a pre-determined price, which is considered the principal exitmarket for these loans. The Company has evaluated the valuation inputs used for these assets, including the existence of pre-determinedexit prices, the terms of the loans, prevailing interest rates and credit risk, and deemed that the primary pricing inputs are Level 2 inputs inthe fair value hierarchy.
Other Long-Term Investments—Other long-term investments include limited partnerships which are consolidated because theCompany is either deemed to exercise control or considered the primary beneficiary of a variable interest entity. These entities areconsidered investment companies and follow specialized industry accounting whereby their assets are carried at fair value. The investmentsheld by these entities include various feeder fund investments in underlying master funds (whose underlying holdings generally includepublic fixed maturities, equity securities and mutual funds), as well as wholly-owned real estate held within other investment funds. Thefair value is determined by reference to the underlying direct investments, with publicly traded equity securities based on quoted prices inactive markets reflected in Level 1, and public fixed maturities and mutual funds priced via quotes from pricing services or observable datareflected in Level 2. The fair value of investments in funds that are subject to significant liquidity restrictions are reflected in Level 3.
The fair value of real estate held in consolidated investment funds is determined through an independent appraisal process. Theappraisals generally utilize a discounted cash flow model, supplemented with replacement cost estimates and comparable recent sales datawhen available. These appraisals and the related assumptions are updated at least annually. Since many of the assumptions utilized areunobservable and are considered to be significant inputs to the valuation, the real estate investments within other long-term investmentshave been reflected within Level 3 in the fair value hierarchy.
The fair value of fund investments, where the fair value option has been elected, is primarily determined by the fund managers. Sincethe valuations may be based on unobservable market inputs and cannot be validated by the Company, these investments have been includedwithin Level 3 in the fair value hierarchy.
Derivative Instruments—Derivatives are recorded at fair value either as assets, within “Other trading account assets,” or “Otherlong-term investments,” or as liabilities, within “Other liabilities,” except for embedded derivatives which are recorded with the associatedhost contract. The fair values of derivative contracts can be affected by changes in interest rates, foreign exchange rates, commodity prices,
188 Prudential Financial, Inc. 2013 Annual Report

PRUDENTIAL FINANCIAL, INC.
Notes to Consolidated Financial Statements
20. FAIR VALUE OF ASSETS AND LIABILITIES (continued)
credit spreads, market volatility, expected returns, non-performance risk, liquidity and other factors. Liquidity valuation adjustments aremade to reflect the cost of exiting significant risk positions, and consider the bid-ask spread, maturity, complexity, and other specificattributes of the underlying derivative position.
The Company’s exchange-traded futures and options include Treasury futures, Eurodollar futures, commodity futures, Eurodollaroptions and commodity options. Exchange-traded futures and options are valued using quoted prices in active markets and are classifiedwithin Level 1 in the fair value hierarchy.
The majority of the Company’s derivative positions are traded in the over-the-counter (“OTC”) derivative market and are classifiedwithin Level 2 in the fair value hierarchy. OTC derivatives classified within Level 2 are valued using models that utilize actively quoted orobservable market input values from external market data providers, third-party pricing vendors and/or recent trading activity. TheCompany’s policy is to use mid-market pricing in determining its best estimate of fair value. The fair values of most OTC derivatives,including interest rate and cross currency swaps, currency forward contracts, commodity swaps, commodity forward contracts, single namecredit default swaps, loan commitments held for sale and to-be-announced (or TBA) forward contracts on highly rated mortgage-backedsecurities issued by U.S. government sponsored entities are determined using discounted cash flow models. The fair values of Europeanstyle option contracts are determined using Black-Scholes option pricing models. These models’ key inputs include the contractual terms ofthe respective contract, along with significant observable inputs, including interest rates, currency rates, credit spreads, equity prices, indexdividend yields, non-performance risk, volatility and other factors.
The Company’s cleared interest rate swaps and credit derivatives linked to an index are valued using models that utilize activelyquoted or observable market inputs, including Overnight Indexed Swap discount rates, obtained from external market data providers, third-party pricing vendors and/or recent trading activity. These derivatives are classified as Level 2 in the fair value hierarchy.
The vast majority of the Company’s derivative agreements are with highly rated major international financial institutions. To reflectthe market’s perception of its own and the counterparty’s non-performance risk, the Company incorporates additional spreads over LIBORinto the discount rate used in determining the fair value of OTC derivative assets and liabilities that are not otherwise collateralized.
Derivatives classified as Level 3 include look-back equity options and other structured products. These derivatives are valued basedupon models, such as Monte Carlo simulation models and other techniques that utilize significant unobservable inputs. Level 3methodologies are validated through periodic comparison of the Company’s fair values to external broker-dealer values.
Cash Equivalents and Short-Term Investments—Cash equivalents and short-term investments include money market instruments,commercial paper and other highly liquid debt instruments. Certain money market instruments are valued using unadjusted quoted prices inactive markets that are accessible for identical assets and are primarily classified as Level 1. The remaining instruments in this category aregenerally fair valued based on market observable inputs and these investments have primarily been classified within Level 2.
Separate Account Assets—Separate Account Assets include fixed maturity securities, treasuries, equity securities and real estateinvestments for which values are determined consistent with similar instruments described above under “Fixed Maturity Securities,”“Equity Securities” and “Other Long-Term Investments.”
Notes of Consolidated VIEs—The fair values of these notes are based on broker quotes and classified within Level 3. See Note 5 andthe Fair Value Option section below for additional information.
Other Liabilities—Other liabilities include certain derivative instruments, the fair values of which are determined consistent withsimilar derivative instruments described above under “Derivative Instruments.”
Future Policy Benefits—The liability for future policy benefits primarily includes general account liabilities for the optional livingbenefit features of the Company’s variable annuity contracts, including guaranteed minimum accumulation benefits (“GMAB”), guaranteedminimum withdrawal benefits (“GMWB”) and guaranteed minimum income and withdrawal benefits (“GMIWB”), accounted for asembedded derivatives. The fair values of the GMAB, GMWB and GMIWB liabilities are calculated as the present value of future expectedbenefit payments to customers less the present value of assessed rider fees attributable to the embedded derivative feature. Thismethodology could result in either a liability or contra-liability balance, given changing capital market conditions and various actuarialassumptions. Since there is no observable active market for the transfer of these obligations, the valuations are calculated using internally-developed models with option pricing techniques. The models are based on a risk neutral valuation framework and incorporate premiumsfor risks inherent in valuation techniques, inputs, and the general uncertainty around the timing and amount of future cash flows. Thedetermination of these risk premiums requires the use of management judgment.
The significant inputs to the valuation models for these embedded derivatives include capital market assumptions, such as interest ratelevels and volatility assumptions, the Company’s market-perceived risk of its own non-performance (“NPR”), as well as actuariallydetermined assumptions, including contractholder behavior, such as lapse rates, benefit utilization rates, withdrawal rates, and mortalityrates. Since many of these assumptions are unobservable and are considered to be significant inputs to the liability valuation, the liabilityincluded in future policy benefits has been reflected within Level 3 in the fair value hierarchy.
Capital market inputs and actual policyholders’ account values are updated each quarter based on capital market conditions as of theend of the quarter, including interest rates, equity markets and volatility. In the risk neutral valuation, the initial swap curve drives the totalreturn used to grow the policyholders’ account values. The Company’s discount rate assumption is based on the LIBOR swap curveadjusted for an additional spread relative to LIBOR to reflect NPR.
Prudential Financial, Inc. 2013 Annual Report 189

PRUDENTIAL FINANCIAL, INC.
Notes to Consolidated Financial Statements
20. FAIR VALUE OF ASSETS AND LIABILITIES (continued)
Actuarial assumptions, including contractholder behavior and mortality, are reviewed at least annually, and updated based uponemerging experience, future expectations and other data, including any observable market data, such as available industry studies or markettransactions such as acquisitions and reinsurance transactions. These assumptions are generally updated in the third quarter of each yearunless a material change that the Company feels is indicative of a long term trend is observed in an interim period.
Transfers between Levels 1 and 2—Periodically there are transfers between Level 1 and Level 2 for assets held in the Company’sSeparate Account. The fair value of foreign common stock held in the Company’s Separate Account may reflect differences in marketlevels between the close of foreign trading markets and the close of U.S. trading markets for the respective day. Dependent on the existenceof such a timing difference, the asset may move between Level 1 and Level 2. In addition, the classification of Separate Account funds mayvary dependent on the availability of information to the public. Should a fund’s net asset value become publicly observable, the fund wouldbe transferred from Level 2 to Level 1. During the year ended December 31, 2013, $4.0 billion were transferred from Level 1 to Level 2and $5.0 billion were transferred from Level 2 to Level 1. During the year ended December 31, 2012, $5.0 billion were transferred fromLevel 1 to Level 2 and $2.1 billion were transferred from Level 2 to Level 1.
Level 3 Assets and Liabilities by Price Source—The table below presents the balances of Level 3 assets and liabilities measured atfair value with their corresponding pricing sources.
As of December 31, 2013
Internal(1) External(2) Total
(in millions)Foreign government bonds . . . . . . . . . . . . . . . . . . . . . . . . . . . . . . . . . . . . . . . . . . . . . . . . . . . . . . . . . . . . . . . . . . . . . . . $ 0 $ 1 $ 1Corporate securities . . . . . . . . . . . . . . . . . . . . . . . . . . . . . . . . . . . . . . . . . . . . . . . . . . . . . . . . . . . . . . . . . . . . . . . . . . . . 660 784 1,444Asset-backed securities . . . . . . . . . . . . . . . . . . . . . . . . . . . . . . . . . . . . . . . . . . . . . . . . . . . . . . . . . . . . . . . . . . . . . . . . . . 283 3,562 3,845Commercial mortgage-backed securities . . . . . . . . . . . . . . . . . . . . . . . . . . . . . . . . . . . . . . . . . . . . . . . . . . . . . . . . . . . . 14 151 165Residential mortgage-backed securities . . . . . . . . . . . . . . . . . . . . . . . . . . . . . . . . . . . . . . . . . . . . . . . . . . . . . . . . . . . . . 3 7 10Equity securities . . . . . . . . . . . . . . . . . . . . . . . . . . . . . . . . . . . . . . . . . . . . . . . . . . . . . . . . . . . . . . . . . . . . . . . . . . . . . . . 141 1,005 1,146Other long-term investments . . . . . . . . . . . . . . . . . . . . . . . . . . . . . . . . . . . . . . . . . . . . . . . . . . . . . . . . . . . . . . . . . . . . . 9 1,387 1,396Other assets . . . . . . . . . . . . . . . . . . . . . . . . . . . . . . . . . . . . . . . . . . . . . . . . . . . . . . . . . . . . . . . . . . . . . . . . . . . . . . . . . . . 10 0 10
Subtotal excluding separate account assets(3) . . . . . . . . . . . . . . . . . . . . . . . . . . . . . . . . . . . . . . . . . . . . . . . . . . . . 1,120 6,897 8,017Separate account assets . . . . . . . . . . . . . . . . . . . . . . . . . . . . . . . . . . . . . . . . . . . . . . . . . . . . . . . . . . . . . . . . . . . . . . . . . . 21,665 938 22,603
Total assets . . . . . . . . . . . . . . . . . . . . . . . . . . . . . . . . . . . . . . . . . . . . . . . . . . . . . . . . . . . . . . . . . . . . . . . . . . . . . . . $22,785 $7,835 $30,620
Future policy benefits . . . . . . . . . . . . . . . . . . . . . . . . . . . . . . . . . . . . . . . . . . . . . . . . . . . . . . . . . . . . . . . . . . . . . . . . . . . $ 441 $ 0 $ 441Other liabilities . . . . . . . . . . . . . . . . . . . . . . . . . . . . . . . . . . . . . . . . . . . . . . . . . . . . . . . . . . . . . . . . . . . . . . . . . . . . . . . . 5 0 5Notes of consolidated VIEs . . . . . . . . . . . . . . . . . . . . . . . . . . . . . . . . . . . . . . . . . . . . . . . . . . . . . . . . . . . . . . . . . . . . . . 0 3,254 3,254
Total liabilities . . . . . . . . . . . . . . . . . . . . . . . . . . . . . . . . . . . . . . . . . . . . . . . . . . . . . . . . . . . . . . . . . . . . . . . . . . . . $ 446 $3,254 $ 3,700
As of December 31, 2012
Internal(1) External(2) Total
(in millions)Corporate securities . . . . . . . . . . . . . . . . . . . . . . . . . . . . . . . . . . . . . . . . . . . . . . . . . . . . . . . . . . . . . . . . . . . . . . . . . . . . $ 889 $ 875 $ 1,764Asset-backed securities . . . . . . . . . . . . . . . . . . . . . . . . . . . . . . . . . . . . . . . . . . . . . . . . . . . . . . . . . . . . . . . . . . . . . . . . . . 338 3,796 4,134Commercial mortgage-backed securities . . . . . . . . . . . . . . . . . . . . . . . . . . . . . . . . . . . . . . . . . . . . . . . . . . . . . . . . . . . . 68 64 132Residential mortgage-backed securities . . . . . . . . . . . . . . . . . . . . . . . . . . . . . . . . . . . . . . . . . . . . . . . . . . . . . . . . . . . . . 3 10 13Equity securities . . . . . . . . . . . . . . . . . . . . . . . . . . . . . . . . . . . . . . . . . . . . . . . . . . . . . . . . . . . . . . . . . . . . . . . . . . . . . . . 101 1,327 1,428Commercial mortgage and other loans . . . . . . . . . . . . . . . . . . . . . . . . . . . . . . . . . . . . . . . . . . . . . . . . . . . . . . . . . . . . . . 48 0 48Other long-term investments . . . . . . . . . . . . . . . . . . . . . . . . . . . . . . . . . . . . . . . . . . . . . . . . . . . . . . . . . . . . . . . . . . . . . 9 1,044 1,053Other assets . . . . . . . . . . . . . . . . . . . . . . . . . . . . . . . . . . . . . . . . . . . . . . . . . . . . . . . . . . . . . . . . . . . . . . . . . . . . . . . . . . . 33 0 33
Subtotal excluding separate account assets(3) . . . . . . . . . . . . . . . . . . . . . . . . . . . . . . . . . . . . . . . . . . . . . . . . . . . . 1,489 7,116 8,605Separate account assets . . . . . . . . . . . . . . . . . . . . . . . . . . . . . . . . . . . . . . . . . . . . . . . . . . . . . . . . . . . . . . . . . . . . . . . . . . 20,422 710 21,132
Total assets . . . . . . . . . . . . . . . . . . . . . . . . . . . . . . . . . . . . . . . . . . . . . . . . . . . . . . . . . . . . . . . . . . . . . . . . . . . . . . . $21,911 $7,826 $29,737
Future policy benefits . . . . . . . . . . . . . . . . . . . . . . . . . . . . . . . . . . . . . . . . . . . . . . . . . . . . . . . . . . . . . . . . . . . . . . . . . . . $ 3,348 $ 0 $ 3,348Notes of consolidated VIEs . . . . . . . . . . . . . . . . . . . . . . . . . . . . . . . . . . . . . . . . . . . . . . . . . . . . . . . . . . . . . . . . . . . . . . 0 1,406 1,406
Total liabilities . . . . . . . . . . . . . . . . . . . . . . . . . . . . . . . . . . . . . . . . . . . . . . . . . . . . . . . . . . . . . . . . . . . . . . . . . . . . $ 3,348 $1,406 $ 4,754
(1) Represents valuations which could incorporate internally-derived and market inputs. See below for additional information related to internally-developed valuation for significant items in the above table.
(2) Represents unadjusted prices from independent pricing services and independent non-binding broker quotes where pricing inputs are not readilyavailable.
(3) Includes assets classified as fixed maturities available-for-sale, trading account assets supporting insurance liabilities and other trading account assets.
190 Prudential Financial, Inc. 2013 Annual Report

PRUDENTIAL FINANCIAL, INC.
Notes to Consolidated Financial Statements
20. FAIR VALUE OF ASSETS AND LIABILITIES (continued)
Quantitative Information Regarding Internally-Priced Level 3 Assets and Liabilities—The table below represents quantitativeinformation on significant internally-priced Level 3 assets and liabilities.
As of December 31, 2013
Fair ValueValuation
Techniques Unobservable Inputs Minimum MaximumWeightedAverage
Impact ofIncrease inInput on
FairValue(1)
(in millions)Assets:Corporate securities . . . . . . . . . . . . . . . . . $660 Discounted cash flow Discount rate 1.25% – 15% 8.52% Decrease
Market comparables EBITDA multiples(2) 5.0X – 8.0X 6.0X IncreaseLiquidation Liquidation value 11.61% – 100.0% 59.17% Increase
Asset—backed securities . . . . . . . . . . . . . $283 Discounted cash flow Prepayment rate(3) 2.82% – 27.41% 10.23% IncreaseDefault rate(3) 0.49% – 31.85% 2.62% DecreaseLoss severity(3) 15.06% – 45.00% 33.00% DecreaseLiquidity premium 1.00% – 2.00% 1.90% DecreaseAverage life (years) 0.16 – 14.76 5.05 IncreaseComparable spreads 0.19% – 45.19% 3.65% DecreaseComparable security yields 0.61% – 10.00% 6.52% Decrease
Liabilities:Future policy benefits(4) . . . . . . . . . . . . . . $441 Discounted cash flow Lapse rate(5) 0% – 11% Decrease
NPR spread(6) 0.08% – 1.09% DecreaseUtilization rate(7) 70% – 94% IncreaseWithdrawal rate(8) 86% – 100% IncreaseMortality rate(9) 0% – 13% DecreaseEquity volatility curve 15% – 28% Increase
As of December 31, 2012
Fair ValueValuation
Techniques Unobservable Inputs Minimum MaximumWeightedAverage
Impact ofIncrease inInput on
FairValue(1)
(in millions)Assets:Corporate securities . . . . . . . . . . . . . . . . . . $ 889 Discounted cash flow Discount rate 1.7% – 17.5% 9.92% Decrease
Market comparables EBITDA multiples(2) 5.0X – 8.5X 6.2X IncreaseCap at call price Call price 100% – 101% 100.24% IncreaseLiquidation Liquidation value 49% – 100.0% 83.06% Increase
Asset-backed securities . . . . . . . . . . . . . . . $ 338 Discounted cash flow Prepayment rate(3) 2.8% – 29.0% 9.84% IncreaseDefault rate(3) 0.5% – 2.52% 0.84% DecreaseLoss severity(3) 35% – 43.88% 35.76% DecreaseLiquidity premium 1.0% – 2.50% 1.83% DecreaseAverage life (years) 0.1 – 15 5.61 IncreaseComparable spreads 0.1% – 20% 2.81% DecreaseComparable security yields 0.4% – 15% 7.59% Decrease
Liabilities:Future policy benefits(4) . . . . . . . . . . . . . . $3,348 Discounted cash flow Lapse rate(5) 0% – 14% Decrease
NPR spread(6) 0.20% – 1.60% DecreaseUtilization rate(7) 70% – 94% IncreaseWithdrawal rate(8) 85% – 100% IncreaseMortality rate(9) 0% – 13% DecreaseEquity volatility curve 19% – 34% Increase
(1) Conversely, the impact of a decrease in input would have the opposite impact for the fair value as that presented in the table.(2) EBITDA multiples represent multiples of earnings before interest, taxes, depreciation and amortization, and are amounts used when the reporting entity
has determined that market participants would use such multiples when pricing the investments.(3) In isolation, an increase in prepayment rate or a decrease in default rate or loss severity would generally result in an increase in fair value, although the
interrelationships between these inputs depend on specific market conditions.(4) Future policy benefits primarily represent general account liabilities for the optional living benefit features of the Company’s variable annuity contracts
which are accounted for as embedded derivatives. Since the valuation methodology for these liabilities uses a range of inputs that vary at the contractlevel over the cash flow projection period, presenting a range, rather than weighted average, is a more meaningful representation of the unobservableinputs used in the valuation.
Prudential Financial, Inc. 2013 Annual Report 191

PRUDENTIAL FINANCIAL, INC.
Notes to Consolidated Financial Statements
20. FAIR VALUE OF ASSETS AND LIABILITIES (continued)
(5) Base lapse rates are adjusted at the contract level based on a comparison of the benefit amount and the policyholder account value and reflect otherfactors, such as the applicability of any surrender charges. A dynamic lapse adjustment reduces the base lapse rate when the benefit amount is greaterthan the account value, as in-the-money contracts are less likely to lapse. Lapse rates are also generally assumed to be lower for the period wheresurrender charges apply.
(6) To reflect NPR, the Company incorporates an additional spread over LIBOR into the discount rate used in the valuation of individual living benefitcontracts in a liability position and generally not to those in a contra-liability position. In determining the NPR spread, the Company reflects thefinancial strength ratings of the Company’s insurance subsidiaries as these are insurance liabilities and senior to debt. The additional spread overLIBOR is determined by utilizing the credit spreads associated with issuing funding agreements, adjusted for any illiquidity risk premium.
(7) The utilization rate assumption estimates the percentage of contracts that will utilize the benefit during the contract duration, and begin lifetimewithdrawals at various time intervals from contract inception. The remaining contractholders are assumed to either begin lifetime withdrawalsimmediately or never utilize the benefit. These assumptions vary based on the product type, the age of the contractholder and the age of the contract.The impact of changes in these assumptions is highly dependent on the contract type and age of the contractholder at the time of the sale and the timingof the first lifetime income withdrawal.
(8) The withdrawal rate assumption estimates the magnitude of annual contractholder withdrawals relative to the maximum allowable amount under thecontract. The fair value of the liability will generally increase the closer the withdrawal rate is to 100%.
(9) Range reflects the mortality rate for the vast majority of business with living benefits, with policyholders ranging from 35 to 90 years old. While themajority of living benefits have a minimum age requirement, certain benefits do not have an age restriction. This results in contractholders for certainbenefits with mortality rates approaching 0%. Based on historical experience, the Company applies a set of age and duration specific mortality rateadjustments compared to standard industry tables. A mortality improvement assumption is also incorporated into the overall mortality table.
Interrelationships Between Unobservable Inputs—In addition to the sensitivities of fair value measurements to changes in eachunobservable input in isolation, as reflected in the table above, interrelationships between these inputs may also exist, such that a change inone unobservable input may give rise to a change in another or multiple inputs. Examples of such interrelationships for significantinternally-priced Level 3 assets and liabilities are as follows:
Corporate Securities—The rate used to discount future cash flows reflects current risk-free rates plus credit and liquidity spreadrequirements that market participants would use to value an asset. The discount rate may be influenced by many factors, including marketcycles, expectations of default, collateral, term, and asset complexity. Each of these factors can influence discount rates, either in isolation,or in response to other factors.
Asset-Backed Securities—Interrelationships may exist between the prepayment rate, the default rate and/or loss severity, depending onspecific market conditions. In stronger business cycles, prepayment rates are generally driven by overall market interest rates, andaccompanied by lower default rates and loss severity. During weaker cycles, prepayments may decline, as default rates and loss severityincrease. Additionally, the impact of these factors on average life varies with the structure and subordination.
Future Policy Benefits—The unobservable contractholder behavior inputs related to the liability for the optional living benefit featuresof the Company’s variable annuity contracts included in future policy benefits are generally based on emerging experience, futureexpectations and other data. While experience for these products is still emerging, the Company expects efficient benefit utilization andwithdrawal rates to generally be correlated with lapse rates. However, behavior is generally highly dependent on the facts andcircumstances surrounding the individual contractholder, such as their liquidity needs or tax situation, which could drive lapse behaviorindependent of other contractholder behavior assumptions. The dynamic lapse adjustment assumes lower lapses when the benefit amount isgreater than the account value, as in-the-money contracts are less likely to lapse. Therefore, to the extent more efficient contractholderbehavior results in greater in-the-moneyness at the contract level, the dynamic lapse function will reduce lapse rates for those contracts.Similarly, to the extent that increases in equity volatility are correlated with overall declines in the capital markets, the dynamic lapsefunction will lower overall lapse rates as contracts become more in-the-money.
Separate Account Assets—In addition to the significant internally-priced Level 3 assets and liabilities presented and describedabove, the Company also has internally-priced separate account assets reported within Level 3. Changes in the fair value of separateaccount assets are borne by customers and thus are offset by changes in separate account liabilities on the Company’s ConsolidatedStatement of Financial Position. As a result, changes in value associated with these investments do not impact the Company’s ConsolidatedStatement of Operations. In addition, fees earned by the Company related to the management of most separate account assets classified asLevel 3 do not change due to changes in the fair value of these investments. Quantitative information about significant internally-pricedLevel 3 separate account assets is as follows:
Real Estate and Other Invested Assets—Separate account assets include $20,806 million and $19,518 million of investments in realestate as of December 31, 2013 and December 31, 2012, respectively, that are classified as Level 3 and reported at fair value. In general,these fair value estimates are based on property appraisal reports prepared by independent real estate appraisers. Key inputs andassumptions to the appraisal process include rental income and expense amounts, related growth rates, discount rates and capitalizationrates. In cases where real estate investments are made through indirect investments, fair value is generally determined by the Company’sequity in net assets of the entities. The debt associated with real estate, other invested assets and the Company’s equity position in entitiesare externally valued. Because of the subjective nature of inputs and the judgment involved in the appraisal process, real estate investmentsand their corresponding debt are typically included in the Level 3 classification. Key unobservable inputs to real estate valuation includecapitalization rates, which ranged from 4.15% to 11.00% (6.35% weighted average) as of December 31, 2013, and 4.75% to 10.50%(6.49% weighted average) as of December 31, 2012, and discount rates, which ranged from 6.00% to 15.00% (7.71% weighted average) as
192 Prudential Financial, Inc. 2013 Annual Report
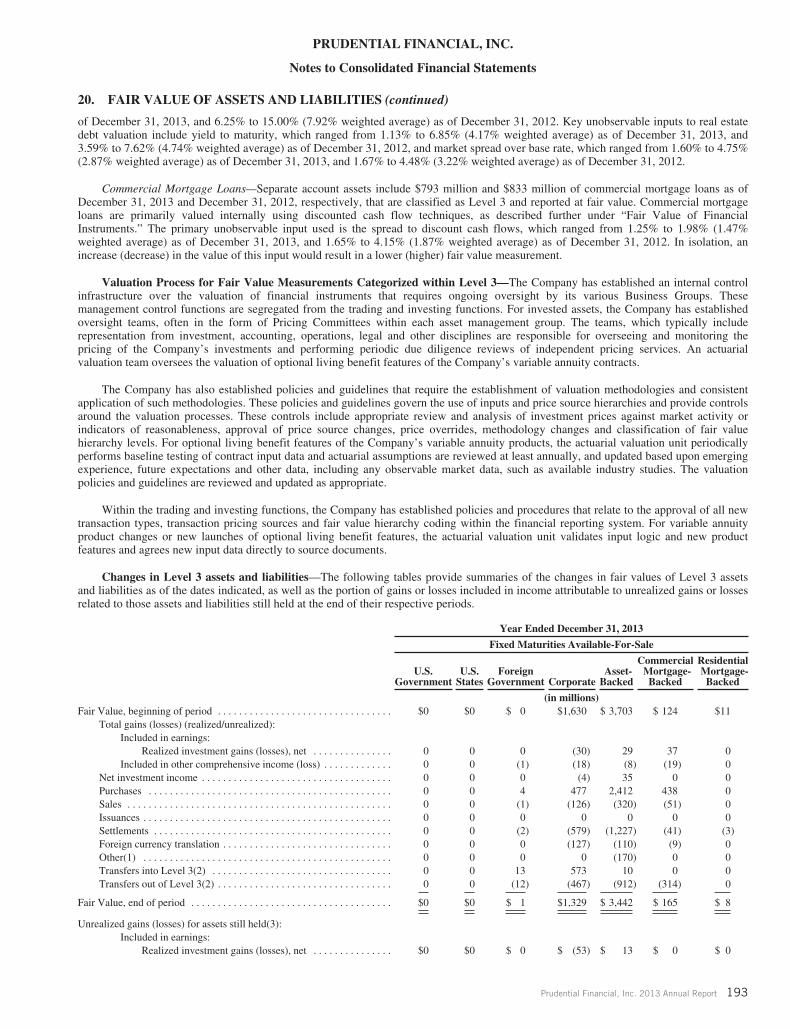
PRUDENTIAL FINANCIAL, INC.
Notes to Consolidated Financial Statements
20. FAIR VALUE OF ASSETS AND LIABILITIES (continued)
of December 31, 2013, and 6.25% to 15.00% (7.92% weighted average) as of December 31, 2012. Key unobservable inputs to real estatedebt valuation include yield to maturity, which ranged from 1.13% to 6.85% (4.17% weighted average) as of December 31, 2013, and3.59% to 7.62% (4.74% weighted average) as of December 31, 2012, and market spread over base rate, which ranged from 1.60% to 4.75%(2.87% weighted average) as of December 31, 2013, and 1.67% to 4.48% (3.22% weighted average) as of December 31, 2012.
Commercial Mortgage Loans—Separate account assets include $793 million and $833 million of commercial mortgage loans as ofDecember 31, 2013 and December 31, 2012, respectively, that are classified as Level 3 and reported at fair value. Commercial mortgageloans are primarily valued internally using discounted cash flow techniques, as described further under “Fair Value of FinancialInstruments.” The primary unobservable input used is the spread to discount cash flows, which ranged from 1.25% to 1.98% (1.47%weighted average) as of December 31, 2013, and 1.65% to 4.15% (1.87% weighted average) as of December 31, 2012. In isolation, anincrease (decrease) in the value of this input would result in a lower (higher) fair value measurement.
Valuation Process for Fair Value Measurements Categorized within Level 3—The Company has established an internal controlinfrastructure over the valuation of financial instruments that requires ongoing oversight by its various Business Groups. Thesemanagement control functions are segregated from the trading and investing functions. For invested assets, the Company has establishedoversight teams, often in the form of Pricing Committees within each asset management group. The teams, which typically includerepresentation from investment, accounting, operations, legal and other disciplines are responsible for overseeing and monitoring thepricing of the Company’s investments and performing periodic due diligence reviews of independent pricing services. An actuarialvaluation team oversees the valuation of optional living benefit features of the Company’s variable annuity contracts.
The Company has also established policies and guidelines that require the establishment of valuation methodologies and consistentapplication of such methodologies. These policies and guidelines govern the use of inputs and price source hierarchies and provide controlsaround the valuation processes. These controls include appropriate review and analysis of investment prices against market activity orindicators of reasonableness, approval of price source changes, price overrides, methodology changes and classification of fair valuehierarchy levels. For optional living benefit features of the Company’s variable annuity products, the actuarial valuation unit periodicallyperforms baseline testing of contract input data and actuarial assumptions are reviewed at least annually, and updated based upon emergingexperience, future expectations and other data, including any observable market data, such as available industry studies. The valuationpolicies and guidelines are reviewed and updated as appropriate.
Within the trading and investing functions, the Company has established policies and procedures that relate to the approval of all newtransaction types, transaction pricing sources and fair value hierarchy coding within the financial reporting system. For variable annuityproduct changes or new launches of optional living benefit features, the actuarial valuation unit validates input logic and new productfeatures and agrees new input data directly to source documents.
Changes in Level 3 assets and liabilities—The following tables provide summaries of the changes in fair values of Level 3 assetsand liabilities as of the dates indicated, as well as the portion of gains or losses included in income attributable to unrealized gains or lossesrelated to those assets and liabilities still held at the end of their respective periods.
Year Ended December 31, 2013
Fixed Maturities Available-For-Sale
U.S.Government
U.S.States
ForeignGovernment Corporate
Asset-Backed
CommercialMortgage-Backed
ResidentialMortgage-Backed
(in millions)Fair Value, beginning of period . . . . . . . . . . . . . . . . . . . . . . . . . . . . . . . . . $0 $0 $ 0 $1,630 $ 3,703 $ 124 $11
Total gains (losses) (realized/unrealized):Included in earnings:
Realized investment gains (losses), net . . . . . . . . . . . . . . . 0 0 0 (30) 29 37 0Included in other comprehensive income (loss) . . . . . . . . . . . . . 0 0 (1) (18) (8) (19) 0
Net investment income . . . . . . . . . . . . . . . . . . . . . . . . . . . . . . . . . . . . 0 0 0 (4) 35 0 0Purchases . . . . . . . . . . . . . . . . . . . . . . . . . . . . . . . . . . . . . . . . . . . . . . 0 0 4 477 2,412 438 0Sales . . . . . . . . . . . . . . . . . . . . . . . . . . . . . . . . . . . . . . . . . . . . . . . . . . 0 0 (1) (126) (320) (51) 0Issuances . . . . . . . . . . . . . . . . . . . . . . . . . . . . . . . . . . . . . . . . . . . . . . . 0 0 0 0 0 0 0Settlements . . . . . . . . . . . . . . . . . . . . . . . . . . . . . . . . . . . . . . . . . . . . . 0 0 (2) (579) (1,227) (41) (3)Foreign currency translation . . . . . . . . . . . . . . . . . . . . . . . . . . . . . . . . 0 0 0 (127) (110) (9) 0Other(1) . . . . . . . . . . . . . . . . . . . . . . . . . . . . . . . . . . . . . . . . . . . . . . . 0 0 0 0 (170) 0 0Transfers into Level 3(2) . . . . . . . . . . . . . . . . . . . . . . . . . . . . . . . . . . 0 0 13 573 10 0 0Transfers out of Level 3(2) . . . . . . . . . . . . . . . . . . . . . . . . . . . . . . . . . 0 0 (12) (467) (912) (314) 0
Fair Value, end of period . . . . . . . . . . . . . . . . . . . . . . . . . . . . . . . . . . . . . . $0 $0 $ 1 $1,329 $ 3,442 $ 165 $ 8
Unrealized gains (losses) for assets still held(3):Included in earnings:
Realized investment gains (losses), net . . . . . . . . . . . . . . . $0 $0 $ 0 $ (53) $ 13 $ 0 $ 0
Prudential Financial, Inc. 2013 Annual Report 193

PRUDENTIAL FINANCIAL, INC.
Notes to Consolidated Financial Statements
20. FAIR VALUE OF ASSETS AND LIABILITIES (continued)Year Ended December 31, 2013
Trading Account Assets
U.SGovernment Corporate
Asset-Backed
CommercialMortgage-Backed
ResidentialMortgage-Backed Equity
AllOther
Activity
(in millions)Fair Value, beginning of period . . . . . . . . . . . . . . . . . . . . . . . . . . . . . . . . . . . . $0 $134 $ 431 $ 8 $2 $1,098 $ 25
Total gains (losses) (realized/unrealized):Included in earnings:
Realized investment gains (losses), net . . . . . . . . . . . . . . . . . . . 0 0 0 0 0 0 (16)Asset management fees and other income . . . . . . . . . . . . . . . . 0 (8) 8 0 0 63 2
Net investment income . . . . . . . . . . . . . . . . . . . . . . . . . . . . . . . . . . . . . . . 0 0 5 1 0 0 0Purchases . . . . . . . . . . . . . . . . . . . . . . . . . . . . . . . . . . . . . . . . . . . . . . . . . . 0 23 319 75 0 17 0Sales . . . . . . . . . . . . . . . . . . . . . . . . . . . . . . . . . . . . . . . . . . . . . . . . . . . . . 0 (13) (3) (1) 0 (140) 0Issuances . . . . . . . . . . . . . . . . . . . . . . . . . . . . . . . . . . . . . . . . . . . . . . . . . . 0 0 0 0 0 0 0Settlements . . . . . . . . . . . . . . . . . . . . . . . . . . . . . . . . . . . . . . . . . . . . . . . . 0 (49) (231) (2) 0 (43) (5)Foreign currency translation . . . . . . . . . . . . . . . . . . . . . . . . . . . . . . . . . . . 0 0 (8) (1) 0 (153) 0Other(1) . . . . . . . . . . . . . . . . . . . . . . . . . . . . . . . . . . . . . . . . . . . . . . . . . . . 0 0 (75) 0 0 0 0Transfers into Level 3(2) . . . . . . . . . . . . . . . . . . . . . . . . . . . . . . . . . . . . . . 0 52 4 0 0 0 0Transfers out of Level 3(2) . . . . . . . . . . . . . . . . . . . . . . . . . . . . . . . . . . . . 0 (24) (47) (80) 0 0 0
Fair Value, end of period . . . . . . . . . . . . . . . . . . . . . . . . . . . . . . . . . . . . . . . . . . $0 $115 $ 403 $ 0 $2 $ 842 $ 6
Unrealized gains (losses) for assets still held(3):Included in earnings:
Realized investment gains (losses), net . . . . . . . . . . . . . . . . . . . $0 $ 0 $ 0 $ 0 $0 $ 0 $(16)Asset management fees and other income . . . . . . . . . . . . . . . . $0 $ (7) $ 7 $ 0 $0 $ 50 $ 2
Year Ended December 31, 2013
EquitySecuritiesAvailable-For-Sale
CommercialMortgageand Other
Loans
OtherLong-term
InvestmentsOtherAssets
(in millions)Fair Value, beginning of period . . . . . . . . . . . . . . . . . . . . . . . . . . . . . . . . . . . . . . . . . . . . . . . . . . . . . . . $330 $ 48 $1,053 $ 8
Total gains (losses) (realized/unrealized):Included in earnings:
Realized investment gains (losses), net . . . . . . . . . . . . . . . . . . . . . . . . . . . . . . . . . . . . . . 13 5 0 (4)Asset management fees and other income . . . . . . . . . . . . . . . . . . . . . . . . . . . . . . . . . . . 0 0 160 0
Included in other comprehensive income (loss) . . . . . . . . . . . . . . . . . . . . . . . . . . . . . . . . . . . 58 0 0 0Purchases . . . . . . . . . . . . . . . . . . . . . . . . . . . . . . . . . . . . . . . . . . . . . . . . . . . . . . . . . . . . . . . . . . . . . 37 0 439 0Sales . . . . . . . . . . . . . . . . . . . . . . . . . . . . . . . . . . . . . . . . . . . . . . . . . . . . . . . . . . . . . . . . . . . . . . . . (65) 0 0 0Issuances . . . . . . . . . . . . . . . . . . . . . . . . . . . . . . . . . . . . . . . . . . . . . . . . . . . . . . . . . . . . . . . . . . . . . 0 0 0 0Settlements . . . . . . . . . . . . . . . . . . . . . . . . . . . . . . . . . . . . . . . . . . . . . . . . . . . . . . . . . . . . . . . . . . . (3) (53) (134) 0Foreign currency translation . . . . . . . . . . . . . . . . . . . . . . . . . . . . . . . . . . . . . . . . . . . . . . . . . . . . . . (53) 0 (13) 0Other(1) . . . . . . . . . . . . . . . . . . . . . . . . . . . . . . . . . . . . . . . . . . . . . . . . . . . . . . . . . . . . . . . . . . . . . . (18) 0 (109) 0Transfers into Level 3(2) . . . . . . . . . . . . . . . . . . . . . . . . . . . . . . . . . . . . . . . . . . . . . . . . . . . . . . . . . 6 0 0 0Transfers out of Level 3(2) . . . . . . . . . . . . . . . . . . . . . . . . . . . . . . . . . . . . . . . . . . . . . . . . . . . . . . . (1) 0 0 0
Fair Value, end of period . . . . . . . . . . . . . . . . . . . . . . . . . . . . . . . . . . . . . . . . . . . . . . . . . . . . . . . . . . . . $304 $ 0 $1,396 $ 4
Unrealized gains (losses) for assets still held(3):Included in earnings:
Realized investment gains (losses), net . . . . . . . . . . . . . . . . . . . . . . . . . . . . . . . . . . . . . . $ (5) $ 0 $ (2) $(3)Asset management fees and other income . . . . . . . . . . . . . . . . . . . . . . . . . . . . . . . . . . . $ 0 $ 0 $ 155 $ 0
194 Prudential Financial, Inc. 2013 Annual Report

?PRUDENTIAL FINANCIAL, INC.
Notes to Consolidated Financial Statements
20. FAIR VALUE OF ASSETS AND LIABILITIES (continued)Year Ended December 31, 2013
SeparateAccountAssets(4)
FuturePolicy
BenefitsOther
Liabilities
Notes ofconsolidated
VIEs
(in millions)Fair Value, beginning of period . . . . . . . . . . . . . . . . . . . . . . . . . . . . . . . . . . . . . . . . . . . . . . . . . . . . . . . $21,132 $(3,348) $ 0 $(1,406)
Total gains (losses) (realized/unrealized):Included in earnings:
Realized investment gains (losses), net . . . . . . . . . . . . . . . . . . . . . . . . . . . . . . . . . . . . . . 2 3,741 (3) 17Interest credited to policyholders’ account balances . . . . . . . . . . . . . . . . . . . . . . . . . . . . 2,649 0 0 0
Net investment income . . . . . . . . . . . . . . . . . . . . . . . . . . . . . . . . . . . . . . . . . . . . . . . . . . . . . . . . . . 20 0 0 0Purchases . . . . . . . . . . . . . . . . . . . . . . . . . . . . . . . . . . . . . . . . . . . . . . . . . . . . . . . . . . . . . . . . . . . . . 1,653 0 0 0Sales . . . . . . . . . . . . . . . . . . . . . . . . . . . . . . . . . . . . . . . . . . . . . . . . . . . . . . . . . . . . . . . . . . . . . . . . (832) 0 0 0Issuances . . . . . . . . . . . . . . . . . . . . . . . . . . . . . . . . . . . . . . . . . . . . . . . . . . . . . . . . . . . . . . . . . . . . . 0 (836) 0 (1,834)Settlements . . . . . . . . . . . . . . . . . . . . . . . . . . . . . . . . . . . . . . . . . . . . . . . . . . . . . . . . . . . . . . . . . . . (2,120) 0 0 (31)Foreign currency translation . . . . . . . . . . . . . . . . . . . . . . . . . . . . . . . . . . . . . . . . . . . . . . . . . . . . . . 0 2 0 0Other(1) . . . . . . . . . . . . . . . . . . . . . . . . . . . . . . . . . . . . . . . . . . . . . . . . . . . . . . . . . . . . . . . . . . . . . . 140 0 (2) 0Transfers into Level 3(2) . . . . . . . . . . . . . . . . . . . . . . . . . . . . . . . . . . . . . . . . . . . . . . . . . . . . . . . . . 89 0 0 0Transfers out of Level 3(2) . . . . . . . . . . . . . . . . . . . . . . . . . . . . . . . . . . . . . . . . . . . . . . . . . . . . . . . (130) 0 0 0
Fair Value, end of period . . . . . . . . . . . . . . . . . . . . . . . . . . . . . . . . . . . . . . . . . . . . . . . . . . . . . . . . . . . . . $22,603 $ (441) $(5) $(3,254)
Unrealized gains (losses) for assets/liabilities still held(3):Included in earnings:
Realized investment gains (losses), net . . . . . . . . . . . . . . . . . . . . . . . . . . . . . . . . . . . . . . $ 0 $ 3,647 $(3) $ 17Interest credited to policyholders’ account . . . . . . . . . . . . . . . . . . . . . . . . . . . . . . . . . . . $ 1,652 $ 0 $ 0 $ 0
Year Ended December 31, 2012
Fixed Maturities Available-For-Sale
U.S.Government
U.S.States
ForeignGovernment Corporate
Asset-Backed
CommercialMortgage-Backed
ResidentialMortgage-Backed
(in millions)Fair Value, beginning of period . . . . . . . . . . . . . . . . . . . . . . . . . . . . . . . . . . . $ 66 $ 0 $ 25 $1,450 $2,528 $145 $16
Total gains (losses) (realized/unrealized):Included in earnings:
Realized investment gains (losses), net . . . . . . . . . . . . . . . . . 0 0 0 (35) 21 25 0Included in other comprehensive income (loss) 0 0 0 195 102 11 0
Net investment income . . . . . . . . . . . . . . . . . . . . . . . . . . . . . . . . . . . . . . 0 0 0 8 30 (1) 1Purchases . . . . . . . . . . . . . . . . . . . . . . . . . . . . . . . . . . . . . . . . . . . . . . . . 0 10 0 375 2,640 44 0Sales . . . . . . . . . . . . . . . . . . . . . . . . . . . . . . . . . . . . . . . . . . . . . . . . . . . . 0 0 0 (165) (426) (28) 0Issuances . . . . . . . . . . . . . . . . . . . . . . . . . . . . . . . . . . . . . . . . . . . . . . . . 0 0 0 0 0 0 0Settlements . . . . . . . . . . . . . . . . . . . . . . . . . . . . . . . . . . . . . . . . . . . . . . . (2) 0 0 (325) (673) (14) (6)Foreign currency translation . . . . . . . . . . . . . . . . . . . . . . . . . . . . . . . . . 0 0 0 (38) (41) (5) 0Other(1) . . . . . . . . . . . . . . . . . . . . . . . . . . . . . . . . . . . . . . . . . . . . . . . . . (64) 0 (8) 71 0 0 0Transfers into Level 3(2) . . . . . . . . . . . . . . . . . . . . . . . . . . . . . . . . . . . . 0 0 8 306 60 37 0Transfers out of Level 3(2) . . . . . . . . . . . . . . . . . . . . . . . . . . . . . . . . . . 0 (10) (25) (212) (538) (90) 0
Fair Value, end of period . . . . . . . . . . . . . . . . . . . . . . . . . . . . . . . . . . . . . . . . $ 0 $ 0 $ 0 $1,630 $3,703 $124 $11
Unrealized gains (losses) for assets still held(3):Included in earnings:
Realized investment gains (losses), net . . . . . . . . . . . . . . . . . $ 0 $ 0 $ 0 $ (1) $ 9 $ 0 $ 0
Prudential Financial, Inc. 2013 Annual Report 195

PRUDENTIAL FINANCIAL, INC.
Notes to Consolidated Financial Statements
20. FAIR VALUE OF ASSETS AND LIABILITIES (continued)Year Ended December 31, 2012
Trading Account Assets
U.S.Government Corporate
Asset-Backed
CommercialMortgage-Backed
ResidentialMortgage-Backed Equity
All OtherActivity
(in millions)Fair Value, beginning of period . . . . . . . . . . . . . . . . . . . . . . . . . . . . . . . . . . . $ 9 $148 $ 416 $ 35 $ 4 $1,296 $ 93
Total gains (losses) (realized/unrealized):Included in earnings:
Realized investment gains (losses), net . . . . . . . . . . . . . . . . . 0 0 0 0 0 0 (73)Asset management fees and other income . . . . . . . . . . . . . . . 0 (7) 17 2 1 88 2
Net investment income . . . . . . . . . . . . . . . . . . . . . . . . . . . . . . . . . . . . . . 0 0 6 1 0 0 0Purchases . . . . . . . . . . . . . . . . . . . . . . . . . . . . . . . . . . . . . . . . . . . . . . . . 0 22 182 16 2 21 0Sales . . . . . . . . . . . . . . . . . . . . . . . . . . . . . . . . . . . . . . . . . . . . . . . . . . . . 0 (12) (12) (5) (3) (170) 0Issuances . . . . . . . . . . . . . . . . . . . . . . . . . . . . . . . . . . . . . . . . . . . . . . . . . 0 0 0 0 0 0 0Settlements . . . . . . . . . . . . . . . . . . . . . . . . . . . . . . . . . . . . . . . . . . . . . . . (2) (25) (112) (4) (1) (89) 6Foreign currency translation . . . . . . . . . . . . . . . . . . . . . . . . . . . . . . . . . . 0 0 (4) (1) 0 (70) 0Other(1) . . . . . . . . . . . . . . . . . . . . . . . . . . . . . . . . . . . . . . . . . . . . . . . . . (7) 7 1 0 (1) 3 (3)Transfers into Level 3(2) . . . . . . . . . . . . . . . . . . . . . . . . . . . . . . . . . . . . 0 5 4 82 0 20 0Transfers out of Level 3(2) . . . . . . . . . . . . . . . . . . . . . . . . . . . . . . . . . . . 0 (4) (67) (118) 0 (1) 0
Fair Value, end of period . . . . . . . . . . . . . . . . . . . . . . . . . . . . . . . . . . . . . . . . $ 0 $134 $ 431 $ 8 $ 2 $1,098 $ 25
Unrealized gains (losses) for assets still held(3):Included in earnings:
Realized investment gains (losses), net . . . . . . . . . . . . . . . . . $ 0 $ 0 $ 0 $ 0 $ 0 $ (1) $(73)Asset management fees and other income . . . . . . . . . . . . . . . $ 0 $ (10) $ 14 $ 2 $ 0 $ 78 $ 2
Year Ended December 31, 2012
EquitySecuritiesAvailable-For-Sale
CommercialMortgageand Other
Loans
OtherLong-term
InvestmentsShort-termInvestments
(in millions)Fair Value, beginning of period . . . . . . . . . . . . . . . . . . . . . . . . . . . . . . . . . . . . . . . . . . . . . . . . . . $360 $ 86 $1,110 $ 0
Total gains (losses) (realized/unrealized):Included in earnings:
Realized investment gains (losses), net . . . . . . . . . . . . . . . . . . . . . . . . . . . . . . . . . (1) 2 1 (9)Asset management fees and other income . . . . . . . . . . . . . . . . . . . . . . . . . . . . . . 0 0 126 0
Included in other comprehensive income (loss) . . . . . . . . . . . . . . . . . . . . . . . . . . . . . . 29 0 0 0Net investment income . . . . . . . . . . . . . . . . . . . . . . . . . . . . . . . . . . . . . . . . . . . . . . . . . . . . . 0 0 6 0Purchases . . . . . . . . . . . . . . . . . . . . . . . . . . . . . . . . . . . . . . . . . . . . . . . . . . . . . . . . . . . . . . . . 69 0 186 9Sales . . . . . . . . . . . . . . . . . . . . . . . . . . . . . . . . . . . . . . . . . . . . . . . . . . . . . . . . . . . . . . . . . . . (22) 0 (25) 0Issuances . . . . . . . . . . . . . . . . . . . . . . . . . . . . . . . . . . . . . . . . . . . . . . . . . . . . . . . . . . . . . . . . 0 0 0 0Settlements . . . . . . . . . . . . . . . . . . . . . . . . . . . . . . . . . . . . . . . . . . . . . . . . . . . . . . . . . . . . . . 0 (40) (296) 0Foreign currency translation . . . . . . . . . . . . . . . . . . . . . . . . . . . . . . . . . . . . . . . . . . . . . . . . . (18) 0 2 0Other(1) . . . . . . . . . . . . . . . . . . . . . . . . . . . . . . . . . . . . . . . . . . . . . . . . . . . . . . . . . . . . . . . . . 0 0 7 0Transfers into Level 3(2) . . . . . . . . . . . . . . . . . . . . . . . . . . . . . . . . . . . . . . . . . . . . . . . . . . . . 5 0 0 0Transfers out of Level 3(2) . . . . . . . . . . . . . . . . . . . . . . . . . . . . . . . . . . . . . . . . . . . . . . . . . . (92) 0 (64) 0
Fair Value, end of period . . . . . . . . . . . . . . . . . . . . . . . . . . . . . . . . . . . . . . . . . . . . . . . . . . . . . . . $330 $ 48 $1,053 $ 0
Unrealized gains (losses) for assets/liabilities still held(3):Included in earnings:
Realized investment gains (losses), net . . . . . . . . . . . . . . . . . . . . . . . . . . . . . . . . . $ (1) $ 1 $ 1 $(9)Asset management fees and other income . . . . . . . . . . . . . . . . . . . . . . . . . . . . . . $ 0 $ 0 $ 56 $ 0
196 Prudential Financial, Inc. 2013 Annual Report

PRUDENTIAL FINANCIAL, INC.
Notes to Consolidated Financial Statements
20. FAIR VALUE OF ASSETS AND LIABILITIES (continued)Year Ended December 31, 2012
OtherAssets
SeparateAccountAssets(4)
FuturePolicy
BenefitsOther
Liabilities
Notes ofconsolidated
VIEs
(in millions)Fair Value, beginning of period . . . . . . . . . . . . . . . . . . . . . . . . . . . . . . . . . . . . . . . . . . . . . . . . . $ 9 $19,358 $(2,886) $ (3) $ (282)
Total gains (losses) (realized/unrealized):Included in earnings:
Realized investment gains (losses), net . . . . . . . . . . . . . . . . . . . . . . . . . . . . . . . 0 0 231 (23) (4)Asset management fees and other income . . . . . . . . . . . . . . . . . . . . . . . . . . . . . 2 0 0 0 0Interest credited to policyholders’ account balances . . . . . . . . . . . . . . . . . . . . . 0 1,932 0 0 0
Purchases . . . . . . . . . . . . . . . . . . . . . . . . . . . . . . . . . . . . . . . . . . . . . . . . . . . . . . . . . . . . . . 0 4,230 0 0 0Sales . . . . . . . . . . . . . . . . . . . . . . . . . . . . . . . . . . . . . . . . . . . . . . . . . . . . . . . . . . . . . . . . . . (3) (1,697) 0 0 0Issuances . . . . . . . . . . . . . . . . . . . . . . . . . . . . . . . . . . . . . . . . . . . . . . . . . . . . . . . . . . . . . . 0 0 (694) 0 (1,412)Settlements . . . . . . . . . . . . . . . . . . . . . . . . . . . . . . . . . . . . . . . . . . . . . . . . . . . . . . . . . . . . . 0 (2,272) 0 26 0Foreign currency translation . . . . . . . . . . . . . . . . . . . . . . . . . . . . . . . . . . . . . . . . . . . . . . . 0 0 1 0 0Other(1) . . . . . . . . . . . . . . . . . . . . . . . . . . . . . . . . . . . . . . . . . . . . . . . . . . . . . . . . . . . . . . . 0 0 0 0 292Transfers into Level 3(2) . . . . . . . . . . . . . . . . . . . . . . . . . . . . . . . . . . . . . . . . . . . . . . . . . . 0 326 0 0 0Transfers out of Level 3(2) . . . . . . . . . . . . . . . . . . . . . . . . . . . . . . . . . . . . . . . . . . . . . . . . 0 (745) 0 0 0
Fair Value, end of period . . . . . . . . . . . . . . . . . . . . . . . . . . . . . . . . . . . . . . . . . . . . . . . . . . . . . . $ 8 $21,132 $(3,348) $ 0 $(1,406)
Unrealized gains (losses) for assets/liabilities still held(3):Included in earnings:
Realized investment gains (losses), net . . . . . . . . . . . . . . . . . . . . . . . . . . . . . . . $ 0 $ 0 $ 146 $(23) $ (4)Asset management fees and other income . . . . . . . . . . . . . . . . . . . . . . . . . . . . . $ 2 $ 0 $ 0 $ 0 $ 0Interest credited to policyholders’ account . . . . . . . . . . . . . . . . . . . . . . . . . . . . $ 0 $ 1,013 $ 0 $ 0 $ 0
Year Ended December 31, 2011
Fixed Maturities Available-For-Sale
U.S.Government
ForeignGovernment Corporate
Asset-Backed
CommercialMortgage-Backed
ResidentialMortgage-Backed
(in millions)Fair Value, beginning of period . . . . . . . . . . . . . . . . . . . . . . . . . . . . . . . . . . . . $ 0 $27 $1,187 $1,753 $130 $23
Total gains (losses) (realized/unrealized):Included in earnings:
Realized investment gains (losses), net . . . . . . . . . . . . . . . . . . 0 0 (31) 38 (41) 0Included in other comprehensive income (loss) . . . . . . . . . . . . . . . . 0 2 (139) (14) 8 (1)
Net investment income . . . . . . . . . . . . . . . . . . . . . . . . . . . . . . . . . . . . . . . 0 0 9 24 (1) 0Purchases . . . . . . . . . . . . . . . . . . . . . . . . . . . . . . . . . . . . . . . . . . . . . . . . . 66 0 556 1,473 5 1Sales . . . . . . . . . . . . . . . . . . . . . . . . . . . . . . . . . . . . . . . . . . . . . . . . . . . . . 0 (1) (144) (558) (30) (1)Issuances . . . . . . . . . . . . . . . . . . . . . . . . . . . . . . . . . . . . . . . . . . . . . . . . . . 0 0 33 0 0 0Settlements . . . . . . . . . . . . . . . . . . . . . . . . . . . . . . . . . . . . . . . . . . . . . . . . 0 0 (387) (373) (36) (5)Foreign currency translation . . . . . . . . . . . . . . . . . . . . . . . . . . . . . . . . . . . 0 0 7 54 8 0Other(1) . . . . . . . . . . . . . . . . . . . . . . . . . . . . . . . . . . . . . . . . . . . . . . . . . . 0 0 143 502 31 (1)Transfers into Level 3(2) . . . . . . . . . . . . . . . . . . . . . . . . . . . . . . . . . . . . . 0 0 893 252 76 0Transfers out of Level 3(2) . . . . . . . . . . . . . . . . . . . . . . . . . . . . . . . . . . . . 0 (3) (677) (623) (5) 0
Fair Value, end of period . . . . . . . . . . . . . . . . . . . . . . . . . . . . . . . . . . . . . . . . . $66 $25 $1,450 $2,528 $145 $16
Unrealized gains (losses) for assets still held(3):Included in earnings:
Realized investment gains (losses), net . . . . . . . . . . . . . . . . . . $ 0 $ 0 $ (39) $ 7 $ (55) $ 0
Prudential Financial, Inc. 2013 Annual Report 197

PRUDENTIAL FINANCIAL, INC.
Notes to Consolidated Financial Statements
20. FAIR VALUE OF ASSETS AND LIABILITIES (continued)Year Ended December 31, 2011
Trading Account Assets
U.S.Government Corporate
Asset-Backed
CommercialMortgage-Backed
ResidentialMortgage-Backed
EquitySecurities
All OtherActivity
(in millions)Fair Value, beginning of period . . . . . . . . . . . . . . . . . . . . . . . . . . . . . . . . . . $0 $117 $ 280 $ 24 $ 36 $ 30 $134
Total gains (losses) (realized/unrealized):Included in earnings:
Realized investment gains (losses), net . . . . . . . . . . . . . . . . . 0 0 0 0 0 0 (31)Asset management fees and other income . . . . . . . . . . . . . . 0 7 (3) 2 0 (69) 3
Net investment income . . . . . . . . . . . . . . . . . . . . . . . . . . . . . . . . . . . . . 0 0 5 2 0 0 0Purchases . . . . . . . . . . . . . . . . . . . . . . . . . . . . . . . . . . . . . . . . . . . . . . . 9 82 305 10 0 39 0Sales . . . . . . . . . . . . . . . . . . . . . . . . . . . . . . . . . . . . . . . . . . . . . . . . . . . 0 (18) (41) (13) (2) (107) 0Issuances . . . . . . . . . . . . . . . . . . . . . . . . . . . . . . . . . . . . . . . . . . . . . . . . 0 0 0 0 0 0 0Settlements . . . . . . . . . . . . . . . . . . . . . . . . . . . . . . . . . . . . . . . . . . . . . . 0 (39) (106) (5) (2) (126) (18)Foreign currency translation . . . . . . . . . . . . . . . . . . . . . . . . . . . . . . . . . 0 0 5 1 1 25 0Other(1) . . . . . . . . . . . . . . . . . . . . . . . . . . . . . . . . . . . . . . . . . . . . . . . . . 0 (1) 17 13 (29) 1,302 0Transfers into Level 3(2) . . . . . . . . . . . . . . . . . . . . . . . . . . . . . . . . . . . 0 44 39 24 0 202 5Transfers out of Level 3(2) . . . . . . . . . . . . . . . . . . . . . . . . . . . . . . . . . . 0 (44) (85) (23) 0 0 0
Fair Value, end of period . . . . . . . . . . . . . . . . . . . . . . . . . . . . . . . . . . . . . . . $9 $148 $ 416 $ 35 $ 4 $1,296 $ 93
Unrealized gains (losses) for assets still held(3):Included in earnings:
Realized investment gains (losses), net . . . . . . . . . . . . . . . . . $0 $ 0 $ 0 $ 0 $ 0 $ 0 $ (31)Asset management fees and other income . . . . . . . . . . . . . . $0 $ 5 $ (7) $ (1) $ 0 $ (80) $ 3
Year Ended December 31, 2011
EquitySecuritiesAvailable-For-Sale
CommercialMortgageand Other
Loans
OtherLong-term
InvestmentsOtherAssets
SeparateAccountAssets(4)
FuturePolicy
Benefits
OtherLiabilitiesand notes
of consolidatedVIEs(5)
(in millions)Fair Value, beginning of period . . . . . . . . . . . . . . . . . . . . . . . . . . . . . . . . . . $ 355 $ 212 $ 768 $9 $15,792 $ 204 $ (3)
Total gains (losses) (realized/unrealized):Included in earnings:
Realized investment gains (losses), net . . . . . . . . . . . . . . . . . (16) 15 2 0 0 (2,554) (16)Asset management fees and other income . . . . . . . . . . . . . . . 0 0 (1) 0 0 0 0Interest credited to policyholders’ account balance . . . . . . . 0 0 0 0 2,868 0 0
Included in other comprehensive income (loss) . . . . . . . . . . . . . . 27 0 0 0 0 0 0Net investment income . . . . . . . . . . . . . . . . . . . . . . . . . . . . . . . . . . . . . 0 0 (27) 0 0 0 0Purchases . . . . . . . . . . . . . . . . . . . . . . . . . . . . . . . . . . . . . . . . . . . . . . . . 63 0 280 0 3,111 0 0Sales . . . . . . . . . . . . . . . . . . . . . . . . . . . . . . . . . . . . . . . . . . . . . . . . . . . . (66) 0 (25) 0 (1,462) 0 0Issuances . . . . . . . . . . . . . . . . . . . . . . . . . . . . . . . . . . . . . . . . . . . . . . . . 0 0 0 0 3 (506) (284)Settlements . . . . . . . . . . . . . . . . . . . . . . . . . . . . . . . . . . . . . . . . . . . . . . (46) (141) (168) 0 (1,156) (1) 18Foreign currency translation . . . . . . . . . . . . . . . . . . . . . . . . . . . . . . . . . 75 0 14 0 0 1 0Other(1) . . . . . . . . . . . . . . . . . . . . . . . . . . . . . . . . . . . . . . . . . . . . . . . . . (853) 0 267 0 0 (30) 0Transfers into Level 3(2) . . . . . . . . . . . . . . . . . . . . . . . . . . . . . . . . . . . . 823 0 0 0 864 0 0Transfers out of Level 3(2) . . . . . . . . . . . . . . . . . . . . . . . . . . . . . . . . . . (2) 0 0 0 (662) 0 0
Fair Value, end of period . . . . . . . . . . . . . . . . . . . . . . . . . . . . . . . . . . . . . . . . $ 360 $ 86 $1,110 $9 $19,358 $(2,886) $(285)
Unrealized gains (losses) for assets still held(3):Included in earnings:
Realized investment gains (losses), net . . . . . . . . . . . . . . . . . $ (25) $ 15 $ 2 $0 $ 0 $(2,566) $ (17)Asset management fees and other income . . . . . . . . . . . . . . . $ 0 $ 0 $ 24 $0 $ 0 $ 0 $ 0Interest credited to policyholders’ account balances . . . . . . . $ 0 $ 0 $ 0 $0 $ 1,823 $ 0 $ 0
(1) Other primarily represents reclassifications of certain assets between reporting categories.(2) Transfers into or out of Level 3 are generally reported as the value as of the beginning of the quarter in which the transfer occurs.(3) Unrealized gains or losses related to assets still held at the end of the period do not include amortization or accretion of premiums and discounts.(4) Separate account assets represent segregated funds that are invested for certain customers. Investment risks associated with market value changes are
borne by the customers, except to the extent of minimum guarantees made by the Company with respect to certain accounts. Separate account liabilitiesare not included in the above table as they are reported at contract value and not fair value in the Company’s Consolidated Statement of Financial Position.
(5) Issuances primarily relate to notes of consolidated VIEs.
198 Prudential Financial, Inc. 2013 Annual Report

PRUDENTIAL FINANCIAL, INC.
Notes to Consolidated Financial Statements
20. FAIR VALUE OF ASSETS AND LIABILITIES (continued)
Transfers—Transfers into Level 3 are generally the result of unobservable inputs utilized within valuation methodologies and the useof indicative broker quotes for assets that were previously valued using observable inputs. Transfers out of Level 3 are generally due to theuse of observable inputs in valuation methodologies as well as the utilization of pricing service information for certain assets that theCompany is able to validate.
For the year ended December 31, 2012, the majority of the Equity Securities Available-for-Sale transfers out of Level 3 were due tothe determination that the pricing inputs for certain equity securities did not have a material liquidity discount and therefore, should beclassified as Level 1, not Level 3.
For the year ended December 31, 2011, the majority of Equity Securities Available-for-Sale and Trading Account Assets—EquitySecurities transfers into Level 3 were due to the determination that the pricing inputs for perpetual preferred stocks provided by third partypricing services were primarily based on indicative broker quotes which could not always be verified against directly observable marketinformation.
Derivative Fair Value Information
The following tables present the balance of derivative assets and liabilities measured at fair value on a recurring basis, as of the dateindicated, by primary underlying. These tables exclude embedded derivatives which are typically recorded with the associated hostcontract. The derivative assets and liabilities shown below are included in “Other trading account assets,” “Other long-term investments” or“Other liabilities” in the tables presented previously in this note, under the headings “Assets and Liabilities by Hierarchy Level” and“Changes in Level 3 Assets and Liabilities.”
As of December 31, 2013
Level 1 Level 2 Level 3 Netting(1) Total
(in millions)Derivative assets:
Interest Rate . . . . . . . . . . . . . . . . . . . . . . . . . . . . . . . . . . . . . . . . . . . . . . . . . . . . . . . . . . . . . . . . $ 10 $ 6,122 $ 8 $ 0 $ 6,140Currency . . . . . . . . . . . . . . . . . . . . . . . . . . . . . . . . . . . . . . . . . . . . . . . . . . . . . . . . . . . . . . . . . . . 0 593 0 0 593Credit . . . . . . . . . . . . . . . . . . . . . . . . . . . . . . . . . . . . . . . . . . . . . . . . . . . . . . . . . . . . . . . . . . . . . 0 3 0 0 3Currency/Interest Rate . . . . . . . . . . . . . . . . . . . . . . . . . . . . . . . . . . . . . . . . . . . . . . . . . . . . . . . . 0 647 0 0 647Equity . . . . . . . . . . . . . . . . . . . . . . . . . . . . . . . . . . . . . . . . . . . . . . . . . . . . . . . . . . . . . . . . . . . . . 14 376 0 0 390Commodity . . . . . . . . . . . . . . . . . . . . . . . . . . . . . . . . . . . . . . . . . . . . . . . . . . . . . . . . . . . . . . . . . 1 0 0 0 1Netting(1) . . . . . . . . . . . . . . . . . . . . . . . . . . . . . . . . . . . . . . . . . . . . . . . . . . . . . . . . . . . . . . . . . . 0 0 0 (7,241) (7,241)
Total derivative assets . . . . . . . . . . . . . . . . . . . . . . . . . . . . . . . . . . . . . . . . . . . . . . . . . . . . . $ 25 $ 7,741 $ 8 $ (7,241) $ 533
Derivative liabilities:Interest Rate . . . . . . . . . . . . . . . . . . . . . . . . . . . . . . . . . . . . . . . . . . . . . . . . . . . . . . . . . . . . . . . . $ 5 $ 7,597 $ 5 $ 0 $ 7,607Currency . . . . . . . . . . . . . . . . . . . . . . . . . . . . . . . . . . . . . . . . . . . . . . . . . . . . . . . . . . . . . . . . . . . 0 425 0 0 425Credit . . . . . . . . . . . . . . . . . . . . . . . . . . . . . . . . . . . . . . . . . . . . . . . . . . . . . . . . . . . . . . . . . . . . . 0 49 0 0 49Currency/Interest Rate . . . . . . . . . . . . . . . . . . . . . . . . . . . . . . . . . . . . . . . . . . . . . . . . . . . . . . . . 0 857 0 0 857Equity . . . . . . . . . . . . . . . . . . . . . . . . . . . . . . . . . . . . . . . . . . . . . . . . . . . . . . . . . . . . . . . . . . . . . 1 474 0 0 475Commodity . . . . . . . . . . . . . . . . . . . . . . . . . . . . . . . . . . . . . . . . . . . . . . . . . . . . . . . . . . . . . . . . . 0 0 0 0 0Netting(1) . . . . . . . . . . . . . . . . . . . . . . . . . . . . . . . . . . . . . . . . . . . . . . . . . . . . . . . . . . . . . . . . . . 0 0 0 (7,257) (7,257)
Total derivative liabilities . . . . . . . . . . . . . . . . . . . . . . . . . . . . . . . . . . . . . . . . . . . . . . . . . . $ 6 $ 9,402 $ 5 $ (7,257) $ 2,156
Prudential Financial, Inc. 2013 Annual Report 199

PRUDENTIAL FINANCIAL, INC.
Notes to Consolidated Financial Statements
20. FAIR VALUE OF ASSETS AND LIABILITIES (continued)As of December 31, 2012
Level 1 Level 2 Level 3 Netting(1) Total
(in millions)Derivative assets:
Interest Rate . . . . . . . . . . . . . . . . . . . . . . . . . . . . . . . . . . . . . . . . . . . . . . . . . . . . . . . . . . . . . . . . $ 11 $11,675 $ 5 $ 0 $ 11,691Currency . . . . . . . . . . . . . . . . . . . . . . . . . . . . . . . . . . . . . . . . . . . . . . . . . . . . . . . . . . . . . . . . . . . 0 432 0 0 432Credit . . . . . . . . . . . . . . . . . . . . . . . . . . . . . . . . . . . . . . . . . . . . . . . . . . . . . . . . . . . . . . . . . . . . . 0 19 0 0 19Currency/Interest Rate . . . . . . . . . . . . . . . . . . . . . . . . . . . . . . . . . . . . . . . . . . . . . . . . . . . . . . . . 0 450 0 0 450Equity . . . . . . . . . . . . . . . . . . . . . . . . . . . . . . . . . . . . . . . . . . . . . . . . . . . . . . . . . . . . . . . . . . . . . 63 518 19 0 600Commodity . . . . . . . . . . . . . . . . . . . . . . . . . . . . . . . . . . . . . . . . . . . . . . . . . . . . . . . . . . . . . . . . . 0 0 0 0 0Netting(1) . . . . . . . . . . . . . . . . . . . . . . . . . . . . . . . . . . . . . . . . . . . . . . . . . . . . . . . . . . . . . . . . . . 0 0 0 (10,117) (10,117)
Total derivative assets . . . . . . . . . . . . . . . . . . . . . . . . . . . . . . . . . . . . . . . . . . . . . . . . . . . . . $ 74 $13,094 $24 $(10,117) $ 3,075
Derivative liabilities:Interest Rate . . . . . . . . . . . . . . . . . . . . . . . . . . . . . . . . . . . . . . . . . . . . . . . . . . . . . . . . . . . . . . . . $ 11 $ 6,783 $ 2 $ 0 $ 6,796Currency . . . . . . . . . . . . . . . . . . . . . . . . . . . . . . . . . . . . . . . . . . . . . . . . . . . . . . . . . . . . . . . . . . . 0 517 0 0 517Credit . . . . . . . . . . . . . . . . . . . . . . . . . . . . . . . . . . . . . . . . . . . . . . . . . . . . . . . . . . . . . . . . . . . . . 0 84 0 0 84Currency/Interest Rate . . . . . . . . . . . . . . . . . . . . . . . . . . . . . . . . . . . . . . . . . . . . . . . . . . . . . . . . 0 578 0 0 578Equity . . . . . . . . . . . . . . . . . . . . . . . . . . . . . . . . . . . . . . . . . . . . . . . . . . . . . . . . . . . . . . . . . . . . . 165 198 0 0 363Commodity . . . . . . . . . . . . . . . . . . . . . . . . . . . . . . . . . . . . . . . . . . . . . . . . . . . . . . . . . . . . . . . . . 0 0 0 0 0Netting(1) . . . . . . . . . . . . . . . . . . . . . . . . . . . . . . . . . . . . . . . . . . . . . . . . . . . . . . . . . . . . . . . . . . 0 0 0 (8,031) (8,031)
Total derivative liabilities . . . . . . . . . . . . . . . . . . . . . . . . . . . . . . . . . . . . . . . . . . . . . . . . . . $176 $ 8,160 $ 2 $ (8,031) $ 307
(1) “Netting” amounts represent cash collateral and the impact of offsetting asset and liability positions held with the same counterparty.
Changes in Level 3 derivative assets and liabilities—The following tables provide a summary of the changes in fair value of Level3 derivative assets and liabilities for the year ended December 31, 2013, as well as the portion of gains or losses included in income for theyear ended December 31, 2013, attributable to unrealized gains or losses related to those assets and liabilities still held at December 31,2013.
Year Ended December 31, 2013
Derivative Assets–Equity
DerivativeAssets–Credit
DerivativeAssets–
Interest Rate
(in millions)Fair Value, beginning of period . . . . . . . . . . . . . . . . . . . . . . . . . . . . . . . . . . . . . . . . . . . . . . . . . . . . . . . . . $ 19 $0 $3
Total gains or (losses) (realized/unrealized):Included in earnings:
Realized investment gains (losses), net . . . . . . . . . . . . . . . . . . . . . . . . . . . . . . . . . . . . . . . (15) 0 0Asset management fees and other income . . . . . . . . . . . . . . . . . . . . . . . . . . . . . . . . . . . . . 0 0 0
Purchases . . . . . . . . . . . . . . . . . . . . . . . . . . . . . . . . . . . . . . . . . . . . . . . . . . . . . . . . . . . . . . . . . . . . . . 0 0 0Sales . . . . . . . . . . . . . . . . . . . . . . . . . . . . . . . . . . . . . . . . . . . . . . . . . . . . . . . . . . . . . . . . . . . . . . . . . . 0 0 0Issuances . . . . . . . . . . . . . . . . . . . . . . . . . . . . . . . . . . . . . . . . . . . . . . . . . . . . . . . . . . . . . . . . . . . . . . . 0 0 0Settlements . . . . . . . . . . . . . . . . . . . . . . . . . . . . . . . . . . . . . . . . . . . . . . . . . . . . . . . . . . . . . . . . . . . . . (4) 0 0Transfers into Level 3(1) . . . . . . . . . . . . . . . . . . . . . . . . . . . . . . . . . . . . . . . . . . . . . . . . . . . . . . . . . . 0 0 0Transfers out of Level 3(1) . . . . . . . . . . . . . . . . . . . . . . . . . . . . . . . . . . . . . . . . . . . . . . . . . . . . . . . . . 0 0 0
Fair Value, end of period . . . . . . . . . . . . . . . . . . . . . . . . . . . . . . . . . . . . . . . . . . . . . . . . . . . . . . . . . . . . . . $ 0 $0 $3
Unrealized gains (losses) for the period relating to those level 3 assets that were still held at the end ofthe period:
Included in earnings:Realized investment gains (losses), net . . . . . . . . . . . . . . . . . . . . . . . . . . . . . . . . . . . . . . . $(15) $0 $0Asset management fees and other income . . . . . . . . . . . . . . . . . . . . . . . . . . . . . . . . . . . . . $ 0 $0 $0
200 Prudential Financial, Inc. 2013 Annual Report

PRUDENTIAL FINANCIAL, INC.
Notes to Consolidated Financial Statements
20. FAIR VALUE OF ASSETS AND LIABILITIES (continued)Year Ended December 31, 2012
Derivative Assets–Equity
DerivativeAssets–Credit
DerivativeAssets–
Interest Rate
(in millions)Fair Value, beginning of period . . . . . . . . . . . . . . . . . . . . . . . . . . . . . . . . . . . . . . . . . . . . . . . . . . . . . . . . . $ 83 $ 1 $(1)
Total gains or (losses) (realized/unrealized):Included in earnings:
Realized investment gains (losses), net . . . . . . . . . . . . . . . . . . . . . . . . . . . . . . . . . . . . . . . (70) (1) 4Asset management fees and other income . . . . . . . . . . . . . . . . . . . . . . . . . . . . . . . . . . . . . 0 0 0
Purchases . . . . . . . . . . . . . . . . . . . . . . . . . . . . . . . . . . . . . . . . . . . . . . . . . . . . . . . . . . . . . . . . . . . . . . 6 0 0Sales . . . . . . . . . . . . . . . . . . . . . . . . . . . . . . . . . . . . . . . . . . . . . . . . . . . . . . . . . . . . . . . . . . . . . . . . . . 0 0 0Issuances . . . . . . . . . . . . . . . . . . . . . . . . . . . . . . . . . . . . . . . . . . . . . . . . . . . . . . . . . . . . . . . . . . . . . . . 0 0 0Settlements . . . . . . . . . . . . . . . . . . . . . . . . . . . . . . . . . . . . . . . . . . . . . . . . . . . . . . . . . . . . . . . . . . . . . 0 0 0Transfers into Level 3(1) . . . . . . . . . . . . . . . . . . . . . . . . . . . . . . . . . . . . . . . . . . . . . . . . . . . . . . . . . . 0 0 0Transfers out of Level 3(1) . . . . . . . . . . . . . . . . . . . . . . . . . . . . . . . . . . . . . . . . . . . . . . . . . . . . . . . . . 0 0 0
Fair Value, end of period . . . . . . . . . . . . . . . . . . . . . . . . . . . . . . . . . . . . . . . . . . . . . . . . . . . . . . . . . . . . . . $ 19 $ 0 $ 3
Unrealized gains (losses) for the period relating to those level 3 assets that were still held at the end ofthe period:
Included in earnings:Realized investment gains (losses), net . . . . . . . . . . . . . . . . . . . . . . . . . . . . . . . . . . . . . . . $(70) $(1) $ 4Asset management fees and other income . . . . . . . . . . . . . . . . . . . . . . . . . . . . . . . . . . . . . $ 0 $ 0 $ 0
(1) Transfers into or out of Level 3 are generally reported as the value as of the beginning of the quarter in which the transfer occurs.
Nonrecurring Fair Value Measurements—Certain assets and liabilities are measured at fair value on a nonrecurringbasis. Nonrecurring fair value reserve adjustments resulted in a net loss of $9 million for the year ended December 31, 2013 oncertain commercial mortgage loans. The carrying value of these loans as of December 31, 2013 was $27 million. Valuationreserve adjustments on certain commercial mortgage loans for the year ended December 31, 2012, resulted in a net gain of $2million and a net loss of $7 million for the year ended December 31, 2011. The adjustments were based on discounted cashflows utilizing market rates or the fair value of the underlying real estate collateral and the underlying assets were classified asLevel 3 in the hierarchy.
There were no intangible asset impairments recorded for the years ended December 31, 2013 and 2011. Impairments of $46 millionwere recorded related to the write off of intangible assets for the year ended December 31, 2012. The impairments were primarily based ondiscounted cash flow models, using assumptions and inputs specific to the Company, and those underlying assets are therefore, classified asLevel 3 in the valuation hierarchy. For certain cost method investments, impairments of $21 million, $4 million and $8 million wererecorded for the years ended December 31, 2013, 2012 and 2011, respectively. The methodologies utilized were primarily discountedfuture cash flow and, where appropriate, valuations provided by the general partners taking into consideration investment related expenses.These cost method investments are classified as Level 3 in the valuation hierarchy.
For mortgage servicing rights, valuation reserves decreased, resulting in a gain of $16 million for the year ended December 31, 2013.Similarly, valuation reserve increases of $14 million and $9 million were recorded for the years ended December 31, 2012 and 2011,respectively, for mortgage servicing rights. Mortgage servicing rights are valued based on internal models and classified as Level 3 in thevaluation hierarchy. For real estate and property and equipment related investments, no impairments were recorded for the year endedDecember 31, 2013. Impairments of $4 million and $22 million for the years ended December 31, 2012 and 2011, respectively, wererecorded for real estate investments, some of which were classified as discontinued operations. The impairments for these real estateinvestments were based primarily on appraisal values and the assets were therefore classified as Level 3 in the valuation hierarchy.
Prudential Financial, Inc. 2013 Annual Report 201
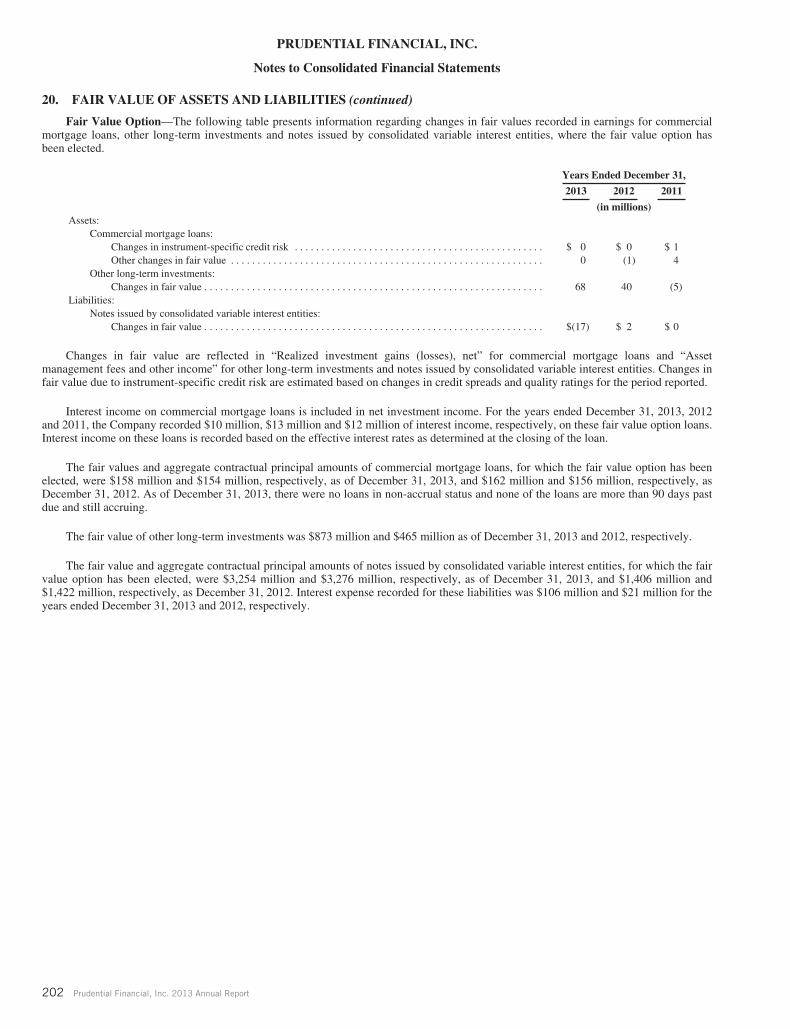
PRUDENTIAL FINANCIAL, INC.
Notes to Consolidated Financial Statements
20. FAIR VALUE OF ASSETS AND LIABILITIES (continued)
Fair Value Option—The following table presents information regarding changes in fair values recorded in earnings for commercialmortgage loans, other long-term investments and notes issued by consolidated variable interest entities, where the fair value option hasbeen elected.
Years Ended December 31,
2013 2012 2011
(in millions)Assets:
Commercial mortgage loans:Changes in instrument-specific credit risk . . . . . . . . . . . . . . . . . . . . . . . . . . . . . . . . . . . . . . . . . . . . . . . $ 0 $ 0 $ 1Other changes in fair value . . . . . . . . . . . . . . . . . . . . . . . . . . . . . . . . . . . . . . . . . . . . . . . . . . . . . . . . . . . 0 (1) 4
Other long-term investments:Changes in fair value . . . . . . . . . . . . . . . . . . . . . . . . . . . . . . . . . . . . . . . . . . . . . . . . . . . . . . . . . . . . . . . . 68 40 (5)
Liabilities:Notes issued by consolidated variable interest entities:
Changes in fair value . . . . . . . . . . . . . . . . . . . . . . . . . . . . . . . . . . . . . . . . . . . . . . . . . . . . . . . . . . . . . . . . $(17) $ 2 $ 0
Changes in fair value are reflected in “Realized investment gains (losses), net” for commercial mortgage loans and “Assetmanagement fees and other income” for other long-term investments and notes issued by consolidated variable interest entities. Changes infair value due to instrument-specific credit risk are estimated based on changes in credit spreads and quality ratings for the period reported.
Interest income on commercial mortgage loans is included in net investment income. For the years ended December 31, 2013, 2012and 2011, the Company recorded $10 million, $13 million and $12 million of interest income, respectively, on these fair value option loans.Interest income on these loans is recorded based on the effective interest rates as determined at the closing of the loan.
The fair values and aggregate contractual principal amounts of commercial mortgage loans, for which the fair value option has beenelected, were $158 million and $154 million, respectively, as of December 31, 2013, and $162 million and $156 million, respectively, asDecember 31, 2012. As of December 31, 2013, there were no loans in non-accrual status and none of the loans are more than 90 days pastdue and still accruing.
The fair value of other long-term investments was $873 million and $465 million as of December 31, 2013 and 2012, respectively.
The fair value and aggregate contractual principal amounts of notes issued by consolidated variable interest entities, for which the fairvalue option has been elected, were $3,254 million and $3,276 million, respectively, as of December 31, 2013, and $1,406 million and$1,422 million, respectively, as December 31, 2012. Interest expense recorded for these liabilities was $106 million and $21 million for theyears ended December 31, 2013 and 2012, respectively.
202 Prudential Financial, Inc. 2013 Annual Report

PRUDENTIAL FINANCIAL, INC.
Notes to Consolidated Financial Statements
20. FAIR VALUE OF ASSETS AND LIABILITIES (continued)
Fair Value of Financial Instruments
The table below presents the carrying amount and fair value by fair value hierarchy level of certain financial instruments that are notreported at fair value. However, in some cases, as described below, the carrying amount equals or approximates fair value.
December 31, 2013 December 31, 2012
Fair ValueCarrying
Amount(1)Fair
ValueCarryingAmount
Level 1 Level 2 Level 3 Total Total Total Total
(in millions)Assets:
Fixed maturities, held-to-maturity . . . . . . . . . . . . . . . . . . . . . . $ 0 $ 2,065 $ 1,488 $ 3,553 $ 3,312 $ 4,511 $ 4,268Commercial mortgage and other loans . . . . . . . . . . . . . . . . . . . 0 639 42,010 42,649 40,850 39,554 36,570Policy loans . . . . . . . . . . . . . . . . . . . . . . . . . . . . . . . . . . . . . . . 0 0 11,766 11,766 11,766 14,592 11,575Other long term investments . . . . . . . . . . . . . . . . . . . . . . . . . . 0 0 2,470 2,470 2,203 2,159 1,995Short-term investments . . . . . . . . . . . . . . . . . . . . . . . . . . . . . . 0 518 0 518 518 57 57Cash and cash equivalents . . . . . . . . . . . . . . . . . . . . . . . . . . . . 3,661 796 0 4,457 4,457 4,500 4,500Accrued investment income . . . . . . . . . . . . . . . . . . . . . . . . . . . 0 3,089 0 3,089 3,089 3,127 3,127Other assets . . . . . . . . . . . . . . . . . . . . . . . . . . . . . . . . . . . . . . . 162 2,147 252 2,561 2,561 2,601 2,601
Total assets . . . . . . . . . . . . . . . . . . . . . . . . . . . . . . . . . . . $3,823 $ 9,254 $57,986 $ 71,063 $ 68,756 $ 71,101 $ 64,693
Liabilities:Policyholders’ account balances—investment contracts . . . . . $ 0 $ 39,347 $57,253 $ 96,600 $ 95,476 $104,200 $101,232Securities sold under agreements to repurchase . . . . . . . . . . . . 0 7,898 0 7,898 7,898 5,818 5,818Cash collateral for loaned securities . . . . . . . . . . . . . . . . . . . . . 0 5,040 0 5,040 5,040 3,941 3,941Short-term debt . . . . . . . . . . . . . . . . . . . . . . . . . . . . . . . . . . . . . 0 2,718 0 2,718 2,669 2,506 2,484Long-term debt . . . . . . . . . . . . . . . . . . . . . . . . . . . . . . . . . . . . . 1,078 19,453 5,038 25,569 23,553 27,497 24,729Notes of consolidated VIEs . . . . . . . . . . . . . . . . . . . . . . . . . . . 0 0 39 39 48 149 171Other liabilities . . . . . . . . . . . . . . . . . . . . . . . . . . . . . . . . . . . . . 0 5,803 266 6,069 6,069 6,356 6,356Separate account liabilities—investment contracts . . . . . . . . . 0 82,071 22,163 104,234 104,234 96,561 96,561
Total liabilities . . . . . . . . . . . . . . . . . . . . . . . . . . . . . . . . $1,078 $162,330 $84,759 $248,167 $244,987 $247,028 $241,292
(1) Carrying values presented herein differ from those in the Company’s Consolidated Statement of Financial Position because certain items within therespective financial statement captions are not considered financial instruments or out of scope under authoritative guidance relating to disclosures ofthe fair value of financial instruments. Financial statement captions excluded from the above table are not considered financial instruments.
The fair values presented above have been determined by using available market information and by applying market valuationmethodologies, as described in more detail below.
Fixed Maturities, Held-to-Maturity
The fair values of public fixed maturity securities are generally based on prices from third-party pricing services, which are reviewedto validate reasonableness. However, for certain public fixed maturity securities and investments in private placement fixed maturitysecurities, this information is either not available or not reliable. For these public fixed maturity securities, the fair value is based onindicative broker quotes, if available, or determined using a discounted cash flow model or internally-developed values. For private fixedmaturities, fair value is determined using a discounted cash flow model. In determining the fair value of certain fixed maturity securities,the discounted cash flow model may also use unobservable inputs, which reflect the Company’s own assumptions about the inputs marketparticipants would use in pricing the security.
Commercial Mortgage and Other Loans
The fair value of most commercial mortgage loans is based upon the present value of the expected future cash flows discounted at theappropriate U.S. Treasury rate or foreign government bond rate (for non-U.S. dollar-denominated loans) plus an appropriate credit spreadfor similar quality loans. The quality ratings for these loans, a primary determinant of the credit spreads and a significant component of thepricing process, are based on an internally-developed methodology.
Certain commercial mortgage loans are valued incorporating other factors, including the terms of the loans, the principal exitstrategies for the loans, prevailing interest rates and credit risk. Other loan valuations are primarily based upon the present value of theexpected future cash flows discounted at the appropriate local government bond rate and local market swap rates or credit default swapspreads, plus an appropriate credit spread and liquidity premium. The credit spread and liquidity premium are a significant component ofthe pricing inputs, and are based upon an internally-developed methodology, which takes into account, among other factors, the creditquality of the loans, the property type of the collateral, the weighted average coupon and the weighted average life of the loans.
Prudential Financial, Inc. 2013 Annual Report 203

PRUDENTIAL FINANCIAL, INC.
Notes to Consolidated Financial Statements
20. FAIR VALUE OF ASSETS AND LIABILITIES (continued)
Policy Loans
During the fourth quarter of 2013, the Company changed the valuation technique used to fair value policy loans. For the period endedDecember 31, 2013, the fair value of policy loans was determined by discounting expected cash flows at the current loan coupon rate. As aresult, the carrying value of the policy loans approximates the fair value for the year ended December 31, 2013. Prior to this change, thefair value of U.S. insurance policy loans was calculated by discounting expected cash flows based upon current U.S. Treasury rates andhistorical loan repayment patterns, while Japanese insurance policy loans used the risk-free proxy based on the yen LIBOR.
Other Long-term Investments
Other long-term investments include investments in joint ventures and limited partnerships. The estimated fair values of these costmethod investments are generally based on the Company’s share of the net asset value (“NAV”) as provided in the financial statements ofthe investees. In certain circumstances, management may adjust the NAV by a premium or discount when it has sufficient evidence tosupport applying such adjustments. For the year end December 31, 2013 and 2012, no such adjustments were made.
Short-Term Investments, Cash and Cash Equivalents, Accrued Investment Income and Other Assets
The Company believes that due to the short-term nature of certain assets, the carrying value approximates fair value. These assetsinclude: certain short-term investments which are not securities, are recorded at amortized cost and include quality loans; cash and cashequivalent instruments; accrued investment income; and other assets that meet the definition of financial instruments, including receivables,such as reinsurance recoverables, unsettled trades, accounts receivable and restricted cash.
Policyholders’ Account Balances—Investment Contracts
Only the portion of policyholders’ account balances related to products that are investment contracts (those without significantmortality or morbidity risk) are reflected in the table above. For fixed deferred annuities, single premium endowments, payout annuitiesand other similar contracts without life contingencies, fair values are derived using discounted projected cash flows based on interest ratesthat are representative of the Company’s financial strength ratings, and hence reflect the Company’s own non-performance risk. Forguaranteed investment contracts, funding agreements, structured settlements without life contingencies and other similar products, fairvalues are derived using discounted projected cash flows based on interest rates being offered for similar contracts with maturitiesconsistent with those of the contracts being valued. For those balances that can be withdrawn by the customer at any time without priornotice or penalty, the fair value is the amount estimated to be payable to the customer as of the reporting date, which is generally thecarrying value. For defined contribution and defined benefit contracts and certain other products, the fair value is the market value of theassets supporting the liabilities.
Securities Sold Under Agreements to Repurchase
The Company receives collateral for selling securities under agreements to repurchase, or pledges collateral under agreements toresell. Repurchase and resale agreements are also generally short-term in nature, and therefore, the carrying amounts of these instrumentsapproximate fair value.
Cash Collateral for Loaned Securities
Cash collateral for loaned securities represents the collateral received or paid in connection with loaning or borrowing securities,similar to the securities sold under agreement to repurchase above. For these transactions, the carrying value of the related asset or liabilityapproximates fair value, as they equal the amount of cash collateral received/paid.
Debt
The fair value of short-term and long-term debt, as well as notes issued by consolidated VIEs, is generally determined by either pricesobtained from independent pricing services, which are validated by the Company, or discounted cash flow models. With the exception ofthe notes issued by consolidated VIEs for which recourse is limited to the assets of the respective VIE and does not extend to the generalcredit of the Company, the fair values of these instruments consider the Company’s own non-performance risk. Discounted cash flowmodels predominately use market observable inputs such as the borrowing rates currently available to the Company for debt and financialinstruments with similar terms and remaining maturities. For commercial paper issuances and other debt with a maturity of less than 90days, the carrying value approximates fair value.
A portion of the senior secured notes issued by Prudential Holdings, LLC (the “IHC debt”) is insured by a third-party financialguarantee insurance policy. The effect of the third-party credit enhancement is not included in the fair value measurement of the IHC debtand the methodologies used to determine fair value consider the Company’s own non-performance risk.
204 Prudential Financial, Inc. 2013 Annual Report

PRUDENTIAL FINANCIAL, INC.
Notes to Consolidated Financial Statements
20. FAIR VALUE OF ASSETS AND LIABILITIES (continued)
Other Liabilities
Other liabilities are primarily payables, such as reinsurance payables, unsettled trades, drafts and accrued expense payables. Due to theshort term until settlement of most of these liabilities, the Company believes that carrying value approximates fair value.
Separate Account Liabilities—Investment Contracts
Only the portion of separate account liabilities related to products that are investments contracts are reflected in the table above.Separate account liabilities are recorded at the amount credited to the contractholder, which reflects the change in fair value of thecorresponding separate account assets including contractholder deposits less withdrawals and fees. Therefore, carrying value approximatesfair value.
21. DERIVATIVE INSTRUMENTS
Types of Derivative Instruments and Derivative Strategies
Interest Rate Contracts
Interest rate swaps, options, and futures are used by the Company to reduce risks from changes in interest rates, manage interest rateexposures arising from mismatches between assets and liabilities (including duration mismatches) and to hedge against changes in thevalue of assets it owns or anticipates acquiring or selling. Swaps may be attributed to specific assets or liabilities or may be used on aportfolio basis. Under interest rate swaps, the Company agrees with other parties to exchange, at specified intervals, the difference betweenfixed-rate and floating-rate interest amounts calculated by reference to an agreed upon notional principal amount.
The Company also uses swaptions, interest rate caps, and interest rate floors to manage interest rate risk. A swaption is an option toenter into a swap with a forward starting effective date. The Company pays a premium for purchased swaptions and receives a premium forwritten swaptions. In an interest rate cap, the buyer receives payments at the end of each period in which the interest rate exceeds theagreed strike price. Similarly, in an interest rate floor, the buyer receives payments at the end of each period in which the interest rate isbelow the agreed strike price. Swaptions and interest rate caps and floors are included in interest rate options.
In exchange-traded interest rate futures transactions, the Company purchases or sells a specified number of contracts, the values ofwhich are determined by the values of underlying referenced investments, and posts variation margin on a daily basis in an amount equal tothe difference in the daily market values of those contracts. The Company enters into exchange-traded futures with regulated futurescommission’s merchants who are members of a trading exchange.
Equity Contracts
Equity index options are contracts which will settle in cash based on differentials in the underlying indices at the time of exercise andthe strike price. The Company uses combinations of purchases and sales of equity index options to hedge the effects of adverse changes inequity indices within a predetermined range.
Foreign Exchange Contracts
Currency derivatives, including currency futures, options, forwards, and swaps, are used by the Company to reduce risks from changesin currency exchange rates with respect to investments denominated in foreign currencies that the Company either holds or intends toacquire or sell, and to hedge the currency risk associated with net investments in foreign operations and anticipated earnings of its foreignoperations.
Under currency forwards, the Company agrees with other parties to deliver a specified amount of an identified currency at a specifiedfuture date. Typically, the price is agreed upon at the time of the contract and payment for such a contract is made at the specified futuredate. As noted above, the Company uses currency forwards to mitigate the impact of changes in currency exchange rates on U.S. dollarequivalent earnings generated by certain of its non-U.S. businesses, primarily its international insurance and investments operations. TheCompany executes forward sales of the hedged currency in exchange for U.S. dollars at a specified exchange rate. The maturities of theseforwards correspond with the future periods in which the non-U.S. dollar-denominated earnings are expected to be generated. Theseearnings hedges do not qualify for hedge accounting.
Under currency swaps, the Company agrees with other parties to exchange, at specified intervals, the difference between one currencyand another at an exchange rate and calculated by reference to an agreed principal amount. Generally, the principal amount of eachcurrency is exchanged at the beginning and termination of the currency swap by each party.
Credit Contracts
The Company writes credit default swaps for which it receives a premium to insure credit risk. These are used by the Company toenhance the return on the Company’s investment portfolio by creating credit exposure similar to an investment in public fixed maturity
Prudential Financial, Inc. 2013 Annual Report 205

PRUDENTIAL FINANCIAL, INC.
Notes to Consolidated Financial Statements
21. DERIVATIVE INSTRUMENTS (continued)
cash instruments. With these derivatives, the Company sells credit protection on an identified name, or an index of names, and in returnreceives a quarterly premium. This premium or credit spread generally corresponds to the difference between the yield on the referencedname’s (or an index’s referenced names) public fixed maturity cash instruments and swap rates, at the time the agreement is executed. Ifthere is an event of default by the referenced name or one of the referenced names in the index, as defined by the agreement, then theCompany is obligated to pay the referenced amount of the contract to the counterparty and receive in return the referenced defaultedsecurity or similar security or (in the case of a credit default index) pay the referenced amount less the auction recovery rate. See creditderivatives written section for further discussion of guarantees. In addition to selling credit protection the Company has purchased creditprotection using credit derivatives in order to hedge specific credit exposures in the Company’s investment portfolio.
Other Contracts
TBAs. The Company uses “to be announced” (“TBA”) forward contracts to gain exposure to the investment risk and return ofmortgage-backed securities. TBA transactions can help the Company enhance the return on its investment portfolio, and can provide amore liquid and cost effective method of achieving these goals than purchasing or selling individual mortgage-backed pools. Typically, theprice is agreed upon at the time of the contract and payment for such a contract is made at a specified future date. Additionally, pursuant tothe Company’s mortgage dollar roll program, TBAs or mortgage-backed securities are transferred to counterparties with a correspondingagreement to repurchase them at a future date. These transactions do not qualify as secured borrowings and are accounted for asderivatives.
Loan Commitments. In its mortgage operations, the Company enters into commitments to fund commercial mortgage loans atspecified interest rates and other applicable terms within specified periods of time. These commitments are legally binding agreements toextend credit to a counterparty. Loan commitments for loans that will be held for sale are recognized as derivatives and recorded at fairvalue. The determination of the fair value of loan commitments accounted for as derivatives considers various factors including, amongothers, terms of the related loan, the intended exit strategy for the loans based upon either securitization valuation models or investorpurchase commitments, prevailing interest rates, origination income or expense, and the value of service rights. Loan commitments thatrelate to the origination of mortgage loans that will be held for investment are not accounted for as derivatives and accordingly are notrecognized in the Company’s financial statements. See Note 23 for a further discussion of these loan commitments.
Embedded Derivatives. The Company sells variable annuity products, which may include guaranteed benefit features that areaccounted for as embedded derivatives. These embedded derivatives are marked to market through “Realized investment gains (losses),net” based on the change in value of the underlying contractual guarantees, which are determined using valuation models. The Companymaintains a portfolio of derivative instruments that is intended to economically hedge the risks related to the above products’ features. Thederivatives may include, but are not limited to equity options, total return swaps, interest rate swaptions, caps, floors, and other instruments.
The Company invests in fixed maturities that, in addition to a stated coupon, provide a return based upon the results of an underlyingportfolio of fixed income investments and related investment activity. The Company accounts for these investments as available-for-salefixed maturities containing embedded derivatives. Such embedded derivatives are marked to market through “Realized investment gains(losses), net,” based upon the change in value of the underlying portfolio.
Synthetic Guarantees. The Company sells synthetic guaranteed investment contracts, through both full service and investment-onlysales channels, to qualified pension plans. The assets are owned by the trustees of such plans, who invest the assets according to thecontract terms agreed to with the Company. The contracts contain a guarantee of a minimum rate of return on participant balancessupported by the underlying assets, and a guarantee of liquidity to meet certain participant-initiated withdrawals from the contract. UnderU.S. GAAP, these contracts are accounted for as derivatives and recorded at fair value.
206 Prudential Financial, Inc. 2013 Annual Report

PRUDENTIAL FINANCIAL, INC.
Notes to Consolidated Financial Statements
21. DERIVATIVE INSTRUMENTS (continued)
The table below provides a summary of the gross notional amount and fair value of derivatives contracts used in a non-broker-dealercapacity by the primary underlying, excluding embedded derivatives which are recorded with the associated host. Many derivativeinstruments contain multiple underlyings. The fair value amounts below represent the gross fair value of derivative contracts prior to takinginto account the netting effects of master netting agreements and cash collateral held with the same counterparty. This netting impactresults in total derivative assets of $533 million and $3,075 million as of December 31, 2013 and 2012, respectively, and total derivativeliabilities of $2,156 million and $307 million as of December 31, 2013 and 2012, respectively, reflected in the Consolidated Statement ofFinancial Position.
December 31, 2013 December 31, 2012
Primary Underlying/Instrument Type
Gross Fair Value Gross Fair Value
Notional Assets Liabilities Notional Assets Liabilities
(in millions)Derivatives Designated as Hedge Accounting
Instruments:Interest Rate
Interest Rate Swaps . . . . . . . . . . . . . . . . . . . . . . . . . $ 2,393 $ 8 $ (228) $ 3,374 $ 26 $ (396)Foreign Currency
Foreign Currency Forwards . . . . . . . . . . . . . . . . . . . 497 1 (27) 639 1 (35)Currency/Interest Rate
Foreign Currency Swaps . . . . . . . . . . . . . . . . . . . . . 8,903 216 (530) 6,373 128 (342)
Total Qualifying Derivatives . . . . . . . . . . . . . . . . . $ 11,793 $ 225 $ (785) $ 10,386 $ 155 $ (773)
Derivatives Not Qualifying as Hedge AccountingInstruments:
Interest RateInterest Rate Swaps . . . . . . . . . . . . . . . . . . . . . . . . . $118,419 $3,835 $(5,102) $108,581 $ 7,779 $(3,301)Interest Rate Futures . . . . . . . . . . . . . . . . . . . . . . . . 14,825 8 (5) 6,749 11 (12)Interest Rate Options . . . . . . . . . . . . . . . . . . . . . . . . 23,873 369 (283) 25,250 895 (141)Interest Rate Forwards . . . . . . . . . . . . . . . . . . . . . . . 1,452 0 (6) 660 0 0
Foreign CurrencyForeign Currency Forwards . . . . . . . . . . . . . . . . . . . 13,357 596 (358) 14,638 371 (397)Foreign Currency Options . . . . . . . . . . . . . . . . . . . . 74 5 0 92 13 0
Currency/Interest RateForeign Currency Swaps . . . . . . . . . . . . . . . . . . . . . 7,072 339 (254) 5,304 239 (152)
CreditCredit Default Swaps . . . . . . . . . . . . . . . . . . . . . . . . 1,904 3 (49) 3,250 19 (84)
EquityEquity Futures . . . . . . . . . . . . . . . . . . . . . . . . . . . . . 262 1 (1) 6,518 0 (165)Equity Options . . . . . . . . . . . . . . . . . . . . . . . . . . . . . 61,301 406 (19) 42,757 603 (40)Total Return Swaps . . . . . . . . . . . . . . . . . . . . . . . . . 11,389 1 (466) 5,779 8 (158)
CommodityCommodity Futures . . . . . . . . . . . . . . . . . . . . . . . . . 37 1 0 0 0 0
Synthetic GIC’s . . . . . . . . . . . . . . . . . . . . . . . . . . . . . . . 60,758 8 0 64,359 6 0
Total Non-Qualifying Derivatives(1) . . . . . . . . . . $314,723 $5,572 $(6,543) $283,937 $ 9,944 $(4,450)
Total Derivatives(2) . . . . . . . . . . . . . . . . . . . . . . . . $326,516 $5,797 $(7,328) $294,323 $10,099 $(5,223)
(1) Based on notional amounts, most of the Company’s derivatives do not qualify for hedge accounting as follows: i) derivatives that economically hedgeembedded derivatives do not qualify for hedge accounting because changes in the fair value of the embedded derivatives are already recorded in netincome, ii) derivatives that are utilized as macro hedges of the Company’s exposure to various risks typically do not qualify for hedge accountingbecause they do not meet the criteria required under portfolio hedge accounting rules, and iii) synthetic guaranteed investment contracts (GIC’s), whichare product standalone derivatives do not qualify as hedging instruments under hedge accounting rules.
(2) Excludes embedded derivatives which contain multiple underlyings. The fair value of these embedded derivatives was a net liability of $430 million asof December 31, 2013, and a net liability of $3,438 million as of December 31, 2012, included in “Future policy benefits” and “Fixed maturities,available-for-sale.”
Prudential Financial, Inc. 2013 Annual Report 207
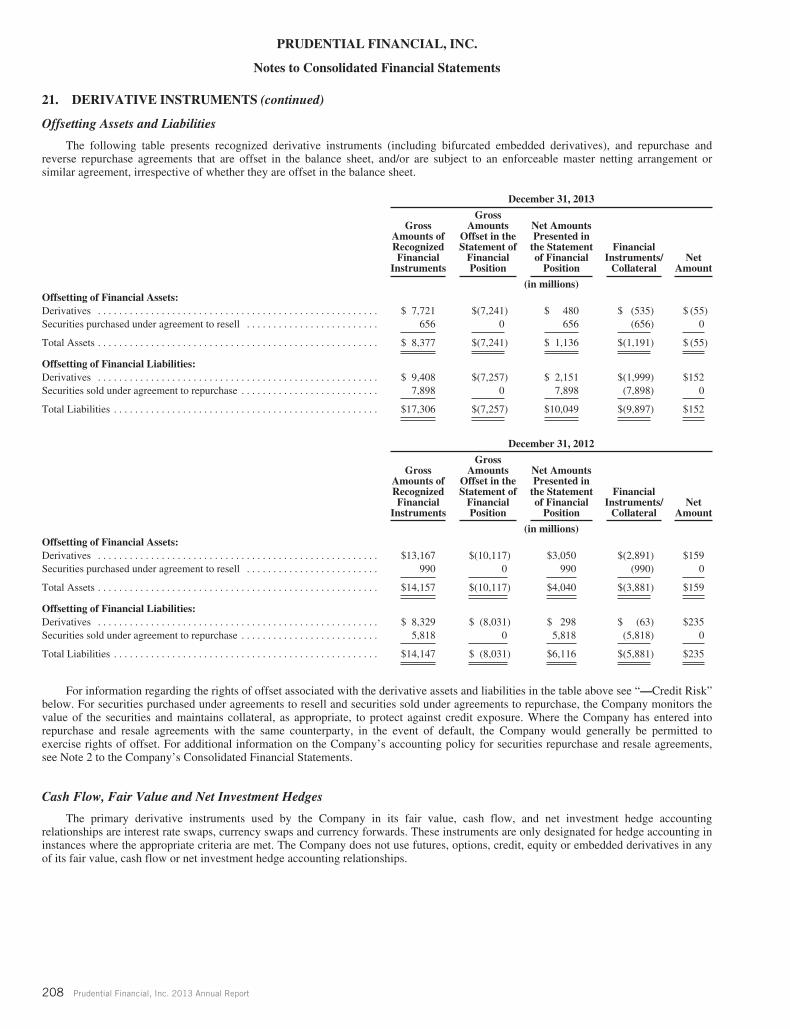
PRUDENTIAL FINANCIAL, INC.
Notes to Consolidated Financial Statements
21. DERIVATIVE INSTRUMENTS (continued)
Offsetting Assets and Liabilities
The following table presents recognized derivative instruments (including bifurcated embedded derivatives), and repurchase andreverse repurchase agreements that are offset in the balance sheet, and/or are subject to an enforceable master netting arrangement orsimilar agreement, irrespective of whether they are offset in the balance sheet.
December 31, 2013
GrossAmounts ofRecognizedFinancial
Instruments
GrossAmounts
Offset in theStatement of
FinancialPosition
Net AmountsPresented in
the Statementof Financial
Position
FinancialInstruments/
CollateralNet
Amount
(in millions)Offsetting of Financial Assets:Derivatives . . . . . . . . . . . . . . . . . . . . . . . . . . . . . . . . . . . . . . . . . . . . . . . . . . . . . $ 7,721 $(7,241) $ 480 $ (535) $ (55)Securities purchased under agreement to resell . . . . . . . . . . . . . . . . . . . . . . . . . 656 0 656 (656) 0
Total Assets . . . . . . . . . . . . . . . . . . . . . . . . . . . . . . . . . . . . . . . . . . . . . . . . . . . . . $ 8,377 $(7,241) $ 1,136 $(1,191) $ (55)
Offsetting of Financial Liabilities:Derivatives . . . . . . . . . . . . . . . . . . . . . . . . . . . . . . . . . . . . . . . . . . . . . . . . . . . . . $ 9,408 $(7,257) $ 2,151 $(1,999) $152Securities sold under agreement to repurchase . . . . . . . . . . . . . . . . . . . . . . . . . . 7,898 0 7,898 (7,898) 0
Total Liabilities . . . . . . . . . . . . . . . . . . . . . . . . . . . . . . . . . . . . . . . . . . . . . . . . . . $17,306 $(7,257) $10,049 $(9,897) $152
December 31, 2012
GrossAmounts ofRecognizedFinancial
Instruments
GrossAmounts
Offset in theStatement of
FinancialPosition
Net AmountsPresented in
the Statementof Financial
Position
FinancialInstruments/
CollateralNet
Amount
(in millions)Offsetting of Financial Assets:Derivatives . . . . . . . . . . . . . . . . . . . . . . . . . . . . . . . . . . . . . . . . . . . . . . . . . . . . . $13,167 $(10,117) $3,050 $(2,891) $159Securities purchased under agreement to resell . . . . . . . . . . . . . . . . . . . . . . . . . 990 0 990 (990) 0
Total Assets . . . . . . . . . . . . . . . . . . . . . . . . . . . . . . . . . . . . . . . . . . . . . . . . . . . . . $14,157 $(10,117) $4,040 $(3,881) $159
Offsetting of Financial Liabilities:Derivatives . . . . . . . . . . . . . . . . . . . . . . . . . . . . . . . . . . . . . . . . . . . . . . . . . . . . . $ 8,329 $ (8,031) $ 298 $ (63) $235Securities sold under agreement to repurchase . . . . . . . . . . . . . . . . . . . . . . . . . . 5,818 0 5,818 (5,818) 0
Total Liabilities . . . . . . . . . . . . . . . . . . . . . . . . . . . . . . . . . . . . . . . . . . . . . . . . . . $14,147 $ (8,031) $6,116 $(5,881) $235
For information regarding the rights of offset associated with the derivative assets and liabilities in the table above see “—Credit Risk”below. For securities purchased under agreements to resell and securities sold under agreements to repurchase, the Company monitors thevalue of the securities and maintains collateral, as appropriate, to protect against credit exposure. Where the Company has entered intorepurchase and resale agreements with the same counterparty, in the event of default, the Company would generally be permitted toexercise rights of offset. For additional information on the Company’s accounting policy for securities repurchase and resale agreements,see Note 2 to the Company’s Consolidated Financial Statements.
Cash Flow, Fair Value and Net Investment Hedges
The primary derivative instruments used by the Company in its fair value, cash flow, and net investment hedge accountingrelationships are interest rate swaps, currency swaps and currency forwards. These instruments are only designated for hedge accounting ininstances where the appropriate criteria are met. The Company does not use futures, options, credit, equity or embedded derivatives in anyof its fair value, cash flow or net investment hedge accounting relationships.
208 Prudential Financial, Inc. 2013 Annual Report

PRUDENTIAL FINANCIAL, INC.
Notes to Consolidated Financial Statements
21. DERIVATIVE INSTRUMENTS (continued)
The following table provides the financial statement classification and impact of derivatives used in qualifying and non-qualifyinghedge relationships, excluding the offset of the hedged item in an effective hedge relationship.
Year Ended December 31, 2013
RealizedInvestment
Gains/(Losses)
NetInvestment
IncomeOther
IncomeInterestExpense
InterestCredited
To Policyholders’AccountBalances
AccumulatedOther
ComprehensiveIncome(1)
(in millions)Derivatives Designated as Hedge Accounting Instruments:Fair value hedgesInterest Rate . . . . . . . . . . . . . . . . . . . . . . . . . . . . . . . . . . . . . . . . . . $ 103 $(71) $ 0 $ 0 $20 $ 0Currency . . . . . . . . . . . . . . . . . . . . . . . . . . . . . . . . . . . . . . . . . . . . (80) (1) 0 0 0 0
Total fair value hedges . . . . . . . . . . . . . . . . . . . . . . . . . . . . . . . . . 23 (72) 0 0 20 0
Cash flow hedgesInterest Rate . . . . . . . . . . . . . . . . . . . . . . . . . . . . . . . . . . . . . . . . . . 0 0 0 (23) 0 26Currency/Interest Rate . . . . . . . . . . . . . . . . . . . . . . . . . . . . . . . . . . 0 2 (91) 0 0 (215)
Total cash flow hedges . . . . . . . . . . . . . . . . . . . . . . . . . . . . . . . . . 0 2 (91) (23) 0 (189)
Net investment hedgesCurrency(2) . . . . . . . . . . . . . . . . . . . . . . . . . . . . . . . . . . . . . . . . . . 0 0 (4) 0 0 6Currency/Interest Rate . . . . . . . . . . . . . . . . . . . . . . . . . . . . . . . . . . 0 0 0 0 0 233
Total net investment hedges . . . . . . . . . . . . . . . . . . . . . . . . . . . . . 0 0 (4) 0 0 239
Derivatives Not Qualifying as Hedge AccountingInstruments:
Interest Rate . . . . . . . . . . . . . . . . . . . . . . . . . . . . . . . . . . . . . . . . . . (5,254) 0 0 0 0 0Currency . . . . . . . . . . . . . . . . . . . . . . . . . . . . . . . . . . . . . . . . . . . . (591) 0 0 0 0 0Currency/Interest Rate . . . . . . . . . . . . . . . . . . . . . . . . . . . . . . . . . . 131 0 (2) 0 0 0Credit . . . . . . . . . . . . . . . . . . . . . . . . . . . . . . . . . . . . . . . . . . . . . . . (4) 0 0 0 0 0Equity . . . . . . . . . . . . . . . . . . . . . . . . . . . . . . . . . . . . . . . . . . . . . . (3,684) 0 0 0 0 0Commodity . . . . . . . . . . . . . . . . . . . . . . . . . . . . . . . . . . . . . . . . . . 1 0 0 0 0 0Embedded Derivatives . . . . . . . . . . . . . . . . . . . . . . . . . . . . . . . . . . 3,752 0 0 0 0 0
Total non-qualifying hedges . . . . . . . . . . . . . . . . . . . . . . . . . . . . . (5,649) 0 (2) 0 0 0
Total . . . . . . . . . . . . . . . . . . . . . . . . . . . . . . . . . . . . . . . . . . . . . . . $(5,626) $(70) $(97) $(23) $20 $50
Prudential Financial, Inc. 2013 Annual Report 209

PRUDENTIAL FINANCIAL, INC.
Notes to Consolidated Financial Statements
21. DERIVATIVE INSTRUMENTS (continued)Year Ended December 31, 2012
RealizedInvestment
Gains/(Losses)
NetInvestment
IncomeOther
IncomeInterestExpense
InterestCredited
To Policyholders’AccountBalances
AccumulatedOther
ComprehensiveIncome(1)
(in millions)Derivatives Designated as Hedge Accounting Instruments:Fair value hedgesInterest Rate . . . . . . . . . . . . . . . . . . . . . . . . . . . . . . . . . . . . . . . . . . $ 22 $ (92) $ 0 $ 4 $33 $ 0Currency . . . . . . . . . . . . . . . . . . . . . . . . . . . . . . . . . . . . . . . . . . . . (37) (3) 0 0 0 0
Total fair value hedges . . . . . . . . . . . . . . . . . . . . . . . . . . . . . . . . . (15) (95) 0 4 33 0
Cash flow hedgesInterest Rate . . . . . . . . . . . . . . . . . . . . . . . . . . . . . . . . . . . . . . . . . . 0 0 0 (19) (1) 14Currency/Interest Rate . . . . . . . . . . . . . . . . . . . . . . . . . . . . . . . . . . 0 (5) (20) 0 0 (185)
Total cash flow hedges . . . . . . . . . . . . . . . . . . . . . . . . . . . . . . . . . 0 (5) (20) (19) (1) (171)
Net investment hedgesCurrency(2) . . . . . . . . . . . . . . . . . . . . . . . . . . . . . . . . . . . . . . . . . . (1) 0 0 0 0 (9)Currency/Interest Rate . . . . . . . . . . . . . . . . . . . . . . . . . . . . . . . . . . 0 0 0 0 0 228
Total net investment hedges . . . . . . . . . . . . . . . . . . . . . . . . . . . . . (1) 0 0 0 0 219
Derivatives Not Qualifying as Hedge AccountingInstruments:
Interest Rate . . . . . . . . . . . . . . . . . . . . . . . . . . . . . . . . . . . . . . . . . . 413 0 0 0 0 0Currency . . . . . . . . . . . . . . . . . . . . . . . . . . . . . . . . . . . . . . . . . . . . (64) 0 0 0 0 0Currency/Interest Rate . . . . . . . . . . . . . . . . . . . . . . . . . . . . . . . . . . 235 0 0 0 0 0Credit . . . . . . . . . . . . . . . . . . . . . . . . . . . . . . . . . . . . . . . . . . . . . . . (34) 0 0 0 0 0Equity . . . . . . . . . . . . . . . . . . . . . . . . . . . . . . . . . . . . . . . . . . . . . . (2,302) 0 0 0 0 0Commodity . . . . . . . . . . . . . . . . . . . . . . . . . . . . . . . . . . . . . . . . . . 0 0 0 0 0 0Embedded Derivatives . . . . . . . . . . . . . . . . . . . . . . . . . . . . . . . . . . 251 0 0 0 0 0
Total non-qualifying hedges . . . . . . . . . . . . . . . . . . . . . . . . . . . . . (1,501) 0 0 0 0 0
Total . . . . . . . . . . . . . . . . . . . . . . . . . . . . . . . . . . . . . . . . . . . . . . . $(1,517) $(100) $(20) $(15) $32 $48
210 Prudential Financial, Inc. 2013 Annual Report
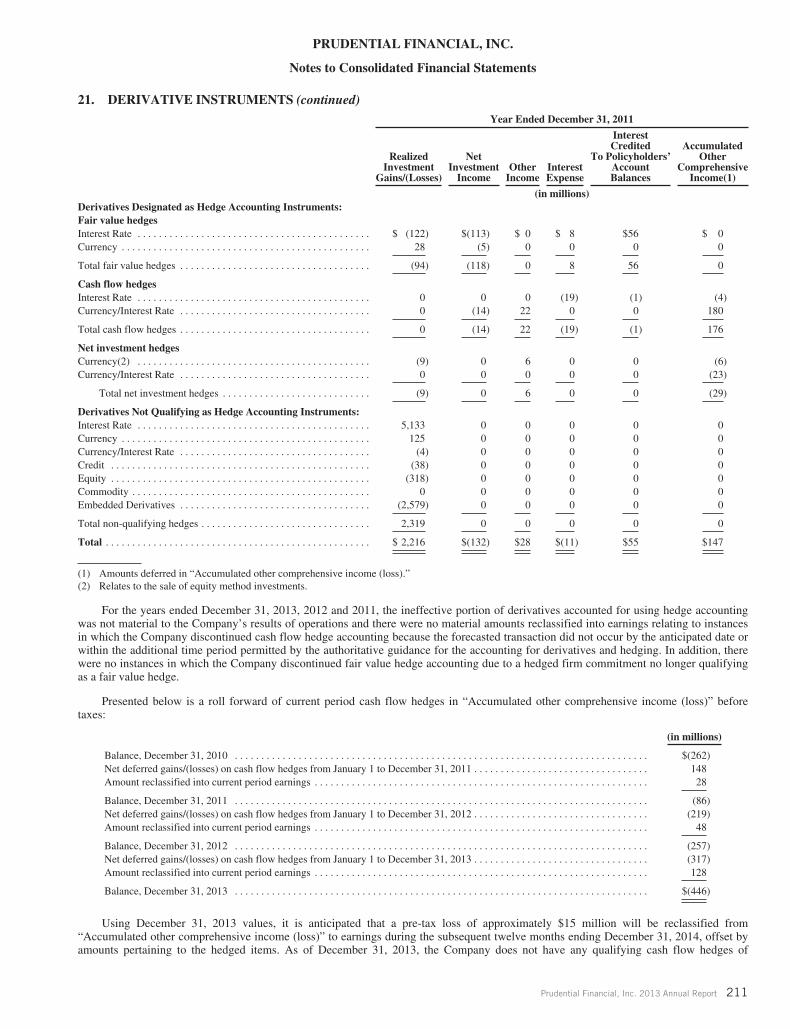
PRUDENTIAL FINANCIAL, INC.
Notes to Consolidated Financial Statements
21. DERIVATIVE INSTRUMENTS (continued)Year Ended December 31, 2011
RealizedInvestment
Gains/(Losses)
NetInvestment
IncomeOther
IncomeInterestExpense
InterestCredited
To Policyholders’AccountBalances
AccumulatedOther
ComprehensiveIncome(1)
(in millions)Derivatives Designated as Hedge Accounting Instruments:Fair value hedgesInterest Rate . . . . . . . . . . . . . . . . . . . . . . . . . . . . . . . . . . . . . . . . . . . . $ (122) $(113) $ 0 $ 8 $56 $ 0Currency . . . . . . . . . . . . . . . . . . . . . . . . . . . . . . . . . . . . . . . . . . . . . . . 28 (5) 0 0 0 0
Total fair value hedges . . . . . . . . . . . . . . . . . . . . . . . . . . . . . . . . . . . . (94) (118) 0 8 56 0
Cash flow hedgesInterest Rate . . . . . . . . . . . . . . . . . . . . . . . . . . . . . . . . . . . . . . . . . . . . 0 0 0 (19) (1) (4)Currency/Interest Rate . . . . . . . . . . . . . . . . . . . . . . . . . . . . . . . . . . . . 0 (14) 22 0 0 180
Total cash flow hedges . . . . . . . . . . . . . . . . . . . . . . . . . . . . . . . . . . . . 0 (14) 22 (19) (1) 176
Net investment hedgesCurrency(2) . . . . . . . . . . . . . . . . . . . . . . . . . . . . . . . . . . . . . . . . . . . . (9) 0 6 0 0 (6)Currency/Interest Rate . . . . . . . . . . . . . . . . . . . . . . . . . . . . . . . . . . . . 0 0 0 0 0 (23)
Total net investment hedges . . . . . . . . . . . . . . . . . . . . . . . . . . . . (9) 0 6 0 0 (29)
Derivatives Not Qualifying as Hedge Accounting Instruments:Interest Rate . . . . . . . . . . . . . . . . . . . . . . . . . . . . . . . . . . . . . . . . . . . . 5,133 0 0 0 0 0Currency . . . . . . . . . . . . . . . . . . . . . . . . . . . . . . . . . . . . . . . . . . . . . . . 125 0 0 0 0 0Currency/Interest Rate . . . . . . . . . . . . . . . . . . . . . . . . . . . . . . . . . . . . (4) 0 0 0 0 0Credit . . . . . . . . . . . . . . . . . . . . . . . . . . . . . . . . . . . . . . . . . . . . . . . . . (38) 0 0 0 0 0Equity . . . . . . . . . . . . . . . . . . . . . . . . . . . . . . . . . . . . . . . . . . . . . . . . . (318) 0 0 0 0 0Commodity . . . . . . . . . . . . . . . . . . . . . . . . . . . . . . . . . . . . . . . . . . . . . 0 0 0 0 0 0Embedded Derivatives . . . . . . . . . . . . . . . . . . . . . . . . . . . . . . . . . . . . (2,579) 0 0 0 0 0
Total non-qualifying hedges . . . . . . . . . . . . . . . . . . . . . . . . . . . . . . . . 2,319 0 0 0 0 0
Total . . . . . . . . . . . . . . . . . . . . . . . . . . . . . . . . . . . . . . . . . . . . . . . . . . $ 2,216 $(132) $28 $(11) $55 $147
(1) Amounts deferred in “Accumulated other comprehensive income (loss).”(2) Relates to the sale of equity method investments.
For the years ended December 31, 2013, 2012 and 2011, the ineffective portion of derivatives accounted for using hedge accountingwas not material to the Company’s results of operations and there were no material amounts reclassified into earnings relating to instancesin which the Company discontinued cash flow hedge accounting because the forecasted transaction did not occur by the anticipated date orwithin the additional time period permitted by the authoritative guidance for the accounting for derivatives and hedging. In addition, therewere no instances in which the Company discontinued fair value hedge accounting due to a hedged firm commitment no longer qualifyingas a fair value hedge.
Presented below is a roll forward of current period cash flow hedges in “Accumulated other comprehensive income (loss)” beforetaxes:
(in millions)
Balance, December 31, 2010 . . . . . . . . . . . . . . . . . . . . . . . . . . . . . . . . . . . . . . . . . . . . . . . . . . . . . . . . . . . . . . . . . . . . . . . . . . . . . . $(262)Net deferred gains/(losses) on cash flow hedges from January 1 to December 31, 2011 . . . . . . . . . . . . . . . . . . . . . . . . . . . . . . . . . 148Amount reclassified into current period earnings . . . . . . . . . . . . . . . . . . . . . . . . . . . . . . . . . . . . . . . . . . . . . . . . . . . . . . . . . . . . . . . 28
Balance, December 31, 2011 . . . . . . . . . . . . . . . . . . . . . . . . . . . . . . . . . . . . . . . . . . . . . . . . . . . . . . . . . . . . . . . . . . . . . . . . . . . . . . (86)Net deferred gains/(losses) on cash flow hedges from January 1 to December 31, 2012 . . . . . . . . . . . . . . . . . . . . . . . . . . . . . . . . . (219)Amount reclassified into current period earnings . . . . . . . . . . . . . . . . . . . . . . . . . . . . . . . . . . . . . . . . . . . . . . . . . . . . . . . . . . . . . . . 48
Balance, December 31, 2012 . . . . . . . . . . . . . . . . . . . . . . . . . . . . . . . . . . . . . . . . . . . . . . . . . . . . . . . . . . . . . . . . . . . . . . . . . . . . . . (257)Net deferred gains/(losses) on cash flow hedges from January 1 to December 31, 2013 . . . . . . . . . . . . . . . . . . . . . . . . . . . . . . . . . (317)Amount reclassified into current period earnings . . . . . . . . . . . . . . . . . . . . . . . . . . . . . . . . . . . . . . . . . . . . . . . . . . . . . . . . . . . . . . . 128
Balance, December 31, 2013 . . . . . . . . . . . . . . . . . . . . . . . . . . . . . . . . . . . . . . . . . . . . . . . . . . . . . . . . . . . . . . . . . . . . . . . . . . . . . . $(446)
Using December 31, 2013 values, it is anticipated that a pre-tax loss of approximately $15 million will be reclassified from“Accumulated other comprehensive income (loss)” to earnings during the subsequent twelve months ending December 31, 2014, offset byamounts pertaining to the hedged items. As of December 31, 2013, the Company does not have any qualifying cash flow hedges of
Prudential Financial, Inc. 2013 Annual Report 211

PRUDENTIAL FINANCIAL, INC.
Notes to Consolidated Financial Statements
21. DERIVATIVE INSTRUMENTS (continued)
forecasted transactions other than those related to the variability of the payment or receipt of interest or foreign currency amounts onexisting financial instruments. The maximum length of time for which these variable cash flows are hedged is 25 years. Income amountsdeferred in “Accumulated other comprehensive income (loss)” as a result of cash flow hedges are included in “Net unrealized investmentgains (losses)” in the Consolidated Statements of Equity.
For effective net investment hedges, the amounts, before applicable taxes, recorded in the cumulative translation adjustment accountwithin “Accumulated other comprehensive income (loss)” were $356 million in 2013, $117 million in 2012, and $(102) million in 2011.
Credit Derivatives WrittenThe following table sets forth the Company’s exposure from credit derivatives where the Company has written credit protection, by
NAIC rating of the underlying credits as of December 31, 2013 and 2012. The Company’s maximum amount at risk under these creditderivatives listed below assumes the value of the underlying referenced securities become worthless. These credit derivatives havematurities of less than 2 years. The table excludes a credit derivative related to surplus notes issued by a subsidiary of Prudential Insuranceand embedded derivatives contained in externally-managed investments in the European market.
December 31, 2013
Single Name Credit Default Index Total
NAICDesignation Notional Fair Value Notional Fair Value Notional Fair Value
(in millions)1 $0 $0 $0 $0 $0 $02 5 0 0 0 5 0
Subtotal . . . . . . . . . . . . . . . . . . . . . . . . . . . 5 0 0 0 5 03 0 0 0 0 0 04 0 0 0 0 0 05 0 0 0 0 0 06 0 0 0 0 0 0
Subtotal . . . . . . . . . . . . . . . . . . . . . . . . . . . 0 0 0 0 0 0
Total . . . . . . . . . . . . . . . . . . . . . . . . . . . . . $5 $0 $0 $0 $5 $0
December 31, 2012
Single Name Credit Default Index Total
NAICDesignation Notional Fair Value Notional Fair Value Notional Fair Value
(in millions)1 $275 $0 $ 0 $0 $ 275 $02 45 0 0 0 45 0
Subtotal . . . . . . . . . . . . . . . . . . . . . . . . . . . 320 0 0 0 320 03 0 0 750 2 750 24 0 0 0 0 0 05 0 0 0 0 0 06 0 0 0 0 0 0
Subtotal . . . . . . . . . . . . . . . . . . . . . . . . . . . 0 0 750 2 750 2
Total . . . . . . . . . . . . . . . . . . . . . . . . . . . . . $320 $0 $750 $2 $1,070 $2
The following table sets forth the composition of the Company’s credit derivatives where the Company has written credit protectionby industry category as of the dates indicated.
December 31, 2013 December 31, 2012
Industry Notional Fair Value Notional Fair Value
(in millions)Corporate Securities:
Consumer Non-cyclical . . . . . . . . . . . . . . . . . . . . . . . . . . . . . . . . . . . . . . . . . . . . . $0 $0 $ 120 $0Capital Goods . . . . . . . . . . . . . . . . . . . . . . . . . . . . . . . . . . . . . . . . . . . . . . . . . . . . 0 0 90 0Basic Industry . . . . . . . . . . . . . . . . . . . . . . . . . . . . . . . . . . . . . . . . . . . . . . . . . . . . 0 0 40 0Transportation . . . . . . . . . . . . . . . . . . . . . . . . . . . . . . . . . . . . . . . . . . . . . . . . . . . . 0 0 25 0Consumer Cyclical . . . . . . . . . . . . . . . . . . . . . . . . . . . . . . . . . . . . . . . . . . . . . . . . 0 0 20 0Energy . . . . . . . . . . . . . . . . . . . . . . . . . . . . . . . . . . . . . . . . . . . . . . . . . . . . . . . . . . 0 0 20 0Communication . . . . . . . . . . . . . . . . . . . . . . . . . . . . . . . . . . . . . . . . . . . . . . . . . . . 5 0 5 0Finance . . . . . . . . . . . . . . . . . . . . . . . . . . . . . . . . . . . . . . . . . . . . . . . . . . . . . . . . . 0 0 0 0Other(1) . . . . . . . . . . . . . . . . . . . . . . . . . . . . . . . . . . . . . . . . . . . . . . . . . . . . . . . . . 0 0 750 2
Total Credit Derivatives . . . . . . . . . . . . . . . . . . . . . . . . . . . . . . . . . . . . . . . . . . . . . . . . $5 $0 $1,070 $2
212 Prudential Financial, Inc. 2013 Annual Report

PRUDENTIAL FINANCIAL, INC.
Notes to Consolidated Financial Statements
21. DERIVATIVE INSTRUMENTS (continued)
(1) Includes Credit Default Index derivative with various industry categories.
In addition to the above, the Company entered into a credit derivative that will require the Company to make certain payments in theevent of deterioration in the value of the surplus notes issued by a subsidiary of Prudential Insurance. The notional amount of this creditderivative is $500 million and the fair value as of December 31, 2013 and 2012 was a liability of $4 million and $32 million, respectively.No collateral was pledged in either period.
In addition to writing credit protection, the Company has purchased credit protection using credit derivatives in order to hedge specificcredit exposures in the Company’s investment portfolio. As of December 31, 2013 and 2012, the Company had $1,399 million and $1,680million of outstanding notional amounts, respectively, reported at fair value as a liability of $42 million and $35 million, respectively.
Prior to disposal in the fourth quarter of 2013, the Company held certain externally-managed investments in the European marketwhich contained embedded derivatives. Their fair values were primarily driven by changes in credit spreads. These investments weremedium-term notes that were collateralized by investment portfolios primarily consisting of investment grade European fixed incomesecurities, including corporate bonds and asset-backed securities, and derivatives, as well as varying degrees of leverage. The notes had astated coupon and provided a return based on the performance of the underlying portfolios and the level of leverage. The Companyinvested in these notes to earn a coupon through maturity, consistent with its investment purpose for other debt securities. The notes wereaccounted for under U.S. GAAP as available-for-sale fixed maturity securities with bifurcated embedded derivatives (total return swaps).Changes in the value of the fixed maturity securities were reported in Equity under the heading “Accumulated Other ComprehensiveIncome (Loss)” and changes in the market value of the embedded total return swaps are included in current period earnings in “Realizedinvestment gains (losses), net.” The Company’s maximum exposure to loss from these investments was $314 million on December 31,2012.
Counterparty Credit Risk
The Company is exposed to credit-related losses in the event of non-performance by counterparties to financial derivative transactions.The Company manages credit risk by entering into derivative transactions with highly rated major international financial institutions andother creditworthy counterparties, and by obtaining collateral where appropriate. Additionally, limits are set on single party creditexposures which are subject to periodic management review.
The credit exposure of the Company’s OTC derivative transactions is represented by the contracts with a positive fair value (marketvalue) at the reporting date. To reduce credit exposures, the Company seeks to (i) enter into OTC derivative transactions pursuant to masteragreements that provide for a netting of payments and receipts with a single counterparty, and (ii) enter into agreements that allow the useof credit support annexes, which are bilateral rating-sensitive agreements that require collateral postings at established threshold levels.Cleared derivatives are bilateral transactions between the Company and a counterparty where the transactions are cleared through aclearinghouse, such that each derivative counterparty is only exposed to the default of the clearinghouse. These cleared transactions requireinitial and daily variation margin collateral postings and include certain interest rate swaps and credit default swaps entered into on or afterJune 10, 2013, related to new guidelines implemented under the Dodd-Frank Wall Street Reform and Consumer Protection Act. Also, theCompany enters into exchange-traded futures and certain options transactions through regulated exchanges and these transactions aresettled on a daily basis, thereby reducing credit risk exposure in the event of non-performance by counterparties to such financialinstruments.
Under fair value measurements, the Company incorporates the market’s perception of its own and the counterparty’s non-performancerisk in determining the fair value of the portion of its OTC derivative assets and liabilities that are uncollateralized. Credit spreads areapplied to the derivative fair values on a net basis by counterparty. To reflect the Company’s own credit spread a proxy based on relevantdebt spreads is applied to OTC derivative net liability positions. Similarly, the Company’s counterparty’s credit spread is applied to OTCderivative net asset positions.
Certain of the Company’s derivative agreements with some of its counterparties contain credit-rating related triggers. If theCompany’s credit rating were to fall below a certain level, the counterparties to the derivative instruments could request termination at thethen fair value of the derivative or demand immediate full collateralization on derivative instruments in net liability positions. If adowngrade occurred and the derivative positions were terminated, the Company anticipates it would be able to replace the derivativepositions with other counterparties in the normal course of business. The aggregate fair value of all derivative instruments with credit-risk-related contingent features that are in a net liability position were $621 million as of December 31, 2013. In the normal course of businessthe Company has posted collateral related to these instruments of $519 million as of December 31, 2013. If the credit-risk-relatedcontingent features underlying these agreements had been triggered on December 31, 2013, the Company estimates that it would berequired to post a maximum of $60 million of additional collateral to its counterparties.
Prudential Financial, Inc. 2013 Annual Report 213

PRUDENTIAL FINANCIAL, INC.
Notes to Consolidated Financial Statements
22. SEGMENT INFORMATION
Segments
The Company has organized its principal operations into the Financial Services Businesses and the Closed Block Business. Within theFinancial Services Businesses, the Company operates through three divisions, which together encompass six reportable segments.Businesses that are not sufficiently material to warrant separate disclosure and divested businesses are included in Corporate and Otheroperations within the Financial Services Businesses. Collectively, the businesses that comprise the three operating divisions and Corporateand Other are referred to as the Financial Services Businesses.
U.S. Retirement Solutions and Investment Management Division. The U.S. Retirement Solutions and Investment Managementdivision consists of the Individual Annuities, Retirement, and Asset Management segments. The Individual Annuities segmentmanufactures and distributes individual variable and fixed annuity products, primarily to the U.S. mass affluent market. The Retirementsegment manufactures and distributes products and provides administrative services for qualified and non-qualified retirement plans andoffers innovative pension risk transfer solutions, investment-only stable value products, guaranteed investment contracts, fundingagreements, institutional and retail notes, structured settlement annuities and other group annuities. The Asset Management segmentprovides a broad array of investment management and advisory services by means of institutional portfolio management, mutual funds,asset securitization activity and other structured products, and strategic investments. These products and services are provided to the publicand private marketplace, as well as to other segments of the Company.
U.S. Individual Life and Group Insurance Division. The U.S. Individual Life and Group Insurance division consists of the IndividualLife and Group Insurance segments. The Individual Life segment manufactures and distributes individual variable life, term life anduniversal life insurance products primarily to the U.S. mass middle, mass affluent and affluent markets. The Individual Life segment alsoincludes the results of the individual life business acquired from The Hartford on January 2, 2013. The Group Insurance segmentmanufactures and distributes a full range of group life, long-term and short-term group disability, and group corporate-, bank- and trust-owned life insurance in the U.S. primarily to institutional clients for use in connection with employee and plans and affinity groups.
International Insurance Division. The International Insurance division consists of the International Insurance segment, whichmanufactures and distributes individual life insurance, retirement and related products to the mass affluent and affluent markets in Japan,Korea and other foreign countries through its Life Planner operations. In addition, similar products are offered to the broad middle incomemarket across Japan through Life Consultants, the proprietary distribution channel of the Company’s Gibraltar Life operation, as well asother channels, including banks and independent agencies.
Corporate and Other. Corporate and Other includes corporate operations, after allocations to business segments, and divestedbusinesses. Corporate operations consist primarily of: (1) investment returns on capital that is not deployed in any business segments;(2) returns from investments not allocated to business segments, including debt-financed investment portfolios, as well as tax creditinvestments and other tax enhanced investments financed by business segments; (3) capital debt that is used or will be used to meet thecapital requirements of the Company and the related interest expense; (4) income and expense from qualified pension and other employeebenefit plans, after allocations to business segments; (5) corporate-level income and expense, after allocations to business segments,including corporate governance, corporate advertising, philanthropic activities, deferred compensation, and costs related to certaincontingencies and enhanced regulatory supervision; (6) certain retained obligations relating to pre-demutualization policyholders whom theCompany had previously agreed to provide insurance for reduced or no premium in accordance with contractual settlements related to priorindividual life insurance sales practices remediation; (7) results related to the Company’s capital protection framework; (8) results relatedto a life insurance joint venture and an asset management company joint venture in China and (9) the impact of transactions with othersegments.
Closed Block Business. The Closed Block Business, which is managed separately from the Financial ServicesBusinesses, was established on the date of demutualization. It includes the Closed Block (as discussed in Note 12); assets heldoutside the Closed Block necessary to meet insurance regulatory capital requirements related to products included within theClosed Block; deferred policy acquisition costs related to the Closed Block policies; the principal amount of the IHC debt (asdiscussed in Note 14) and certain related assets and liabilities.
Segment Accounting Policies. The accounting policies of the segments are the same as those described in Note 2. Results for eachsegment include earnings on attributed equity established at a level which management considers necessary to support each segment’srisks. Operating expenses specifically identifiable to a particular segment are allocated to that segment as incurred. Operating expenses notidentifiable to a specific segment that are incurred in connection with the generation of segment revenues are generally allocated basedupon the segment’s historical percentage of general and administrative expenses. As discussed in Note 2, results for the periods presentedin the Company’s Consolidated Financial Statements reflect the implementation of a discretionary change in accounting principle related tothe Company’s accrual of performance-based incentive fee revenue in its Asset Management segment.
For information related to significant acquisitions and disposition, see Note 3. For information related to the adoption of newaccounting pronouncements, see Note 2. The segments’ results in prior years have been revised for these items, as applicable, to conform tothe current year presentation.
214 Prudential Financial, Inc. 2013 Annual Report

PRUDENTIAL FINANCIAL, INC.
Notes to Consolidated Financial Statements
22. SEGMENT INFORMATION (continued)
Adjusted Operating Income
In managing the Financial Services Businesses, the Company analyzes the operating performance of each segment using “adjustedoperating income.” Adjusted operating income does not equate to “income (loss) from continuing operations before income taxes andequity in earnings of operating joint ventures” or “net income” as determined in accordance with U.S. GAAP but is the measure of segmentprofit or loss used by the Company to evaluate segment performance and allocate resources, and consistent with authoritative guidance, isthe measure of segment performance presented below. Adjusted operating income is calculated by adjusting each segment’s “income (loss)from continuing operations before income taxes and equity in earnings of operating joint ventures” for the following items, which aredescribed in greater detail below:
• realized investment gains (losses), net, and related charges and adjustments;
• net investment gains and losses on trading account assets supporting insurance liabilities and changes in experience-ratedcontractholder liabilities due to asset value changes;
• the contribution to income/loss of divested businesses that have been or will be sold or exited, including businesses that have beenplaced in wind down status, but that did not qualify for “discontinued operations” accounting treatment under U.S. GAAP; and
• equity in earnings of operating joint ventures and earnings attributable to noncontrolling interests.
These items are important to an understanding of overall results of operations. Adjusted operating income is not a substitute forincome determined in accordance with U.S. GAAP, and the Company’s definition of adjusted operating income may differ from that usedby other companies. However, the Company believes that the presentation of adjusted operating income as measured for managementpurposes enhances the understanding of results of operations by highlighting the results from ongoing operations and the underlyingprofitability factors of the Financial Services Businesses.
As discussed in Note 1, the Company recorded out of period adjustments during 2012 that resulted in a decrease in adjusted operatingincome of $160 million for the year, principally $61 million to the Asset Management segment and $99 million to Corporate and Otheroperations.
Realized investment gains (losses), net, and related charges and adjustments
Realized investment gains (losses), net
Adjusted operating income excludes “Realized investment gains (losses), net,” except for certain items described below. Significantactivity excluded from adjusted operating income includes impairments and credit-related gains and losses from sales of securities, thetiming of which depends largely on market credit cycles and can vary considerably across periods, and interest rate-related gains and lossesfrom sales of securities, which are largely subject to the Company’s discretion and influenced by market opportunities, as well as theCompany’s tax and capital profile. Additionally, certain gains and losses pertaining to derivative contracts that do not qualify for hedgeaccounting treatment are also excluded from adjusted operating income. Trends in the underlying profitability of the Company’s businessescan be more clearly identified without the fluctuating effects of these transactions.
The following table sets forth the significant components of “Realized investment gains (losses), net” that are included in adjustedoperating income and, as a result, are reflected as adjustments to “Realized investment gains (losses), net” for purposes of calculatingadjusted operating income:
Years Ended December 31,
2013 2012 2011
(in millions)Net gains (losses) from:
Terminated hedges of foreign currency earnings . . . . . . . . . . . . . . . . . . . . . . . . . . . . . . . . . . . . . . . . . . $240 $ (75) $(136)Current period yield adjustments(1) . . . . . . . . . . . . . . . . . . . . . . . . . . . . . . . . . . . . . . . . . . . . . . . . . . . . 445 320 241Principal source of earnings(1) . . . . . . . . . . . . . . . . . . . . . . . . . . . . . . . . . . . . . . . . . . . . . . . . . . . . . . . . $122 $ 91 $ 176
(1) Amounts for the prior periods have been reclassified to conform to current period presentation. In addition to the items in the table above, “Realizedinvestment gains (losses), net, and related charges and adjustments” also includes an adjustment to reflect “Realized investments gains (losses), net”related to divested businesses as results of “Divested businesses”, discussed below.
Terminated Hedges of Foreign Currency Earnings. The amounts shown in the table above primarily reflect the impact of anintercompany arrangement between Corporate and Other operations and the International Insurance segment, pursuant to which the non-U.S. dollar-denominated earnings in all countries for a particular year, including its interim reporting periods, are translated at fixedcurrency exchange rates. The fixed rates are determined in connection with a currency hedging program designed to mitigate the risk thatunfavorable rate changes will reduce the segment’s U.S. dollar equivalent earnings. Pursuant to this program, the Company’s Corporateand Other operations may execute forward currency contracts with third parties to sell the net exposure of projected earnings from thehedged currency in exchange for U.S. dollars at a specified exchange rate. The maturities of these contracts correspond with the future
Prudential Financial, Inc. 2013 Annual Report 215

PRUDENTIAL FINANCIAL, INC.
Notes to Consolidated Financial Statements
22. SEGMENT INFORMATION (continued)
periods in which the identified non-U.S. dollar-denominated earnings are expected to be generated. These contracts do not qualify forhedge accounting under U.S. GAAP, so the resulting profits or losses are recorded in “Realized investment gains (losses), net.” When thecontracts are terminated in the same period that the expected earnings emerge, the resulting positive or negative cash flow effect is includedin adjusted operating income.
Current Period Yield Adjustments. The Company uses interest rate and currency swaps and other derivatives to manage interest andcurrency exchange rate exposures arising from mismatches between assets and liabilities, including duration mismatches. For derivativecontracts that do not qualify for hedge accounting treatment, the periodic swap settlements, as well as certain other derivative related yieldadjustments are recorded in “Realized investment gains (losses), net”, and are included in adjusted operating income to reflect the after-hedge yield of the underlying instruments. In certain instances, when these derivative contracts are terminated or offset before their finalmaturity, the resulting realized gains or losses are recognized in adjusted operating income over periods that generally approximate theexpected terms of the derivatives or underlying instruments in order for adjusted operating income to reflect the after-hedge yield of theunderlying instruments. Included in the amounts shown in the table above are gains on certain derivatives contracts that were terminated oroffset in prior periods of $72 million, $64 million and $50 million for the years ended 2013, 2012 and 2011, respectively. Additionally, asof December 31, 2013, there was a $444 million deferred net gain related to certain derivative contracts that were terminated or offsetbefore their final maturity, primarily in the International Insurance segment.
Principal Source of Earnings. The Company conducts certain activities for which realized investment gains and losses are aprincipal source of earnings for its businesses and therefore included in adjusted operating income, particularly within the Company’sAsset Management segment. For example, Asset Management’s strategic investing business makes investments for sale or syndication toother investors or for placement or co-investment in the Company’s managed funds and structured products. The realized investment gainsand losses associated with the sale of these strategic investments, as well as related derivative results, are a principal activity for thisbusiness and included in adjusted operating income. In addition, the realized investment gains and losses associated with loans originatedby the Company’s commercial mortgage operations, as well as related derivative results and retained mortgage servicing rights, are aprincipal activity for this business and included in adjusted operating income.
Other items reflected as adjustments to Realized investment gains (losses), net
The following table sets forth certain other items excluded from adjusted operating income and reflected as an adjustment to “Realizedinvestment gains (losses), net” for purposes of calculating adjusted operating income:
Years Ended December 31,
2013 2012 2011
(in millions)Net gains (losses) from:
Other trading account assets . . . . . . . . . . . . . . . . . . . . . . . . . . . . . . . . . . . . . . . . . . . . . . . . . . . . . . . . . . $ 168 $ 102 $ (81)Foreign currency exchange movements . . . . . . . . . . . . . . . . . . . . . . . . . . . . . . . . . . . . . . . . . . . . . . . . . (4,060) (1,750) 986Other activities . . . . . . . . . . . . . . . . . . . . . . . . . . . . . . . . . . . . . . . . . . . . . . . . . . . . . . . . . . . . . . . . . . . . . $ 167 $ 29 $(109)
Other Trading Account Assets. The Company has certain investments in its general account portfolios that are classified as trading.These trading investments are carried at fair value and included in “Other trading account assets, at fair value” on the Company’sstatements of financial position. Realized and unrealized gains and losses for these investments are recorded in “Asset management feesand other income.” Consistent with the exclusion of realized investment gains and losses with respect to other investments managed on aconsistent basis, the net gains or losses on these investments are excluded from adjusted operating income.
Foreign Currency Exchange Movements. The Company has certain assets and liabilities for which, under U.S. GAAP, the changesin value, including those associated with changes in foreign currency exchange rates during the period, are recorded in “Asset managementfees and other income.” To the extent the foreign currency exposure on these assets and liabilities is economically hedged or consideredpart of the Company’s capital funding strategies for its international subsidiaries, the change in value included in “Asset management feesand other income” is excluded from adjusted operating income. The amounts in the table above are largely driven by non-yen denominatedinsurance liabilities in the Company’s Japanese insurance operations. The insurance liabilities are supported by investments denominated incorresponding currencies, including a significant portion designated as available-for-sale. While these non-yen denominated assets andliabilities are economically hedged, under U.S. GAAP, unrealized gains and losses on available-for-sale investments, including thosearising from foreign currency exchange rate movements, are recorded in “Accumulated other comprehensive income (loss),” while the non-yen denominated liabilities are re-measured for foreign currency exchange rate movements, and the related change in value is recorded inearnings within “Asset management fees and other income.” Due to this non-economic volatility that is reflected in U.S. GAAP earnings,the change in value recorded within “Asset management fee and other income” is excluded from adjusted operating income.
Other Activities. The Company excludes certain other items from adjusted operating income that are consistent with similaradjustments described above. The significant items within other activities shown in the table above included the following:
In connection with the settlement of disputes arising out of the Chapter 11 bankruptcy petition filed by Lehman Brothers HoldingsInc., the Company recorded losses of $65 million in 2011 related to a portion of its counterparty exposure on derivative transactions it hadpreviously held with Lehman Brothers and its affiliates. For the years ended 2013 and 2012, the Company recorded $146 million and $12
216 Prudential Financial, Inc. 2013 Annual Report

PRUDENTIAL FINANCIAL, INC.
Notes to Consolidated Financial Statements
22. SEGMENT INFORMATION (continued)
million, respectively, in estimated recoveries of this settlement. These losses and recoveries are recorded within “Asset management feesand other income” within the Company’s Corporate and Other operations. Consistent with the exclusion of credit-related losses recorded in“Realized investment gains (losses), net”, the impact of these losses and recoveries are excluded from adjusted operating income.
The Company records valuation adjustments for non-performance risk that relates to the uncollateralized portion of certain derivativecontracts between a subsidiary of the Company and third parties and liquidity risk associated with certain derivatives. These adjustmentsare recorded within “Asset management fees and other income.” Consistent with the exclusion of the mark-to-market on derivativesrecorded in “Realized investment gains (losses), net”, the impact of these risks is excluded from adjusted operating income. The net impactof these risks was to exclude from adjusted operating income net gains of $30 million, net gains of $36 million and net losses of $22million for the years ended 2013, 2012 and 2011, respectively.
Related charges
Charges that relate to realized investment gains and losses are also excluded from adjusted operating income, and include thefollowing:
• The portion of the amortization of deferred policy acquisition costs, value of business acquired, unearned revenue reserves anddeferred sales inducements for certain products that is related to net realized investment gains and losses.
• Policyholder dividends and interest credited to policyholders’ account balances that relate to certain life policies that pass backcertain realized investment gains and losses to the policyholder, and reserves for future policy benefits for certain policies that areaffected by net realized investment gains and losses.
• Market value adjustments paid or received upon a contractholder’s surrender of certain of the Company’s annuity products as theseamounts mitigate the net realized investment gains or losses incurred upon the disposition of the underlying invested assets.
Investment gains and losses on trading account assets supporting insurance liabilities and changes in experience-ratedcontractholder liabilities due to asset value changes
Certain products included in the Retirement and International Insurance segments are experience-rated in that investment resultsassociated with these products are expected to ultimately accrue to contractholders. The majority of investments supporting theseexperience-rated products are classified as trading and are carried at fair value, with realized and unrealized gains and losses reported in“Asset management fees and other income.” To a lesser extent, these experience-rated products are also supported by derivatives andcommercial mortgage and other loans. The derivatives are carried at fair value, with realized and unrealized gains and losses reported in“Realized investment gains (losses), net.” The commercial mortgage and other loans are carried at unpaid principal, net of unamortizeddiscounts and an allowance for losses, with gains and losses on sales and changes in the valuation allowance for commercial mortgage andother loans reported in “Realized investment gains (losses), net.”
Adjusted operating income excludes net investment gains and losses on trading account assets supporting insurance liabilities, whichis consistent with the exclusion of realized investment gains and losses with respect to other investments supporting insurance liabilitiesmanaged on a consistent basis. In addition, to be consistent with the historical treatment of charges related to realized investment gains andlosses on investments, adjusted operating income also excludes the change in contractholder liabilities due to asset value changes in thepool of investments (including changes in the fair value of commercial mortgage and other loans) supporting these experience-ratedcontracts, which are reflected in “Interest credited to policyholders’ account balances.” These adjustments are in addition to the exclusionfrom adjusted operating income of net investment gains and losses on the related derivatives and commercial mortgage and other loansthrough “Realized investment gains (losses), net, and related charges and adjustments,” as discussed above. The result of this approach isthat adjusted operating income for these products includes net fee revenue and interest spread the Company earns on these experience-ratedcontracts, and excludes changes in fair value of the pool of investments, both realized and unrealized, that are expected to ultimately accrueto the contractholders.
Divested businesses
The contribution to income/loss of divested businesses that have been or will be sold or exited, including businesses that have beenplaced in wind down, but that did not qualify for “discontinued operations” accounting treatment under U.S. GAAP, are excluded fromadjusted operating income as the results of divested businesses are not relevant to understanding the Company’s ongoing operating results.
On July 1, 2013, the Company sold its wealth management solutions business to Envestnet Inc. Due to the existence of an ongoingcontractual relationship between the Company and these operations, this disposition did not qualify for discontinued operations treatmentunder U.S. GAAP. As a result, the Company has classified the results of these operations, previously reported in the Asset Managementsegment, as a “divested business” and excluded the results from adjusted operating income for all periods presented.
As previously disclosed in its Annual Report on Form 10-K for the year ended December 31, 2012, the Company decided to place itslong-term care business in wind down in 2012 and has classified the results of this business as a divested business for all periods presented.
Prudential Financial, Inc. 2013 Annual Report 217

PRUDENTIAL FINANCIAL, INC.
Notes to Consolidated Financial Statements
22. SEGMENT INFORMATION (continued)
Equity in earnings of operating joint ventures and earnings attributable to noncontrolling interests
Equity in earnings of operating joint ventures, on a pre-tax basis, are included in adjusted operating income as these results are aprincipal source of earnings. These earnings are reflected on a U.S. GAAP basis on an after-tax basis as a separate line on the Company’sConsolidated Statements of Operations.
Earnings attributable to noncontrolling interests are excluded from adjusted operating income. Earnings attributable to noncontrollinginterests represents the portion of earnings from consolidated entities that relates to the equity interests of minority investors, and arereflected on a U.S. GAAP basis as a separate line on the Company’s Consolidated Statements of Operations.
The summary below reconciles adjusted operating income before income taxes for the Financial Services Businesses to income fromcontinuing operations before income taxes and equity in earnings of operating joint ventures:
Years Ended December 31,
2013 2012 2011
(in millions)Adjusted Operating Income before income taxes for Financial Services Businesses by Segment:
Individual Annuities . . . . . . . . . . . . . . . . . . . . . . . . . . . . . . . . . . . . . . . . . . . . . . . . . . . . . . . . . . . . . . . . . . . . . . . . . . . . . . $ 2,085 $ 1,039 $ 662Retirement . . . . . . . . . . . . . . . . . . . . . . . . . . . . . . . . . . . . . . . . . . . . . . . . . . . . . . . . . . . . . . . . . . . . . . . . . . . . . . . . . . . . . . 1,039 638 594Asset Management . . . . . . . . . . . . . . . . . . . . . . . . . . . . . . . . . . . . . . . . . . . . . . . . . . . . . . . . . . . . . . . . . . . . . . . . . . . . . . . 723 584 888
Total U.S. Retirement Solutions and Investment Management Division . . . . . . . . . . . . . . . . . . . . . . . . . . . . . . 3,847 2,261 2,144
Individual Life . . . . . . . . . . . . . . . . . . . . . . . . . . . . . . . . . . . . . . . . . . . . . . . . . . . . . . . . . . . . . . . . . . . . . . . . . . . . . . . . . . 583 384 482Group Insurance . . . . . . . . . . . . . . . . . . . . . . . . . . . . . . . . . . . . . . . . . . . . . . . . . . . . . . . . . . . . . . . . . . . . . . . . . . . . . . . . . 157 16 163
Total U.S. Individual Life and Group Insurance Division . . . . . . . . . . . . . . . . . . . . . . . . . . . . . . . . . . . . . . . . . 740 400 645
International Insurance . . . . . . . . . . . . . . . . . . . . . . . . . . . . . . . . . . . . . . . . . . . . . . . . . . . . . . . . . . . . . . . . . . . . . . . . . . . . 3,152 2,704 2,263
Total International Insurance Division . . . . . . . . . . . . . . . . . . . . . . . . . . . . . . . . . . . . . . . . . . . . . . . . . . . . . . . . 3,152 2,704 2,263
Corporate Operations . . . . . . . . . . . . . . . . . . . . . . . . . . . . . . . . . . . . . . . . . . . . . . . . . . . . . . . . . . . . . . . . . . . . . . . . . . . . . (1,370) (1,338) (1,112)
Total Corporate and Other . . . . . . . . . . . . . . . . . . . . . . . . . . . . . . . . . . . . . . . . . . . . . . . . . . . . . . . . . . . . . . . . . (1,370) (1,338) (1,112)
Adjusted Operating Income before income taxes for Financial Services Businesses . . . . . . . . . . . . . . . . . . . . . . . . . . . . 6,369 4,027 3,940
Reconciling items:Realized investment gains (losses), net, and related adjustments . . . . . . . . . . . . . . . . . . . . . . . . . . . . . . . . . . . . . . . . (9,956) (3,666) 2,503Charges related to realized investment gains (losses), net . . . . . . . . . . . . . . . . . . . . . . . . . . . . . . . . . . . . . . . . . . . . . 1,807 857 (1,656)Investment gains (losses) on trading account assets supporting insurance liabilities, net . . . . . . . . . . . . . . . . . . . . . (250) 610 223Change in experience-rated contractholder liabilities due to asset value changes . . . . . . . . . . . . . . . . . . . . . . . . . . . 227 (540) (123)Divested businesses . . . . . . . . . . . . . . . . . . . . . . . . . . . . . . . . . . . . . . . . . . . . . . . . . . . . . . . . . . . . . . . . . . . . . . . . . . 29 (615) 90Equity in earnings of operating joint ventures and earnings attributable to noncontrolling interests . . . . . . . . . . . . . 28 (29) (227)
Income (loss) from continuing operations before income taxes and equity in earnings of operating joint ventures forFinancial Services Businesses . . . . . . . . . . . . . . . . . . . . . . . . . . . . . . . . . . . . . . . . . . . . . . . . . . . . . . . . . . . . . . . . . . . . . . . . . (1,746) 644 4,750
Income (loss) from continuing operations before income taxes and equity in earnings of operating joint ventures for ClosedBlock Business . . . . . . . . . . . . . . . . . . . . . . . . . . . . . . . . . . . . . . . . . . . . . . . . . . . . . . . . . . . . . . . . . . . . . . . . . . . . . . . . . . . . 62 64 214
Income (loss) from continuing operations before income taxes and equity in earnings of operating joint ventures . . . . . . . . . $(1,684) $ 708 $ 4,964
The U.S. Retirement Solutions and Investment Management Division and U.S. Individual Life and Group Insurance Division resultsreflect deferred policy acquisition costs as if the individual annuity business and group insurance business were stand-alone operations. Theelimination of intersegment costs capitalized in accordance with this policy is included in consolidating adjustments within Corporate andOther operations.
218 Prudential Financial, Inc. 2013 Annual Report

PRUDENTIAL FINANCIAL, INC.
Notes to Consolidated Financial Statements
22. SEGMENT INFORMATION (continued)
The summary below presents certain financial information for the Company’s reportable segments:
As Of or Year Ended December 31, 2013
Revenues
NetInvestment
IncomePolicyholders’
Benefits
InterestCredited to
Policyholders’AccountBalances
Dividends toPolicyholders
InterestExpense
Amortization ofDeferred Policy
AcquisitionCosts
TotalAssets
(in millions)Financial Services Businesses:
Individual Annuities . . . . . . . . . . . . . . . . . . . . . $ 4,465 $ 693 $ 77 $ 381 $ 0 $ 91 $257 $160,778Retirement . . . . . . . . . . . . . . . . . . . . . . . . . . . 6,028 4,067 2,461 1,529 0 26 15 170,762Asset Management . . . . . . . . . . . . . . . . . . . . 2,678 87 0 0 0 11 25 45,040
Total U.S. Retirement Solutions andInvestment Management Division . . . . 13,171 4,847 2,538 1,910 0 128 297 376,580
Individual Life . . . . . . . . . . . . . . . . . . . . . . . . 4,620 1,406 1,869 576 33 407 111 64,990Group Insurance . . . . . . . . . . . . . . . . . . . . . . 5,518 585 4,299 232 0 7 10 39,185
Total U.S. Individual Life and GroupInsurance Division . . . . . . . . . . . . . . . . 10,138 1,991 6,168 808 33 414 121 104,175
International Insurance . . . . . . . . . . . . . . . . . 22,540 4,306 14,499 984 107 3 1,011 168,677
Total International Insurance Division . . . 22,540 4,306 14,499 984 107 3 1,011 168,677
Corporate Operations . . . . . . . . . . . . . . . . . . (568) 386 (35) 0 0 715 (35) 13,947
Total Corporate and Other . . . . . . . . . . . (568) 386 (35) 0 0 715 (35) 13,947
Total . . . . . . . . . . . . . . . . . . . . . . . . 45,281 11,530 23,170 3,702 140 1,260 1,394 663,379
Reconciling items:Realized investment gains (losses), net, and
related adjustments . . . . . . . . . . . . . . . . . . (9,960) (13) 0 0 0 0 0Charges related to realized investment gains
(losses), net . . . . . . . . . . . . . . . . . . . . . . . . (199) 0 (225) (500) 0 0 (1,191)Investment gains (losses) on trading account
assets supporting insurance liabilities,net . . . . . . . . . . . . . . . . . . . . . . . . . . . . . . . (250) 0 0 0 0 0 0
Change in experience-rated contractholderliabilities due to assets value changes . . . . 0 0 0 (227) 0 0 0
Divested businesses . . . . . . . . . . . . . . . . . . . . 631 196 454 0 0 1 0Equity in earnings of operating joint
ventures and earnings attributable tononcontrolling interests . . . . . . . . . . . . . . . (78) 0 0 0 0 0 0
Total Financial ServicesBusinesses . . . . . . . . . . . . . . . . . 35,425 11,713 23,399 2,975 140 1,261 203 663,379
Closed Block Business . . . . . . . . . . . . . . . . . . . . . 6,036 3,016 3,334 136 1,910 148 37 68,402
Total per Consolidated Financial Statements . . . . $41,461 $14,729 $26,733 $3,111 $2,050 $1,409 $240 $731,781
Prudential Financial, Inc. 2013 Annual Report 219

PRUDENTIAL FINANCIAL, INC.
Notes to Consolidated Financial Statements
22. SEGMENT INFORMATION (continued)As Of or Year Ended December 31, 2012
Revenues
NetInvestment
IncomePolicyholders’
Benefits
InterestCredited to
Policyholders’AccountBalances
Dividends toPolicyholders
InterestExpense
Amortizationof Deferred
PolicyAcquisition
CostsTotalAssets
(in millions)Financial Services Businesses:
Individual Annuities . . . . . . . . . . . . . . . . . . . $ 3,983 $ 770 $ 573 $ 452 $ 0 $ 109 $ 338 $146,893Retirement(1) . . . . . . . . . . . . . . . . . . . . . . . . . 36,595 3,203 33,317 1,695 0 20 49 168,262Asset Management . . . . . . . . . . . . . . . . . . . . . 2,376 107 0 0 0 15 24 41,884
Total U.S. Retirement Solutions andInvestment Management Division . . . 42,954 4,080 33,890 2,147 0 144 411 357,039
Individual Life . . . . . . . . . . . . . . . . . . . . . . . . 3,367 1,033 1,210 329 31 316 419 47,371Group Insurance . . . . . . . . . . . . . . . . . . . . . . . 5,601 586 4,528 228 0 7 5 38,754
Total U.S. Individual Life and GroupInsurance Division . . . . . . . . . . . . . . . 8,968 1,619 5,738 557 31 323 424 86,125
International Insurance . . . . . . . . . . . . . . . . . 29,586 4,268 20,981 1,122 124 3 1,173 183,794
Total International InsuranceDivision . . . . . . . . . . . . . . . . . . . . . . . 29,586 4,268 20,981 1,122 124 3 1,173 183,794
Corporate Operations . . . . . . . . . . . . . . . . . . . (405) 403 136 (22) 0 773 (42) 12,287
Total Corporate and Other . . . . . . . . . . . (405) 403 136 (22) 0 773 (42) 12,287
Total . . . . . . . . . . . . . . . . . . . . . . . . 81,103 10,370 60,745 3,804 155 1,243 1,966 639,245
Reconciling items:Realized investment gains (losses), net, and
related adjustments . . . . . . . . . . . . . . . . . . (3,671) (24) 0 0 0 0 0Charges related to realized investment gains
(losses), net . . . . . . . . . . . . . . . . . . . . . . . . (108) 0 (2) (247) 0 0 (716)Investment gains (losses) on trading account
assets supporting insurance liabilities,net . . . . . . . . . . . . . . . . . . . . . . . . . . . . . . . 610 0 0 0 0 0 0
Change in experience-rated contractholderliabilities due to assets value changes . . . . 0 0 0 540 0 0 0
Divested businesses . . . . . . . . . . . . . . . . . . . . 735 162 943 0 0 0 216Equity in earnings of operating joint ventures
and earnings attributable to noncontrollinginterests . . . . . . . . . . . . . . . . . . . . . . . . . . . (79) 0 0 0 0 0 0
Total Financial ServicesBusinesses . . . . . . . . . . . . . . . . . 78,590 10,508 61,686 4,097 155 1,243 1,466 639,245
Closed Block Business . . . . . . . . . . . . . . . . . . . . . 6,257 3,153 3,445 137 2,021 148 38 69,990
Total per Consolidated Financial Statements . . . . $84,847 $13,661 $65,131 $4,234 $2,176 $1,391 $1,504 $709,235
(1) In 2012, the Company completed significant non-participating group annuity pension risk transfer transactions with two unaffiliated pension plansponsors. The premiums from these transactions contributed approximately $31.8 billion to revenue in the Retirement segment. These premiums werelargely offset by a corresponding increase in policyholders’ benefits.
220 Prudential Financial, Inc. 2013 Annual Report

PRUDENTIAL FINANCIAL, INC.
Notes to Consolidated Financial Statements
22. SEGMENT INFORMATION (continued)Year Ended December 31, 2011
Revenues
NetInvestment
IncomePolicyholders’
Benefits
InterestCredited to
Policyholders’AccountBalances
Dividends toPolicyholders
InterestExpense
Amortizationof Deferred
PolicyAcquisition
Costs
(in millions)Financial Services Businesses:
Individual Annuities . . . . . . . . . . . . . . . . . . . . . . . . . $ 3,638 $ 790 $ 476 $ 570 $ 0 $ 112 $ 536Retirement . . . . . . . . . . . . . . . . . . . . . . . . . . . . . . . . 4,871 3,178 1,594 1,715 0 14 41Asset Management . . . . . . . . . . . . . . . . . . . . . . . . . . 2,531 118 0 0 0 13 25
Total U.S. Retirement Solutions andInvestment Management Division . . . . . . . . 11,040 4,086 2,070 2,285 0 139 602
Individual Life . . . . . . . . . . . . . . . . . . . . . . . . . . . . . 2,900 978 1,115 299 29 214 135Group Insurance . . . . . . . . . . . . . . . . . . . . . . . . . . . . 5,606 575 4,474 228 0 0 6
Total U.S. Individual Life and GroupInsurance Division . . . . . . . . . . . . . . . . . . . . 8,506 1,553 5,589 527 29 214 141
International Insurance . . . . . . . . . . . . . . . . . . . . . . . 19,567 3,754 11,963 978 122 1 880
Total International Insurance Division . . . . . . . 19,567 3,754 11,963 978 122 1 880
Corporate Operations . . . . . . . . . . . . . . . . . . . . . . . . (187) 410 146 (34) 0 809 (58)
Total Corporate and Other . . . . . . . . . . . . . . . . (187) 410 146 (34) 0 809 (58)
Total . . . . . . . . . . . . . . . . . . . . . . . . . . . . . 38,926 9,803 19,768 3,756 151 1,163 1,565
Reconciling items:Realized investment gains (losses), net, and related
adjustments . . . . . . . . . . . . . . . . . . . . . . . . . . . . . . 2,497 (28) 0 0 0 0 0Charges related to realized investment gains
(losses), net . . . . . . . . . . . . . . . . . . . . . . . . . . . . . . (108) 0 0 466 1 0 1,080Investment gains (losses) on trading account assets
supporting insurance liabilities, net . . . . . . . . . . . 223 0 0 0 0 0 0Change in experience-rated contractholder
liabilities due to assets value changes . . . . . . . . . 0 0 0 123 0 0 0Divested businesses . . . . . . . . . . . . . . . . . . . . . . . . . 793 135 364 0 0 1 13Equity in earnings of operating joint ventures and
earnings attributable to noncontrollinginterests . . . . . . . . . . . . . . . . . . . . . . . . . . . . . . . . (261) 0 0 0 0 0 0
Total Financial Services Businesses . . . . 42,070 9,910 20,132 4,345 152 1,164 2,658Closed Block Business . . . . . . . . . . . . . . . . . . . . . . . . . . . 7,015 3,214 3,482 139 2,571 148 37
Total per Consolidated Financial Statements . . . . . . . . . . $49,085 $13,124 $23,614 $4,484 $2,723 $1,312 $2,695
Revenues, calculated in accordance with U.S. GAAP, for the years ended December 31, include the following associated with theCompany’s foreign and domestic operations:
2013 2012 2011
(in millions)Domestic operations . . . . . . . . . . . . . . . . . . . . . . . . . . . . . . . . . . . . . . . . . . . . . . . . . . . . . . . . . . . . . . . . . . . . $22,222 $56,684 $28,955Foreign operations, total . . . . . . . . . . . . . . . . . . . . . . . . . . . . . . . . . . . . . . . . . . . . . . . . . . . . . . . . . . . . . . . . . 19,239 28,163 20,130Foreign operations, Japan . . . . . . . . . . . . . . . . . . . . . . . . . . . . . . . . . . . . . . . . . . . . . . . . . . . . . . . . . . . . . . . . 16,523 26,393 17,607Foreign operations, Korea . . . . . . . . . . . . . . . . . . . . . . . . . . . . . . . . . . . . . . . . . . . . . . . . . . . . . . . . . . . . . . . . 1,437 1,294 1,331
The Asset Management segment revenues include intersegment revenues, primarily consisting of asset-based management andadministration fees, for the years ended December 31, as follows:
2013 2012 2011
(in millions)Asset Management segment intersegment revenues . . . . . . . . . . . . . . . . . . . . . . . . . . . . . . . . . . . . . . . . . . . . . . . . . . $611 $545 $498
Management has determined the intersegment revenues with reference to market rates. Intersegment revenues are eliminated inconsolidation in Corporate and Other.
Prudential Financial, Inc. 2013 Annual Report 221

PRUDENTIAL FINANCIAL, INC.
Notes to Consolidated Financial Statements
23. COMMITMENTS AND GUARANTEES, CONTINGENT LIABILITIES AND LITIGATION ANDREGULATORY MATTERS
Commitments and GuaranteesThe Company occupies leased office space in many locations under various long-term leases and has entered into numerous leases
covering the long-term use of computers and other equipment. Rental expense, net of sub-lease income, incurred for the years endedDecember 31, 2013, 2012 and 2011, was $253 million, $287 million and $280 million, respectively.
The following table presents, at December 31, 2013, the Company’s future minimum lease payments under non-cancelable operatingleases along with associated sub-lease income:
OperatingLeases
Sub-leaseIncome
(in millions)2014 . . . . . . . . . . . . . . . . . . . . . . . . . . . . . . . . . . . . . . . . . . . . . . . . . . . . . . . . . . . . . . . . . . . . . . . . . . . . . . . . . . . . . . . . . . $140 $(14)2015 . . . . . . . . . . . . . . . . . . . . . . . . . . . . . . . . . . . . . . . . . . . . . . . . . . . . . . . . . . . . . . . . . . . . . . . . . . . . . . . . . . . . . . . . . . 97 (1)2016 . . . . . . . . . . . . . . . . . . . . . . . . . . . . . . . . . . . . . . . . . . . . . . . . . . . . . . . . . . . . . . . . . . . . . . . . . . . . . . . . . . . . . . . . . . 75 02017 . . . . . . . . . . . . . . . . . . . . . . . . . . . . . . . . . . . . . . . . . . . . . . . . . . . . . . . . . . . . . . . . . . . . . . . . . . . . . . . . . . . . . . . . . . 62 02018 . . . . . . . . . . . . . . . . . . . . . . . . . . . . . . . . . . . . . . . . . . . . . . . . . . . . . . . . . . . . . . . . . . . . . . . . . . . . . . . . . . . . . . . . . . 45 02019 and thereafter . . . . . . . . . . . . . . . . . . . . . . . . . . . . . . . . . . . . . . . . . . . . . . . . . . . . . . . . . . . . . . . . . . . . . . . . . . . . . . 90 0
Total . . . . . . . . . . . . . . . . . . . . . . . . . . . . . . . . . . . . . . . . . . . . . . . . . . . . . . . . . . . . . . . . . . . . . . . . . . . . . . . . . . . . . $509 $(15)
Occasionally, for business reasons, the Company may exit certain non-cancelable operating leases prior to their expiration. In theseinstances, the Company’s policy is to accrue, at the time it ceases to use the property being leased, the future rental expense net of anyexpected sub-lease income, and to release this reserve over the remaining commitment period. Of the total non-cancelable operating leasesand sub-lease income amounts listed above, $9 million and $4 million, respectively, has been accrued at December 31, 2013.
Commercial Mortgage Loan Commitments
As of December 31,
2013 2012
(in millions)Total outstanding mortgage loan commitments . . . . . . . . . . . . . . . . . . . . . . . . . . . . . . . . . . . . . . . . . . . . . . . . . . . . . . $2,365 $2,552Portion of commitment where prearrangement to sell to investor exists . . . . . . . . . . . . . . . . . . . . . . . . . . . . . . . . . . . $ 587 $ 897
In connection with the Company’s commercial mortgage operations, it originates commercial mortgage loans. Commitments for loansthat will be held for sale are recognized as derivatives and recorded at fair value. In certain of these transactions, the Company pre-arrangesthat it will sell the loan to an investor, including to governmental sponsored entities as discussed below, after the Company funds the loan.
Commitments to Purchase Investments (excluding Commercial Mortgage Loans)
As of December 31,
2013 2012
(in millions)Expected to be funded from the general account and other operations outside the separate accounts(1) . . . . . . . . . . $5,461 $3,410Expected to be funded from separate accounts . . . . . . . . . . . . . . . . . . . . . . . . . . . . . . . . . . . . . . . . . . . . . . . . . . . . . . $ 274 $ 757Portion of separate account commitments with recourse to Prudential Insurance . . . . . . . . . . . . . . . . . . . . . . . . . . . . $ 0 $ 7
(1) Includes a remaining commitment of $256 million and $200 million at December 31, 2013 and 2012, respectively, related to the Company’s agreementto co-invest with the Fosun Group (Fosun) in a private equity fund, managed by Fosun, for the Chinese marketplace.
The Company has commitments to purchase or fund investments, some of which are contingent upon events or circumstances notunder the Company’s control, including those at the discretion of the Company’s counterparties. The Company anticipates a portion ofthese commitments will ultimately be funded from its separate accounts. Some of the separate account commitments have recourse toPrudential Insurance if the separate accounts are unable to fund the amounts when due.
Guarantees of Investee Debt
As of December 31,
2013 2012
(in millions)Total guarantees of debt issued by entities in which the separate accounts have invested . . . . . . . . . . . . . . . . . . . . . $2,510 $2,178Amount of above guarantee that is limited to separate account assets . . . . . . . . . . . . . . . . . . . . . . . . . . . . . . . . . . . . $2,510 $2,167Accrued liability associated with guarantee . . . . . . . . . . . . . . . . . . . . . . . . . . . . . . . . . . . . . . . . . . . . . . . . . . . . . . . . . $ 0 $ 0
222 Prudential Financial, Inc. 2013 Annual Report

PRUDENTIAL FINANCIAL, INC.
Notes to Consolidated Financial Statements
23. COMMITMENTS AND GUARANTEES, CONTINGENT LIABILITIES AND LITIGATION ANDREGULATORY MATTERS (continued)
A number of guarantees provided by the Company relate to real estate investments held in its separate accounts, in which entities thatthe separate account has invested in have borrowed funds, and the Company has guaranteed their obligations. The Company provides theseguarantees to assist these entities in obtaining financing. The Company’s maximum potential exposure under these guarantees is mostlylimited to the assets of the separate account. The exposure that is not limited to the separate account assets relates mostly to guaranteeslimited to fraud, criminal activity or other bad acts. These guarantees generally expire at various times over the next eleven years. AtDecember 31, 2013, the Company’s assessment is that it is unlikely payments will be required. Any payments that may become requiredunder these guarantees would either first be reduced by proceeds received by the creditor on a sale of the underlying collateral, or wouldprovide rights to obtain the underlying collateral.
Indemnification of Securities Lending Transactions
As of December 31,
2013 2012
(in millions)Indemnification provided to mutual fund and separate account clients for securities lending . . . . . . . . . . . . . . . . . . $15,598 $15,454Fair value of related collateral associated with above indemnifications . . . . . . . . . . . . . . . . . . . . . . . . . . . . . . . . . . . $15,965 $15,730Accrued liability associated with guarantee . . . . . . . . . . . . . . . . . . . . . . . . . . . . . . . . . . . . . . . . . . . . . . . . . . . . . . . . . $ 0 $ 0
In the normal course of business, the Company may facilitate securities lending transactions on behalf of mutual funds and separateaccounts for which the Company is the investment advisor and/or the asset manager. In certain of these arrangements, the Company hasprovided an indemnification to the mutual funds or separate accounts to hold them harmless against losses caused by counterparty (i.e.,borrower) defaults associated with the securities lending activity facilitated by the Company. Collateral is provided by the counterparty tothe mutual fund or separate account at the inception of the loan equal to or greater than 102% of the fair value of the loaned securities andthe collateral is maintained daily at 102% or greater of the fair value of the loaned securities. The Company is only at risk if thecounterparty to the securities lending transaction defaults and the value of the collateral held is less than the value of the securities loanedto such counterparty. The Company believes the possibility of any payments under these indemnities is remote.
Credit Derivatives Written
As discussed further in Note 21, the Company writes credit derivatives under which the Company is obligated to pay the counterpartythe referenced amount of the contract and receive in return the defaulted security or similar security.
Guarantees of Asset Values
As of December 31,
2013 2012
(in millions)Guaranteed value of third parties’ assets . . . . . . . . . . . . . . . . . . . . . . . . . . . . . . . . . . . . . . . . . . . . . . . . . . . . . . . . . . . $78,110 $64,424Fair value of collateral supporting these assets . . . . . . . . . . . . . . . . . . . . . . . . . . . . . . . . . . . . . . . . . . . . . . . . . . . . . . $79,458 $67,555Asset associated with guarantee, carried at fair value . . . . . . . . . . . . . . . . . . . . . . . . . . . . . . . . . . . . . . . . . . . . . . . . . $ 8 $ 5
Certain contracts underwritten by the Retirement segment include guarantees related to financial assets owned by the guaranteedparty. These contracts are accounted for as derivatives and carried at fair value. The collateral supporting these guarantees is not reflectedon the Company’s balance sheet.
Guarantees of Credit Enhancements
As of December 31,
2013 2012
(in millions)Guarantees of credit enhancements of debt instruments associated with commercial real estate assets . . . . . . . . . . . $156 $172Fair value of properties and associated tax credits that secure the guarantee . . . . . . . . . . . . . . . . . . . . . . . . . . . . . . . $220 $215Accrued liability associated with guarantee . . . . . . . . . . . . . . . . . . . . . . . . . . . . . . . . . . . . . . . . . . . . . . . . . . . . . . . . . $ 0 $ 0
The Company arranges for credit enhancements of certain debt instruments that provide financing primarily for affordable multi-family real estate assets, including certain tax-exempt bond financings. The credit enhancements provide assurances to the debt holders asto the timely payment of amounts due under the debt instruments. The remaining contractual maturities for these guarantees are up tofifteen years. The Company’s obligations to reimburse required credit enhancement payments are secured by mortgages on the related realestate. The Company receives certain ongoing fees for providing these enhancement arrangements and anticipates the extinguishment of itsobligation under these enhancements prior to maturity through the aggregation and transfer of its positions to a substitute enhancementprovider.
Prudential Financial, Inc. 2013 Annual Report 223

PRUDENTIAL FINANCIAL, INC.
Notes to Consolidated Financial Statements
23. COMMITMENTS AND GUARANTEES, CONTINGENT LIABILITIES AND LITIGATION ANDREGULATORY MATTERS (continued)
Indemnification of Serviced Mortgage Loans
As of December 31,
2013 2012
(in millions)Maximum exposure under indemnification agreements for mortgage loans serviced by the Company . . . . . . . . . . . $1,173 $1,147First-loss exposure portion of above . . . . . . . . . . . . . . . . . . . . . . . . . . . . . . . . . . . . . . . . . . . . . . . . . . . . . . . . . . . . . . $ 371 $ 369Accrued liability associated with guarantees . . . . . . . . . . . . . . . . . . . . . . . . . . . . . . . . . . . . . . . . . . . . . . . . . . . . . . . . $ 17 $ 19
As part of the commercial mortgage activities of the Company’s Asset Management segment, the Company provides commercialmortgage origination, underwriting and servicing for certain government sponsored entities, such as Fannie Mae and Freddie Mac. TheCompany has agreed to indemnify the government sponsored entities for a portion of the credit risk associated with certain of themortgages it services through a delegated authority arrangement. Under these arrangements, the Company originates multi-familymortgages for sale to the government sponsored entities based on underwriting standards they specify, and makes payments to them for aspecified percentage share of losses they incur on certain loans serviced by the Company. The Company’s percentage share of lossesincurred generally varies from 2% to 20% of the loan balance, and is typically based on a first-loss exposure for a stated percentage of theloan balance, plus a shared exposure with the government sponsored entity for any losses in excess of the stated first-loss percentage,subject to a contractually specified maximum percentage. The Company services $8,816 million of mortgages subject to these loss-sharingarrangements as of December 31, 2013, all of which are collateralized by first priority liens on the underlying multi-family residentialproperties. As of December 31, 2013, these mortgages had an average debt service coverage ratio of 1.82 times and an average loan-to-value ratio of 60%. The Company’s total share of losses related to indemnifications that were settled was $0 million, $2 million, and $1million for the years ended December 31, 2013, 2012, and 2011, respectively.
Contingent Consideration
As of December 31,
2013 2012
(in millions)Maximum potential contingent consideration associated with acquisitions . . . . . . . . . . . . . . . . . . . . . . . . . . . . . . . . $0 $52
In connection with the Company’s initial investment in an operating joint venture, the Company agreed to pay additionalconsideration in future periods, contingent upon the attainment of defined operating objectives. The arrangement was resolved in 2013 andno additional consideration is required as the joint venture did not attain the defined operating objectives.
Other Guarantees
As of December 31,
2013 2012
(in millions)Other guarantees where amount can be determined . . . . . . . . . . . . . . . . . . . . . . . . . . . . . . . . . . . . . . . . . . . . . . . . . . $404 $530Accrued liability for other guarantees and indemnifications . . . . . . . . . . . . . . . . . . . . . . . . . . . . . . . . . . . . . . . . . . . . $ 7 $ 8
The Company is also subject to other financial guarantees and indemnity arrangements. The Company has provided indemnities andguarantees related to acquisitions, dispositions, investments and other transactions that are triggered by, among other things, breaches ofrepresentations, warranties or covenants provided by the Company. These obligations are typically subject to various time limitations,defined by the contract or by operation of law, such as statutes of limitation. In some cases, the maximum potential obligation is subject tocontractual limitations, while in other cases such limitations are not specified or applicable. Included above are $323 million and $299million as of December 31, 2013 and 2012, respectively, of yield maintenance guarantees related to certain investments the Company sold.The Company does not expect to make any payments on these guarantees and is not carrying any liabilities associated with theseguarantees.
Since certain of these obligations are not subject to limitations, it is not possible to determine the maximum potential amount dueunder these guarantees. The accrued liabilities identified above do not include retained liabilities associated with sold businesses.
Insolvency Assessments
Most of the jurisdictions in which the Company is admitted to transact business require insurers doing business within the jurisdictionto participate in guarantee associations, which are organized to pay contractual benefits owed pursuant to insurance policies issued byimpaired, insolvent or failed insurers. These associations levy assessments, up to prescribed limits, on all member insurers in a particular
224 Prudential Financial, Inc. 2013 Annual Report

PRUDENTIAL FINANCIAL, INC.
Notes to Consolidated Financial Statements
23. COMMITMENTS AND GUARANTEES, CONTINGENT LIABILITIES AND LITIGATION ANDREGULATORY MATTERS (continued)
state on the basis of the proportionate share of the premiums written by member insurers in the lines of business in which the impaired,insolvent or failed insurer engaged. Some states permit member insurers to recover assessments paid through full or partial premium taxoffsets. In addition, Japan has established the Japan Policyholders Protection Corporation as a contingency to protect policyholders againstthe insolvency of life insurance companies in Japan through assessments to companies licensed to provide life insurance.
Assets and liabilities held for insolvency assessments were as follows:
As of December 31,
2013 2012
(in millions)Other assets:
Premium tax offset for future undiscounted assessments . . . . . . . . . . . . . . . . . . . . . . . . . . . . . . . . . . . . . . . . . . $78 $ 76Premium tax offsets currently available for paid assessments . . . . . . . . . . . . . . . . . . . . . . . . . . . . . . . . . . . . . . . 5 5
Total . . . . . . . . . . . . . . . . . . . . . . . . . . . . . . . . . . . . . . . . . . . . . . . . . . . . . . . . . . . . . . . . . . . . . . . . . . . . . . . $83 $ 81
Other liabilities:Insolvency assessments . . . . . . . . . . . . . . . . . . . . . . . . . . . . . . . . . . . . . . . . . . . . . . . . . . . . . . . . . . . . . . . . . . . . $46 $105
Contingent LiabilitiesOn an ongoing basis, the Company’s internal supervisory and control functions review the quality of sales, marketing and other
customer interface procedures and practices and may recommend modifications or enhancements. From time to time, this review processresults in the discovery of product administration, servicing or other errors, including errors relating to the timing or amount of payments orcontract values due to customers. In certain cases, if appropriate, the Company may offer customers remediation and may incur charges,including the cost of such remediation, administrative costs and regulatory fines.
The Company is subject to the laws and regulations of states and other jurisdictions concerning the identification, reporting andescheatment of unclaimed or abandoned funds, and is subject to audit and examination for compliance with these requirements. Foradditional discussion of these matters, see “Litigation and Regulatory Matters” below.
It is possible that the results of operations or the cash flow of the Company in a particular quarterly or annual period could bematerially affected as a result of payments in connection with the matters discussed above or other matters depending, in part, upon theresults of operations or cash flow for such period. Management believes, however, that ultimate payments in connection with these matters,after consideration of applicable reserves and rights to indemnification, should not have a material adverse effect on the Company’sfinancial position.
Litigation and Regulatory MattersThe Company is subject to legal and regulatory actions in the ordinary course of its businesses. Pending legal and regulatory actions
include proceedings relating to aspects of the Company’s businesses and operations that are specific to it and proceedings that are typical ofthe businesses in which it operates, including in both cases businesses that have been either divested or placed in wind-down status. Someof these proceedings have been brought on behalf of various alleged classes of complainants. In certain of these matters, the plaintiffs areseeking large and/or indeterminate amounts, including punitive or exemplary damages. The outcome of litigation or a regulatory matter,and the amount or range of potential loss at any particular time, is often inherently uncertain.
The Company establishes accruals for litigation and regulatory matters when it is probable that a loss has been incurred and theamount of that loss can be reasonably estimated. For litigation and regulatory matters where a loss may be reasonably possible, but notprobable, or is probable but not reasonably estimable, no accrual is established but the matter, if material, is disclosed, including mattersdiscussed below. The Company estimates that as of December 31, 2013, the aggregate range of reasonably possible losses in excess ofaccruals established for those litigation and regulatory matters for which such an estimate currently can be made is not material (i.e., lessthan $250 million). Any estimate is not an indication of expected loss, if any, or the Company’s maximum possible loss exposure on suchmatters. The Company reviews relevant information with respect to its litigation and regulatory matters on a quarterly and annual basis andupdates its accruals, disclosures and estimates of reasonably possible loss based on such reviews.
Individual Annuities, Individual Life and Group Insurance
In January 2013, a qui tam action on behalf of the State of Florida, Total Asset Recovery Services v. Met Life Inc., et al., ManulifeFinancial Corporation, et. al., Prudential Financial, Inc., The Prudential Insurance Company of America, and Prudential InsuranceAgency, LLC. filed in the Circuit Court of Leon County, Florida, was served on the Company. The complaint alleges that the Companyfailed to escheat life insurance proceeds to the State of Florida in violation of the Florida False Claims Act and seeks injunctive relief,compensatory damages, civil penalties, treble damages, prejudgment interest, attorneys’ fees and costs. In March 2013, the Company fileda motion to dismiss the complaint. In August 2013, the court dismissed the complaint with prejudice. In September 2013, plaintiff filed anappeal with Florida’s Circuit Court of the Second Judicial Circuit in Leon County.
Prudential Financial, Inc. 2013 Annual Report 225

PRUDENTIAL FINANCIAL, INC.
Notes to Consolidated Financial Statements
23. COMMITMENTS AND GUARANTEES, CONTINGENT LIABILITIES AND LITIGATION ANDREGULATORY MATTERS (continued)
In September 2012, the State of West Virginia, through its State Treasurer, filed a lawsuit, State of West Virginia ex. Rel. John D.Perdue v. Prudential Insurance Company of America, in the Circuit Court of Putnam County, West Virginia. The complaint allegesviolations of the West Virginia Uniform Unclaimed Property Fund Act by failing to properly identify and report all unclaimed insurancepolicy proceeds which should either be paid to beneficiaries or escheated to West Virginia. The complaint seeks to examine the records ofPrudential Insurance to determine compliance with the West Virginia Uniform Unclaimed Property Fund Act, and to assess penalties andcosts in an undetermined amount. In October 2012, the State of West Virginia commenced a second action, State of West Virginia ex. Rel.John D. Perdue v. Pruco Life Insurance Company making the same allegations stated in the action against Prudential Insurance. In April2013, the Company filed motions to dismiss the complaints in both of the West Virginia actions. In December 2013, the Court granted theCompany’s motions and dismissed the complaints with prejudice. In January 2014, the State of West Virginia appealed the decisions.
In January 2012, a Global Resolution Agreement entered into by the Company and a third party auditor became effective upon itsacceptance by the unclaimed property departments of 20 states and jurisdictions. Under the terms of the Global Resolution Agreement, thethird party auditor acting on behalf of the signatory states will compare expanded matching criteria to the Social Security Master Death File(“SSMDF”) to identify deceased insureds and contract holders where a valid claim has not been made. In February 2012, a RegulatorySettlement Agreement entered into by the Company to resolve a multi-state market conduct examination regarding its adherence to stateclaim settlement practices became effective upon its acceptance by the insurance departments of 20 states and jurisdictions. The RegulatorySettlement Agreement applies prospectively and requires the Company to adopt and implement additional procedures comparing its recordsto the SSMDF to identify unclaimed death benefits and prescribes procedures for identifying and locating beneficiaries once deaths areidentified. Substantially all other jurisdictions that are not signatories to the Global Resolution Agreement or the Regulatory SettlementAgreement have entered into similar agreements with the Company.
The Company is one of several companies subpoenaed by the New York Attorney General regarding its unclaimed propertyprocedures. Additionally, the New York State Department of Financial Services (“NYDFS”) has requested that 172 life insurers (includingthe Company) provide data to the NYDFS regarding use of the SSMDF. The New York Office of Unclaimed Funds is conducting an auditof the Company’s compliance with New York’s unclaimed property laws. In February 2012, the Massachusetts Office of the AttorneyGeneral requested information regarding the Company’s unclaimed property procedures. In December 2013, this matter was closed withoutprejudice. In May 2013, the Company entered into a settlement agreement with the Minnesota Department of Commerce, InsuranceDivision, which requires the Company to take additional steps to identify deceased insureds and contract holders where a valid claim hasnot been made.
From July 2010 to December 2010, four purported nationwide class actions were filed challenging the use of retained asset accountsto settle death benefit claims of beneficiaries of a group life insurance contract owned by the United States Department of Veterans Affairsthat covers the lives of members and veterans of the U.S. armed forces. In 2011, the cases were consolidated in the United States DistrictCourt for the District of Massachusetts by the Judicial Panel for Multi-District Litigation as In re Prudential Insurance Company ofAmerica SGLI/VGLI Contract Litigation. The consolidated complaint alleges that the use of the retained assets accounts that earn interestand are available to be withdrawn by the beneficiary, in whole or in part, at any time, to settle death benefit claims is in violation of federallaw, and asserts claims of breach of contract, breaches of fiduciary duty and the duty of good faith and fair dealing, fraud and unjustenrichment and seeks compensatory and punitive damages, disgorgement of profits, equitable relief and pre and post-judgment interest. InMarch 2011, the motion to dismiss was denied. In January 2012, plaintiffs filed a motion to certify the class. In August 2012, the courtdenied plaintiffs’ class certification motion without prejudice pending the filing of summary judgment motions on the issue of whetherplaintiffs sustained an actual injury. In October 2012, the parties filed motions for summary judgment. In November 2013, the Court issueda Memorandum and Order stating that the named plaintffs: (1) did not suffer a cognizable legal injury; (2) are not entitled to any damagesbased on allegations of delay in payment of benefits; and (3) are not entitled to disgorgement of profits as a remedy. The Court orderedfurther briefing on whether nominal damages should be awarded and whether any equitable relief should be granted. In February 2014, theparties filed briefs on the issues addressed in the Court’s order.
In September 2010, Huffman v. The Prudential Insurance Company, a purported nationwide class action brought on behalf ofbeneficiaries of group life insurance contracts owned by ERISA-governed employee welfare benefit plans was filed in the United StatesDistrict Court for the Eastern District of Pennsylvania, challenging the use of retained asset accounts in employee welfare benefit plans tosettle death benefit claims as a violation of ERISA and seeking injunctive relief and disgorgement of profits. In July 2011, the Company’smotion for judgment on the pleadings was denied. In February 2012, plaintiffs filed a motion to certify the class. In April 2012, the Courtstayed the case pending the outcome of a case involving another insurer that is before the Third Circuit Court of Appeals.
In January 2011, a purported state-wide class action, Garcia v. The Prudential Insurance Company of America was dismissed by theSecond Judicial District Court, Washoe County, Nevada. The complaint was brought on behalf of Nevada beneficiaries of individual lifeinsurance policies for which, unless the beneficiaries elected another settlement method, death benefits were placed in retained assetaccounts. The complaint alleges that by failing to disclose material information about the accounts, the Company wrongfully delayedpayment and improperly retained undisclosed profits, and seeks damages, injunctive relief, attorneys’ fees and pre and post-judgmentinterest. In February 2011, plaintiff appealed the dismissal to the Nevada Supreme Court. As previously reported, in December 2009, anearlier purported nationwide class action raising substantially similar allegations brought by the same plaintiff in the United States DistrictCourt for the District of New Jersey, Garcia v. Prudential Insurance Company of America, was dismissed. In December 2011, plaintiffappealed the dismissal. In January 2013, the Nevada Supreme Court affirmed the dismissal of the complaint. In May 2013, the time for theplaintiffs to appeal the dismissal expired.
226 Prudential Financial, Inc. 2013 Annual Report

PRUDENTIAL FINANCIAL, INC.
Notes to Consolidated Financial Statements
23. COMMITMENTS AND GUARANTEES, CONTINGENT LIABILITIES AND LITIGATION ANDREGULATORY MATTERS (continued)
In December 2010, a purported state-wide class action complaint, Phillips v. Prudential Financial, Inc., was filed in state court andremoved to the United States District Court for the Southern District of Illinois. The complaint makes allegations under Illinois law,substantially similar to the Garcia cases, on behalf of a class of Illinois residents whose death benefit claims were settled by retained assetsaccounts. In March 2011, the complaint was amended to drop the Company as a defendant and add Pruco Life Insurance Company as adefendant and is now captioned Phillips v. Prudential Insurance and Pruco Life Insurance Company. In November 2011, the complaintwas dismissed. In December 2011, plaintiff appealed the dismissal. In May 2013, the United States Court of Appeals for the SeventhCircuit affirmed the dismissal of plaintiff’s putative class action complaint. In August 2013, plaintiff’s time to appeal the dismissal expired.
In February 2011, a fifth amended complaint was filed in the United States District Court for the District of New Jersey in Clark v.Prudential Insurance Company. The complaint brought on behalf of a purported class of California, Indiana, Ohio and Texas residents whopurchased individual health insurance policies alleges that Prudential Insurance failed to disclose that it had ceased selling this type ofpolicy in 1981 and that, as a result, premiums would increase significantly. The complaint alleges claims of fraudulent misrepresentationand omission, breach of the duty of good faith and fair dealing, and California’s Unfair Competition Law and seeks compensatory andpunitive damages. The matter was originally filed in 2008 and certain of the claims in the first four complaints were dismissed. In February2012, plaintiffs filed a motion for class certification. In July 2012, Prudential Insurance moved for summary judgment on certain ofplaintiffs’ claims. In February 2013, the Court denied plaintiffs’ motion for class certification, granted the motion by Prudential Insurancefor summary judgment against two of the named plaintiffs, and denied summary judgment against two other plaintiffs. In April 2013, theCourt denied plaintiffs’ motions: (i) for reconsideration of the Court’s order denying class certification and granting the Company partialsummary judgment; and (ii) to alter or amend the order denying class certification by redefining the class and bifurcating liability anddamages issues. In December 2013, the named plaintiffs agreed to a settlement within reserved amounts. In January 2014, the Courtdismissed the complaint with prejudice.
From November 2002 to March 2005, eleven separate complaints were filed against the Company and the law firm of LeedsMorelli & Brown in New Jersey state court and in the New Jersey Superior Court, Essex County as Lederman v. Prudential Financial, Inc.,et al. The complaints allege that an alternative dispute resolution agreement entered into among Prudential Insurance, over 235 claimantswho are current and former Prudential Insurance employees, and Leeds Morelli & Brown (the law firm representing the claimants) wasillegal and that Prudential Insurance conspired with Leeds Morelli & Brown to commit fraud, malpractice, breach of contract, and violateracketeering laws by advancing legal fees to the law firm with the purpose of limiting Prudential’s liability to the claimants. In February2010, the New Jersey Supreme Court assigned the cases for centralized case management to the Superior Court, Bergen County. TheCompany participated in a court-ordered mediation that resulted in a settlement involving 193 of the remaining 235 plaintiffs. The amountspaid to the 193 plaintiffs were within existing reserves for this matter. In December 2013, the Company participated in court-orderedmediation that resulted in a December 2013 settlement involving 40 of the remaining 42 plaintiffs with litigation against the Company,including plaintiffs who had not yet appealed the dismissal of their claims. The amounts paid to the 40 plaintiffs were within existingreserves for this matter.
Other Matters
In October 2012, a shareholder derivative lawsuit, Stephen Silverman, Derivatively on Behalf of Prudential Financial, Inc. v.John R. Strangfeld, et. al., was filed in the United States District Court for the District of New Jersey, alleging breaches offiduciary duties, waste of corporate assets and unjust enrichment by certain senior officers and directors. The complaint names asdefendants the Company’s Chief Executive Officer, the Chief Financial Officer, the Principal Accounting Officer, certainmembers of the Company’s Board of Directors and a former Director. The complaint alleges that the defendants made false andmisleading statements regarding the Company’s current and future financial condition based on, among other things, the allegedfailure to disclose: (i) potential liability for benefits that should either have been paid to policyholders or their beneficiaries, orescheated to applicable states; and (ii) the extent of the Company’s exposure for alleged state and federal law violationsconcerning the settlement of claims and the escheatment of unclaimed property. The complaint seeks an undetermined amount ofdamages, attorneys’ fees and costs, and equitable relief including a direction for the Company to reform and to improve itscorporate governance and internal procedures to comply with applicable laws.
In October 2012, the Board of Directors received a shareholder demand letter (the “Demand”), containing allegations of wrongdoingsimilar to those alleged in the Silverman complaint. The Demand alleges that the Company’s Senior Management: (i) breached theirfiduciary duties of loyalty and good faith in connection with the management, operation and oversight of the Company’s business;(ii) breached their fiduciary duty of good faith to establish and maintain adequate internal controls; and (iii) breached their fiduciary dutiesby disseminating false, misleading and/or incomplete information, all in connection with the Company’s alleged failure to use the SSDMFand to pay beneficiaries and escheat funds to states. The Demand requests that the Board of Directors: (a) undertake an independentinternal investigation into Senior Management’s violations of New Jersey and/or federal law; and (b) commence a civil action against eachmember of Senior Management to recover for the benefit of the Company the amount of damages sustained by the Company as a result ofthe alleged breaches described above. In response to the Demand, the Board of Directors formed a Special Litigation Committee that hasretained an outside law firm to investigate the Demand’s allegations. In September 2013, before the conclusion of the Special Litigation
Prudential Financial, Inc. 2013 Annual Report 227

PRUDENTIAL FINANCIAL, INC.
Notes to Consolidated Financial Statements
23. COMMITMENTS AND GUARANTEES, CONTINGENT LIABILITIES AND LITIGATION ANDREGULATORY MATTERS (continued)
Committee’s investigation, the shareholder who submitted the Demand filed a shareholder derivative lawsuit, Paul Memo, Derivatively onBehalf of Prudential Financial, Inc. v. John R. Strangfeld, Jr. et. al., in New Jersey Superior Court, Essex County. The complaint names asdefendants the Company’s Chief Executive Officer, the Vice Chairman, a former Chief Financial Officer, the Principal Accounting Officer,certain members of the Company’s Board of Directors and a former Director. The complaint repeats the allegations in the Demand andseeks an undetermined amount of damages, attorneys’ fees and costs, and equitable relief including a direction for the Company to reformand to improve its corporate governance and internal procedures to comply with applicable laws.
In August 2012, a purported class action lawsuit, City of Sterling Heights General Employees’ Retirement System v. PrudentialFinancial, Inc., et al., was filed in the United States District Court for the District of New Jersey, alleging violations of federal securitieslaw. The complaint names as defendants the Company’s Chief Executive Officer, the Chief Financial Officer, the Principal AccountingOfficer and certain members of the Company’s Board of Directors. The complaint alleges that knowingly false and misleading statementswere made regarding the Company’s current and future financial condition based on, among other things, the alleged failure to disclose:(i) potential liability for benefits that should either have been paid to policyholders or their beneficiaries, or escheated to applicable states;and (ii) the extent of the Company’s exposure for alleged state and federal law violations concerning the settlement of claims and theescheatment of unclaimed property. The complaint seeks an undetermined amount of damages, interest, attorneys’ fees and costs. In May2013, the complaint was amended to add three additional putative institutional investors as lead plaintiffs: National Shopmen PensionFund, The Heavy & General Laborers’ Locals 472 & 172 Pension & Annuity Funds, and Roofers Local No. 149 Pension Fund. In June2013, the Company moved to dismiss the amended complaint. In February 2014, the Court denied the Company’s motion to dismiss.
In October 2006, a purported class action lawsuit, Bouder v. Prudential Financial, Inc. and Prudential Insurance Company ofAmerica, was filed in the United States District Court for the District of New Jersey, claiming that Prudential failed to pay overtime toinsurance agents in violation of federal and Pennsylvania law, and that improper deductions were made from these agents’ wages inviolation of state law. The complaint sought back overtime pay and statutory damages, recovery of improper deductions, interest, andattorneys’ fees. In March 2008, the court conditionally certified a nationwide class on the federal overtime claim. Separately, in March2008, a purported nationwide class action lawsuit was filed in the United States District Court for the Southern District of California, Wangv. Prudential Financial, Inc. and Prudential Insurance, claiming that the Company failed to pay its agents overtime and provide otherbenefits in violation of California and federal law and seeking compensatory and punitive damages in unspecified amounts. In September2008, Wang was transferred to the United States District Court for the District of New Jersey and consolidated with the Bouder matter.Subsequent amendments to the complaint resulted in additional allegations involving purported violations of an additional nine states’overtime and wage payment laws. In February 2010, Prudential moved to decertify the federal overtime class that had been conditionallycertified in March 2008 and moved for summary judgment on the federal overtime claims of the named plaintiffs. In July 2010, plaintiffsfiled a motion for class certification of the state law claims. In August 2010, the district court granted Prudential’s motion for summaryjudgment, dismissing the federal overtime claims. In January 2013, the Court denied plaintiffs’ motion for class certification in its entirety.In July 2013, the Court granted plaintiffs’ motion for reconsideration, permitting plaintiffs to file a motion to certify a class of employeeinsurance agents seeking recovery under state wage and hour laws. In September 2013, plaintiffs filed a renewed motion for classcertification.
Since April 2012, the Company has filed ten actions seeking to recover damages attributable to investments in residential mortgage-backed securities (“RMBS”). Eight actions were filed in New Jersey state court, captioned The Prudential Insurance Company of America,et al. v. JP Morgan Chase, et al.; The Prudential Insurance Company of America, et al. v. Morgan Stanley, et al.; The Prudential InsuranceCompany of America, et al. v. Nomura Securities International, Inc., et al.; The Prudential Insurance Company of America, et al. v.Barclays Bank PLC, et al.; The Prudential Insurance Company of America, et al. v. Goldman Sachs & Company, et al.;The PrudentialInsurance Company of America, et al. v. RBS Financial Products, Inc., et al.; The Prudential Insurance Company of America, et al. v.Countrywide Financial Corp., et al.; and The Prudential Insurance Company of America, et al. v. UBS Securities LLC. et al. Additionally,two actions were filed in the United States District Court for the District of New Jersey: The Prudential Insurance Company of America v.Credit Suisse Securities (USA) LLC, et al. and The Prudential Insurance Company of America v. Bank of America National Associationand Merrill Lynch & Co., Inc., et al. Among other allegations stemming from the defendants’ origination, underwriting and sales ofRMBS, the complaints assert claims of common law fraud, negligent misrepresentation, breaches of the New Jersey Civil RICO statute,and, in some lawsuits, federal securities claims. The complaints seek unspecified damages.
Seven of the defendants (J.P. Morgan, Barclays, Nomura, RBS, Goldman Sachs, Countrywide, and UBS) removed the lawsuits fromNew Jersey state court to the United States District Court for the District of New Jersey. The Countrywide defendants also made anapplication to the Judicial Panel on Multi-District Litigation to transfer that case to the United States District Court for the Central Districtof California. In August 2013, that application was granted. Except for the Nomura and Goldman Sachs actions, the Company filedmotions to remand the lawsuits to New Jersey state court. The J.P. Morgan, Barclays, RBS and UBS lawsuits were subsequently remandedto New Jersey state court.
Each of the Goldman Sachs, Morgan Stanley, Nomura, Credit Suisse, Barclays, Bank of America/Merrill Lynch, J.P. Morgan, RBSand Countrywide defendants filed motions to dismiss the complaints against them. The motions to dismiss filed by Goldman Sachs, J.P.Morgan, Morgan Stanley, and Credit Suisse have been denied, the motion to dismiss filed by Nomura has been superseded by the filing ofour amended complaint, and the motions to dismiss filed by Barclays, Bank of America/Merrill Lynch, RBS and Countrywide are pending.In December 2013, the lawsuit against Goldman Sachs was settled.
228 Prudential Financial, Inc. 2013 Annual Report

PRUDENTIAL FINANCIAL, INC.
Notes to Consolidated Financial Statements
23. COMMITMENTS AND GUARANTEES, CONTINGENT LIABILITIES AND LITIGATION ANDREGULATORY MATTERS (continued)
Summary
The Company’s litigation and regulatory matters are subject to many uncertainties, and given their complexity and scope, theiroutcome cannot be predicted. It is possible that the Company’s results of operations or cash flow in a particular quarterly or annual periodcould be materially affected by an ultimate unfavorable resolution of pending litigation and regulatory matters depending, in part, upon theresults of operations or cash flow for such period. In light of the unpredictability of the Company’s litigation and regulatory matters, it isalso possible that in certain cases an ultimate unfavorable resolution of one or more pending litigation or regulatory matters could have amaterial adverse effect on the Company’s financial position. Management believes, however, that, based on information currently known toit, the ultimate outcome of all pending litigation and regulatory matters, after consideration of applicable reserves and rights toindemnification, is not likely to have a material adverse effect on the Company’s financial position.
24. QUARTERLY RESULTS OF OPERATIONS (UNAUDITED)
The unaudited quarterly results of operations for the years ended December 31, 2013 and 2012 are summarized in the table below:
Three Months Ended
March 31 June 30 September 30 December 31
(in millions, except per share amounts)2013Total revenues . . . . . . . . . . . . . . . . . . . . . . . . . . . . . . . . . . . . . . . . . . . . . . . . . . . . . . . . . . . . . $10,171 $10,041 $11,310 $ 9,939Total benefits and expenses . . . . . . . . . . . . . . . . . . . . . . . . . . . . . . . . . . . . . . . . . . . . . . . . . . . 11,730 10,810 9,784 10,821Income (loss) from continuing operations . . . . . . . . . . . . . . . . . . . . . . . . . . . . . . . . . . . . . . . . (686) (489) 1,032 (424)Income (loss) from discontinued operations . . . . . . . . . . . . . . . . . . . . . . . . . . . . . . . . . . . . . . 1 2 8 (4)Net income (loss) . . . . . . . . . . . . . . . . . . . . . . . . . . . . . . . . . . . . . . . . . . . . . . . . . . . . . . . . . . . (685) (487) 1,040 (428)Less: Income attributable to noncontrolling interests . . . . . . . . . . . . . . . . . . . . . . . . . . . . . . . 35 27 13 32Net income (loss) attributable to Prudential Financial, Inc. . . . . . . . . . . . . . . . . . . . . . . . . . . (720) (514) 1,027 (460)Basic earnings per share—Common Stock(1):
Income (loss) from continuing operations attributable to Prudential Financial, Inc. . . . $ (1.58) $ (1.12) $ 2.06 $ (0.93)Income (loss) from discontinued operations, net of taxes . . . . . . . . . . . . . . . . . . . . . . . . 0.00 0.00 0.01 (0.01)
Net income (loss) attributable to Prudential Financial, Inc. . . . . . . . . . . . . . . . . . . . . . . $ (1.58) $ (1.12) $ 2.07 $ (0.94)
Diluted earnings per share—Common Stock(1):Income (loss) from continuing operations attributable to Prudential Financial, Inc. . . . $ (1.58) $ (1.12) $ 2.02 $ (0.93)Income (loss) from discontinued operations, net of taxes . . . . . . . . . . . . . . . . . . . . . . . . 0.00 0.00 0.02 (0.01)
Net income (loss) attributable to Prudential Financial, Inc. . . . . . . . . . . . . . . . . . . . . . . $ (1.58) $ (1.12) $ 2.04 $ (0.94)
Basic and diluted earnings per share—Class B Stock(1):Income (loss) from continuing operations attributable to Prudential Financial, Inc. . . . $ 5.50 $ 1.00 $ 29.50 $ (14.00)
Net income (loss) attributable to Prudential Financial, Inc. . . . . . . . . . . . . . . . . . . . . . . $ 5.50 $ 1.00 $ 29.50 $ (14.00)
2012Total revenues . . . . . . . . . . . . . . . . . . . . . . . . . . . . . . . . . . . . . . . . . . . . . . . . . . . . . . . . . . . . . $ 9,635 $16,140 $13,136 $45,936Total benefits and expenses . . . . . . . . . . . . . . . . . . . . . . . . . . . . . . . . . . . . . . . . . . . . . . . . . . . 10,386 13,167 14,074 46,512Income (loss) from continuing operations . . . . . . . . . . . . . . . . . . . . . . . . . . . . . . . . . . . . . . . . (926) 2,231 (565) (185)Income (loss) from discontinued operations . . . . . . . . . . . . . . . . . . . . . . . . . . . . . . . . . . . . . . 7 7 (2) 3Net income (loss) . . . . . . . . . . . . . . . . . . . . . . . . . . . . . . . . . . . . . . . . . . . . . . . . . . . . . . . . . . . (919) 2,238 (567) (182)Less: Income attributable to noncontrolling interests . . . . . . . . . . . . . . . . . . . . . . . . . . . . . . . 6 16 7 21Net income (loss) attributable to Prudential Financial, Inc. . . . . . . . . . . . . . . . . . . . . . . . . . . (925) 2,222 (574) (203)Basic earnings per share—Common Stock(1):
Income (loss) from continuing operations attributable to Prudential Financial, Inc. . . . $ (2.01) $ 4.73 $ (1.32) $ (0.42)Income (loss) from discontinued operations, net of taxes . . . . . . . . . . . . . . . . . . . . . . . . 0.01 0.02 0.00 0.00
Net income (loss) attributable to Prudential Financial, Inc. . . . . . . . . . . . . . . . . . . . . . . $ (2.00) $ 4.75 $ (1.32) $ (0.42)
Diluted earnings per share—Common Stock(1):Income (loss) from continuing operations attributable to Prudential Financial, Inc. . . . $ (2.01) $ 4.67 $ (1.32) $ (0.42)Income (loss) from discontinued operations, net of taxes . . . . . . . . . . . . . . . . . . . . . . . . 0.01 0.02 0.00 0.00
Net income (loss) attributable to Prudential Financial, Inc. . . . . . . . . . . . . . . . . . . . . . . $ (2.00) $ 4.69 $ (1.32) $ (0.42)
Basic and diluted earnings per share—Class B Stock(1):Income (loss) from continuing operations attributable to Prudential Financial, Inc. . . . $ 6.50 $ (6.00) $ 20.00 $ (9.00)Income (loss) from discontinued operations, net of taxes . . . . . . . . . . . . . . . . . . . . . . . . 0.00 (0.50) (0.50) 0.00
Net income (loss) attributable to Prudential Financial, Inc. . . . . . . . . . . . . . . . . . . . . . . $ 6.50 $ (6.50) $ 19.50 $ (9.00)
(1) Quarterly earnings per share amounts may not add to the full year amounts due to the averaging of shares.
Prudential Financial, Inc. 2013 Annual Report 229

PRUDENTIAL FINANCIAL, INC.
Notes to Consolidated Financial Statements
24. QUARTERLY RESULTS OF OPERATIONS (UNAUDITED) (continued)
The quarterly historical information presented in the table above has been revised to reflect the impact of a discretionary change inaccounting principle for recognition of performance based incentive fee revenue. The Company adopted this revised accounting principlein the fourth quarter of 2013 with retrospective application for prior periods. For further information, see Note 2. See table below forimpact to net income (loss) attributable to Prudential Financial, Inc. and diluted earnings per share of Common stock for previouslyreported periods.
Three Months Ended
March 31 June 30 September 30 December 31
(in millions, except per share amounts)Impact of change in accounting for performance based incentive fees:2013INCOME (LOSS) FROM CONTINUING OPERATIONS . . . . . . . . . . . . . $ (21) $ (1) $ (21) n/a
Less: Income (loss) attributable to noncontrolling interests . . . . . . . . . . . . (7) (8) (6) n/a
NET INCOME (LOSS) ATTRIBUTABLE TO PRUDENTIALFINANCIAL, INC. . . . . . . . . . . . . . . . . . . . . . . . . . . . . . . . . . . . . . . . . . . . . $ (14) $ 7 $ (15) n/a
EARNINGS PER SHAREFinancial Services Businesses
Basic earnings per share—Common Stock:Income (loss) from continuing operations attributable to Prudential
Financial, Inc. . . . . . . . . . . . . . . . . . . . . . . . . . . . . . . . . . . . . . . . . . . . . . $(0.03) $ 0.02 $(0.03) n/aNet income (loss) attributable to Prudential Financial, Inc. . . . . . . . . . . . . (0.03) 0.01 (0.04) n/a
Diluted earnings per share—Common Stock:Income (loss) from continuing operations attributable to Prudential
Financial, Inc. . . . . . . . . . . . . . . . . . . . . . . . . . . . . . . . . . . . . . . . . . . . . . $(0.03) $ 0.02 $(0.04) n/aNet income (loss) attributable to Prudential Financial, Inc. . . . . . . . . . . . . (0.03) 0.01 (0.03) n/a
2012INCOME (LOSS) FROM CONTINUING OPERATIONS . . . . . . . . . . . . . $ 9 $ (1) $ (8) $ 23
Less: Income (loss) attributable to noncontrolling interests . . . . . . . . . . . . (5) 1 (18) (6)
NET INCOME (LOSS) ATTRIBUTABLE TO PRUDENTIALFINANCIAL, INC. . . . . . . . . . . . . . . . . . . . . . . . . . . . . . . . . . . . . . . . . . . . . $ 14 $ (2) $ 10 $ 29
EARNINGS PER SHAREFinancial Services Businesses
Basic earnings per share—Common Stock:Income (loss) from continuing operations attributable to Prudential
Financial, Inc. . . . . . . . . . . . . . . . . . . . . . . . . . . . . . . . . . . . . . . . . . . . . . $ 0.03 $(0.01) $ 0.02 $0.06Net income (loss) attributable to Prudential Financial, Inc. . . . . . . . . . . . . 0.03 0.00 0.02 0.06
Diluted earnings per share—Common Stock:Income (loss) from continuing operations attributable to Prudential
Financial, Inc. . . . . . . . . . . . . . . . . . . . . . . . . . . . . . . . . . . . . . . . . . . . . . $ 0.03 $ 0.00 $ 0.02 $0.06Net income (loss) attributable to Prudential Financial, Inc. . . . . . . . . . . . . 0.03 0.00 0.02 0.06
Results for the fourth quarter of 2013 include a pre-tax benefit of $116 million related to an out of period adjustment recorded by theCompany due to an overstatement of reserves in the third quarter of 2013. The overstatement resulted from the use of incorrect data inputsto calculate the impact of the market’s perception of our own non-performance risk on the reserves for certain annuities with guaranteedbenefits. This item impacted only the third and fourth quarters of 2013 and had no impact to full year 2013 reported results.
Results for the second quarter of 2012 include a total pre-tax charge of $122 million related to two out of period adjustments recordedby the Company. The first adjustment related to a decline in the value of a real estate-related investment. Based on a review of theunderlying collateral and a related guarantee, the Company determined that impairments of $75 million should have been recognized, $61million of which related to prior periods. The second adjustment consisted of an increase of $61 million in reserves for estimated paymentsarising from use of new Social Security Master Death File matching criteria to identify deceased policy and contract holders. The initialcalculation of the reserve excluded certain life policies in extended term status from the analysis used to identify potential claims.
Results for the fourth quarter of 2012 include a total pre-tax charge of $54 million related to an out of period adjustment recorded bythe Company due to an understatement of recorded liabilities for certain employee benefits based on a review of the consistency ofrecognition of such liabilities.
230 Prudential Financial, Inc. 2013 Annual Report

PRUDENTIAL FINANCIAL, INC.
Supplemental Combining Statements of Financial PositionDecember 31, 2013 and 2012 (in millions)
2013 2012
FinancialServices
BusinessesClosed Block
Business Consolidated
FinancialServices
BusinessesClosed Block
Business Consolidated
ASSETSFixed maturities, available-for-sale, at fair value . . . . . . . . . . . . . . . . . $243,654 $43,212 $286,866 $254,917 $46,419 $301,336Fixed maturities, held-to-maturity, at amortized cost . . . . . . . . . . . . . . 3,312 0 3,312 4,268 0 4,268Trading account assets supporting insurance liabilities, at fair
value . . . . . . . . . . . . . . . . . . . . . . . . . . . . . . . . . . . . . . . . . . . . . . . . . 20,827 0 20,827 20,590 0 20,590Other trading account assets, at fair value . . . . . . . . . . . . . . . . . . . . . . 6,111 342 6,453 6,053 275 6,328Equity securities, available-for-sale, at fair value . . . . . . . . . . . . . . . . 6,026 3,884 9,910 5,052 3,225 8,277Commercial mortgage and other loans . . . . . . . . . . . . . . . . . . . . . . . . . 31,335 9,673 41,008 27,125 9,608 36,733Policy loans . . . . . . . . . . . . . . . . . . . . . . . . . . . . . . . . . . . . . . . . . . . . . 6,753 5,013 11,766 6,455 5,120 11,575Other long-term investments . . . . . . . . . . . . . . . . . . . . . . . . . . . . . . . . 8,304 2,024 10,328 8,016 2,012 10,028Short-term investments . . . . . . . . . . . . . . . . . . . . . . . . . . . . . . . . . . . . . 5,837 1,866 7,703 5,186 1,261 6,447
Total investments . . . . . . . . . . . . . . . . . . . . . . . . . . . . . . . . . . . . . 332,159 66,014 398,173 337,662 67,920 405,582Cash and cash equivalents . . . . . . . . . . . . . . . . . . . . . . . . . . . . . . . . . . 10,797 642 11,439 17,546 554 18,100Accrued investment income . . . . . . . . . . . . . . . . . . . . . . . . . . . . . . . . . 2,505 584 3,089 2,534 593 3,127Deferred policy acquisition costs . . . . . . . . . . . . . . . . . . . . . . . . . . . . . 16,101 411 16,512 13,688 412 14,100Value of business acquired . . . . . . . . . . . . . . . . . . . . . . . . . . . . . . . . . . 3,675 0 3,675 3,248 0 3,248Other assets . . . . . . . . . . . . . . . . . . . . . . . . . . . . . . . . . . . . . . . . . . . . . . 13,082 751 13,833 11,313 511 11,824Separate account assets . . . . . . . . . . . . . . . . . . . . . . . . . . . . . . . . . . . . . 285,060 0 285,060 253,254 0 253,254
TOTAL ASSETS . . . . . . . . . . . . . . . . . . . . . . . . . . . . . . . . . . . . $663,379 $68,402 $731,781 $639,245 $69,990 $709,235
LIABILITIES AND EQUITYLIABILITIESFuture policy benefits . . . . . . . . . . . . . . . . . . . . . . . . . . . . . . . . . . . . . . $156,601 $50,258 $206,859 $165,212 $50,838 $216,050Policyholders’ account balances . . . . . . . . . . . . . . . . . . . . . . . . . . . . . . 131,298 5,359 136,657 128,987 5,426 134,413Policyholders’ dividends . . . . . . . . . . . . . . . . . . . . . . . . . . . . . . . . . . . 97 5,418 5,515 257 7,250 7,507Securities sold under agreements to repurchase . . . . . . . . . . . . . . . . . . 4,128 3,770 7,898 3,436 2,382 5,818Cash collateral for loaned securities . . . . . . . . . . . . . . . . . . . . . . . . . . . 4,230 810 5,040 2,864 1,077 3,941Income taxes . . . . . . . . . . . . . . . . . . . . . . . . . . . . . . . . . . . . . . . . . . . . . 6,010 (588) 5,422 9,019 (507) 8,512Short-term debt . . . . . . . . . . . . . . . . . . . . . . . . . . . . . . . . . . . . . . . . . . . 2,594 75 2,669 2,409 75 2,484Long-term debt . . . . . . . . . . . . . . . . . . . . . . . . . . . . . . . . . . . . . . . . . . . 21,953 1,600 23,553 23,054 1,675 24,729Other Liabilities . . . . . . . . . . . . . . . . . . . . . . . . . . . . . . . . . . . . . . . . . . 13,618 307 13,925 11,561 277 11,838Notes issued by consolidated variable interest entities . . . . . . . . . . . . . 3,302 0 3,302 1,577 0 1,577Separate account liabilities . . . . . . . . . . . . . . . . . . . . . . . . . . . . . . . . . . 285,060 0 285,060 253,254 0 253,254
Total liabilities . . . . . . . . . . . . . . . . . . . . . . . . . . . . . . . . . . . . . . . 628,891 67,009 695,900 601,630 68,493 670,123
EQUITYAccumulated other comprehensive income . . . . . . . . . . . . . . . . . . . . . 8,586 95 8,681 9,990 224 10,214Other attributed equity . . . . . . . . . . . . . . . . . . . . . . . . . . . . . . . . . . . . . 25,299 1,298 26,597 27,016 1,273 28,289
Total attributed equity . . . . . . . . . . . . . . . . . . . . . . . . . . . . . . . . . 33,885 1,393 35,278 37,006 1,497 38,503Noncontrolling interests . . . . . . . . . . . . . . . . . . . . . . . . . . . . . . . . . . . . 603 0 603 609 0 609
Total equity . . . . . . . . . . . . . . . . . . . . . . . . . . . . . . . . . . . . . . . . . . 34,488 1,393 35,881 37,615 1,497 39,112
TOTAL LIABILITIES AND EQUITY . . . . . . . . . . . . . . . . . . $663,379 $68,402 $731,781 $639,245 $69,990 $709,235
See Notes to Supplemental Combining Financial Information
Prudential Financial, Inc. 2013 Annual Report 231

PRUDENTIAL FINANCIAL, INC.
Supplemental Combining Statements of OperationsYears Ended December 31, 2013 and 2012 (in millions)
2013 2012
FinancialServices
BusinessesClosed Block
Business Consolidated
FinancialServices
BusinessesClosed Block
Business Consolidated
REVENUESPremiums . . . . . . . . . . . . . . . . . . . . . . . . . . . . . . . . . . . . . . . . . . . . . . $23,509 $2,728 $26,237 $62,537 $2,817 $65,354Policy charges and fee income . . . . . . . . . . . . . . . . . . . . . . . . . . . . . 5,415 0 5,415 4,489 0 4,489Net investment income . . . . . . . . . . . . . . . . . . . . . . . . . . . . . . . . . . . 11,713 3,016 14,729 10,508 3,153 13,661Asset management fees and other income . . . . . . . . . . . . . . . . . . . . . 226 60 286 2,740 44 2,784Realized investment gains (losses), net
Other-than-temporary impairments on fixed maturitysecurities . . . . . . . . . . . . . . . . . . . . . . . . . . . . . . . . . . . . . . . . (659) (396) (1,055) (939) (672) (1,611)
Other-than-temporary impairments on fixed maturitysecurities transferred to Other Comprehensive Income . . . . 509 347 856 676 598 1,274
Other realized investment gains (losses), net . . . . . . . . . . . . . . (5,288) 281 (5,007) (1,421) 317 (1,104)
Total realized investment gains (losses), net . . . . . . . (5,438) 232 (5,206) (1,684) 243 (1,441)
Total revenues . . . . . . . . . . . . . . . . . . . . . . . . . . . . . . . . . . . . . . 35,425 6,036 41,461 78,590 6,257 84,847
BENEFITS AND EXPENSESPolicyholders’ benefits . . . . . . . . . . . . . . . . . . . . . . . . . . . . . . . . . . . 23,399 3,334 26,733 61,686 3,445 65,131Interest credited to policyholders’ account balances . . . . . . . . . . . . . 2,975 136 3,111 4,097 137 4,234Dividends to policyholders . . . . . . . . . . . . . . . . . . . . . . . . . . . . . . . . 140 1,910 2,050 155 2,021 2,176Amortization of deferred policy acquisition costs . . . . . . . . . . . . . . . 203 37 240 1,466 38 1,504General and administrative expenses . . . . . . . . . . . . . . . . . . . . . . . . 10,454 557 11,011 10,542 552 11,094
Total benefits and expenses . . . . . . . . . . . . . . . . . . . . . . . . 37,171 5,974 43,145 77,946 6,193 84,139
INCOME (LOSS) FROM CONTINUING OPERATIONSBEFORE INCOME TAXES AND EQUITY IN EARNINGSOF OPERATING JOINT VENTURES . . . . . . . . . . . . . . . . . . (1,746) 62 (1,684) 644 64 708
Income tax expense (benefit) . . . . . . . . . . . . . . . . . . . . . . . (1,074) 16 (1,058) 192 21 213
INCOME (LOSS) FROM CONTINUING OPERATIONSBEFORE EQUITY IN EARNINGS OF OPERATINGJOINT VENTURES . . . . . . . . . . . . . . . . . . . . . . . . . . . . . . . . . . (672) 46 (626) 452 43 495
Equity in earnings of operating joint ventures, net of taxes . . . . . . . 59 0 59 60 0 60
INCOME (LOSS) FROM CONTINUING OPERATIONS . . . . (613) 46 (567) 512 43 555Income (loss) from discontinued operations, net of taxes . . . . . . . . . 7 0 7 17 (2) 15
NET INCOME (LOSS) . . . . . . . . . . . . . . . . . . . . . . . . . . . . . . . . . . (606) 46 (560) 529 41 570Less: Income attributable to noncontrolling interests . . . . . . . . . . . . 107 0 107 50 0 50
NET INCOME (LOSS) ATTRIBUTABLE TO PRUDENTIALFINANCIAL, INC. . . . . . . . . . . . . . . . . . . . . . . . . . . . . . . . . . . . $ (713) $ 46 $ (667) $ 479 $ 41 $ 520
See Notes to Supplemental Combining Financial Information
232 Prudential Financial, Inc. 2013 Annual Report

PRUDENTIAL FINANCIAL, INC.
Notes to Supplemental Combining Financial Information
1. BASIS OF PRESENTATION
The supplemental combining financial information presents the consolidated financial position and results of operations for PrudentialFinancial, Inc. and its subsidiaries (together, the “Company”), separately reporting the Financial Services Businesses and the Closed BlockBusiness. The Financial Services Businesses and the Closed Block Business are both fully integrated operations of the Company and arenot separate legal entities. The supplemental combining financial information presents the results of the Financial Services Businesses andthe Closed Block Business as if they were separate reporting entities and should be read in conjunction with the Consolidated FinancialStatements.
The Company has outstanding two classes of common stock. The Common Stock reflects the performance of the Financial ServicesBusinesses and the Class B Stock reflects the performance of the Closed Block Business.
The Closed Block Business was established on the date of demutualization and includes the assets and liabilities of the Closed Block(see Note 12 to the Consolidated Financial Statements for a description of the Closed Block). It also includes assets held outside the ClosedBlock necessary to meet insurance regulatory capital requirements related to products included within the Closed Block; deferred policyacquisition costs related to the Closed Block policies; the principal amount of the IHC debt (as discussed below and in Note 14 to theConsolidated Financial Statements) and related unamortized debt issuance costs, as well as an interest rate swap related to the IHC debt;and certain other related assets and liabilities. The Financial Services Businesses consist of the U.S. Retirement Solutions and InvestmentManagement, U.S. Individual Life and Group Insurance, and International Insurance divisions and Corporate and Other operations.
2. ALLOCATION OF RESULTS
This supplemental combining financial information reflects the assets, liabilities, revenues and expenses directly attributable to theFinancial Services Businesses and the Closed Block Business, as well as allocations deemed reasonable by management in order to fairlypresent the financial position and results of operations of the Financial Services Businesses and the Closed Block Business on a stand-alonebasis. While management considers the allocations utilized to be reasonable, management has the discretion to make operational andfinancial decisions that may affect the allocation methods and resulting assets, liabilities, revenues and expenses of each business. Inaddition, management has limited discretion over accounting policies and the appropriate allocation of earnings between the twobusinesses. The Company is subject to agreements which provide that, in most instances, the Company may not change the allocationmethodology or accounting policies for the allocation of earnings between the Financial Services Businesses and Closed Block Businesswithout the prior consent of the Class B Stock holders or IHC debt bond insurer.
General corporate overhead not directly attributable to a specific business that has been incurred in connection with the generation ofthe businesses’ revenues is generally allocated between the Financial Services Businesses and the Closed Block Business based on thegeneral and administrative expenses of each business as a percentage of the total general and administrative expenses for all businesses.
PHLLC has outstanding IHC debt, of which net proceeds of $1.66 billion were allocated to the Financial Services Businessesconcurrent with the demutualization on December 18, 2001. The IHC debt is serviced by the cash flows of the Closed Block Business, andthe results of the Closed Block Business reflect interest expense associated with the IHC debt.
Income taxes are allocated between the Financial Services Businesses and the Closed Block Business as if they were separatecompanies based on the taxable income or losses and other tax characterizations of each business. If the Financial Services Businessesgenerate tax benefits, such as net operating losses, it is entitled to record such tax benefits to the extent they are expected to be utilized on aconsolidated basis. However, if the Closed Block Business generates tax benefits, it will receive the full benefit in cash, and the FinancialServices Businesses will subsequently recover the payment at the time the benefits are actually utilized on a consolidated basis.
Holders of Common Stock have no interest in a separate legal entity representing the Financial Services Businesses; holders of theClass B Stock have no interest in a separate legal entity representing the Closed Block Business; and holders of each class of commonstock are subject to all of the risks associated with an investment in the Company.
In the event of a liquidation, dissolution or winding-up of the Company, holders of Common Stock and holders of Class B Stockwould be entitled to receive a proportionate share of the net assets of the Company that remain after paying all liabilities and the liquidationpreferences of any preferred stock.
The results of the Financial Services Businesses are subject to certain risks pertaining to the Closed Block. These include anyexpenses and liabilities from litigation affecting the Closed Block policies as well as the consequences of certain potential adverse taxdeterminations. In connection with the sale of the Class B Stock and IHC debt, the cost of indemnifying the investors with respect tocertain matters will be borne by the Financial Services Businesses.
Prudential Financial, Inc. 2013 Annual Report 233

MARKET PRICE OF AND DIVIDENDS ON COMMON EQUITY, AND RELATED STOCKHOLDER MATTERS
Prudential Financial’s Common Stock was issued to eligible policyholders in Prudential Insurance’s demutualization and sold toinvestors in Prudential Financial’s initial public offering. The Common Stock began trading on the New York Stock Exchange under thesymbol “PRU” on December 13, 2001. The following table presents the high and low closing prices for the Common Stock on the NewYork Stock Exchange during the periods indicated and the dividends declared per share during such periods:
High Low Dividends
2013:Fourth Quarter . . . . . . . . . . . . . . . . . . . . . . . . . . . . . . . . . . . . . . . . . . . . . . . . . . . . . . . . . . . . . . . . . . . . . . . . . . . . . . . . . . . . . . . $92.43 $75.99 $0.53Third Quarter . . . . . . . . . . . . . . . . . . . . . . . . . . . . . . . . . . . . . . . . . . . . . . . . . . . . . . . . . . . . . . . . . . . . . . . . . . . . . . . . . . . . . . . $82.62 $73.30 $0.40Second Quarter . . . . . . . . . . . . . . . . . . . . . . . . . . . . . . . . . . . . . . . . . . . . . . . . . . . . . . . . . . . . . . . . . . . . . . . . . . . . . . . . . . . . . . $73.03 $54.91 $0.40First Quarter . . . . . . . . . . . . . . . . . . . . . . . . . . . . . . . . . . . . . . . . . . . . . . . . . . . . . . . . . . . . . . . . . . . . . . . . . . . . . . . . . . . . . . . . $60.41 $54.64 $0.40
2012:Fourth Quarter . . . . . . . . . . . . . . . . . . . . . . . . . . . . . . . . . . . . . . . . . . . . . . . . . . . . . . . . . . . . . . . . . . . . . . . . . . . . . . . . . . . . . . . $59.89 $48.74 $1.60Third Quarter . . . . . . . . . . . . . . . . . . . . . . . . . . . . . . . . . . . . . . . . . . . . . . . . . . . . . . . . . . . . . . . . . . . . . . . . . . . . . . . . . . . . . . . $58.63 $45.46 —Second Quarter . . . . . . . . . . . . . . . . . . . . . . . . . . . . . . . . . . . . . . . . . . . . . . . . . . . . . . . . . . . . . . . . . . . . . . . . . . . . . . . . . . . . . . $64.50 $44.74 —First Quarter . . . . . . . . . . . . . . . . . . . . . . . . . . . . . . . . . . . . . . . . . . . . . . . . . . . . . . . . . . . . . . . . . . . . . . . . . . . . . . . . . . . . . . . . $64.65 $51.30 —
On January 31, 2014, there were 1,612,274 registered holders of record for the Common Stock and 461 million shares outstanding.
The Class B Stock was issued to institutional investors (two subsidiaries of American International Group, Inc. and Pacific Life Corp.)in a private placement pursuant to Section 4(2) of the Securities Act of 1933 on the date of demutualization. There is no established publictrading market for the Class B Stock. For the years ended December 31, 2013 and 2012, Prudential Financial paid dividends totaling$9.625 per share of Class B Stock. On January 31, 2014, there were three holders of record for the Class B Stock and 2 million sharesoutstanding.
Prudential Financial’s Board of Directors currently intends to continue to declare and pay dividends on the Common Stock and ClassB Stock. Future dividend decisions will be based on, and affected by, a number of factors including the financial performance of theFinancial Services Businesses and Closed Block Business; our overall financial condition, results of operations, cash requirements andfuture prospects; regulatory restrictions including on the payment of dividends by Prudential Financial’s subsidiaries and requirementsunder Dodd-Frank; and such other factors as the Board of Directors may deem relevant. Dividends payable by Prudential Financial arelimited to the amount that would be legally available for payment under New Jersey corporate law. For additional information on dividendsand related regulatory restrictions, see Note 15 to the Consolidated Financial Statements.
For additional information about our exchangeable surplus notes see Note 14 to the Consolidated Financial Statements.
234 Prudential Financial, Inc. 2013 Annual Report

PERFORMANCE GRAPH
The following graph, which covers the period from the closing price on December 31, 2008 through the closing price onDecember 31, 2013, compares the cumulative total shareholder return on Prudential Financial’s Common Stock with the cumulative totalshareholder return on (i) the Standard & Poor’s (“S&P”) 500 Index, and (ii) a Financial Services Composite Index, which is the average ofthe S&P 500 Life & Health Insurance and S&P 500 Diversified Financials indices. The figures presented below assume the reinvestment ofall dividends into shares of common stock and an initial investment of $100 at the closing prices on December 31, 2008.
ANNUAL RETURN PERCENTAGEYears Ending
Company / Index Dec09 Dec10 Dec11 Dec12 Dec13
Prudential Financial, Inc . . . . . . . . . . . . . . . . . . . . . . . . . . . . . . . . . . . . . . . . . . . . . . 66.75 20.66 -12.19 9.67 77.17S&P 500 Index . . . . . . . . . . . . . . . . . . . . . . . . . . . . . . . . . . . . . . . . . . . . . . . . . . . . . . 26.46 15.06 2.11 16.00 32.39Financial Services Composite Index . . . . . . . . . . . . . . . . . . . . . . . . . . . . . . . . . . . . . 22.98 15.17 -25.37 27.97 52.43
Company / Index
Prudential Financial, Inc.
S&P 500 Index
Financial Services Composite Index
Comparison of Cumulative Five Year Total Return
Base Period
INDEXED RETURNSYears Ending
31 Dec 08 31 Dec 09 31 Dec 10 31 Dec 11 31 Dec 12 31 Dec 13
100
100
100
12/31/08 12/31/09 12/31/10 12/31/11 12/31/12 12/31/13$0
$100
$200
$300
$400
Prudential Financial, Inc. S&P 500 Index Financial Services Composite Index
166.75 201.21 176.69 193.77 343.30
126.46 145.51 148.59 172.37 228.19
122.98 141.63 105.70 135.26 206.18
Prudential Financial, Inc. 2013 Annual Report 235

FORWARD-LOOKING STATEMENTS
Certain of the statements included in this Annual Report on Form 10-K, including but not limited to those inManagement’s Discussion and Analysis of Financial Condition and Results of Operations, constitute forward-lookingstatements within the meaning of the U.S. Private Securities Litigation Reform Act of 1995. Words such as “expects,”“believes,” “anticipates,” “includes,” “plans,” “assumes,” “estimates,” “projects,” “intends,” “should,” “will,” “shall” orvariations of such words are generally part of forward-looking statements. Forward-looking statements are made based onmanagement’s current expectations and beliefs concerning future developments and their potential effects upon PrudentialFinancial, Inc. and its subsidiaries. There can be no assurance that future developments affecting Prudential Financial, Inc.and its subsidiaries will be those anticipated by management. These forward-looking statements are not a guarantee of futureperformance and involve risks and uncertainties, and there are certain important factors that could cause actual results todiffer, possibly materially, from expectations or estimates reflected in such forward-looking statements, including, amongothers: (1) general economic, market and political conditions, including the performance and fluctuations of fixed income,equity, real estate and other financial markets; (2) the availability and cost of additional debt or equity capital or externalfinancing for our operations; (3) interest rate fluctuations or prolonged periods of low interest rates; (4) the degree to whichwe choose not to hedge risks, or the potential ineffectiveness or insufficiency of hedging or risk management strategies wedo implement, with regard to variable annuity or other product guarantees; (5) any inability to access our credit facilities;(6) reestimates of our reserves for future policy benefits and claims; (7) differences between actual experience regardingmortality, longevity, morbidity, persistency, surrender experience, interest rates or market returns and the assumptions weuse in pricing our products, establishing liabilities and reserves or for other purposes; (8) changes in our assumptions relatedto deferred policy acquisition costs, value of business acquired or goodwill; (9) changes in assumptions for retirementexpense; (10) changes in our financial strength or credit ratings; (11) statutory reserve requirements associated with term anduniversal life insurance policies under Regulation XXX and Guideline AXXX; (12) investment losses, defaults andcounterparty non-performance; (13) competition in our product lines and for personnel; (14) difficulties in marketing anddistributing products through current or future distribution channels; (15) changes in tax law; (16) economic, political,currency and other risks relating to our international operations; (17) fluctuations in foreign currency exchange rates andforeign securities markets; (18) regulatory or legislative changes, including the Dodd-Frank Wall Street Reform andConsumer Protection Act; (19) inability to protect our intellectual property rights or claims of infringement of the intellectualproperty rights of others; (20) adverse determinations in litigation or regulatory matters and our exposure to contingentliabilities, including in connection with our divestiture or winding down of businesses; (21) domestic or international militaryactions, natural or man-made disasters including terrorist activities or pandemic disease, or other events resulting incatastrophic loss of life; (22) ineffectiveness of risk management policies and procedures in identifying, monitoring andmanaging risks; (23) effects of acquisitions, divestitures and restructurings, including possible difficulties in integrating andrealizing projected results of acquisitions; (24) interruption in telecommunication, information technology or otheroperational systems or failure to maintain the security, confidentiality or privacy of sensitive data on such systems;(25) changes in statutory or U.S. GAAP accounting principles, practices or policies; (26) Prudential Financial, Inc.’s primaryreliance, as a holding company, on dividends or distributions from its subsidiaries to meet debt payment obligations and theability of the subsidiaries to pay such dividends or distributions in light of our ratings objectives and/or applicable regulatoryrestrictions; and (27) risks due to the lack of legal separation between our Financial Services Businesses and our ClosedBlock Business. Prudential Financial, Inc. does not intend, and is under no obligation, to update any particular forward-looking statement included in this document. See “Risk Factors” included in Prudential Financial’s 2013 Annual Report onForm 10-K for discussion of certain risks relating to our businesses and investment in our securities.
236 Prudential Financial, Inc. 2013 Annual Report

Prudential officers and directors (as of March 1, 2014)
eXecutiVe officers
John R. Strangfeld Chairman of the Board, Chief Executive Officer and President
Mark B. Grier Vice Chairman
Edward P. Baird* Executive Vice President and Chief Operating Officer, International Businesses
Susan L. Blount Executive Vice President and General Counsel
Robert M. Falzon Executive Vice President and Chief Financial Officer
Charles F. Lowrey* Executive Vice President and Chief Operating Officer, U.S. Businesses
Barbara G. Koster Senior Vice President and Chief Information Officer
Richard F. Lambert Senior Vice President and Chief Actuary
Nicholas C. Silitch Senior Vice President and Chief Risk Officer
Scott C. Sleyster Senior Vice President and Chief Investment Officer
Sharon C. Taylor Senior Vice President, Human Resources
Board of directors
Thomas J. Baltimore Jr. President and Chief Executive Officer, RLJ Lodging Trust
Gordon M. Bethune Managing Director, g-b1 Partners
Gaston Caperton Former Governor, West Virginia
Gilbert F. Casellas Chairman, OMNITRU
James G. Cullen Retired President and Chief Operating Officer, Bell Atlantic Corporation
Mark B. Grier Vice Chairman, Prudential Financial, Inc.
Constance J. Horner Former Guest Scholar at The Brookings Institution and Former Assistant to the President of the United States
Martina T. Hund-Mejean Chief Financial Officer, MasterCard Worldwide
Karl J. Krapek Co-Founder, The Keystone Companies
Christine A. Poon Dean and John W. Berry, Sr., Chair in Business, Fisher College of Business at The Ohio State University
Douglas A. Scovanner Founder and Managing Member, Comprehensive Financial Strategies, LLC
John R. Strangfeld Chairman of the Board, Chief Executive Officer and President, Prudential Financial, Inc.
James A. Unruh Founding Principal, Alerion Capital Group, LLC
shareholder informationCorporate Office Prudential Financial, Inc. 751 Broad Street, Newark, NJ 07102 973-802-6000
Stock Exchange Listing The Common Stock of Prudential Financial, Inc. is traded on the New York Stock Exchange under the symbol “PRU.”
Shareholder Services at Computershare Computershare Trust Company, N.A., the transfer agent for Prudential Financial, Inc., can assist registered shareholders with a variety of services, including: Convenient liquidation of shares Direct deposit of dividends Transferring shares from a deceased shareholder
to another owner Changing the ownership of your shares Change of address
For more information, contact Computershare directly: Online: www.computershare.com/investor By phone: within the United States at 800-305-9404,
outside the United States at 732-512-3782 By mail: Computershare Trust Company, N.A.
P.O. Box 43033, Providence, RI 02940-3033
Did you know you can also transfer shares registered at Computershare to your broker? Please contact your broker for additional information.
Annual Meeting Shareholders are invited to attend Prudential Financial, Inc.’s annual meeting, which will be held on May 13, 2014, beginning at 2 p.m. at our corporate headquarters. You may listen to the annual meeting on the internet by visiting www.investor.prudential.com. Additional information about the meeting can be found in the proxy statement.
Information about Prudential Financial, Inc. You can contact Prudential Financial, Inc.’s Corporate Information Service at 877-998-7625 at any time to obtain or listen to financial results or news releases. In addition, you may request a copy of our Annual Report on Form 10-K, which we will send to you without charge. You may also access our news releases, financial information and reports filed with the Securities and Exchange Commission (for example, our Annual Report on Form 10-K, our Quarterly Reports on Form 10-Q, and our Current Reports on Form 8-K and any amendments to those forms) online at www.investor.prudential.com. Copies of current documents on our website are available without charge, and reports filed with or furnished to the Securities and Exchange Commission will be available as soon as reasonably practicable after they are filed with or furnished to the Commission.
Investor Relations Institutional investors, analysts and other members of the professional financial community can contact our Investor Relations department via e-mail at [email protected], or by visiting the Investor Relations website at www.investor.prudential.com.
Visit Prudential Financial, Inc. Online For more information about our corporate governance, as well as to access information for shareholders and information about our company, visit our website at www.prudential.com/governance.
Now you can receive electronic delivery of all shareholder communications from Computershare, including the annual report and proxy materials, tax forms and other statements. By selecting this option, you are partnering with us to minimize our impact on the environment.
* Effective April 4, 2014, Charles F. Lowrey replaces Edward P. Baird as Executive Vice President and Chief Operating Officer of Prudential’s International Businesses, following Baird’s retirement, and Stephen Pelletier, previously CEO of Prudential’s Group Insurance business, succeeds Lowrey as Executive Vice President and Chief Operating Officer, U.S. Businesses.

PAPERS PRODUCED UNDER A SUSTAINABLE FOREST MANAGEMENT PROGRAM. PRINTED USING
VEGETABLE-BASED INKS AND RENEWABLE ENERGY.PRINTED ON RECYCLED PAPER
WITh 10% POST-CONSUMER WASTE.
PRU
DEN
TIAL FINAN
CIAL, INC.
2013 ANN
UAL R
EPOR
T