Embed Size (px)
Citation preview
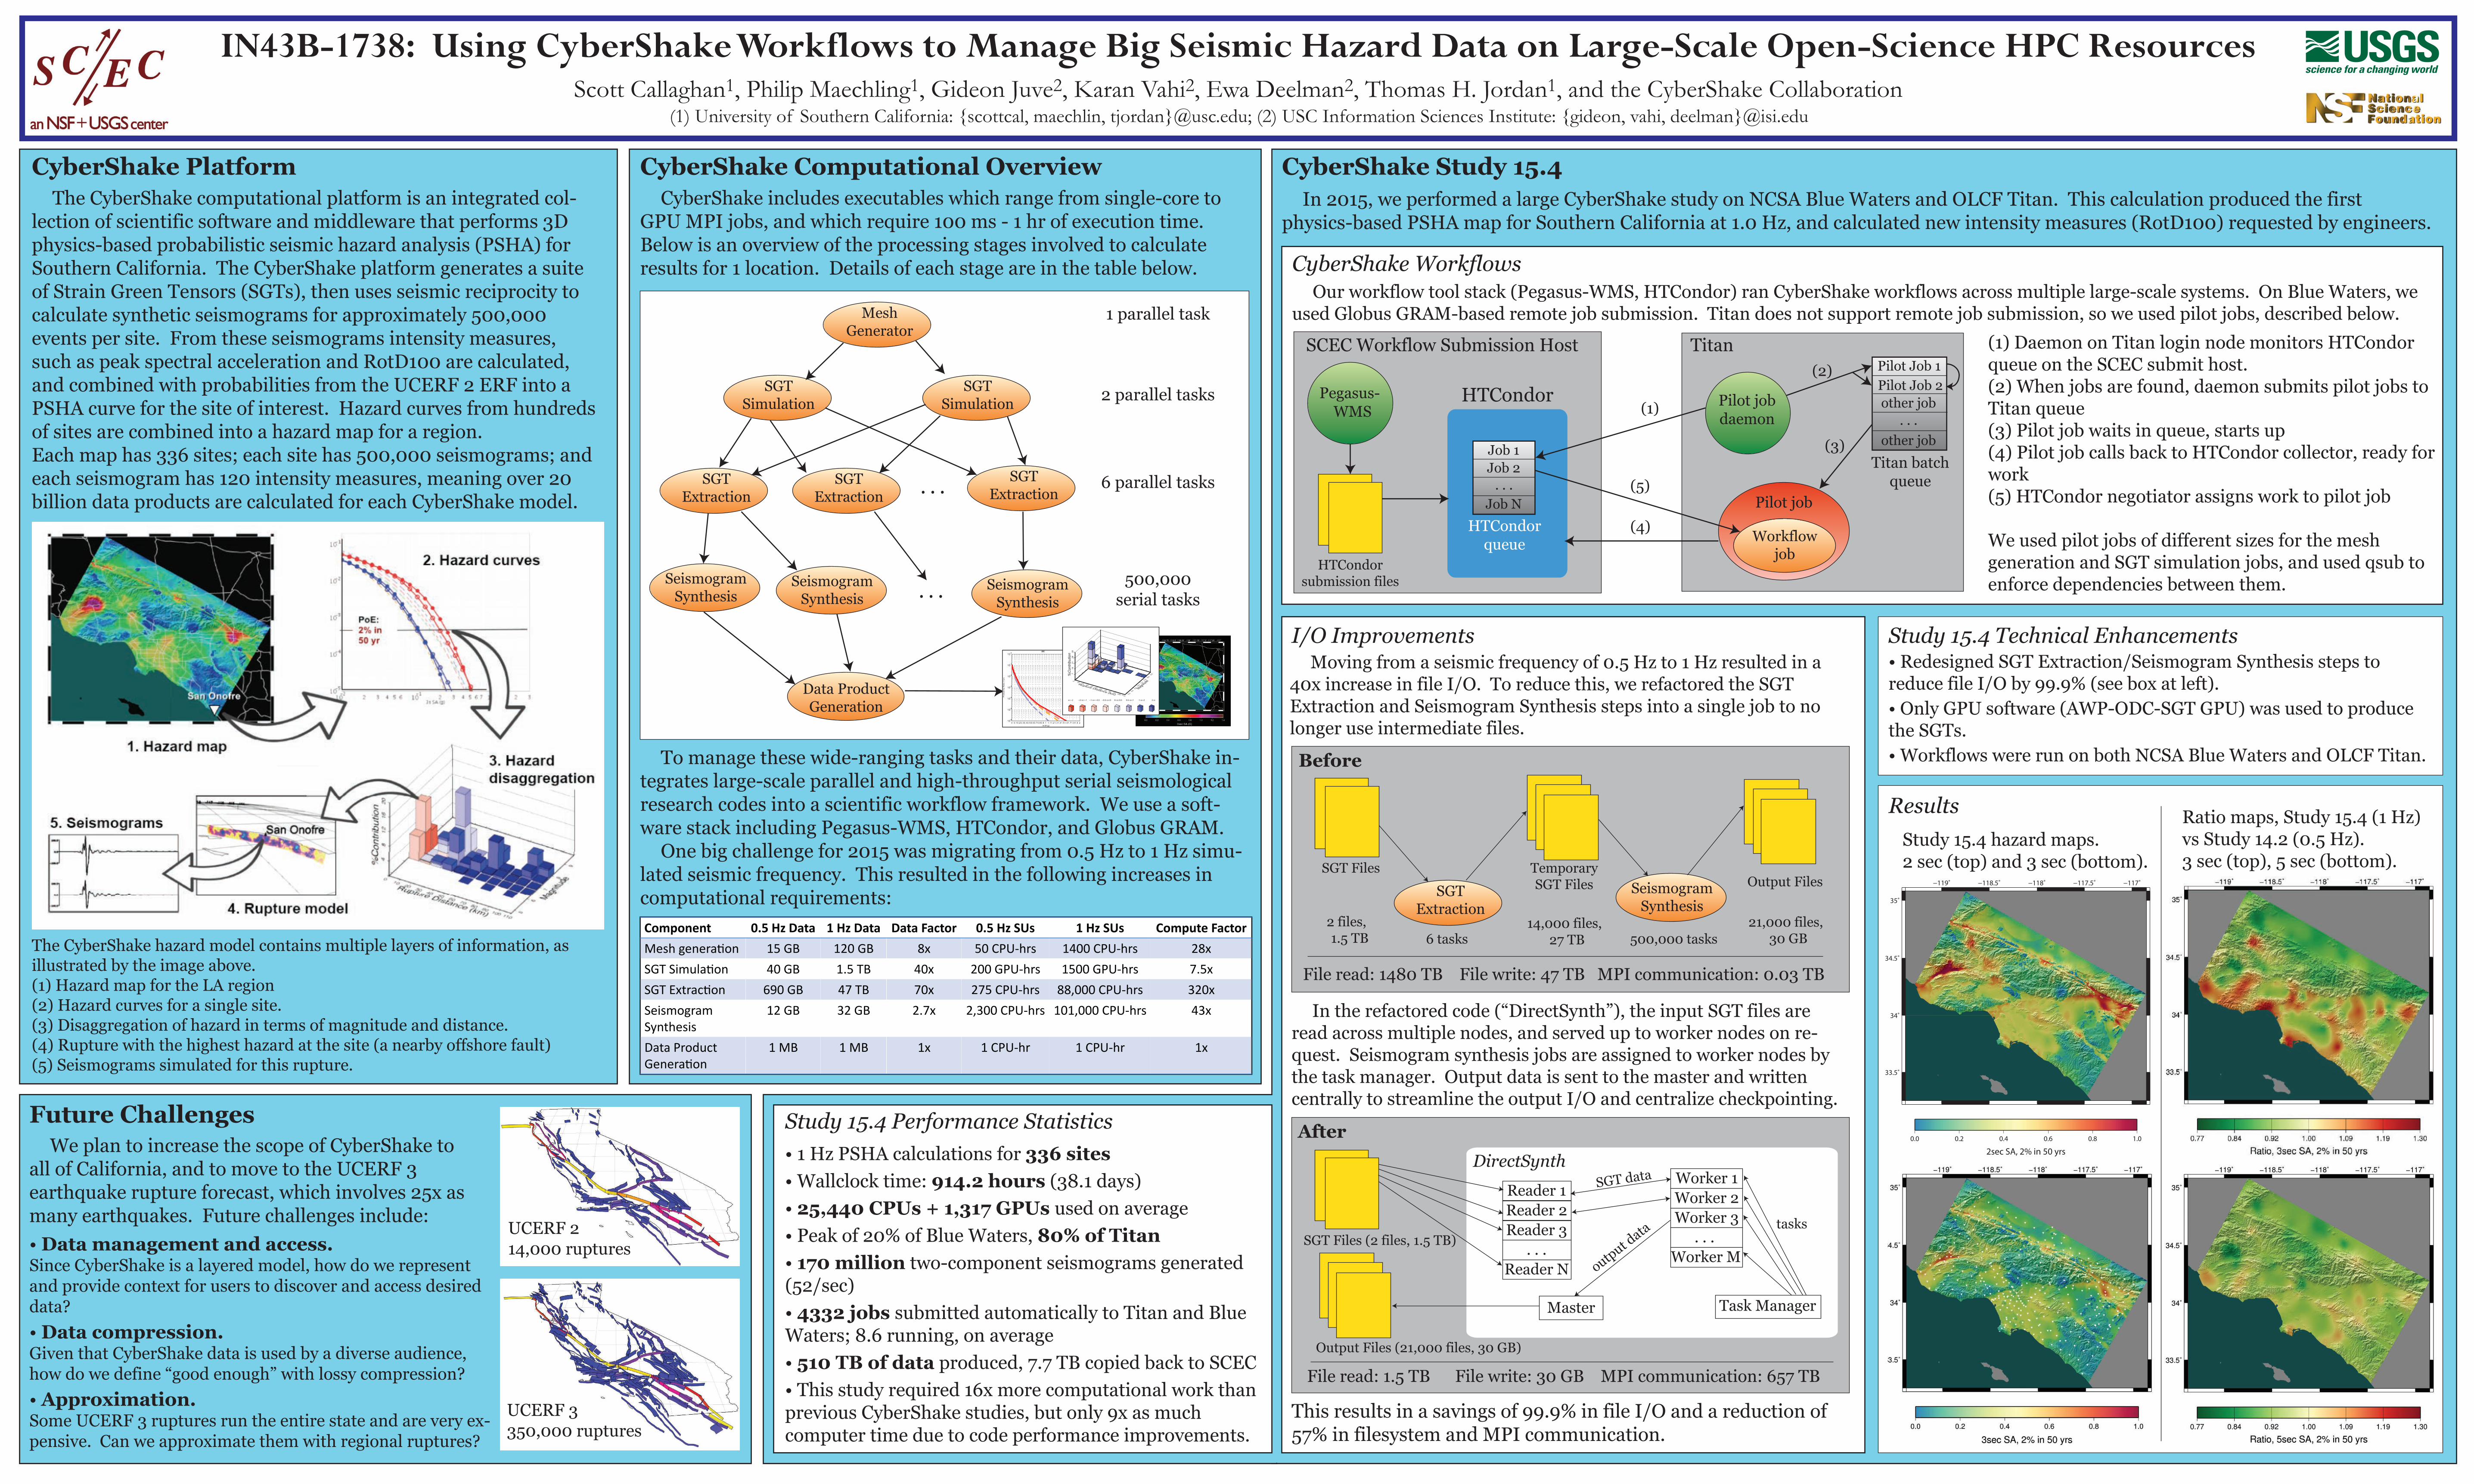
IN43B-1738: Using CyberShake Workflows to Manage Big Seismic Hazard Data on Large-Scale Open-Science HPC Resources Scott Callaghan1, Philip Maechling1, Gideon Juve2, Karan Vahi2, Ewa Deelman2, Thomas H. Jordan1, and the CyberShake Collaboration
(1) University of Southern California: {scottcal, maechlin, tjordan}@usc.edu; (2) USC Information Sciences Institute: {gideon, vahi, deelman}@isi.edu
CyberShake Platform The CyberShake computational platform is an integrated col-lection of scientific software and middleware that performs 3D physics-based probabilistic seismic hazard analysis (PSHA) for Southern California. The CyberShake platform generates a suite of Strain Green Tensors (SGTs), then uses seismic reciprocity to calculate synthetic seismograms for approximately 500,000 events per site. From these seismograms intensity measures, such as peak spectral acceleration and RotD100 are calculated, and combined with probabilities from the UCERF 2 ERF into a PSHA curve for the site of interest. Hazard curves from hundreds of sites are combined into a hazard map for a region.Each map has 336 sites; each site has 500,000 seismograms; and each seismogram has 120 intensity measures, meaning over 20 billion data products are calculated for each CyberShake model.
The CyberShake hazard model contains multiple layers of information, as illustrated by the image above.(1) Hazard map for the LA region(2) Hazard curves for a single site.(3) Disaggregation of hazard in terms of magnitude and distance.(4) Rupture with the highest hazard at the site (a nearby offshore fault)(5) Seismograms simulated for this rupture.
Future Challenges
CyberShake Computational Overview
To manage these wide-ranging tasks and their data, CyberShake in-tegrates large-scale parallel and high-throughput serial seismological research codes into a scientific workflow framework. We use a soft-ware stack including Pegasus-WMS, HTCondor, and Globus GRAM. One big challenge for 2015 was migrating from 0.5 Hz to 1 Hz simu-lated seismic frequency. This resulted in the following increases in computational requirements:
MeshGenerator
SGTExtraction
SGTSimulation
SGTSimulation
SGTExtraction
SGTExtraction
SeismogramSynthesis
SeismogramSynthesis
SeismogramSynthesis
Data ProductGeneration
. . .
. . .
USC
0 0.1 0.2 0.3 0.4 0.5 0.6 0.7 0.8 0.9 1 1.1 1.2 1.3 1.4 1.5 1.6 1.7 1.8 1.9 23s SA (g)
1 0- 6
1 0- 5
1 0- 4
1 0- 3
1 0- 2
1 0- 1
1 0 0
Pro
ba
bili
ty R
ate
(1
/yr)
010 20 30 40 50 60 70 80 90 100 110
Rupture Distance (km) 5.05.5
6.06.5
7.07.5
8.08.5
Magnitude
714
2128
35%
Con
tribu
tion
ε<−2 −2<ε<−1 −1<ε<−0.5 −0.5<ε<0 0<ε<0.5 0.5<ε<1 1<ε<2 2<ε
1 parallel task
2 parallel tasks
6 parallel tasks
500,000serial tasks
CyberShake includes executables which range from single-core to GPU MPI jobs, and which require 100 ms - 1 hr of execution time. Below is an overview of the processing stages involved to calculate results for 1 location. Details of each stage are in the table below.
Component 0.5 Hz Data 1 Hz Data Data Factor 0.5 Hz SUs 1 Hz SUs Compute FactorMesh generation 15 GB 120 GB 8x 50 CPU-hrs 1400 CPU-hrs 28xSGT Simulation 40 GB 1.5 TB 40x 200 GPU-hrs 1500 GPU-hrs 7.5xSGT Extraction 690 GB 47 TB 70x 275 CPU-hrs 88,000 CPU-hrs 320xSeismogram Synthesis
12 GB 32 GB 2.7x 2,300 CPU-hrs 101,000 CPU-hrs 43x
Data Product Generation
1 MB 1 MB 1x 1 CPU-hr 1 CPU-hr 1x
CyberShake Study 15.4 In 2015, we performed a large CyberShake study on NCSA Blue Waters and OLCF Titan. This calculation produced the first physics-based PSHA map for Southern California at 1.0 Hz, and calculated new intensity measures (RotD100) requested by engineers.
Study 15.4 Technical Enhancements• Redesigned SGT Extraction/Seismogram Synthesis steps to reduce file I/O by 99.9% (see box at left).• Only GPU software (AWP-ODC-SGT GPU) was used to produce the SGTs.• Workflows were run on both NCSA Blue Waters and OLCF Titan.
CyberShake Workflows Our workflow tool stack (Pegasus-WMS, HTCondor) ran CyberShake workflows across multiple large-scale systems. On Blue Waters, we used Globus GRAM-based remote job submission. Titan does not support remote job submission, so we used pilot jobs, described below.
Pegasus-WMS
HTCondor
Study 15.4 hazard maps.2 sec (top) and 3 sec (bottom).
0.0 0.2 0.4 0.6 0.8 1.0
2sec SA, 2% in 50 yrs
−119˚ −118.5˚ −118˚ −117.5˚ −117˚
33.5˚
34˚
34.5˚
35˚
SCEC Workflow Submission Host
HTCondor queue
Results
Study 15.4 Performance Statistics• 1 Hz PSHA calculations for 336 sites• Wallclock time: 914.2 hours (38.1 days)• 25,440 CPUs + 1,317 GPUs used on average• Peak of 20% of Blue Waters, 80% of Titan • 170 million two-component seismograms generated (52/sec)• 4332 jobs submitted automatically to Titan and Blue Waters; 8.6 running, on average• 510 TB of data produced, 7.7 TB copied back to SCEC• This study required 16x more computational work than previous CyberShake studies, but only 9x as much computer time due to code performance improvements.
I/O Improvements Moving from a seismic frequency of 0.5 Hz to 1 Hz resulted in a 40x increase in file I/O. To reduce this, we refactored the SGT Extraction and Seismogram Synthesis steps into a single job to no longer use intermediate files.
SGTExtraction
SeismogramSynthesis
Temporary SGT Files
SGT FilesOutput Files
File read: 1480 TB File write: 47 TB MPI communication: 0.03 TB
In the refactored code (“DirectSynth”), the input SGT files are read across multiple nodes, and served up to worker nodes on re-quest. Seismogram synthesis jobs are assigned to worker nodes by the task manager. Output data is sent to the master and written centrally to streamline the output I/O and centralize checkpointing.
Master Task Manager
Reader 1Reader 2Reader 3
. . .Reader N
Worker 1Worker 2Worker 3
. . .Worker M
Output Files (21,000 files, 30 GB)
This results in a savings of 99.9% in file I/O and a reduction of 57% in filesystem and MPI communication.
(1) Daemon on Titan login node monitors HTCondor queue on the SCEC submit host.(2) When jobs are found, daemon submits pilot jobs to Titan queue(3) Pilot job waits in queue, starts up(4) Pilot job calls back to HTCondor collector, ready for work(5) HTCondor negotiator assigns work to pilot job
We used pilot jobs of different sizes for the mesh generation and SGT simulation jobs, and used qsub to enforce dependencies between them.
Titan
HTCondor submission files
Pilot job daemon
Titan batch queue
Pilot job
Workflow job
(1)
(2)
(3)
(4)
(5)
Before
2 files,1.5 TB 6 tasks
14,000 files,27 TB 500,000 tasks
21,000 files,30 GB
File read: 1.5 TB File write: 30 GB MPI communication: 657 TB
After
SGT data
tasks
output data
SGT Files (2 files, 1.5 TB)
DirectSynth We plan to increase the scope of CyberShake to all of California, and to move to the UCERF 3 earthquake rupture forecast, which involves 25x as many earthquakes. Future challenges include:• Data management and access.Since CyberShake is a layered model, how do we represent and provide context for users to discover and access desired data?• Data compression. Given that CyberShake data is used by a diverse audience, how do we define “good enough” with lossy compression?• Approximation.Some UCERF 3 ruptures run the entire state and are very ex-pensive. Can we approximate them with regional ruptures?
UCERF 214,000 ruptures
UCERF 3350,000 ruptures
Job 1Job 2
Job N. . .
Pilot Job 1Pilot Job 2other job
other job. . .
Ratio maps, Study 15.4 (1 Hz) vs Study 14.2 (0.5 Hz).3 sec (top), 5 sec (bottom).