Embed Size (px)
Citation preview

In vivo microscopy
Janos Peti-Peterdi Professor
Department of Physiology and Biophysics, Zilkha Neurogenetic Institute
Keck School of Medicine
University of Southern California
1

Outline Visualization of
renal/glomerular
structure/function
Pathology/podocyt
e injury
• Quantitative
imaging of organ
functions (GFR, RBF,
RAS elements)
•Serial MPM imaging
of the same glom.
over time in vivo
•New mouse models
with fluorescent cell
lineage tags
•Tracking cell fate,
function, migration
•Podocyte shedding
•Leaky GFB, GFR↓
•Cell-to cell
propagation of
injury, calcium
signaling
Tissue remodeling,
regeneration
•The highly dynamic
glomerular
environment
•New concept on
endogenous nephron
repair master
program
•Role of body salt
and fluid
conservation, classic
salt sensing
mechanisms

Imaging approach using in vivo multiphoton microscopy
Dunn et al AJP Cell Physiol. 283: C905-16, 2002.
Kang et al AJP Renal Physiol. 291: F495-502, 2006.
Look inside the intact, living kidney
Observe the function of cells, vascular/tubular structures
photon 1 photon 2
focal plane Low Energy
Ar HeNe MP
IR
680-1300nm
Abdominal Imaging Window

Oscillations in glomerular/tubular function
Time (s) 0 50 100 150 200 250 300 Flu
ore
scen
ce
in
ten
sit
y
Glom
PT
CCD
Frequency: 0.12 Hz (myogenic)
0.023 Hz (TGF)
Period: 6-10 s (myogenic)
20-50 s (TGF)

• The mechanisms of glomerular injury/dysfunction,
albuminuria are incompletely understood due to technical
limitations in studying the GFB in its native environment in
vivo.
• Multiphoton microscopy is able to visualize the intact GFB
with high temporal and spatial resolution in the intact living
kidney.
Glomerular structure and function
Urinary pole
Vascular pole
albumin
podocytes
70kDa dextran
quinacrine
Lucifer yellow

ROI1
ROI2
C
Time (s) 2 4 6 8 10 12 14
LY
in
ten
sit
y X
10
3
1.0
1.5
2.0
2.5
3.0
3.5
4.0
4.5
ROI1
ROI2
Dt
A G
PT
D S
NG
FR
(n
l/m
in)
ROI2 distance (µm)
B
G
0
20
40
60
0 100 200 300 400 500
Quantitative imaging of kidney functions - SNGFR
Kang et al AJP Renal Physiol 291: F495-502, 2006
70kDa dextran
quinacrine
Lucifer yellow

SNGFR
Control STZ-
diabetes STZ+ARB
SN
GF
R (
nL
/min
)
0
10
20
30
40
50
60
70
80
*
ns
Control
STZ-diabetes
Renal blood flow - RBC velocity
70kDa dextran
quinacrine

B
Tim
e (
s)
0
2.0
0 20 X(µm)
Dx Dt
C D A
PT DT
DT
Renal blood flow - RBC velocity
Kang et al AJP Renal Physiol 291: F495-502, 2006

Multiphoton imaging allows high sensitivity measurement of glomerular permeability
©2012 by American Society of Nephrology
Nakano D et al. JASN 2012;23:1847-1856
500 kDa dextran inulin

Glomerular albumin permeability
Progressive glomerular pathology
in a mouse model of FSGS (NEP25 mice) Day 1 Day 3
Day 4 Day 5
Podocyte-GFP
Alexa594-albumin

Prorenin receptor

A
AA
G
B
CCD G
The two sites of (patho)physiological renin expression
in the renal cortex
Classic vascular site - JGA CNT - CCD
Renin
Alexa594-albumin

JGA
AA
AA
CCD
CCD
Renin content in
both the JGA and
CCD increased in
untreated
diabetes. However,
olmesartan
treatment
increased JGA
renin, but
decreased CCD
renin.
Renin content in the diabetic kidney
Un-
treated
ARB
JGA CCD renin
Kang JJ et al, Hypertension 51: 1597-604, 2008
Renin
Alexa594-albumin
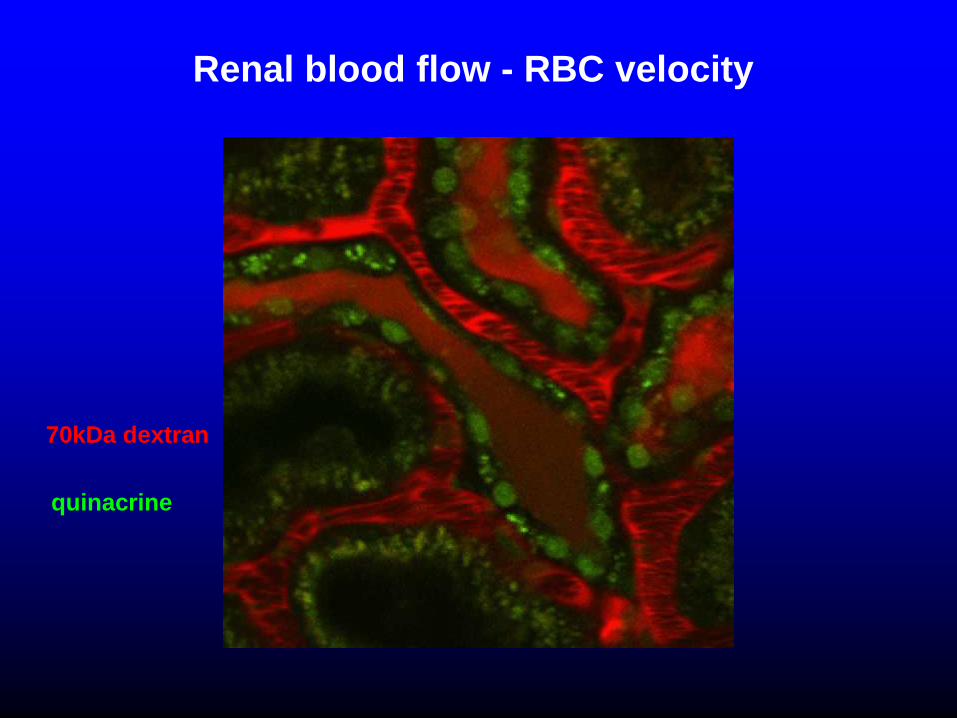
Lasagni L and Romagnani P. J Am Soc Nephrol 2010.
Tracking the fate of podocytes in vivo using serial
multiphoton imaging in mice
with fluorescent lineage tags

t=0 h t=24 h t=48 h
Cell tracking by serial MP imaging of same glomerulus
every 24 hours
Hackl et al. Nat. Med. 2013

MPM imaging in vivo reveals signs of podocyte migration
in the intact kidney after UUO
Glo
meru
li w
ith
pa
rieta
l G
FP
(%
)
Days after UUO Ctrl UUO
0
20
40
60
80
100
Glo
meru
li w
ith
pa
rieta
l G
FP
(%
)
0
20
40
60
80
100
*
a b c
d e f
g h i 0 20 40 60 80 100 120 140 160
Hackl et al. Nat. Med. 2013

GFP+ cells in the parietal layer after UUO
Hackl et al. Nat. Med. 2013

Identification and tracking of single podocytes in the new
multi-color Pod-Confetti mouse model using in vivo MPM
imaging
Cell 2010

Pod-Confetti after UUO
Hackl et al. Nat. Med. 2013
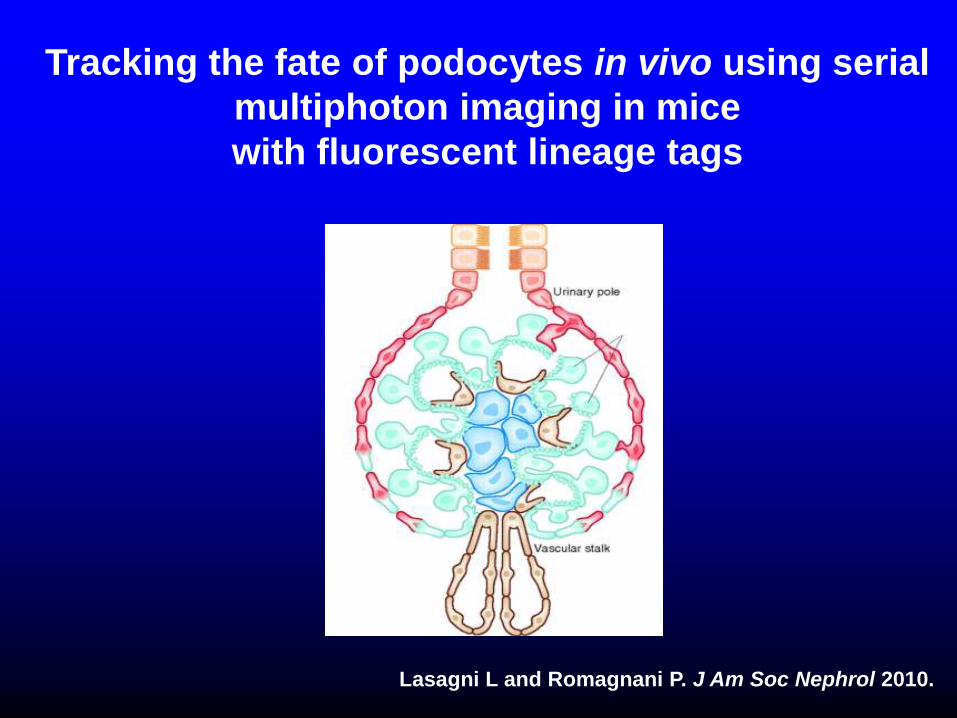
Zariwala et al, J. Neuroscience (2012)
Podocin GCaMP3
New mouse models with cell-specific expression
of the genetically encoded calcium indicator GCaMP3
Mice expressing GCaMP3
in:
• Podocytes
X
Burford JL et al, J Clin Invest, 2014

Podocyte calcium waves visualized in vivo in the new Pod-
GCaMP3 mouse model using MPM imaging
0s 20s 40s
0
1
2
3
Ctrl ANGII injury
ΔF
/F0
*
*
Burford JL et al, J Clin Invest, 2014

Podocyte calcium waves visualized in vivo in the new Pod-
GCaMP3 mouse model using MPM imaging
Burford JL et al, J Clin Invest, 2014

Podocyte calcium waves visualized in vivo in the new Pod-
GCaMP3 mouse model using MPM imaging
Burford JL et al, J Clin Invest, 2014
0
200
400
600
Ctrl Suramin
0
400
800
1200
Ctrl/WT Suramin P2Y2-/-
0
4
8
12
Ctrl/WT Suramin P2Y2-/-
*
* * * *
F b
as
eli
ne
(U
)
ΔF
(U
)
Velo
cit
y (
µm
/s)
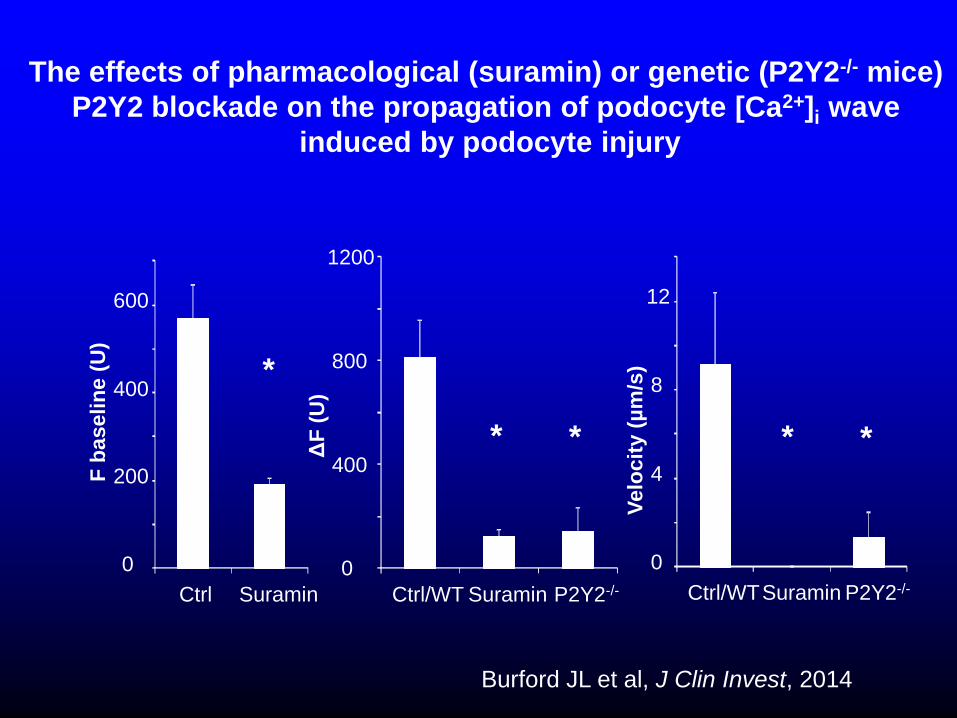
The effects of pharmacological (suramin) or genetic (P2Y2-/- mice)
P2Y2 blockade on the propagation of podocyte [Ca2+]i wave
induced by podocyte injury
Burford JL et al, J Clin Invest, 2014

Tracking TRPC6-mediated podocyte [Ca2+]i and glomerulopathy
development in
vivo
in the
same glomerulus
GC
aM
P3 F
(×
10
3)
Pod-GCaMP3
/WT
Pod-GCaMP3
/TRPC6KO
Pod-
GCaMP3
/TRPC6TG
0
10
20
30
‡
‡
* †
40 Baseline ANG II
B
*
Baselin
e
14
days a
fter
AN
G I
I in
fusio
n
Pod-GCaMP3
/TRPC6-TG Pod-GCaMP3
/TRPC6-KO
Pod-GCaMP3
/WT A

Intravital imaging of podocyte cell functions
Highly sensitive foot process and podocyte [Ca2+]i imaging
in iPod-Confetti and Pod-GCaMP5/Tomato mice
Fixed tissue SEM In vivo MPM in mouse

Intravital imaging of podocyte
cell functions
Highly sensitive podocyte
[Ca2+]i imaging
in Pod-GCaMP5/Tomato mice
x y
z
Tomato
Ca2+
Ca2+
Albumin

Experimental approach to study renal stem cells:
(1) Transgenic mouse models, genetic cell fate mapping
mesenchymal progenitor cell lineages
NG2-CreERT2-Tomato; Ren1d-Confetti; Foxd1-CreERT2-Confetti
(2) Serial intravital imaging of same glomerulus over days,
tracking cell fate Urinary pole
Vascular pole
A
C
B
• Migration pattern
• Dynamics
• Function
• Heterogeneity

Progenitor cells
G
G
Visual clue: Progenitor cells home to the glomerular entrance
NG2-CreERT2-Tomato mice Low salt diet + ACEi
500 kDa dextran-Alexa 488
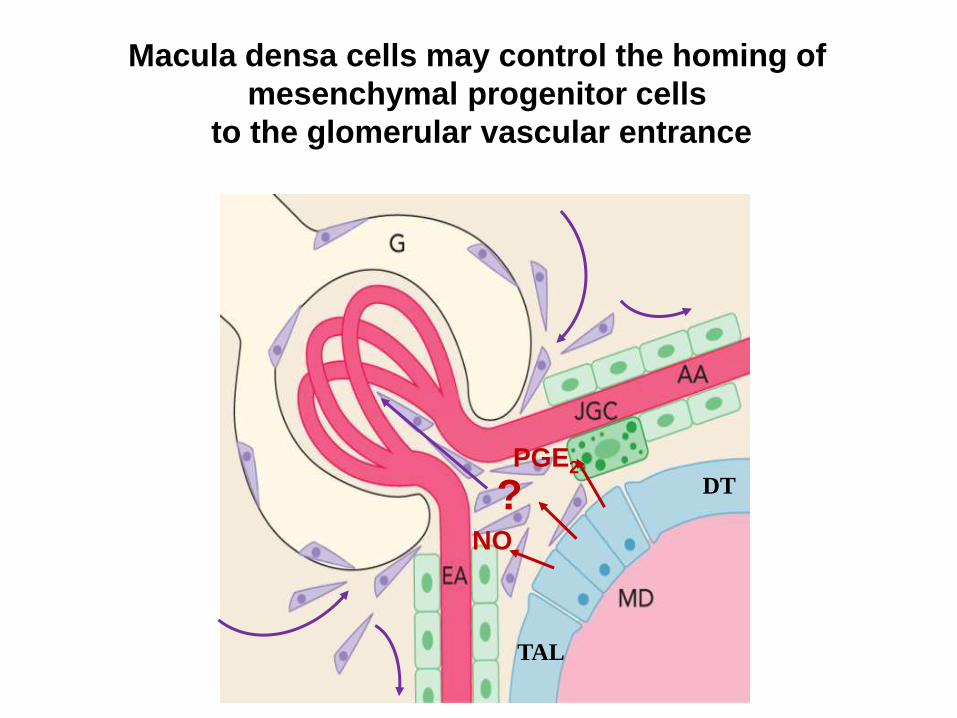
Macula densa cells may control the homing of
mesenchymal progenitor cells
to the glomerular vascular entrance
TAL
DT ? NO
PGE2

Macula Densa (MD) cells: chief medical doctor of nephron?
• Strategic anatomical localization at the glomerular entrance
• Upside-down cells, organelle-rich basal region facing the glomerulus
• Very thin, fragmented basement membrane
MD
Brenner and Rector’s The Kidney

The nephron: evolutionary and developmental links
Romagnani, P. et al. (2013) Renal progenitors: an evolutionary conserved strategy for kidney regeneration Nat. Rev. Nephrol. doi:10.1038/nrneph.2012.290
• Migration from sea to land
• Successful adaptive
mechanisms in nephron
structure and function to
conserve body salt and fluids
• Strategic localization of
macula densa cells during
nephron development
• Elongation of loop of Henle
after birth

• Hypothesis: Master program exists for nephron repair
• We need to learn from evolution, physiology, adaptation
to environment
• Loss of body fluid and salt, the most robust and
organ-specific stimulus
• Apply and augment strategy in disease
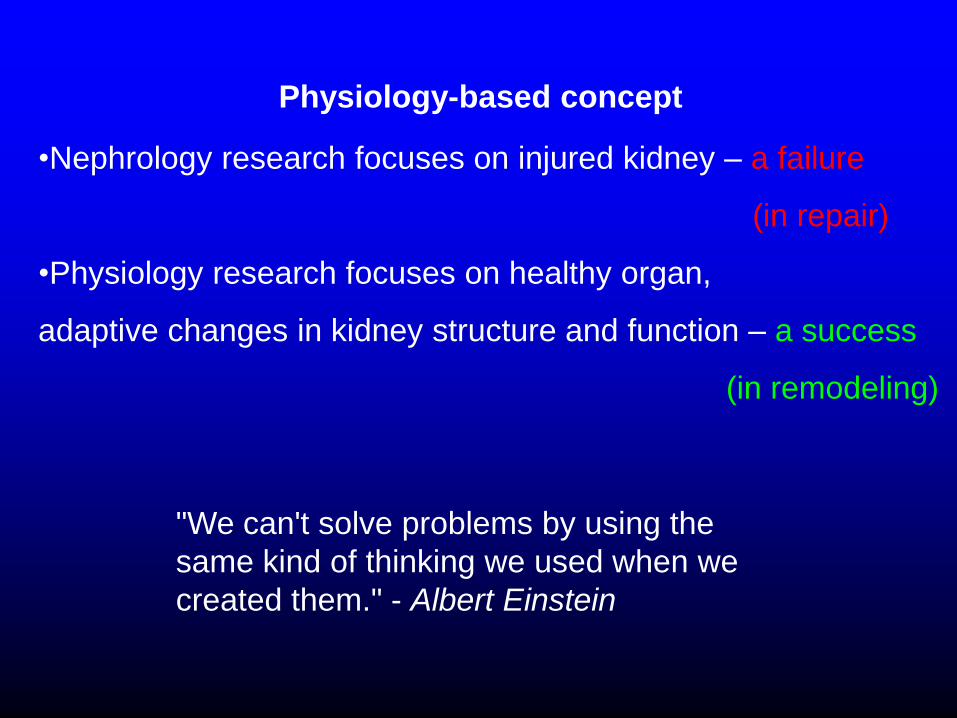
"We can't solve problems by using the
same kind of thinking we used when we
created them." - Albert Einstein
•Nephrology research focuses on injured kidney – a failure
(in repair)
•Physiology research focuses on healthy organ,
adaptive changes in kidney structure and function – a success
(in remodeling)
Physiology-based concept

The condition associated with the
loss of body fluid and salt may be the
most appropriate and effective stimulus
for nephron-level kidney repair

Baseline Day 3 Day 5
Day 7 Day 10 Day 13
Tracking the same glomerular area over two weeks LS+ACEI:
NG2-Tomato cells home to the glomerular vascular pole
Progenitor cells 500 kDa dextran-Alexa 488
G

Serial multiphoton imaging of cells of the NG2 lineage
in NG2-CreERT2-Tomato mice
Progenitor cells

Serial multiphoton imaging of cells of the NG2 lineage
in NG2-CreERT2-Tomato mice
Progenitor cells

Robust increase in renal cortical NG2+ cell density
in response to 5 days low salt+ACEI diet
Ctrl Low salt+ACEI
G G
G
G
PTs 0
10
20
30
40
50
60
70
80
Ctrl LS+ACEI
# N
G2+
cell
s p
er
fie
ld
* C
Similar results after 10 days
furosemide treatment G

NG2-Confetti
AA2
G1
G2
AA1
H NG2-Confetti
AA2
G1
G2 AA1
G3 AA3
I
AA
ɑ-SMA NG2-Tomato A renin NG2-Tomato
20%
Ng2+ 80%
Ng2-
DAPI B renin NG2-Tomato
77%
Ng2+
23%
Ng2-
DAPI C
G
AA G
AA
G
D E F G PDGFRβ
NG2-Tomato
G
Claudin-1 NG2-Tomato
G
Podocin NG2-Tomato
G
Villin NG2-Tomato
PTs
Tracking the fate of mesenchymal progenitor (NG2+) cells

Low salt+ACEi treated mice, selective COX-2 inhibition with SC58236
COX-2 and nNOS inhibition (MD cell markers) block
NG2+ cell homing to the glomerular vascular pole
Control LS+ACEi
NG2 cell
DAPI
LS+ACEi+COX
2i LS+ACEi
+7-NI
*
# #
*p<0.05 vs. control #p<0.05 vs. LS+ACEi

Low salt+ACEi treated mice, selective nNOS inhibition (7-NI)
0
2
4
6
8
10
12
14
16
18
LS+
ACEi
LS+ACEi+
7-NI
Ctrl Ctrl+
7-NI N
um
ber
of
Ki6
7+
cell
s p
er
JG
A a
rea
*
§
Ki67
DAPI
Control
Ctrl+7-NI
LS+ACEi
LS+ACEi
+7-NI
nNOS inhibition (MD cell marker) blocks
NG2+ cell proliferation at the glomerular vascular pole
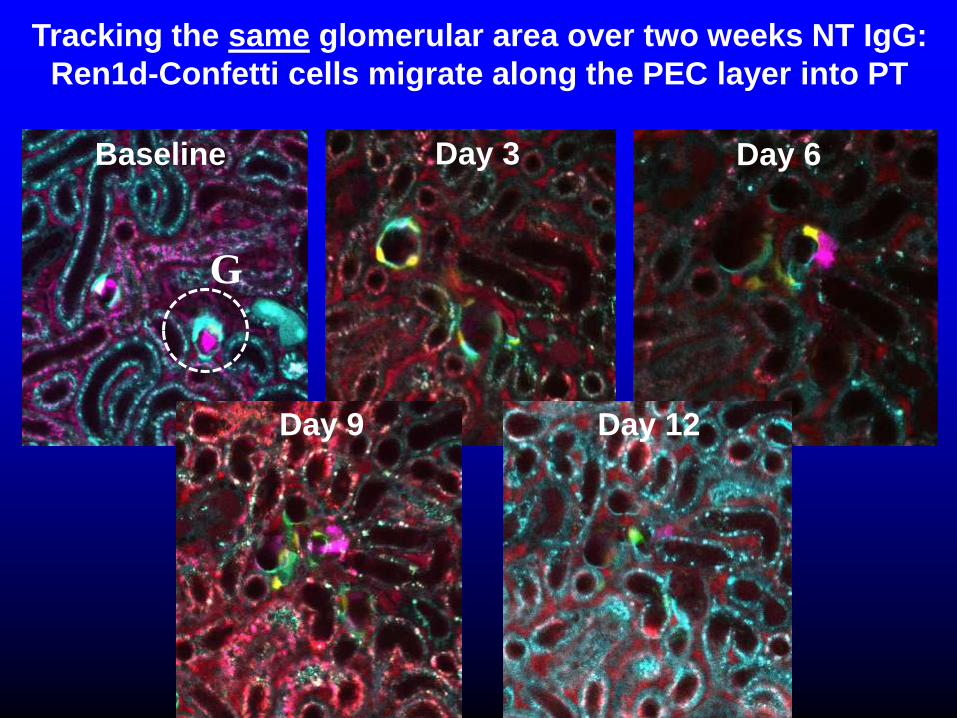
Baseline Day 3 Day 6
Day 9 Day 12
Tracking the same glomerular area over two weeks NT IgG:
Ren1d-Confetti cells migrate along the PEC layer into PT
G

G
MD→
MD cell isolation and bioinformatics workflow
GFP mouse model
nNOS/CreERT2-mTmG/fl
Digestion and harvest Isolation
Transcriptome and bioinformatics Confirmation

Macula densa-specific expression of novel angiogenic
secreted proteins in the human kidney
MD→
←MD
Pappa-2 CCN1/Cyr61
Pregnancy-associated plasma protein A2
• Cleaves IGFBP-5
• Local regulator of IGF bioavailability
• Tissue hypertrophy
Cyr61 (Cystein-rich protein 61)
• αVβ5 Integrin binding
• NF-kB signaling
• Angiogenesis

CYR61 Expression in Ju CKD 2 Discovery Cohort: Minimal Change Disease vs. Healthy Living Donor
Under-expression Gene Rank: 39 (in top 1%) P-value: 5.55E-7
Reporter: 3491 t-Test: -5.818
Fold Change: -2.145
Legend
0. No value (42) 1. Healthy Living Donor (31) 2. Arterial Hypertension (20) 3. Diabetic Nephropathy (17) 4. Focal Segmental Glomerulosclerosis (17) 5. IgA Nephropathy (25) 6. Lupus Nephritis (32) 7. Membranous Glomerulonephropathy (18) 8. Minimal Change Disease (14) 9. Thin Basement Membrane Disease (6) 10. Vasculitis (21)
Ju CKD 2
Sci Transl Med 2015/12/01 243 samples
mRNA 17,379 measured genes
Affymetrix Human Genome U133 Plus 2.0 Array (altCDF v10)
© 2015 The Regents of The University of Michigan. Images from Nephroseq may be used in publications with proper citation. The citation is as follows: Nephroseq (The
Regents of The University of Michigan, Ann Arbor, MI) was used for analysis and visualization. For further information, refer to the terms of use. Nephroseq Source: https://www.nephroseq.org/resource/main.html#a:1N10406;cv:detail;d:1N156636767;dso:geneUnderex;dt:predefinedClass;ec:[1N2];epv:1N1.1N3;et:under;f:195810567;g:3491;gt:boxplot;p:1N200014695;pg:1;pvf:9809,1N9,1N800098054;scr:datasets;ss:all;th:g100.0,p0.050,fc0.0;v:17

Macula densa cells may function as inducers and master
regulators of mesenchymal progenitor cell-mediated
vascular, glomerular, and tubular remodeling
TAL
DT
NO
PGE2
Pappa2
CCN1

Dysfunctional macula densa cells as
the root cause of glomerular disease?
Future goal
• Fine-tuning of the MD-targeting regenerative approach
• Identification and activation of the critical molecular players

THANK YOU
Peti-Peterdi lab
Anne Riquier-Brison
Kengo Kidokoro
Toshiki Doi
Ju-Young Moon
Georgina Gyarmati
Jasmine Castillejos
Donna Ralph
Urvi Shroff
Jim Burford
Haykanush Gevorgyan
Lisa Lam
Karie Villanueva
Sarah Vargas
Ildiko Toma
Arnold Sipos
McMahon lab
Sanjeev Kumar
Jing Liu
Institute of Urology
Inderbir Gill
Andre Abreu
Nariman Ahmadi
AHA ADA
UKRO Amgen
U Regensburg, Germany
Ina Schieβl
Hayo Castrop
U Southern Denmark, DK
Per Svenningsen
Waitemata DHB/U Bristol
Andy Salmon
U Washington
Stuart Shankland
Jeff Pippin
Kagawa U, JPN
Daisuke Nakano
Akira Nishiyama
U Cologne, Germany
Thomas Benzing
Bernhard Schermer
Matthias Hackl
Agnes Prokai
Mario Negri, Bergamo, IT
Paola Rizzo
Ariela Benigni
Giuseppe Remuzzi
DK64324, DK10944
S10RR024754
SE/UAB/USC
Laszlo Rosivall
Darwin Bell
Alicia McDonough


![Cellular Force Microscopy for in Vivo Measurements of - Plant physiology · Breakthrough Technologies Cellular Force Microscopy for in Vivo Measurements of Plant Tissue Mechanics1[W][OA]](https://img.pdfslide.us/doc/110x75/5f03c7b37e708231d40abbb3/cellular-force-microscopy-for-in-vivo-measurements-of-plant-breakthrough-technologies.jpg)