Embed Size (px)
Citation preview
Breakthrough Technologies
Cellular Force Microscopy for in Vivo Measurements ofPlant Tissue Mechanics1[W][OA]
Anne-Lise Routier-Kierzkowska, Alain Weber, Petra Kochova, Dimitris Felekis, Bradley J. Nelson,Cris Kuhlemeier, and Richard S. Smith*
Institute of Plant Sciences, University of Bern, CH–3013 Bern, Switzerland (A.-L.R.-K., A.W., P.K., C.K., R.S.S.);Department of Mechanics, Faculty of Applied Sciences, University of West Bohemia, 306 14 Pilsen, Czech Republic(P.K.); and Institute of Robotics and Intelligent Systems, Eidgenossische Technische Hochschule Zurich,CH–8092 Zurich, Switzerland (D.F., B.J.N.)
Although growth and morphogenesis are controlled by genetics, physical shape change in plant tissue results from a balancebetween cell wall loosening and intracellular pressure. Despite recent work demonstrating a role for mechanical signals inmorphogenesis, precise measurement of mechanical properties at the individual cell level remains a technical challenge. To addressthis challenge, we have developed cellular force microscopy (CFM), which combines the versatility of classical microindentationtechniques with the high automation and resolution approaching that of atomic force microscopy. CFM’s large range of forcesprovides the possibility to map the apparent stiffness of both plasmolyzed and turgid tissue as well as to performmicropuncture ofcells using very high stresses. CFM experiments reveal that, within a tissue, local stiffness measurements can vary with the level ofturgor pressure in an unexpected way. Altogether, our results highlight the importance of detailed physically based simulations forthe interpretation of microindentation results. CFM’s ability to be used both to assess and manipulate tissue mechanics makes it amethod of choice to unravel the feedbacks between mechanics, genetics, and morphogenesis.
A major question in plant biology is how organs areable to develop complex three-dimensional (3D) shapeswhile maintaining mechanical integrity (Cosgrove,2005; Thompson, 2005; Schopfer, 2006). Plant cells aresurrounded by stiff cell walls that contain the consider-able turgor pressure within (Schopfer, 2006). Althoughmorphogenesis occurs at the tissue level (Coen et al.,2004), wall mechanical properties are controlled at thecellular level through the deposition and chemicalmodification of cell wall material (Kohler and Spatz,2002; Baskin, 2005; Cosgrove, 2005; Burgert, 2006;Schopfer, 2006). Hence, the mechanical properties ofthe cell walls have to be studied in planta, at the cellularand subcellular scales (Geitmann, 2006; Mirabet et al.,2011).
The stiffness of a material is determined by the forcethat is required for a certain deformation. In singlecells, stiffness can be investigated in situ using micro-and nano-indentation methods (Geitmann, 2006). Athin probe indents the cell surface, while both theapplied load and the probe displacement are moni-
tored. Stiffness values are extracted by computing theslope of the force-displacement curve at maximalindentation depth. The stiffness obtained reflects notonly cell wall elastic properties but also turgor pres-sure (Smith et al., 1998; Wang et al., 2004), cell andindenter geometry (Bolduc et al., 2006), and mechan-ical stresses prior to indentation (Zamir and Taber,2004). For that reason, we will refer to it as “apparentstiffness” (Zamir and Taber, 2004). The influence ofeach factor on the apparent stiffness depends on theprobe tip shape, its size, and how deep it is indentedinto the cell surface or how large the applied load is.For instance, it has been reported that the forcesmeasured by using very large, spherical probes at arelatively small indentation depth are mainly due tothe cell internal pressure (Lintilhac et al., 2000; Weiet al., 2001), because stretching of the cell wall isnegligible. In pollen tubes, the apparent stiffness hasbeen measured using microindentation methods withsmall, flat-tipped probes that were applying forces inthe low micronewton range (Geitmann and Parre,2004; Parre and Geitmann, 2005; Zerzour et al., 2009).Recently, nano-indentation with atomic force micros-copy (AFM) has been used to study cells in theArabidopsis (Arabidopsis thaliana) inflorescence apex(Milani et al., 2011; Peaucelle et al., 2011). Peaucelleand coworkers (2011) were able to detect differences inthe cell apparent stiffness in relation to the degree ofmethylesterification of homogalacturonan, a pecticpolymer. The measurements, however, were per-formed only on plasmolized tissues. In the study ofMilani et al. (2011), very local differences in wallmechanical properties were detected by shallow in-dentation with a sharp, pyramidal indenter, using
1 This work was supported by SystemsX.ch, the Swiss Initiative inSystems Biology, and the Scientific Exchange Programme betweenthe NewMember States of the EU and Switzerland (Sciex NMS-CH;grant no. 09.039 to P.K.).
* Corresponding author; e-mail [email protected] author responsible for distribution of materials integral to the
findings presented in this article in accordance with the policydescribed in the Instructions for Authors (www.plantphysiol.org) is:Richard S. Smith ([email protected]).
[W] The online version of this article contains Web-only data.[OA] Open Access articles can be viewed online without a sub-
scription.www.plantphysiol.org/cgi/doi/10.1104/pp.111.191460
1514 Plant Physiology�, April 2012, Vol. 158, pp. 1514–1522, www.plantphysiol.org � 2012 American Society of Plant Biologists. All Rights Reserved.
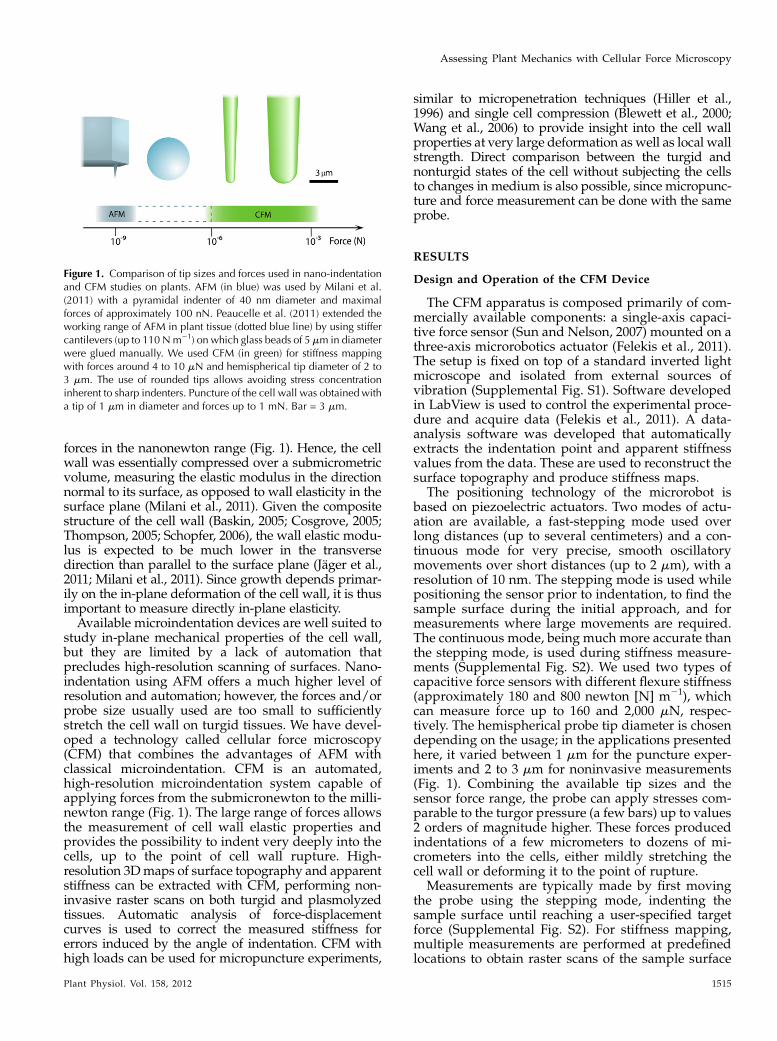
forces in the nanonewton range (Fig. 1). Hence, the cellwall was essentially compressed over a submicrometricvolume, measuring the elastic modulus in the directionnormal to its surface, as opposed to wall elasticity in thesurface plane (Milani et al., 2011). Given the compositestructure of the cell wall (Baskin, 2005; Cosgrove, 2005;Thompson, 2005; Schopfer, 2006), the wall elastic modu-lus is expected to be much lower in the transversedirection than parallel to the surface plane (Jager et al.,2011; Milani et al., 2011). Since growth depends primar-ily on the in-plane deformation of the cell wall, it is thusimportant to measure directly in-plane elasticity.Available microindentation devices are well suited to
study in-plane mechanical properties of the cell wall,but they are limited by a lack of automation thatprecludes high-resolution scanning of surfaces. Nano-indentation using AFM offers a much higher level ofresolution and automation; however, the forces and/orprobe size usually used are too small to sufficientlystretch the cell wall on turgid tissues. We have devel-oped a technology called cellular force microscopy(CFM) that combines the advantages of AFM withclassical microindentation. CFM is an automated,high-resolution microindentation system capable ofapplying forces from the submicronewton to the milli-newton range (Fig. 1). The large range of forces allowsthe measurement of cell wall elastic properties andprovides the possibility to indent very deeply into thecells, up to the point of cell wall rupture. High-resolution 3Dmaps of surface topography and apparentstiffness can be extracted with CFM, performing non-invasive raster scans on both turgid and plasmolyzedtissues. Automatic analysis of force-displacementcurves is used to correct the measured stiffness forerrors induced by the angle of indentation. CFM withhigh loads can be used for micropuncture experiments,
similar to micropenetration techniques (Hiller et al.,1996) and single cell compression (Blewett et al., 2000;Wang et al., 2006) to provide insight into the cell wallproperties at very large deformation as well as local wallstrength. Direct comparison between the turgid andnonturgid states of the cell without subjecting the cellsto changes in medium is also possible, since micropunc-ture and force measurement can be done with the sameprobe.
RESULTS
Design and Operation of the CFM Device
The CFM apparatus is composed primarily of com-mercially available components: a single-axis capaci-tive force sensor (Sun and Nelson, 2007) mounted on athree-axis microrobotics actuator (Felekis et al., 2011).The setup is fixed on top of a standard inverted lightmicroscope and isolated from external sources ofvibration (Supplemental Fig. S1). Software developedin LabView is used to control the experimental proce-dure and acquire data (Felekis et al., 2011). A data-analysis software was developed that automaticallyextracts the indentation point and apparent stiffnessvalues from the data. These are used to reconstruct thesurface topography and produce stiffness maps.
The positioning technology of the microrobot isbased on piezoelectric actuators. Two modes of actu-ation are available, a fast-stepping mode used overlong distances (up to several centimeters) and a con-tinuous mode for very precise, smooth oscillatorymovements over short distances (up to 2 mm), with aresolution of 10 nm. The stepping mode is used whilepositioning the sensor prior to indentation, to find thesample surface during the initial approach, and formeasurements where large movements are required.The continuous mode, being much more accurate thanthe stepping mode, is used during stiffness measure-ments (Supplemental Fig. S2). We used two types ofcapacitive force sensors with different flexure stiffness(approximately 180 and 800 newton [N] m21), whichcan measure force up to 160 and 2,000 mN, respec-tively. The hemispherical probe tip diameter is chosendepending on the usage; in the applications presentedhere, it varied between 1 mm for the puncture exper-iments and 2 to 3 mm for noninvasive measurements(Fig. 1). Combining the available tip sizes and thesensor force range, the probe can apply stresses com-parable to the turgor pressure (a few bars) up to values2 orders of magnitude higher. These forces producedindentations of a few micrometers to dozens of mi-crometers into the cells, either mildly stretching thecell wall or deforming it to the point of rupture.
Measurements are typically made by first movingthe probe using the stepping mode, indenting thesample surface until reaching a user-specified targetforce (Supplemental Fig. S2). For stiffness mapping,multiple measurements are performed at predefinedlocations to obtain raster scans of the sample surface
Figure 1. Comparison of tip sizes and forces used in nano-indentationand CFM studies on plants. AFM (in blue) was used by Milani et al.(2011) with a pyramidal indenter of 40 nm diameter and maximalforces of approximately 100 nN. Peaucelle et al. (2011) extended theworking range of AFM in plant tissue (dotted blue line) by using stiffercantilevers (up to 110 Nm21) on which glass beads of 5 mm in diameterwere glued manually. We used CFM (in green) for stiffness mappingwith forces around 4 to 10 mN and hemispherical tip diameter of 2 to3 mm. The use of rounded tips allows avoiding stress concentrationinherent to sharp indenters. Puncture of the cell wall was obtained witha tip of 1 mm in diameter and forces up to 1 mN. Bar = 3 mm.
Assessing Plant Mechanics with Cellular Force Microscopy
Plant Physiol. Vol. 158, 2012 1515
on large areas (covering up to 150 mm in this study).The target force is chosen so that the indentation depthis at least equal to the indenter radius. Starting fromthis indentation depth, the continuous mode is used toproduce a series of smooth oscillations, indenting andretracting the tip over several hundred nanometers.Stiffness values are extracted from force-displacementdata acquired during the continuous mode. Measure-ments performed far beyond the contact point presentthe advantage of being less prone to artifacts related totip-sample contact (Cappella and Dietler, 1999), such asadhesion or an irregular surface due, for example, to thegeometry of individual cells within a tissue (Peaucelleet al., 2011).
While the sample is indented by the sensor, itssprings deflect by an amount depending both on themeasured force and the sensor stiffness. The data-analysis software enables the correction of raw posi-tion signal for sensor deflection, given the sensorstiffness value obtained by calibration (see “Materialsand Methods”). While detecting the contact point, theforce signal is corrected for undesired offset (e.g.caused by liquid surface tension in wet conditions).After both force and position signals are corrected, theapparent stiffness is extracted from the multiple oscil-lations (usually two to three) and averaged separatelyfor loading and unloading phases. Multiple oscilla-tions are used to evaluate data reliability: for purelyelastic behavior, valid measurements should showforce-indentation curves that do not drift in time andare similar in loading and unloading phases (Supple-mental Fig. S2). The contact points extracted from dataobtained with raster scans are used to reconstruct thesample surface in 3D. An analytical model was used todetermine the effect of the angle of indentation onmeasured stiffness (Fig. 2), assuming frictionless con-tact (Supplemental Materials Methods S1). This ana-lytical model was confirmed by finite element method(FEM) simulation (Supplemental Fig. S4) and used tocorrect stiffness values for surface slope (Fig. 2).
For puncture experiments, the sensor probe indentsthe cell surface until reaching a force of several hun-dred micronewtons. In this case, data are acquired inthe stepping mode, as opposed to the continuousmode, since displacement over dozens of micrometersis required to break the cell wall. As in the case forother measurements, the force and displacement sig-nals are corrected before further analysis.
CFM Measurements on Living Tissue and Single Cells
Onion (Allium cepa) epidermal peels were used as amodel of a monolayered, homogeneous tissue. Twotypes of experiments were conducted on epidermalcells with CFM: stiffness mapping with noninvasive,small indentation scans covering several cells, and cellwall puncture using very high forces. The mechanicaleffects of turgor pressure were investigated by map-ping cell apparent stiffness in various states of plas-molysis as well as by comparing stiffness before andafter releasing turgor pressure by puncture. Stiffnessmeasurements on BY2 tobacco (Nicotiana tabacum)culture cells in normal medium demonstrated thatCFM is also suitable for single plant cells. FEM wasused to simulate indentation experiments on realisticcell and tissue models. Such simulations are essentialto interpret often nonintuitive experimental results,giving new insight into cell and tissue mechanics.
For stiffness mapping of onion epidermis, the max-imal force parameter was chosen in such a way thatthe indentation depth (1–2 mm) on turgid cells wassmall, compared with the cell diameter (approxi-mately 40 mm). FEM-based simulations showed thatthis indentation depth and tip diameter (2–3 mm) weresmall enough not to induce a significant increase inturgor pressure during the measurements (Supple-mental Results S1). Small forces (4–10 mN) were usedin order to avoid irreversible deformation of the cellwall and triggering physiological responses that mightlead to significant changes in the tissue mechanical
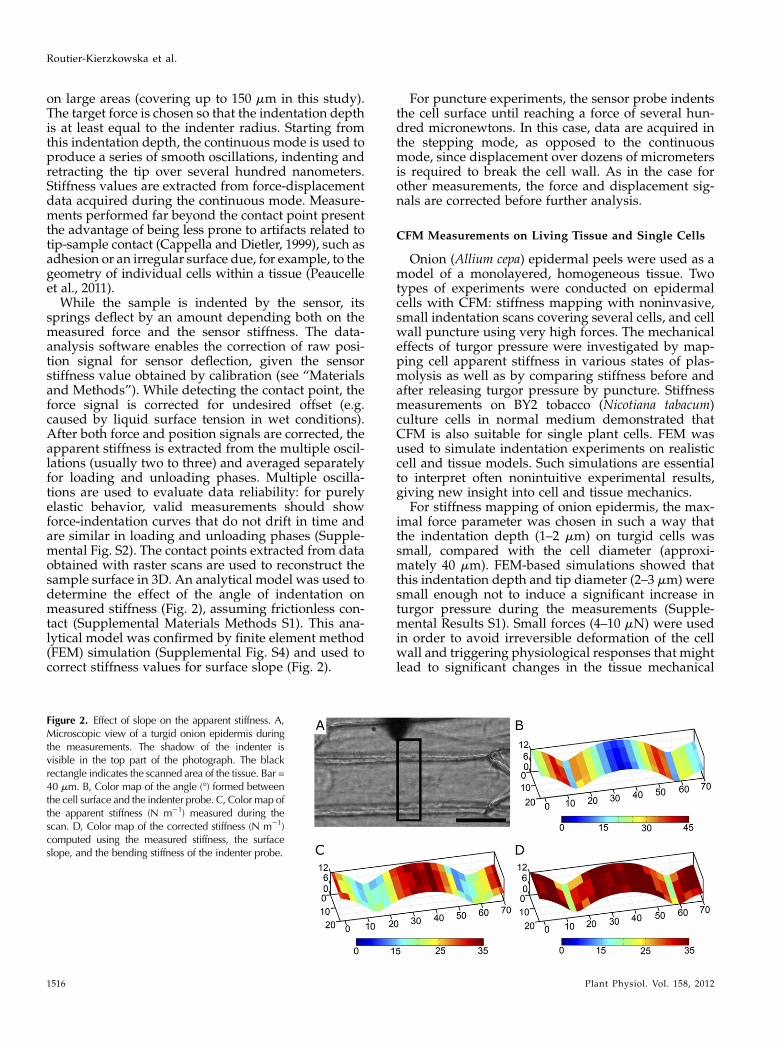
Figure 2. Effect of slope on the apparent stiffness. A,Microscopic view of a turgid onion epidermis duringthe measurements. The shadow of the indenter isvisible in the top part of the photograph. The blackrectangle indicates the scanned area of the tissue. Bar =40 mm. B, Color map of the angle (�) formed betweenthe cell surface and the indenter probe. C, Color map ofthe apparent stiffness (N m21) measured during thescan. D, Color map of the corrected stiffness (N m21)computed using the measured stiffness, the surfaceslope, and the bending stiffness of the indenter probe.
Routier-Kierzkowska et al.
1516 Plant Physiol. Vol. 158, 2012
properties during the time of the experiments (Sup-plemental Fig. S5). Measurements were corrected forslope, tip bending, and sensor deflection. In turgidtissues, the apparent stiffness is approximately uni-form overall, except in a small area (3–5 mm) above thecross wall (Figs. 2 and 3), where stiffness is between 1.4and 2.2 times lower (n = 8 cells).In order to investigate the effect of pressure on
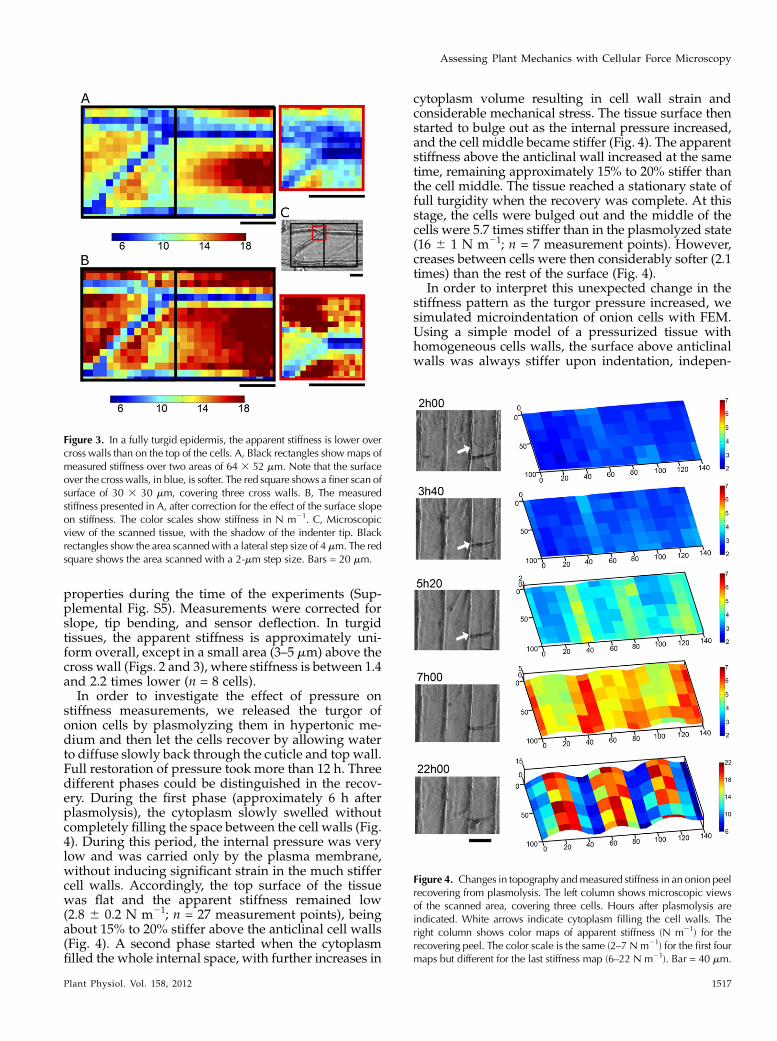
stiffness measurements, we released the turgor ofonion cells by plasmolyzing them in hypertonic me-dium and then let the cells recover by allowing waterto diffuse slowly back through the cuticle and top wall.Full restoration of pressure took more than 12 h. Threedifferent phases could be distinguished in the recov-ery. During the first phase (approximately 6 h afterplasmolysis), the cytoplasm slowly swelled withoutcompletely filling the space between the cell walls (Fig.4). During this period, the internal pressure was verylow and was carried only by the plasma membrane,without inducing significant strain in the much stiffercell walls. Accordingly, the top surface of the tissuewas flat and the apparent stiffness remained low(2.8 6 0.2 N m21; n = 27 measurement points), beingabout 15% to 20% stiffer above the anticlinal cell walls(Fig. 4). A second phase started when the cytoplasmfilled the whole internal space, with further increases in
cytoplasm volume resulting in cell wall strain andconsiderable mechanical stress. The tissue surface thenstarted to bulge out as the internal pressure increased,and the cell middle became stiffer (Fig. 4). The apparentstiffness above the anticlinal wall increased at the sametime, remaining approximately 15% to 20% stiffer thanthe cell middle. The tissue reached a stationary state offull turgidity when the recovery was complete. At thisstage, the cells were bulged out and the middle of thecells were 5.7 times stiffer than in the plasmolyzed state(16 6 1 N m21; n = 7 measurement points). However,creases between cells were then considerably softer (2.1times) than the rest of the surface (Fig. 4).
In order to interpret this unexpected change in thestiffness pattern as the turgor pressure increased, wesimulated microindentation of onion cells with FEM.Using a simple model of a pressurized tissue withhomogeneous cells walls, the surface above anticlinalwalls was always stiffer upon indentation, indepen-
Figure 3. In a fully turgid epidermis, the apparent stiffness is lower overcross walls than on the top of the cells. A, Black rectangles showmaps ofmeasured stiffness over two areas of 64 3 52 mm. Note that the surfaceover the cross walls, in blue, is softer. The red square shows a finer scan ofsurface of 30 3 30 mm, covering three cross walls. B, The measuredstiffness presented in A, after correction for the effect of the surface slopeon stiffness. The color scales show stiffness in N m21. C, Microscopicview of the scanned tissue, with the shadow of the indenter tip. Blackrectangles show the area scannedwith a lateral step size of 4 mm. The redsquare shows the area scanned with a 2-mm step size. Bars = 20 mm.
Figure 4. Changes in topography andmeasured stiffness in an onion peelrecovering from plasmolysis. The left column shows microscopic viewsof the scanned area, covering three cells. Hours after plasmolysis areindicated. White arrows indicate cytoplasm filling the cell walls. Theright column shows color maps of apparent stiffness (N m21) for therecovering peel. The color scale is the same (2–7 N m21) for the first fourmaps but different for the last stiffness map (6–22 N m21). Bar = 40 mm.
Assessing Plant Mechanics with Cellular Force Microscopy
Plant Physiol. Vol. 158, 2012 1517
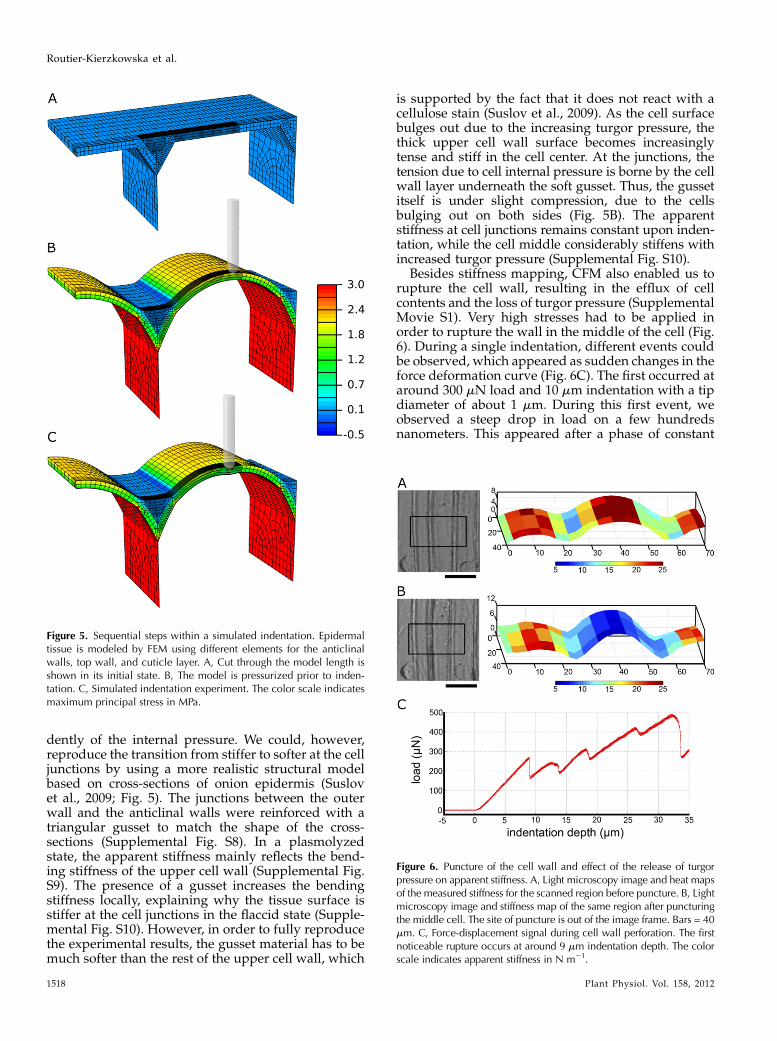
dently of the internal pressure. We could, however,reproduce the transition from stiffer to softer at the celljunctions by using a more realistic structural modelbased on cross-sections of onion epidermis (Suslovet al., 2009; Fig. 5). The junctions between the outerwall and the anticlinal walls were reinforced with atriangular gusset to match the shape of the cross-sections (Supplemental Fig. S8). In a plasmolyzedstate, the apparent stiffness mainly reflects the bend-ing stiffness of the upper cell wall (Supplemental Fig.S9). The presence of a gusset increases the bendingstiffness locally, explaining why the tissue surface isstiffer at the cell junctions in the flaccid state (Supple-mental Fig. S10). However, in order to fully reproducethe experimental results, the gusset material has to bemuch softer than the rest of the upper cell wall, which
is supported by the fact that it does not react with acellulose stain (Suslov et al., 2009). As the cell surfacebulges out due to the increasing turgor pressure, thethick upper cell wall surface becomes increasinglytense and stiff in the cell center. At the junctions, thetension due to cell internal pressure is borne by the cellwall layer underneath the soft gusset. Thus, the gussetitself is under slight compression, due to the cellsbulging out on both sides (Fig. 5B). The apparentstiffness at cell junctions remains constant upon inden-tation, while the cell middle considerably stiffens withincreased turgor pressure (Supplemental Fig. S10).
Besides stiffness mapping, CFM also enabled us torupture the cell wall, resulting in the efflux of cellcontents and the loss of turgor pressure (SupplementalMovie S1). Very high stresses had to be applied inorder to rupture the wall in the middle of the cell (Fig.6). During a single indentation, different events couldbe observed, which appeared as sudden changes in theforce deformation curve (Fig. 6C). The first occurred ataround 300 mN load and 10 mm indentation with a tipdiameter of about 1 mm. During this first event, weobserved a steep drop in load on a few hundredsnanometers. This appeared after a phase of constant
Figure 5. Sequential steps within a simulated indentation. Epidermaltissue is modeled by FEM using different elements for the anticlinalwalls, top wall, and cuticle layer. A, Cut through the model length isshown in its initial state. B, The model is pressurized prior to inden-tation. C, Simulated indentation experiment. The color scale indicatesmaximum principal stress in MPa.
Figure 6. Puncture of the cell wall and effect of the release of turgorpressure on apparent stiffness. A, Light microscopy image and heat mapsof the measured stiffness for the scanned region before puncture. B, Lightmicroscopy image and stiffness map of the same region after puncturingthe middle cell. The site of puncture is out of the image frame. Bars = 40mm. C, Force-displacement signal during cell wall perforation. The firstnoticeable rupture occurs at around 9 mm indentation depth. The colorscale indicates apparent stiffness in N m21.
Routier-Kierzkowska et al.
1518 Plant Physiol. Vol. 158, 2012
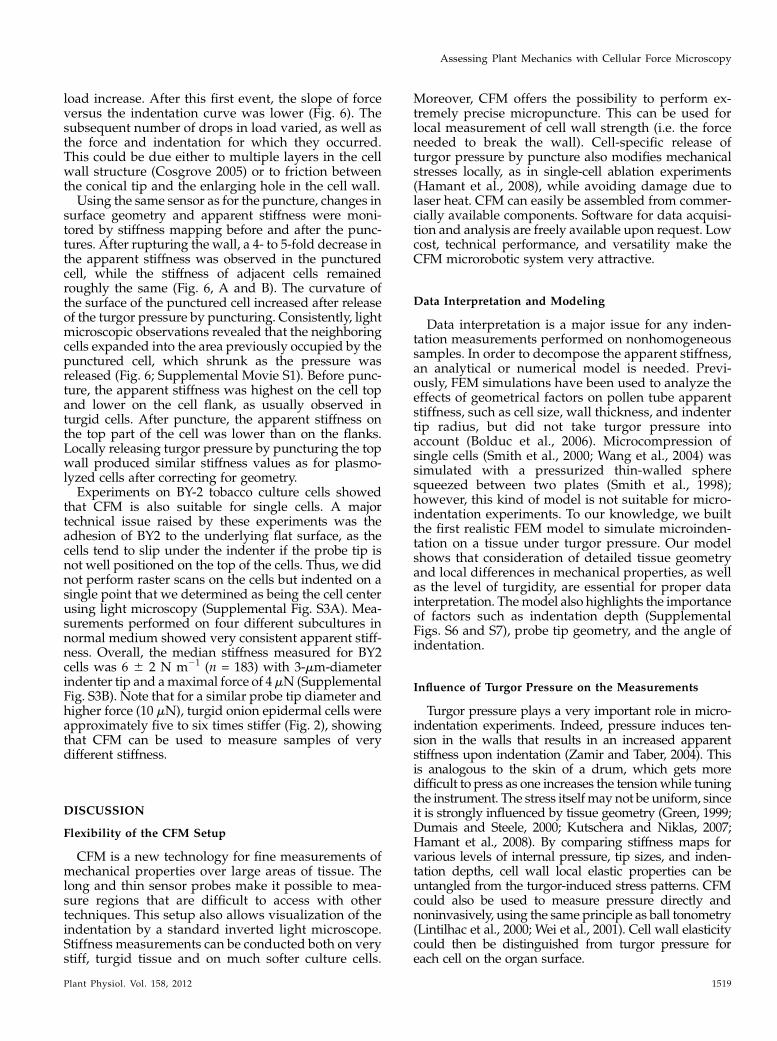
load increase. After this first event, the slope of forceversus the indentation curve was lower (Fig. 6). Thesubsequent number of drops in load varied, as well asthe force and indentation for which they occurred.This could be due either to multiple layers in the cellwall structure (Cosgrove 2005) or to friction betweenthe conical tip and the enlarging hole in the cell wall.Using the same sensor as for the puncture, changes in
surface geometry and apparent stiffness were moni-tored by stiffness mapping before and after the punc-tures. After rupturing the wall, a 4- to 5-fold decrease inthe apparent stiffness was observed in the puncturedcell, while the stiffness of adjacent cells remainedroughly the same (Fig. 6, A and B). The curvature ofthe surface of the punctured cell increased after releaseof the turgor pressure by puncturing. Consistently, lightmicroscopic observations revealed that the neighboringcells expanded into the area previously occupied by thepunctured cell, which shrunk as the pressure wasreleased (Fig. 6; Supplemental Movie S1). Before punc-ture, the apparent stiffness was highest on the cell topand lower on the cell flank, as usually observed inturgid cells. After puncture, the apparent stiffness onthe top part of the cell was lower than on the flanks.Locally releasing turgor pressure by puncturing the topwall produced similar stiffness values as for plasmo-lyzed cells after correcting for geometry.Experiments on BY-2 tobacco culture cells showed
that CFM is also suitable for single cells. A majortechnical issue raised by these experiments was theadhesion of BY2 to the underlying flat surface, as thecells tend to slip under the indenter if the probe tip isnot well positioned on the top of the cells. Thus, we didnot perform raster scans on the cells but indented on asingle point that we determined as being the cell centerusing light microscopy (Supplemental Fig. S3A). Mea-surements performed on four different subcultures innormal medium showed very consistent apparent stiff-ness. Overall, the median stiffness measured for BY2cells was 6 6 2 N m21 (n = 183) with 3-mm-diameterindenter tip and amaximal force of 4mN (SupplementalFig. S3B). Note that for a similar probe tip diameter andhigher force (10 mN), turgid onion epidermal cells wereapproximately five to six times stiffer (Fig. 2), showingthat CFM can be used to measure samples of verydifferent stiffness.
DISCUSSION
Flexibility of the CFM Setup
CFM is a new technology for fine measurements ofmechanical properties over large areas of tissue. Thelong and thin sensor probes make it possible to mea-sure regions that are difficult to access with othertechniques. This setup also allows visualization of theindentation by a standard inverted light microscope.Stiffness measurements can be conducted both on verystiff, turgid tissue and on much softer culture cells.
Moreover, CFM offers the possibility to perform ex-tremely precise micropuncture. This can be used forlocal measurement of cell wall strength (i.e. the forceneeded to break the wall). Cell-specific release ofturgor pressure by puncture also modifies mechanicalstresses locally, as in single-cell ablation experiments(Hamant et al., 2008), while avoiding damage due tolaser heat. CFM can easily be assembled from commer-cially available components. Software for data acquisi-tion and analysis are freely available upon request. Lowcost, technical performance, and versatility make theCFM microrobotic system very attractive.
Data Interpretation and Modeling
Data interpretation is a major issue for any inden-tation measurements performed on nonhomogeneoussamples. In order to decompose the apparent stiffness,an analytical or numerical model is needed. Previ-ously, FEM simulations have been used to analyze theeffects of geometrical factors on pollen tube apparentstiffness, such as cell size, wall thickness, and indentertip radius, but did not take turgor pressure intoaccount (Bolduc et al., 2006). Microcompression ofsingle cells (Smith et al., 2000; Wang et al., 2004) wassimulated with a pressurized thin-walled spheresqueezed between two plates (Smith et al., 1998);however, this kind of model is not suitable for micro-indentation experiments. To our knowledge, we builtthe first realistic FEM model to simulate microinden-tation on a tissue under turgor pressure. Our modelshows that consideration of detailed tissue geometryand local differences in mechanical properties, as wellas the level of turgidity, are essential for proper datainterpretation. Themodel also highlights the importanceof factors such as indentation depth (SupplementalFigs. S6 and S7), probe tip geometry, and the angle ofindentation.
Influence of Turgor Pressure on the Measurements
Turgor pressure plays a very important role in micro-indentation experiments. Indeed, pressure induces ten-sion in the walls that results in an increased apparentstiffness upon indentation (Zamir and Taber, 2004). Thisis analogous to the skin of a drum, which gets moredifficult to press as one increases the tensionwhile tuningthe instrument. The stress itselfmay not be uniform, sinceit is strongly influenced by tissue geometry (Green, 1999;Dumais and Steele, 2000; Kutschera and Niklas, 2007;Hamant et al., 2008). By comparing stiffness maps forvarious levels of internal pressure, tip sizes, and inden-tation depths, cell wall local elastic properties can beuntangled from the turgor-induced stress patterns. CFMcould also be used to measure pressure directly andnoninvasively, using the same principle as ball tonometry(Lintilhac et al., 2000; Wei et al., 2001). Cell wall elasticitycould then be distinguished from turgor pressure foreach cell on the organ surface.
Assessing Plant Mechanics with Cellular Force Microscopy
Plant Physiol. Vol. 158, 2012 1519
Experiments using CFM provide new insights intotissue structure and mechanics. In a fully turgid tissue,the surface is softer above the cross walls than in themiddle part of the cells (Fig. 3). This is in apparentcontradiction to the cell junctions being stiffer underreduced turgor pressure (Fig. 4). Our FEM simulationssuggest that this switch in stiffness pattern can beexplained by tissue geometry and the presence of amuch softer material accumulated between cells. CFMexperimental results show that, in order to obtain a fullpicture of the sample’s mechanical design, microinden-tations should be performed at various levels of turgid-ity and interpreted with a detailed mechanical model.
Potential Applications
In this study, we show that CFM can be used on liveplant tissue and single cells under a wide range offorces and indentation depths. Previouswork onmouseoocyte (Sun and Nelson, 2007) using the same type ofsensors as in CFM indicated that their force range issuitable for animal systems as well. CFM scans can beperformed over large areas, up to several centimeterswide, and on curved surfaces, opening the possibility tomap organs such as Arabidopsis leaves or Drosophilawing discs. The axis of indentation can be horizontal aswell as vertical, making it possible to measure livingstems or roots in an upright position to avoid gravi-tropic responses. The CFM setup is small enough to beused in combination with confocal microscopy, en-abling the visualization of fluorescent markers overlaidwith stiffness maps for future studies. Monitoring ofprotein localization or cytoskeleton responses triggeredby large deformations would also be possible. CFMversatility makes it the method of choice to unravel thefeedbacks between mechanics, genetics, and growth.
MATERIALS AND METHODS
CFM Setup Description
The multiaxis positioning system is composed of three linear microposi-
tioners (SmarAct SLC-2475) controlled by piezoelectric actuators. Each axis is
capable of moving over a range of 49 mm and is calibrated by the manufacturer
to give absolute position as an output. At the sampling frequency currently used
for CFM, resolution of the positioning system is about 10 nm. Amodular system
(SmarAct MCS-3D) is used for control of the robot, both for manual positioning
prior to experiments and automated control during experiments. The force
sensor (Femtotools FT270 or FT540) is mounted on a custom aluminum arm
(Femtotools), which is fixed to the microrobot (Supplemental Fig. S1). The
positioning system ismounted on a custom-made stage on the top of an inverted
microscope (Olympus IMT-2). Themicroscope is set on a vibration-free table and
coveredwith a custom-madeplexiglass box to protect the CFMcomponents from
environmental noise. The light source for microscopic observations is provided
by light-emitting diodes on the top of the box, to avoid heating the setup, which
would cause thermal expansion. The setup is also electrically grounded.
A data acquisition card (National Instruments USB 6009) is used to acquire
force data from the sensor. The position of the robot is acquired through the
modular control system (MCS-3D). Both components are connected to a
personal computer via USB and integrated with a custom application
implemented in LabView (National Instruments), which controls the posi-
tioning system based on a force feedback. The software user interface allows
for controlling experiment parameters, such as contact force and maximal
force (at deepest indentation), positioning speed, step size for raster scans, and
number of loading cycles (Felekis et al., 2011).
Sensors Used in Experiments
Two types of uniaxial capacitive microforce sensors were used in the
experiments: FT-S540, with a load range of 6160 mN and a resolution of 0.05
mN, and FT-S270, with a load range of 62,000 mN and resolution of 0.4 mN at
100 Hz (Femtotools; http://www.femtotools.com). In most experiments, FT-
S540 was used, because of its higher resolution. FT-S270 was used when
higher forces were required, such as when puncturing the upper cell wall of
onion (Allium cepa) epidermis.
In all the experiments described, we used sensors onwhich a tungsten probe
(Picoprobe; GGB Industries) was glued with a UV-curable glue. The probes are
long cylinders, tapered at the extremity, ending with half-spheres of various
radii. The total length of the probe is between 1 and 2 mm. The diameter of the
cylindrical part is 22, 35, or 60mmdepending on the diameter of the ending half-
sphere, 1, 2, or 3 mm, respectively. The smallest tip size, 1 mm in diameter, was
used in combination with a FT-S270 sensor for puncture experiments. Interme-
diate and larger tip sizes were used with FT-S540 sensors for all other exper-
iments on onion epidermis and tobacco (Nicotiana tabacum) BY2 cells.
Parameters Used for Experiments
Each measurement started with a fast-approach phase (average speed
around 4 mm s21), using the stepping mode (“slip-stick” principle) of piezo-
electric actuation. Once the sample surface was detected, the sensor moved
backward by a user-defined amount (usually 1–3 mm). A second approach
phase started with a lower speed (average speed of 1.5 mm s21), still using the
stepping mode of actuation. During this “fine-approach” phase, the sensor
indents the sample until reaching a user-defined target force. This triggers the
last phase of measurement, where smooth oscillations are performed with the
continuous mode of actuation (controlled directly by piezoelongation; Sup-
plemental Fig. S2A). The average speed varied between 600 and 800 nm s21
during the loading and unloading phases of the oscillations.
Depending on the type of experiment, the sample apparent stiffness, and the
tip size, different values were used for the maximal force. For noninvasive scans
on turgid onion peels (Figs. 2, 3, and 6) and on tissue recovering fromplasmolysis
(Fig. 4), maximal forces of 10 and 6 mN were used, respectively. For puncture of
onion cell wall with FT-S270 sensors (Fig. 6), a maximal force of 600mNwas used.
Experiments on BY2 cells were performed using a maximal force of 4 mN.
System Calibration
Before all experiments, the sensor stiffness was measured by acquiring force-
displacement curves while indenting a hard surface (microscope glass slide or
steel block). Assuming a negligible indentation depth compared with deflection
of sensors springs, themeasured stiffnesswas considered to closely approximate
the bending stiffness of the beam springs themselves. A 5 3 5 grid was
performed, with a maximal force of 40 mN and the same velocity parameters as
those used in subsequent experiments. The gridwas repeated until the extracted
stiffness varied less than 5% in all the grid nodes. Typical stiffness values varied
for individual FT-S540 sensors between 150 and 200 N m21. For FT-S270, it
varied between 600 and 800 N m21. Before each experimental session, the
sensors were checked for drift and/or damage by comparing stiffness values
with those taken upon their first use.
Data Analysis
The code used for data analysis was written in Matlab (Mathworks).
Correction for Sensor Deflection
During measurements on soft samples, the sensor probe indents the
sample surface while the sensor’s beam springs bend by an amount depend-
ing on the applied load. Thus, for a given position z of the actuator, the actual
probe tip zcorrected position relative to the sample is as follows:
zcorrected ¼ zþ F=S
where F is the load measured by the sensor and S is the sensor stiffness
determined by calibration. The sign convention for z and F vectors is the same
(positive is pointing upward).
Routier-Kierzkowska et al.
1520 Plant Physiol. Vol. 158, 2012
Detection of the Contact Point (Sample Surface) and
Force Offset
The contact point between the sensor probe and the sample surface is
extracted from the force-displacement curve acquired during the fine approach.
In the ideal case, the force measured by the sensor during the fine approach is
zero before contact. The force signal will increase rapidly as the probe tip
contacts the sample and indents farther into the material. The contact point
should then be the first point in the force-displacement curve that has a positive
value. Due to various factors (water surface tension, vibrations during stepping
mode, etc.), the force signal is often noisy and nonzero before contact. Thus, in
order to find the contact point, we first smooth both the displacement and force
signals using a Savitzky-Golay filter (Supplemental Fig. S2C). For each mea-
surement cycle, the force signal is offset, so that the mean force signal before the
contact point is equal to zero. The contact point is then determined to be the
closest point to the maximal indentation that is below a user-defined contact
force threshold (usually smaller than 1 mN). Both force offsetting and contact
point detection are performed iteratively, using finer and finer threshold values.
Indentation depth is then given by the sensor position (corrected for sensor
deflection) minus the contact point position. We call the maximal indentation
depth the value corresponding to the last point reachedduring the fine approach
phase. The force signal offset is used further to deduce the actual load exerted on
the sample at maximal indentation depth.
Computation of Stiffness
The stepping mode of actuation during the fine approach results in data
that are more noisy than for the continuous mode (Supplemental Fig. S2, A
and B). Therefore, stiffness values are extracted from force-displacement
curves acquired during the smooth oscillations in continuous mode. We
compute the stiffness as the slope of a least-squares linear fit of the force-
displacement curve, close to maximal indentation depth. Points used for the
linear fit are the ones above a user-defined force threshold, thus avoiding
points that are too close to the contact point. The linear fit threshold, usually
equal to half of the maximal force, is chosen so that the points taken for the
linear fit are typically not farther than 400 nm from the point of maximal
indentation depth (Supplemental Fig. S2D). Curves corresponding to loading
and unloading phases are analyzed separately. Stiffness values given in this
article correspond to the loading phase, since they are less influenced by
adhesion between the tip and the sample (Cappella and Dietler, 1999).
3D Reconstruction and Visualization of Sample Surface
For each (x, y) position of the raster scan grid, we extract a contact point (giving
the z position) as well as other parameters (stiffness, maximal indentation depth,
maximal force, creep). For each point, the normal to the surface is computed, using
a bicubic fit of the point and its closest neighbors. Surface slope is then given by the
angle formed by the normal to the surface and the z axis. In order to visualize
parameter values on 3D curved surfaces, a rectangular grid is created, such that
the center of each rectangle corresponds to the (x, y, z) position of a measurement
point. The z position of the rectangle corners are then obtained by a cubic
interpolation. Coloring of each rectangle corresponds directly to the parameter
value (e.g. stiffness) extracted for the corresponding measurement point.
Effect of Indentation Angle on Measured Stiffness
Indenting on a surface that is not perpendicular to the sensor probe
modifies the measured stiffness. We studied this effect, assuming that the
contact between the spherical tip and the sample was frictionless and the tip
probe could bend under the applied load (Supplemental Materials and
Methods S1). For an angle of indentation a and given the probe-bending
stiffness SB, themeasured stiffness Sz is related to the “normal” stiffness Sn (the
stiffness that would be measured with a probe normal to the surface) by
Sz ¼ Sn:SB:cosðaÞ2=ðSB þ Sn:sinðaÞ2Þand
Sn ¼ Sz:SB=ðSB:cosðaÞ2 � Sz:sinðaÞ2Þ
Using the last equation, we computed the stiffness normal to the surface
from the measured stiffness, the surface slope obtained from raster scan data,
and the probe-bending stiffness. The analytical model was confirmed by FEM
simulations (Supplemental Results S1).
Comparison of Stiffness Measured on the Top and
Junctions in Onion Epidermal Cells
Stiffness values for the cell top and junctions were extracted from stiffness
maps. Measurement points were classified as belonging to the junctions if
their z position was low and the slope was below 20� and as belonging to the
top if the z position was high and the slope was below 20�. We then computed
the ratio between the median of stiffness values for points belonging to the top
and junctions. For the statistics on turgid epidermis, we extracted data from
stiffness maps that covered eight different regions on a total of six indepen-
dent peels.
FEM Simulations of Microindentation of Tissue underPartial and Full Turgor Pressure
To explain the stiffness maps obtained during the recovery of turgor
pressure in epidermal cells (Fig. 4), we modeled the CFM experiment with
different turgor pressures. The model was built in Abaqus Standard (SIMU-
LIA). We did not try to quantify model parameters but to capture the
qualitative behavior of the experiment. The geometry and constitutive parts of
the model were based on histological sections reported previously (Suslov
et al., 2009). The top cell wall layer was assumed to be composed of a thin, stiff
layer covered by a much thicker and softer layer, presumably the cuticle.
Above the cross walls in the crevice, the top layer is assumed to consist of even
softer material, based on the observation that these places did not react to
cellulose staining (Suslov et al., 2009). The bottom part of themodel is given by
two parallel cross walls, each 15 mm high, which are 40 mm apart from each
other. The middle cross wall is twice as thick (1 mm) as the distal one, because
it represents the cell walls of two neighboring cells. Both cross walls are tied to
a solid region that covers the upper part of the model. This region is composed
of a solid cutical layer of 2 mm thickness that is reinforced by a membrane skin
(0.5 mm) at the bottom surface. The region above the cross wall and the cutical
layer is filled up with a prismatic gusset (7.66 mm wide, 6.18 mm high). The
CFM indenter is modeled by a rigid hemisphere (3 mm diameter) that is
attached to a rigid cylinder. All sections were assigned with linear elastic,
isotropic material definitions (Supplemental Fig. S8A). The resulting geometry
was further partitioned into two regions of different mesh properties. Those
areas that would be involved in the contact problem were meshed with linear
membrane (M3D4) and linear solid (C3D8, C3D6) elements. The remaining
structure was meshed with quadratic membrane (M3D6, M3D8) and qua-
dratic solid (C3D20, C3D15) elements. The domains of different element
degrees as well as the two edges between cross walls and the upper cell wall
were connected by tie constraints. The simulation was divided into an
inflation step and an indentation step that were both performed under the
same boundary conditions (Fig. 5). During the inflation step, the structure was
pressurized with either 5 bar (turgid) or 0.1 bar (deflated). For both pressures,
we then simulated indentations at different positions. The contact was
assumed to be frictionless and enforced by a finite sliding, node-to-node
contact algorithm. To handle large distortions of the mesh, we used Arbitrary
Langrangian Eulerian remeshing around the zone of contact.
Sample Preparation
Fresh spring onions were acquired commercially. For all experiments, we
used the white, lower part from the second scale of the bulb. The excision was
made a few millimeters from the bulb base and around 2 cm long for 1 cm
wide. Waterproof laboratory tags were stuck to the extremities of the bulb
piece on its adaxial side and then gently lifted so that the epidermis detached
from inner bulb tissue. Next, epidermis peels were bathed in distilled water,
hanging from the tagged extremities, for 10 min. For the plasmolysis exper-
iments, the peels were additionally bathed for 2 min in 3%NaCl solution, then
quickly rinsed with pure water in order to remove the remains of salt on the
peel surface.
The bottom side of the peels (previously facing the inner tissue) was then
gently dried using cellulose paper (Whatman). Using the tags at their
extremities, peels were stuck to tissue culture frost-treated plastic plates for
better adhesion of the cells to the dish. Two additional tags were stuck on the
remaining free sides of the peels, so that the peels were held flat against the
Assessing Plant Mechanics with Cellular Force Microscopy
Plant Physiol. Vol. 158, 2012 1521
dish. The prepared peels were then covered in distilled water before measure-
ments. Since the tags are waterproof, water had to enter the cells by passing
through the cuticle that covers the upper face of the epidermal peel. The cuticle
is a thick hydrophobic layer whose physiological function, among others, is to
prevent the cells from drying. The water diffused hence very slowly, resulting in
a slow recovery of turgor pressure for the plasmolized peels.
Fresh cultures of BY2 tobacco cells were prepared between 1 and 3 d before
CFM measurements. Experiments were performed in the same medium as
used for cell culture in frost-treated tissue culture dishes. The cells were
allowed to settle at the bottom of the culture dishes before starting measure-
ments. Long, cylindrical cells (80–160 mm in length and around 45 mm in
diameter) in files were chosen for the experiments (Supplemental Fig. S3). In
order to make sure that the cells were properly adhering to the plate, we
measured only cells that did not float in the medium while moving the plate.
Supplemental Data
The following materials are available in the online version of this article.
Supplemental Figure S1. CFM setup on inverted microscope.
Supplemental Figure S2. Computation of contact point and stiffness from
force and position data.
Supplemental Figure S3. CFM measurements on BY-2 culture cells.
Supplemental Figure S4. FEM verification of an analytical model to correct
for indentation angle.
Supplemental Figure S5. Results of repetitive scans on a turgid onion
epidermis peel.
Supplemental Figure S6. Design of simulations used to determine the
increase in pressure during indentation.
Supplemental Figure S7. Effect of indentation on internal pressure in-
crease and measured stiffness.
Supplemental Figure S8. Structure of the FEM model of epidermal cells.
Supplemental Figure S9. Stress resulting from simulated indentation on
cells with low and high pressure.
Supplemental Figure S10. Force indentation curves obtained from simu-
lating indentations on cells with low or high pressure.
Supplemental Materials and Methods S1.
Supplemental Results S1.
Supplemental Movie S1. Micropuncture of onion epidermal cell.
ACKNOWLEDGMENTS
We thank Theres Imhof for BY2 cell culture, Willy Tanner for technical
support, Siobhan Braybrook and Naomi Nakayama for help during the initial
phase of the project, Ales Janka for advice on modeling, Felix Beyeler for
advice on the hardware setup, and Bernadette Guenot, Daniel Kierzkowski,
and Sarah Robinson for critical reading of the manuscript and help with the
figures.
Received November 22, 2011; accepted February 14, 2012; published February
21, 2012.
LITERATURE CITED
Baskin TI (2005) Anisotropic expansion of the plant cell wall. Annu Rev
Cell Dev Biol 21: 203–222
Blewett J, Burrows K, Thomas CA (2000) Micromanipulation method to
measure the mechanical properties of single tomato suspension cells.
Biotechnol Lett 22: 1877–1883
Bolduc JE, Lewis LJ, Aubin CE, Geitmann A (2006) Finite-element analysis
of geometrical factors in micro-indentation of pollen tubes. Biomech
Model Mechanobiol 5: 227–236
Burgert I (2006) Exploring the micromechanical design of plant cell walls.
Am J Bot 93: 1391–1401
Cappella B, Dietler G (1999) Force-distance curves by atomic force mi-
croscopy. Surf Sci Rep 34: 5–104
Coen E, Rolland-Lagan AG, Matthews M, Bangham JA, Prusinkiewicz P
(2004) The genetics of geometry. Proc Natl Acad Sci USA 101: 4728–4735
Cosgrove DJ (2005) Growth of the plant cell wall. Nat Rev Mol Cell Biol 6:
850–861
Dumais J, Steele CR (2000) New evidence for the role of mechanical forces
in the shoot apical meristem. J Plant Growth Regul 19: 7–18
Felekis D, Muntwyler S, Vogler H, Beyeler F, Grossniklaus U, Nelson BJ
(2011) Quantifying growth mechanics of living, growing plant cells in
situ using microrobotics. Micro Nano Lett 6: 311–316
Geitmann A (2006) Experimental approaches used to quantify physical
parameters at cellular and subcellular levels. Am J Bot 93: 1380–1390
Geitmann A, Parre E (2004) The local cytomechanical properties of grow-
ing pollen tubes correspond to the axial distribution of structural
cellular elements. Sex Plant Reprod 17: 9–16
Green PB (1999) Expression of pattern in plants: combining molecular and
calculus-based biophysical paradigms. Am J Bot 86: 1059–1076
Hamant O, Heisler MG, Jonsson H, Krupinski P, Uyttewaal M, Bokov P,
Corson F, Sahlin P, Boudaoud A, Meyerowitz EM, et al (2008) Devel-
opmental patterning by mechanical signals in Arabidopsis. Science 322:
1650–1655
Hiller R, Bruce D, Jeronimidis G (1996) A micro-penetration technique for
mechanical testing of plant cell walls. J Texture Stud 27: 559–587
Jager A, Hofstetter K, Buksnowitz C, Gindl-Altmutter W, Konnerth J
(2011) Identification of stiffness tensor components of wood cell walls by
means of nanoindentation. Compos Part A: Appl Sci 42: 2101–2109
Kohler L, Spatz HC (2002) Micromechanics of plant tissues beyond the
linear-elastic range. Planta 215: 33–40
Kutschera U, Niklas KJ (2007) The epidermal-growth-control theory of
stem elongation: an old and a new perspective. J Plant Physiol 164:
1395–1409
Lintilhac PM, Wei C, Tanguay JJ, Outwater JO (2000) Ball tonometry: a
rapid, nondestructive method for measuring cell turgor pressure in
thin-walled plant cells. J Plant Growth Regul 19: 90–97
Milani P, Gholamirad M, Traas J, Arneodo A, Boudaoud A, Argoul F,
Hamant O (2011) In vivo analysis of local wall stiffness at the shoot
apical meristem in Arabidopsis using atomic force microscopy. Plant J
67: 1116–1123
Mirabet V, Das P, Boudaoud A, Hamant O (2011) The role of mechanical
forces in plant morphogenesis. Annu Rev Plant Biol 62: 365–385
Parre E, Geitmann A (2005) Pectin and the role of the physical properties of
the cell wall in pollen tube growth of Solanum chacoense. Planta 220:
582–592
Peaucelle A, Braybrook SA, Le Guillou L, Bron E, Kuhlemeier C, Hofte H
(2011) Pectin-induced changes in cell wall mechanics underlie organ
initiation in Arabidopsis. Curr Biol 21: 1720–1726
Schopfer P (2006) Biomechanics of plant growth. Am J Bot 93: 1415–1425
Smith A, Moxham K, Middelberg A (1998) On uniquely determining cell-
wall material properties with the compression experiment. Chem Eng
Sci 53: 3913–3922
Smith AE, Zhang Z, Thomas CR, Moxham KE, Middelberg AP (2000) The
mechanical properties of Saccharomyces cerevisiae. Proc Natl Acad Sci
USA 97: 9871–9874
Sun Y, Nelson BJ (2007) MEMS capacitive force sensors for cellular and
flight biomechanics. Biomed Mater 2: S16–S22
Suslov D, Verbelen JP, Vissenberg K (2009) Onion epidermis as a new
model to study the control of growth anisotropy in higher plants. J Exp
Bot 60: 4175–4187
Thompson DS (2005) How do cell walls regulate plant growth? J Exp Bot
56: 2275–2285
Wang CX, Wang L, Thomas CR (2004) Modelling the mechanical properties
of single suspension-cultured tomato cells. Ann Bot (Lond) 93: 443–453
Wang L, Hukin D, Pritchard J, Thomas C (2006) Comparison of plant cell
turgor pressure measurement by pressure probe and micromanipula-
tion. Biotechnol Lett 28: 1147–1150
Wei C, Lintilhac PM, Tanguay JJ (2001) An insight into cell elasticity and load-
bearing ability: measurement and theory. Plant Physiol 126: 1129–1138
Zamir EA, Taber LA (2004) On the effects of residual stress in micro-
indentation tests of soft tissue structures. J Biomech Eng 126: 276–283
Zerzour R, Kroeger J, Geitmann A (2009) Polar growth in pollen tubes is
associated with spatially confined dynamic changes in cell mechanical
properties. Dev Biol 334: 437–446
Routier-Kierzkowska et al.
1522 Plant Physiol. Vol. 158, 2012