Embed Size (px)
Citation preview

at SciVerse ScienceDirect
Atmospheric Environment 70 (2013) 18e27
Contents lists available
Atmospheric Environment
journal homepage: www.elsevier .com/locate/atmosenv
In vitro evaluation of pulmonary deposition of airborne volcanic ash
Anna Lähde a,*, Sigurbjörg Sæunn Gudmundsdottir b, Jorma Joutsensaari c, Unto Tapper d,Jarno Ruusunen a, Mika Ihalainen a, Tommi Karhunen a, Tiina Torvela a, Jorma Jokiniemi a,d,Kristiina Järvinen e, Sigurður Reynir Gíslason f, Haraldur Briem g,Sveinbjörn Gizurarson b,**
a Fine Particle and Aerosol Technology Laboratory, Department of Environmental Science, University of Eastern Finland, P.O. Box 1627,FI-70211 Kuopio, Finlandb Faculty of Pharmaceutical Sciences, School of Health Science, University of Iceland, Hofsvallagata 53, 107 Reykjavik, IcelandcDepartment of Applied Physics, University of Eastern Finland, P.O. Box 1627, FI-70211 Kuopio, FinlanddVTT Fine Particles, P.O. Box 1000, 02044 VTT Espoo, Finlande School of Pharmacy, Faculty of Health Sciences, University of Kuopio, 70211 Kuopio, Finlandf Institute of Earth Sciences, Sturlugata 7, 101 Reykjavík, IcelandgDirectorate of Health, Barónsstíg 47, 101 Reykjavík, Iceland
h i g h l i g h t s
< Re-suspension of ash can substantially increase airborne particle concentrations.< Up to 9% of the ash particle surface area was deposited into the alveolar region.< Most of the particle surface area was deposited to the head airways.
a r t i c l e i n f o
Article history:Received 17 September 2012Received in revised form30 November 2012Accepted 19 December 2012
Keywords:Volcanic ashAerosolizationLung depositionHealthParticle size
* Corresponding author. Tel.: þ358 40 355 3805.** Corresponding author. Tel.: þ354 898 0318.
E-mail addresses: [email protected] (A. Lähde), sv
1352-2310/$ e see front matter � 2013 Elsevier Ltd.http://dx.doi.org/10.1016/j.atmosenv.2012.12.048
a b s t r a c t
There has been an increasing interest in the effects of volcanic eruption on the environment, climate, andhealth following two recent volcanic eruptions in Iceland. Although health issues are mainly focused onsubjects living close to the eruption due to the high concentration of airborne ash and gasses in closevicinity to the volcanoes, the ash may also reach high altitude and get distributed thousands of kilo-meters away from the volcano. Ash particles used in the studies were collected at the Eyjafjallajökull andGrímsvötn eruption sites. The composition, size, density and morphology of the particles were analyzedand the effect of particle properties on the re-dispersion and lung deposition were studied. The aero-dynamic size and morphology of the particles were consistent with field measurement results obtainedduring the eruptions. Due to their size and structure, the ash particles can be re-suspended and trans-ported into the lungs. The total surface area of submicron ash particles deposited into the alveolar andtracheobronchial regions of the lungs were 3e9% and 1e2%, respectively. Although the main fraction ofthe surface area is deposited in the head airways region, a significant amount of particles can deposit intothe alveolar and tracheobronchial regions. The results indicate that a substantial increase in the con-centration of respirable airborne ash particles and associated health hazard can take place if thedeposited ash particles are re-suspended under dry, windy conditions or by outdoor human activity.
� 2013 Elsevier Ltd. All rights reserved.
1. Introduction
The Eyjafjallajökull volcano eruption took place from April 14 tolate May 2010 ejecting around 480 Tg of volcanic ash whereof 80%was airborne tephra, i.e. around 380 Tg (Gislason et al., 2011b;
[email protected] (S. Gizurarson).
All rights reserved.
Gudmundsson et al., 2012; Schumann et al., 2011). A second vol-cano, Grímsvötn, erupted a year later in May 2011. Most of the massfrom Grímsvötnwas ejected over the first 24 h of the eruption. Botheruptions caused a large release of particles to the environment.The eruption of Eyja affected the air quality all around Europewhilethe eruption of Grímsvötn increased the particle concentrationsespecially in the Northern Europe (Gislason et al., 2011b; Kerminenet al., 2011; Olsson et al., 2012; Tesche et al., 2012). The interna-tional media was focused on the disruption to the aviation, while

A. Lähde et al. / Atmospheric Environment 70 (2013) 18e27 19
less attention was paid to the environmental pollution and poten-tial health effects of these particles. However, increased PM10 (massof particles smaller than 10 mm) values were observed in a numberof locations around Europe (Bukowiecki et al., 2011; Colette et al.,2011; Donovan and Oppenheimer, 2011; Kerminen et al., 2011;Schäfer et al., 2011). For example, high PM10 concentrations up to140 mg m�3 were measured at Schauinsland and 100 mg m�3 inFreiburg in Germany (Schäfer et al., 2011), and hourly PM10 con-centrations exceeded 100 mg m�3 in the southern parts of Scandi-navia for several hours (Tesche et al., 2012). However, much highermean daily average PM10 value were observed in Reykjavik on June4, 2010 was about 500 mg m�3 after Eyjafjallajökull eruption(Bodvarsdottir and Sigurdardottir, 2010; Thorsteinsson et al., 2012).After the Grímsvötn eruption the maximumvalue was measured tobe around 200 mg m�3 on May 22, 2011. These values clearly exceedthe PM10 threshold of 50 mg m�3 set by the European Union airquality directive 2008/50/EC (Schäfer et al., 2011).
The high emissions can have important local and regional im-plications that affect vegetation, livestock and people especiallywithin Iceland (Graham et al., 1985; Gudmundsson et al., 2008).Healtheffects of airborneparticlesdependon thedose,which in caseof particles in air is normally derived from the measured particleconcentration, the breathing flow rate and the breathing frequencyof the individual (Asbach et al., 2009). Airborne fine particles withthe aerodynamic diameter below 2.5 mm and especially ultrafineparticles (diameter< 100nm),with smallmass per particle but largesurface area per unitmass, have been associatedwith adversehealtheffects such as cardiac and respiratory diseases (Dockery, 2009;Katsouyanni et al., 1997; Löndahl et al., 2007; Pope and Dockery,2006). In particular the health hazard due to prolonged exposureto airborne respirable silica, a major constituent of volcanic ash, iswell known (Edmonds et al.,1977;Grahamet al.,1985). A populationbased survey of early health effects of the Eyjafjallajökull 2010eruption was undertaken in Iceland at the end of the eruption(Carlsen et al., 2012). The short-term ash exposure was associatedwith upper airway irritation symptoms and exacerbation of pre-
Fig. 1. A map of south Iceland showing the locations of Eyjafjallajökull and Grímsvötn
existing asthma but did not contribute to serious health problems.The exposure did not impair respiratory function compared to con-trols. Outdoor use of protective glasses and face masks was consid-ered protective against irritation to the eyes and the upper airways.
In this paper we compare the aerosolization of bulk ash particlescollected 60 km from the Eyjafjallajökull eruption on 15 April 2010and80kmfromGrímsvötneruptiononMay22nd2011.Theemphasisof this study is on the characterization, evaluation and comparison ofthe particulate matter emitted from these two volcanoes. The ashsamples collected from the ground during the eruptions consist ofsmall particles adhering to the surface of larger particles. Thisstructure resembles that of typical pharmaceutical dry powder for-mulation for inhalation, consisting of micronized drug particles withcoarse carrier particles (Prime et al., 1997). Therefore, the re-dispersion of the particles and aerosol properties were studied. Inaddition, in vitro pulmonary deposition of the ash particles fromEyjaand Grím were assessed based on their aerodynamic diameter andtotal number concentration. Furthermore, the surface area of parti-cles corresponding to the deposition in the tracheobronchial andalveolar regions of human lungs was determined with the nano-particle surface area monitor. This gives valuable information of thehealth effects of the particles, since the reactivity of the particleswithin the lung is nowadays known to be related to the surface areaand number of particlesmore thanmass (Horwell and Baxter, 2006).The data obtained in these studies were compared to the environ-mental particle concentrations measured during the eruptions.
2. Materials and methods
2.1. Materials
Sample of the Eyjafjalljökull ash was collected on the main roadin south-eastern Iceland, about 60 km east of the summit crater on15 April 2010 12:30:00 GMT about 30 h after the onset of thesummit eruption of the Eyjafjallajökull (Gislason et al., 2011a,2011b), see Fig. 1. The collection site was located at the southern
and sites where the settled ash samples were collected (indicated Eyja and Grím).

A. Lähde et al. / Atmospheric Environment 70 (2013) 18e2720
edge of the plume which was heading nearly straight east. Thesamples were collected using a Plexiglas spatula and heavy walledpolyethylene bags (Gislason et al., 2011a). The samples were kept inthe bags in a dry place and samples intended for experimental andmicroscopic studies were kept in desiccators. The size of the sam-ples, several kilos, acted in itself as desiccators.
The Grímsvötn samples were collected about 80 km from thecrater on 22May 2011, the 2nd day of eruption, when the density ofthe airborne ash was at the highest in the town of Kirkjubæ-jarklaustur (Fig. 1). The sample was collected from the ground inthe town of Kirkjubæjarklaustur sampled in the dark, within theplume that was heading southewest (Fig. 1). The sample wasplaced into a heavy wallet plastic bag and shipped immediately foranalysis.
Both Eyja and Grím collection sites were selected because thesewere the closest farm communities (Kirkjubæjarklaustur town/Grímsvötn, and Álftaver farm community/Eyjafjallajökull) mostseverely affected by the ash, during the first two days of theeruptions. Both samples were collected within 30 h of the onset ofthe eruption before they were rained on. The distance from theeruption was 60e80 km in both cases.
2.2. Aerosolization of the ash particles
Fig. 2 shows the experimental set-up used for the aerosolizationof the ash particles. It can be divided into the (1) particle dispersion,(2) dilution andmixing, and (3) sampling sections. The ash particleswere dispersed using a fluidized bed aerosol generator (FBAG,Model 3400A, TSI Inc., USA). The system is able to disperse drypowders, with aerodynamic diameter of the particles ranging from0.5 to 40 mm, into the gas phasewith stable concentration. The beadpurge of FBAGwas adjusted to 2 L min�1. A filtered air flow beneaththe bed, i.e. the bed flow, carried the aerosolized particles to theoutlet of the generator. The flow rate of the bed flow was variedbetween 15 and 30 L min�1 corresponding to average air velocity of0.15 and 0.4 cm s�1, respectively. No size classification, i.e. cyclone,was used at the FBAG outlet. The aerosol exiting the FBAG wasdiluted with dry air at ambient temperature, using a porous tubediluter, to obtain a suitable concentration range for the on-lineaerosol analyzers (Lyyränen et al., 2004). To ensure isokineticsampling the total flow rate was kept at 62.5 L min�1 during theexperiments by adjusting the dilution flow rate down from47.5 L min�1 to 32.5 L min�1 as the aerosol flow rate increased from15 to 30 L min�1.
Fig. 2. The experimental set-up for the aerosolization of the ash particles. The rea
2.3. Instrumentation and characterization
The determination of the grain size distributions of the samplesas collected on the ground was attempted with dynamic lightscattering (Zetasizer nanoZS, Malvern Instruments). The watersuspensions of particles were sonicated for 60 min before themeasurement. Bulk density of the settled ash samples was obtaineddirectly from the ratio of mass and volume, i.e. 20.3 g Eyjafjallajö-kull and 17.4 g Grímsvötn ash were measured in 25 ml graduatedcylinder. Tap density was determined using an ERWEKA tap densityanalyzer (SVM, Apparatebau GMBH, Heusenstamm, Germany). Thebulk and the tap densities were used in the calculation of the Carr’scompressibility index (Staniforth and Aulton, 2007).
The aerodynamic number size distribution and the relatedgeometric mean diameter of the aerosolized ash particles weremeasured on-line with electrical low-pressure impactor (ELPI,Dekati Ltd., Finland) using isokinetic sampling. The aerodynamicparticle size is defined as the diameter of a spherical particle witha density of 1000 kg m�3, i.e. it is equivalent to a water droplethaving the same aerodynamic properties as the particle (Hinds,1999). The total particle number concentration in the gas phasewas determined with a condensation particle counter (CPC 3776,TSI Inc., USA).
The surface area of the nanoparticles corresponding to thedeposition in the tracheobronchial (TB, trap voltage 100 V) andalveolar (AL, trap voltage 200 V) regions of the lungs were deter-mined with a nanoparticle surface area monitor (NSAM, model3550, TSI Inc., USA) (Shin et al., 2007). A cyclone specificallydesigned for NSAM was used to remove all particles above1000 nm, which is the upper limit of the size range that can still bereliably measured with this equipment (Asbach et al., 2009). Par-ticle deposition onto TB, AL and head airways regions (HA) werealso calculated from the particle size distributions determined withELPI using the ICRP respiratory deposition models (Asbach et al.,2009; Hinds, 1999; ICRP, 1994; Leskinen et al., 2012). In the parti-cle lung deposition calculations from ELPI data, mass and surfacearea size distributions were obtained from the number size distri-butions using one mode log-normal distribution fitting with theparticle density of 2 g cm�3. Results were scaled to a PM10 con-centration of 1 mg m�3 to enable comparison of the results. Fur-thermore, the hygroscopic growth of the particles can significantlyalter particle deposition in lung (Löndahl et al., 2007). However,according to a recent study (Lathem et al., 2011) the hygroscopicgrowth of volcanic ash particles is very weak as the settled ash
ctor consists of (1) aerosol generation, (2) dilution and (3) sampling sections.

A. Lähde et al. / Atmospheric Environment 70 (2013) 18e27 21
particles typically consist of water insoluble or only very slightlysoluble compounds (e.g. silica, iron oxides). The hygroscopicityparameter reported for Eyjafjallajökull ash particles was less than0.01 corresponding to growth factor value of ca. 1.12 in lungs. Thus,it has been ignored in the calculations.
The morphology of the collected particles was imaged witha field emission low-voltage electron microscope (FE-SEM, LeoGemini DSM 982) operated at a 2 kV acceleration voltage. Theelemental composition of the particles was analyzed usinga transmission electron microscope (TEM, Jeol JEM-2100F) withenergy dispersion spectrometer (EDS, Thermo Scientific NS7 withSi(Li) crystal) operated at a 200 kV acceleration voltage. The aero-solized samples for the electron microscope analyses were col-lected directly from the aerosol flow on a holey carbon copper grid(Agar Scientific Inc., S147-4400 Holey Carbon Film 400 Mesh Cu)using an aspiration-based electron microscope sampler (Lyyränenet al., 2009). The dry powder samples of bulk ash particles wereprepared on stubs using double sided carbon tabs (SPI Supplies).The particle composition and crystallinity were determinedwith anX-ray diffractometer (XRD, Bruker D8 DISCOVER). The specificsurface area of the samples was determined with nitrogenadsorption isotherms (i.e. BET method) measured with Tristar II3020 porosity analyzer (Micrometrics Instrument Corp., USA).
3. Results and discussion
3.1. Properties of settled ash particles
Based on the dynamic light scattering analysis both sampleswere very polydispersive. The Eyja sample consisted of submicron
Fig. 3. SEM images of the particles collected from the ground near Eyjafjallajökull
particles with size between 100 nm and 200 nm, while large par-ticles sedimented on the bottom of suspension. The particle size inthe Grím sample could not be measured as it was more poly-disperse than Eyja sample. However, the obtained polydispersivityof the samples corresponds well with the SEM images of the vol-canic ash particles shown in Fig. 3. The size of the particles sedi-mented out of the ash plume in close vicinity of Eyja ranged fromsubmicron up to 50 mmwhile the size of the Grím particles rangedfrom submicron to 100 mm. In addition, the Grím particles weremore faceted than the Eyja particles. The tapped density value andthe Carr’s compressibility index for Eyjawere 1292 kgm�3 and 23%,respectively. The corresponding values for Grím were 1183 kg m�2
and 25%. Furthermore, the specific surface area (BET) of the settledash particles was 3.09 m2 g�1 for Eyja and 0.53 m2 g�1 for Grím.These kinds of values are typical for relatively large and non-porousparticles with poor flowability (Staniforth and Aulton, 2007). Thedifference in the particle properties originates from the differencesin the conditions during the particle formation, i.e. the force ofexplosive vs. effusive activity of the subglacial volcanoes, the dis-tance from the eruption site and the chemical composition of themagma (Donovan and Oppenheimer, 2011). However, in both casesthe coarse ash particles were covered with smaller particlesadhered to their surface (Fig. 3). A substantial fraction of these fineparticles in the ash can cause a significant concentration of respi-rable airborne particles if the deposited ash is re-suspended underdry, windy conditions or by outdoor human activity (Horwell et al.,2010; Thorsteinsson et al., 2012). An example of such events is thedust storms that took place close to Eyja and affected the air qualityas far as 100 km away in the capital Reykjavik (Donovan andOppenheimer, 2011).
(A scale 50 mm, B scale 10 mm) and Grímsvötn (C scale 50 mm, D scale 10 mm).

A. Lähde et al. / Atmospheric Environment 70 (2013) 18e2722
The X-ray diffraction patterns of the settled ash samples areshown in Fig. 4. There is elemental variation between the Eyja andGrím samples that arises from different magma compositions. Thevolcanic ash particles from Eyja have substantial silica content andthe peaks between 26 and 27� 2q can be assigned to quartz. This isconsistent with the composition obtained from the airborne par-ticles in Europe during the eruption (Bukowiecki et al., 2011;Lettino et al., 2012; Petäjä et al., 2012; Schumann et al., 2011). Thepresence of silicates and iron oxideswere also confirmedwith TEM/EDS studies. In comparison, there were fewer peaks in the XRDgraph of Grím particles which is consistent with previous studiesshowing that Grímsvötn particles consisted mostly of basaltic glasswhile Eyjafjallajökull ash was dominated by andesitic glass(Gislason et al., 2011b). No sulfurous compounds were observed inthe studies as expected as the samples were collected from theground in close vicinity of the volcanoes and were not aged in theatmosphere. However, exposure to crystalline silica is well knownto causes silicosis (Horwell and Baxter, 2006). In addition, volcanicash containing Fe2þ can increase the toxic reactions in the lung.
3.2. Properties of aerosolized ash particles
3.2.1. Particle size distributionsThe properties of aerosolized ash particles obtained from Eyja
and Grím are shown in Table 1 and the corresponding particlenumber size distributions in Fig. 5. The aerosolization of the ashsamples show that both volcanic ashes can be easily re-dispersedinto the air. The geometric mean diameter (Dp) of the re-dispersed particles was below 1 mm at the studied flow rates of15, 20 and 30 L min�1 (Table 1). In the case on Eyja particles, theparticle size distributions were unimodal (Fig. 5AeC). The Dp ofparticles decreased from 830 nm to 669 nmwhile the total particleconcentration was almost tripled as the bed flow increased from15 L min�1 to 30 L min�1. This is explained by improved de-agglomeration at the higher flow rates. The total number of re-dispersed particles was over 10 000 # cm�3. The Dp of the re-dispersed Grím particles was slightly larger compared to Eyjaparticles, particularly at the flow rate of 15 Lmin�1. As with the Eyjaparticles, the size of the Grím particles decreased from 940 nm to694 nmwith increasing flow rate from 15 to 30 L min�1 due to the
Fig. 4. The XRD patterns of ash p
better de-agglomeration. In contrast to the Eyja particles, thenumber concentration of particles with diameters around 100 nmincreased as the flow rate increased and thus, the particle sizedistributions became bimodal (Fig. 5DeF). However, the totalnumber concentration of aerosolized particles was around twotimes lower at the flow rates of 15 and 20 L min�1 and over fourtimes lower at the highest flow rate than those for Eyja (Table 1).This corresponds to the specific surface area measurements andSEM images of the bulk samples (Fig. 3) indicating that ash particlesof these volcanoes have different size and shape (rounded vs. fac-eted) that affected their re-dispersion.
A clearly increase in ground level PM10 values were measuredaround Europe during the eruptions (Bukowiecki et al., 2011;Colette et al., 2011; Donovan and Oppenheimer, 2011; Schäfer et al.,2011). To compare the ground level measurements, the particle sizedistributions of re-suspended ash were converted to the mass/volume distributions (one mode log-normal fitting, density2.0 g cm�3). Volume size distributions of re-dispersed particles hada mode around 2 mm (1.7e2.7 mm). A similar mode consisting ofvolcanic ash particles was also observed at several locations inEurope during the eruptions (Bukowiecki et al., 2011; Kerminenet al., 2011; O’Dowd et al., 2012; Pitz et al., 2011). However, theemission of a large amount of gaseous SO2 to the atmosphereduring the eruptions and consequent secondary aerosol formationin the troposphere was not investigated in this study. Thus, theincrease in the accumulation mode, i.e. formation of new particlesaround 0.3e0.5 mm, observed in field studies and other effects ofSO2 are not comparable to this study.
3.2.2. Shape and composition of the aerosolized particlesFig. 6 shows the SEM images of the ash particles aerosolized at
15 L min�1. Similar particle shapes were also observed with thehigher flow rates. The particles are significantly smaller than theash particles collected from the ground (Fig. 3). Furthermore, there-dispersed particles from both Eyja and Grím showed goodresemblance to airborne particles that were collected from the at-mosphere during the eruptions in various locations in Europe(Bukowiecki et al., 2011; Kerminen et al., 2011; Petäjä et al., 2012).Based on the TEM/EDS the particles consisted mostly of silicatesand iron which is in agreement with the XRD studies of the settled
articles from Eyja and Grím.

Table 1Average particle diameter (Dp, geometricmean diameter), geometric standard deviation (GSD), total particle number concentration (Ntot) andmass concentration (PM10) of theEyjafjallajökull and Grímsvötn ash particles dispersed at different flow rates. PM10 values were calculated from log-normal fitted distributions (one mode fitting, density2.0 g cm�3). (� ¼ standard deviation, n.a. ¼ not available).
Volcano Dispersion flow rate[L min�1]
Dp [nm] GSD Ntot [1 cm�3] PM10 [mg m�3]
ELPI CPC
Eyjafjallajökull 15 830 � 8 2.16 � 0.01 (1.39 � 0.05) � 104 (1.14 � 0.22) � 104 3920 770 � 4 2.11 � 0.00 (2.15 � 0.06) � 104 (1.78 � 0.17) � 104 4230 669 � 3 2.11 � 0.01 (3.88 � 0.14) � 104 (3.69 � 0.18) � 104 69
Grímsvötn 15 940 � 20 2.15 � 0.08 (7.95 � 0.18) � 103 n.a. 3020 729 � 6 2.60 � 0.03 (1.06 � 0.02) � 104 n.a. 2330 694 � 9 2.41 � 0.03 (8.77 � 0.39) � 103 n.a. 11
100 1000 10000
0
0.5
1
1.5
2x 10
4
Dp (nm)
dN
/dlo
gD
p (
1/c
m3)
Eyja 15lpm
(A)
100 1000 10000
0
5000
10000
15000
Dp (nm)
dN
/dlo
gD
p (
1/c
m3)
Grim 15lpm
(D)
(B)
100 1000 10000
0
1
2
3
4x 10
4
Dp (nm)
dN
/dlo
gD
p (
1/c
m3)
Eyja 20lpm
100 1000 10000
0
5000
10000
15000
Dp (nm)
dN
/dlo
gD
p (
1/c
m3)
Grim 20lpm
(E)
(C)
100 1000 10000
0
2
4
6x 10
4
Dp (nm)
dN
/dlo
gD
p (
1/c
m3)
Eyja 30lpm
100 1000 10000
0
5000
10000
15000
Dp (nm)
dN
/dlo
gD
p (
1/c
m3)
Grim 30lpm
(F)
Fig. 5. Aerodynamic number size distributions of Eyja particles aerosolized at flow rates of (A) 15 L min�1, (B) 20 L min�1 and (C) 30 L min�1, and Grím particles aerosolized at flowrates of (D) 15 L min�1, (E) 20 L min�1 and (F) 30 L min�1.
A. Lähde et al. / Atmospheric Environment 70 (2013) 18e27 23

Fig. 6. SEM images of the Eyjafjallajökull (AeC) and Grímsvötn (CeF) particles aerosolized at 15 L min�1 collected directly from the aerosol on the holey carbon copper grid. (A andC scale 10 mm, B and D scale 2 mm, C and F scale 500 nm).
A. Lähde et al. / Atmospheric Environment 70 (2013) 18e2724
ash samples. The silicate grains are most likely a mixture of variousminerals as observed in situ measurements during Eyja eruption(Schumann et al., 2011). The results were consistent with the on-line measurement data obtained during the eruptions, as particlecomposition and morphology of the re-dispersed particles werevery similar to the results of field experiments. This indicates thatthe re-dispersed ash particles can be used to evaluate the lungdeposition of these particles.
3.3. Lung deposition of the aerosolized particles
Table 2 shows the lung deposited surface area concentrations(LDSA) of submicron ash particles (Dp < 1 mm) determined withNSAM and ELPI. The results correspond to tracheobronchial (TB)and alveolar (AL) regions of the lung at different experimental
conditions (scaled to PM10 value of 1 mg m�3). The LDSA concen-tration values indicate the total surface of the particles depositedinto the human lung regions per volume of inhaled air. The LDSAvalues of submicron particles increased with increasing dispersionflow rate from ca. 10e50 mm2 cm�3 for the AL region and from ca.3e10 mm2 cm�3 for the TB region. At higher flow rates relativelymore submicron particles were dispersed into the air and thusalso LSDA values were higher. However, the relative depositionsurface area values (%, i.e., LDSA values divided by the totalsurface area of the submicron particles) did not show increasewith increasing dispersion flow rates. This indicated thatsubmicron particles were equally dispersed into air. NSAM andELPI results are in relatively good agreement for TB region, seeTable 2. However, the LDSA values obtained for the AL regionwith NSAM were almost consistently smaller than the values
Table
2Su
rfacearea
concentrationsof
subm
icronparticles
(Dp<1mm)a
shparticles
aerosoliz
edat
differentfl
owrates.Th
elung-dep
osited
surfacearea
(LDSA
)co
ncentrationsweremea
suredwithNSA
Man
dcalculatedfrom
ELPI
resu
lts
usingtheICRPresp
iratorydep
ositionmod
elsforalve
olar
andtracheo
bron
chialreg
ions(A
sbachet
al.,20
09).To
facilitateco
mparison
s,theresu
ltswerescaled
toPM
10(D
p<
10mm)co
ncentrationof
1mgm
�3.P
ercents
(%)after
LDSA
values
arerelative
dep
ositionco
ncentrationsco
mpared
tototalsurfacearea
ofsu
bmicronparticles
(Stot,PM
1).Th
elast
columnsh
owstotalsurfacearea
ofPM
10particles
(Stot,PM
10).Su
bmicronparticles
wereon
lytake
ninto
theacco
untin
thelungdep
ositionresu
ltssince
apre-cyclonewithcu
tdiameter
of1mm
wereusedat
theinletof
NSA
M.
Volcano
Dispersion
flow
rate
[Lmin
�1]
LDSA
,NSA
M[ mm
2cm
�3]a
LDSA
,ELP
I[mm
2cm
�3]a
S tot[mm
2cm
�3]
Alveo
lar
Tracheo
bron
chial
Alveo
lar
Tracheo
bron
chial
PM1
PM10
Eyjafjallajöku
ll15
82.9%
3.5
1.3%
249.0%
4.2
1.6%
266
1558
2018
4.7%
4.2
1.1%
348.9%
6.0
1.6%
378
1773
3023
5.5%
5.1
1.2%
379.0%
6.7
1.6%
414
1792
Grímsvötn
1511
5.4%
2.8
1.4%
189.0%
3.0
1.6%
196
1485
2019
5.9%
4.3
1.4%
289.0%
4.9
1.6%
316
1772
3048
8.3%
9.6
1.7%
518.9%
8.9
1.6%
571
2232
aScaled
toPM
10co
ncentrationof
1mgm
�3.
A. Lähde et al. / Atmospheric Environment 70 (2013) 18e27 25
obtained with ELPI. This discrepancy is most likely caused by thedifferent measurement principles of NSAM and ELPI (Asbach et al.,2009; Keskinen et al., 1992).
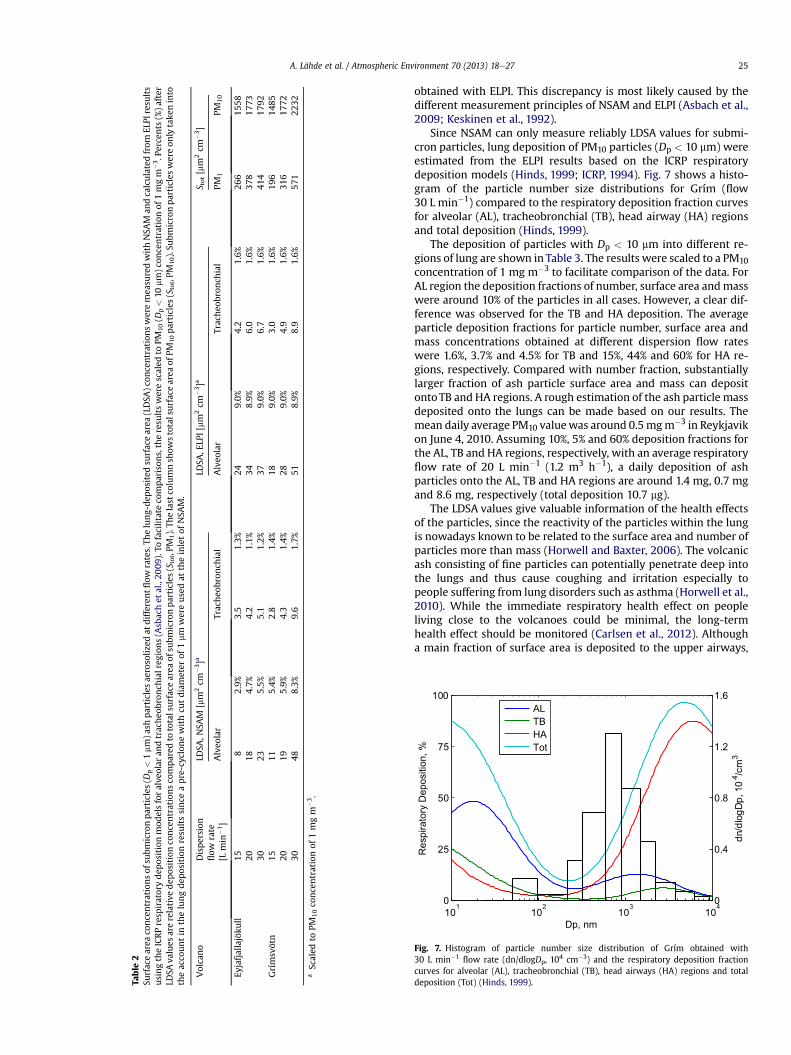
Since NSAM can only measure reliably LDSA values for submi-cron particles, lung deposition of PM10 particles (Dp < 10 mm) wereestimated from the ELPI results based on the ICRP respiratorydeposition models (Hinds, 1999; ICRP, 1994). Fig. 7 shows a histo-gram of the particle number size distributions for Grím (flow30 L min�1) compared to the respiratory deposition fraction curvesfor alveolar (AL), tracheobronchial (TB), head airway (HA) regionsand total deposition (Hinds, 1999).
The deposition of particles with Dp < 10 mm into different re-gions of lung are shown in Table 3. The results were scaled to a PM10concentration of 1 mg m�3 to facilitate comparison of the data. ForAL region the deposition fractions of number, surface area andmasswere around 10% of the particles in all cases. However, a clear dif-ference was observed for the TB and HA deposition. The averageparticle deposition fractions for particle number, surface area andmass concentrations obtained at different dispersion flow rateswere 1.6%, 3.7% and 4.5% for TB and 15%, 44% and 60% for HA re-gions, respectively. Compared with number fraction, substantiallylarger fraction of ash particle surface area and mass can depositontoTB and HA regions. A rough estimation of the ash particle massdeposited onto the lungs can be made based on our results. Themean daily average PM10 valuewas around 0.5mgm�3 in Reykjavikon June 4, 2010. Assuming 10%, 5% and 60% deposition fractions forthe AL, TB and HA regions, respectively, with an average respiratoryflow rate of 20 L min�1 (1.2 m3 h�1), a daily deposition of ashparticles onto the AL, TB and HA regions are around 1.4 mg, 0.7 mgand 8.6 mg, respectively (total deposition 10.7 mg).
The LDSA values give valuable information of the health effectsof the particles, since the reactivity of the particles within the lungis nowadays known to be related to the surface area and number ofparticles more than mass (Horwell and Baxter, 2006). The volcanicash consisting of fine particles can potentially penetrate deep intothe lungs and thus cause coughing and irritation especially topeople suffering from lung disorders such as asthma (Horwell et al.,2010). While the immediate respiratory health effect on peopleliving close to the volcanoes could be minimal, the long-termhealth effect should be monitored (Carlsen et al., 2012). Althougha main fraction of surface area is deposited to the upper airways,
0
25
50
75
100
Dp, nm
Res
pira
tory
Dep
ositi
on, %
101
102
103
1040
0.4
0.8
1.2
1.6
dn/d
logD
p, 1
04 /c
m3
ALTBHATot
Fig. 7. Histogram of particle number size distribution of Grím obtained with30 L min�1
flow rate (dn/dlogDp, 104 cm�3) and the respiratory deposition fractioncurves for alveolar (AL), tracheobronchial (TB), head airways (HA) regions and totaldeposition (Tot) (Hinds, 1999).

Table 3Total number (Ntot), surface (Stot) and PM1 mass concentrations of ash particles aerosolized at different dispersion flow rates. To facilitate comparisons, the results were scaledto PM10 concentration of 1 mg m�3. Relative alveolar (AL), tracheobronchial (TB), head airways (HA) regions and total deposition (Tot) for particle number, surface area (Surf.Area) and mass (PM10) concentrations calculated from ELPI results using the ICRP respiratory deposition models (Hinds, 1999). Particle size range is from ca. 15 nm to 10 mm.
Volcano Flow rate L min�1 Ntota # cm�3 Stot
a mm2 cm�3 PM1a mg m�3 Deposition,
number (%)Deposition, surf.Area (%)
Deposition,PM10 (%)
AL TB HA Tot AL TB HA Tot AL TB HA Tot
Eyjafjallajökull 15 6.6E þ 02 1.5E þ 03 0.09 9.1 1.6 15 26 10 3.9 48 62 9.0 4.5 65 7920 9.4E þ 02 1.7E þ 03 0.12 8.9 1.5 13 24 10 3.6 43 57 9.6 4.5 61 7530 1.1E þ 03 1.7E þ 03 0.12 9.0 1.5 12 23 10 3.6 43 56 9.5 4.4 61 75
Grímsvötn 15 4.7E þ 02 1.4E þ 03 0.07 9.3 1.8 19 30 10 4.1 50 65 9.1 4.6 66 8020 7.4E þ 02 1.7E þ 03 0.12 9.1 1.6 17 28 11 3.8 44 58 10 4.6 59 7430 1.3E þ 03 2.2E þ 03 0.20 8.8 1.4 15 25 11 3.2 36 50 11 4.2 50 65
Average 8.6E þ 02 1.7E þ 03 0.12 9.0 1.6 15 26 11 3.7 44 58 9.6 4.5 60 74
a Scaled to PM10 concentration of 1 mg m�3.
A. Lähde et al. / Atmospheric Environment 70 (2013) 18e2726
a significant amount of particles can deposit into the alveolar andtracheobronchial regions. In summary, roughly 3e9% and 1e2% ofthe total surface area of inhaled submicron ash particles wasobserved to deposit into AL and TB regions of the lungs, respec-tively. No significant differences between the ashes from Eyjafjal-lajökull and Grímsvötn were observed. However, the resultsindicate that a substantial increase in the concentration of respi-rable airborne ash particles and associated health hazard can takeplace if the deposited ash particles are re-suspended under dry,windy conditions or by outdoor human activity (Horwell andBaxter, 2006; Thorsteinsson et al., 2012).
4. Conclusions
We have analyzed and compared volcanic ash particles derivednear from Eyjafjallajökull (Eyja) and Grímsvötn (Grím) volcanoesduring their eruptions. The ash particles weremainly agglomeratedand irregular in shape. The Grím particles were larger and morefaceted than Eyja particles, which was likely to originate from thedifferent conditions during the particle formation. In both cases,the coarse particles were covered with smaller particles adhered totheir surface. Grímsvötn particles consisted of mostly basaltic glasswhile Eyjafjallajökull ash is dominated by andesitic glass. Thespecific surface area values of the ash particles were typical forrelatively large and non-porous particles. The composition, size,density and morphology of Eyja and Grím ash particles were dif-ferent, which affects re-dispersion, lung deposition and thus, tox-icological properties of the particles.
The aerosolization experiments of the ash samples showed thatboth volcanic ashes can be easily re-dispersed to the air. The geo-metric mean diameters of re-dispersed particles were below 1 mm.The results indicate that a substantial increase in concentration ofrespirable airborne ash particles can take place if the deposited ashparticles are re-suspended under dry, windy conditions or by out-door human activity. This can cause a potential health hazard. Theresults were consistent with the on-line measurement dataobtained during the eruptions of both Eyja and Grím. In addition,particle composition and morphology of re-dispersed particles wassimilar to field experiments results. This indicates that re-dispersedash particles can be used to evaluate lung depositions of volcanicash particles.
Measurements and calculations on lung deposited surface areaconcentrations indicated that roughly 3e9% and 1e2% of totalsurface area of submicron ash particles is able to deposit intoalveolar and tracheobronchial regions of lungs, respectively. Nosignificant difference between Eyja and Grím ashes was observed.Although, a main fraction of surface area is deposited to the headairways region, a significant amount of particles can be depositedinto alveolar and tracheobronchial regions. Based on the estimation
of mass deposition of ash particles into lungs, a daily dose is around1.4 mg, 0.7 mg and 8.6 mg for the alveolar, tracheobronchial andhead airways regions (total 10.7 mg), respectively, at PM10 concen-tration of 0.5 mg m�3 (respiratory flow rate of 20 L min�1). How-ever, the surface area of ash particle could be relevant measurewhen determining the potential risks of the inhaled particles sincenearly all the chemistry of the particles undergoes surfacereactions.
Acknowledgments
The authors thank Guðni Einarsson and Helgi Björnsson forcollecting ash from Grímsvötn at Kirkjubæjarklaustur. NordPlusPharmacy Exchange Program is thanked for supporting the col-laboration between the countries. We would also like to acknowl-edge the support by the strategic funding of the University ofEastern Finland under the project Novel nanostructured materialsfor pharmaceutical, biomedical and environmental applications.
References
Asbach, C., Fissan, H., Stahlmecke, B., Kuhlbusch, T.A.J., Pui, D.Y.H., 2009. Conceptuallimitations and extensions of lung-deposited Nanoparticle Surface Area Mon-itor (NSAM). Journal of Nanoparticle Research 11, 101e109.
Bodvarsdottir, A.R., Sigurdardottir, Á, October 18e19th, 2010. Air Quality in Rey-kjavik, Road Dust, Mitigating Measures and Health, A Conference on: Road Duste Health Effects and Abatement Strategies, Stockholm, Sweden.
Bukowiecki, N., Zieger, P., Weingartner, E., Juranyi, Z., Gysel, M., Neininger, B.,Schneider, B., Hueglin, C., Ulrich, A., Wichser, A., Henne, S., Brunner, D., Kaegi, R.,Schwikowski, M., Tobler, L., Wienhold, F.G., Engel, I., Buchmann, B., Peter, T.,Baltensperger, U., 2011. Ground-based and airborne in-situ measurements ofthe Eyjafjallajökull volcanic aerosol plume in Switzerland in spring 2010. At-mospheric Chemistry and Physics 11, 10011e10030.
Carlsen, H.K., Gislason, T., Benediktsdottir, B., Kolbeinsson, T.B., Hauksdottir, A.,Thorsteinsson, T., Briem, H., 2012. A survey of early health effects of theEyjafjallajökull 2010 eruption in Iceland: a population-based study. BMJ Open 2.
Colette, A., Favez, O., Meleux, F., Chiappini, L., Haeffelin, M., Morille, Y., Malherbe, L.,Papin, A., Bessagnet, B., Menut, L., Leoz, E., Rouil, L., 2011. Assessing in near realtime the impact of the April 2010 Eyjafjallajökull ash plume on air quality.Atmospheric Environment 45, 1217e1221.
Dockery, D.W., 2009. Health effects of particulate air pollution. Annals of Epi-demiology 19, 257e263.
Donovan, A.R., Oppenheimer, C., 2011. The 2010 Eyjafjallajökull eruption and thereconstruction of geography. Geographical Journal 177, 4e11.
Edmonds, J.W., Henslee, W.W., Guerra, R.E., 1977. Particle size effects in determi-nation of respirable a-quartz by X-ray diffraction. Analytical Chemistry 49,2196e2203.
Gislason, S.R., Alfredsson, H.A., Eiriksdottir, E.S., Hassenkam, T., Stipp, S.L.S., 2011a.Volcanic ash from the 2010 Eyjafjallajökull eruption. Applied Geochemistry 26,S188eS190.
Gislason, S.R., Hassenkam, T., Nedel, S., Bovet, N., Eiriksdottir, E.S., Alfredsson, H.A.,Hem, C.P., Balogh, Z.I., Dideriksen, K., Oskarsson, N., Sigfusson, B., Larsen, G.,Stipp, S.L.S., 2011b. Characterization of Eyjafjallajökull volcanic ash particles anda protocol for rapid risk assessment. Proceedings of the National Academy ofSciences of the United States of America 108, 7307e7312.
Graham, J.A., Miller, F.J., Davies, D.W., Hiteshew, M.E., Walsh, L.C., 1985. Inhalationstudies of Mt. St. Helens volcanic ash in animals. Environmental Research 37,61e71.

A. Lähde et al. / Atmospheric Environment 70 (2013) 18e27 27
Gudmundsson, M.T., Larsen, G., Hoskuldsson, A., Gylfason, A.G., 2008. Volcanichazards in Iceland. Jökull 58, 251e268.
Gudmundsson, M.T., Thordarson, T., Höskuldsson, A., Larsen, G., Björnsson, H.,Prata, F.J., Oddsson, B., Magnússon, E., Högnadóttir, T., Petersen, G.N.,Hayward, C.L., Stevenson, J.A., Jónsdóttir, I., 2012. Ash generation and distri-bution from the aprilemay 2010 eruption of Eyjafjallajökull, Iceland. ScientificReports 2.
Hinds, W.C., 1999. Aerosol Technology: Properties, Behavior and Measurement ofAirborne Particles, second ed. John Wiley & Sons, New York.
Horwell, C.J., Baxter, P.J., 2006. The respiratory health hazards of volcanic ash:a review for volcanic risk mitigation. Bulletin of Volcanology 69, 1e24.
Horwell, C.J., Baxter, P.J., Hillman, S.E., Damby, D.E., Delmelle, P., Donaldson, K.,Dunster, C., Calkins, J.A., Fubini, B., Hoskuldsson, A., Kelly, F.J., Larsen, G., LeBlond, J.S., Livi, K.J.T., Mendis, B., Murphy, F., Sweeney, S., Tetley, T.D.,Thordarson, T., Tomatis, M., 2010. Respiratory health hazard assessment of ashfrom the 2010 eruption of Eyjafjallajökull volcano, Iceland. In: A Summary ofInitial Findings from a Multi-centre Laboratory Study. The International Vol-canic Health Hazard Network Report.
ICRP, 1994. Human Respiratory Tract Model for Radiological Protection. In: ICRPPublication, vol. 66, Ann. ICRP 24 pp. 1e3.
Katsouyanni, K., Touloumi, G., Spix, C., Schwartz, J., Balducci, F., Medina, S., Rossi, G.,Wojtyniak, B., Sunyer, J., Bacharova, L., Schouten, J.P., Ponka, A., Anderson, H.R.,1997. Short term effects of ambient sulphur dioxide and particulate matter onmortality in 12 European cities: results from time series data from the APHEAproject. BMJ 314, 1658.
Kerminen, V.M., Niemi, J.V., Timonen, H., Aurela, M., Frey, A., Carbone, S.,Saarikoski, S., Teinilä, K., Hakkarainen, J., Tamminen, J., Vira, J., Prank, M.,Sofiev, M., Hillamo, R., 2011. Characterization of a volcanic ash episode insouthern Finland caused by the Grimsvötn eruption in Iceland in May 2011.Atmospheric Chemistry and Physics 11, 12227e12239.
Keskinen, J., Pietarinen, K., Lehtimäki, M., 1992. Electrical low pressure impactor.Journal of Aerosol Science 23, 353e360.
Lathem, T.L., Kumar, P., Nenes, A., Dufek, J., Sokolik, I.N., Trail, M., Russell, A., 2011.Hygroscopic properties of volcanic ash. Geophysical Research Letters 38.
Leskinen, J., Joutsensaari, J., Lyyränen, J., Koivisto, J., Ruusunen, J., Järvelä, M.,Tuomi, T., Hämeri, K., Auvinen, A., Jokiniemi, J., 2012. Comparison of nano-particle measurement instruments for occupational health applications. Journalof Nanoparticle Research 14, 1e16.
Lettino, A., Caggiano, R., Fiore, S., Macchiato, M., Sabia, S., Trippetta, S., 2012.Eyjafjallajökull volcanic ash in southern Italy. Atmospheric Environment 48,97e103.
Lyyränen, J., Backman, U., Tapper, U., Auvinen, A., Jokiniemi, J., 2009. A size selectivenanoparticle collection device based on diffusion and thermophoresis. Journalof Physics: Conference Series 170, 11.
Lyyränen, J., Jokiniemi, J., Kauppinen, E.I., Backman, U., Vesala, H., 2004. Comparisonof different dilution methods for measuring diesel particle emissions. AerosolScience and Technology 38, 12e23.
Löndahl, J., Massling, A., Pagels, J., Swietlicki, E., Vaclavik, E., Loft, S., 2007. Size-resolved respiratory-tract deposition of fine and ultrafine hydrophobic andhygroscopic aerosol particles during rest and exercise. Inhalation Toxicology 19,109e116.
O’Dowd, C., Ceburnis, D., Ovadnevaite, J., Martucci, G., Bialek, J., Monahan, C.,Berresheim, H., Vaishya, A., Grigas, T., Jennings, S.G., McVeigh, P., Varghese, S.,Flanagan, R., Martin, D., Moran, E., Lambkin, K., Semmler, T., Perrino, C.,McGrath, R., 2012. The Eyjafjallajökull ash plume e Part I: physical, chemicaland optical characteristics. Atmospheric Environment 48, 129e142.
Olsson, J., Stipp, S.L.S., Dalby, K.N., Gislason, S.R., 9e11 January, 2012. Surfaceproperties of the Grímsvötn 2011 volcanic ash, 30th Nordic geological WinterMeeting, Reykjavík, Iceland, p 138.
Petäjä, T., Laakso, L., Grönholm, T., Launiainen, S., Evele-Peltoniemi, I., Virkkula, A.,Leskinen, A., Backman, J., Manninen, H.E., Sipilä, M., Haapanala, S., Hämeri, K.,Vanhala, E., Tuomi, T., Paatero, J., Aurela, M., Hakola, H., Makkonen, U.,Hellén, H., Hillamo, R., Vira, J., Prank, M., Sofiev, M., Siitari-Kauppi, M.,Laaksonen, A., Lehtinen, K.E.J., Kulmala, M., Viisanen, Y., Kerminen, V.M., 2012.In-situ observations of Eyjafjallajökull ash particles by hot-air balloon. Atmo-spheric Environment 48, 104e112.
Pitz, M., Gu, J., Soentgen, J., Peters, A., Cyrys, J., 2011. Particle size distributionfactor as an indicator for the impact of the Eyjafjallajökull ash plume atground level in Augsburg, Germany. Atmospheric Chemistry and Physics 11,9367e9374.
Pope, C.A., Dockery, D.W., 2006. Health effects of fine particulate air pollution: linesthat connect. Journal of the Air & Waste Management Association 56, 709e742.
Prime, D., Atkins, P.J., Slater, A., Sumby, B., 1997. Review of dry powder inhalers.Advanced Drug Delivery Reviews 26, 51e58.
Schumann, U., Weinzierl, B., Reitebuch, O., Schlager, H., Minikin, A., Forster, C.,Baumann, R., Sailer, T., Graf, K., Mannstein, H., Voigt, C., Rahm, S., Simmet, R.,Scheibe, M., Lichtenstern, M., Stock, P., Rüba, H., Schäuble, D., Tafferner, A.,Rautenhaus, M., Gerz, T., Ziereis, H., Krautstrunk, M., Mallaun, C., Gayet, J.F.,Lieke, K., Kandler, K., Ebert, M., Weinbruch, S., Stohl, A., Gasteiger, J., Gross, S.,Freudenthaler, V., Wiegner, M., Ansmann, A., Tesche, M., Olafsson, H., Sturm, K.,2011. Airborne observations of the Eyjafjalla volcano ash cloud over Europeduring air space closure in April and May 2010. Atmospheric Chemistry andPhysics 11, 2245e2279.
Schäfer, K., Thomas, W., Peters, A., Ries, L., Obleitner, F., Schnelle-Kreis, J., Birmili, W.,Diemer, J., Fricke, W., Junkermann, W., Pitz, M., Emeis, S., Forkel, R., Suppan, P.,Flentje, H., Gilge, S., Wichmann, H.E., Meinhardt, F., Zimmermann, R.,Weinhold, K., Soentgen, J., Münkel, C., Freuer, C., Cyrys, J., 2011. Influences of the2010 Eyjafjallajökull volcanic plume on air quality in the northern Alpine re-gion. Atmospheric Chemistry and Physics 11, 8555e8575.
Shin, W.G., Pui, D.Y.H., Fissan, H., Neumann, S., Trampe, A., 2007. Calibration andnumerical simulation of nanoparticle surface area monitor (TSI model 3550NSAM). Journal of Nanoparticle Research 9, 61e69.
Staniforth, J., Aulton, M., 2007. Aulton’s Pharmaceutics e the Design and Manu-facture of Medicines, third ed. Churchill Livingstone/Elsevier.
Tesche, M., Glantz, P., Johansson, C., Norman, M., Hiebsch, A., Ansmann, A.,Althausen, D., Engelmann, R., Seifert, P., 2012. Volcanic ash over Scandinaviaoriginating from the Grímsvötn eruptions in May 2011. Journal of GeophysicalResearch-Atmospheres 117.
Thorsteinsson, T., Jóhannsson, T., Stohl, A., Kristiansen, N.I., 2012. High levels ofparticulate matter in Iceland due to direct ash emissions by the Eyjafjallajökulleruption and resuspension of deposited ash. Journal of Geophysical Research-Solid Earth 117.