Embed Size (px)
Citation preview
APPLIED AND ENVIRONMENTAL MICROBIOLOGY, Feb. 1978, p. 283-2890099-2240/78/0035-0283$02.00/0Copyright i 1978 American Society for Microbiology
Vol. 35, No. 2
Printed in U.S.A.
Isolation and Properties of Fecal Proteins and Fecal AlkalinePhosphatase from Germfree and Conventional Rats
MASATOSHI NAKANO,l YUKIKO SUMI,2 AND MASASUMI MIYAKAWAt
Departnent of Pathology,' Aichi Medical College, Nagakute, Aichi 480-11, and Institute for GermfreeAnimals,2 School ofMedicine, Nagoya University, Nagoya, Japan
Received for publication 27 July 1977
Fecal proteins from germfree and conventional rats were isolated. The proteinsfrom the two kinds of feces differed in molecular weight, judging from Sephadexgel filtration and sodium dodecyl sulfate-polyacrylamide gel electrophoresis. Theconventional feces contained a greater amount of high-molecular-weight and a
lesser amount of low-molecular-weight proteins than did the germnfree feces. Thefecal proteins of both kinds contained carbohydrates. Both feces containedconsiderable enzyme activity. The germfree feces contained extremely high activ-ity in alkaline phosphatase and leucine aminopeptidase. Both feces showed thesame level of trehalase activity. The conventional feces contairked higher levelsof activity of protease and acid phosphatase than did the germfree feces. Lactaseactivity was observed only in the conventional feces. The fecal elkaline phospha-tase resembled the intestinal enzyme in response to L-phenylalanine inhibitionand urea denaturation. From these results it was inferred that the gernfree fecescontained some of the intestinal proteins and that the conventional feces con-
tained bacterial proteins in addition to intestinal proteins.
Micorflora in the intestinal tract influence themorphology and metabolism of host cells andimprove the digestibility of diets (5, 31).A comparison of the nitrogen content in the
feces from germfree (GF) and conventional (CV)animals has been reported (18, 20, 32). GF ratsexcrete more total nitrogen than do the CV rats(18, 32). Yoshida et al. (32) reported that CVfeces contained more total amino acids per gramof nitrogen than did the GF feces. Hoskins andZamcheck (15) reported that GF feces containedmore carbohydrates and fewer proteins than didCV feces. Very little is known about the prop-erties of fecal proteins in GF and CV animals.As described above, contents of the fecal ni-
trogen in GF animals are different from those inCV animals. These differences might be due tothe microflora in the intestinal tract and/or tothe turnover rate of intestinal mucosal cells.Thus far, the origin of the fecal proteins has notbeen conclusively established. Therefore, we ex-amined the origin of the fecal proteins from GFand CV rats.This paper deals with the isolation and prop-
erties of fecal proteins from GF and CV rats.The origin of the fecal proteins is discussed.
t Present address: Laboratory of Germfree Life Research,Gifu-ken, Japan.
MATERIALS AND METHODSAnimals. Eight GF and ten CV rats (Wistar strain,
male, 200 + 10 days of age) were used. The GF ratswere kept in four cages inside one isolator, with com-partments, of the MS-66 type described by Miyakawa(21). The CV animals were kept in five cages. Theisolator and all CV cages were kept in a clean humid-ity-controlled room (23 ± 1°C) for all studies. All cagesprovided about 17 by 30 cm of floor space, and eachcage contained two animals. The microbiological testfor GF status was performed by the method ofWagner(29).
Diet. All GF and CV animals were kept on theautoclaved diet prepared as described by Miyakawa(21). The diet was sterilized at 121°C for 25 min.
Isolation of fecal proteins. Feces were collectedfrom both the GF and CV rats and frozen at -20°Cbefore being used. Each fecal sample was homogenizedin a Waring blender for 1 min with 10 volumes of 0.1M phosphate buffer (pH 7.0). The homogenate waspassed through a layer of gauze and centrifuged at10,000 x g for 10 min. Solid ammonium sulfate broughtto 0.9 saturation was added to the resulting superna-tant. After being stirred for 30 miin at 4°C, the super-natant was centrifuged at 12,000 x g for 20 min. Theprecipitate was dissolved in 50 mM phosphate buffer(pH 7.0) and dialyzed against the same buffer over-night. The dialyzed solution was centrifuged to removeinsoluble materials. The clear supernatant was desig-nated as crude protein fraction.
Gel filtration. Gel chromatography was carriedout on columns of Sephadex G-100 and G-200 andSephacryl S-200. A column (1.6 or 2.6 cm in internal
283
on May 24, 2018 by guest
http://aem.asm
.org/D
ownloaded from
284 NAKANO, SUMI, AND MIYAKAWA
diameter) was packed with swollen gel to a final heightof about 65 cm and equilibrated with 50mM phosphatebuffer (pH 7.0) or 0.1 M tris(hydroxymethyl)-aminomethane (Tris)-hydrochloride buffer (pH 7.2).The protein solution was applied to the column andthen eluted with the same buffer.
DEAE-celiulose column chromatography. Thecrude protein fraction was applied to a diethylamino-ethyl (DEAE)-cellulose column (2.5 by 30 cm) previ-ously equilibrated with 10 mM Tris-hydrochloridebuffer (pH 7.2). Elution was done with a linear gra-dient of from 0 to 1.0 M NaCl concentration in thesame buffer.Assay methods for enzyme activity. The activ-
ity of acid and alkaline phosphatase was assayed bythe methods of Tanaka and Akazawa (28), and Forst-ner et al. (11) with some modifications, respectively.Assay of the activity of leucine aminopeptidase (LA-Pase) and protease was based on the methods ofGoldbarg and Rutenberg (13) and Nakano and Asahi(23), respectively. Trehalase activity was assayed bythe method described previously (24). Lactase activitywas assayed in the same manner as trehalase, exceptthat lactose instead of trehalose was used as the sub-strate. The liberated glucose was determined by theTris-glucose oxidase method of Dahlqvist (4).
Analytical procedure. Polyacrylamide gel elec-trophoresis in the presence of sodium dodecyl sulfatewas performed in a 7.5% gel by the method of Weberand Osborn (30). The protein content was determinedby the method of Lowry et al. (19).
Sialidase treatment. Fecal proteins were treatedwith bacterial sialidase as described by Fairbanks etal. (8).
Chemicals. Glucose oxidase and sialidase were pur-chased from Sigma Chemical Co. and BoehringerMannheim Corp., respectively. Sephadex G-100 andG-200 and Sephacryl S-200 were products from Phar-macia Fine Chemicals, Inc. DEAE-cellulose was ob-tained from Brown Co.
RESULTSGel chromatography on Sephadex col-
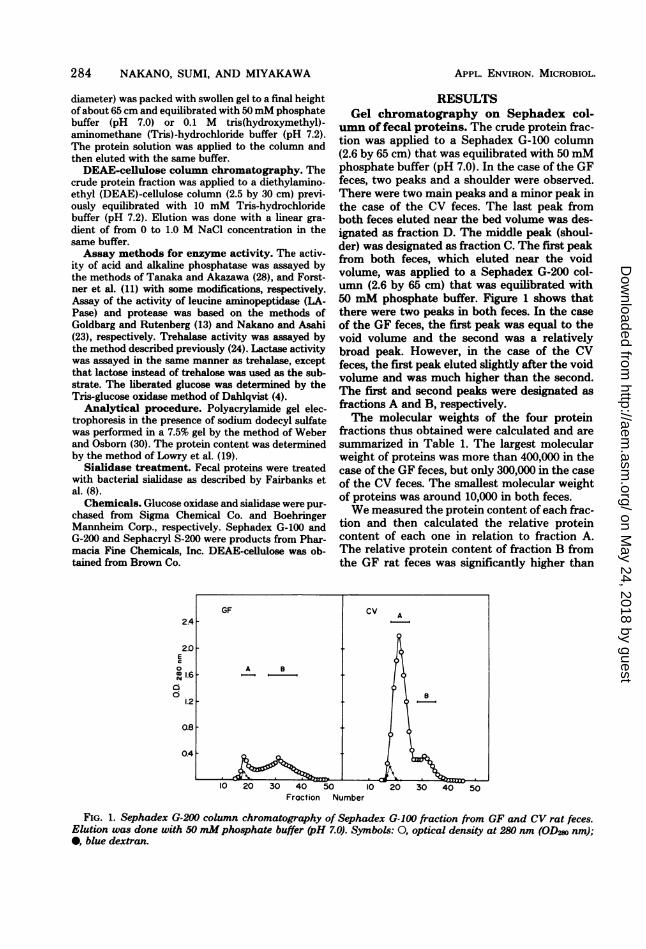
umn of fecal proteins. The crude protein frac-tion was applied to a Sephadex G-100 column(2.6 by 65 cm) that was equilibrated with 50 mMphosphate buffer (pH 7.0). In the case of the GFfeces, two peaks and a shoulder were observed.There were two main peaks and a minor peak inthe case of the CV feces. The last peak fromboth feces eluted near the bed volume was des-ignated as fraction D. The middle peak (shoul-der) was designated as fraction C. The first peakfrom both feces, which eluted near the voidvolume, was applied to a Sephadex G-200 col-umn (2.6 by 65 cm) that was equilibrated with50 mM phosphate buffer. Figure 1 shows thatthere were two peaks in both feces. In the caseof the GF feces, the first peak was equal to thevoid volume and the second was a relativelybroad peak. However, in the case of the CVfeces, the first peak eluted slightly after the voidvolume and was much higher than the second.The first and second peaks were designated asfractions A and B, respectively.The molecular weights of the four protein
fractions thus obtained were calculated and aresummarized in Table 1. The largest molecularweight of proteins was more than 400,000 in thecase of the GF feces, but only 300,000 in the caseof the CV feces. The smallest molecular weightof proteins was around 10,000 in both feces.We measured the protein content ofeach frac-
tion and then calculated the relative proteincontent of each one in relation to fraction A.The relative protein content of fraction B fromthe GF rat feces was significantly higher than
10 20 30 40 50 10 20 30 40 50Fraction Number
FIG. 1. Sephadex G-200 column chromatography of Sephadex G-100 fraction from GF and CV rat feces.Elution was done with 50 mMphosphate buffer (pH 7.0). Symbols: 0, optical density at 280 nm (OD2s nm);0, blue dextran.
APPL. ENVIRON. MICROBIOL.
on May 24, 2018 by guest
http://aem.asm
.org/D
ownloaded from
FECAL PROTEINS AND ALKALINE PHOSPHATASE
that from the CV rat feces. No significant differ-ence between the GF and CV feces was observedin other fractions.Sodium dodecyl sulfate-polyacrylamide
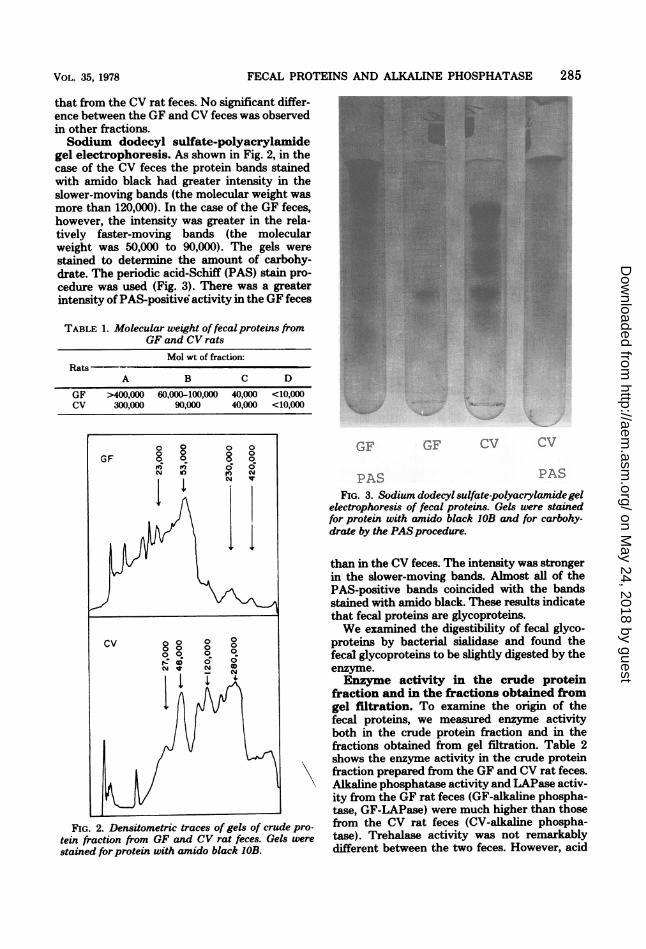
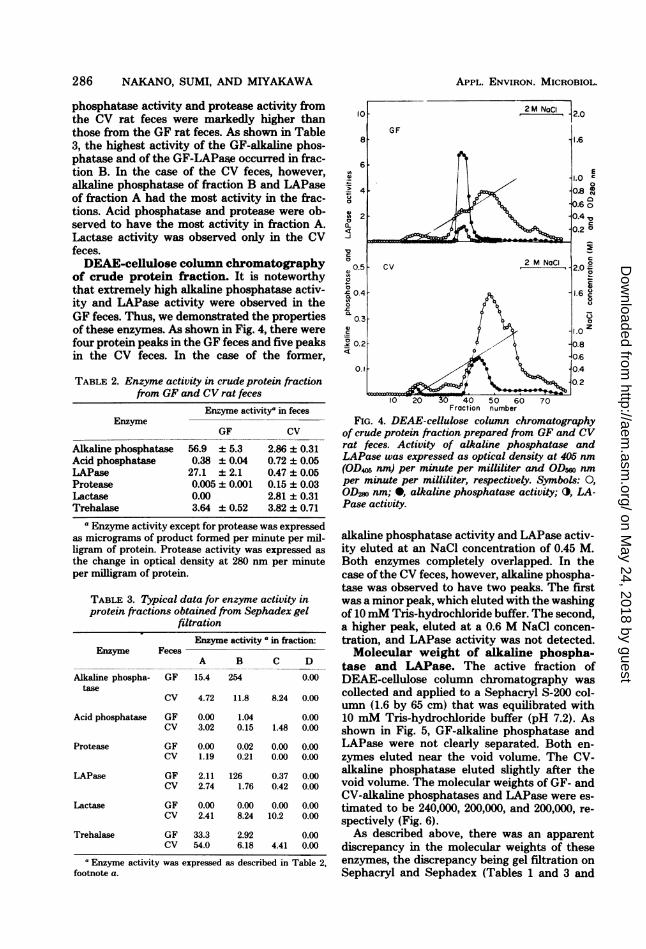
gel electrophoresis. As shown in Fig. 2, in thecase of the CV feces the protein bands stainedwith amido black had greater intensity in theslower-moving bands (the molecular weight wasmore than 120,000). In the case of the GF feces,however, the intensity was greater in the rela-tively faster-moving bands (the molecularweight was 50,000 to 90,000). The gels werestained to determine the amount of carbohy-drate. The periodic acid-Schiff (PAS) stain pro-cedure was used (Fig. 3). There was a greaterintensity of PAS-positive activity in the GF feces
TABLE 1. Molecular weight offecal proteins fromGF and CV rats
Mol wt of fraction:Rats
A B C D
GF >400,000 60,000-100,000 40,000 <10,000CV 300,000 90,000 40,000 <10,000
FIG. 2. Densitometric traces of gels of crude pro-tein fraction from GF and CV rat feces. Gels were
stained for protein with amido black IOB.
GF G;F CV CV
PAS PASFIG. 3. Sodium dodecyl sulfate-polyacrylamidegel
electrophoresis of fecal proteins. Gels were stainedfor protein with amido black 1OB and for carbohy-drate by the PAS procedure.
than in the CV feces. The intensity was strongerin the slower-moving bands. Almost all of thePAS-positive bands coincided with the bandsstained with amido black. These results indicatethat fecal proteins are glycoproteins.We examined the digestibility of fecal glyco-
proteins by bacterial sialidase and found thefecal glycoproteins to be slightly digested by theenzyme.Enzyme activity in the crude protein
fraction and in the fractions obtained fromgel filtration. To examine the origin of thefecal proteins, we measured enzyme activityboth in the crude protein fraction and in thefractions obtained from gel filtration. Table 2shows the enzyme activity in the crude proteinfraction prepared from the GF and CV rat feces.Alkaline phosphatase activity and LAPase activ-ity from the GF rat feces (GF-alkaline phospha-tase, GF-LAPase) were much higher than thosefrom the CV rat feces (CV-alkaline phospha-tase). Trehalase activity was not remarkablydifferent between the two feces. However, acid
285VOL. 35, 1978
on May 24, 2018 by guest
http://aem.asm
.org/D
ownloaded from
286 NAKANO, SUMI, AND MIYAKAWA
phosphatase activity and protease activity fromthe CV rat feces were markedly higher thanthose from the GF rat feces. As shown in Table3, the highest activity of the GF-alkaline phos-phatase and of the GF-LAPase occurred in frac-tion B. In the case of the CV feces, however,alkaline phosphatase of fraction B and LAPaseof fraction A had the most activity in the frac-tions. Acid phosphatase and protease were ob-served to have the most activity in fraction A.Lactase activity was observed only in the CVfeces.DEAE-cellulose column chromatography
of crude protein fraction. It is noteworthythat extremely high alkaline phosphatase activ-ity and LAPase activity were observed in theGF feces. Thus, we demonstrated the propertiesof these enzymes. As shown in Fig. 4, there werefour protein peaks in the GF feces and five peaksin the CV feces. In the case of the former,
TABLE 2. Enzyme activity in crude protein fractionfrom GF and CV rat feces
Enzyme activitya in fecesEnzyme
GF CV
Alkaline phosphatase 56.9 ± 5.3 2.86 ± 0.31Acid phosphatase 0.38 ± 0.04 0.72 ± 0.05LAPase 27.1 ± 2.1 0.47 ± 0.05Protease 0.005 ± 0.001 0.15 ± 0.03Lactase 0.00 2.81 ± 0.31Trehalase 3.64 ± 0.52 3.82 ± 0.71
a Enzyme activity except for protease was expressedas micrograms of product formed per minute per mil-ligram of protein. Protease activity was expressed asthe change in optical density at 280 nm per minuteper milligram of protein.
TABLE 3. Typical data for enzyme activity inprotein fractions obtained from Sephadex gel
filtrationEnzyme activity a in fraction:
Enzyme FecesA B C D
Alkaline phospha- GF 15.4 254 0.00tase
CV 4.72 11.8 8.24 0.00
Acid phosphatase GF 0.00 1.04 0.00CV 3.02 0.15 1.48 0.00
Protease GF 0.00 0.02 0.00 0.00CV 1.19 0.21 0.00 0.00
LAPase GF 2.11 126 0.37 0.00CV 2.74 1.76 0.42 0.00
Lactase GF 0.00 0.00 0.00 0.00CV 2.41 8.24 10.2 0.00
Trehalase GF 33.3 2.92 0.00CV 54.0 6.18 4.41 0.00
a Enzyme activity was expressed as described in Table 2,footnote a.
APPL. ENVIRON. MICROBIOL.
10
8
6
0'> 4
0 20
o.s
04
0m
-O0.2
0.1
1.6
E1.0
0
0.6 00.4 o
0.2 a
E2.0 °
0.1.6 c
0.4
0.2
0.40.2
GF
cv 2 M NaCI
SA
1020a 40 50 60 7010 2 0 40 50 60 70
Fraction number
FIG. 4. DEAE-cellulose column chromatographyof crude protein fraction prepared from GF and CVrat feces. Activity of alkaline phosphatase andLAPase was expressed as optical density at 405 nm(OD405 nm) per minute per milliliter and ODs5o nmper minute per milliliter, respectively. Symbols: 0,
OD280 nm; 0, alkaline phosphatase activity; 0, LA-Pase activity.
alkaline phosphatase activity and LAPase activ-ity eluted at an NaCl concentration of 0.45 M.Both enzymes completely overlapped. In thecase of the CV feces, however, alkaline phospha-tase was observed to have two peaks. The firstwas a minor peak, which eluted with the washingof 10mM Tris-hydrochloride buffer. The second,a higher peak, eluted at a 0.6 M NaCl concen-tration, and LAPase activity was not detected.Molecular weight of alkaline phospha-
tase and LAPase. The active fraction ofDEAE-cellulose column chromatography wascollected and applied to a Sephacryl S-200 col-umn (1.6 by 65 cm) that was equilibrated with10 mM Tris-hydrochloride buffer (pH 7.2). Asshown in Fig. 5, GF-alkaline phosphatase andLAPase were not clearly separated. Both en-
zymes eluted near the void volume. The CV-alkaline phosphatase eluted slightly after thevoid volume. The molecular weights of GF- andCV-alkaline phosphatases and LAPase were es-timated to be 240,000, 200,000, and 200,000, re-
spectively (Fig. 6).As described above, there was an apparent
discrepancy in the molecular weights of theseenzymes, the discrepancy being gel filtration onSephacryl and Sephadex (Tables 1 and 3 and
2 M NoCI 2.0
on May 24, 2018 by guest
http://aem.asm
.org/D
ownloaded from
FECAL PROTEINS AND ALKALINE PHOSPHATASE
1.0
O 0.80<)
a 0.62-
.0_.0
0
E 0.2
w
GF CV
0I0 3 1 0 3
I 0 20 30 1 0 20 30Fraction nurber
FIG. 5. Gel filtration on SephacrylS-200 ofDEAE-cellulose fraction. Enzyme activity was expressed as
described in the legend to Fig. 4. Symbols: 0, opticaldensity at 280 nm; 0, alkaline phosphatase activity;O, LAPase activity.
2.4
2.2
V./Vo2.0
1.8
1.6
I.4
1.2
2 3 5 10 20 30Molecular weight (x 104)
FIG. 6. Estimation of molecular weight of fecalalkaline phosphatase and LAPase on Sephacryl S-200 gel filtration. The following proteins were usedas marker proteins: (1) chymotrypsinogen, (2), oval-bumin, (3) bovine serum albumin, (4) unmunogloblinG, and (5) glucose oxidase.
Fig. 6). Thus, to make sure of this discrepancy,the DEAE-cellulose fraction was applied to a
Sephadex G-100 column (1.6 by 65 cm) that wasequilibrated with 10 mM Tris-hydrochloridebuffer (pH 7.2). As shown in Fig. 7, both GF-and CV-alkaline phosphatases were elutedshortly after the void volume. The molecularweight of these enzymes was calculated to beabout 80,000 on a calibration curve.Heat stability of fecal alkaline phospha-
tase and LAPase. Figure 8 shows the heatstability of the activity in the GF- and CV-al-kaline phosphatases and in the GF-LAPase. The
inactivation rate for the alkaline phosphataseactivity was faster than that for the LAPaseactivity. The GF-alkaline phosphatase was morelabile than the CV-alkaline phosphatase in re-
sponse to heat denaturation.Inhibitors and activators. As shown in Ta-
ble 4, both the GF- and CV-alkaline phospha-tases were inhibited about 70% by 5 mM L-
-
8
4-
0
L)
10
0
E
w
I 0 20 30Fraction number
FIG. 7. Gel filtration on Sephadex G-100(ofDEAE-cellulose fraction from GFand CVrat feces. Symbols:0, optical density at 280 nm; *, alkalinephosphataseactivity; ------ blue dextran.
00
80-
60-
o' 40-
S
E 20-
0 10 20 30 40 50 60
Incubation time at 600 (min)
FIG. 8. Heat stability of fecal alkaline phospha-tase activity and LAPase activity. Symbols: 0, GF-alkaline phosphatase activity; 0, CV-alkaline phos-phatase activity; 0, LAPase activity. The enzymefraction used was DEAE.
l 2
\Q3
5I GF-LAPase CV-alk. Pose
GF-alk. PoseI. ...........,I\
VOL. 35, 1978 287
on May 24, 2018 by guest
http://aem.asm
.org/D
ownloaded from
288 NAKANO, SUMI, AND MIYAKAWA
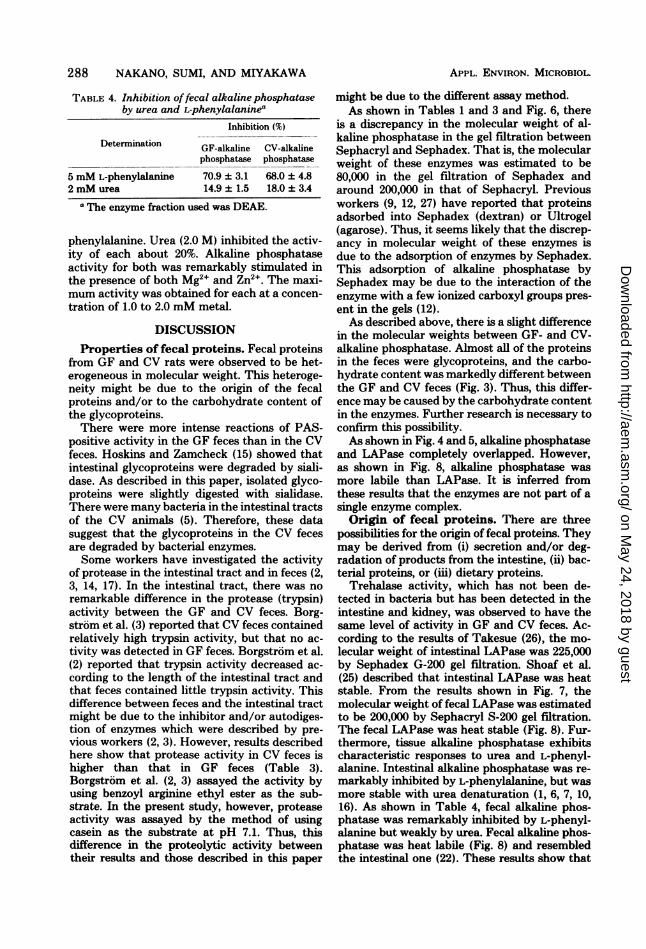
TABLE 4. Inhibition offecal alkaline phosphataseby urea and L-phenylalaninea
Inhibition (%)
Determination GF-alkaline CV-alkalinephosphatase phosphatase
5 mM L-phenylalanline 70.9 :± 3.1 68.0 ± 4.82 mM urea 14.9 + 1.5 18.0 ± 3.4
a The enzyme fraction used was DEAE.
phenylalanine. Urea (2.0 M) inhibited the activ-ity of each about 20%. Alkaline phosphataseactivity for both was remarkably stimulated inthe presence of both Mg2" and Zn2+. The maxi-mum activity was obtained for each at a concen-
tration of 1.0 to 2.0 mM metal.
DISCUSSIONProperties of fecal proteins. Fecal proteins
from GF and CV rats were observed to be het-erogeneous in molecular weight. This heteroge-neity might be due to the origin of the fecalproteins and/or to the carbohydrate content ofthe glycoproteins.There were more intense reactions of PAS-
positive activity in the GF feces than in the CVfeces. Hoskins and Zamcheck (15) showed thatintestinal glycoproteins were degraded by siali-dase. As described in this paper, isolated glyco-proteins were slightly digested with sialidase.There were many bacteria in the intestinal tractsof the CV animals (5). Therefore, these datasuggest that the glycoproteins in the CV fecesare degraded by bacterial enzymes.Some workers have investigated the activity
of protease in the intestinal tract and in feces (2,3, 14, 17). In the intestinal tract, there was no
remarkable difference in the protease (trypsin)activity between the GF and CV feces. Borg-strom et al. (3) reported that CV feces containedrelatively high trypsin activity, but that no ac-tivity was detected in GF feces. Borgstrom et al.(2) reported that trypsin activity decreased ac-
cording to the length of the intestinal tract andthat feces contained little trypsin activity. Thisdifference between feces and the intestinal tractmight be due to the inhibitor and/or autodiges-tion of enzymes which were described by pre-
vious workers (2, 3). However, results describedhere show that protease activity in CV feces ishigher than that in GF feces (Table 3).Borgstrom et al. (2, 3) assayed the activity byusing benzoyl arginine ethyl ester as the sub-strate. In the present study, however, proteaseactivity was assayed by the method of usingcasein as the substrate at pH 7.1. Thus, thisdifference in the proteolytic activity betweentheir results and those described in this paper
APPL. ENVIRON. MICROBIOL.
might be due to the different assay method.As shown in Tables 1 and 3 and Fig. 6, there
is a discrepancy in the molecular weight of al-kaline phosphatase in the gel filtration betweenSephacryl and Sephadex. That is, the molecularweight of these enzymes was estimated to be80,000 in the gel filtration of Sephadex andaround 200,000 in that of Sephacryl. Previousworkers (9, 12, 27) have reported that proteinsadsorbed into Sephadex (dextran) or Ultrogel(agarose). Thus, it seems likely that the discrep-ancy in molecular weight of these enzymes isdue to the adsorption of enzymes by Sephadex.This adsorption of alkaline phosphatase bySephadex may be due to the interaction of theenzyme with a few ionized carboxyl groups pres-ent in the gels (12).As described above, there is a slight difference
in the molecular weights between GF- and CV-alkaline phosphatase. Almost all of the proteinsin the feces were glycoproteins, and the carbo-hydrate content was markedly different betweenthe GF and CV feces (Fig. 3). Thus, this differ-ence may be caused by the carbohydrate contentin the enzymes. Further research is necessary toconfirm this possibility.As shown in Fig. 4 and 5, alkaline phosphatase
and LAPase completely overlapped. However,as shown in Fig. 8, alkaline phosphatase wasmore labile than LAPase. It is inferred fromthese results that the enzymes are not part of asingle enzyme complex.Origin of fecal proteins. There are three
possibilities for the origin of fecal proteins. Theymay be derived from (i) secretion and/or deg-radation of products from the intestine, (ii) bac-terial proteins, or (iii) dietary proteins.
Trehalase activity, which has not been de-tected in bacteria but has been detected in theintestine and kidney, was observed to have thesame level of activity in GF and CV feces. Ac-cording to the results of Takesue (26), the mo-lecular weight of intestinal LAPase was 225,000by Sephadex G-200 gel filtration. Shoaf et al.(25) described that intestinal LAPase was heatstable. From the results shown in Fig. 7, themolecular weight of fecal LAPase was estimatedto be 200,000 by Sephacryl S-200 gel filtration.The fecal LAPase was heat stable (Fig. 8). Fur-thermore, tissue alkaline phosphatase exhibitscharacteristic responses to urea and L-phenyl-alanine. Intestinal alkaline phosphatase was re-markably inhibited by L-phenylalanine, but wasmore stable with urea denaturation (1, 6, 7, 10,16). As shown in Table 4, fecal alkaline phos-phatase was remarkably inhibited by L-phenyl-alanine but weakly by urea. Fecal alkaline phos-phatase was heat labile (Fig. 8) and resembledthe intestinal one (22). These results show that
on May 24, 2018 by guest
http://aem.asm
.org/D
ownloaded from
FECAL PROTEINS AND ALKALINE PHOSPHATASE
fecal alkaline phosphatase and LAPase are sim-ilar to those in the intestines. Thus, from theabove data it is inferred that fecal proteins con-tain the secretion and/or degradation productsfrom the intestine.
Lactase activity was observed only in CVfeces. The activity of protease and acid phos-phatase in CV feces was higher than that in GFfeces. Bacteria contain fi-glucosidase (lactase),protease, and acid phosphatase. These resultssuggest that the relatively high activity of theseenzymes in CV feces is caused by bacterial en-zymes. Therefore, it may be inferred from theseresults that some of the proteins in CV feces arederived from bacterial proteins in addition tointestinal proteins.Because all diets were autoclaved, no enzyme
activity could be detected in the diets. As shownin Table 3, in proteins with a low molecularweight (fraction D), no enzyme activity was de-tected. Some of the low-molecular-weight pro-teins may be drived from dietary proteins.
Further research is necessary to confirm theorigin of fecal proteins.
LITERATURE CITED1. Bahr, M., and J. H. Wilkinson. 1967. Urea as a selective
inhibitor of human tissue alkaline phosphatase. Clin.Chim. Acta 17:367-370.
2. Borgstrom, B., A. Dahlqvist, B. E. Gustafsson, G.Landh, and J. Malmquist. 1959. Trypsin, invertase,and amylase content of feces of germfree rats. Proc.Soc. Exp. Biol. Med.102:154-155.
3. Borgstr6m, B., A. Dahlqvist, B. E. Gustafsson, andJ. Sjovall. 1957. Studies of intestinal digestion andabsorption in the human. J. Clin. Invest. 36:1521-1536.
4. Dahlqvist, A. 1964. Method for assay of intestinal disac-charidase. Anal. Biochem. 7:18-25.
5. Donaldson, R. M. 1964. Normal bacterial populations ofthe intestine and their relation to intestinal function. N.Engl. J. Med. 270:994-1000.
6. Dyck, W. P., F. F. Hall, and C. R. Ratliff. 1973. Hor-monal control of intestinal alkaline phosphatase secre-tion in the dog. Gastroenterology 65:445-450.
7. Dyck, W. P., G. A. Martin, and C. R. Ratliff. 1973.Influence of secretion and cholecystokinin on intestinalalkaline phophatase secretion. Gastroenterology64:599-602.
8. FaIrbanks, G., T. L Steck, and D. F. H. Wallach. 1971.Electrophoretic analysis of the major polypeptides ofthe human erythrocyte membrane. Biochemistry10:2606-2616.
9. Fernandez-Souza, J. M., and R. Rodriquez. 1977. Ly-sozyme-agarose interaction. Biochem. Biophys. Res.Commun. 74:1426-1431.
10. Fshman, W. EL, S. Green, and N. Inglis. 1963. L-phenylalanine: an organ specific, stereospecific inhibitorofhuman intestinal alkaine phosphatase. Nature (Lon-don) 198:685-686.
11. Forstner, G. G., S. ML Sabesin, and K. J. Iseelbacher.1968. Rat intestinal microvillus membranes. Purifica-tion and biochemical characterization. Biochem. J.106:381-390.
12. Gelotte, B. 1960. Studies on gel filtration. Sorption prop-erties of the bed material Sephadex. J. Chromatogr.3:330-342.
13. Goldbarg, J. A., and A. M. Rutenberg. 1958. Thecolorimetric determination of leucine aminopeptidasein urine and serum of normal subjects and patients withcancer and other dieseases. Cancer 11:283-291.
14. Grossman, M. I. 1962. Fecal enzymes of dogs with pan-creatic exclusion. Proc. Soc. Exp. Biol. Med. 110:41-42.
15. Hoskins, L. C., and N. Zamcheck. 1968. Bacterial deg-radation of gastrointestinal mucins. I. Comparison ofmucus constituents in the stools of germfree and con-ventional rats. Gastroenterology 54:210-217.
16. Kaplan, M. M. 1972. Alkaline phosphatase. Gastroenter-ology 62:452-468.
17. Lepkovsky, S., M. Wagner, F. Furuta, K. Ozone, andT. Koike. 1964. The protease, amylase, and lipase ofintestinal contents of germfree and conventional chick-ens. Poult. Sci. 43:722-726.
18. Levenson, S. M., and B. Tennant. 1963. Contributionsof intestinal microflora to the nutrition of the hostanimal. Fed. Proc. 22:109-119.
19. Lowry, 0. H., N. J. Rosebrough, A. L Farr, and R. J.Randall. 1951. Protein measurement with the Folinphenol reagent. J. Biol. Chem. 193:265-275.
20. Luckey, T. D., J. R. Pleasants, W. Wagner, H. A.Gordon, and J. A. Reyniers. 1955. Some observationson vitamin metabolism in germfree rats. J. Nutr.57:169-182.
21. Miyakawa, M. 1967. Studies of rearing germfree rats, p.48-62. In M. Miyakawa and T. D. Luckey (ed.), Ad-vances in germfree research and gnotobiology. CRCPress, Cleveland.
22. Monod, A., J.-P. Bonjour, and H. Fleisch. 1972. Rela-tion between alkaline phosphatase and Ca2+-ATPase incalcium transport. Nature (London) New Biol.240:126-127.
23. Nakano, M., and T. Asahi. 1972. Subcellular distributionof hydrolase in germinating pea cotyledons. Plant CellPhysiol. 13:101-110.
24. Nakano, M., Y. Sumi, and M. Miyakawa. 1977. Purifi-cation and properties of trehalase from rat intestinalmucosal cells. J. Biochem. (Tokyo) 81:1041-1049.
25. Shoaf, C. R., R. M. Berko, and W. D. Heizer. 1976.Isolation and characterization of four peptide hydro-lases from the brush border of rat intestinal mucosa.Biochim. Biophys. Acta 445:694-719.
26. Takesue, Y. 1975. Purification and properties of leucine,8-naphthylamidase from rabbit small-intestinal mu-cosal cells. J. Biochem. (Tokyo) 77:103-115.
27. Takesue, Y., and T. Kashiwagi. 1969. Solubilizationand behavior toward Sephadex of rabbit intestinal su-crase. J. Biochem. (Tokyo) 65:427-434.
28. Tanaka, Y., and T. Akazawa. 1969. Adsorption of sol-uble starch synthetase from spinach leaf with amylose.J. Jpn. Soc. Starch Sci. 17:229-236.
29. Wagner, M. 1959. Determination of germfree status. Ann.N.Y. Acad. Sci. 78:89-101.
30. Weber, K., and M. Osborn. 1969. The relative mobilityof molecular weight determinations by dodecyl sulfate-polyacrylamide gel electrophoresis. J. Biol. Chem.244:4406-4412.
31. Yoshida, T., J. R. Pleasants, B. S. Reddy, and B. S.Wostmann. 1968. Efficiency of digestion in germfreeconventional rabbits. Br. J. Nutr. 22:723-737.
32. Yoshida, T., J. R. Pleasants, B. S. Reddy, and B. S.Wostmann. 1971. Amino acid composition of cecalcontents and feces in germfree and conventional rabbits.J. Nutr. 101:1423-1430.
VOL. 35, 1978 289
on May 24, 2018 by guest
http://aem.asm
.org/D
ownloaded from


![Sodium Dodecyl Sulfate-PolyacrylAmide gel Electrophoresis [SDS-PAGE] Experiment 7 BCH 333[practical]](https://img.pdfslide.us/doc/110x75/5a4d1acb7f8b9ab05996f6d2/sodium-dodecyl-sulfate-polyacrylamide-gel-electrophoresis-sds-page-experiment.jpg)