Embed Size (px)
Citation preview

Ing
PaSha Cb M
Sou
Economics and Human Biology 11 (2013) 502–514
A
Art
Re
Re
Ac
Av
Ke
He
Ad
Bo
Ne
So
§
Cre
wh
an*
De
ou
Te
w.
(N
(S.1
UK
15
htt
urban South Africa, 16 year old adolescents experiencereater health equality than children§
ula L. Griffiths a,b,*, William Johnson a,1, Noel Cameron a,b, John M. Pettifor b,ane A. Norris b
entre for Global Health and Human Development, School of Sport, Exercise and Health Sciences, Loughborough University, UK
RC/Wits Developmental Pathways for Health Research Unit, Faculty of Health Sciences, University of the Witwatersrand, Johannesburg,
th Africa
1. Introduction
Despite the strong established link between socio-economic status (SES) and health outcomes across the life-course (Marmot, 2005), the evidence for a social gradient inadolescent health outcomes is less consistent (West,1997). Based on evidence from developed countries, West(1997) suggests that adolescence may be a period in whichhealth inequalities (defined by SES) may become moreequal. He suggests that severe chronic diseases are theexception to this rule because they have their origins inearly life when inequalities are stronger.
Adolescence is defined as the period of somatic,psychological, social, and sexual development that occursin the 5–10 years after the onset of the adolescent growthspurt in height/and or weight and the maturation of the
R T I C L E I N F O
icle history:
ceived 8 October 2012
ceived in revised form 9 May 2013
cepted 9 May 2013
ailable online 6 June 2013
ywords:
alth inequalities
olescence
dy composition
ighbourhood
uth Africa
A B S T R A C T
Despite the strongly established link between socio-economic status (SES) and health
across most stages of the life-course, the evidence for a socio-economic gradient in
adolescent health outcomes is less consistent. This paper examines associations between
household, school, and neighbourhood SES measures with body composition outcomes in
16 year old South African Black urban adolescents from the 1990 born Birth to Twenty
(Bt20) cohort. Multivariable regression analyses were applied to data from a sub-sample of
the Bt20 cohort (n = 346, 53% male) with measures taken at birth and 16 years of age to
establish socio-economic, biological, and demographic predictors of fat mass, lean mass,
and body mass index (BMI). Results were compared with earlier published evidence of
health inequality at ages 9–10 years in Bt20. Consistent predictors of higher fat mass and
BMI in fully adjusted models were being female, born post term, having a mother with post
secondary school education, and having an obese mother. Most measures of SES were only
weakly associated with body composition, with an inconsistent direction of association.
This is in contrast to earlier findings with Bt20 9–10 year olds where SES inequalities in
body composition were observed. Findings suggest targeting obesity interventions at
females in households where a mother has a high BMI.
� 2013 The Authors. Published by Elsevier B.V. All rights reserved.
This is an open-access article distributed under the terms of the
ative Commons Attribution-NonCommercial-ShareAlike License,
ich permits non-commercial use, distribution, and reproduction in
y medium, provided the original author and source are credited. Corresponding author at: Centre for Global Health and Human
velopment, School of Sport, Exercise and Health Sciences, Loughbor-
gh University, Loughborough, Leicestershire LE11 3TU, UK.
l.: +44 01509 228 159; fax: +44 01509 223 940.
E-mail addresses: [email protected] (P.L. Griffiths),
[email protected] (W. Johnson), [email protected]
. Cameron), [email protected] (J.M. Pettifor), [email protected]
A. Norris).
Present address: MRC Unit for Lifelong Health and Ageing, London,
.
Contents lists available at SciVerse ScienceDirect
Economics and Human Biology
jou r nal h o mep age: h t t p: / /w ww.els evier . co m/lo c ate /eh b
70-677X/$ – see front matter � 2013 The Authors. Published by Elsevier B.V. All rights reserved.
p://dx.doi.org/10.1016/j.ehb.2013.05.004

hcaeainwinsheinhngininaimbgaththmCobau1thSoth
r(Hmthrrbafrab(SeadapprhnmodS
P.L. Griffiths et al. / Economics and Human Biology 11 (2013) 502–514 503
ypothalamic-pituitary-gonadal axis. These biologicalhanges are accompanied by increasing engagement indult social and sexual activities (Bogin, 2013). Thexplanation for more equality in health outcomes indolescence has been related to this increasing engagement
adult social activities using a sociological framework,hereby peer or youth culture or sub-culture and schoolfluences become more important during the secondary
chool years of adolescent life compared to social class orousehold SES (West, 1997). This suggests that the SESnvironment external to the household becomes increas-gly more important as adolescents spend less time in the
ome and more time with peers in the school andeighbourhood environments. This is a logical explanationiven that adolescence marks the onset of increasingdependence from the family, with more time being spent the community (Allison et al., 1999). Further, West (1997)
rgues that the school and peer environment could be moreportant than even the neighbourhood SES environment
ecause adolescents tend to identify more with their peerroup culture than with other external forces such asspects of the household and neighbourhood not relevant toat culture. This means that assessing relevant measures ofe school, neighbourhood, and peer environment becomeore important for assessing inequalities in adolescence.
ritics of West’s hypothesis argue that more equal healthutcomes in adolescence may be an artefact of the dataecause, for instance, studies use poor measures ofdolescent SES (e.g. adult occupation measures have beensed as proxies for adolescent SES) (Judge and Benzeval,993) and/or use self-report health outcomes, which mayemselves be influenced by an individual’s SES (Davey
mith et al., 1994). Poorly measured SES and/or healthutcome variables have the potential to mask SES effectsat may otherwise exist.Recently, a number of review studies have explored the
elationship between SES and adolescent health outcomesolstein et al., 2009; Starfield et al., 2002) and foundixed evidence for a relationship, although the balance ofe evidence is more strongly towards inequalities existing
ather than not existing. More specifically focussing on theelationship between SES and obesity/adiposity, a reviewy Shrewsbury and Wardle (2008) of 45 child anddolescent studies (9 of which include only adolescents)om developed countries between 1990 and 2005 foundn inverse association in 6 out of 9 studies for adolescentoys and 1 out of the 9 adolescent studies for girlshrewsbury and Wardle, 2008). Thus, this provides mixed
vidence for a link between SES and obesity/adiposity indolescence. A separate review paper of 15 studies fromeveloped countries (7 adolescent) specifically studied thessociation between overweight/obesity and factors in thehysical environment, such as built environment andopulation density (Holstein et al., 2009). Whilst thiseview found evidence of associations between neighbour-ood environments and overweight/obesity in childhood,o such relationship was observed for adolescents. There isuch less evidence examining inequalities in adolescent
besity within developing country contexts than ineveloped countries. The limited existing evidence relatingES to adolescent obesity in South Africa suggests no
association or a weak link in boys at the household level(Kruger et al., 2006) and no evidence exists to test theassociation at the neighbourhood or school level.
Previous researchers studying the link between SES andhealth outcomes in adolescents have called for a need touse more longitudinal approaches in order to establishhow inequalities might develop or become more equalover the early life-course (Starfield et al., 2002). The Bt20cohort provides a unique opportunity to test West’shypothesis and to study adolescent inequalities in bodycomposition outcomes taking into account the early lifecourse in a transitioning economy because inequalitieshave already been studied in childhood. It is thereforepossible to compare findings from the earlier childhoodanalysis with analyses that focus on the adolescent years inthe cohort. This earlier childhood work with the Bt20cohort revealed a positive association between householdSES measures taken in infancy and later childhood (ages 9–10 years) with body composition outcomes at ages 9–10years (Griffiths et al., 2008). The findings showed that theinfancy SES environment was more strongly associatedwith lean mass than fat mass and that age 9–10 yearhousehold SES measures were more strongly associatedwith fat mass than lean mass. At ages 9–10 years, there wasa low prevalence of overweight and obesity in Bt20, with ahigher prevalence of malnutrition, thus indicating that thehigh SES children were advantaged.
The Bt20 cohort were born in 1990, the year thatNelson Mandela was released from prison. In the fourdecades preceding Mandela’s release, the combinedimpact of Apartheid and the economic sanctions placedon the South African government by the internationalcommunity led to extreme inequality (Cameron, 2003). Bythe late 1990s, inequality in South Africa remained onlysecond to Brazil (May, 2000). Despite these high levels ofinequality, South Africa is currently one of the moredeveloped countries in sub-Saharan Africa (UNDP, 2011)with a higher prevalence of chronic disease than mostother sub-Saharan African countries. For instance, WorldHealth Organisation (WHO, 2011) data show that it rankssecond in sub-Saharan Africa for its male and femaleadulthood (aged 15+) prevalence of combined overweightand obesity (68.5% females and 41.3% males with aBMI > 25 kg/m2) (WHO, 2011).
The Bt20 cohort present a unique opportunity to testWest’s hypothesis within a developing country contextbecause of the comprehensive set of SES measures at thehousehold, neighbourhood, and school level, whichaddress some of the earlier concerns of critics of West’sargument about the lack of robust measures of SES. Thesedata also offer the opportunity to test West’s idea thataspects of the school SES environment might morestrongly measure inequalities at this age than moretraditional neighbourhood SES measures. Using objec-tively measured outcomes of body mass, lean mass, andfat mass also overcomes earlier problems of adolescentstudies using self report health outcomes. The period ofadolescence studied in this paper is limited to age 16years, which is when participant body composition andcommunity SES assessments were undertaken in thecohort. To test West’s hypothesis in an urban South

Afbeincoco
2.
2.1
32re(RsalohearAfnogrannecoBlhorain
ofprfocaceas
2.2
mthDeMhoducocha rmwstuhotorerehotoSoinwin
P.L. Griffiths et al. / Economics and Human Biology 11 (2013) 502–514504
rican context, this paper will examine the associationtween household/neighbourhood/school SES measures
infancy/at age 16 years and body composition out-mes at age 16 years controlling for a range of potentiallynfounding factors.
Materials and methods
. Participants
Birth to Twenty (Bt20) is a longitudinal cohort study of73 singleton births occurring in 1990 to permanentlysident mothers in Johannesburg–Soweto, South Africaichter et al., 2004, 2007). At ages 9–10 years, a sub-mple from the cohort (n = 429) was enrolled into angitudinal study assessing factors influencing bonealth and body composition. Because the sub-cohorte predominantly African Black this paper focuses on therican Black group because the African White group weret present in sufficient numbers to analyse as a separateoup. Bone health participants had more detailed healthd SES assessments than the Bt20 cohort. For instanceighbourhood and school measures of SES were notllected on the main cohort at age 16 years. Those Africanack participants with data on household/neighbour-od/school SES and anthropometric and dual-energy X-y absorptiometry (DXA) data at 16 years were included
current analyses (n = 346, 53% male).Ethical approval was granted by the ethics committees
the University of the Witwatersrand, South Africa for theimary data collection and Loughborough University, UKr the secondary analyses of the data. The primaryregiver gave written informed consent for their adoles-nt to participate and the adolescent provided writtencent to participate at 16 years.
. Socio-economic status measures
During infancy and at age 16 years household SESeasures were caregiver assessed using a questionnaireat was based on standard measures used by themographic and Health Surveys (www.measuredhs.com).
easures included caregiver’s education and occupation,me ownership and type, and household consumerrable ownership. These are measures that have beenmmonly used to assess the association between SES andild health or fertility in developing countries according toeview of 67 studies (Bollen et al., 2001). In addition to theost commonly used measures of SES, marital status andater and sanitation provision were also tested in this
dy. Those not marrying or cohabiting are likely to live inuseholds that have less adults and which are more likely
be female headed. Having less adults in the householdsults in a higher dependency ratio and potentially reducedsources for expenditure on children. Female headeduseholds and higher dependency ratios have been shown
be associated with higher risk of chronic poverty in theuth African context (Roberts, 2001). Bt20 collectedformation on the type of water and toilet facility andhether it was shared, sole, or other type of access. Infancy, information was only available on whether the
household had inside provision of water and toilet facilities,outside facilities, or a mixture of both. At age 16 years, moredetailed information was available to allow households tobe split into whether they had hot or cold tap water oranother source of water as well as whether this source wassole or shared. At age 16 years more detailed informationwas also available regarding the toilet facilities so thathouseholds could be distinguished by whether they hadaccess to a flush versus other type of toilet and whether thataccess was sole or shared. Sole use of water and toiletfacilities is preferable and would indicate a higher SES in thiscontext. Similarly hot water and a flush toilet would beconsidered the optimal water and sanitation provision.Measures of water and sanitation provision not only capturethe SES environment but also disease risk. Where facilitiesare shared or less optimal (i.e. no availability of hot water)the risk for morbidity will be higher and this may have directinfluences on body composition outcomes that are separatefrom SES effects.
At 16 years of age neighbourhood and school SES wereself-assessed using a culturally relevant questionnaire,which was developed by consulting community leadersand Bt20 adolescents/caregivers using focus group discus-sions and in-depth interviews in 2005/2006 (Sheppard et al.,2010). Based on the findings of this earlier formative work,neighbourhood was defined for all participants as an areaapproximately 20 min walk or 2 km from home in anydirection.
The neighbourhood SES questionnaire included ques-tions relating to: (1) economic aspects of neighbourhoodsincluding neighbourhood wealth, perceived inequalities inwealth, type, condition, and spacing of housing, infra-structure and service provision type, condition of roads,and neighbourhood problems (e.g. traffic congestion,illegal dumping), (2) social aspects of neighbourhoodsincluding safety, crime, activities for young people,neighbourhood friends, peer pressure, noise, and religiousinvolvement, and (3) school environment with questionson school type, facilities, class sizes, out of school activities,and problems (e.g. poor academic standards, alcohol anddrug consumption, weapons).
To enable a more parsimonious analysis of SESmeasures and to avoid problems of multicollinearity,principal components analysis (PCA) was used to constructneighbourhood SES indices. A theory based approach wasused to develop seven neighbourhood SES indices as wellas two household SES indices and PCA confirmed theappropriateness of grouping these variables together. Ineach case, the first component scores were extracted andthe statistical assumption that all Eigenvalues be greaterthan 1 was met. The first components explained between27 and 91% of variation. In most cases only one Eigenvaluewas greater than 1. However, where there were twoEigenvalues greater than 1, the scree plots showed a clearinflection between the first and second component in allcases meaning that 1 component was extracted for theanalysis. Furthermore, the second components for any ofthe indices were hard to interpret in a theory drivenapproach to construction because they included bothpositive and negative values and there was no clearsubstantive reason that could be found for the variables
thinabin(2inhssisinwmthqminsinad
2
m
aWaacwu
4omaloap
2
rbaminpaps(Tfrthcoa
P.L. Griffiths et al. / Economics and Human Biology 11 (2013) 502–514 505
at were assigned negative values versus positive values any of the indices. Further details about the composition
nd fit of the neighbourhood indices have previouslyeen reported (Griffiths et al., 2012). Neighbourhooddices created were; (1) neighbourhood economic index,) neighbourhood need for more services and facilitiesdex, (3) neighbourhood problem index, (4) neighbour-
ood crime prevention index, and (5) neighbourhoodocial support and happiness index. Two variables (Howafe do you feel in the neighbourhood and how much crime
there in the neighbourhood?) did not load well onto anydex and were thus retained as individual variables. Thereere also two school indices identified; (6) school environ-ent index and (7) school problems index. In addition toese neighbourhood and school measures, household
uestionnaire data were used to construct two indices thateasured ownership of consumer durables, the first duringfancy and the second at age 16 years. Regression factor
cores were extracted for each index and tertiles for eachdex were created. A variable was created to identify
dolescents who transitioned from one index of consumerurables tertile to another between infancy and 16 years.
.3. Anthropometric and DXA-derived body composition
easures
Birth weight and weight and height at 16 years weressessed using standard techniques (Lohman et al., 1991).
eight was measured using digital scales and height using stadiometer (Holtain, UK). Low birthweight was defineds a birthweight less than 2.5 kg. Body mass index wasalculated as weight (Kg)/height (m)2 and adolescentsere classified as normal weight, overweight, or obese
sing Cole et al.’s international age specific cut-off points.At 16 years of age a fan-beam densitometer (model QDR
500A; Hologic Inc, Bedford, Massachusetts) was used tobtain DXA readings of body composition. Total body fatass (FM) and lean mass (LM) were assessed using the
dult software version 8.21 (Hologic Inc) to enablengitudinal follow up with comparable software into
dulthood. DXA scans used recommended standardisedatient positioning and scan analysis.
.4. Other variables used in the analysis
Caregivers reported the ethnicity of the adolescent asecorded on the official birth notification. Individuals bornefore 37 weeks gestation were classified as preterm andfter 41 weeks as post term. Adolescent’s parity andother’s marital status and age were self reported duringfancy. Adolescent’s reported smoking status (current,
revious smoker, or never smoked) at age 16 years andssessed their own pubertal development with the use oficture cards detailing the different stages of the Tannercales for breasts and genitalia or pubic hair developmentanner, 1962). Maternal weight and height were availableom data that were collected between 2002 and 2004 whene cohort were aged 12–14 years. Maternal BMI was
alculated in the same way as for adolescents, butverweight and obesity were defined using internationallyccepted cut-offs of >25 kg/m2 and >30 kg/m2, respectively.
2.5. Statistical analyses
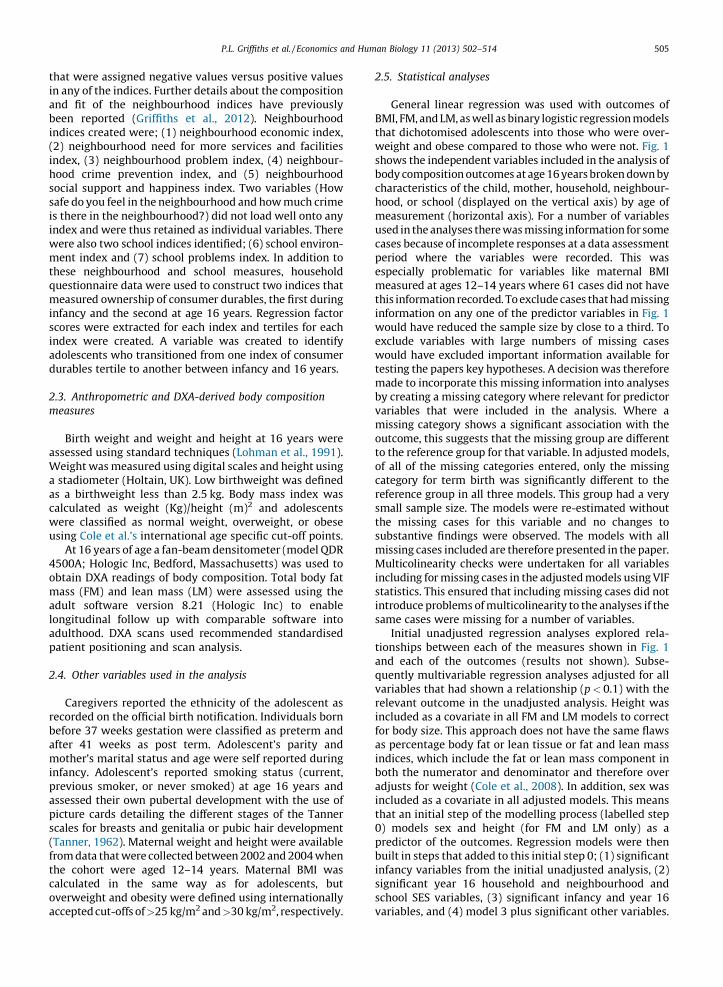
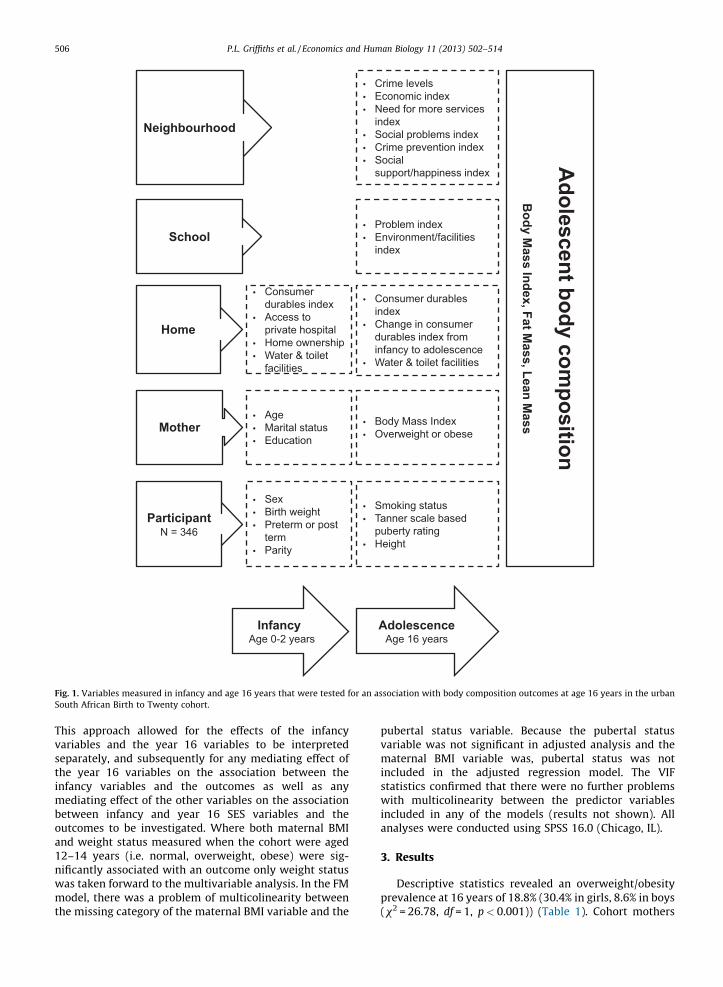
General linear regression was used with outcomes ofBMI, FM, and LM, as well as binary logistic regression modelsthat dichotomised adolescents into those who were over-weight and obese compared to those who were not. Fig. 1shows the independent variables included in the analysis ofbody composition outcomes at age 16 years broken down bycharacteristics of the child, mother, household, neighbour-hood, or school (displayed on the vertical axis) by age ofmeasurement (horizontal axis). For a number of variablesused in the analyses there was missing information for somecases because of incomplete responses at a data assessmentperiod where the variables were recorded. This wasespecially problematic for variables like maternal BMImeasured at ages 12–14 years where 61 cases did not havethis information recorded. To exclude cases that had missinginformation on any one of the predictor variables in Fig. 1would have reduced the sample size by close to a third. Toexclude variables with large numbers of missing caseswould have excluded important information available fortesting the papers key hypotheses. A decision was thereforemade to incorporate this missing information into analysesby creating a missing category where relevant for predictorvariables that were included in the analysis. Where amissing category shows a significant association with theoutcome, this suggests that the missing group are differentto the reference group for that variable. In adjusted models,of all of the missing categories entered, only the missingcategory for term birth was significantly different to thereference group in all three models. This group had a verysmall sample size. The models were re-estimated withoutthe missing cases for this variable and no changes tosubstantive findings were observed. The models with allmissing cases included are therefore presented in the paper.Multicolinearity checks were undertaken for all variablesincluding for missing cases in the adjusted models using VIFstatistics. This ensured that including missing cases did notintroduce problems of multicolinearity to the analyses if thesame cases were missing for a number of variables.
Initial unadjusted regression analyses explored rela-tionships between each of the measures shown in Fig. 1and each of the outcomes (results not shown). Subse-quently multivariable regression analyses adjusted for allvariables that had shown a relationship (p < 0.1) with therelevant outcome in the unadjusted analysis. Height wasincluded as a covariate in all FM and LM models to correctfor body size. This approach does not have the same flawsas percentage body fat or lean tissue or fat and lean massindices, which include the fat or lean mass component inboth the numerator and denominator and therefore overadjusts for weight (Cole et al., 2008). In addition, sex wasincluded as a covariate in all adjusted models. This meansthat an initial step of the modelling process (labelled step0) models sex and height (for FM and LM only) as apredictor of the outcomes. Regression models were thenbuilt in steps that added to this initial step 0; (1) significantinfancy variables from the initial unadjusted analysis, (2)significant year 16 household and neighbourhood andschool SES variables, (3) significant infancy and year 16variables, and (4) model 3 plus significant other variables.
Thvasethinmbeouan12niwmth
Fig
So
P.L. Griffiths et al. / Economics and Human Biology 11 (2013) 502–514506
is approach allowed for the effects of the infancyriables and the year 16 variables to be interpretedparately, and subsequently for any mediating effect ofe year 16 variables on the association between thefancy variables and the outcomes as well as anyediating effect of the other variables on the associationtween infancy and year 16 SES variables and thetcomes to be investigated. Where both maternal BMId weight status measured when the cohort were aged–14 years (i.e. normal, overweight, obese) were sig-
ficantly associated with an outcome only weight statusas taken forward to the multivariable analysis. In the FModel, there was a problem of multicolinearity betweene missing category of the maternal BMI variable and the
pubertal status variable. Because the pubertal statusvariable was not significant in adjusted analysis and thematernal BMI variable was, pubertal status was notincluded in the adjusted regression model. The VIFstatistics confirmed that there were no further problemswith multicolinearity between the predictor variablesincluded in any of the models (results not shown). Allanalyses were conducted using SPSS 16.0 (Chicago, IL).
3. Results
Descriptive statistics revealed an overweight/obesityprevalence at 16 years of 18.8% (30.4% in girls, 8.6% in boys(x2 = 26.78, df = 1, p < 0.001)) (Table 1). Cohort mothers
• Consumer
durables index
• Access to
private hospital
• Home ow nership
• Water & toilet
facilities
• Age
• Ma rital status
• Education
• Sex
• Birth weight
• Preterm or post
term
• Parity
• Crime leve ls
• Ec onomic index
• Need for mo re services
index
• Soci al problems index
• Crime prevention index
• Soci al
support/ha ppiness index
• Problem index
• Environment/fac iliti es
index
• Consumer durables
index
• Chan ge in consume r
durables inde x from
infancy to ad olescence
• Water & toilet facilities
• Body Mass Index
• Overweight or obese
• Smoking status
• Tan ner scale based
puberty rating
• Height
InfancyAge 0-2 years
Adole scen ceAge 16 years
Neighbourhood
School
Home
Mother
Partic ipantN = 346
Ad
ole
scen
t bo
dy
co
mp
ositio
n
Bo
dy M
ass In
dex, F
at M
ass, L
ean
Mass
. 1. Variables measured in infancy and age 16 years that were tested for an association with body composition outcomes at age 16 years in the urban
uth African Birth to Twenty cohort.

wpcoyrahsflwth
3
mBbs
T
M
(F
o
C
a
in
T
D
(F
B
P.L. Griffiths et al. / Economics and Human Biology 11 (2013) 502–514 507
ere predominantly aged below 30 years at the time of thearticipant’s birth, were giving birth to their first or secondhild, had not graduated from high school, and wereverweight or obese when the cohort member was 16ears of age (Table 2). At birth, 49% of the cohort lived inented local authority housing and 48% had outside waternd toilet facilities. At age 16 years, approximately 18% onlyad shared access to water and 50% had outside access toole or shared use of toilet facilities (Table 2). There wasuidity in relative household SES between birth and 16 yearsith only 38% households remaining in the same tertile ofe household consumer durable SES index (Table 2).
.1. Body mass index
As results for the fully adjusted logistic regressionodels were equivalent to those for the linear model of
MI, only the linear regression results are presented forrevity. The variables shown in Table 3 were found to beignificant in initial unadjusted linear regression models of
able 1
ean (SD) birthweight, weight, height, body mass index (BMI), fat mass
M), lean mass (LM); and percent low birth weight, overweight, and
bese by sex for South African Black children aged 16 years.
Total n = 346
Sex (n) Male
(185)
Female
(161)
Mean (SD)
birthweight (g)b
3162.8
(515.7)
3008.5
(493.2)a
Percent (n) LBW
(birthweight < 2500 g)b
8.6
(16)
13.7
(22)
Age 16 mean (SD)
weight (kg)
58.3
(10.6)
57.9
(11.6)
Age 16 mean (SD)
height (cm)
168.9
(7.5)
158.2
(5.8)a
Age 16 mean (SD)
BMI (kg/m2)
20.4
(3.6)
23.1
(4.3)a
Age 16 mean (SD)
FM (kg)
9.7
(6.7)
19.2
(7.6)a
Age 16 mean (SD)
LM (kg)
47.0
(6.1)
37.3
(4.9)a
Age 16 percent (n)
overweightc
5.4
(10)
22.4
(36)a
Age 16 percent (n)
obeseb
3.2
(6)
8.1
(13)a
Age 16 percent (n)
overweight or obese
8.6
(16)
30.4
(49)a
a Indicates a significant (p < 0.05) sex difference in this variable.
ontinuous variables were tested using an independent samples t-test
nd categorical variables using a multidimensional Chi-square test.b 10 cases did not have birthweight, and therefore LBW, recorded.c Overweight and obesity are defined using Cole et al.’s age appropriate
ternational cut-offs for children and adolescents.
able 2
escriptive Statistics for predictors of body mass index (BMI), fat mass
M (kg)), and lean mass (LM (kg)) used in regression analyses for African
lack Bt20 16 year olds.a
Total n = 346 Percent or mean (SD)
Infancy measuresFemale 46.5
Male 53.5
Term 84.6
Preterm 13.6
Table 2 (Continued )
Total n = 346 Percent or mean (SD)
Missing 0.6
Parity 1 40.9
Parity 2 28.9
Parity 3 16.5
Parity 4 plus 12.7
Missing parity 0.9
Mother’s age 15–19 yrs 19.7
Mother’s age 20–24 yrs 29.8
Mother’s age 25–29 yrs 25.7
Mother’s age 30–34 yrs 17.6
Mother’s age 35–39 yrs 7.2
Married/cohabiting 24.5
Previously married 0.6
Single 74.3
Missing marital status 0.6
Mother’s education �grade 10 55.2
Mother’s education grades 11–12 35.3
Mother’s education post school 8.1
Mother’s education missing 1.4
Public hospital 95.3
Private hospital 3.8
Missing hospital 0.9
Owns Property 28.6
Rented private 17.1
Rented local authority 49.4
Provided by employer 2.0
Missing home ownership 2.9
Indoor water/toilet 21.9
Inside & outside water/toilet 24.3
Outside water/toilet 48.3
Missing water/toilet 5.5
Sole use water/toilet 76.8
Sole & shared toilet/water 3.8
Shared toilet/water 13.9
Missing sole/shared water 5.5
Age 16 measuresIndoor sole use hot/cold water 26.9
Indoor share use hot/cold water 9.8
Indoor sole use cold water 26.9
Indoor share use cold water 8.4
Other 25.7
Missing 2.3
Sole use indoor flush toilet 35.3
Shared use indoor flush toilet 10.1
Sole use outdoor flush toilet 37.6
Shared use outdoor flush toilet 12.1
Other/missing 4.9
Increase SES tertile 0–16 yrs 22.2
Stay same SES tertile 0–16yrs 37.6
Reduce SES tertile 0–16 yrs 31.2
Missing SES tertile change 9.0
Currently smoke 22.2
Previously smoked 50.0
Never smoked 8.7
Missing smoking data 19.1
Tanner = 5 on either scale 20.6
Tanner = 4 on either scale 30.6
Tanner �3 on either scale 44.8
Missing Tanner scale 4.0
Maternal BMI (kg/m2)b 28.8 (5.9)
Maternal overweightc 30.6
Maternal obese 28.3
Maternal not overweight/obese 23.4
Missing maternal weight 17.7a This table does not include the household/neighbourhood SES indices
included in the anlaysis because by definition approximately a third of the
sample fits into each of the index tertiles.b Maternal BMI was assessed between 2002 and 2004 when the cohort
were aged between 12 and 14 years of age.c Maternal overweight and obesity defined using internationally
Post term 1.2 accepted cut-offs of >25 kg/m2 and >30 kg/m2, respectively.

BMreremduvaWin
Ta
Ad
va
C
S
F
I
T
P
P
M
M
G
P
M
W
B
S
M
I
M
L
M
Y
W
I
I
I
O
M
N
A
S
V
N
S
A
N
N
I
M
L
M
O
M
O
O
M
A
*
*
*a
inib
c
P.L. Griffiths et al. / Economics and Human Biology 11 (2013) 502–514508
I at 16 years and were included into the adjustedgression analysis for BMI. In step one of the BMI adjustedgression model, all infancy variables entered into theodel apart from the SES index of infancy consumerrables were significant (Table 3). None of the year 16riables in step two were significantly associated with BMI.hen both infancy and year 16 variables were adjusted for
step three, all significant variables in the previous steps
retained significance and direction of association, andindoor sole use of running cold water at 16 years becamesignificant. When the model was also adjusted for maternalweight status measured when the cohort were aged 12–14years, maternal post secondary school education becameinsignificant. The only significant SES measures associatedwith BMI in the fully adjusted model were having pooreraccess to water and toilet facilities in infancy compared to
ble 3
justed parameter estimates from a linear regression model of body mass index (BMI) at 16 years for African Black Bt20 participants using predictor
riables that had a previous significant bivariate association with BMI.
n
(total = 346)
Step 0a
adjusted
parameter
estimate (SE)
Step 1
adjusted
parameter
estimate (SE)
Step 2
adjusted
parameter
estimate (SE)
Step 3
adjusted
parameter
estimate (SE)
Step 4
adjusted
parameter
estimate (SE)
onstant 346 17.73 (0.66) 17.52 (0.80) 19.30 (1.18) 18.99 (1.219) 17.71 (1.24)
ex (refb male) 185
emale 161 2.69 (0.43)*** 2.82 (0.41)*** 2.52 (0.44)*** 2.68 (0.43)*** 2.67 (0.41)***
nfancy variables
erm birth (ref term) 293
reterm 47 �0.83 (0.61) �0.73 (0.64) �0.48 (0.62)
ost term 4 5.88 (1.93)** 6.35 (1.97)** 5.36 (1.92)**
issing 2 10.00 (3.46)** 9.18 (3.51)** 9.05 (3.40)**
aternal education (ref up to grade 10) 191
rades 11–12 122 0.12 (0.45) 0.18 (0.48) 0.25 (0.47)
ost school 28 1.80 (0.77)* 1.74 (0.78)* 1.11 (0.76)
issing 5 0.53 (2.50) 0.36 (2.57) 0.89 (2.49)
ater & toilet facilities (ref sole use) 266
oth sole and shared use 13 2.22 (1.08)* 2.43 (1.10)* 3.07 (1.07)**
hared use 48 0.38 (0.60) 0.44 (0.63) 0.29 (0.61)
issing 19 1.76 (1.29) 1.78 (1.32) 1.91 (1.29)
ndex of consumer durables (ref highest tertile) 84
iddle tertile 137 �0.53 (0.52) �0.49 (0.53) �0.12 (0.52)
owest tertile 107 �0.54 (0.57) �0.37 (0.59) �0.15 (0.58)
issing 18 �1.01 (1.38) �0.89 (1.43) �1.01 (1.39)
ear 16 variables
ater facilities (ref indoor sole use hot/cold) 93
ndoor shared use hot/cold water 34 �0.23 (0.80) �0.59 (0.79) �0.45 (0.76)
ndoor sole use cold water 93 �1.08 (0.60) �1.17 (0.59)* �1.15 (0.57)*
ndoor share use cold water 29 0.26 (0.85) 0.20 (0.83) 0.01 (0.80)
ther water source 89 �0.44 (0.61) �0.54 (0.61) �0.55 (0.59)
issing 8 �2.85 (1.48) �2.91 (1.44)* �2.78 (1.39)
eighbourhood safety (ref very unsafe/unsafe) 39
verage safety 82 �0.06 (0.81) �0.19 (0.78) �0.06 (0.75)
afe 167 �0.57 (0.75) �0.55 (0.73) �0.43 (0.71)
ery safe 58 �0.81 (0.87) �0.95 (0.84) �0.68 (0.81)
eighbourhood crime (ref a lot) 71
ome crime 103 �1.00 (0.64) �1.00 (0.63) �0.83 (0.61)
verage crime 81 0.53 (0.67) 0.35 (0.66) 0.58 (0.64)
ot much crime 80 0.01 (0.68) �0.17 (0.67) �0.16 (0.65)
o crime 11 �0.73 (1.32) �0.56 (1.29) �0.50 (1.25)
ndex of school environment (ref highest tertile) 112
iddle tertile 116 �0.38 (0.53) �0.15 (0.52) �0.04 (0.50)
owest tertile 113 �0.24 (0.56) �0.01 (0.55) 0.06 (0.53)
issing 5 �1.25 (1.85) �0.98 (1.80) �0.39 (1.77)
ther variables
aternal weight status (ref normal weight)c 81
verweight 106 0.02 (0.56)
bese 98 2.40 (0.57)***
issing 61 0.41 (0.66)
djusted R2 346 0.10 0.19 0.11 0.19 0.24
p < 0.05.
* p < 0.01.
** p < 0.001 (two tailed).
Multivariable regression models were built in five steps: (0) sex, (1) significant infancy variables from initial analysis, (2) significant year 16 variables from
tial analysis, (3) significant infancy and year 16 variables from initial analysis and (4) added significant other variables from initial analysis.
Ref = reference category.
Maternal overweight and obesity defined using internationally accepted cut-offs of >25 kg/m2 and >30 kg/m2, respectively.

thBya2oe
T
A
h
v
P.L. Griffiths et al. / Economics and Human Biology 11 (2013) 502–514 509
e reference category, which was associated with increasedMI, and having poorer access to water facilities at age 16ears compared to the reference category, which wasssociated with a lower BMI. This adjusted model explained4% of the variance in BMI at age 16 years compared to 10%f the variance in BMI explained by the model with just sexntered as a predictor (step 0).
3.2. Fat mass
The variables shown in Table 4 were found to besignificant in initial unadjusted linear regression models ofFM at 16 years and are similar to the list of variablesidentified for their association with BMI in unadjustedanalyses. In step one of the adjusted FM regression model,
able 4
djusted parameter estimates from a linear regression model of fat mass (FM) at 16 years for African Black Bt20 participants using predictor variables that
ad a previous significant association with FM in models adjusting for height only.
n Step 0a
adjusted
parameter
estimate (SE)
Step 1
adjusted
parameter
estimate (SE)
Step 2
adjusted
parameter
estimate (SE)
Step 3
adjusted
parameter
estimate (SE)
Step 4
adjusted
parameter
estimate (SE)
Constant 346 �8.17 (10.32) �6.30 (9.91) �6.24 (10.50) �5.10 (10.09) �8.58 (9.84)
Height (cm) 346 0.05 (0.06) 0.03 (0.06) 0.05 (0.06) 0.03 (0.06) 0.04 (0.05)
Sex (refb male) 185
Female 161 10.01 (0.98)*** 10.28 (0.94)*** 9.66 (1.00)*** 10.06 (0.96)*** 9.99 (0.96)***
Infancy variables
Term birth (ref term) 293
Preterm 47 �1.75 (1.10) �1.65 (1.12) �1.29 (1.10)
Post term 4 10.57 (3.43)** 10.97 (3.48)** 8.54 (3.43)*
Missing 2 22.50 (6.17)*** 22.81 (6.12)*** 20.77 (6.09)**
Maternal education (ref up to grade 10) 191
Grades 11–12 122 0.69 (0.80) 0.63 (0.84) 0.84 (0.82)
Post school 28 4.24 (1.39)** 4.12 (1.41)** 2.83 (1.40)*
Missing 5 0.46 (4.98) �0.70 (5.04) �0.91 (4.91)
Home ownership (ref owns property) 99
Rented private 59 0.18 (1.14) 0.47 (1.15) 0.01 (1.13)
Rented local authority 171 0.23 (0.87) 0.38 (0.88) 0.07 (0.86)
Provided by employer 7 �2.38 (2.66) �1.95 (2.71) �2.76 (2.66)
Missing 10 �5.26 (3.87) �4.95 (3.93) �3.28 (3.91)
Water and toilet facilities (ref sole use) 266
Both sole and shared use 13 5.90 (1.93)** 5.50 (1.95)** 6.38 (1.91)**
Shared use 48 0.30 (1.10) 0.10 (1.12) �0.03 (1.09)
Missing 19 4.90 (2.33)* 5.03 (2.38)* 3.88 (2.33)
Year 16 variables
Toilet facilities (ref sole use indoor flush) 122
Share use indoor flush toilet 35 1.43 (1.39) 0.63 (1.33) 0.29 (1.30)
Sole use outdoor flush toilet 130 0.33 (0.93) 0.024 (0.90) �0.06 (0.88)
Share use outdoor flush toilet 42 2.06 (1.31) 1.70 (1.25) 2. 24 (1.23)
Other toilet type/missing 17 �1.46 (1.87) �2.19 (1.80) �1.55 (1.75)
Neighbourhood safety (ref very unsafe/unsafe) 39
Average safety 82 �1.54 (1.43) �1.63 (1.37) �1.35 (1.34)
Safe 167 �1.44 (1.31) �1.32 (1.26) �0.57 (1.23)
Very safe 58 �2.03 (1.53) �2.16 (1.45) �1.61 (1.42)
Index of school environment (ref highest tertile) 112
Middle tertile 116 �1.42 (0.97) �0.99 (0.92) �0.93 (0.90)
Lowest tertile 113 �2.10 (1.00)* �1.51 (0.98) �1.69 (0.96)
Missing 5 �3.77 (3.34) �3.77 (3.18) �2.74 (3.14)
Other variables
Smoking status (ref currently smokes) 275
Previously smoked 106 �0.19 (1.04)
Never smoked 155 0.34 (0.99)
Missing 14 3.37 (1.99)
Maternal weight status (ref normal weight)c 81
Overweight 106 0.21 (0.99)
Obese 98 4.34 (1.03)***
Missing 61 1.79 (1.18)
Adjusted R2 0.31 0.39 0.31 0.39 0.43
* p < 0.05.
** p < 0.01.
*** p < 0.001 (two tailed).a Multivariable regression models were built in five steps: (0) sex and height, (1) significant infancy variables from initial analysis, (2) significant year 16
ariables from initial analysis, (3) significant infancy and year 16 variables from initial analysis and (4) added significant other variables from initial analysis.b
Ref = reference category.c Maternal overweight and obesity defined using internationally accepted cut-offs of >25 kg/m2 and >30 kg/m2, respectively.
allwstesuthsigadsighaantiofininFMpr
3.3
sigFM
Ta
Ad
va
C
H
S
F
I
B
T
P
P
M
Y
N
A
S
V
I
M
L
O
S
P
N
M
M
O
O
M
A
*
*
*a
sig
frob
c
P.L. Griffiths et al. / Economics and Human Biology 11 (2013) 502–514510
infancy variables tested apart from home ownershipere significant (Table 4). All of the significant variables inp one were associated with significantly higher FM in all
bsequent steps. Of the year 16 variables, only being ine lowest tertile of the index of school environment wasnificant and only in step two where there was nojustment for infancy and other variables. The onlynificant SES measure in the fully adjusted model wasving poorer access to water and toilet facilities in infancyd having a mother with post secondary school educa-n, which were both associated with increased FM. Theal adjusted model (step 4) explained 43% of the variance
FM at age 16 years compared to 31% of the variance in explained by the model with height and sex only as
edictors (step 0).
. Lean mass
The variables shown in Table 5 were found to benificant in initial unadjusted linear regression models of
at 16 years and were entered into the adjusted
analyses. All infancy variables entered into the adjustedanalyses remained significant in all steps of the modelbuilding, although none of the year 16 variables weresignificant in any step (Table 5). In the fully adjustedmodel, none of the socio-economic measures weresignificant, maternal obesity measured when the cohortwere aged 12–14 years was associated with significantlyhigher LM. 66% of the variance in LM at 16 years wasexplained by the fully adjusted model (step 4) compared to61% of the variance explained by the model that onlyincluded sex and height (step 0).
4. Discussion
Findings show little evidence of a relationship of bodycomposition at age 16 with SES both when looking at thesignificance of the parameter estimates and the change inadjusted R-squared values between unadjusted andadjusted models. Associations have been tested using anextensive range of household, school, and neighbourhoodSES measures. For all three outcomes, the largest change in
ble 5
justed parameter estimates from a linear regression model of lean mass (LM) at 16 years for African Black Birth to Twenty participants for predictor
riables that had a previous significant association with LM in models adjusting for height only.
n Step 0a
adjusted
parameter
estimate (SE)
Step 1
adjusted
parameter
estimate (SE)
Step 2
adjusted
parameter
estimate (SE)
Step 3
adjusted
parameter
estimate (SE)
Step 4
adjusted
parameter
estimate (SE)
onstant 346 �22.07 (6.62) �25.73 (6.35) �28.582 (6.697) �28.046 (6.430) �30.039 (6.428)
eight (cm) 346 0.47 (0.04)*** 0.42 (0.04)*** 0.469 (0.037)*** 0.425 (0.036)*** 0.438 (0.036)***
ex (refb male) 185
emale 161 �4.67 (0.63)*** �4.81 (0.60)*** �4.582(0.637)*** �4.740 (0.607)*** �4.690 (0.624)***
nfancy variables
irthweight (g) 342 0.002 (0.001)*** 0.002 (0.001)*** 0.002 (0.001)**
erm birth (ref term) 293
reterm 47 0.59 (0.74) 0.804 (0.747) 0.888 (0.753)
ost term 4 5.75 (2.20)** 5.942 (2.205)** 5.007 (2.231)*
issing 2 13.52 (3.10)*** 13.204 (3.103)*** 13.144 (3.185)***
ear 16 variables
eighbourhood safety (ref very unsafe/unsafe) 39
verage safety 82 1.18 (0.90) 1.46 (0.86) 1.51 (0.86)
afe 167 0.16 (0.83) 0.36 (0.79) 0.40 (0.79)
ery safe 58 0.07 (0.96) 0.20 (0.92) 0.31 (0.92)
ndex of crime prevention (ref highest tertile) 114
iddle tertile 117 0.40 (0.61) 0.66 (0.58) 0.76 (0.58)
owest tertile 115 1.02 (0.61) 0.86 (0.58) 0.76 (0.58)
ther variables
moking status (ref currently smokes) 275
reviously smoked 106 �0.09 (0.69)
ever smoked 155 �0.10 (0.65)
issing 14 1.35 (1.35)
aternal weight status (ref normal weight)c 81
verweight 106 0.70 (0.64)
bese 98 2.03 (0.67)**
issing 61 0.31 (0.76)
djusted R2 0.61 0.65 0.61 0.65 0.66
p < 0.05.
* p < 0.01.
** p < 0.001 (two tailed).
Multivariable regression models were adjusted for height and sex and were built in four steps: (1) significant infancy variables from initial analysis, (2)
nificant year 16 variables from initial analysis, (3) significant infancy and year 16 variables from initial analysis and (4) added significant other variables
m initial analysis.
Ref = reference category.
Maternal overweight and obesity defined using internationally accepted cut-offs of >25 kg/m2 and >30 kg/m2, respectively.
thmhlaspdfoamcA1b(Gp
atafaininTwbtaF2seBBswwansGAhotaTlirthrbwisoLceaea
wth
P.L. Griffiths et al. / Economics and Human Biology 11 (2013) 502–514 511
e R-squared value between step 0 (sex and height onlyodel) and step 2 (age 16 predictor variables plus sex and
eight) is 1%. The changes in the R-squared are slightlyrger, although still modest, for the difference between
tep 0 (sex and height only model) and step 1 (infancyredictor variables plus sex and height) with a 9%ifference for BMI, 8% difference for FM, and a 4% differencer LM. This study’s findings have shown that there does
ppear to be evidence supporting West’s hypothesis ofore equal health in adolescence (assessed using body
omposition outcomes) in these 16 year old urban Southfricans at least based on the SES measures assessed at age6 years. This is because observed significant differencesy SES in body composition outcomes at 9–10 years
riffiths et al., 2008) are not seen in the analysesresented in this paper at age 16.
SES variables that were found to be significantlyssociated with the FM and BMI outcomes were measuresken in the infancy period; access to sanitation and watercilities and maternal education. This suggests that ifequalities do exist at this age they endure from thefancy period rather than being created at age 16 years.
his is different to what was observed at ages 9–10 yearshen infancy SES measures were only associated with LM
ut not FM and BMI. In that earlier work, SES measuresken at 9–10 years were more strongly associated with
M and BMI than infancy SES measures (Griffiths et al.,008). At age 16 years, those born to mothers with postecondary school education compared to lower levels ofducation were associated with higher values of FM andMI (for BMI this was only before controlling for maternalMI). Eight percent of the cohort had mothers with postecondary school education. For many decades it has beenell established that maternal education is associatedith improved income and access to resources (Cleland
nd van Ginneken, 1988). Maternal education is alsoormally associated with improved knowledge and sub-equently improved child health (e.g. Cleland and vaninneken, 1988; Boyle et al., 2006). However, in Southfrica where the Bt20 cohort were born into a climate of aigh prevalence of under nutrition and low prevalence ofver nutrition it is likely that health messages would havergeted preventing child under rather than over nutrition.
hus public knowledge available regarding obesity waskely limited even for educated individuals. The extraesources available to more educated mothers may
erefore have provided a more calorie dense diet,esulting in increased FM and BMI for their offspringefore health messages and knowledge regarding obesityere available. There is mounting evidence that lean mass
programmed by growth in utero and the first six monthsf life (Wells et al., 2005; Singhal et al., 2003), meaning thatM is less likely to be related to current environmentalonditions when assessing adolescent outcomes. This mayxplain why maternal education has been found to bessociated with FM and BMI in this study but not LM asnvironmental conditions are less likely to influence LM byge 16.
Although some household measures of sanitation andater facilities showed some association with BMI and FM,e direction of significance changed between different
measures in infancy and at age 16 years. In infancy, beingin one of the middle ranking SES groups (i.e. sole andshared use of water and toilet facilities) resulted in higherpredicted BMI/FM than those who had sole access to waterand toilet facilities. In contrast, the age 16 SES measure thatwas significant identified the middle ranking group interms of SES (having indoor running cold water) to havepredicted lower BMI scores than the high ranking groupwho had both indoor cold and hot running water. Thismeans that the significance was not linear within thevariable at either age (i.e. the middle SES group showedsignificance rather than the category representing thelower end of the SES measure when comparing to the highSES group). There is therefore not a consistent pattern ofassociation with this measure of SES and BMI and FMeither within or between the age groups assessed.
Adolescent reported neighbourhood and school SESvariables at age 16 years showed some association withBMI and FM in unadjusted models whereas caregiverassessed household consumer durable measures did not.This gives some support to West’s idea that there is a needto measure relevant aspects of an adolescent’s SESenvironment, which includes their wider social environ-ment. The Bt20 school and neighbourhood SES question-naire should be relevant to the adolescents as it wasdeveloped using input from information gained from Bt20participants at age 15 years in focus group discussionsabout relevant aspects of their neighbourhood and schoolenvironment (Sheppard et al., 2010). However, even theseadolescent assessed neighbourhood and school measureswere not significantly associated with body composition inadjusted models. West’s hypothesis was built uponevidence relating to adolescent health inequalities in highincome countries and this is the first formal test of thehypothesis within a low and middle income countrysetting using cohort data.
The findings of this paper are important because theysuggest that for body composition outcomes, SES is notstrongly driving differences within the adolescent period.It is not yet known whether SES inequalities previouslyobserved in the Bt20 cohort in infancy (Willey et al., 2009)and childhood (Griffiths et al., 2008), but not duringadolescence in the present paper, will emerge in adult-hood. We have also not fully assessed the ‘peer culture’measure that West proposed may be important inadolescence. This aspect would be difficult to assess inthe cohort without a qualitative study to fully understandadolescent ‘peer culture’ in the urban South Africancontext to develop quantitative measures of peer culture.It is also possible that, besides the original social reasonsproposed by West (1997) for more equal health inadolescents, biological factors also complicate the assess-ment of health inequalities at this age in this cohort. Suchbiological factors combined with the rapid social changethat has been taking place in South Africa in the post-Apartheid period could influence the findings observed atage 16 years. Body composition is very heavily influencedby pubertal status. During puberty both boys and girlsexperience the adolescent growth spurt, but sexuallydimorphic increases occur in fat mass in girls and leanmass in boys under the influence of the sex hormones
oeRoaslatSorebywdefa20(ccobeanovchmciatioetprfrochtorecaonminanscsutraloprrethhe
pr18ovcadoBlhistuloofMesunovthbepainaginte
P.L. Griffiths et al. / Economics and Human Biology 11 (2013) 502–514512
strogen and testosterone, respectively (Tanner, 1989;emmich and Rogol, 1999). Pubertal status is itselfsociated with SES, with low SES being associated wither entry into puberty (Tanner, 1962; Adair, 2001). In theuth African transitioning context, this would likelyduce the BMI and fat mass of the low SES group acquired
age 16, compared to those from the higher SES groupsho enter puberty earlier. This is because pubertalvelopment, at least in girls, is associated with increasing
t mass (Bogin, 1999) and body mass index (Kaplowitz,08). At the same time, for low SES adolescents
ompared to high SES) the transitioning environmentuld be starting to result in changes to lifestylehaviours such as increasing access to high fat dietsd less physical activity because a significant increase inerweight was observed in the cohort between lateildhood and age 16 years. Low SES groups tend to beore vulnerable to such changing lifestyle factors asso-ted with nutrition transition during periods of transi-n in middle income countries (Popkin, 2001, Monteiro
al., 2001). The high SES group could also have beenovided with more protection from becoming overweightm environmental factors associated with the rapidlyanging environment such as being the first to be exposed
knowledge about how to prevent obesity. This wouldsult in the high SES group’s experience of earlier pubertyncelling out the effects of the broader SES environment
body composition and making the SES groups appearore equal at this age. This assertion needs further testing
this South African context because the findings of thisalysis show those with mothers with post secondaryhool education to have predicted higher FM and BMI,ggesting that this community may not yet havensitioned to the usual pattern of increased risk for
wer SES groups observed in middle income countries inevious research. Nevertheless, there is a need forsearchers to consider the biological context as well ase social context when studying inequalities in adolescentalth.Overweight and obesity are an emerging health
oblem in South Africa and also in the Bt20 cohort..8% of the adolescents in the present study wereerweight or obese, with 30% of females being in thistegory. This is a 20% increase compared to thecumented prevalence at ages 9–10 years in Africanack girls in the same cohort (Griffiths et al., 2008). Thegher prevalence of obesity in females observed in this
dy is supported by similar work in another townshipcation in South Africa of adults where female prevalence obesity was 5.7 times higher than males (Case andenendez, 2009). The rising prevalence of obesity,pecially in females, means that it is important toderstand the factors leading to increased risk forerweight to reduce risk for later chronic diseases inis context. Although we do not find strong associationstween SES and the body composition outcomes in thisper, we do show other factors to be important. Theseclude maternal BMI, measured when the cohort wereed 12–14 years, as well as variables assessed in infancy,cluding for FM and BMI whether the infant was born postrm (although this finding is based on a very small sample
size and needs further exploration with larger samplesizes) and the infant’s birth weight (LM). Maternal BMIexplains 5% of the variance in BMI, 4% for FM, and 1% forLM. Maternal BMI is potentially a marker of geneticpotential for obesity, it is also an indicator of a sharedobesogenic environment as well as a potential marker initself of household SES. If we cross-tabulate maternal BMIgrouped into normal, overweight, obese, and missing withthe household SES tertile index assessed in infancy and thehousehold SES tertile index assessed at age 16 years of age,the Chi-squared statistics produced show no statisticallysignificant association. However, maternal BMI is asso-ciated with maternal education measured in infancy(x2 = 16.41, p = 0.012) and the adjusted standardisedresiduals show that this significance comes from the postsecondary school education group being significantly lesslikely to be normal weight and significantly more likely tobe obese. This is the same pattern of association that isshown with FM, BMI and LM in adolescents. This suggeststhat as well as potential genetic drivers of associationsbetween maternal BMI and adolescent body compositionoutcomes, that there may also be factors related to theresources associated with maternal education that influ-ence increased maternal BMI as well as adolescent bodycomposition outcomes, especially in a society like SouthAfrica that has undergone such rapid nutrition transition.
5. Limitations
Previous findings related to attrition in the cohort showno bias in attrition by SES in the first sixteen years of theoverall cohort’s life (Norris et al., 2007). However, thespecific sub-sample used here for this analysis has asignificantly higher SES on some measures compared tothe original Bt20 children, thus under-representing thepoor (results not shown). It is possible that with furtherinclusion of the poor group into the analysis that therewould have been more of a spread in SES, which may haveresulted in more significant findings being observed.Despite differences between this sub-sample and themain cohort, no such differences exist between this sub-sample and the one used in the 9–10 year analysis whereSES differences were observed. With alpha set at 0.05 andpower at 0.80, the sample size analysed has the statisticalpower to detect medium to large effect sizes, but is notadequate to detect small effect sizes (Cohen, 1992).Nevertheless the same bone health sub-sample was usedto perform the analysis on the 9–10 year old children thusmaking the findings of the two papers comparable inpower for studying change in the effect of the SES measuresover the early life-course.
This study also lacks environmental SES measuresduring infancy outside of the household, which meansthat it only studies the effect of environmental measuresof SES in adolescence. It has not been possible to fully testWest’s idea that peer SES may be a stronger influence onhealth outcomes in adolescence compared to other SESmeasures because this study’s school measures did notencompass measures of the social status of peers. Whenmodelling neighbourhood health effects, researchersoften use a multilevel approach to control for the
c(ntahtbruawammwett
6
byswSaceastopa1hseaoAwSeoapcinmh
auFlacBW
P.L. Griffiths et al. / Economics and Human Biology 11 (2013) 502–514 513
lustering of SES characteristics within neighbourhoodsPickett and Pearl, 2001). However, the definition ofeighbourhood used here (within 20 min of home) meanthat no two households exactly shared a neighbourhood,lthough they will share some aspect of their neighbour-ood with other participants. Not being able to correct forhis partial lack of independence could lead to slightlyiased standard error estimates. Finally there were aeasonable number of missing cases across the variablessed in these analyses, which have been included in thenalysis as missing categories. It is possible that resultsould have changed if information had been available for
ll of these cases on all variables. However, the onlyissing group to show significance in the fully adjustedodels was for the variable measuring whether the birthas a term birth or not. The significance of model
stimates did not change when including or excludinghis small number of missing cases (results not shown forhe models where the cases were excluded).
. Conclusion
This study shows evidence of a weaker associationetween SES and body composition outcomes at age 16ears in this urban South African context compared totudies of the same cohort in infancy and childhood. Thereas some association between two infancy measures of
ES (maternal education and sanitation) and BMI and FM,lthough the direction of this association was notonsistent. Those with the highest levels of maternalducation had adolescents with the highest predicted BMInd FM, whilst those with a middle level of water andanitation provision had significantly different BMI and FM
those with the highest level of water and sanitationrovision. The direction of the association for the waternd sanitation variables changed between infancy and age6 years. Taken together this evidence reveals more equalealth in adolescents for the first time in a transitioningetting using longitudinal data. It supports West’s hypoth-sis of more equal health outcomes in adolescence,lthough we observe limited evidence for the importancef the school context in shaping inequalities in this Southfrican urban environment. There are both biological andider societal level social factors that were occurring in
outh Africa at this time that could go some way toxplaining a more equal profile in body compositionutcomes at this age in this context. These factors, inddition to the original social reasons for less inequalityroposed by West (1997), show that adolescence is aomplex period to study in relation to SES healthequalities because of the challenge of adequatelyeasuring the social and biological context in which
ealth outcomes occur at this stage in the life course.There is a need to assess whether inequalities evolve
gain in early adulthood in this cohort to more fullynderstand the pattern of inequality beyond adolescence.urthermore, studying change in BMI over the period fromte childhood to adolescence and relating it to SES status
ould add further understanding to how inequalities inMI evolve through adolescence in transitioning contexts.
the mother, household, school, and neighbourhood level,findings suggest that targeting obesity interventions atfemales in households with a mother who already has ahigh BMI, and especially to those of higher educationalstatus, would target the most at risk for obesity inadolescence within this transitioning context.
Financial support
Bt20 receives financial and logistic support from theUniversity of the Witwatersrand. The Bone Health studywas financially supported by the Wellcome Trust (UK) andBirth to Twenty continues to be supported by theWellcome Trust (UK) (reference number 092097/Z/10/Z).The neighbourhood and school socioeconomic measuresdata were funded by the Medical Research Council (UK)through grant id 70363. PG’s time in writing the paper wasalso supported by a British Academy Mid-career Fellow-ship (Ref: MD120048). The funders had no influence onstudy design or in the collection, analysis and interpreta-tion of data or in writing the report. The authors takeresponsibility for all of these aspects of the study.
Author contributions
PG conceived the research question with the help of SN,JP and NC. PG and WJ carried out the data analysis, PG ledthe writing of the manuscript with the help of WJ, and allauthors took responsibility for final editing, reviewing andapproval of the document.
Acknowledgements
The authors would like to thank the Bt20 participantsand research team, and also Gretchen Hanke for her help incleaning the age-16 socioeconomic data. The authorswould also like to thank Dr Jennifer Van Hook for herperceptive comments on an earlier draft of the paperpresented at the 2011 Population Association of Americaannual meeting.
References
Adair, L., 2001. Size at birth predicts age at menarche. Pediatrics 107, E59.Allison, K.W., Burton, L., Marshall, S., Perez-Febles, A., Yarrington, J., Kirsh,
L.B., Merriwether-DeVries, C., 1999. Life experiences among urbanadolescents: examining the role of context. Child Development 70,1017–1029.
Bogin, B., 2013. Childhood, adolescence and longevity. In: Hewlett, B.L(Ed.), Adolescent Identity. Evolutionary, Cultural and DevelopmentalPerspectives. 1st ed. Routledge, New York, pp. 23–39.
Bogin, B., 1999. Patterns of Human Growth, 2nd ed. Cambridge UniversityPress, Cambridge.
Bollen, K., Glanville, J.L., Stecklov, G., 2001. Socioeconomic status and classin studies of fertility and health in developing countries. AnnualReview of Sociology 27, 153–185.
Boyle, M.H., Racine, Y., Georgiades, K., Snelling, D., Hong, S., Omariba, W.,Hurley, P., Rao-Melacini, P., 2006. The influence of economic devel-opment level, household wealth and maternal education on childhealth in the developing world. Social Science and Medicine 63,2242–2254.
Cameron, N., 2003. Physical growth in a transitional economy: the after-
math of South African apartheid. Economics and Human Biology 1,29–42. ith the range of variables tested within this study at
Ca
Cle
CoCo
Co
Da
Gr
Gr
Ho
Jud
Ka
Kr
Lo
Ma
Ma
Mo
No
P.L. Griffiths et al. / Economics and Human Biology 11 (2013) 502–514514
se, A., Menendez, A., 2009. Sex differences in obesity rates in poorcountries: evidence from South Africa. Economics and Human Biology7, 271–282.
land, J.G., van Ginneken, J.K., 1988. Maternal education and childsurvival in developing Countries: the search for pathways of influ-ence. Social Science and Medicine 27, 1357–1368.
hen, J., 1992. A power primer. Psychological Bulletin 112, 155–159.le, T.J., Bellizzi, M.C., Flegal, K.M., Dietz, W.H., 2000. Establishing a
standard definition for child overweight and obesity worldwide:international survey. British Medical Journal 320, 1240–1243.
le, T.J., Fewtrell, M.S., Prentice, A., 2008. The fallacy of using percentagebody fat as a measure of adiposity. American Journal of ClinicalNutrition 87, 1959 (author reply 1959–60).
vey Smith, G., Blane, D., Bartley, M., 1994. Explanations for socio-economic differentials in mortality. European Journal of Public Health4, 131–144.
iffiths, P.L., Sheppard, Z.A., Johnson, W., Cameron, N., Pettifor, J.M.,Norris, S.A., 2012. Associations between household and neighbour-hood socio-economic status and systolic blood pressure among urbanSouth African adolescents. Journal of Biosocial Science 44, 433–458.
iffiths, P.L., Rousham, E.K., Norris, S.A., Pettifor, J.M., Cameron, N., 2008.Socio-economic status and body composition outcomes in urbanSouth African children. Archives of Disease in Childhood 93, 862–867.
lstein, B.E., Currie, C., Boyce, W., Damsgaard, M.T., Gobina, I., Kokonyei,G., Hetland, J., de Looze, M., Richter, M., Due, P., The HBSC SocialInequalities Focus Group, 2009. Socio-economic inequality in multi-ple health complaints among adolescents: international comparativestudy in 37 countries. International Journal of Public Health 54, S260–S270.
ge, K., Benzeval, M., 1993. Health inequalities: new concerns about thechildren of single mothers. British Medical Journal 306, 677.
plowitz, P.B., 2008. Link between body fat and the timing of puberty.Pediatrics 121, s208–s217.
uger, R., Kruger, H.S., Macintyre, U.E., 2006. The determinants of over-weight and obesity among 10- to 15-year-old schoolchildren in theNorth West Province, South Africa – the THUSA BANA (Transition andHealth during Urbanisation of South Africans; BANA, children) study.Public Health Nutrition 9, 351–358.
hman, T.G., Roche, A.F., Martorell, R., 1991. Anthropometric Standardi-zation Reference Manual. Human Kinetics Books, Champaign.
rmot, M., 2005. Social determinants of health inequalities. The Lancet365, 1099–1104.
y, J., 2000. Inequality in South Africa. Meeting the Challenge. DavidPhillip Publishers, Cape Town.
nteiro, C.A., Condey, W.L., Popkin, B.M., 2001. Independent effects ofincome and education on the risk of obesity in the Brazillian adultpopulation. Journal of Nutrition 131, 881S–886S.
rris, S.A., Richter, L.M., Fleetwood, S.A., 2007. Panel studies in devel-oping countries: case analysis of sample attrition over the past 16
years within the Birth to Twenty cohort in Johannesburg, South Africa.Journal of International Development 19, 1143–1150.
Pickett, K.E., Pearl, M., 2001. Multilevel analyses of neighbourhood socio-economic context and health outcomes: a critical review. Journal ofEpidemiology and Community Health 55, 111–122.
Popkin, B.M., 2001. The nutrition transition and obesity in the developingworld. Journal of Nutrition 131, 871S–873S.
Richter, L.M., Norris, S.A., De Wet, T., 2004. Transition from Birth to Ten toBirth to Twenty: the South African cohort reaches 13 years of age.Paediatric and Perinatal Epidemiology 18, 290–301.
Richter, L., Norris, S., Pettifor, J., Yach, D., Cameron, N., 2007.Cohort Profile: Mandela’s children: the 1990 Birth to Twenty studyin South Africa. International Journal of Epidemiology 36, 504–511.
Roberts, B.J., 2001. Chronic and transitory poverty in post-ApartheidSouth Africa: evidence from KwaZulu-Natal. Journal of Poverty 5,1–27.
Roemmich, J.N., Rogol, A.D., 1999. Hormonal changes during puberty andtheir relationship to fat distribution. American Journal of HumanBiology 11, 209–224.
Sheppard, Z.A., Norris, S.A., Pettifor, J.M., Cameron, N., Griffiths, P.L., 2010.How can we learn about community socio-economic status andpoverty in a developing country urban environment? An examplefrom Johannesburg–Soweto, South Africa. African Population Studies24, 53–70.
Shrewsbury, V., Wardle, J., 2008. Socioeconomic status and adiposity inchildhood: a systematic review of cross-sectional studies 1990–2005.Obesity 16, 275–284.
Singhal, A., Wells, J.C.K., Cole, T.J., Fewtrell, M., Lucas, A., 2003. Program-ming of lean body mass: a link between birth weight, obesity andcardiovascular disease. American Journal of Clinical Nutrition 77,726–730.
Starfield, B., Riley, A.W., Witt, W.P., Robertson, J., 2002. Social classgradients in health during adolescence. Journal of Epidemiologyand Community Health 56, 354–361.
Tanner, J.M., 1989. Foetus into Man: Physical Growth from Conception toMaturity, 2nd ed. Harvard University Press, Cambridge, MA, USA.
Tanner, J.M., 1962. Growth at Adolescence. Blackwell, Oxford, UK.UNDP, 2011. Human Development Reports..Wells, J.C.K., Hallal, P.C., Wright, A., Singhal, A., Victora, C.G., 2005. Fetal,
infant and childhood growth: relationships with body compositionin Brazilian boys aged 9 years. International Journal of Obesity 29,1192–1198.
West, P., 1997. Health inequalities in the early years: is there equalisationin youth? Social Science & Medicine 44, 833–858.
WHO, 2011. Global Infobase..Willey, B.A., Cameron, N., Norris, S.A., Pettifor, J.M., Griffiths, P.L., 2009.
Socio-economic predictors of stunting in preschool children – apopulation-based study from Johannesburg and Soweto. South Afri-can Medical Journal 99, 450–456.