Embed Size (px)
Citation preview
Universidade de São Paulo
Instituto de Biociências
Departamento de Ecologia
Rodolpho Credo Rodrigues
In�uência da estrutura da vegetação sobre a
diversidade e detectabilidade das espécies de
aves do Cerrado
In�uence of vegetation structure on the
diversity and detectability of Cerrado birds
São Paulo
2016


1
Rodolpho Credo Rodrigues
In�uência da estrutura da vegetação sobre a
diversidade e detectabilidade das espécies de
aves do Cerrado
In�uence of vegetation structure on the
diversity and detectability of Cerrado birds
Tese apresentada ao Departamento de Ecolo-
gia do Instituto de Biociências da Universi-
dade de São Paulo como requisito para a obtenção
do título de Doutor em Ciências.
Área de Concentração: Ecologia
Orientador: Prof. Dr. Paulo Inácio de Knegt
López de Prado
Versão corrigida
(O original encontra-se disponível no Insitituto de Biociências da USP)
São Paulo
2016

2
Ficha catalográ�ca
Rodrigues, Rodolpho Credo
In�uência da estrutura da vegetação sobre a diversidade e detectabilidade
das espécies de aves do Cerrado
Número de páginas: 118 páginas
Tese (Doutorado) - Instituto de Biociências da Universidade de São Paulo.
Departamento de Ecologia.
1. avifauna 2.savana 3. heterogeneidade de habitats 4. modelos hi-
erárquicos bayesianos. I. Instituto de Biociências da Universidade de São
Paulo. Departamento de Ecologia.
Comissão Julgadora:
Profa. Dra. Renata Pardini Prof. Dr. Cristiano de Campos Nogueira
Prof. Dr. Arthur Ângelo Bispo Prof. Dr. Marcos Maldonado Coelho
Prof. Dr. Paulo Inácio de Knegt López de Prado
(Orientador)

aos bichos, às plantas e ao povo do Cerrado, dedico!

4

Agradecimentos
En�m, após estes quatro anos de doutorado, chegou o momento de agradecer formal-
mente a todos que participaram direta e indiretamente deste trabalho e da minha formação.
Foram muitas pessoas importantes nesta jornada, por isso desde já quero agradecer a todos
que estiveram presentes e que contribuíram e dizer que cheguei até aqui com muito esforço
más me sinto muito feliz!
Primeiro, gostaria de agradecer ao Paulo Inácio, meu orientador, por ser um grande exem-
plo de pessoa, de pesquisador e principalmente de professor, pela paciência em transmitir
seu conhecimento e tranquilidade nos momentos mais difíceis da pós graduação. Gostaria
de agradecer também ao prof. Glauco Machado e ao prof. Paulo Guimarães Jr. (Miúdo)
pela amizade e pela oportunidade de participar da LAGE, este ambiente incrível, inspirador
e aconchegante. Agradeço pela convivência e companheirismo de todos os grandes amigos
que �z neste nosso meta-laboratório, no LET e também na pós, em especial Camila Mandai,
Camila Castanho, Renato Lima, Sara Mortara, Marcelo Awade, Leonardo Wedekin, Carlos
Candía-Gallardo, Bruno Ribeiro, Renato Coutinho, Melina Leite, Danilo Mori, Luísa No-
vaes, Ayana Martins, Eduardo Pinto, Jomar Barbosa, Esther Sebástian, Julia Astegiano,
Marília Gayarsa, Paula Lemos, Cristiane Millán, Flávia Marquitti, Mariana Vidal, Lean-
dro Tambosi, Lucas Medeiros, Lucas Nascimento, Maikon Freitas, Marina Xavier e Sérgio
Souza. Meus sinceros agradecimentos aos professores Alexandre Oliveira, Renata Pardini,
Jean Paul Metzger, Márcio Martins, José Carlos Motta Jr., Eduardo Alves e também
à Vera Lima, Luís Souza e todos funcionários da pós graduação. Agradeço igualmente
aos funcionários do Parque Nacional Grande Sertão Veredas especialmente Zé Rodrigues,

6
Dna. Joana, Laura França e Dr. Luiz Se¯gio Martins, Ernane Faria da ONG Funatura
e ao nosso guia sr. Antonio Correia da Silva (Toninho Buraco), pela amizade e compan-
heirismo. Quero agradecer também à Viviana Ruiz-Gutiérrez, que contribuiu com ideías e
discussões para o terceiro capítulo desta tese e me recebeu no Cornell Lab of Ornithology,
além de Jesse Lepak, Alex Lees, Nárgila Moura, Gerardo Gonzalez, Steven Rios, Sara e
Eliot Miller, amigos que �z durante minha curta porém intensa visita ao CLO.
Agradeço também aos amigos de longa data, Dé, Nerão, Douglão, Gu, Thi e Pedrão, além
de Pedro Bernardes, Gregório Menezes, Pedro Dias, Renato Gaiga, Michel Garey, Hugo
Pereira, Thammy Dias, Ricardo Marcelino, Lucas Jardim e Mário Sacramento, pela parce-
ria incondicional. Agradeço à toda a minha família, dos Credo e dos Rodrigues, em especial
minha vó Maria de Lourdes (in memorian), Tia Má, Tio Zé (in memorian), Tio Tatão e
Tia Dedeca e aos primos Marina, Mi, Ju, Lê, Tatau, Pi e Carol. Agradeço também aos
"agregados" Castro e Crivellenti, especialmente meus sogros Renato e Adriana pelo car-
inho, ao meu cunhado Rafa e à Ná pela amizade e à pequena Gabi pela doçura. Agradeço
aos meu pais, Antonio e Marilena, pelo exemplo de sabedoria, humildade e dedicação e
pelo amor e compreensão de sempre. Aos meus irmãos Lê e Thu e minhas cunhadas Lu
e Bia, pela amizade, apoio e incentivo e também à recém chegada Elisa pela injeção de
alegria em nossas vidas. Por �m, agradeço à Livia, minha esposa e eterna namorada, pelo
convívio e crescimento do dia a dia, por compartilhar comigo tantos sonhos e realizações
e por ser esta pessoa e companheira tão maravilhosa!
Esta tese/dissertação foi escrita em LATEX com a classe IAGTESE, para teses e dissertações do IAG.

Mas levei a minha sina. Mundo, o em que se estava, não era para gente, era um espaço
para os de meia-razão. Para ouvir gavião guinchar ou as tantas seriemas que
chungavam...Isso quando o ermo melhorava de ser só ermo. A chapada é para aqueles
casais de antas, que toram trilhas largas no cerradão por aonde, e sem saber de ninguém
assopram sua bruta força...No mais nem mortalma...Dias inteiros, nada, tudo o
nada...Não se tem onde acostumar os olhos, toda �rmeza se dissolve. Isto é assim. Desde
o raiar da aurora o sertão tonteia.�
(João Guimarães Rosa, trecho do livro Grande Sertão Veredas)

8

Resumo
Em diversos estudos ao redor do globo, a estrutura e heterogeneidade da vegetação têm
sido considerados fatores determinantes para a diversidade de espécies de aves e também de
outros grupos de animais. O Cerrado é a segunda mais extensa e mais ameaçada formação
vegetacional de ocorrência no Brasil. Esta vegetação típica do bioma das savanas tropicais
também é caracterizada por um mosaico de tipo de vegetações, que juntas formam um
evidente gradiente ambiental de estrutura e heterogeneidade de vegetação. Na presente tese
analisamos a in�uência da estrutura e heterogeneidade da vegetação sobre a diversidade
em comunidades de aves do Cerrado. Nossa expectativa era corroborar a "Hipótese de
Heterogeneidade de Habitats", que propõe que quanto maior a estrutura e complexidade
da vegetação, maior será a diversidade de espécies.
No primeiro capítulo, realizamos uma compilação sistemática de estudos publicados
sobre a diversidade de aves em áreas ocupadas por algumas �sionomias típicas de Cerrado
sensu lato (campos, savanas e cerradões), com o intuito de analisar o conhecimento obtido
até então acerca da relação entre diversidade de aves e a estrutura da vegetação no Cerrado.
Além disto, analisamos também a in�uência de diferentes métodos amostrais em revelar
esta relação. Foram selecionadas 72 amostras de 22 estudos, sendo que estas amostras
variaram quanto ao tipo de �sionomia amostrada e o método amostral empregado, além de
também estarem disponíveis em diferentes artigos e serem realizadas em diferentes áreas de
estudo. Para análises destes dados, utilizamos a análise de modelos lineares generalizados
de efeitos mistos (modelo GLM com distribuição de erros poisson), que permite analisar os
efeitos de variáveis �xas e aleatórias sobre a variável explicativa (riqueza de espécies). As

10
variáveis de efeito �xo foram o tipo de vegetação amostrada (vegetação campestre, savânica
e �orestal) e o método amostral empregado (ponto �xo, transecto e redes de neblina). Já
as variáveis de efeito aleatório utilizadas foram o artigo onde os dados foram publicados,
o autor de cada estudo e a localidade geográ�ca amostrada. O efeito destas variáveis
aleatórias poderiam afetar somente os interceptos das relações entre as variáveis �xas e
a variável explicativa ou poderiam alterar a magnitude (i.e. inclinação) da relação entre
as variáveis �xas e explicativa. Construímos diversos modelos a partir da combinação de
variáveis de efeito �xo e aleatório e a seleção do modelo mais parcimonioso foi feito por meio
do critério AICc (critério de informação de Akaike corrigido para pequenas amostras). O
modelo que apresentou menor valor de AICc (mais parcimonioso) foi aquele que incluiu os
efeitos de ambas variáveis de efeito �xo (�sionomia e método amostral) e também um efeito
da interação entre estas duas variáveis. Neste modelo também foram incluídos os efeitos
das variáveis aleatórias artigo e localidade geográ�ca sobre os interceptos das relações entre
as variáveis de efeito �xo e a variável explicativa. Estes resultados mostraram que não só
a riqueza de espécies de aves em nosso estudo variou em função da �sionomia e do método
amostral empregado, mas que também a relação entre riqueza e �sionomia também foi
diferente dependendo do método amostral utilizado. Portanto, esta interação não permitiu
que fosse estimada a relação entre �sionomia e riqueza sem considerar o efeito dos métodos.
Já os efeitos das variáveis aleatórias mostraram que a variação estimada nos interceptos
entre artigos foi duas vezes maior do que a variação estimada entre localidades geográ�cas.
O efeito da interação entre as variáveis �sionomia e método amostral apontou para a
existência de heterogeneidade de detecção entre locais com diferentes �sionomias, além
também de um efeito das �sionomias na efetividade dos diferentes métodos amostrais. A
in�uência dos métodos amostrais no número de espécies observadas em cada �sonomia pode
ser esperada devido às diferenças intrínsecas dos métodos, já que ponto �xo e transecto são
baseados em contatos visuais e auditivos com as espécies, enquanto que o método de rede
de neblina consiste na captura passiva das espécies que voam na altura das redes. Assim,
redes de neblina podem ser mais efetivas em habitats menos estruturados (por ex. campos
limpos e sujos), onde a rede alcança quase todo os estratos de vegetação. No entanto,

11
o método de transecto pode ser mais efetivo que o método de ponto �xo em áreas de
�orestas, pois nestes hábitats as espécies tendem a ter territórios menores e o deslocamento
do observador proporciona ao observador cobrir um maior número de terrítórios. Por
outro lado, o ponto �xo pode ser mais vantajoso por não produzir ruído e afugentar as
espécies, o que pode ser uma desvantagem do método de transecto. Outros fatores, como
a experiência e número de observadores, número de pontos amostrais, número de redes
utilizadas e comprimento de transectos, podem explicar a grande variação estimada entre
os artigos. Uma das maneiras de se contornar estes efeitos metodológicos é utilizar métodos
desenvolvidos especialmente para lidar com diferentes probabilidades de detecção entre
espécies, entre sítios e até métodos amostrais. Estes métodos podem render dados mais
con�áveis para o estudo da ecologia das espécies e poderiam consequentemente contribuir
para a elaboração de planos de manejo e/ou conservação mais efetivos.
No segundo capítulo, a relação entre diversidade de aves e estrutura da vegetação foi
analisada a partir de dados coletados em campo e utilizando um protocolo de amostragem
especí�co para se estimar e considerar os efeitos da vegetação sobre a detecção das espécies.
As amostragens foram realizadas em um dos maiores e mais preservados remanescentes pro-
tegidos de Cerrado (Parque Nacional Grande Sertão Veredas-PARNA GSV) e consistiram
do registro das espécies de aves em 32 áreas amostrais. Estas localidades foram dispostas
em um gradiente de tipos de vegetação de Cerrado, que variaram desde campos limpos e
sujos, campos cerrado a cerrados sensu stricto. O cálculo da riqueza de espécies de aves em
cada sítio foi realizado através de modelos de ocupação-detecção, adaptados para estimar
a riqueza de espécies em comunidades. A vegetação, por sua vez, foi medida a partir de
estimativas de presença da vegetação entre 0 e 4 m de altura, divididos em 16 intervalos
de altura de 22,5 cm cada um. Duas variáveis de estrutura foram obtidas a partir de uma
análise de componentes principais, que foi aplicada para resumir a variação da presença de
vegetação nestes 16 intervalos de altura. Estas variáveis de estrutura vertical da vegetação
foram relacionadas tanto com a ocupação quanto com a detecção das espécies, já que em
nossas análises a estrutura vertical da vegetação poderia in�uenciar não só a ocorrência
más também a detecção das espécies. O dia e também a temperatura no momento da

12
amostragem também foram incluídas como covariáveis que poderiam afetar a detecção.
Após a estimativa da riqueza de espécies pelo modelo de ocupação-detecção para comu-
nidades, esta riqueza estimada foi relacionada à estrutura da vegetação por uma função
quadrática e usando um modelo bayesiano de metanálise, que permitiu incluir também
a incerteza nas estimativas de riqueza na análise. Com o intuito de melhor compreen-
der os efeitos da detecção imperfeita, também foi ajustado um modelo quadrático GLM
(distribuição de erros normal) aos dados de riqueza observada. Os resultados mostraram
que a riqueza estimada a partir dos dados das 38 espécies mais detectadas durante as
amostragens teve uma fraca relação com as duas covariáveis de estrutura de vegetação,
sendo que houve uma maior riqueza de espécies em sítios com vegetação intermediária em
altura e uma maior riqueza de espécies de aves em sítios onde houve maior presença de
vegetação abaixo de 2 m de altura. No entanto, as relações entre riqueza estimada e estas
covariáveis foram menos intensas mas qualitativamente similares às relações entre a riqueza
observada e as covariáveis de vegetação. A menor intensidade nas relações da riqueza es-
timada foi evidenciada principalmente em ambos os extremos do gradiente de estrutura
vertical da vegetação e também nas áreas com menor presença de vegetação abaixo de 2
m. Estes resultados mostraram que o efeito da detecção imperfeita pode alterar o efeito da
relação entre riqueza de espécies e estrutura de vegetação. Além disso, ao menos para as
38 espécies mais comumente encontradas na área de estudo, os resultados apontam para a
importância de todo o gradiente de estrutura da vegetação para a manutenção da riqueza
de espécies de aves no Cerrado. Futuros estudos que visem aprimorar o uso destes modelos
de ocupação e detecção para comunidades são fundamentais para permitir o uso dos dados
de todas as espécies da comunidade. Além disto, outros estudos que se proponham a anal-
isar a dinâmica e composição das comunidades de aves nestes gradientes de estrutura de
vegetação são fundamentais para um maior entendimento sobre a ecologia e conservação
das aves no Cerrado.
Palavras-chave: avifauna, savana, �to�sionomia, heterogeneidade de habitats, modelos
de efeitos mistos, gradiente ambiental, ocupação, detecção, modelos bayesianos
hierárquicos, hotspot, conservação.

Abstract
In several studies around the world, vegetation structure and heterogeneity have been
considered determinant factors for avian diversity and also for the diversity of other groups
of animals. The Cerrado is the second most extensive and most threatened vegetal forma-
tion that occurs in Brazil. This vegetation is a typical tropical savanna and is characterized
by an mosaic of several vegetation types, which forms an obvious environmental gradient
of vegetation structure and heterogeneity. In this thesis, we analysed the in�uence of the
structure and heterogeneity of the vegetation on the diversity of Cerrado bird communities.
Our expectation was to support the "Habitat Heterogeneity Hypothesis", which suggests
that the higher the structure and complexity of vegetation, the greater the diversity of
species.
In the �rst chapter, we conducted a systematic compilation of published studies about
bird diversity performed in areas with di�erent Cerrado lato sensu physiognomies, in or-
der to analyse the actual knowledge about the relationship between diversity of birds and
the structure of the vegetation in the Cerrado. We selected 72 samples from 22 studies
and these samples varied in vegetation physiognomy, sampling method used, and they also
were published in di�erent scienti�c papers and be carried out in di�erent geographical
locations. We performed generalized linear e�ects models analysis (poisson error distri-
bution GLM model), which allows us to analyse the e�ects of �xed and random variables
on the explanatory variable (species richness). Fixed variables were the type of sam-
pled vegetation (grassland, savanna and forest) and the sampling method employed (point
counts, transect and mist nets). The random variables were the article where the data

14
were published, the author of each study and geographic location. These random variables
could a�ect only the intercepts of the relationships of �xed and random variables with
explanatory variable or could alter the intensity (i.e. slopes) of the relationship between
�xed and explanatory variable. We built several models from the combination of �xed
and random e�ects variables and selection the most parsimonious model was made by
using the AICc criterion (Akaike Information Criterion corrected for small samples). The
model that showed lower value of AICc (more parsimonious) was the one that included
the e�ects of both �xed e�ect variables (physiognomy and sampling method) and also an
interaction e�ect between these two variables. In this model were also included the e�ects
of random variables article and geographic location on the intercepts of the relationship
between the �xed e�ect variables and the explanatory variable. These results showed that
besides bird species richness in our study varied due to physiognomy and sampling method
variables, the relationship between richness and physiognomy also was di�erent depending
on the sampling method used. Therefore, this interaction does not allowed us to estimate
the relationship between physiognomy and species richness without considering sampling
methods e�ects. Additionally, the e�ects of random variables showed that the variation
in the intercept among papers was two times larger than the estimated intercept variation
among geographic locations. The e�ect of interaction between the vegetation physiog-
nomy and sampling method variables pointed to the existence of detection heterogeneities
between locations, physiognomies, and also between di�erent sampling methods. The in-
�uence of the sampling method in the number of species observed in each physiognomy
may be expected due to intrinsic di�erences in the methods, since point counts and tran-
sect are based on visual and aural contacts with the species, while the mist net method
consists in passive capture of species trying to �y through the nets. Thus, mist nets may
be more e�ective in less structured environments (e.g. grasslands) where the net reaches
virtually all vegetation layers. However, transect method can be more e�ective than the
point counts method in forested areas, since in these habitats species tend to have smaller
territory areas, and the observer movement provides the observer cover greater areas. On
the other hand, point counts methods minimize noise and bird species drive o�, which may

15
be a disadvantage of transect method. Other factors, such as experience and number of
observers, the number of sampling points, the number of nets used and length of transects,
may explain the wide estimated variation among papers. One of the ways to overcome
these methodological e�ects is to use methods developed specially to deal with di�erent
detection probabilities among species, sites and even sampling methods, which could yield
more reliable data for the ecological studies and the development of species management
and / or conservation plans.
In the second chapter, the relationship between bird diversity and vegetation structure
was analysed from data collected in the �eld and using a speci�c sampling protocol to esti-
mate and consider the e�ects of vegetation on species detections. The samples were taken
in one of the largest and well preserved remnants of Cerrado (Grande Sertão Veredas Na-
tional Park-PARNA GSV) and consisted of recording bird species in 32 areas arranged in
a Cerrado structural vegetation gradient, ranging from grasslands, open and dense savan-
nas. Estimated bird species richness at each site was calculated using occupancy-detection
models adapted to estimate the number of species in communities. The vegetation, in turn,
was measured from estimates of the presence of vegetation between 0 and 4 m, divided in
16 height intervals of 22.5 cm each. Two structure variables were obtained from a principal
component analysis applied to summarize the variation of the vegetation presence in these
16 height intervals. These vegetation variables were related to the occupancy and detection
of species, since the vegetation structure could in�uence not only the occurrence but also
the detection of species in our analysis. The sampling day and also the temperature at the
time of sampling were also included as covariates that could a�ect detections. After the es-
timation of species richness by occupancy-detection models for communities, this estimated
richness was related by a quadratic function with the vegetation structure covariates using
a Bayesian meta-analysis model, which also allowed us to include uncertainty in richness
estimates. In order to better understand the e�ects of imperfect detection, we also �t a
quadratic model GLM (normal distribution errors) to the observed (naive) richness data.
The results showed that estimated richness from the data of the 38 most detected species
during sampling had a weak relationship with both covariates of vegetation structure, and

16
there was a greater species richness at sites with intermediate vegetation height and greater
bird species richness in places where there was a greater presence of vegetation below 2
m height. However, the relationsphips between estimated richness and these covariates
was less intense but qualitatively similar to the relationship between observed richness and
vegetation covariates. The lowest intensity in the estimated richness relationships were
observed mainly at both ends of the vertical gradient of vegetation and also in areas with
less presence of vegetation below 2 m. These results showed that the e�ect of imperfect
detection can change the e�ect of the relationship between species richness and vegeta-
tion structure. Moreover, at least for the 38 species most commonly found in the study
area, these results points to the importance of the entire vegetation structure gradient to
maintain the bird species richness in Cerrado. Future studies aiming to improve the use
of these models of occupancy and detection for communities are essential to allow the use
of data of all species in the community. In addition, other studies that propose to analyse
the dynamics and composition of bird communities in these vegetation structure gradients
are fundamental for a better understanding on the ecology and conservation of Cerrado
birds.
Keywords: avifauna, savanna, vegetation physiognomy, habitat heterogeneity,
mixed-e�ects models, environmental gradient, occupancy, detection, Bayesian
hierarchical models, biodiversity hotspot, biodiversity conservation.

Sumário
1. Introdução geral . . . . . . . . . . . . . . . . . . . . . . . . . . . . . . . . . . . 19
1.1 Estrutura da vegetação x diversidade em comunidades de aves . . . . . . . 19
1.2 Efeitos da Detectabilidade em estudos ecológicos . . . . . . . . . . . . . . . 20
1.3 O Cerrado . . . . . . . . . . . . . . . . . . . . . . . . . . . . . . . . . . . . 21
1.4 Objetivo desta tese . . . . . . . . . . . . . . . . . . . . . . . . . . . . . . . 21
2. Bird diversity and vegetation structure relationship in Cerrado hotspot, Brazil: Can
di�erent sampling methods a�ect our view of ecological patterns? . . . . . . . . 23
2.1 INTRODUCTION . . . . . . . . . . . . . . . . . . . . . . . . . . . . . . . 26
2.2 METHODS . . . . . . . . . . . . . . . . . . . . . . . . . . . . . . . . . . . 29
2.3 RESULTS . . . . . . . . . . . . . . . . . . . . . . . . . . . . . . . . . . . . 38
2.4 DISCUSSION . . . . . . . . . . . . . . . . . . . . . . . . . . . . . . . . . . 41
3. Bird diversity and vegetation structure relationship: E�ects of vegetation gradients
on species richness and detectability in Cerrado savanna, Brazil . . . . . . . . . 47
3.1 INTRODUCTION . . . . . . . . . . . . . . . . . . . . . . . . . . . . . . . 50
3.2 METHODS . . . . . . . . . . . . . . . . . . . . . . . . . . . . . . . . . . . 53
3.3 RESULTS . . . . . . . . . . . . . . . . . . . . . . . . . . . . . . . . . . . . 61
3.4 DISCUSSION . . . . . . . . . . . . . . . . . . . . . . . . . . . . . . . . . . 64
4. Conclusões . . . . . . . . . . . . . . . . . . . . . . . . . . . . . . . . . . . . . . 73

18
Referências . . . . . . . . . . . . . . . . . . . . . . . . . . . . . . . . . . . . . . . . 77
Appendix 91
A. . . . . . . . . . . . . . . . . . . . . . . . . . . . . . . . . . . . . . . . . . . . . . 93
A.1 Databases and keywords used in secondary data search . . . . . . . . . . . 93
A.2 Detailed description of surveys locations . . . . . . . . . . . . . . . . . . . 96
A.3 Detailed description of statistical analyses . . . . . . . . . . . . . . . . . . 101
B. . . . . . . . . . . . . . . . . . . . . . . . . . . . . . . . . . . . . . . . . . . . . . 105
B.1 Bayesian model codes in BUGS language . . . . . . . . . . . . . . . . . . . 105
B.2 Posterior predictive checks of metanalysis models �t . . . . . . . . . . . . . 108
B.3 Table of species sampled during surveys . . . . . . . . . . . . . . . . . . . . 109
B.4 Results of species richness and occupancy using all species data . . . . . . 115

Capítulo 1
Introdução geral
1.1 Estrutura da vegetação x diversidade em comunidades de aves
A estrutura da vegetação é uma das variaveis que mais afetam a diversidade em co-
munidades de aves (MacArthur and MacArthur, 1961; Cody, 1985; Tews et al., 2004).
Diversos trabalhos em todos os continentes tem mostrado que variáveis como: tipo de
�sionomia vegetal, altura do dossel, per�l vertical da folhagem, densidade e diâmetro das
árvores têm grande in�uência sobre a quantidade de espécies e de individuos presentes nas
comunidades de aves (MacArthur and MacArthur, 1961; Rotenberry, 1985; Díaz, 2006;
Price et al., 2013; Carrillo-Rubio et al., 2014). A explicação mais aceita para este padrão
é a proposta pela "Hipótese de Especialização por Recursos" ("Resource Specialization
Hypothesis" (Srivastava and Lawton, 1998)), a qual propõe que uma maior diversidade e
distribuição espacial dos recursos no ambiente pode sustentar uma maior diversidade de
espécies, por uma maior especialização nos recursos e uma redução na competição entre
as espécies. Este pode ser o principal padrão de diversidade em comunidades de aves,
visto que alguns trabalhos recentes têm mostrado que o clima, considerado outro fator
determinante, afeta as aves principalmente através da sua in�uência sobre o crescimento
da vegetação e não por um efeito direto sobre a ocorrência das espécies (Hurlbert, 2004;
Kissling et al., 2008; Ferger et al., 2014). As savanas são formações vegetais que apresen-
tam uma grande heterogeneidade espacial e estrutural de vegetação (Doughty et al., 2016).
Estas formações são caracterizadas por um mosaico complexo de campos de gramíneas,
vegetações arbustivas até �orestas, incluindo ainda �orestas de galeria e áreas inundáveis

20
(Ratter et al., 1997; Price et al., 2013). Fatores abióticos, como fertilidade e profundidade
do solo, além da disponibilidade de água e ocorrência de fogo, e também bióticos, como o
pastejo por herbívoros, têm relação com a manutenção desta heterogeneidade espacial da
vegetação (Ratter et al., 1997; Doughty et al., 2016). Devido ao aumento da fragmentação
da vegetação por fatores antrópicos, o estudo destas vegetações espacialmente heterogêneas
pode signi�car uma grande oportunidade para estudos ecológicos e estudo aplicados à con-
servação de espécies, por proporcionar uma melhor compreensão dos padrões e processos
ecológicos em ambientes que são naturalmente fragmentados.
1.2 Efeitos da Detectabilidade em estudos ecológicos
Apesar do longo histórico dos estudos ecológicos em geral, o desenvolvimento recente
desta disciplina deve-se principalmente à elaboração e aplicação de ferramentas metodológ-
icas e estatísticas cada vez mais modernas e poderosas. Um dos exemplos deste tipo de
inovação teórica e tecnológica na ecologia é o desenvolvimento e incorporação da questão da
detecção imperfeita em amostragens de populações e comunidade de organismos. A in�uên-
cia do processo amostral sobre as estimativas de diversidade de comunidades já é conhecido
de longa data na literatura ecológica (e.g. (Fisher et al., 1943; Preston, 1948)). A partir do
�nal da década de 1970, alguns trabalhos propuseram incluir formalmente possíveis efeitos
da heterogeneidade nas probabilidades de detecção das espécies sobre as estimativas do
tamanho destas populações (Otis et al., 1978; Burnham and Overton, 1979). Estes méto-
dos foram generalizados no início do ±eculo XXI, a partir da implementação destas idéias
usando uma abordagem de modelagem hierárquica para ocupação e detecção das espécies
(Mackenzie et al., 2002). Inicialmente, estes modelos possibilitaram não só a estimativa de
parâmetros associados à presença ou ausência de espécies em comunidades, mas também
a consideração do efeito de outras variáveis sobre o processo de observação destas espécies
e/ou indivíduos durante as amostragens. Nos dias de hoje, parâmetros como extinção e
colonização locais, além de número e composição de espécies em comunidades, por exem-
plo, podem ser inferidos a partir de métodos computacionais e�cientes que permitem a

21
estimativas de muitos parâmetros simultaneamente. Estes estudos têm comprovado que
a detecção imperfeita pode in�uenciar de forma substancial a nossa visão dos padrões e
processos ecológicos (Gu and Swihart, 2004; Zipkin et al., 2010; Ruiz-Gutiérrez and Zip-
kin, 2011). Consequentemente, estes erros podem também nos levar à tomada de decisões
equivocadas quanto ao manejo e/ou conservação de espécies e áreas naturais e, portanto,
devem ser levadas em conta para maiores êxitos no processos de decisão envolvendo estudos
ecológicos e de conservação de espécies.
1.3 O Cerrado
O Cerrado é o segundo bioma de maior extensão (Ratter et al., 1997) e o segundo
mais ameaçado do Brasil (Myers et al., 2000). Este bioma está situado na região cen-
tral do Brasil e sua área de ocorrência era de aproximadamente 2.000.000 km2 no início
da ocupação européia. Hoje, estima-se que mais de 50 % desta área já tenha sido al-
terada (Carvalho et al., 2009). A ocupação humana dos últimos remanescentes tem se
intensi�cado recentemente devido à expansão da agricultura mecanizada de monoculturas
(Frederico, 2010; Spera et al., 2016). O Cerrado possui uma maior heterogeneidade de
ambientes em escala da paisagem que os biomas mais ricos em biodiversidade que ocorrem
no Brasil (Mata Atlântica e Floresta Amazônica). Esta heterogeneidade acontece por que
o Cerrado é formado por um mosaico de vários tipos de vegetação ou de �to�sionomias (p.
ex. campos, savanas, �orestas estacionais e formações ripárias e/ou associadas a corpos
d'água). Esta heterogeneidade ambiental in�uencia tanto a diversidade quanto a estrutura
e dinâmica das comunidades de organismos que ali vivem (Nogueira et al., 2011; da Silva
and Bates, 2002). Apesar da importância e relevância da diversidade de plantas (Simon
et al., 2009) e de animais do Cerrado em nível global (Myers et al., 2000), a conservação
do Cerrado ainda é negligenciada em relação aos outros biomas brasileiros (Klink and
MAchado, 2005). Trabalhos biológicos e ecológicos têm aumentado signi�cativamente nos
últimos anos, porém a maioria dos trabalhos no Cerrado ainda é focado nas características
da �ora e também na produção agrícola na área de ocorrência do bioma (Borges et al.,

22
2015).
1.4 Objetivo desta tese
Assim, vista a importância da estrutura da vegetação para a determinação da diver-
sidade de comunidades de aves e o recente desenvolvimento de ferramentas analíticas ro-
bustas capazes de representar adequadamente os parâmetros desta relação, o objetivo do
presente trabalho é avaliar a relação entre diversidade de aves e estrutura da vegetação no
Cerrado. Nossa abordagem consistiu de duas análises distintas, que irão gerar manuscritos
a serem submetidos e que juntos pretendem prover um panorama inédito do efeito da es-
trutura da vegetação sobre a riqueza de espécies de aves no Cerrado. Inicialmente, será
feita uma análise de estudos publicados na literatura sobre a diversidade de aves em tipos
�sionômicos do bioma Cerrado. Posteriormente também será feita a análise dos resultados
de um estudo observacional que considerou os efeitos da detectabilidade imperfeita sobre
as estimativas da diversidade de aves em um mosaico vegetacional no Cerrado. Espera-se
que, assim como em outros biomas e formações �orestais ao redor do globo, a diversidade
de aves seja maior em áreas com maior complexidade de estrutura da vegetação. Espera-se
também que a estrutura da vegetação irá afetar a detectabilidade das espécies e portanto,
as estimativas de diversidade tomadas das comunidades.

Capítulo 2
Bird diversity and vegetation structure relationship in
Cerrado hotspot, Brazil: Can di�erent sampling
methods a�ect our view of ecological patterns?

24
ABSTRACT
Aim: Analyse the relation of bird species diversity and vegetation physiognomy consider-
ing the in�uence of di�erent sampling methods in describe this relation.
Location: Main region of Brazilian Cerrado savanna hot spot. We search secondary data
in scienti�c literature of the world and in Brazil, including scienti�c papers, Master
thesis and Ph.D dissertations and regionally important biological publications.
Methods: We compiled data about bird species richness surveyed in a gradient of vege-
tation structure formed by di�erent Cerrado physignomies (grasslands, savannas and
forests). These studies also were performed using three di�erent bird sampling meth-
ods: point counts, transects and capture by mist nets. As these data were collected
at di�erent localities and were published in di�erent studies by di�erent authors, we
used a generalized linear mixed model approach (GLMM) to consider the random
variation of the species richness due to these variables. We used a model selection
approach and selected the best models by Akaike information criterion (AIC).
Results: The best model to predict the Cerrado bird diversity was the one that includes
the vegetation physiognomy, the sampling method and interaction among them as
independent variables. Also, the regions where the samples were taken and the
publication where the data were obtained in�uenced the variance of bird species
richness estimation for each physiognomy and sampling method.
Main conclusions: We observed that the in�uence of vegetation structure in methods
e�ciency can potentially a�ect the results and the conclusions of the studies. This
fact could biased our view of this ecological pattern, if the sampling e�ort has not
been su�cient to reach the assymptote of bird richness accumulation curve of each
vegetation type. We suggest that future studies focused in understand ecological
patterns and/or in survey bird diversity to conservation and monitoring programs,
consider the e�ects of detection probabilities to generate reliable estimations about

25
highly diverse and threatened tropical areas.
Keywords: aves, savanna, species richness, habitat structure, conservation, detectability

26
2.1 INTRODUCTION
Vegetation structural heterogeneity is one of the most important environmental drivers
of birds diversity (Tews et al., 2004). This relationship between bird diversity and veg-
etation structure can be predicted by the "Vegetation Structure Hypothesis" (Kissling
et al., 2008) and more generally by the "Resource Specialization Hypothesis" (Srivas-
tava and Lawton, 1998; Hurlbert, 2004). The ecological mechanism behind these two
hypotheses is that the greater availability and diversity of resources in more complex habi-
tats allows more species with di�erent niches to coexist (Srivastava and Lawton, 1998).
Several studies had emphasized that vegetation structure is strongly correlated to the
number of species recorded in a given habitat (Wilson, 1974; Cody, 1985). In the early
1960's, R. H. MacArthur had already observed that bird species diversity in eastern US
forests was strongly related to vertical vegetation pro�le (MacArthur and MacArthur, 1961;
MacArthur et al., 1962). This positive relationship of number of species and structural di-
versity of vegetation was also noted by Wiens and Rotenberry (1981) for shrubsteppe bird
communities in western North American Great Basin. Recently, Hurlbert (2004) showed
that number of North American bird species was greater in more complex and forested
habitats than in open ones, even with both habitats presenting the same productivity.
Then, this result reinforces the role of vegetation structure per se as an important factor
in�uencing the number of bird species in temperate regions.
Unfortunately, this relation of bird diversity and vegetation structure was little explored
at tropical regions. The few published studies were mainly focused in tropical rain forests.
For instance, Terborgh (1977) found a positive correlation of bird diversity and foliage
height pro�le in elevational gradients of peruvian rain forests. More recently and also in
an altitudinal gradient in Peru, Jankowski et al. (2013) also observed that bird species
richness increase with forest canopy height. On the other hand, other types of vegetation
vastly distributed in the tropics, such as woodlands and grasslands, are rarely mentioned,
specially those vegetations that occurs in Australia, Africa and South America (Tews et al.,
2004). In a context of human impacts and disturbances on vegetation in Australia, Kutt

27
and Martin (2010) showed a negative in�uence of woodland thinning and clearing on bird
diversity. Also, in savannas of southern Africa, vegetation alterations due to grazing and
tree removal also in�uenced both the bird species richness and abundance (Seymour and
Dean, 2010). Using woody plant and bird distribution maps of Kenya, Kissling et al. (2008)
also found evidence that the vegetation structure is positively related to the number of bird
species. However, as other results in the same region presented no evidence on the bird
diversity-vegetation structure relation (e.g Kissling et al. (2007), these authors suggested
more studies in this topic to improve the knowledge on the role of vegetation structure for
tropical woodland bird communities diversity.
Vegetation structure varies dramatically even in undisturbed areas within the wood-
land vegetations, notably in the neotropical savannas. "Cerrado" vegetation �the Brazilian
savanna� is the most extense savanna of South America, and encompasses a wide range
of phytophysiognomies, from open �elds to seasonal forests. This habitat heterogeneity
results in a marked gradient of vegetation structure. Even though, the few studies available
that were concerned with the relationship of avifauna and vegetation structure in Cerrado
are not conclusive. This happens because some of these studies provided only a quali-
tative description of bird diversity among phytophysiognomies (Tubelis and Cavalcanti,
2001; Pacheco and Olmos, 2006; Motta-Junior et al., 2008), while others studies showed
an increase of bird diversity with vegetation structure (Pacheco and Olmos, 2006; Fieker,
2012) and some showed even a negative relationship among these two variables (Silva,
2004; Piratelli and Blake, 2006; Rodrigues and Faria, 2007). Nevertheless, a confounding
factor among these studies is that they used di�erent sampling methods to address the re-
lationship of bird diversity and vegetation structure. This is a important factor to consider
because di�erent sampling methods may present biases, which can a�ect the detectability
of species and consequently, of the diversity patterns (Blake and Loiselle, 2001). In this
sense, the evaluation of bird diversity and vegetation structure relationship can be poten-
tially problematic if the census methods are sensitive to vegetation characteristics (Bonter
et al., 2008). Thus, a crucial step to obtain reliable estimates and answer ecological ques-
tions is to know and understand the e�ectiveness and limitations of sampling methods in

28
the characterization of the properties of biological assemblages (Elphick, 2008).
In bird community studies, several methods were developed and had been applied de-
pending on the research focus, �nancial and technical support and even preferences of each
researcher. The three most used methods to sample bird communities are transects, point
counts and capture by mist nets (Bibby et al., 1992). Point counts method depends on
visual and auditive contacts with birds while the observer stays in the same spot during
the sampling time interval. It is indicated to sample bird communities in heterogeneous
landscapes, because it is easier to spatially distribute point counts in the landscape unities
and also it is easier to achieve statistical independence among samples (Bibby et al., 1992).
The transect method also consists in registering bird species visually and/or auditivelly,
but the records are made with the observer travelling along a path during a predetermined
time and space interval. This method is broadly used because it allows the observer to
cover larger sampling areas with less time e�ort and allows accurate estimates of bird
species richness at a site or region (Verner and Ritter, 1985). Finally, mist-netting consists
in capture birds in nets opened usually at 0-3 m high. This method is more expensive and
time consuming than point count or transect methods, but the possibility of capture and
marking individuals allows the observer to gather population and community parameters
with greater accuracy (Bibby et al., 1992). Although each of these methods have their
advantages, they can present some particular biases that could a�ect the e�ciency (i.e.
number of registered species by unity of temporal sampling e�ort) of each one and could
alter the conclusions of the studies as well. For example, point counts can yield under-
sampled estimations of bird diversity by the presence and density of vegetation around
the observation point(Bibby et al., 1992). Line transects can accumulate less records than
point counts by the noise produced during the observer movement and can cause the ob-
server distraction and evasion of birds from the transect vicinity (Roberts and Schnell,
2006). In turn, mist nets rarely span from canopy to the ground and it has been criticized
for undersample bird communities, by the loss of specialists of uncovered vegetation strata
(Bonter et al., 2008). Therefore, it is important not just to know how sampling method in-
�uences diversity estimation, but also to consider their e�ects to adequately represent the

29
properties of biological systems. The neglect of this sampling biases can lead to super�cial
and misguided interpretations of the study results, which may have serious consequences
for the understanding and conservation of biodiversity. This problem could be even more
important in the tropics, which includes very diverse and threatened regions that are still
poorly understood.
Our aim is to analyse the relationship of bird diversity and vegetation structure across
the natural gradient of vegetation structure in the Brazilian savanna. To obtain the data,
we built a comprehensive dataset of studies that surveyed bird diversity in di�erent vegeta-
tion types of Cerrado biome. As our view of this relationship could be a�ected by potential
biases of the avian census methods, we also analyse their e�ects on the estimation of bird
diversity-vegetation structure relationship. We expected that bird species richness would
be higher in more complex and forested vegetation than in less complex ones. Also, we be-
lieve that methods that combine visual and auditive detections and e�ectively cover larger
areas will record more bird species and diversity. We believe that the knowledge of the
vegetation structure and bird diversity relationship and the possible in�uence of sampling
methods will greatly improve the understanding of ecological patterns of bird communities
and can help to develop conservation and monitoring programs to Cerrado communities
as well.
2.2 METHODS
Study region
Cerrado domain is located in the central portion of South America, mainly in Brazil's
territory and it is the second largest biome in this country. It mainly occurs on dys-
trophic, aluminium-rich and well drained soils. As other savannas in the world, the typical
vegetation includes from open and/or dense grasslands (e.g. "campo limpo" and "campo
sujo", respectively), sparse and dense savannas ("campo cerrado" e "cerrado sensu stricto"
woodlands), to closed-canopy woodlands ("cerradão" woodlands and semi and/or decidu-
ous dry forests) and evergreen forested vegetation enclaves ( "mata de galeria" and "mata

30
ciliar" riverine forests). However, Cerrado sensu lato vegetation de�nition includes only
grasslands, savannas and "cerradão" seasonal dry forests, by the major �oristic similarity of
�oras among these phytophysyognomies (Coutinho, 1978; Oliveira-Filho and Ratter, 2002).
The occurrence of these di�erent vegetation phytophysyionomies is determined mainly by
gradients of soils fertility and depth, water saturation and also by occurrence of �re (Ratter
et al., 1997). The in�uence of these factors results in mosaics of vegetation patches, but
most Cerrado vegetation (about 3/4 of total Cerrado area) consists of savanna vegetation
(including open and dense grasslands) and the remainder area is covered by dry forests and
intermediate types between these two (da Silva and Bates, 2002). Besides this great veg-
etation and habitat heterogeneity, the Cerrado biome also bears great diversity and high
rates of endemisms of plants and animals (da Silva and Bates, 2002; Simon et al., 2009;
Nogueira et al., 2011). About 840 bird species are found in Cerrado region (Marini and
Garcia, 2005), which is almost 50 % of brazilian avifauna. Among those, approximately 4
% are endemic bird species (da Silva and Bates, 2002) and almost 12 % are classi�ed as
globally threatened (Marini and Garcia, 2005). Despite the big extension and biological
diversity in the Cerrado region, some authors estimated that between 40 and 60 % of the
total area of the Cerrado has already been converted by human land uses Carvalho et al.
(2009), but other suggested that the loss natural cover could reach 80%, putting Cerrado
as one of the global hotspots of biodiversity (Myers et al., 2000).
Secondary data search
We searched for Cerrado bird community studies in four main sources of data: indexed
scienti�c literature databases, master and PhD thesis databases of brazilian Universities,
regional important non-indexed publications and also for governmental agencies reports
(e.g. management plans of protected areas, environmental assessments). For published
indexed papers, we looked at Web of Science, Scopus and Scielo databases (hereafter WoS,
Sco and Sci, respectively). They are the three most used databases for biological scienti�c
literature in Brazil and cover periods from 1900, 1985 and 2000 to present, respectively.
We inspect these bases from November to December 2013, to �nd studies that contained

31
the keywords in document �elds speci�ed by us (Table A.1, Appendix A.1). In the WoS
and Sco databases, because the wide covering and quantity of studies in them, we searched
for keywords related with our research subject only in study titles, abstracts and keywords
�elds. In Sci database, we looked for keywords in all indices and search �elds, because
the volume of data to trial is manageable and chances of �nd studies of our interest is
greater than in the other two databases. During January-March 2014 we searched for
master thesis and Ph.D dissertations in the Brazilian graduate studies agency (CAPES)
database (http://bancodeteses.capes.gov.br/), which includes the majority of graduation
studies produced in Brazil since 1985. Also, we searched in biology, zoology and/or ecology
graduation courses databases of universities located inside the main Cerrado region (Table
A.2, Appendix A.1), to �nd older documents not included in the CAPES base. In these
databases, we looked for all studies that included both "aves" ("birds" in portuguese)
and "cerrado" keywords in their abstracts. We reviewed all the content of editions and
volumes of regional non-indexed publications in avian, ecological and/or biological research
in Brazil and South America, from 1971 until today (Table A.3, Appendix A.1). We visited
the available volumes in publication websites and the others not available in these online
databases were consulted in the Instituto de Biociências' library collection, at University
of São Paulo, Brazil. Additionally, during November 2013 and July 2014 period, we made
a non-sistematic search on internet using Google search tool site using "cerrado", "bird"
and "vegetation" as keywords. We used this tool to �nd additional studies not included
in the sistematic search and others cited in other study compilations (Accordi et al., 2003,
2005, 005a; Borges, 2008; Morandini, 2013). Finally, during 2015 we review our �ndings
searching for citations of other studies and also asked for recognized authors and researchers
of the area for missing or additional works or compilations that could be interesting to our
subject.
Database construction and inclusion criteria
After a �rst inspection of all study titles and abstracts found in our searches, we
rejected the studies not related with Cerrado birds and/or Cerrado region. We consid-

32
ered only studies performed inside the main Brazilian Cerrado region, excluding others
tropical "savanna" vegetations outside Brazil (e.g., African and Australian savannas and
Venezuelan Llaños), inside Pantanal wetlands or inside Amazonia region ("campinaranas"
or Amazonian savanna enclaves). By great historical and geographical di�erences of these
vegetation types in relation of the main Cerrado region vegetation, the inclusion of these
studies in our analyses could introduce undesirable variation in our data set. After this
�rst step, we created a spreadsheet to tabulate information from 175 potentially interesting
studies. These studies were then screened based on four sequential criteria:
Surveys of Cerrado bird community: We classify all of the 175 studies as surveys
of the entire bird community or not. We reject textbooks and study compilations
that aimed to describe bird diversity of some region or place, as well as theoretical
studies about conservation and distribution patterns of Cerrado birds. Additionally,
we rejected reviews and studies about foraging, reproduction and diversity of a single
or few taxa (usually a single family), foraging guilds (e.g. insectivores) or studies of
mixed �ocks of birds. By applying this criterion, we selected 123 studies that aimed
to survey the entire diurnal bird community of a site, of a region or that presented
data of several �eld surveys in main Cerrado region;
Surveys of typical Cerrado sensu lato phytophisiognomies: Among the 123 stud-
ies selected through the application of the �rst criterion, we exclude those studies
performed in plantations of exotic or native species or in very anthropi�ed sites (i.e.
habitat patches smaller than 30 ha). We also rejected surveys on riparian vegetation
or in areas subject to �ooding or waterlogging (e.g. seasonal �ooded grasslands)
during the most duration of the year. Surveys in decidual or semidecidual forests,
even occuring inside the main Cerrado region, were also excluded of our analyses. We
considered that these sites may present great in�uences of adjacent habitats in birds
assemblages of sampled sites and they also may have di�erent plant species compo-
sition in relation to Cerrado sensu lato phytophysiognomies. Then, we selected a
subset of 99 bird inventories that were performed in typical phytophysiognomies of

33
Cerrado sensu lato, which must be clearly classi�ed by the authors of each study.
Description of sampling method and sampling e�ort: We included only inventories
that used point counts, transects and capture by mist nets to survey birds and con-
tained clear informations about the sampling methods and the sampling e�ort em-
ployed using each one, as well as the sampling e�ort employed in each sampled site.
As sampling methods and sampling e�ort have direct relation with estimation of bird
diversity, both information were used in our analysis to reduce the residual error in
it. We selected 70 studies after the application of this criterion.
Description of bird community diversity per site: We needed that authors must present
the number of species or a list of species by each location. We de�ne as a independent
site in our analysis the sampling unities presented by the authors, with a measure
of bird diversity and the methods and e�ort used to sampling it. The application of
this criterion resulted in a subset of 55 studies.
After the application of our criteria, we inspected the remaining 55 studies to extract
the information we needed. In this step, we excluded six studies that shared data with
other more complete ones. Also, we rejected other 13 studies that used Rapid Ecological
Assessments survey protocol(RAE)(e.g., all governmental agencies reports and some bird
inventories), because we considered this methodology indicated to generate basic knowledge
about the diversity of a site or region, and could not precisely represent the species versus
vegetation structure relation. Finally, we did not locate 14 of the remaining 36 studies
cited during our search. Then, at the end of studies inspection, we selected 22 studies,
which sampled 72 sites distributed in the core and peripheral areas of Cerrado. All these
sites are located at southeast, western, central and north regions of Brazil (Figure 2.1)
and are described in detail in supplementary material (Table A.4, Appendix A.2). Ideally,
all studies should have sampled all phytophysiognomies using the three di�erent methods.
However, we also considered studies that sampled only one phytophysiognomy and using
just one method, to maximize our sample and because our statistical methods were robust
enough to lead with unbalanced designs (see Statistical Analysis section below).

34
Figure 2.1: Map of South America and Brazil, showing the original spatial distribution of the Cerradoregion. In the ampli�ed view, brazilian states names are showed and letters indicates the 26 sampledregions used in our analyses. Regions and sampled sites are described in Table A.4, Appendix A.2

35
Response variable
We used as response variable the species richness in each site, which is obtained by
the number of species detected in the site survey. This measure was also divided by the
log of sampling e�ort in each site, which allowed us standardize the number of species
by e�ort unity. This resultant response variable can be interpreted as the number of
species added in each log of sampling hours and have close resemblance with the increment
of species at the initially steppest growth in species accumulation curves (Gotelli and
Colwell, 2001). In the cases where the authors presented a list of species sampled by
each site (59 of 72 sites, 81% of cases), we calculated the number of species considering
only diurnal species, because nocturnal species (e.g. Tytonidae, Strigidae, Nyctibidae
and Caprimulgidae families) are registered almost eventually during standard diurnal bird
community surveys and probably were undersampled in them. We also did not considered
in the number of species unidenti�ed taxa at the species level (e.g. Elaenia sp.) and we
considered both boreal and austral migratory species as part of the species pool of the
site. The sampling e�ort presented by the authors were obtained of each study methods
by collecting the information in the text or by calculating the total hours of sampling
by number of samples and number of temporal replicates. Point counts were sampled
as periods of 10, 15 and 20 minutes, and varied from to 3 to 30 points in each sample
site. Transects also varied in time period and in length (from 0.5 to 1.5 km) and mist
nets oppened by sampling session varied from two to 25 standard nets (12 m length and
between 2.0 and 3.0 m of heigth and 36 and 61 mm mesh size). As the number of nets
varied greatly and the number of bird species and individuals catched in one net oppened is
very low, we had to rescale the net sampling e�ort as 10 net/hour. As both sampling e�ort
and number of species varied greatly among sites (ranging 2-601 h and 6-201, respectively)
and are non-linearly related, the use of a logarithm scale best met the assumptions of linear
analysis, such as normal distribution of errors and homogeneity of variances. To assure the
validity of this standardization we checked the linear relationship between the logarithm
of the number of recorded species and the logarithm of e�ort time (Figure A.1, Appendix
A.3)

36
Independent variables
We summarized the types of cerrado vegetation reported by the authors in three wide
classes in which all reported subtypes can be securely distinguished (Table A.5, Appendix
A.2). A complete description of the main types of cerrado considered here can be found
at Goodland (1971); Ribeiro and Walter (1998) and more simpli�ed in da Silva and Bates
(2002). These three wide phitophysiognomy classes were used as a categorical variable
in the analysis. The �rst class is Grasslands, that are phytophysiognomies with greater
predominance of grasses, exposed soil or exposed rocks and also few sparse shrubs and
small trees. The second class is Savannas, where the shrubs, treelets and some trees of
between 3 and 8 m forms a distinct strata, as important as the herbaceous layer. The third
and last class is Forests, which include the "cerradão" dry forests. In these physiognomy
there is a continuous and dense tree canopy of 8-15 m high, grasses and forbs are sparse
and the density of shrubs is lower than in savanna and grasslands vegetation types.
In studies revised by us, three methods of bird sampling were used: point counts,
transects and capture by mist nets. Then, we also used information about the sampling
method employed to survey bird community provided by the authors in each study.
As many surveyed sites were in the same geographical region and some were visited
concomitantly during the preparation of the studies, these surveys can not be considered as
completely independent replicates. Then, we considered as independent random variables
the regions where the data were collected, the authors that collected them and the study
where the data was published, which summarizes the e�ects of the sampled region, the
observer e�ect and other study's particularities. For this purpose, we considered as samples
of the same sampled region all samples taken within the same continuous natural area (e.g.
Brasília Natural Park), or those located closer than 2 km from other sampled areas. The
senior author of each study was considered as the main collector of the data and the author
names and publication year was used to identify each publication.

37
Statistical analysis and models construction
We used generalized linear mixed models analysis (GLMM), which is an indicated tool
to analyse data where part of the variation among sampling units is related to known
parameters that are not related with the objectives of the study (random e�ects)(Bolker
et al., 2009). These models uses a Poisson error distribution, that is indicated to model
counting variables and we included the logarithm of sampling e�ort as an o�set in the
model, to standardize at 1 the e�ect of the sampling e�ort on species richness, as we had
already mentioned. We modelled the relationship of dependent variable, recorded number
of species per hour in Cerrado bird communities, with explanatory variables, phytophys-
iognomy and sampling method. Also, we tested if the addition and interaction of the
e�ects of the two explanatory variables could be important to describe the variation of
bird species richness in samples. The addition e�ects hypothesis is justi�ed by the e�ects
of both variables could present on species richness, but these e�ects are independent and
the total e�ect is obtained by the sum of both e�ects. In the case of interaction among
variables e�ects, the e�ect of vegetation structure on species richness will depend on the
sampling method used and vice versa. Also, as cited in the independent variables section
above, we also consider the e�ects of region, authors and publication as random variables,
to modelling variance in the model predicted e�ects. The models construction and sta-
tistical tests followed the Zuur et al. (2009) protocol to analyse nested and hierarchical
data. First, we identi�ed the best random variable structure of the model, including all the
important �xed e�ects in models and testing which of the random variables is/are more
important to represent our data. The selection of the best random e�ects structure were
made comparing the models �t by the AICc model selection criterion (see below). We
constructed 12 GLMM models with the same �xed structure to test which of the random
variables structure presented better �t of the data. We built mixed models with one or
more variables acting as intercept random e�ects and other models with variables acting
as intercept and slope random e�ects (Table A.6, Appendix A.3). Among those, two were
chosen as best models by our model selection criterion: one that included the random
intercept e�ects of sampling region and study author and other that had sampling region

38
and publication as random intercept e�ects (Table A.6, Appendix A.3). We chosen the last
one as the best random e�ects structure because we found only two studies performed by
the same author. For this reason, we think our data did not present replicates enough to
support an author random e�ect. After this step, we selected the best �xed e�ect variables,
using the best random e�ect structure selected earlier. The models evaluated were a nested
set that encompasses the interaction between sampling method and vegetation type, the
additive e�ects of the these two variables and also each e�ect separately. We also included
a null model in the model selection, to test the hypothesis that the dependent variable
is constant or unrelated to the variables. In this step, models also were selected using
the Akaike Information Criterion (AIC), with a correction of this index to small samples
(AICc). The model with smaller AICc was considered the most plausible description of
the data and any other that presented di�erences of model AICcs (∆AICc) lesser than
two were considered equally plausible. All the analyses were made in the R software, using
"glmer" function of lme4 package (Bates et al., 2014). The di�erences among model AICcs
(∆AICc) was computed by "AICctab" function, of bbmle R package (Bolker and Team,
2016). Best model(s) were inspected and validated by the analysis of residuals distribution
for each exploratory variables and by the quantile-quantile plot, to visually check the resid-
uals �t to a normal distribution. By these analyses, no clear evidence of non-normality
and heterocedasticity associated to �xed e�ects was found, which support our choice for
this analysis (Figure A.2, Appendix A.3). To examine our results, we used the parameter
values obtained after the �t of the best model to simulate 10000 similar data sets. We
�tted again the model on these data and calculated the mean predicted richness and mean
con�dence intervals of �xed and random e�ects in each combination of vegetation type
and census method.
2.3 RESULTS
The most plausible model included the interactive e�ects of phytophysiognomy and
sampling method variables (Table 2.1).

39
Table 2.1 - Comparison of linear mixed-e�ects models that describe the relationship of bird speciesrichness with phytophysiognomy and bird sampling methods. The column Model �xed e�ects shows theindependent variable(s) that each model include, the Random e�ects column shows the variables includedas random e�ects. The column AICc shows the values of model's Akaike Information Criterion, correctedfor small samples. The column ∆AICc shows the relative distance of each model to the best model (AICc = 0). The last two columns, df and Weights show the degrees of freedom (number of estimatedparameters) and weights (conditional probability of each model being the best one) of each of the models.Variables legend: Phy = Vegetation phytophysiognomy; Met = Sampling method, Phy:Met = interactionamong Vegetation phytophysiognomy and Sampling Method e�ects; 1|Reg = random intercept e�ect ofsampled region; 1|Pub = random intercept e�ect of publication.
Model Fixed e�ects Random e�ects AICc ∆AICc dfPhy + Met + Phy:Met 1|Reg + 1|Pub 670.63 0 11Phy + Met 1|Reg + 1|Pub 689.19 18.55 7Met 1|Reg + 1|Pub 695.8 25.16 5Phy 1|Reg + 1|Pub 1714.56 1043.92 5Constant 1|Reg + 1|Pub 1721.24 1050.61 3
All other models, including the null e�ects model, presented ∆AICc values higher than
10, which points to low predictive power of these models against the best model (Table
2.1).
The interaction between phytophysiognomy and sampling method indicates that the
e�ciency of di�erent sampling methods to sample species can change among phytophys-
iognomies. Additionally, the random e�ect variables, sampled region and publication,
described the variation of parameter estimations with a standard deviation of 1.33 and
2.41 species per sampling hour, respectively. This means that the value of species ini-
tially expected to occur in each physiognomy using a speci�c method can vary around 3.7
species per hour, only by the sum of the expected variation due to sampled regions and
publications singularities.
The model �xed e�ects predicted that point counts records a mean of more than seven
species per hour in grasslands. The model also predicted that savannas phytophysiog-
nomies sampled by point counts records a mean of almost 11 species per e�ort hour, which
represented an increase in the number of species per hour of around 40 % in relation to
grasslands. Likewise, the model predicted that point counts sample a mean of two species
per hour of e�ort in forests, which is only 30 % of the estimated for grasslands using this
method (Table 2.2). The inspection of the con�dence intervals of these parameters shows
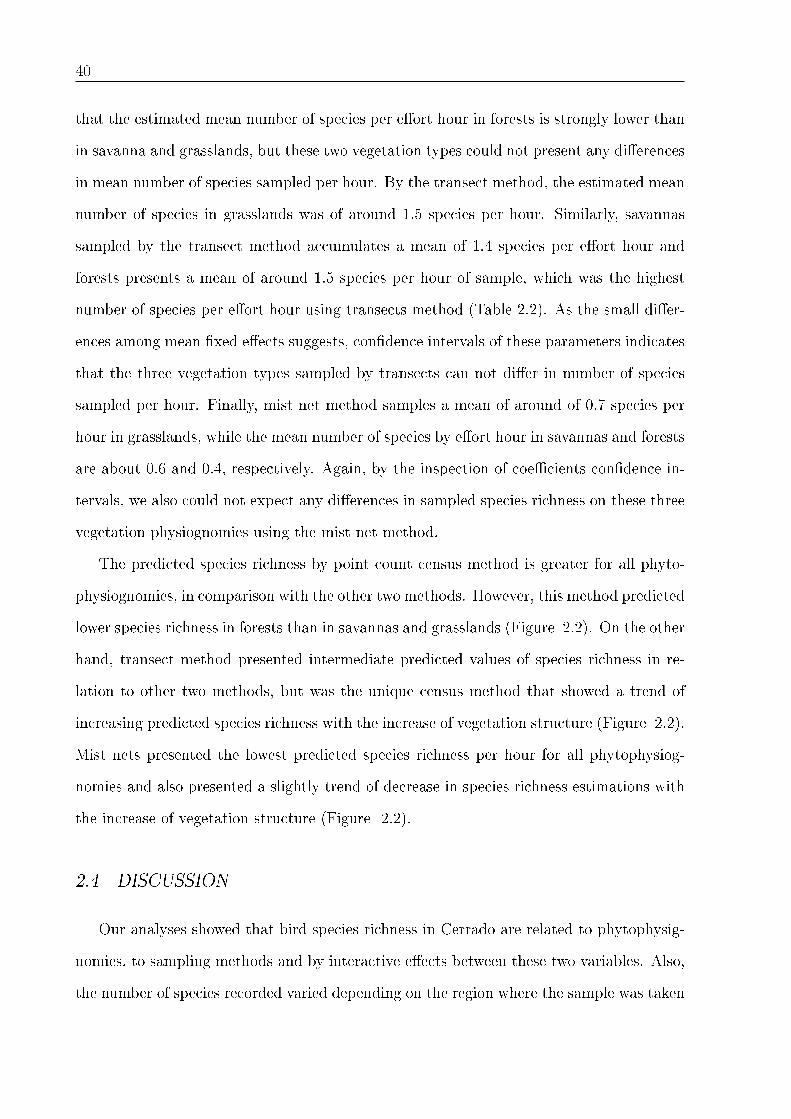
40
that the estimated mean number of species per e�ort hour in forests is strongly lower than
in savanna and grasslands, but these two vegetation types could not present any di�erences
in mean number of species sampled per hour. By the transect method, the estimated mean
number of species in grasslands was of around 1.5 species per hour. Similarly, savannas
sampled by the transect method accumulates a mean of 1.4 species per e�ort hour and
forests presents a mean of around 1.5 species per hour of sample, which was the highest
number of species per e�ort hour using transects method (Table 2.2). As the small di�er-
ences among mean �xed e�ects suggests, con�dence intervals of these parameters indicates
that the three vegetation types sampled by transects can not di�er in number of species
sampled per hour. Finally, mist net method samples a mean of around of 0.7 species per
hour in grasslands, while the mean number of species by e�ort hour in savannas and forests
are about 0.6 and 0.4, respectively. Again, by the inspection of coe�cients con�dence in-
tervals, we also could not expect any di�erences in sampled species richness on these three
vegetation physiognomies using the mist net method.
The predicted species richness by point count census method is greater for all phyto-
physiognomies, in comparison with the other two methods. However, this method predicted
lower species richness in forests than in savannas and grasslands (Figure 2.2). On the other
hand, transect method presented intermediate predicted values of species richness in re-
lation to other two methods, but was the unique census method that showed a trend of
increasing predicted species richness with the increase of vegetation structure (Figure 2.2).
Mist nets presented the lowest predicted species richness per hour for all phytophysiog-
nomies and also presented a slightly trend of decrease in species richness estimations with
the increase of vegetation structure (Figure 2.2).
2.4 DISCUSSION
Our analyses showed that bird species richness in Cerrado are related to phytophysig-
nomies, to sampling methods and by interactive e�ects between these two variables. Also,
the number of species recorded varied depending on the region where the sample was taken

41
Table 2.2 - Summary of best statistical GLMM model �tted to our data. Table shows model coe�cientswith their con�dence intervals, number of total observations, number of levels and estimated variance foreach of the random variables included in the model.
Model coe�cients Values [IC's]Intercept 2.00∗
[1.53; 2.48]Method.mist net −2.32∗
[−2.76; −1.90]Method.transect −1.62∗
[−1.98; −1.27]Phyto.forest −1.22
[−3.21; 0.76]Phyto.savanna 0.36∗
[0.22; 0.50]Method.mist net:Phyto.forest 0.62
[−1.41; 2.65]Method.transect:Phyto.forest 1.28
[−0.71; 3.28]Method.mist net:Phyto.savanna −0.58∗
[−0.96; −0.19]Method.transect:Phyto.savanna −0.37∗
[−0.61; −0.14]Num. obs. 72Num. groups: region 26Num. groups: publication 22Variance: regiao.(Intercept) 0.08Variance: autor.ano.(Intercept) 0.79∗ 0 outside the con�dence interval

42
Figure 2.2: Predicted number of species per unity of e�ort for combinations of each independent variablelevels. Solid lines are predicted number of species by �xed e�ects, dashed lines are the standard deviationaround �xed e�ects predictions, estimated to sampled regions and publication random e�ects and pointsare the observed values of Cerrado bird diversity for each combination of vegetation physiognomies andcensus methods.
and also varied by in�uences of the particularities of each study design, accounted as ran-
dom e�ects. These results predicted by the �xed e�ects are not conclusive to reveal the
well known positive relationship between bird diversity and vegetation structure(Wiens
and Rotenberry, 1981; Cody, 1985; Hurlbert, 2004; Kissling et al., 2008). However, they
pointed to the in�uence of census methods on quantifying the bird diversity (Bibby et al.,
1992; Blake and Loiselle, 2001; Bonter et al., 2008). The interaction among census meth-
ods and vegetation structure e�ects suggests di�erent e�ects of phytophysiognomy in the
sampling e�ciency of each method to register species. Hence, we can expect that cen-
sus methods can in�uence our view of the relationship between bird species richness and
vegetation structure (Mackenzie et al. 2006).
The main part of studies about Cerrado bird communities that we found did not address
the relationship between bird diversity and vegetation structure and physiognomy directly
(Motta Jr., 1990; Lins, 1994; Antas, 1999; Abreu, 2000; Curcino et al., 2007; Braz, 2008;
Sendoda, 2009; Tolesano-Pascoli et al., 2010; Cavarzere, 2013; Pascoal et al., 2013). Other

43
studies were focused in descriptions of bird diversity in diverse and undersampled regions
(Almeida, 2002; Pacheco and Olmos, 2006; Martins, 2007; Costa and Rodrigues, 2012;
Olmos and Brito, 2007) and few ones had investigated quantitatively the relation of bird
diversity with physiognomy in a local scale. (Tubelis and Cavalcanti, 2001; Silva, 2004;
Piratelli and Blake, 2006; Rodrigues and Faria, 2007; Motta-Junior et al., 2008; Valadão,
2012; Posso et al., 2013; Fieker, 2012). Our study presented a view of this question for the
entire biome and also showed how the choice and use of di�erent methods could a�ect the
conclusions of studies on the bird diversity-vegetation structure relationship.
One advantage of the use of mixed e�ects models is to separately quantify di�erent
sources of heterogeneity in the data. In our study, the use of sampled region and publication
as random e�ect variables allow us to incorpore very di�erent studies in our analysis and
measure the variance included in data by these two variables. The heterogeneity between
studies was evident by the comparison of the variance due to publication with the estimated
variance among sampled regions. The estimated variance among papers was almost two
times higher than the estimated variance among regions, which we think will strongly
in�uence our results due to climatic, geographical and ecological singularities of each region.
We believe that some of this great variance found among studies could be due to factors
as number of observers and their survey experience, number of points, number and size
of nets oppened, number and extension of transects, radius census de�nition and another
factors that could introduce heterogeneity in our samples. All these factors, besides basic
information about the diversity surveyed per site and per sampling method, sampling e�ort
and sampling geographical location, were not always clearly described in the studies we
compiled. For these reasons, we recommended that future studies that aimed to survey
bird communities in Cerrado and in other unknown and threatened regions should include
these information of study design in the publications whenever as possible, to also allow
the use of these data in future studies.
Since the beginning of bird ecology studies, the structure of vegetation has been viewed
as one of the most important factors a�ecting bird community diversity (MacArthur and
MacArthur, 1961; MacArthur et al., 1962; Wiens and Rotenberry, 1981). This positive

44
relationship is explained by the e�ect of the vegetation on the number of spots and mi-
crohabitats to nest, sing, shelter and feed, decreasing the competition and promoting
coexistence of more species (Wiens and Rotenberry, 1981). This hypothesis, called as
"Resource Specialization Hypothesis", is invoked as one of the explanations of why the
number of species is greater in tropical forests than in temperate ones (Orians, 1969).
More speci�cally, the derived "Vegetation Structure Hypothesis" has been considered as a
explanation by the increase of bird diversity with increase of structural complexity of vege-
tation (Hurlbert, 2004; Kissling et al., 2008). This relationship of vegetation structure and
bird diversity was also tested and corroborated in Australia (Price et al., 2013) and Africa
(Skowno and Bond, 2003) tropical savannas. However, the evidences for South American
savannas are still inconclusive, mainly by the confounding e�ects introduced by the use of
di�erent census methods.
In a local scale, Tubelis and Cavalcanti (2001) and Fieker (2012) found more bird species
in more complex vegetations than in simpler ones, but they did evaluated only grasslands
and savannas Cerrado vegetation types. These authors attributed the great diversity found
in more complex areas to great opportunities to species colonization. Motta-Junior et al.
(2008) did not statistically analyse the di�erence among number of species in savanna and
grassland vegetations, but found more species in savanna vegetation than in grasslands,
even using in savanna half of sampling e�ort used in grasslands. In turn, Valadão (2012)
and Posso et al. (2013) did not found statistical di�erences in bird diversity among cerradão
forest and cerrado savanna, but found greater bird richness in riverine forests. They
concluded that only riverine forests may provide more resources to species than other
Cerrado sensu lato physiognomies. Alternatively, Silva (2004); Rodrigues and Faria (2007);
Piratelli and Blake (2006) found an opposite trend of lower bird species in forests than
in savannas and �elds. Silva (2004) sampled savanna patches surrounded by forests and
observed some species not exclusively dependent of forest foraging in savannas. He pointed
that savanna bird diversity could be enriched by the in�uence of forests in the nearby.
Finally, Piratelli and Blake (2006) found more species in cerrado than in cerradão and
argued that this pattern could be generated to the major disturbance level in cerradão forest

45
than in savanna or even by the in�uence of the mist net method, that could undersampled
species of mid and upper canopy in cerradão. This latter study was the only among these
studies that mentioned the in�uence of census method in the bird diversity as one of
the possible explanation for the unexpected pattern of decreasing diversity with increase
of vegetation structure. Before him, Macedo (2002) suggested that greater diversity in
savanna than in forest found by Fry (1970) could be due to point counts detection biases
occurring more strongly in forests than in savannas, which is one of the e�ects found in
our results.
Indeed, although many of the ecological mechanisms proposed can be in play, the above
case studies also di�er markedly in their census methods and sampling designs, which can
a�ect the recorded number of species. Our study shows that the three most used methods
can present biases in the number of species recorded per hour in each vegetation type. This
e�ect of di�erent method detectabilities can alter the total number of species recorded in a
site, if the sampling e�ort will not su�cient to reach the assymptote of species accumula-
tion curve (Gotelli and Colwell, 2001). The issue of detection heterogeneity is know since
the half of last century (e.g. Burnham and Overton (1979)) and in the recent years several
studies in temperate regions have proven its importance and proposed di�erent methods to
lead with this potential problem (Boulinier et al., 1998; MacKenzie et al., 2003; Mackenzie
et al., 2002; Dorazio and Royle, 2005). However, this topic deserves more attention be-
cause there is no consensus about the real advantage of it, mainly in very diverse systems.
For example, Banks-Leite et al. (2014) evaluated the conclusions of three case studies that
measure occupancy rates and population size in mammals and birds in tropical region
of Brazil. They found that the results did not change qualitatively if detectability was
considered or not. These authors also argued that the e�ort necessary to estimate de-
tectability in community surveys at large scales is hardly feasible. This controversy points
to the need for a deeper exploration on the relative gain of using methods that consider
di�erences in detection among species, locations and methods, especially in rich and unex-
plored regions, such as the tropics. Alternatively, our study seems to be di�erent because
the variable of interest (bird diversity) can be positively in�uenced by vegetation struc-

46
ture while the vegetation structure itself may negatively in�uence the detectability of the
species. Therefore, we think that studies designed to account for detection heterogeneity
using multi-species occupancy models could help to clarify the importance of detectability
in community ecology studies.
By our results, the e�ect of phytophysiognomy on observed bird diversity depends on
the census method used, which prevents us to make general conclusions about bird di-
versity among phytophysiognomies if census method is not accounted for. According to
da Silva (1995, 1997); da Silva and Bates (2002), 80% of bird species of Cerrado are depen-
dent of forests in some degree, and the remaining 20 % are almost exclusively dependent
on open areas. Also, Blamires et al. (2008) found that the bird diversity in the Cerrado
biome is strongly related to temperature and actual evapotranspiration. These climatic
variables are proxies of vegetation production (Kissling et al., 2008), suggesting a correla-
tion between plant biomass and bird species richness. As the complexity of vegetation in
Cerrado is strongly linked to the increase of plant biomass from the grasslands to forests,
these results suggests that number of species would be greater in forests than in savannas
and grasslands. We observed that only the transect method showed a trend of positive
relation of bird diversity and vegetation structure. Point counts predicted more species in
grassland and savanna vegetations than transects, but was strongly a�ected by increased
vegetation structure in forests, probably by the increase of structures surrounding the ob-
server. Transect method allows sampling in larger areas and can be more e�cient than
point counts to register more sedentary and territorial species. The presence of these
species can be more important specially in forested vegetations, where the home ranges of
species can be smaller, by the higher density of food items in more complex vegetations
(Schoener, 1968). Alternatively, bird species can be warned and could be not detected
by the distraction and noise production while the observer moves on vegetation, which in
point count method is less probable to happen, since the observer remains at the same
place during censusing. These facts could explain why the number of predicted species
per hour using point counts was greater in all phytophisiognomies than the predicted by
transects, and also why the predicted bird richness decreased strongly in forests sampled

47
with point counts. Moreover, we observed that the best model in our analysis predicted a
similar number of species for all the three vegetation types by the mist net method, with
a slightly decrease in estimated bird diversity with increasing vegetation structure. Mist
nets capture more frequently birds that use understory and midstory habitats. By this,
it is possible that the use of mist nets in open habitats will provide a better representa-
tion of the entire community, while in higher vegetation types, the proportion of habitat
sampled will be smaller and captures will possibly re�ect just the diversity where the nets
are opened (Bonter et al., 2008). Then, by all these e�ects, we believe that detectability
should also be considered to evaluate the e�ciency of these di�erent census methods.
Our conclusion is that a positive relationship between bird diversity and vegetation
structure in the Cerrado is not so obvious as we initially expected because the estimates of
diversity in phytophysiognomies varied widely depending on the census methods used. We
believe that sampling designs that allowed the comparison of species richness considering
the detection heterogeneity among environments and among census methods, are essential
to better understand the relationship of bird diversity and vegetation structure in Cerrado.
Based on these informations, we can build reliable conservation plans for this and other rich
and threatened tropical biomes, avoiding misinterpretations of the results and mistaken
conclusions as well(Gimenez et al., 2008).
Acknowledgements
We thank Camila T. Castanho, Sara R. Mortara and Renato A. F. Lima for the impor-
tant suggestions on the initial version of the manuscript and also to Karlla V. C. Barbosa
for the great help in compiling data and building the map of the sampled regions. We also
thank Capes Federal Government Agency and Departamento de Ecologia of Universidade
de São Paulo by the �nancial and institutional support.

48

Capítulo 3
Bird diversity and vegetation structure relationship:
E�ects of vegetation gradients on species richness and
detectability in Cerrado savanna, Brazil

50
ABSTRACT
Vertical vegetation structure and heterogeneity are among the most important variables
in the determination of bird species diversity. Several studies had related di�erent measures
of vegetation structure with diversity and number of bird species around the world. Habi-
tat Heterogeneity Hypothesis proposes that the more heterogeneity and structure of the
vegetation, the greater the resource diversity and resource availability in the environment,
allowing a greater coexistence of the species. We analysed this relationship using data on
the bird species richness and vegetation structure in the Cerrado savanna biome, that is
characterized by a heterogeneous mosaic of habitats that greatly vary in vegetation struc-
ture. Species richness was calculated using bayesian multi-species occupancy-detection
models, which estimate the richness based on the probability of occurrence and detec-
tion of species. In turn, vegetation structure was measured by vegetation presence in 16
height intervals equally distributed between 0 and 4 m. The vegetation data were sum-
marized using principal component analysis, which resulted in two orthogonal axes that
represented 72 % of the variation of data. These two vegetation covariates were related to
species occurrence and also to species detection, since vegetation can in�uence positively
the occurrence and richness but could interfere negatively in the species detections. Other
variables, such as the period of the year and of the day were also used as covariates of
detection. Species richness in each site was estimated by this multi-species occupancy-
detection models and was related to vegetation covariates using a bayesian metanalysis
model. We used a quadratic function to describe the relationship of estimated species
richness with vegetation structure and we also �tted a quadratic GLM model to the ob-
served species richness data, in order to compare the results of both models. Using data
of the 38 most detected species, we noted that estimated and observed species richness
provided qualitatively similar explanations about the relationship of bird species richness
and vegetation structure gradients. Both models predicted higher species richness at the
middle of vegetation height gradient and slightly higher species richness where vegetation
presence below 2 m was high. However, estimated species richness showed less markedly
trends than those of obtained from observed species richness, which pointed to greater in-

51
�uence of imperfect detection at sites where vegetation is characterized by grasslands and
more arboreal savannas, and also where vegetation below 2 m is scarcer. By these results,
we concluded that diversity of most detected bird species weakly responded to vegetation
gradients in our study area in Cerrado and the e�ects of vegetation on species detection
can increase the intensity of the relationship among bird diversity and vegetation. Future
studies focused on include information of the most rare species, as well as other focused
on analyse species dynamics and composition in Cerrado vegetation gradients will gener-
ate valuable information to the ecology and conservation of bird species in this rich and
threatened biome.
Keywords: avifauna, habitat heterogeneity, hot spots, multi-species models,
detectability

52
3.1 INTRODUCTION
Vertical vegetation structure and heterogeneity are among the most important drivers
of bird species diversity (MacArthur and MacArthur, 1961; Wiens and Rotenberry, 1981;
Cueto and de Casenave, 1999; Tews et al., 2004; Ferger et al., 2014). For instance, a posi-
tive e�ect of foliage height diversity on the diversity of bird communities was noted in the
pioneering bird ecological studies of Robert H. MacArthur (MacArthur and MacArthur,
1961; MacArthur et al., 1962). This measurement of vegetation structure was taken by
calculating the diversity of foliage density in horizontal layers at di�erent heights above
the ground, being the most structurally diverse the sites where foliage density varied the
most among the layers. Since then, other studies had related the increase of bird species
richness and diversity with the increase of vegetation height and vegetation strata (Wiens
and Rotenberry, 1981; Cueto and de Casenave, 1999; Jankowski et al., 2013; Azpiroz and
Blake, 2016) and also with the increase of vegetation heterogeneity (i.e. diversity of plant
forms or phytophysiognomies) at local (Poulsen, 2002; Díaz, 2006; Ferger et al., 2014) and
landscape scales (Bohning-Gaese, 1997; Kissling et al., 2008). These studies reinforced the
central role of vegetation structure and heterogeneity for the distribution of bird diversity
in the world. This pattern can be explained by the �Habitat Heterogeneity Hypothesis�
(Tews et al., 2004), or even "Vegetation Structure Hypothesis" as used by Kissling et al.
(2008). These two are mechanistically based on the "Resource Specialization Hypothesis",
which suggests that the increase of habitat heterogeneity (and/or structure) could a�ect
positively the diversity and availability of potential resources in the environment (e.g. food,
perches, shelter and nest sites), promoting specialists occurrence and also the coexistence
of more species (Wilson, 1974; Hurlbert, 2004). Savanna biomes are amenable systems to
test this hypothesis, since it covers around 20% of Earth's land surface (Field et al., 1998)
and presents great vegetation heterogeneity at local and regional spatial scales. Vegeta-
tion types in savanna ranges from open grasslands to forests, often arranged in complex
mosaics. This heterogeneity is maintained by some kinds of disturbances, such as grazing,
browsing and �re occurrence (Doughty et al., 2016). Cerrado Brazilian savanna is the sec-
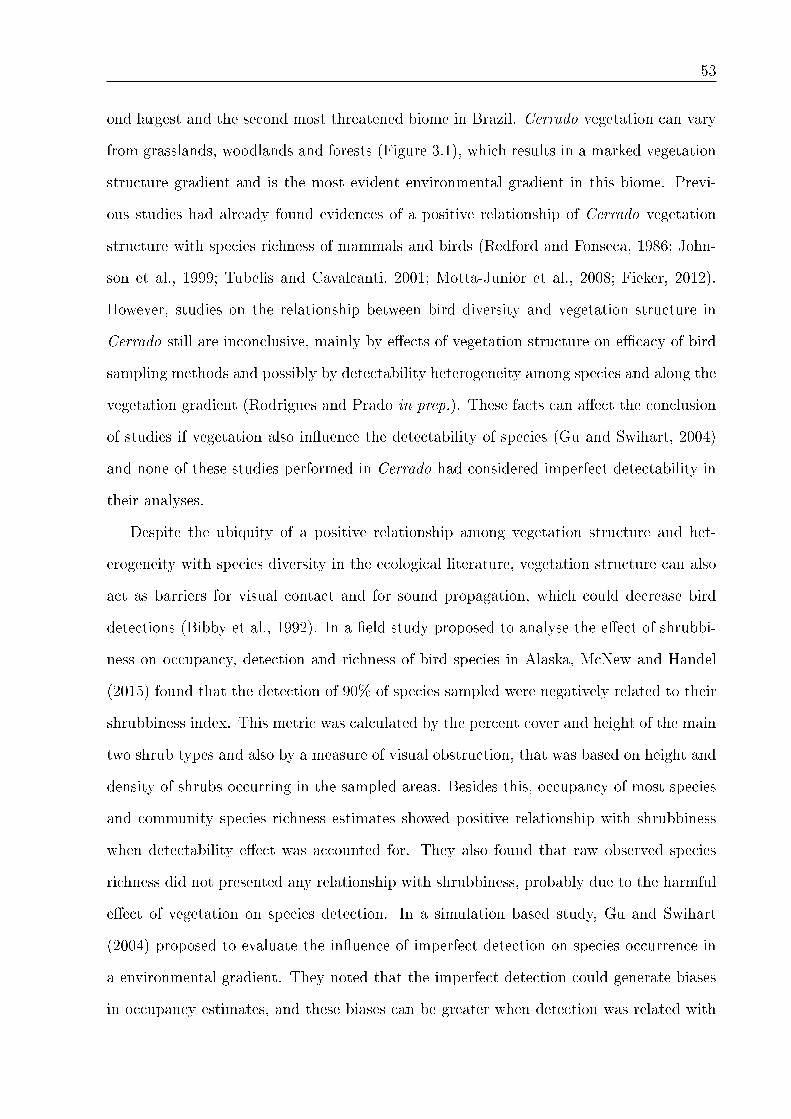
53
ond largest and the second most threatened biome in Brazil. Cerrado vegetation can vary
from grasslands, woodlands and forests (Figure 3.1), which results in a marked vegetation
structure gradient and is the most evident environmental gradient in this biome. Previ-
ous studies had already found evidences of a positive relationship of Cerrado vegetation
structure with species richness of mammals and birds (Redford and Fonseca, 1986; John-
son et al., 1999; Tubelis and Cavalcanti, 2001; Motta-Junior et al., 2008; Fieker, 2012).
However, studies on the relationship between bird diversity and vegetation structure in
Cerrado still are inconclusive, mainly by e�ects of vegetation structure on e�cacy of bird
sampling methods and possibly by detectability heterogeneity among species and along the
vegetation gradient (Rodrigues and Prado in prep.). These facts can a�ect the conclusion
of studies if vegetation also in�uence the detectability of species (Gu and Swihart, 2004)
and none of these studies performed in Cerrado had considered imperfect detectability in
their analyses.
Despite the ubiquity of a positive relationship among vegetation structure and het-
erogeneity with species diversity in the ecological literature, vegetation structure can also
act as barriers for visual contact and for sound propagation, which could decrease bird
detections (Bibby et al., 1992). In a �eld study proposed to analyse the e�ect of shrubbi-
ness on occupancy, detection and richness of bird species in Alaska, McNew and Handel
(2015) found that the detection of 90% of species sampled were negatively related to their
shrubbiness index. This metric was calculated by the percent cover and height of the main
two shrub types and also by a measure of visual obstruction, that was based on height and
density of shrubs occurring in the sampled areas. Besides this, occupancy of most species
and community species richness estimates showed positive relationship with shrubbiness
when detectability e�ect was accounted for. They also found that raw observed species
richness did not presented any relationship with shrubbiness, probably due to the harmful
e�ect of vegetation on species detection. In a simulation based study, Gu and Swihart
(2004) proposed to evaluate the in�uence of imperfect detection on species occurrence in
a environmental gradient. They noted that the imperfect detection could generate biases
in occupancy estimates, and these biases can be greater when detection was related with

54
the habitat covariates. In this case, biases can also be more or less pronounced depend-
ing if detection and occupancy are positively or negatively related with habitat variables
(MacKenzie et al., 2006). Other studies also pointed to a potential in�uence of vegetation
structure, as well as other variables such as season, weather and noise, on species detectabil-
ity (Stau�er et al., 2002; Zipkin et al., 2010), despite the e�ects of some of these variables
have not yet been tested. Occupancy-detection models include an important theoretical
re�nement for many biological and ecological studies, that is the consideration of species
detection and species occurrence as two di�erent, but linked, processes. These models
had been used from population to metacommunity studies and they had pointed to the
importance of considering detectability heterogeneity to determine accurately occupancy
and also species richness patterns (Zipkin et al., 2010; Ruiz-Gutiérrez and Zipkin, 2011;
Mihaljevic and Johnson, 2015). These studies argues that detection heterogeneity should
be included in studies to avoid misunderstanding of ecological patterns and processes and
consequently to misleading conservation and management actions as well. However, these
models presents a cost in relation to traditional methods due to the higher sampling e�ort
needed to achieve accurate parameter estimates. Detection probabilities are calculated
based on repeated surveys of the same site in a short period of time and very rare and
cryptic species hardly will provide su�cient data to permit these estimates, even with
unrealistic high sampling e�ort (Banks-Leite et al., 2014). Even though, these models
that consider detection heterogeneity can be specially important to better inform policy
makers in situations of species and ecosystems management and also in the development of
ecological studies focused on determine species responses to environmental gradients, such
as those found in the in Cerrado savanna and other heterogeneous vegetation mosaics.
Therefore, our study aimed to analyze the relationship between bird species richness
and occupancy and vegetation structure in the Cerrado savanna vegetation mosaic. We
proposed to do this considering also the potential e�ects of imperfect detection on species,
di�erent habitats and sampling occasions, which we believe will provide a more accurate
view of the species-habitat relationship in the Cerrado biome. To do this, we used a
multi-species occupancy model approach to investigate how species species richness and
55
occupancy were related with habitat covariates. At the same time, we quanti�ed the
e�ects of these habitat covariates and other sampling covariates on detection of species
during our surveys. We expect that bird species richness will increase with vegetation
structure gradient in a Cerrado vegetation mosaic, as proposed by the "Habitat Hetero-
geneity Hypothesis". However, we also expect that vegetation can also negatively a�ect
our perception of this relationship, through biases caused by imperfect detection.
3.2 METHODS
Study area
We collected data of species occupancy and detection in sites at the Grande Sertão
Veredas National Park (PARNA-GSV), Central Brazil (Figure 3.1). The climate of the
region can be de�ned as "Aw", by Köppen classi�cation, or tropical with a marked dry
season during winter (April-October period). The rainy season extends from November
to March and almost all rainfall (1200 mm annual average) occurs in this period. The
park has an area of 223,000 ha of well preserved Cerrado, however, north Minas Gerais
and south Bahia, as well as other big Cerrado remnant areas, are being fastly occupied by
monocultural plantations (Spera et al., 2016). The vegetation of the region is characterized
by di�erent Cerrado vegetation types, from grasslands to woodlands and forests. Some
vegetation types are strictly associated with presence of water bodies, such as seasonal
humid grasslands, riparian and gallery forests and also "Veredas" palm swamps. As we
are interested in vegetation structure e�ect on bird communities, our study focused only in
the Cerrado lato sensu gradient, that include grasslands, savannas and dry forests. These
vegetation types occurs in more elevated areas and frequently in vegetation mosaics. The
spatial distribution of these patches are determined mainly by gradients of soil depth and
fertility, and also by �re occurrence (Ratter et al., 1997; IBAMA, 2003). We searched
for homogeneous patches of vegetation of at least 400m of radius, where we centrally
located our sampling sites. However, some of patches were less wide but longer (e.g. some
grasslands adjacent to Veredas swamps presented 50 m wide, but more than 1 km long),

56
which we believe to be patches larger enough to house bird communities that are related
to habitat features.
Figure 3.1: Cerrado vegetation distribution map in Brazil and detailed view of sampling points locationinside Grande Sertão Veredas National Park area. Pictures at the bottom shows examples of sampled sitesin the vegetation gradient. A: grasslands; B: open savanna; C: savanna
Bird sampling
We distributed 32 sampling sites (at least 400m distant from each other) in a gradient
of Cerrado lato sensu vegetation structure, including patches of grasslands, open and more
dense and arboreal types of savanna; Figure 3.1). We distributed our sites in two main
areas of the park, which was done to represent a larger area and to reduce the travel time
and distance to visit the sites. We avoided areas with history of human occupation or
disturbance. These areas are concentrated around the houses of former residents of the
park area and were identi�ed by the report of park rangers. The �eldwork was carried
out in two sampling seasons of 20 days each, during November-December 2014 and march

57
2015. These sampling periods were planned to sample bird community during the rainy
season, which is the main reproductive period of Cerrado birds and when species present
greater activity. Bird samplings were done from sunrise to the next four hours, which is
the period of highest activity of most Cerrado birds.
Study design
We set two transects of 200 m length in each of the 32 sites. The transects ran perpen-
dicular of roads and were at least 50 m apart. Surveys in these transects were made using
the transect method of bird census, which consists to register birds while the observer
travels by a path with constant speed (Bibby et al., 1992). Each sample period lasted 20
minutes and were made by two doubles of observers (one observer and one �eld assistant),
which allowed us to survey the two transects of each site simultaneously. During the sam-
pling, the observer and the assistant walked in the transect with constant speed (1 km/h)
and recorded and identi�ed all birds seen or heard inside a bu�er of 100 m around the
transect. After the �rst period of sample in each site, observer doubles alternated transects
and both observers initiated another sample period at the same site. Then, we collapsed
data of these four sampling periods (two samples of 20 minutes of each observer), which
resulted in sampling occasions of 80 minutes. Also, half of the 32 sites were surveyed
once and the other half two or three times during each sampling season. We assumed
that each sampling season is closed to non random species migration, then, this temporal
replicates in each season of sampling allowed us calculate detection probabilities of species
(MacKenzie et al., 2006).
Covariates of habitat and detection
We measured the vegetation structure in each sampling site by using an adaptation
of Wiens and Rotenberry (1981) method to characterize shrubsteppe vegetation in US.
This measurement consisted of counting the presence of vegetation in 16 height intervals
(approx. 22.5 cm each) in 20 vegetation sampling points in each transect. Each measure
of vegetation structure had been taken every ten meters, alternating the two sides of each

58
transect. To help in this task, we used a 4m long bamboo rod with marks delimiting each
height interval. We recorded the intervals where any live vegetation (grass, herbs, shrubs,
trees) was in contact with the rod. We used a PCA analysis to summarize the count data of
vegetation presence by height intervals. This analysis was made using "prcomp" function
of stats R package and we scaled and centered at zero our variables to reduce skewness
and standardize the variances (Venables and Ripley, 2002). We used the �rst two axes of
PCA analysis (hereafter PC1 and PC2) as our vegetation structure covariates. The total
percentage of variation presented by these two PCA axes was 72.1% (53.8 and 18.3% for
PC1 and PC2, respectively). PC1 ordered the sampled sites by the increase of presence of
vegetation by height (Figure 3.2). Grasslands sampling sites, which have predominance of
vegetation presence in the �rst height interval presented PC1 values lesser than -2, while
open savanna sampling sites presented PC1 values from -2 to 1 and arboreal savanna sites
presented PC1 values from 1 to 6 (Figure 3.2). On the other hand, PC2 axis presented
negative values for points with greater presence of vegetation in the lower 1.5 m (from 1 to
7 height intervals, mainly open savanna sampling sites) and positive values for sampling
sites that presented greater presence of vegetation in the �rst height interval and above
1.5 m height (grasslands and savanna sampling sites) (Figure 3.2).
In the same way we believe that vegetation structure could a�ect positively the bird
species richness, we think that vegetation structure could a�ect negatively bird detection.
Then, as we sampled sites disposed in a vegetation gradient, we thought we also need to
include the two vegetation structure variables (PC1 and PC2) as covariates of detection.
Additionally of these two covariates of detection, we also included the date of each sample
(converted to count data, being �rst season receiving values from 1 to 20 and second
season values from 21 to 38) and the mean temperature during the sample as covariates
of detection. As our samples were taken during the rainy season (and after the incoming
of migrant species in communities), we did not expect non-random changes in species
occupancy between the two sampling periods. However, we decided to model detectability
e�ects between sampling periods, to reduce detection heterogeneity among samples. In the
same way, as temperature can present a negative e�ect on bird detections and it increases

59
Figure 3.2: Ordination plot of Principal Component Analysis (PCA) for vegetation structure of sampledpoints.
fastly during the day specially in more open vegetation types of Cerrado, we also modelled
the potential e�ects of mean temperature during the samples in bird detections. Both count
dates and temperature variables were standardized to improve parameters convergence.
Response variables
As explained above, we sample all birds seen or heard inside a bu�er of 100 m wide
around the transects, excluding species observed �ying over the transects and also species
inside the bu�er but using another vegetation type (e.g. species detected inside Veredas
swamps was not considered in samples of adjacent grasslands). We just recorded the pres-
ence of each species per sampling occasion. Then, we estimated the number of species in
each site using a multi-species occupancy models approach. The idea behind this approach
is to calculate the occupancy of each species at each point, considering also the probability
of detection of each species in each site and in each sampling occasion (see details below).
After that, occupancy probability is translated in presences or absences of species given
our occupancy-detection model and the number of species is estimated by summing the

60
number of species that was estimated to occur in each site (Kéry and Royle, 2016). Al-
ternatively, total number of species recorded during all sampling occasions was used as
our naive estimation of species richness in each site. To access the occupancy patterns of
species in the vegetation gradient, we analysed occupancy estimates for each species and
for each site. This procedure allowed us to evaluate if some regions of the gradient are
more densely occupied than others, which can give us an additional view of the use of
vegetation gradient by bird species.
Statistical models and analyses
Despite the idea of detectability heterogeneity a�ecting the estimates of population size
dates back the 1970's (Otis et al., 1978), the hierarchical model of occupancy used by us
was recently developed by Mackenzie et al. (2002) and nowadays had gained much more
attention. These occupancy models are considered hierarchical because they represent two
di�erent, but linked processes: the �rst is the underlying ecological pattern of occupancy,
which we are more frequently interested to, and the second is the sampling process itself,
which is directly a�ected by detection heterogeneities among species, sites, sampling pe-
riods and/or other variables as well. By expanding this �rst development, other models
and protocols are being proposed to analyze and estimate occupancy and detection of
multiple species simultaneously (Kéry and Royle, 2016), or even to estimate parameters
for community and metacommunities (Sutherland et al., 2016). We used the two-step
multi-species analysis, which is the most simplest protocol for estimate species richness
and relate it with habitat variables (Kéry and Royle, 2016). In this approach, the �rst
step consists of estimating species richness from species occupancy in each site, by using a
occupancy-detection bayesian hierarchical model (BUGS code in Appendix B.1). We used
Bernoulli distributions to model the occurrence and detection of species in each site and
sampling occasion. Then, the occurrence of each species in each site can be represented by
z[i, k] ∼ Bernoulli(ψ[i, k]), where z is a latent variable of the presence or absence of each
species per site given our model and species-site ψ, i is the indexation for sites, k is the in-
dexation for each species and ψ is the probability of occurrence. The detection probability

61
of each species, however, is calculated by each sampling occasion, and the detection of each
species can be represent as d[i, j, k] ∼ Bernoulli(z[i, k]p[i, j, k]), where d is the detection
or non detection of species during that survey (given the species is present in that site
i.e. z[i, k] = 1), j is the indexation for the sampling occasions and p is the probability of
detection for each species per site and sampling occasion. These probabilities (ψ and p)
were related with covariates by imposing that mean logit of these probabilities are linearly
related with covariates. Then, these relationships are described by logit(ψ) = β0 + β1x
logit(p) = α0 + α1x , where β0 and β1 are the intercept and slope of the linear relation-
ship of occupancy and the covariate, α0 and α1 are the intercept and slope of the linear
relationship of detection and the covariate and x is the covariate of occupancy/detection
itself. The number of species per site was calculated by the sum of species occurring in
that site given our model (i.e.∑z[i, ] ) and the mean number of species and uncertainty
around these estimates per site were calculated by the estimated species richness obtained
in each model iteration.
The second step consists of relate mean number of species and uncertainty around
the estimates with habitat variables, using a bayesian metanalysis model (BUGS code in
Appendix B.1). In this model, the species richness of each site was modelled by using a
Normal probability distribution function, with mean number of species varying quadrati-
cally with habitat covariates, namely, N [i] ∼ a+bx+cx2+e[i], where i is the index for each
site, a, b and x are the intercept, slope and covariate of interest, respectively, and e[i] is the
uncertainty associated to the previous estimate of species richness. We ran the occupancy-
detection and metanalysis models using jags software and rjags R package, being the �rst
used to implement MCMC algorithm for estimate parameters and the latter was used to
allow connection of R software with jags. For the occupancy-detection hierarchical model,
we estimated the parameters using three MCMC chains and 30000 iterations. The 5000
initial values were discarded (burn-in) and one within 25 estimates (thinning rate) was
stored as sample of parameters posterior distributions. In the case of metanalysis models,
we also used three MCMC chains but 12000 iterations each and 2000 burn-in iterations
and also 1/10 of thinning rate. In all models trails, we used uninformative priors for all

62
parameters (ψ and p Uniform(0, 1) and other model coe�cients and species richness N
Normal(mean = 0, sd = 0.001). we used 0.4 as initial values of ψ and p probabilities
for all species and initial values of other parameters were sampled from random Normal
distributions (rnorm function on R, with mean = 0, sd = 0.001).
Model inference and evaluation
We constructed two sets of models, one where occupancy, detection and species richness
were related to PC1 and other where these quantities are related to PC2. Both sets of
models include dates and mean temperature as covariates of detection. We opted to make
inferences only on these models, because multiple comparison of multi-species hierarchical
models (using some model selection and comparison criterion, such as DIC) can become
inconclusive due to possible di�erent species responses to environmental gradients (Carrillo-
Rubio et al., 2014). In our case, this separation of models with di�erent habitat covariates
also prevent for non convergence during model parameters estimations, since with our data
with were not able to estimate both covariates e�ects in the same model. Therefore, our
models of occupancy, detection and species richness can be described as
z[i, k] ∼ Bernoulli(psi[i, k]), logit(psi) = a+ bPC (3.1)
d[i, j, k] ∼ Bernoulli(z[i, k]p[i, j, k]), logit (p) = a+ bPC + cJD + dMT (3.2)
N [i] ∼ Normal(N [i], tau[i]), N [i] = a+ bPC + cPC2 + e[i] (3.3)
, where PC stands for PC1 or PC2, in each model and JD and MT are dates and mean
temperature covariates, respectively. All parameter estimates were checked for convergence
by calculating the R-hat convergence metric (R-hat <1.1 means convergence of chains
parameter estimates) and by visual inspection of chains convergence using the function
"traceplot" of coda R package. Model �t assessments were made using bayesian p-value
and posterior predictive checks (Gelman, 2003), which were calculated by using chi square
statistic as discrepancy measure and implemented by the "ppcheck" function of jagsUI R

63
package (Kellner, 2016) (Figure B.1, Appendix B.2)
3.3 RESULTS
We recorded 140 bird species from 14 orders and 36 di�erent families (Table B.1,
Appendix B.3). However, model parameters of rare species (less than 20 records) presented
greater chances of non convergence in MCMC chains, which seemed to bias our view
of species richness-vegetation structure relationship (Figure B.2, Appendix B.4, see also
Discussion). Then, we repeated our analyses using just the 38 most detected species (those
with more than 20 records) and we presented these results below. The mean estimated
number of species per site after correcting for imperfect detection was 26.47 (sd = 2.96)
if we use PC1 as a covariate in the model and 25.61 (sd = 3.63) for PC2, while the mean
number of observed species was 18.96 (sd = 6.93), which is lower that estimated species
richness and presented standard deviation almost two times higher than we observed for
estimated species richness. The inspection of both GLM and Bayesian multi-species models
coe�cients did not show relevant di�erences among them (Table 3.1). Also, both models
presented the same relationship for PC1 and PC2 covariates, but credible intervals of
Bayesian models were slightly narrow than con�dence intervals of GLM model coe�cients
(Table 3.1).
The relationships of estimated species richness with PC1 habitat covariates showed
that estimated species richness are slightly greater at lower and intermediate values of
PC1, while observed species richness was higher at intermediate values of PC1 (Figure
3.3). In turn, the relationship of estimated species richness with PC2 vegetation structure
covariate was weak but negative, while the observed species richness was negatively related
with PC2 vegetation covariate (Figure 3.3).
The analysis of species occupancy showed that the mean occupancy in the model with
PC1 as covariate was 0.68 and varied from 0.001 to 0.998 and was 0.66, but varied between
0.0003 and 0.999 in the model with PC2 as covariate. Species occupancy values seemed to
be higher at intermediate and high positive PC1 values, which represented the sites with

64
Table 3.1 - Comparison between Bayesian multi-species (estimated species richness considering speciesoccupancy and detection) and GLM (naive observed species richness) models coe�cients. We also show theBayesian Credible Intervals of 2.5% and 97.5% of Bayesian model coe�cients and Con�dence Intervals of2.5% and 97.5% for GLM coe�cients estimates. a, b and c model coe�cients are the intercept, linear andquadratic e�ects of the covariate on response variable, respectively. The asterisks highlight the coe�cientswhere BCI and CI intervals did not include 0.
Model Covariate Coe�cient Value IC(2.5%) IC(97.5%)Bayesian PC1 a 28.37 26.69 29.97
b 0.42 -0.05 0.88c -0.18 -0.34 -0.02*
GLM PC1 a 22.70 19.31 26.09b 0.67 -0.25 1.61c -0.44 -0.75 -0.13*
Bayesian PC2 a 26.9 25.45 29.97b -1.80 -2.61 -1.03*c -0.33 -0.67 0.01
GLM PC2 a 19.01 16.14 21.88b -2.08 -3.67 -0.48*c -0.01 -0.69 0.66
Figure 3.3: Relationship of estimated and observed (naive) species richness with vegetation structurecovariates. White points and gray lines are the estimated species richness and 95% credibility intervalsaround the estimates. Solid blue lines are the species richness-vegetation structure model predictions anddashed blue lines are the 95% lower and upper credibility intervals. Solid black circles are the observed(naive) species richness for each site and solid red line is the prediction of a quadratic glm Normal-errormodel �tted to naive data.

65
greater vegetation presence at intermediate and high height intervals, respectively (Figure
3.4). The sites that presented lower PC1 values and represented grasslands sites presented
lower occupancy values for the majority of species (Figure 3.4). For the PC2 covariate,
species occupancy was higher for lower values of this covariate and the majority of species
also presented higher occupancy values near the middle of the gradient (between -1 and
0 PC2 values) (Figure 3.4). Negative values of PC2 covariate represented the sites with
greater presence of vegetation below 2 m and intermediate and positive values of PC2
represented the sites with less vegetation presence in intermediate height intervals.
Figure 3.4: Occupancy patterns of species for the two vegetation gradient covariates. Cells colors are"warmer" where species presented higher occupancy values at each site. Species were ordered in rows bythe mean of PC1 (or PC2) score divided by species occupancy at that site. In turn, the columns wereordered by increasing values of each habitat covariate.
Additionally, mean detection probabilities in the PC1 model covariate was 0.32 and
varied from 0.007 to 0.90, while in the PC2 model covariate mean detection was 0.33 and
varied from 0.003 to 0.95. Inspection of model's detection coe�cients showed that the e�ect
of PC1 habitat covariate on detectability depended on the species, being approximately
half of species responding negatively and the other half positively related to this PC1
covariate. (Figure 3.5). PC2 habitat covariate also presented a negative relationship
with detection for almost half of species, while the other half of species presented their
detection positively related with PC2 habitat covariate (Figure 3.5). The other covariates
of detection, dates count and mean temperature during the samples, also presented positive

66
and negative e�ects on detectability of some species for both set of models (Figures 3.5).
These parameter estimates showed that the e�ects of these variables on detection seemed
to be quite variable among species.
Figure 3.5: Histograms of detectability parameter values for each model. Top graphs are parameter valuesfor that model where detectability and occurrence were related to PC1 covariate. Bottom graphs are thesame parameters but for the model that include the e�ects of PC2 covariate on detectability and occur-rence. From left to right: values of intercept coe�cient, slope values for detection and habitat covariaterelationship, slope values for detection and count dates sample covariate relationship and �nally, slopevalues for detection and mean temperature sample covariate relationship. Black vertical lines representthe mean value of the coe�cients for all the 38 species analysed.
3.4 DISCUSSION
Our work is the �rst study on the relationship of bird species richness and vegetation
structure in Cerrado savanna that consider potential e�ects of vegetation on detectability.
The models that considered vegetation e�ects on species detectability pointed to slightly
greater number of species at sites with vegetation at the intermediate height values and
at sites with more presence of vegetation below 2 m. These relationships of species rich-
ness and vegetation gradients were also found when we considered the number of observed
species (naive estimate of species richness) as our diversity measure, but in this case the
relationships seemed to be more pronounced than those presented for estimated species
richness. These results were contrary to our initial expectations, since most supported
hypothesis in the literature proposes monotonic increase of species richness with increase

67
of vertical vegetation structure, which in our study was represented by the PC1 covariate.
On the other hand, the positive relationship of species richness with PC2 covariate showed
that vegetation presence below 2 m indicated that species can be responding to the shrub
component of vegetation, which are more abundant in open savanna sites and which are
those sites with lower values of PC2 covariate. Since occupancy values we used to cal-
culate species richness in our approach, species occupancy also was slightly higher at the
middle of the PC1 vegetation gradient. In turn, PC2 vegetation gradient presented higher
occupancy values at the lower limit and also at the middle of this vegetation gradient.
Detectability e�ects varied greatly among species and we did not observe a general pattern
of species detection responses to the covariates. However, the e�ects of imperfect detection
during all samples was highlighted by the higher mean and lower variance of estimated
species richness in relation to observed species richness and also by the less pronounced
relationships of species richness and vegetation gradients when we consider detectability
heterogeneity in species richness estimates. Then, if we use the observed species richness we
could underestimate the presence of species and overestimate the importance of vegetation
gradient to them, even we considering just the most detected species that are supposed to
be less a�ected by problems related to imperfect detection.
The faster decrease of observed in relation to estimated species richness at both ends of
vegetation height gradient and also in the areas with less presence of vegetation below 2 m
suggests that detection can be in�uenced by vegetation characteristics. Canopy species can
be less detected by the observer if they uses the upper part of the canopy, which is farther
from the observer and darker, depending on the height and density of this vegetation
layer. In a similar way, grass density is greater and the presence of perches is lower in pure
grasslands than in open and arboreal savannas physiognomies. This habitat characteristics
lead species that uses grasslands to forage on the ground and inside grass thickets, which
could contribute to lower detection rates of species by the observer in the lower end of
the vegetation height gradient. Consequently, species would be more detected in that sites
where vegetation presented more shrubs and other vegetation forms in heights near to the
observer's height of view. Macedo (2002) had already pointed that bird species probably

68
presented lower detection probabilities in forests than in savannas, which could explain
the greater species richness in the latter in relation to the former physiognomy, that was
the result found by Fry (1970). On the other hand, McNew and Handel (2015) found that
the shrubbiness of vegetation (a measure of visual obstruction of vegetation at a height
of 0.5 m and the percentage and height of the two main types of shrubs in their study
area) a�ected negatively the detection of 90% of the bird species in an Alaskan tundra.
They also found that ignoring this negative e�ect of vegetation on detectability could alter
the view of bird species richness-vegetation relationship. Then, the results of these two
latter studies supports our �ndings that vegetation height and also density could a�ect
bird species records and possibly may a�ect the conclusions of ecological studies as well.
In our study, the weaker relationship for estimated species richness in relation to ob-
served species may signalize that the species does not have preferences for certain parts of
the vegetation gradients in this Cerrado area. This result can be expected if we remember
that in our analyses we restricted the species pool to the most detected species, that were
also the most common bird species and probably those with less environmental require-
ments. However, Zipkin et al. (2010) used other approach to calculate species richness and
they found that relationship of understorey foliage and tree basal area with bird diversity
became more evident when they calculated bird community richness using occupancy-
detection approach rather than using only the observed species richness. McNew and
Handel (2015) also found that the use of multi-species models revealed a positive relation-
ship of bird species richness and vegetation structure, while the naive species richness did
not show any relationship with their vegetation structure measurement. The approach
used in these studies include all species recorded and the estimates of rare species param-
eter is feasible by assigning a common distribution for species parameters. Then, species
are considered as random e�ects into the model and abundant species provide information
about the distribution of parameters and consequently, for the parameters of rare and
cryptic species as well. We opted by the two-step approach for two main reasons: the �rst
is that we can calculate and incorporate uncertainty of species richness estimation in our
metanalysis model, which we believe to be important to consider to a better interpretation
69
of the relationship between psecies richness and the vegetation gradient; the second is that
this model was tested via simulations by McNew and Handel (2015) and it presented some
biases in represent the true relationship of species richness and an environmental gradient.
These biases arised by the dependence of all species to a common distribution, which could
force the species responses in the same direction. This assumption seems to be unreal in
our situation, since some species presented opposite relationships to the same gradient.
Thus, besides our approach is more conservative, our results provide a more accurate and
informative view of the bird community diversity and vegetation structure relationship
than other studies that focused their inferences in models �tted to individual species or
those that uses naive data without considering detectability heterogeneity among samples.
We also model the relationship of total number of species, irrespective to the quantity
of data, with our vegetation structure metrics and the results of these relationships are
quite di�erent to those observed for the naive data (Figures B.2 and B.3, Appendix B.4).
In this case, species richness are greater in the both ends of the two vegetation gradients,
while naive species richness presented the same observed pattern (but weaker) than those
observed for the smaller data set. Besides the di�erent patterns assigned by the two
diversity metrics, the di�erences between values of estimated and observed species richness
greatly increased, which pointed to bigger loss of using observed rather estimated richness
values. According to Banks-Leite et al. (2014), one of the disadvantages of using species
with insu�cient data is that occupancy-detection model tends to attribute occupancy
values close to 1, but uncertainty around this parameter and in detection probability will
be huge. This fact would increase the number of species occurring in sites where many
rare species occurs, which will change dramatically the shape of species richness-vegetation
relationship. Besides the risk of in�ate species richness by the inclusion of rare species,
the uncertainty around estimates of species richness remained quite low in relation to
the observed species richness. Overall, we think that the treatment for rare species in
these models need to be improved to a better representation of species-rich communities.
As the increase of the number of records for these species in the �eld is not easy, other
possibility provided by bayesian models is the inclusion of additional information on prior

70
parameter distributions. This information can be gathered through expert interviews,
that would assign probabilities to the occurrence of species which would allow us to build
more realistic distributions for the occurrence probabilities of species. If the rarity status of
species could be manipulated by imposing these di�erent prior parameter distribution, may
be the occurrence of rare species would not appear so widespread and the species richness
in the community should not be overestimated. This solution was not tested already for
the occupancy-detection models, since all studies to date provided non informative priors
to the species occupancy and detection parameters. Nonetheless, if more knowledge about
the system are included by using informative priors in our analysis, parameter estimates
tend to be more precise (Kinas and Andrade, 2010).
The relationships of estimated species richness and vegetation structure gradients pointed
to a slightly greater importance of intermediate height vegetation presence and also of veg-
etation presence below 2 m. Other studies performed to analyse the relationship of vegeta-
tion structure and heterogeneity with bird diversity in Cerrado are not totally conclusive,
mainly by some particularities of each one and also by lack of statistical treatment of these
data. For instance, Fieker (2012) found a positive correlation among bird diversity (cal-
culated by Shannon Diversity Index) and total species richness with habitat complexity,
measured using Shannon diversity index using 18 classes of vegetation and other structures
and soil features in 50 plots of 2 x 2 m in each sample site(e.g. percentage of grasses, four
height classes of shrubs and trees, epyphites, percentage of area occupied by termites nests,
soil burrows, bare and soaked soil). However, she also included �ooded areas in her census
(some that also presented greater habitat complexity) and her work was not totally clear
about why correlation analysis was used instead of regression, that would be a more ade-
quate analysis to stablish cause-e�ects relationships. Additionally, other two studies found
a increase of bird diversity from grasslands to savannas, but they did not statistically test
their results and did not standardized sampling e�ort among di�erent habitats (Tubelis
and Cavalcanti, 2001; Motta-Junior et al., 2008). Other studies did not found a increase
of bird species from savannas to forests (Valadão, 2012; Posso et al., 2013) and others
found that savannas presented greater species richness than forests and grasslands, but

71
they also did not provide statistical treatment to their data (Silva, 2004; Rodrigues and
Faria, 2007; Piratelli and Blake, 2006), which can weaken the inference and generalization
power of these data. In a recent compilation and secondary analysis of data published
about species richness-vegetation structure gradient in Cerrado, Rodrigues and Prado in
prep. also were not able to conclude about this relationship mainly by greater variability
in the bird estimates due to the di�erent sampling methods used in each study, which we
know to be severely in�uenced by habitat characteristics variation inside the vegetation
gradient.
Our study used a multi-species bayesian approach that explicitly lead with detectabil-
ity heterogeneity among species, sample sites and occasions, at the same time we estimate
occupancy probabilities and species richness relationships with habitat covariates. These
analyses showed that the most detected species presented higher occurrences at the middle
of the vegetation height gradient and also where vegetation is characterized by great veg-
etation presence below 2 m. These species occurrence patterns resulted in slightly higher
species richness at sites where vegetation is not exclusively formed by grasses or trees, but
specially where small trees and shrubs (that represent the intermediate vegetation strata)
are more abundant. Cerrado vegetation is majorly represented by savannas and its in-
termediate forms, while both grasslands and forests represent only 25% of total Cerrado
area. Among species more often sampled by us, we noted that majority of them or are
considered quasi endemic Cerrado species (e.g. Saltatriculla atricollis, Heliactin bilophus,
Cyanocorax critatelus, Suiriri a�nis, Schistochlamys ru�capillus, Thmanophilus torqua-
tus, Neothraupis fasciata, Melanopareia torquata, Cypsnagra hirundinacea, Euscarthmus
rufomarginatus or they are typical of more open vegetation types (Zonotrichia capen-
sis, Elaenia chriquensis, Eupsitulla aurea, Sporophila plumbea, Ammodramus humeralis,
Mimus saturninus, Eupetomena macroura, Synallaxis albescens, Elaenia cristata, Emberi-
zoides herbicola, Gnorimopsar chopi, Tachornis squamatta, Rynchotus rufescens, Cariama
cristata, Xolmis cinereus, Chlorostilbon lucidus, Phacellodomus ru�frons, Myiophobus fas-
ciatus. In general, Cerrado bird species are less dependent of forests than other species
from Atlantic and Amazonian rain forests, for example (Stotz et al., 1996). However,

72
da Silva (1995) argued that near to 75% of species found in Cerrado are dependent of for-
est in some degree, but his analysis include common species in perypheral areas of Cerrado
and ca have their origin in Amazonian and Atlantic Forests domains. We did not sample
strictly Cerrado forested habitats during our study (e.g. Cerradão dry forests and river-
ine forests), but our samples included typical Cerrado species that are locally abundant
in other Cerrado savanna remnants and natural areas. Then, our results can be viewed
as the main response of most common Cerrado avifauna to vegetation, that seems to be
positively a�ected by intermediate types of vegetation and also to shrub component of
vegetation. Nevertheless, Cerrado also presents important areas of endemism that may be
associated with the generation of both forest and grassland species and today these species
inhabits enclaves of these types of vegetation scattered throughout the biome (da Silva
and Bates, 2002). Therefore, to achieve a better understand about the structure and dis-
tribution of the entire Cerrado bird diversity, it is imperative to consider how changes
in community composition happens and whether there is a dynamic process of species
occupancy-extinction along these vegetation gradients. Some studies had already analysed
the composition of bird community and found that grassland formed separate clusters of
species from those of savanna communities (Tubelis and Cavalcanti, 2001; Fieker, 2012)
and other evidences pointed to the use of forests by Cerrado bird species (Tubelis et al.,
2004) and also to the use of savanna by forest species (Silva, 2004). Novel studies in these
�elds are needed to expand our knowledge and incorporation of the occupancy-detection
framework in those can yield more reliable data, and hence better implementation and
greater e�ectiveness of conservation and management plans.
In relation of Cerrado birds conservation, our study have important implications. We
found a weak relationship of bird species richness and occupancy with intermediate height
vegetation and also with the presence of vegetation below 2 m height. This response of
Cerrado bird species to vegetation gradient can point to the importance of shrub compo-
nent of vegetation, that is more abundant in open areas of Cerrado. However, the lower
magnitude of response shows that probably the entire gradient can be used by most bird
species and grasslands could harbour as many species more forested habitats. Even though,
73
some endemic and rare species are restricted to grasslands or forests (da Silva and Bates,
2002) and the investigation of occupancy patterns of these species should be prioritized
to measure beta diversity among the di�erent physiognomies. Then, future studies in this
topic that also consider the detection heterogeneity among habitats will greatly contribute
to the regional maintenance of species diversity in this rich and complex biome.
Acknowledgements
We would like to acknowledge all �eld assistants, specially Gregório R. Menezes, Anto-
nio C. da Silva, Karlla V. C. Barbosa, Thiago V. Costa, Hugo S. Pereira and Mário Sacra-
mento, for the help during the �eldwork. Also, we would to thanks Gregório R.Menezes,
Leonardo L. Wedekin, Marcelo Awade and members of LET laboratory by fruitful intel-
lectual discussions during the elaboration of the study and of the manuscript. Finally, to
the CAPES institutional scholarship program and FAPESP governamental agency, by the
�nancial support of 2013/19250-7 research project.

74

Capítulo 4
Conclusões
Nesta tese, a análise da "Hipótese de Heterogeneidade de Habitats" se deu a partir
de duas abordagens distintas, que contrastaram principalmente na metodologia e delinea-
mento da coleta dos dados e, consequentemente nas análises estatísticas utilizadas e nos
resultados obtidos. No primeiro capítulo, realizamos uma busca extensiva de trabalhos
publicados a �m de obter dados de riqueza de espécies em comunidades de aves de difer-
entes formações vegetais de ocorrência no bioma Cerrado. Estes dados foram levantados
na literatura cientí�ca nacional e internacional, incluindo períodicos, teses e dissertações
produzidas em diversas regiões do Brasil, além de relatórios cientí�cos que visavam o
conhecimento e investigação da diversidade em áreas de interesse público, como parques
nacionais e estaduais. Todos os relatórios cientí�cos e planos de manejo, assim como a
grande parte dos estudos compilados por nós não apresentaram informações su�cientes
sobre o delineamento amostral e também sobre os metodologia desenvolvida durante o
trabalho, o que reduziu ainda mais a quantidade de dados que poderiam ser analisados
e replicados em trabalhos posteriores. Ainda assim, mostramos que a riqueza observada
de espécies de aves em comunidades de Cerrado é determinada por uma interação entre a
�sionomia vegetal amostrada e o método amostral utilizado. Isto signi�ca que o número
de espécies registradas em cada �sionomia vegetal depende do método amostral escolhido,
sendo que cada um dos métodos mostrou uma relação diferente da riqueza de espécies com a
estrutura da vegetação. Além disso, a variação estimada para os efeitos aleatórios mostrou
que a variação nos valores dos efeitos �xos foi duas vezes maior devido à características dos
estudos do que devido à variação nas localidades amostradas. Estes resultados reforçaram

76
a in�uência de diferentes métodos de amostragem na quanti�cação da diversidade de aves
e também a grande variação entre os estudos devido a fatores metodológicos, o que nos
impossibilitou de determinar a relação da riqueza de aves com a estrutura da vegetação no
Cerrado. Assim, além de um maior planejamento do delineamento amostral e uma maior
clareza na de�nição e elaboração dos estudos, nós sugerimos que deveriam ser usados de-
lineamentos e métodos mais robustos para lidar com efeitos da possível heterogeneidade de
detecção entre amostras, entre espécies e também entre métodos amostrais. Estes métodos
vêm sendo desenvolvidos com grande rapidez nas últimas décadas e apresentam um avanço
teórico e aplicado muito grande, visto que a detecção imperfeita das espécies animais, e
mesmo vegetais, está longe de ser uma exceção em estudos biológicos e ecológicos.
No segundo capítulo, analisamos a relação entre estrutura da vegetação e diversidade de
aves utilizando dados de riqueza de aves coletados em um gradiente estrutural de vegetação.
Nesta etapa, utilizamos um delineamento amostral que também nos permitiu considerar
potenciais efeitos da estrutura da vegetação sobre a detectabilidade das espécies, assim
como também calcular as probabilidades de ocupação e detecção para cada espécie sep-
aradamente. Os resultados obtidos neste capítulo, para as 38 espécies mais detectadas,
mostraram que a riqueza das comunidades e a detecção das espécies de aves podem ser
in�uenciados pela estrutura da vegetação. Apesar da relação entre riqueza de aves e es-
trutura da vegetação não ter sido positiva e monotônica, como esperávamos inicialmente,
houve um discreto aumento do número de espécies de aves nos sítios onde a estrutura
vertical da vegetação foi intermediária e também nos sítios onde houve maior presença de
vegetação abaixo de 2 m. Quando comparadas as relações da riqueza estimada de espécies
(que considera a heterogeneidade de detecção) e as relações que consideraram apenas a
riqueza observada (naive), esta última apresentou padrões mais acentuados. Apesar disto,
ambas as medidas de diversidade apresentarem resultados qualitativamente semelhantes.
Esta diferença nas relações entre estrutura da vegetação e riqueza estimada e observada foi
maior principalmente nos dois extremos do gradiente de estrutura vertical da vegetação e
também nas áreas com menor presença (ou densidade) de vegetação abaixo de 2 m. Esta
comparação, portanto, mostra que nestes extremos dos gradientes de vegetação a detecção

77
das espécies pode ser mais baixa, o que poderia re�etir diretamente na intensidade dos
padrões observados. É importante salientar que estas diferenças foram observadas para o
conjunto de espécies mais representadas durante as amostragens, as quais provavelmente
são as mais comuns e que apresentam maiores probabilidades de detecção. Se consider-
armos todo o conjunto de 140 espécies amostradas durante o estudo, as relações entre
estrutura da vegetação e riqueza estimada e observada se inverteriam, sendo a riqueza
estimada de espécies bem maior nos extremos dos gradientes e a riqueza observada man-
teria o mesmo padrão observado para as espécies mais detectadas. Os resultados obtidos
nesta análise que inclui todas as espécies necessitam ser con�rmados, já que a análise dos
dados de espécies com poucos registros nestes modelos de ocupação e e detecção pode ser
problemática. Um dos potenciais problemas seria a não convergência das estimativas dos
parâmetros de ocupação, o que resulta em uma maior chance de prevermos falsas pre-
senças das espécies mais raras. Uma forma de contornar este problema seria utilizarmos
diferentes distribuições a priori para os parâmetros de ocorrência das espécies. Por meio
de informações adicionais de diferentes fontes, poderíamos diminuir as incertezas sobre os
valores dos parâmetros destas espécies, e isto ajudaria a reduzir os potenciais vieses nes-
tas situações. Além disto, outros estudos que busquem avaliar a composição e dinâmica
das comunidades nestes mosaicos vegetacionais também são necessários para um maior
entendimento do papel da estrutura da vegetação para a manutenção da diversidade de
aves no Cerrado.

78

Referências
Abreu, T. L. S. (2000). Efeito de queimadas sobre a comunidade de aves de Cerrado. PhD
thesis, Dissertação de Mestrado - Universidade de Brasília, Brasília, BR.
Accordi, I. A., Barcellos-silveira, A., and Pacheco, J. F. (2003). Bibliogra�a Digital da
Ornitologia Brasileira - I. October, 11(2):245�262.
Accordi, I. A., Barcellos-silveira, A., and Pacheco, J. F. (2005). Bibliogra�a Digital da
Ornitologia Brasileira - IV. October, 11(2):245�262.
Accordi, I. A., Barcellos-silveira, A., and Pacheco, J. F. (2005a). Bibliogra�a Digital da
Ornitologia Brasileira - V. October, 11(2):245�262.
Almeida, M. E. d. C. (2002). Estrutura De Comunidades De Aves Em Áreas De Cerrado Da
Região Nordeste Do Estado De São Paulo. PhD thesis, Tese de Doutorado - Universidade
Federal de São Carlos, São Carlos, BR.
Antas, P. d. T. Z. (1999). Comunidade De Aves Dos Cerrados Do Planalto Central E
Porção Ocidental Do Médio Rio São Francisco. PhD thesis, Tese de Doutorado - Uni-
versidade de Brasília, Brasília, BR.
Azpiroz, A. B. and Blake, J. G. (2016). Associations of grassland birds with vegetation
structure in the Northern Campos of Uruguay. The Condor, 118(1):12�23.
Banks-Leite, C., Pardini, R., Boscolo, D., Cassano, C. R., Püttker, T., Barros, C. S., and
80
Barlow, J. (2014). Assessing the utility of statistical adjustments for imperfect detection
in tropical conservation science. Journal of Applied Ecology, 51(4):849�859.
Bates, D., Maechler, M., Bolker, B. M., and Walker, S. (2014). Fitting Linear Mixed-E�ects
Models using {lme4}. Journal Of Statistical Software, 67(1):1�48.
Bibby, C. J., Burgess, N. D., and Hill, D. A. (1992). Bird Census Techniques. Academic
Press, San Diego, US.
Blake, J. H. and Loiselle, B. A. (2001). Bird assemblages in second-growth and old-growth
forests, Costa Rica: Perspectives from mist nets and point counts. The Auk, 118(2):304�
326.
Blamires, D., de Oliveira, G., de Souza Barreto, B., and Diniz-Filho, J. A. F. (2008).
Habitat use and deconstruction of richness patterns in Cerrado birds. Acta Oecologica,
33(1):97�104.
Bohning-Gaese, K. (1997). Determinants of avian species richness at di�erent spatial scales.
Journal of Biogeography, 24(1):49�60.
Bolker, B. and Team, R. D. C. (2016). bbmle: Tools for General Maximum Likelihood
Estimation. R package version 1.0.18.
Bolker, B. M., Brooks, M. E., Clark, C. J., Geange, S. W., Poulsen, J. R., Stevens, M.
H. H., and White, J. S. S. (2009). Generalized linear mixed models: a practical guide
for ecology and evolution. Trends in Ecology and Evolution, 24(3):127�135.
Bonter, D. N., Brooks, E. W., and Donovan, T. M. (2008). What are we missing with
only ground-level mist nets? Using elevated nets at a migration stopover site. Journal
of Field Ornithology, 79(3):314�320.
Borges, P. P., de Andrade Oliveira, K. A. F., Machado, K. B., Vaz, Ú. L., da Cunha, H. F.,
and Nabout, J. C. (2015). Tendências e lacunas da literatura cientí�ca sobre o bioma
Cerrado:Uma análise cienciométrica. Neotropical Biology and Conservation, 10(1):2�8.

81
Borges, S. H. (2008). Bibliogra�a ornitológica do Brasil - Dissertações e teses no período
de 1970 à 2005. Revista Brasileira de Ornitologia, 16(1):82�98.
Boulinier, T. B., Nichols, J. D. N., Sauer, J., and Hines, J. E. (1998). Estimating Species
Richness : the Importance of Heterogeneity in Species Detectability. Ecology, 79(3):1018�
1028.
Braz, V. D. S. (2008). Ecologia e conservação das aves campestres do bioma Cerrado. Tese
de Doutorado. PhD thesis, Tese de Doutorado - Universidade de Brasília, Brasília, BR.
Burnham, K. and Overton, W. (1979). Robust estimation of population size when capture
probabilities vary among animals. Ecology, 60(5):927�936.
Carrillo-Rubio, E., Kéry, M., Morreale, S. J., Sullivan, P. J., Gardner, B., Cooch, E. G.,
and Lassoie, J. P. (2014). Use of multispecies occupancy models to evaluate the response
of bird communities to forest degradation associated with logging. Conservation Biology,
28(4):1034�1044.
Carvalho, F. M. V., De Marco, P., and Ferreira, L. G. (2009). The Cerrado into-pieces:
Habitat fragmentation as a function of landscape use in the savannas of central Brazil.
Biological Conservation, 142(7):1392�1403.
Cavarzere, V. (2013). Does the reproductive season account for more records of birds in a
marked seasonal climate landscape in the state of São Paulo, Brazil? Papeis Avulsos de
Zoologia, 53(18):253�260.
Cody, M. L. (1985). Habitat Selection in Birds. Number 1. Academic Press, Orlando, US.
Costa, L. M. and Rodrigues, M. (2012). Bird community structure and dynamics in
the campos rupestres of southern Espinhaço Range, Brazil: Diversity, phenology and
conservation. Revista Brasileira de Ornitologia, 20(2):132�147.
Coutinho, L. M. (1978). O conceito de cerrado. Revista brasileira de Botânica, 1:17�23.

82
Cueto, V. R. and de Casenave, J. L. (1999). Determinants of bird species richness: role of
climate and vegetation structure at a regional scale. Journal of Biogeography, 26(1):487�
492.
Curcino, A., De Sant'Ana, C. E. R., and Heming, N. M. (2007). Comparação de três
comunidades de aves na região de Niquelândia, GO. Revista Brasileira de Ornitologia,
15(4):574�584.
da Silva, J. M. C. (1995). Avian inventory of the cerrado region, South America: implica-
tions for biological conservation. Bird Conservation International, 5:291�304.
da Silva, J. M. C. (1997). Endemic bird species and conservation in the Cerrado Region,
South America. Biodiversity and Conservation, 6:435�450.
da Silva, J. M. C. and Bates, J. M. (2002). Biogeographic Patterns and Conservation in
the South American Cerrado: A Tropical Savanna Hotspot. BioScience, 52(3):225.
Díaz, L. (2006). In�uences of forest type and forest structure on bird communities in oak
and pine woodlands in Spain. Forest Ecology and Management, 223(1-3):54�65.
Dorazio, R. M. and Royle, J. A. (2005). Estimating Size and Composition of Biological
Communities by Modeling the Occurrence of Species. Jounal of the American Statistical
Association, 100(407):389�398.
Doughty, C. E., Faurby, S., and Svenning, J. C. (2016). The impact of the megafauna
extinctions on savanna woody cover in South America. Ecography, 39(2):213�222.
Elphick, C. S. (2008). How you count counts: The importance of methods research in
applied ecology. Journal of Applied Ecology, 45(5):1313�1320.
Ferger, S. W., Schleuning, M., Hemp, A., Howell, K. M., and Böhning-Gaese, K. (2014).
Food resources and vegetation structure mediate climatic e�ects on species richness of
birds. Global Ecology and Biogeography, 23(5):541�549.

83
Fieker, C. Z. (2012). Estruturação das assembléias de aves que utilizam diferentes �siono-
mias de Cerrado na Estação Ecológica de Itirapina, São Paulo. PhD thesis, Dissertação
de Mestrado - Universidade Federal de São Carlos, São Carlos, BR.
Field, C., Behrenfeld, M. J., Randerson, J. T., and Falkowski, P. (1998). Primary Pro-
duction of the Biosphere: Integrating Terrestrial and Oceanic Components. Science,
281(5374):237�240.
Fisher, R. A., Corbet, S., and Williams, C. B. (1943). The Relation Between the Number
of Species and the Number of Individuals in a Random Sample of an Animal Population.
Journal of Animal Ecology, 12(1):42�58.
Frederico, S. (2010). O Novo Tempo do Cerrado: Expansão dos fronts agrícolas e controle
do sistema de armazenamento de grãos. Editora São Paulo: Anna Blume.
Fry, C. H. (1970). Ecological distribution of birds in north-eastern Mato Grosso state,
Brazil. Anais da Academia Brasileira de Ciências, 42:275�318.
Gelman, A. (2003). A Bayesian Formulation of Exploratory Data Analysis and Goodness-
of-�t Testing. International Statistical Review, 71(2):369�382.
Gimenez, O., Viallefont, A., Charmantier, A., Pradel, R., Cam, E., Brown, C. R., Ander-
son, M. D., Brown, M. B., Covas, R., and Gaillard, J.-M. (2008). The risk of �awed
inference in evolutionary studies when detectability is less than one. The American
naturalist, 172(3):441�448.
Goodland, R. (1971). A physiognomic analysis of the Cerrado vegetation of Central Brasil.
Journal of Ecology, 59(2):411�419.
Gotelli, N. J. and Colwell, R. K. (2001). Quantifying biodiversity: Procedures and pitfalls
in the measurement and comparison of species richness. Ecology Letters, 4(4):379�391.
Gu, W. and Swihart, R. K. (2004). Absent or undetected? E�ects of non-detection of
species occurrence on wildlife-habitat models. Biological Conservation, 116(2):195�203.

84
Hurlbert, A. H. (2004). Species-energy relationships and habitat complexity in bird com-
munities. Ecology Letters, 7(8):714�720.
IBAMA (2003). Parque Nacional Grande Sertão Veredas: Plano de Manejo.
Jankowski, J. E., Merkord, C. L., Rios, W. F., Cabrera, K. G., Revilla, N. S., and Silman,
M. R. (2013). The relationship of tropical bird communities to tree species composition
and vegetation structure along an Andean elevational gradient. Journal of Biogeography,
40(5):950�962.
Johnson, M. a., Saraiva, P. M., and Coelho, D. (1999). The role of gallery forests in the
distribution of cerrado mammals. Revista Brasileira de Biologia, 59(3):421�427.
Kellner, K. (2016). jagsUI: A Wrapper Around 'rjags' to Streamline 'JAGS' Analyses. R
package version 1.4.2.
Kéry, M. and Royle, J. A. (2016). Applied Hierarchical Modeling in Ecology. Analysis of
distribution, abundance and species richness in R and BUGS: Volume 1: Prelude and
Static Models. Academic Press, 1st edition.
Kinas, P. G. and Andrade, H. A. (2010). Introdução à Análise Bayesiana (com R). MaisQ-
nada, Porto Alegre, BR.
Kissling, W. D., Field, R., and Böhning-Gaese, K. (2008). Spatial patterns of woody plant
and bird diversity: Functional relationships or environmental e�ects? Global Ecology
and Biogeography, 17(3):327�339.
Kissling, W. D., Rahbek, C., and Böhning-Gaese, K. (2007). Food Plant Diversity as
Broad-Scale Determinant of Avian Frugivore Richness. Proceedings: Biological Sciences,
274(1611):799�808.
Klink, C. A. and MAchado, R. B. (2005). A conservação do Cerrado brasileiro. Megadi-
versidade, 1(1):147�155.

85
Kutt, A. S. and Martin, T. G. (2010). Bird foraging height predicts bird species response
to woody vegetation change. Biodiversity and Conservation, 19(8):2247�2262.
Lins, L. V. (1994). O Papel Da Mata Ciliar Na Estrutura De Uma Comunidade De Aves
Do Cerrado (Brasília, Df). PhD thesis, Dissertaçãode Mestrado - Universidade Federal
de Minas Gerais, Belo Horizonte, BR.
MacArthur, R. H. and MacArthur, J. W. (1961). On bird species diversity. Ecology,
42(3):594�598.
MacArthur, R. H., MacArthur, J. W., and Preer, J. (1962). On Bird Species Diversity .
II . Prediction of Bird Census from Habitat Measurements. The American Naturalist,
96(888):167�174.
Macedo, R. H. F. (2002). The Avifauna: Ecology, Biogeography, and Behavior. In Oliveira,
P. and Marquis, R. J., editors, The Cerrados of Brazil: ecology and natural history of a
neotropical savanna, number chapter 5, pages 242�265. Columbia University Press, New
York.
MacKenzie, D. I., Nichols, J. D., Hines, J. E., Knutson, M. G., and Franklin, A. B. (2003).
Estimating site occupancy, colonization, and local extinction when a species is detected
imperfectly. Ecology, 84(8):2200�2207.
Mackenzie, D. I., Nichols, J. D., Lachman, G. B., Droege, S., Royle, J. A., and Langtimm,
C. A. (2002). Estimating Site Occupancy Rates When Detection Probabilities Are Less
Than One. Ecology, 83(8):2248�2255.
MacKenzie, D. I., Nichols, J. D., Royle, J. A., Pollock, K. H., Bailey, L. L., and Hines,
J. E. (2006). Occupancy Estimation and Modeling: Inferring Patterns and Dynamics of
Species Occurrence, volume 1. Academic Press, 1st edition.
Marini, M. Â. and Garcia, F. I. (2005). Conservação de aves no Brasil. Megadiversidade,
1(1):95�102.

86
Martins, F. D. C. (2007). Estrutura de comunidades de aves em remanescentes de Floresta
Estacional Decidual na região do Vale do Rio Paranã - GO e TO. PhD thesis, Tese de
Doutorado - Tese de Doutorado - Universidade de Brasília, Brasília, BR.
McNew, L. B. and Handel, C. M. (2015). Evaluating species richness: Biased ecological
inference results from spatial heterogeneity in detection probabilities. Ecological Appli-
cations, 25(6):1669�1680.
Mihaljevic, J. R. and Johnson, M. B. J. P. T. J. (2015). Using multispecies occupancy
models to improve the characterization and understanding of metacommunity structure.
Ecology, 96(7):1783�1792.
Morandini, R. S. (2013). Diversidade funcional das aves do Cerrado com simulações da
perda de �sionomias campestres e espécies ameaçadas: implicações para a conservação.
PhD thesis, Dissertação de Mestrado - Universidade de São Paulo, São Paulo, BR.
Motta Jr., J. C. (1990). Estrutura tró�ca e composição das avifaunas de três hábitats
terrestres na região central do estado de São Paulo. Ararajuba, (1):65�71.
Motta-Junior, J. C., Granzinolli, M. A. M., and Develey, P. F. (2008). Aves da Estação
Ecológica de Itirapina , estado de São Paulo , Brasil Material e Métodos. Biota Neotrop-
ica, 8(3):207�227.
Myers, N., Mittermeier, R. A., Mittermeier, C. G., da Fonseca, G. A. B., and Kent, J.
(2000). Biodiversity hotspots for conservation priorities. Nature, 403(6772):853�858.
Nogueira, C., Ribeiro, S., Costa, G. C., and Colli, G. R. (2011). Vicariance and endemism
in a Neotropical savanna hotspot: Distribution patterns of Cerrado squamate reptiles.
Journal of Biogeography, 38(10):1907�1922.
Oliveira-Filho, A. T. and Ratter, J. T. (2002). Vegetation physiognomies and woody �ora
o the cerrado biome. In Oliveira, P. S. and Marquis, R. J., editors, The Cerrados of
Brazil: Ecology and Natural History of a Neotropical Savanna, pages 91�120. Columbia
University Press, New York.

87
Olmos, F. and Brito, G. R. R. (2007). Aves da região da Barragem de Boa Esperança,
médio rio Parnaíba, Brasil. Revista Brasileira de Ornitologia, 15(1):37�52.
Orians, G. H. (1969). The Number of Bird Species in Some Tropical Forests. Ecology,
50(5):783�801.
Otis, D. L., Burnham, K. P., White, G. C., and Anderson, D. R. (1978). Statistical Infer-
ence from Capture Data on Closed Animal Populations. Wildlife Monographs, (62):3�
135.
Pacheco, J. F. and Olmos, F. (2006). As aves do Tocantins 1: Região sudeste. Revista
Brasileira de Ornitologia, 14(2):85�100.
Pascoal, J. O., Amorim, M. P., Martins, M. M., Melo, C., da Silva Júnior, E. L., Ogrze-
walska, M., Labruna, M. B., and Szabó, M. P. J. (2013). Ticks on birds in a savanna
(Cerrado) reserve on the outskirts of Uberlândia, Minas Gerais, Brazil . Carrapatos
em aves de uma reserva do Cerrado na periferia de Uberlândia, Minas Gerais, Brasil,
22(1):46�52.
Piratelli, A. (2003). Mesh size and bird capture rates in Mato Grosso do Sul State, Brazil.
Brazilian Journal of Biology, 63(1):105�111.
Piratelli, A. and Blake, J. G. (2006). Bird Communities of the Southeastern Cerrado
Region , Brazil. Ornitologia Neotropical, 17:213�225.
Posso, S. R., de Freitas, M. N., Bueno, F. A., Mizobe, R. S., Filho, J. C. M., and Ragusa-
Neto, J. (2013). Avian composition and distribution in a mosaic of cerrado habitats
(RPPN Parque Ecológico João Basso) in Rondonópolis, Mato Grosso, Brazil. Revista
Brasileira de Ornitologia, 21(4):243�256.
Poulsen, B. O. (2002). Avian richness and abundance in temperate Danish forests: Tree
variables important to birds and their conservation. Biodiversity and Conservation,
11(9):1551�1566.
Preston, F. W. (1948). The Commonness, And Rarity, of Species. Ecology, 29(3):254.
88
Price, B., McAlpine, C. A., Kutt, A. S., Ward, D., Phinn, S. R., and Ludwig, J. A.
(2013). Disentangling How Landscape Spatial and Temporal Heterogeneity A�ects Sa-
vanna Birds. PLoS ONE, 8(9).
Ratter, J. A., Ribeiro, J. F., and S., B. (1997). The Brazilian Cerrado Vegetation and
Threats to its Biodiversity. Annals of Botany, 80:223�230.
Redford, K. H. and Fonseca, G. A. B. (1986). The Role of Gallery Forests in th Zoogeog-
raphy of the Cerrado's Non-volant Mammalian Fauna. Biotropica, 18(2):126�135.
Ribeiro, J. F. and Walter, B. M. T. (1998). Fito�sionomias do bioma Cerrado. In Sano,
S.M. and Almeida, S., editor, Cerrado : ambiente e �ora, pages 87�166. Embrapa -
CPAC.
Roberts, J. P. and Schnell, G. D. (2006). Comparison of survey methods for wintering
grassland birds. Journal of Field Ornithology, 77(1):46�60.
Rodrigues, M. and Faria, L. D. P. (2007). Species Richness of Understory Birds in Di�erent
Habitats of the Cerrado Region of Southeastern Brazil. Tropical Ecology, 13:101�110.
Rotenberry, J. T. (1985). The role of habitat in avian community composition: physiog-
nomy or �oristics? Oecologia, 67(2):213�217.
Ruiz-Gutiérrez, V. and Zipkin, E. F. (2011). Detection biases yield misleading patterns of
species persistence and colonization in fragmented landscapes. Ecosphere, 2(5):art61.
Schoener, T. (1968). Sizes of feeding territories among birds. Ecology, 49(1):123�141.
Sendoda, A. M. C. (2009). Efeito do manejo de fogo sobre comunidades de aves em campos
sujos no Parque Nacional das Emas, GO/MS, Cerrado central. Dissertação de Mestrado.
PhD thesis.
Seymour, C. L. and Dean, W. R. J. (2010). The in�uence of changes in habitat structure on
the species composition of bird assemblages in the southern Kalahari. Austral Ecology,
35(5):581�592.

89
Silva, G. B. M. (2004). Estimativas Da Diversidade Da Avifauna Em Fito�sionomias
Do Bioma Cerrado Na Estação De Pesquisa E Desenvolvimento Ambiental ( Epda )
Galheiro , Perdizes , Mg. PhD thesis, Dissertação de Mestrado - Universidade Federal
de Lavras, Lavras, BR.
Simon, M. F., Grether, R., de Queiroz, L. P., Skema, C., Pennington, R. T., and Hughes,
C. E. (2009). Recent assembly of the Cerrado, a neotropical plant diversity hotspot, by
in situ evolution of adaptations to �re. Proceedings of the National Academy of Sciences,
106(48):20359�20364.
Skowno, A. L. and Bond, W. J. (2003). Bird community composition in an actively man-
aged savanna reserve, importance of vegetation structure and vegetation composition.
Biodiversity and Conservation, 12(11):2279�2294.
Spera, S. A., Galford, G. L., Coe, M. T., Macedo, M. N., and Mustard, J. F. (2016). Land-
use change a�ects water recycling in brazil's last agricultural frontier. Global Change
Biology, pages n/a�n/a.
Srivastava, D. S. and Lawton, J. H. (1998). Why More Productive Sites Have More
Species : An Experimental Test of Theory Using Tree-Hole Communities. The American
Naturalist, 152(4):510�529.
Stau�er, H. B., Ralph, C. J., and Miller, S. L. (2002). Incorporating detection uncertainty
into presence-absence surveys for Marbled Murrelet. In Scott, J., Heglund, P., Morrison,
M., Hau�er, J., Raphael, M., Wall, W., and Samson, F., editors, Predicting Species
Occurrences: Issues of Accuracy and Scale, number 1992, pages 357�365. Island Press,
Washington, DC.
Stotz, D. F., Fitzpatrick, J. W., Parker III, T. A., and Moskovits, D. K. (1996). Neotropical
Birds: Ecology and Conservation. University of Chicago Press, Chicago, US.
Sutherland, C., Brambilla, M., Pedrini, P., and Tenan, S. (2016). A multiregion community
model for inference about geographic variation in species richness. Methods in Ecology
and Evolution, pages 1�9.

90
Terborgh, J. (1977). Bird Species Diversity on an Andean Elevational Gradient. Ecology,
58(5):1007�1019.
Tews, J., Brose, U., Grimm, V., Tielbörger, K., Wichmann, M. C., Schwager, M., and
Jeltsch, F. (2004). Animal species diversity driven by habitat heterogeneity/diversity:
the importance of keystone structures. Journal of Biogeography, 31(1):79�92.
Tolesano-Pascoli, G. V., Torga, K., Franchin, A. G., Ogrzewalska, M., Gerardi, M.,
Olegário, M. M. M., Labruna, M. B., Szabó, M. P. J., and Marçal Júnior, O. (2010).
Ticks on birds in a forest fragment of Brazilian cerrado (savanna) in the municipality of
Uberlândia, State of Minas Gerais, Brazil. Revista brasileira de parasitologia veterinaria
= Brazilian journal of veterinary parasitology : Orgao O�cial do Colegio Brasileiro de
Parasitologia Veterinaria, 19(4):244�248.
Tubelis, D. P. and Cavalcanti, R. B. (2001). Community similarity and abundance of
bird species in open habitats of a central Brazilian Cerrado. Ornitologia Neotropical,
12:57�73.
Tubelis, D. P., Cowling, A., and Donnelly, C. (2004). Landscape supplementation in
adjacent savannas and its implications for the design of corridors for forest birds in the
central Cerrado, Brazil. Biological Conservation, 118(3):353�364.
Valadão, R. M. (2012). As aves da Estação Ecológica Serra das Araras, Mato Grosso,
Brasil. Biota Neotropica, 12(3):263�281.
Venables, W. N. and Ripley, B. D. (2002). Modern Applied Statistics With S. Technomet-
rics, 45(1):111�111.
Verner, J. and Ritter, L. V. (1985). A comparison of transects and spot mapping in
oak-pine wooldands of California. The Condor, 90(1):401�419.
Wiens, J. A. and Rotenberry, J. T. (1981). Habitat Associations and Community Struc-
ture of Birds in Shrubsteppe Environments. Source: Ecological Monographs Ecological
Monographs, 51(11):21�42.

91
Wilson, M. F. (1974). Avian Community Organization and Habitat Structure. Ecology,
55(5):1017�1029.
Zipkin, E. F., Royle, J., Dawson, D. K., and Bates, S. (2010). Multi-species occurrence
models to evaluate the e�ects of conservation and management actions. Biological Con-
servation, 143(2):479�484.
Zuur, A., Ieno, E., Walker, J., Saveliev, A., and Smith, G. (2009). Mixed E�ects Models
and Extensions in Ecology with R. Springer, New York.

92

Appendix


Appendix A
A.1 Databases and keywords used in secondary data search
We chosen keywords within some categories of interest that allow us to �nd studies
within our scope. We combined keywords of the same category using "OR" and di�erent
categories using "AND" boolean operators, which allows us search any word present of
one category, but the studies in demand necessarily had to use at least one word of each
category. In the �rst two databases (Web of Science and Scopus) we choose keywords in
four categories of interest (vegetation structure, biome, taxonomic group and community
properties)(Table 3), but in Scielo database we used keywords in just three categories
(vegetation structure, taxonomic group and community properties), by a limitation in the
search tool to include more than three keywords search �elds (Table 3). Speci�cally in
Scopus database, we had to perform three separate searches using all the keywords of
biome, taxonomic group and community properties categories, but separated subsets of
vegetation structure keywords, because the search tool of this database presented a limit
in the quantity of characters allowed in each search �eld (Table 3).

96
Table A.1 - Database search results, search data and key words used in each one.
-Web of Science:327 articlesDate: 26 November 2013Vegetation structure �vegeta* structure�, �habitat* structure�,�vegeta*
height��vegeta* complexity�, �vegeta* physiognom*�,�phytophysiognom*�, �phitophysiognom*�, *physiog-nom*,�vegeta* diversity�, �habitat* structur*�, �vegeta* pro-�le�,�habitat* complexit*�, �habitat* physiognom*�,�habitat* heterogeneit*�, �habitat* height*�,�habitat* diversit*�, �structur* complexit*�,�structur* heterogeneit*�, �structur* height*�,�structur* diversit*�, �foliage height*�, �foliage pro�le�,�foliage diversit*�
Biome cerrado*, savanna*, savannah*, woodland*, grassland*Taxonomic group bird*, avifauna, avianCommunity property diversity, �species richness�, richness, �species number�,
�species abundance*�-Scopus: 138 articlesDate: 28 November 2013Vegetation StructureSearch 1 �vegeta* structure�, �habitat* structure�, �vegeta*
height�,�vegeta* complexity�, �vegeta* physiognom*�,�phytophysiognom*�, �phitophysiognom*�, *physiog-nom*,�vegeta* diversity�, �habitat* structur*�, �vegeta* pro-�le�
Search 2 �habitat* complexit*�, �habitat* physiognom*�,�habitat* heterogeneit*�, �habitat* height*�,�habitat* diversit*�, �structur* complexit*�,�structur* heterogeneit*�, �structur* height*�,�structur* diversit*�
Search 3 �foliage height*�, �foliage pro�le�, �foliage diversit*�Biome cerrado*, savanna*, savannah*, woodland*,
grassland*Taxonomic group bird*, avifauna, avianCommunity property diversity, �species richness�, richness,
�species number�, �species abundance*�-Scielo: 25 articlesDate: 10 December 2013Biome cerrado*, savan*, woodland*, grassland*, campo*Taxonomic Group aves, bird*, avifauna, avianCommunity property diversi*, riqueza, richness,
�riqueza de espécies�, �species richness�, �species num-ber*�,abundância, abundance*, "abundância de espécies",�species abundance�, comunidade, community

97
Table A.2 - Universities consulted for thesis and dissertations including "aves" and "cerrado" in theabstract.
University Code University Name State StudiesDateUSP Universidade de São Paulo SP 97 22/01/14
UNICAMP Universidade de Campinas SP 8 23/01/14
UNESP Universidade Estadual Paulista SP 8 11/02/14Campi : S. J. Rio Preto, Botu-catu, Rio Claro
UFSCAR Universidade Federal de São Car-los
SP 35 09/02/14
UFMG Universidade Federal de MinasGerais
MG 4 23/01/14
UFU Universidade Federal de Uberlân-dia
MG 65 09/02/14
UFOP Universidade Federal de OuroPreto
MG 4 11/02/14
UFV Universidade Federal de Viçosa MG 35 11/02/14
UNB Universidade de Brasília DF 91 23/01/14
UFG Universidade Federal de Goiás GO 78 23/01/14
UFF Universidade Federal Fluminense RJ 6 09/02/14
UERJ Universidade Estadual do Rio deJaneiro
RJ 2 11/02/14
UFRJ Universidade Federal do Rio deJaneiro
RJ 152 11/02/14
UFMA Universidade Federal do Maran-hão
MA 2 11/02/14
UFPI Universidade Federal do Piauí PI 0 11/02/14

98
Table A.3 - List of regionally important publications scanned by us, with volumes checked, time periodof the search and number of studies selected by us.
Publication Volumes visited Time periodLundiana 01-11 1982-2013Iheringia 89-104 2000-2014Revista Brasileira de Biologia* 1-60 1971-2001Brazilian Journal of Biology* 61-74 2001-2014Checklist 01-10 2005-2014Cotinga 01-36 1994-2014Biota Neotropica 01-14 2001-2014Ararajuba* 1-12 1990-2004Revista Brasileira de Ornitologia* 13-22 2005-2014Papéis Avulsos de Zoologia 42-54 2002-2014Revista Brasileira de Zoologia 01-25 1982-2008
A.2 Detailed description of surveys locations
Table A.4 - List of all independent observations used in our study, with their ID and position in Figure
1, Data base and study where the data were published, scienti�c magazine or academic publication level,
geographical coordinates, habitat physiognomy sampled, census method and e�ort in hours and the number
of species registered.
ID Base Study Lat Long Phyto MethodE�ort
(h)
Bird
spp.
A Website Motta Jr. 1990 -21,5800 -47,5200 S T 54.0 77
B UFMG Lins, L.V. 1994 -15,5641 -47,5307 S N 192.0 30
B UFMG Lins, L.V. 1994 -15,5641 -47,5307 S P 32.0 47
B personal Tubelis and
Cavalcanti
2001
-15,4080 -47,5750 G P 10.66 18
B personal Tubelis and
Cavalcanti
2001
-15,4080 -47,5750 G P 16.0 36

99
B personal Tubelis and
Cavalcanti
2001
-15,4080 -47,5750 S P 36.0 80
B personal Tubelis and
Cavalcanti
2001
-15,4080 -47,5750 S P 16.66 53
C UNB Antas, P.T.Z.
1999
-15,4080 -47,5750 S N 40.0 9
C UNB Antas, P.T.Z.
1999
-15,4080 -47,5750 S N 33.0 11
C UNB Antas, P.T.Z.
1999
-15,4080 -47,5750 S N 35.0 10
C UNB Antas, P.T.Z.
1999
-15,4080 -47,5750 S P 5.0 31
C UNB Antas, P.T.Z.
1999
-15,4080 -47,5750 S P 5.0 33
C UNB Antas, P.T.Z.
1999
-15,4080 -47,5750 S P 5.0 33
C UNB Braz 2008 -15,4080 -47,5750 G T 81.5 70
C UNB Abreu, T.L.S.
2000
-15,4080 -47,5750 S T 57.0 70
C UNB Abreu, T.L.S.
2000
-15,4080 -47,5750 S T 57.0 70
D UNB Antas, P.T.Z.
1999
-15,2400 -45,5458 S N 40.0 14
D UNB Antas, P.T.Z.
1999
-15,2400 -45,5458 S N 17.5 8
D UNB Antas, P.T.Z.
1999
-15,2400 -45,5458 S N 21.5 12
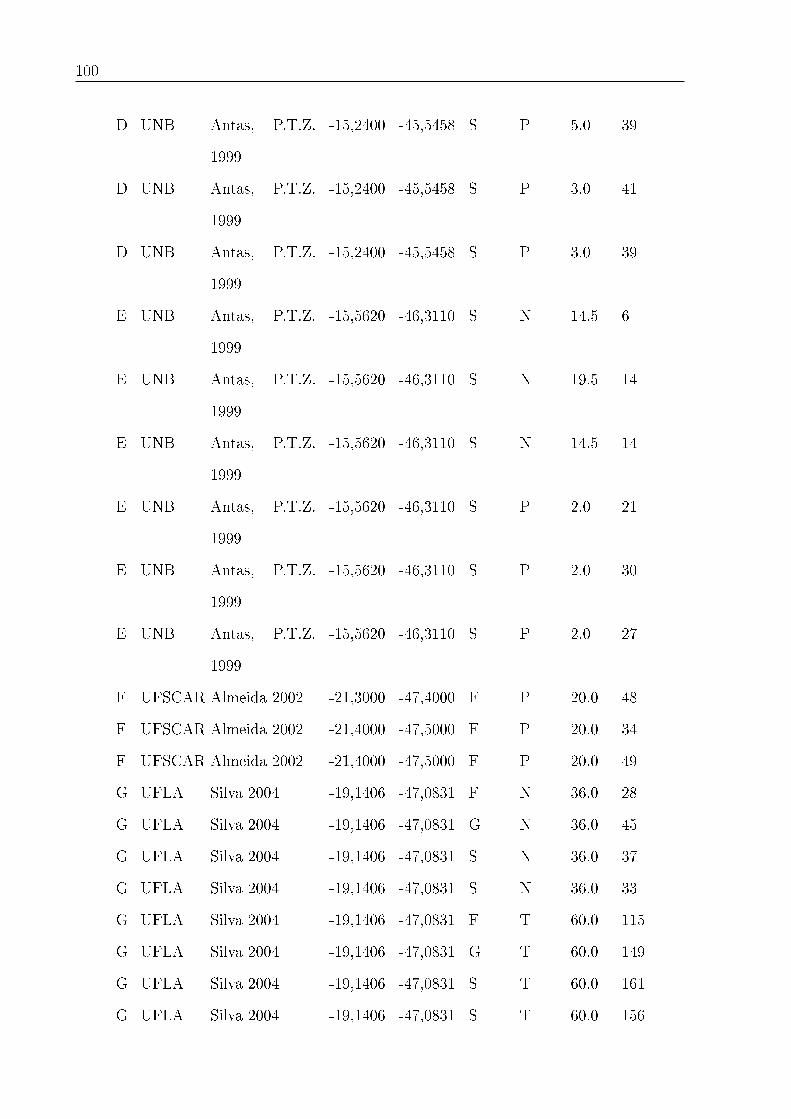
100
D UNB Antas, P.T.Z.
1999
-15,2400 -45,5458 S P 5.0 39
D UNB Antas, P.T.Z.
1999
-15,2400 -45,5458 S P 3.0 41
D UNB Antas, P.T.Z.
1999
-15,2400 -45,5458 S P 3.0 39
E UNB Antas, P.T.Z.
1999
-15,5620 -46,3110 S N 14.5 6
E UNB Antas, P.T.Z.
1999
-15,5620 -46,3110 S N 19.5 14
E UNB Antas, P.T.Z.
1999
-15,5620 -46,3110 S N 14.5 14
E UNB Antas, P.T.Z.
1999
-15,5620 -46,3110 S P 2.0 21
E UNB Antas, P.T.Z.
1999
-15,5620 -46,3110 S P 2.0 30
E UNB Antas, P.T.Z.
1999
-15,5620 -46,3110 S P 2.0 27
F UFSCAR Almeida 2002 -21,3000 -47,4000 F P 20.0 48
F UFSCAR Almeida 2002 -21,4000 -47,5000 F P 20.0 34
F UFSCAR Almeida 2002 -21,4000 -47,5000 F P 20.0 49
G UFLA Silva 2004 -19,1406 -47,0831 F N 36.0 28
G UFLA Silva 2004 -19,1406 -47,0831 G N 36.0 45
G UFLA Silva 2004 -19,1406 -47,0831 S N 36.0 37
G UFLA Silva 2004 -19,1406 -47,0831 S N 36.0 33
G UFLA Silva 2004 -19,1406 -47,0831 F T 60.0 115
G UFLA Silva 2004 -19,1406 -47,0831 G T 60.0 149
G UFLA Silva 2004 -19,1406 -47,0831 S T 60.0 161
G UFLA Silva 2004 -19,1406 -47,0831 S T 60.0 156

101
H Website Pacheco and
Olmos 2006
-11,5051 -46,4225 S T 8.7 160
I Website Pacheco and
Olmos 2006
-13,2345 -47,4220 G T 6.5 62
J Website Pacheco and
Olmos 2006
-12,4005 -47,5357 S T 10.5 148
K personal Piratelli and
Blake 2006
-21,2500 -52,0300 S N 375.0 67
K personal Piratelli and
Blake 2006
-20,3600 -51,4100 F N 601.0 66
L Website Curcino et al
2007
-14,0934 -48,2006 S P 10.0 80
M UNB Martins 2007 -14,3119 -46,4712 S T 90.0 31
N UNB Martins 2007 -13,3842 -46,4524 S T 55.0 32
O UNB Martins 2007 -12,5455 -47,3659 S T 105.0 56
P personal Rodrigues and
Faria 2007
-17.3894 -43.8961 S N 100.8 66
Q personal Rodrigues and
Faria 2007
-18.7433 -45.0413 S N 100.8 44
R personal Rodrigues and
Faria 2007
-17.0291 -45.9016 F N 100.8 36
R Website Olmos and
Brito 2007
-6,4711 -43,5036 S T 12.56 76
R Website Olmos and
Brito 2007
-6,4711 -43,5036 S T 10.45 70
S Scielo Motta Jr. et al
2008
-22,1445 -47,5141 G P 20.0 70
S Scielo Motta Jr. et al
2008
-22,1445 -47,5141 S P 10.0 77

102
S UFSCAR Fieker CZ 2012 -22,1445 -47,5141 G P 9.0 56
S UFSCAR Fieker CZ 2012 -22,1445 -47,5141 G P 9.0 49
S UFSCAR Fieker CZ 2012 -22,1445 -47,5141 G P 9.0 49
S UFSCAR Fieker CZ 2012 -22,1445 -47,5141 G P 9.0 61
S UFSCAR Fieker CZ 2012 -22,1445 -47,5141 S P 9.0 67
S UFSCAR Fieker CZ 2012 -22,1445 -47,5141 S P 9.0 69
S UFSCAR Fieker CZ 2012 -22,1445 -47,5141 S P 9.0 78
S UFSCAR Fieker CZ 2012 -22,1445 -47,5141 S P 9.0 66
T USP Sendoda 2009 -17,5200 -53,0700 G T 38.0 36
U Google
Scholar
Tolesano-
Pascoli et al
2010
-18,5657 -48,1214 F N 200.0 26
V Website Costa and Ro-
drigues 2012
-19,1750 -43,3450 G N 241.86 40
W Scielo Valadão et al
2012
-15,2711 -57,0606 F T 80.0 141
W Scielo Valadão et al
2012
-15,2711 -57,0606 F T 80.0 210
W Scielo Valadão et al
2012
-15,2711 -57,0606 S T 80.0 194
W Scielo Valadão et al
2012
-15,2711 -57,0606 S T 80.0 165
X Website Cavarzere 2013 -22,0400 -49,3000 F T 73.5 162
Y Scielo Pascoal et al
2013
-18,5909 -48,1803 S T 320.0 50
Z Website Posso et al 2013 -16,3140 -54,4956 S T 28.0 115
Z Website Posso et al 2013 -16,3140 -54,4956 F T 14.0 107

103
Table A.5 - Classi�cation of phytophisiognomies used by us and the vegetation classi�cation of studyauthors that lies in each of our vegetation classes. Also, in the last column, the name of each vegetationcategory roughly translated to English.
Present Classi�cation Authors classi�cation English translationGrasslands campo �eld
campo limpo clean �eldcampo sujo dirty �eld
campo rupestre rocky �eldSavannas campo cerrado �eld savanna
parque cerrado small savanna patches spread in �eldcerrado sensu stricto typical savanna
cerrado typical savannaForests cerradão taller cerrado
A.3 Detailed description of statistical analyses
E�ort in mist net method can be measured in hours of sampling per net opened or
even in h/m2, which is calculated by the net area (length and high of the net) and hours
of sampling. Also, the mesh size of the nets used can vary and a�ect the size of individuals
and species caught (Piratelli, 2003). However, these informations about the net area and
mesh size sometimes are not presented by the authors and the majority of studies used
standard net sizes (12 m long x 2.5 m high, with 36mm mesh size). Then, we standardized
our net sampling e�ort unit as the number of hours per net opened, irrespectively of its
area and mesh size, and we considered this unity as equivalent to one hour of observation
in point/transect method.

104
Figure A.1: Relation of Species richness and Logarithm of Sampling E�ort per hour for each censusmethod. This graphs showed linear relations among these variables, which support us in our choice of usea linear model analysis.
Table A.6 - Statistical models, their AIC values, delta AICs, degrees of freedom and models weights.Legend of Fixed e�ects variables: Phy = Vegetation phytophysiognomy; Met = census method, Phy:Met =interaction among Vegetation phytophysiognomy and census Method e�ects; Legends of Random e�ects:1|Reg = random intercept e�ect of sampled region; 1|Aut = random intercept e�ect of study author;1|Pub = random intercept e�ect of publication; Phy|Aut= random slope e�ect of author in the relationof Species richness and phytophysiognomy; Phy|Pub= random slope e�ect of publication in the relationof species richness and phytophysiognomy; NULL= no random e�ect used.
Model Fixed e�ects Random e�ects AIC ∆ AIC dfPhy + Met + Phy:Met 1|Reg + 1|Aut 670.1 0 11Phy + Met + Phy:Met 1|Reg + 1|Pub 670.6 0.5 11Phy + Met + Phy:Met 1|Reg + 1|Pub + 1|Aut 673.0 2.8 12Phy + Met + Phy:Met Phy|Aut 690.0 19.9 15Phy + Met + Phy:Met 1|Reg 690.1 20.0 10Phy + Met + Phy:Met Phy|Pub 691.9 21.7 15Phy + Met + Phy:Met 1|Pub 705.2 35.1 10Phy + Met + Phy:Met 1|Aut 707.2 37.0 10Phy + Met + Phy:Met 1|Pub + 1|Aut 707.4 37.3 11Phy + Met + Phy:Met Met|Aut 709.8 39.7 15Phy + Met + Phy:Met Met|Pub 710.7 40.5 15Phy + Met + Phy:Met NULL 2372.9 1702.7 9

105
Figure A.2: Best model graphical validation for our GLMM analysis. From topleft to bottomright: Residu-als distribution for census method variable, for phytophisiognomy variable and o�set variable, log(samplinge�ort in hours. Finally, at bottomright the normal quantile-quantile plot and model residuals plotted.

106

Appendix B
B.1 Bayesian model codes in BUGS language
1- Occupancy-detection model with species richness derivation in BUGS
language
sink("occupancy-detection-predcheck.txt")
cat("
model {
# Priors
for(k in 1:nspec){ # Loop over species
mean.psi[k] dunif(0,1)# priors of psi follwing a uniform
beta0[k] <-logit(mean.p[k]) # priors of beta0 for p in logit scale
beta1[k] dnorm(0,0.001)# priors of beta1 for p following a normal
mean.p[k] dunif(0,1)
alpha0[k] <-logit(mean.p[k]) # priors of alpha0 for p in logit scale
alpha1[k] dnorm(0,0.001)# priors of alpha1 for p following a normal
alpha2[k] dnorm(0,0.001)# priors of alpha2 for p following a normal
alpha3[k] dnorm(0,0.001)# priors of alpha3 for p following a normal
}
# Ecological model for latent occurrence z (process model)
for(k in 1:nspec){ # Loop over species
for (i in 1:M) { # Loop over sites
logit(psi[i,k])<-beta0[k] + beta1[k]*veg[i]
z[i,k] dbern(psi[i,k])

108
}
}
# Observation model for observed data Y
for(k in 1:nspec){ # Loop over species
for (i in 1:M) { # Loop over sites
for (j in 1:J[i]) { # Loop over occasions
logit(p[i,j,k])<- alpha0[k] + alpha1[k]*veg[i] + alpha2[k]*dates[i] + alpha3[k]*mtemp[i]
mup[i,j,k]<-z[i,k] * p[i,j,k]
Ysum[i,j,k] dbern(mup[i,j,k])
}
}
}
# Derived quantities
for (i in 1:M) { # Loop over sites
Nsite[i] <- sum(z[i,]) # Add up number of occurring species at each site
}
} # end model
",�ll=TRUE)
sink()

109
2- Metanalysis model with discrepancy values calculation in BUGS language
sink("metaanalysis-predcheck.txt")
cat("
model{
# Priors
for(v in 1:2){ # Priors for intercept and polynomial coe�cients
beta[v] dnorm(0, 0.0001)
}
tau.site <- pow(sd.site, -2)
sd.site dunif(0,10)
# Likelihood
for (i in 1:n){
N[i] dnorm(muN[i], tau.psd[i]) # Measurement error model for estimated N
tau.psd[i] <- pow(psd[i], -2) # 'Known' part of residual: meas. error
muN[i] <- beta[1] + beta[2] * ele[i] + eps.site[i] # add another source of uncertainty
eps.site[i] dnorm(0, tau.site) # this is the usual 'residual'
# This section was adapted to Marc and Royle book code
# Fit assessments: Chi-squared test statistic and posterior predictive check
chi2[i] <- pow((N[i]-muN[i]),2) / (muN[i]+e) # obs.
Nmax.new[i] dnorm(muN[i], tau.psd[i]) # Replicate (new) data set
chi2.new[i] <- pow((Nmax.new[i]-muN[i]),2) / (muN[i]+e) # exp.
}
# Add up discrepancy measures for entire data set
�t <- sum(chi2[]) # Omnibus test statistic actual data
�t.new <- sum(chi2.new[]) # Omnibus test statistic replicate data
# range of data as a second discrepancy measure
obs.range <- max(N[]) - min(N[])
exp.range <- max(Nmax.new[]) - min(Nmax.new[])
# Get predictions for plot
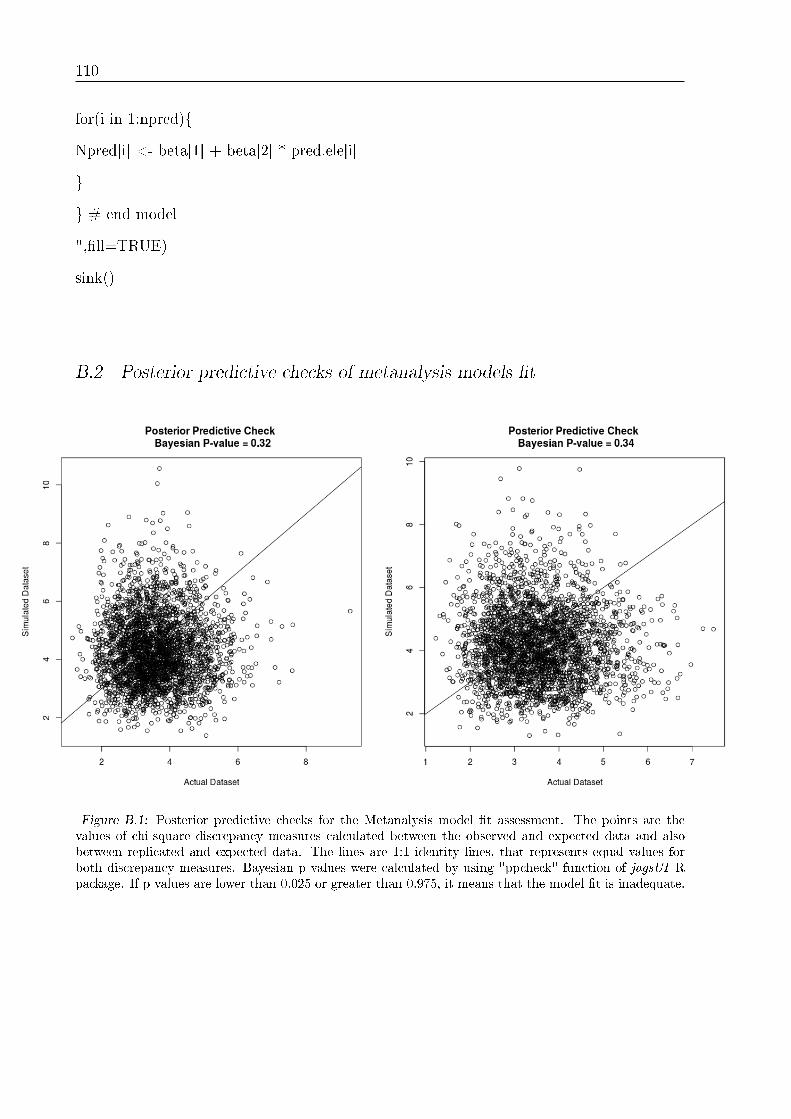
110
for(i in 1:npred){
Npred[i] <- beta[1] + beta[2] * pred.ele[i]
}
} # end model
",�ll=TRUE)
sink()
B.2 Posterior predictive checks of metanalysis models �t
Figure B.1: Posterior predictive checks for the Metanalysis model �t assessment. The points are thevalues of chi-square discrepancy measures calculated between the observed and expected data and alsobetween replicated and expected data. The lines are 1:1 identity lines, that represents equal values forboth discrepancy measures. Bayesian p values were calculated by using "ppcheck" function of jagsUI Rpackage. If p values are lower than 0.025 or greater than 0.975, it means that the model �t is inadequate.

111
B.3 Table of species sampled during surveys
Table B.1 - Species, Orders and Families sampled during surveys. Species were ordered by decreasing
number of detections (N. det.) to highlight the 38 most detected species (N.det.≥ 20).
Species Order Family N. Det.
Zonotrichia capensis Passeriformes Passerellidae 191
Elaenia chiriquensis Passeriformes Tyrannidae 150
Eupsittula aurea Psittaciformes Psittacidae 148
Sporophila plumbea Passeriformes Thraupidae 145
Ammodramus humeralis Passeriformes Passerellidae 127
Mimus saturninus Passeriformes Mimidae 125
Eupetomena macroura Apodiformes Trochilidae 114
Saltatricula atricollis Passeriformes Thraupidae 111
Troglodytes musculus Passeriformes Troglodytidae 96
Synallaxis albescens Passeriformes Furnariidae 89
Elaenia cristata Passeriformes Tyrannidae 81
Formicivora rufa Passeriformes Thamnophilidae 77
Emberizoides herbicola Passeriformes Thraupidae 76
Camptostoma obsoletum Passeriformes Tyrannidae 75
Heliactin bilophus Apodiformes Trochilidae 75
Lepidocolaptes angustirostris Passeriformes Dendrocolaptidae 68
Gnorimopsar chopi Passeriformes Icteridae 56
Elaenia �avogaster Passeriformes Tyrannidae 55
Suiriri a�nis Passeriformes Tyrannidae 52
Cyanocorax cristatellus Passeriformes Corvidae 40
Tachornis squamata Apodiformes Apodidae 38
Thamnophilus torquatus Passeriformes Thamnophilidae 38
Neothraupis fasciata Passeriformes Thraupidae 37
Melanopareia torquata Passeriformes Melanopareiidae 36

112
Cyclarhis gujanensis Passeriformes Vireonidae 32
Rhynchotus rufescens Tinamiformes Tinamidae 29
Cypsnagra hirundinacea Passeriformes Thraupidae 28
Schistochlamys ru�capillus Passeriformes Thraupidae 27
Euscarthmus rufomarginatus Passeriformes Tyrannidae 26
Nystalus chacuru Galbuliformes Bucconidae 26
Cariama cristata Cariamiformes Cariamidae 25
Xolmis cinereus Passeriformes Tyrannidae 25
Amazona aestiva Psittaciformes Psittacidae 24
Chlorostilbon lucidus Apodiformes Trochilidae 24
Phacellodomus ru�frons Passeriformes Furnariidae 23
Tangara palmarum Passeriformes Thraupidae 23
Euphonia chlorotica Passeriformes Fringillidae 21
Myiophobus fasciatus Passeriformes Tyrannidae 20
Myiarchus swainsoni Passeriformes Tyrannidae 19
Alipiopsitta xanthops Psittaciformes Psittacidae 18
Milvago chimachima Falconiformes Falconidae 17
Myiarchus tyrannulus Passeriformes Tyrannidae 17
Crypturellus parvirostris Tinamiformes Tinamidae 16
Knipolegus lophotes Passeriformes Tyrannidae 16
Tyrannus albogularis Passeriformes Tyrannidae 15
Amazilia �mbriata Apodiformes Trochilidae 14
Piranga �ava Passeriformes Cardinalidae 14
Polioptila dumicola Passeriformes Polioptilidae 14
Columbina squammata Columbiformes Columbidae 13
Cantorchilus leucotis Passeriformes Troglodytidae 11
Turdus leucomelas Passeriformes Turdidae 11
Colaptes campestris Piciformes Picidae 10
Diopsittaca nobilis Psittaciformes Psittacidae 10

113
Hemitriccus margaritaceiventer Passeriformes Rhynchocyclidae 10
Sublegatus modestus Passeriformes Tyrannidae 10
Myiarchus ferox Passeriformes Tyrannidae 9
Xolmis velatus Passeriformes Tyrannidae 9
Ara ararauna Psittaciformes Psittacidae 8
Caracara plancus Falconiformes Falconidae 8
Formicivora melanogaster Passeriformes Thamnophilidae 8
Pachyramphus polychopterus Passeriformes Tityridae 8
Phaethornis pretrei Apodiformes Trochilidae 8
Ramphastos toco Piciformes Ramphastidae 8
Stelgidopteryx ru�collis Passeriformes Hirundinidae 8
Thectocercus acuticaudatus Psittaciformes Psittacidae 8
Furnarius rufus Passeriformes Furnariidae 7
Patagioenas picazuro Columbiformes Columbidae 7
Brotogeris chiriri Psittaciformes Psittacidae 6
Rupornis magnirostris Accipitriformes Accipitridae 6
Saltator similis Passeriformes Thraupidae 6
Schistochlamys melanopis Passeriformes Thraupidae 6
Schoeniophylax phryganophilus Passeriformes Furnariidae 6
Athene cunicularia Strigiformes Strigidae 5
Galbula ru�cauda Galbuliformes Galbulidae 5
Hemithraupis guira Passeriformes Thraupidae 5
Heterospizias meridionalis Accipitriformes Accipitridae 5
Melanerpes candidus Piciformes Picidae 5
Phacellodomus ruber Passeriformes Furnariidae 5
Pitangus sulphuratus Passeriformes Tyrannidae 5
Setophaga pitiayumi Passeriformes Parulidae 5
Sporophila nigricollis Passeriformes Thraupidae 5
Culicivora caudacuta Passeriformes Tyrannidae 4

114
Tangara cayana Passeriformes Thraupidae 4
Campephilus melanoleucos Piciformes Picidae 3
Chaetura meridionalis Apodiformes Apodidae 3
Columbina picui Columbiformes Columbidae 3
Dryocopus lineatus Piciformes Picidae 3
Hemitriccus striaticollis Passeriformes Rhynchocyclidae 3
Megarynchus pitangua Passeriformes Tyrannidae 3
Porphyrospiza caerulescens Passeriformes Thraupidae 3
Progne tapera Passeriformes Hirundinidae 3
Sicalis �aveola Passeriformes Thraupidae 3
Synallaxis frontalis Passeriformes Furnariidae 3
Volatinia jacarina Passeriformes Thraupidae 3
Baryphthengus ru�capillus Coraciiformes Momotidae 2
Basileuterus culicivorus Passeriformes Parulidae 2
Cathartes aura Cathartiformes Cathartidae 2
Colibri serrirostris Apodiformes Trochilidae 2
Falco femoralis Falconiformes Falconidae 2
Geranoaetus albicaudatus Accipitriformes Accipitridae 2
Herpsilochmus longirostris Passeriformes Thamnophilidae 2
Machetornis rixosa Passeriformes Tyrannidae 2
Nystalus maculatus Galbuliformes Bucconidae 2
Patagioenas cayennensis Columbiformes Columbidae 2
Picumnus albosquamatus Piciformes Picidae 2
Psarocolius decumanus Passeriformes Icteridae 2
Sicalis citrina Passeriformes Thraupidae 2
Tachyphonus rufus Passeriformes Thraupidae 2
Tangara sayaca Passeriformes Thraupidae 2
Taraba major Passeriformes Thamnophilidae 2
Thamnophilus pelzelni Passeriformes Thamnophilidae 2

115
Tyrannus melancholicus Passeriformes Tyrannidae 2
Aphantochroa cirrochloris Apodiformes Trochilidae 1
Buteo brachyurus Accipitriformes Accipitridae 1
Charitospiza eucosma Passeriformes Thraupidae 1
Cnemotriccus fuscatus Passeriformes Tyrannidae 1
Colaptes melanochloros Piciformes Picidae 1
Columbina talpacoti Columbiformes Columbidae 1
Coragyps atratus Cathartiformes Cathartidae 1
Dacnis cayana Passeriformes Thraupidae 1
Falco sparverius Falconiformes Falconidae 1
Glaucidium brasilianum Strigiformes Strigidae 1
Heliomaster squamosus Apodiformes Trochilidae 1
Herpetotheres cachinnans Falconiformes Falconidae 1
Hirundinea ferruginea Passeriformes Tyrannidae 1
Legatus leucophaius Passeriformes Tyrannidae 1
Myiothlypis leucophrys Passeriformes Parulidae 1
Myrmorchilus strigilatus Passeriformes Thamnophilidae 1
Nemosia pileata Passeriformes Thraupidae 1
Orthopsittaca manilatus Psittaciformes Psittacidae 1
Piaya cayana Cuculiformes Cuculidae 1
Progne chalybea Passeriformes Hirundinidae 1
Psittacara leucophthalmus Psittaciformes Psittacidae 1
Ramphocelus carbo Passeriformes Thraupidae 1
Sturnella superciliaris Passeriformes Icteridae 1
Tyrannus savana Passeriformes Tyrannidae 1
Urubitinga coronata Accipitriformes Accipitridae 1
Veniliornis mixtus Piciformes Picidae 1
Veniliornis passerinus Piciformes Picidae 1

116
Zenaida auriculata Columbiformes Columbidae 1

117
B.4 Results of species richness and occupancy using all species data
Figure B.2: Relationship of estimated and observed (naive) species richness with vegetation structurecovariates. White points and gray lines are the estimated species richness and 95% credibility intervalsaround the estimates. Solid blue lines are the species richness-vegetation structure model predictions anddashed blue lines are the 95% lower and upper credibility intervals. Solid black circles are the observed(naive) species richness for each site and solid red line is the prediction of a quadratic glm Normal-errormodel �tted to naive data.

118
Figure B.3: Occupancy patterns of species for the two vegetation gradient covariates. Cells colors are"warmer" where species presented higher occupancy values at each site. Species were ordered in rows bythe mean of PC1 (or PC2) score divided by species occupancy at that site. In turn, the columns wereordered by increasing values of each habitat covariate.


![O livrinho das aves [por] Rodolpho von Iheringberigan.com/ambiente/assets/olivrinhodasaves00iher.pdf · ^LIBRAR IES*^SMITHSONIAN_INSTITUTlONN0linillSNI_NVIN0SHllWs'^S3 IHVM3 o: CO](https://img.pdfslide.us/doc/110x75/5f832e0acfbd276a33175c70/o-livrinho-das-aves-por-rodolpho-von-librar-iessmithsonianinstitutlonn0linillsninvin0shllwss3.jpg)