Embed Size (px)
Citation preview

UPDATES
1
www.indexuniverse.com/ETFR
IN THIS ISSUE
Pimco’s Total Return ETF is set to launch in March. But how does it differ from the blockbuster mutual fund of the same name?Page 1
Mining stocks are an attractive precious metals alternative for some investors. Julian Murdoch digs into the ETFs that cover them.Page 6
Issuers have opened the flood gates on new ETFs for 2012. ETFR lays out what’s been launched so far.Page 8
Kevin Simpson of Capital Wealth Planning discusses how GDX’s volatility makes it perfect for his firm’s options offerings.Page 12
ETFR’s monthly data bank covers all U.S.-listed ETFs, including assets, performance data and more. Pages 13-22
News Highlights: Vanguard, SSgA In Price War; First ETFs List On BATS; iShares Rolls Out Regional Funds; PowerShares Adds To ‘Low Vol’ Lineup … And much more!Pages 1-4
By Cory BanksIt may be the biggest ETF launch since SPY.
This month, fixed-income manage-ment firm Pimco plans to launch an ex-change-traded fund version of its flagship Total Return Mutual Fund (PTTRX). The ETF will be actively managed by Pimco founder and PTTRX leader Bill Gross, of-ten hailed as the best mutual fund man-ager in the world. If successful, the ETF could change how active funds are per-ceived in ETFs.
But though the two funds share a name, they’re not identical. In fact, the differences between the mutual and ex-change-traded funds could mean a sig-nificant difference in return, particularly over any specific time period.
ETF AdvantagesThere’s a lot to be excited about with the Pimco Total Return ETF (ticker: TRXT). Take intraday trading. While PTTRX can only
be traded once per day—after the close—TRXT, like all ETFs, will trade throughout the day, just like a stock. Given the likely popularity of the new ETF, we expect real liquidity to develop in the fund, keeping spreads tight. And like any stock, TRXT’s tradability will lead to a number of ancil-lary benefits (marginability, etc.).
Cost, however, is the biggie: TRXT is set to have an annual expense ratio of 0.55 percent. That’s 30 basis points cheaper than the “A” class mutual fund version that’s most readily available for retail inves-tors. The bulk of that cost savings is driven by the fact that TRXT will not charge 12b-1 fees, the much-despised fees mutual funds levy to cover sales and marketing costs.
Combined, these benefits will make the ETF a nice vehicle …
Potential Challenges… if it delivers the returns people expect.
After all, the real key to TRXT’s
Sizing Up Pimco’s Total Return ETF
State Street Global Advisors cut ex-pense ratios on its nine “Select Sector SPDR” sector ETFs, leaving their prices 1 basis point lower than competing funds from Vanguard.
The Select Sector SPDRs are the larg-est U.S.-focused sector ETFs. In a regula-tory filing effective Jan. 31, the Boston-based SSgA said that expense ratios on all nine of its Select Sector ETFs would be lowered by 10 percent, or 2 basis points, to 0.18 percent.
On the surface, the move appears to be a response to price-cutting made by Valley Forge, Pa.-based Vanguard in late December. At that time, Vanguard said it was able to cut expense ratios on its fam-ily of sector funds by some 20 percent—to 0.19 percent each—thanks to gains in economies of scale and growth in assets.
A representative for the Select Sector SPDR Trust said the board of directors had already decided to lower fees on the suite of SPDR sector ETFs at its last meeting in No-
vember, but an announcement could only be made once a prospectus was filed with the Securities and Exchange Commission.
First ETFs List On BATSOn Jan. 24, iShares launched the iShares MSCI Norway Capped Investable Mar-ket Index Fund (BATS: ENOR); it was the first ETF to launch on the BATS ex-change. ENOR comes with an expense ratio of 0.53 percent.
iShares plans to launch a total of eight
Vanguard, SSgA In Price War
Vol. 12 | No. 3March 2012
9

Go in with anexit strategy.PowerShareS eTFS give you iNTraDay
liquiDiTy So aNyThiNg you geT iNTo, you
caN geT ouT oF.✲ BecauSe wheN iT comeS
To iNveSTiNg For your clieNTS, you’re
NoT juST aloNg For The riDe.
invescopowershares.com | Follow us @PowerShares
The best situation for your clients is the agility to avoid a bad one.
✲ Exchange-traded funds (ETFs) trade on exchanges, like stocks, continuously throughout the trading day. // There are risks involved with investing in ETFs including possible loss of money. The funds are not actively managed and intraday liquidity does not protect against losses. Ordinary brokerage commissions apply. Shares are not FDIC insured, may lose value and have no bank guarantee.
// Shares are not individually redeemable and owners of the shares may acquire those shares from the Funds and tender those shares for redemption to the funds in Creation Unit aggregations only, typically consisting of 50,000 shares. // Po werSha res® is a reg istered tra demark of Invesco Power S h a res Capital Management LLC. ALPS Distributors, Inc. is the distributor for Q Q Q. Invesco PowerShares Capital Management LLC is not affil iated with ALPS Distributors, Inc.
// An investor should consider the Fund’s investme nt objective, risks, c h a rges and expenses ca re ful ly before investin g. To obtain a pros p ec tus , w h ich conta ins this and ot h e r info r m a t i o n a b out t he Q Q Q, a unit investment trust , p lease contac t your broker, call 800.983.0903 or v isit www.invescopowershares.com. Please read the prospectus carefully before investing.
CLIENT > PowerShares | JOB > 11_PWR-0007P_US Print PUB > ETFR_Sept | ORIENTATION > Full Page TRIM > 8.5"x11” | BLEED > 8.75”x11.25” | LIVE > 8”x10.5” | INKS > 4C @ 300 MAX | COLOR PROFILE > U.S. Web Coated (SWOP) v2
11_PWR-0007P_Liquidity_FP_ETFR_sept_M.indd 1 8/1/11 11:15 AM

UPDATES
ETFR • March 2012 3
IndexUniverse LLC353 Sacramento Street, Suite 1520
San Francisco, CA 94111
CEOJim Wiandt
415 659 9007Fax 415 659 9005
COO Don Friedman415 659 9009
Publisher & Director of SalesFoster Wright646 867 4481
EditorMatt Hougan
Managing EditorCory Banks
Copy EditorLisa Barr
Art DirectorJeannine Gaubert [email protected]
Online Production ManagerJuan Calderon
SUBSCRIPTION INFORMATIONThe introductory rate to subscribe to ETFR is $279 annually. Subscribe by contacting Ivana Zivkovic at [email protected] or by calling 415-659-9029.
COPYRIGHT STATEMENT © 2012 IndexUniverse LLC. All rights reserved.The text, images and other materials contained or displayed are proprietary to IndexUniverse LLC, ex-cept where otherwise noted, and constitute valuable intellectual property. No material from any part of any IndexUniverse LLC publication, product, service, report, email or website may be downloaded, trans-mitted, broadcast, transferred, assigned, reproduced or in any other way used or otherwise disseminated in any form to any person or entity, without the explicit written consent of IndexUniverse LLC.
For permission to photocopy and use material elec-tronically, please contact [email protected] or call 415-659-9004.
single-country ETFs on the exchange. ENOR was followed by additional funds—the iShares MSCI Denmark Capped Invest-able Market Index Fund (BATS: EDEN), the iShares MSCI Finland Capped Invest-able Market Index Fund (BATS: EFNL) and the iShares MSCI India Index Fund (BATS: INDA). Like ENOR, EDEN and EFNL both cost 0.53 percent, while INDA carries an expense ratio of 0.65 percent.
The other iShares slated to launch on the BATS exchange include ETFs tracking the small-cap markets of Canada, Australia, India, the United Kingdom and Germany.
iShares Rolls Out Regional FundsBlackRock’s iShares launched two new regional emerging market funds in mid-January, a first-to-market one targeting Europe, the Middle East and Africa; and the other focused on Latin America. Both ETFs track MSCI indexes and have pri-mary listings on Nasdaq.
The two funds—the iShares MSCI Emerging Markets Latin America (Nas-daqGM: EEML) and the iShares MSCI Emerging Markets EMEA Index Fund (NasdaqGM: EEME)—both come with an expense ratio of 0.49 percent.
EEME is the first ETF to offer exposure to European, Middle Eastern and African emerging market equities, San Francisco-based iShares said in an emailed commu-niqué on the rollout. The ETF targets the Czech Republic, Egypt, Hungary, Moroc-co, Poland, Russia, South Africa and Tur-key, according to the fund’s prospectuses.
EEML, the ETF focused on Latin Amer-ica, targets the following five countries: Brazil, Chile, Colombia, Mexico and Peru.
iShares Debuts Commodity-Stock ETFsIn early February, iShares launched five sep-arate equity ETFs focused on commodities.
The five funds and their expense ra-tios are:• iShares MSCI Global Gold Miners Fund
(NYSE Arca: RING), 0.39 percent• iShares MSCI Global Select Metals &
Mining Producers Fund (NYSE Arca: PICK), 0.39 percent, including fee waiver of 0.02 percent through Dec. 31, 2014
• iShares MSCI Global Energy Producers
Fund (NYSE Arca: FILL), 0.39 percent• iShares MSCI Global Agricultural Pro-
ducers Fund (NYSE Arca: VEGI), 0.39 percent, including 0.01 percent fee waiver through Dec. 31, 2014
• iShares MSCI Global Silver Miners Fund (NYSE Arca: SLVP), 0.39 percentAll five new iShares funds use repre-
sentative sampling strategies, meaning they don’t seek to own all the compa-nies in the MSCI indexes they track. They also are broad-based funds that provide diversification by including stocks in a wide variety of regions and countries, both developed and developing.
PowerShares Adds To ‘Low Vol’ LineupIn mid-January, Invesco PowerShares brought two low-volatility ETFs to mar-ket. The launches follow on the success of the PowerShares S&P 500 Low Vola-tility Portfolio ETF (NYSE Arca: SPLV), which has gathered more than $1 billion since its launch in May 2011.
The PowerShares S&P Emerging Mar-kets Low Volatility Portfolio (NYSE Arca: EELV) and the PowerShares S&P Interna-tional Developed Low Volatility Portfolio (NYSE Arca: IDLV), like SPLV, each track indexes derived from broader bench-marks that have been screened to ex-clude higher-volatility stocks.
EELV and IDLV currently come with net annual expense ratios of 0.29 percent and 0.25 percent, respectively. Both prices re-flect fee waivers effective through April 20, 2013 of 16 basis points on EELV and 10 basis points on IDLV. EELV is based on the S&P Emerging BMI Plus Large Mid Cap Index, which covers stocks from Brazil, Chile, China, Colombia, the Czech Repub-lic, Egypt, Hungary, India, Indonesia, Ma-laysia, Mexico, Morocco, Peru, the Philip-pines, Poland, Russia, South Africa, South Korea, Taiwan, Thailand and Turkey.
ProShares Launches Breakeven Inflation ETFsIn mid-January, ProShares rolled out a pair of funds that allow investors to express an outlook on inflation by pairing exposure of 30-year Treasury bonds with TIPS, a first for the U.S. ETF market. One ETF is long 30-year T-bonds and short 30-year TIPS, and the other achieves the opposite.

UPDATES
4 ETFR • March 2012
The ProShares 30 Year TIPS/TSY Spread (NYSE Arca: RINF) tracks the Dow Jones Credit Suisse 30-Year Inflation Breakeven Index, which is designed to measure the return of a long position in 30-Year TIPS and a short position in Treasury bonds.
Its inverse counterpart, the ProShares Short 30 Year TIPS/TSY Spread (NYSE Arca: FINF), provides the daily inverse perfor-mance of that same index, which means it’s short the long bond and long 30-year TIPS.
Each fund charges 0.75 percent in fees.
New ProShares Bond Fund Covers German MarketProShares launched an ETF in late January that is focused solely on debt issued by the German government, following a similar product rollout by Pimco in November.
The ProShares German Sovereign/Sub- Sovereign ETF (NYSE Arca: GGOV) charges 0.45 percent, including a 0.33% fee waiv-er that is in place through Jan. 25, 2013. At least for the first year of its existence, investors in GGOV will pay the same fee as the Pimco Germany Bond Index Fund (NYSE Arca: BUND), which is focused on the German sovereign debt market.
GGOV invests in investment-grade fixed-rate debt securities issued by Germany’s federal government in addition to securities from German local and government-backed agencies. The bonds must have a minimum principal outstanding of $1 billion and have at least one year to maturity.
AdvisorShares Rolls Out Active Sector Fund-Of-FundsAdvisorShares in mid-January launched a sector fund-of-funds ETF that’s de-signed to generate consistent returns in any market environment through a sector-rotation system.
The AdvisorShares Rockledge Sec-torSAM ETF (NYSE Arca: SSAM) is a long/short portfolio that invests in the top-performing sectors while shorting those expected to have low or negative returns.
Rockledge Advisors, a subsidiary of Conn.-based investment advisory firm Rockledge Group that’s known for sector investing, manages the fund. The ETF has a net annual expense ratio of 1.50 percent.
SSAM relies on Rockledge Advisors’ pro-prietary quantitative sector scoring and al-location methodology, or SectorSAM. The
system determines which U.S. sectors look most and least promising by forecasting each sector’s excess return within a specific time frame relative to the broad stock mar-ket as measured by the S&P 500 Index.
SSAM strives to maintain a dollar-neu-tral portfolio—meaning the dollar value of long positions is equal to that of short positions—as a way to mitigate risk, ac-cording to information in the fund’s pro-spectus filed with U.S. regulators.
SSgA Debuts Small-Cap EM Asia ETFIn mid-January, State Street Global Advi-sors launched a small-cap version of its broader SPDR S&P Emerging Asia Pacific ETF (NYSE Arca: GMFS), a first-to-market fund targeting a region that many ana-lysts see as having the greatest potential for growth in the coming years.
The new SPDR S&P Small Cap Emerging Asia Pacific ETF (NYSE Arca: GMFS) comes with an annual expense ratio of 0.65 per-cent, compared with 0.59 percent for the broader and larger-cap SPDR S&P Emerg-ing Asia Pacific ETF (NYSE Arca: GMF).
Each stock in the index is capped at a maximum of 25 percent of the index weight, and the top five stocks are capped at a maximum of 50 percent of the index weight. Countries covered in the index have historically included, among other countries, China, India, Indonesia, Malaysia, the Philip-pines, Taiwan and Thailand. As of May 31, 2011, the index had 1,321 securities.
SPY Crosses $100 Billion MarkIn early February, “SPY,” the very first U.S.-listed exchange-traded fund, became the first ETF to gather more than $100 billion, almost 19 years after its launch, putting it in the company of some of the more legendary U.S. mutual funds and making it the perfect metaphor for an ETF industry that’s on a roll.
The fund, officially known as the SPDR S&P 500 ETF (NYSE Arca: SPY), gath-ered $1.31 billion in fresh assets as of Jan. 20, ending the day’s trading session with $101.03 billion in assets, according to data compiled by IndexUniverse. It’s a milestone that’s almost unbelievable to those who created SPY. The ETF was dreamed up by the American Stock Ex-change as a vehicle for traders its creators
hoped would help pump up volume.SPY is now just about as big as the
$101.8 billion Vanguard 500 Index Fund (VFINX), the world’s first index mutual fund, launched in 1975.
WisdomTree Turns A ProfitWisdomTree swung to a fourth-quarter profit of $889,000 compared with a $580,000 loss in the same year-earlier pe-riod. The results were fueled by a more than 20 percent increase in revenue, as it continued to attract investors to its funds.
The company’s fourth-quarter revenue rose to $16.2 million from $13.4 million in the same year-earlier quarter.
In all of 2011, the company earned $3.1 million compared with a net loss of $7.5 million in 2010, as revenues jumped almost 56 percent to $65.2 million.
The company’s total expenses increased 9.2 percent to $15.3 million from $14.0 million in the fourth quarter of 2010.
Advisors Used More ETFs In 2011ETFs are as popular with independent advi-sors as they have ever been, snagging more client assets in 2011 than in previous years, a new Charles Schwab study showed.
That growth, while set to continue, isn’t spelling the end of mutual funds just yet, according to the “2012 ETF Outlook For Advisors” that San Francisco-based Schwab co-authored with ETF Trends, an ETF news website. To that point, ETFs represented just 8 percent of registered investment advisor (RIA) assets held at Schwab, the study said.
During 2011, more than eight out of 10 RIAs who custody client assets with Schwab used ETFs in their client portfolios, according to the study. What’s more, their allocations to ETFs grew by 5 percent in the past year to reach a total of $60 billion.
In 2011, mutual funds at Schwab con-tinued to attract assets in a trend that sug-gests advisors are comfortable mixing both types of investment vehicles. Specifically, they still tend to rely more on mutual funds for core positions and on ETFs for more ac-tive trading strategies, the company said.
About 85 percent of investment advi-sors working with Schwab used ETFs in their client portfolios in 2011, and more than half of them used ETFs to obtain ex-posure to equities, mostly U.S. equities.

ETFsPLUS A WHOLE LOT MORE
Subscriptions: www.indexuniverse.com/subscriptions. Advertising and Reprints Inquiries: 415.659.9029

6 ETFR • March 2012
By Julian MurdochIf you’ve watched the roller coaster of gold prices, you might be a bit queasy. And if that upset stomach made you think about returning to the world of eq-uities through gold miners, you wouldn’t be alone. Precious metals mining ETFs now hold $12.4 billion in AUM. But what exactly are you getting with this not-quite-gold exposure?
Miners ETFs hold companies that pro-duce highly sought-after precious met-als, but they are equities just the same, and as such are subject to the same market forces as GM, Target and Pepsi. The credit crunch, the Arab spring, the European debt crisis—anything that in-fluences the market as a whole affects the companies in these funds as well. On the other hand, the funds are also highly correlated with the prices of their underlying products—something that can either amplify stock market forces, or sometimes counteract them.
The main advantage of buying metals miners ETFs for most investors is simply their familiarity. Ultimately, they’re just equities, as opposed to commodities ETFs, which many investors find daunt-ing, with their unusual structure and tax treatment. But which miner ETF is the best for you?
Gold MinersThe largest gold miner ETF is the Market Vectors Gold Miners Fund (NYSE Arca: GDX), with $9.4 billion in assets under management as of the end of January 2012—a full two-thirds of assets in this niche are captured by this ETF. GDX tracks the NYSE Arca Gold Miners Index and is composed of primarily large-cap equities, though it does hold roughly 12 percent midcaps and 2 percent small. It delivered a dividend yield of just 0.92 in 2011, but for the 12 months ending Jan. 31, 2012 GDX was the best-performing gold miner ETF, with a total return of 5 percent. During the same time period, spot gold was up around 30 percent.
Its top five holdings as of Feb. 6 were Barrick Gold Corp, Goldcorp Inc., New-mont Mining Corp., AngloGold Ashanti Ltd. and Silver Wheaton Corp.
Notice the last one. Silver Wheaton Corp, a company that expects to pro-duce 25 million equivalent ounces of silver in 2012, also makes it into the top holdings of GDX because of its large gold production (an estimated 15,000 ounces in 2011). This highlights a very important thing to remember when looking for a mining-company “pure” play—precious metals are often found together in mining deposits, along with other metals such as
copper, tin and other base metals. This makes it difficult to get exposure
to single metals, but not impossible. Glob-al X launched its Pure Gold Miners fund (NYSE Arca: GGGG) in March 2011 to do just that. GGGG’s prospectus states: “Only companies that generate the vast major-ity of their business from gold mining are eligible to be included in the Underlying Index.” It goes on to note that in 2010, 95 percent of revenues from companies in the index were derived from gold mining.
Other options for exposure to gold mining companies include the Market Vec-tors Junior Gold Miners Fund (NYSE Arca: GDXJ), which holds primarily small-cap companies (less than $1 billion in mar-ket cap) that are involved in gold mining and exploration. These companies tend to carry more risk and see more volatility than the larger, more established compa-nies and deliver even lower dividend yields (0.29 in 2011). The hook, however, is that they also carry more potential upside. Ju-nior gold miners have long been a specula-tive favorite, tapping into the hopefulness of an Old-West forty-niner. GDXJ is cur-rently the second-largest ETF in this sector, with around $2.5 billion in assets under management at the end of January 2012.
Similarly, the Global X Explorers ETF (NYSE Arca: GLDX) focuses on the ex-
Precious Metals Or Precious Miners?
Figure 1
Metals Miners ETFs Compared
Ticker fund AuM ($, M)30-dAy
Avg. vol.expense
rATio1–yrTrr
GDX Market Vectors Gold Miners 9,408.33 10,992,615 0.53 5.01 GDXJ Market Vectors Junior Gold Miners 2,523.11 2,883,374 0.54 -7.38 GGGG Global X Pure Gold Miners 5.53 5,390 0.59 -4.62* GLDX Global X Gold Explorers 28.88 37,968 0.65 -23.37 PSAU PowerShares Glbl Gold & Prec Mtls 48.61 9,230 0.75 1.24 PLTM First Trust ISE Global Platinum 11.07 14,692 0.70 -36.89 SIL Global X Silver Miners 361.42 203,937 0.65 10.59*Earliest possible date: 3/15/11
Source: Bloomberg. Data as of 1/31/2012.

ETFR • March 2012 7
ploration stage of gold mining. The fund tracks approximately 30 companies, primarily outside of the U.S., that are engaged in exploration and early devel-opment of gold mine locations. Unsur-prisingly, the further you move away from companies with established gold produc-tion businesses, the less the return of the companies has anything to do with price movements in gold. GLDX has the lowest correlation to gold spot prices of all the gold miner ETFs, at just 0.672 percent.
Silver MinersUntil just recently, silver buffs had an easy choice, with one ETF focused on silver miners: the Global X Silver Miners ETF (NYSE Arca: SIL). It tracks the Solactive Global Silver Miners Index. The most no-table thing about the fund is that it’s actu-ally quite highly correlated to other miners (ranging from 0.834 for GGGG to 0.897 for GDXJ), but only moderately correlated to the actual price of silver at 0.772. SIL also largely failed to participate in spot sil-ver’s meteoric rise and fall in the spring of 2011, although it has tracked spot silver much more closely since that time.
Platinum MinersThe First Trust ISE Global Platinum Index Fund (NYSE Arca: PLTM) tracks compa-nies that produce not only platinum, but also the other platinum group metals: palladium, osmium, iridium, ruthenium and rhodium. These metals are all used in industrial applications, with palladium and platinum playing a large role in the production of catalytic converters for gasoline and diesel engines. This makes the whole group far more sensitive to true economic conditions and less sus-ceptible to the whims of precious metals speculators and investors.
That hasn’t particularly helped inves-tors, however. Platinum had an especial-ly rough year, losing around 11 percent in the 12 months ending Jan. 31, 2012. PLTM was down close to 37 percent dur-ing the same period. Lower demand for platinum, and the subsequent price fall combined with market pressures, heavily impacted these firms. Investors haven’t been all that interested in playing, ei-ther, and the fund currently has less than $12 million in assets.
One ETF To Bind Them All The PowerShares Global Gold and Pre-cious Metals Portfolio (NYSE Arca: PSAU) tracks the Nasdaq OMX Global Gold and Precious Metals Index. It includes the largest and most liquid companies in-volved in gold, silver and platinum min-ing and production. For the 12 months ending Jan. 31, 2012, PSAU has a total return of 1.24 percent—not as good as SIL and GDX, but much better than the rest of the precious metal mining ETFs. Given the nonpure-play nature of most mining companies, it’s an interesting ap-proach, but one that hasn’t particularly caught on with investors either, with un-der $50 million in assets.
New Kids On The BlockThe world of ETFs is constantly growing, and this sector is no exception. iShares, which has been on a bit of a fund-launch-ing tear in 2012, recently launched two new ETFs: RING and SLVP.
RING is the MSCI Global Gold Min-ers Fund ETF, a fairly straightforward clone of the sector leader, GDX. SLVP, or the MSCI Global Silver Miners Fund ETF, does the same for silver. The most notable thing about the two funds is not their construction, but their pricing. Normally, the miners sector is expensive, with expense ratios ranging from 53 to 75 basis points—high for passive index funds. The new iShares offerings, how-ever, are priced at just 0.39 percent.
While it’s far too early to make con-clusions, it’s fairly safe to assume the core exposure provided by these new competitors will be adequate for the
needs of most investors, and the cost advantages are compelling.
How They PerformedIt should be noted that none of these eq-uity ETFs outperformed the price of the metals their holdings produced in the past year. In the 12 months ending Jan. 31, 2012, gold was up 30 percent, sil-ver was up 18 percent and platinum was down 11 percent, all handily beating the miners. But comparing mining company performance to spot metal prices is a bit of an apples-and-oranges comparison—they’re fruit, but you’re not making pies with one of them.
The more accurate comparison would be to look at the performance of the stock market in general, and here, two ETFs—the Market Vectors Gold Miners (GDX) and the Global X Silver Miners (SIL)—did post better returns than the S&P’s 4.12 percent for the same time period.
But perhaps the most important thing to remember is that you’re not buying gold or silver or even rhodium with these ETFs. You’re buying companies; compa-nies with cash flow, balance sheets, man-agement and politics to contend with. And this leads correlations to be quite low.
Once upon a time, gold miners were seen as a way of getting convenient access to gold price exposure in a liquid, ex-change-traded vehicle. Since investors can now do that directly through precious metals ETFs, miners have a much higher hurdle to clear. They have to be good in-vestments in their own right. As always, lift up the hood to make that call for yourself, just like you would for any equity ETF.
Figure 2
Metals Miners Correlations
Ticker fundSpoT Gold
SpoT Silver
plaT
GDX Market Vectors Gold Miners 0.700 0.716 0.719 GDXJ Market Vectors Junior Gold Miners 0.692 0.739 0.747 GGGG Global X Pure Gold Miners 0.715 0.693 0.769 GLDX Global X Gold Explorers 0.672 0.716 0.761 PLTM First Trust ISE Global Platinum 0.237 0.430 0.555 SIL Global X Silver Miners 0.611 0.772 0.734 PSAU PowerShares Glbl Gold & Prec Mtls 0.636 0.709 0.750
Source: IndexUniverse
8 ETFR • March 2012
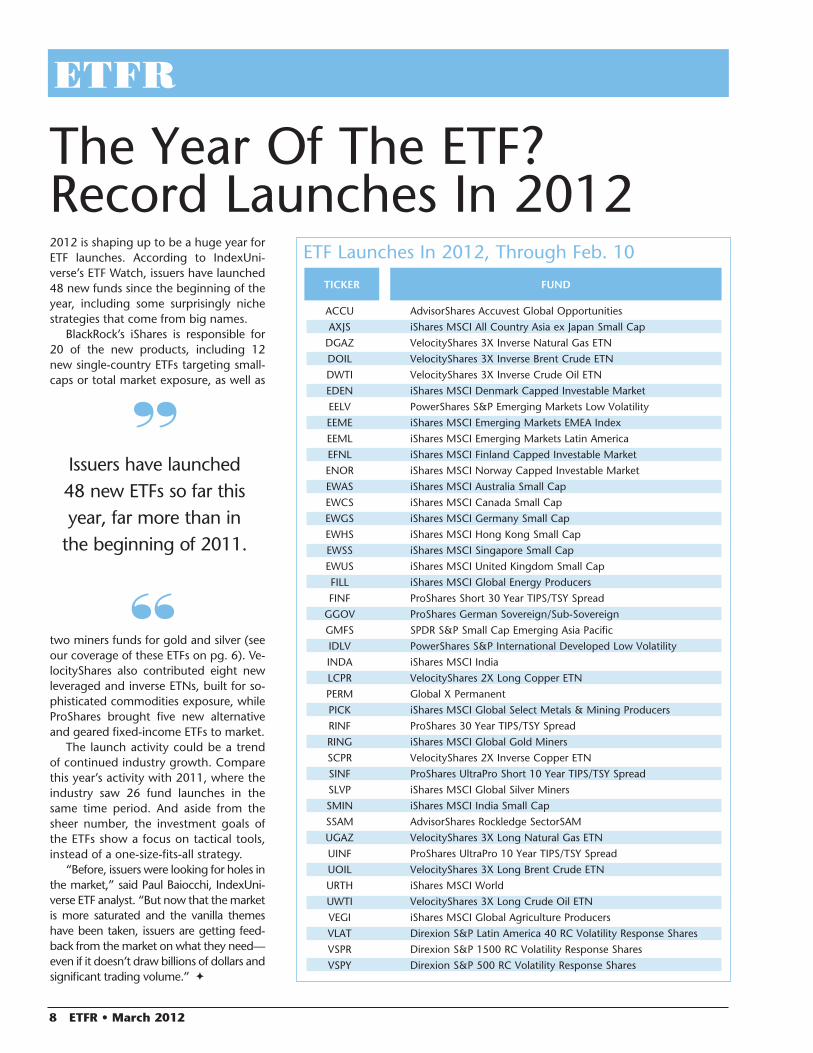
2012 is shaping up to be a huge year for ETF launches. According to IndexUni-verse’s ETF Watch, issuers have launched 48 new funds since the beginning of the year, including some surprisingly niche strategies that come from big names.
BlackRock’s iShares is responsible for 20 of the new products, including 12 new single-country ETFs targeting small-caps or total market exposure, as well as
two miners funds for gold and silver (see our coverage of these ETFs on pg. 6). Ve-locityShares also contributed eight new leveraged and inverse ETNs, built for so-phisticated commodities exposure, while ProShares brought five new alternative and geared fixed-income ETFs to market.
The launch activity could be a trend of continued industry growth. Compare this year’s activity with 2011, where the industry saw 26 fund launches in the same time period. And aside from the sheer number, the investment goals of the ETFs show a focus on tactical tools, instead of a one-size-fits-all strategy.
“Before, issuers were looking for holes in the market,” said Paul Baiocchi, IndexUni-verse ETF analyst. “But now that the market is more saturated and the vanilla themes have been taken, issuers are getting feed-back from the market on what they need—even if it doesn’t draw billions of dollars and significant trading volume.”
The Year Of The ETF? Record Launches In 2012
ETF Launches In 2012, Through Feb. 10
Ticker fund
ACCU AdvisorShares Accuvest Global Opportunities AXJS iShares MSCI All Country Asia ex Japan Small Cap DGAZ VelocityShares 3X Inverse Natural Gas ETN DOIL VelocityShares 3X Inverse Brent Crude ETN DWTI VelocityShares 3X Inverse Crude Oil ETN EDEN iShares MSCI Denmark Capped Investable Market EELV PowerShares S&P Emerging Markets Low Volatility EEME iShares MSCI Emerging Markets EMEA Index EEML iShares MSCI Emerging Markets Latin America EFNL iShares MSCI Finland Capped Investable Market ENOR iShares MSCI Norway Capped Investable Market EWAS iShares MSCI Australia Small Cap EWCS iShares MSCI Canada Small Cap EWGS iShares MSCI Germany Small Cap EWHS iShares MSCI Hong Kong Small Cap EWSS iShares MSCI Singapore Small Cap EWUS iShares MSCI United Kingdom Small Cap FILL iShares MSCI Global Energy Producers FINF ProShares Short 30 Year TIPS/TSY Spread GGOV ProShares German Sovereign/Sub-Sovereign GMFS SPDR S&P Small Cap Emerging Asia Pacific IDLV PowerShares S&P International Developed Low Volatility INDA iShares MSCI India LCPR VelocityShares 2X Long Copper ETN PERM Global X Permanent PICK iShares MSCI Global Select Metals & Mining Producers RINF ProShares 30 Year TIPS/TSY Spread RING iShares MSCI Global Gold Miners SCPR VelocityShares 2X Inverse Copper ETN SINF ProShares UltraPro Short 10 Year TIPS/TSY Spread SLVP iShares MSCI Global Silver Miners SMIN iShares MSCI India Small Cap SSAM AdvisorShares Rockledge SectorSAM UGAZ VelocityShares 3X Long Natural Gas ETN UINF ProShares UltraPro 10 Year TIPS/TSY Spread UOIL VelocityShares 3X Long Brent Crude ETN URTH iShares MSCI World UWTI VelocityShares 3X Long Crude Oil ETN VEGI iShares MSCI Global Agriculture Producers VLAT Direxion S&P Latin America 40 RC Volatility Response Shares VSPR Direxion S&P 1500 RC Volatility Response Shares VSPY Direxion S&P 500 RC Volatility Response Shares
Issuers have launched 48 new ETFs so far this year, far more than in
the beginning of 2011.

ETFR • March 2012 9
appeal is simple: Bill Gross. Investors are excited about this fund because they hope that TRXT will replicate PTTRX’s tre-mendous performance (while retaining the added benefits of the ETF).
Launched in 1987, PTTRX eventually grew to become the largest—and argu-ably most successful—mutual fund in the world, with over $250 billion in assets un-der management and a five-year return of over 50 percent.
A large factor in that performance is the freedom Gross has in managing it. According to its prospectus, PTTRX de-votes “at least 65 percent of its total as-sets” to fixed-income products, but may also invest up to 10 percent of assets in junk bonds and 30 percent in foreign-de-nominated products, including another 15 percent in products tied to develop-ing nations. Those are all standard allo-cations for a bond fund seeking high re-turns, and a quick read of the prospectus would lead most investors to think that they’ve got PTTRX figured out.
But they’d be wrong. In fact, it’s ex-tremely hard to tell how Gross runs the fund. The holdings list for Total Return is over 300 pages deep, and because it’s only published quarterly, is long since out of date by the time a potential inves-tor starts her homework.
Buried inside those 300 pages is one kind of holding that most mutual fund investors rarely think about: derivatives. According to the prospectus, Gross and his team can invest “without limitation” in derivatives for PTTRX, including op-tions, futures or swaps. ETFR’s review of the holdings suggest that PTTRX uses de-rivatives primarily for two reasons: 1) to adjust interest-rate exposure; and 2) to hedge against credit risk.
The utility of interest rate swaps is clear: They can be used to quickly adjust duration.
For example, say Total Return adds a large position in long-maturity Treasury bonds, hoping to lock in their attractive yields. The move may signal Gross’ con-fidence that the Federal Reserve won’t
crank up interest rates. But if there are timing concerns, or short-term changes in the market, Gross can use interest-rate swaps to either raise or lower the fund’s total duration quickly. This constant di-aling up and down gives PTTRX an ex-treme amount of flexibility.
The CDS side may be just as impor-tant. PTTRX often buys credit default swaps as insurance. That insurance is a double-edged sword, however: If the market does well, the cost and dilution of those CDSs should hurt the mutual fund’s performance. If the market falls apart, the
swaps pay off. There are even indications that the fund has sold CDSs in the past—doing so would express a position that a borrower won’t default, without requiring the fund to actually hold the bond.
Realistically, there’s little limit to what Gross can use these derivatives to achieve.
What’s The Issue With The ETF?All this is relevant because, as of this writ-ing, the U.S. Securities and Exchange Commission has a lockdown on provid-ing exemptive relief from the 1940 Act for new ETF issuers that want to use swaps or other derivatives inside port- folios. The fear is that these derivatives may be too risky for end-investors, and until the regulatory board decides whether or not to tighten current restric-tions, no one gets to use them.
This pulls an effective tool out of TRXT’s belt. The fund’s full prospectus addresses this, stating that the ETF “will not invest in options contracts, futures contracts or swap agreements, in accordance with the Trust’s current SEC exemptive relief. Should the SEC modify the Trust’s current exemptive relief or otherwise issue guid-ance or relief such that the [ETF] may uti-lize one or more of these derivative instru-ments in reliance thereon, the [ETF] may revise this policy accordingly.”
Outside of that statement, the pro-spectuses for both the mutual fund and ETF are essentially identical. But it’s a sig-nificant limitation, and one that begs the question of how truly comparable the portfolios for these products will be.
Another potential concern of the ETF structure could be seen as an advan-tage for others: portfolio transparency. While PTTRX discloses its holdings quar-terly, TRXT will have to—by law—dis-
Pimco from page 1
Figure 1
Pimco’s Total Return Funds Compared
Ticker12b-1Fees
expenseraTio
Fundbonds
allocaTioncrediT
deFaulT swapsinTeresT
raTe swapscurrency Forwards
TRXT Pimco Total Ret ETF 0.55% No At least 65% No No Yes PTTRX Pimco Total Ret INSTL 0.46% No At least 65% Yes Yes Yes PTTAX Pimco Total Ret A 0.90% Yes At least 65% Yes Yes Yes
Source: Pimco
While PTTRX discloses its holdings quarterly, TRXT will have to—by law—disclose its full portfolio on a daily basis, raising the risk of other market
participants frontrunning the portfolio.
10 ETFR • March 2012
close its full portfolio on a daily basis, raising the risk of other market partici-pants front-running the portfolio. This is not insurmountable—Pimco’s Enhanced Short Maturity Strategy ETF (NYSE Arca: MINT) follows an active strategy with bonds, discloses its portfolio daily and has been a major success, attracting $1.4 billion in assets. But it does mean that in-vestors will see Bill Gross’ magic on full display. In fact, some wonder if TRXT will follow different tactics than the mutual fund, to avoid the possibility of investors front-running the bigger portfolio.
Which One To Buy?So should investors buy the mutual fund or the ETF? It’s not an easy question to answer.
It’s fair to expect that Gross and his team will make the ETF as identical to the mutual fund as possible—after all, they’ve taken the bold step of naming it the “To-tal Return ETF.” But we know an entire class of holdings—derivatives—will be absent until the SEC lifts its lockout. De-
termining how those derivatives, or the lack thereof, impact performance is like hitting a mosquito with a dart.
Dave Nadig, director of Research at In-dexUniverse, believes TRXT’s lack of deriv-atives might lead to a more volatile ETF in the short term. “TRXT will have vastly few-er holdings and an inability to hedge out interest and tail risk,” he said. “That will make the ETF far more subject to spikes, because there will be no insurance.”
Not everyone agrees. Michael Paciot-ti, chief investment officer at Integrated Capital Management Inc., sees the lack of derivatives as lowering risk for the port-folio. “With the mutual fund, when you use derivatives, that brings leverage,” he said. “Pimco’s point of view is that, if a portfolio’s leverage doesn’t affect its dura-tion, it’s not risk-based leverage.”
But Paciotti believes that the lever-age still affects you in tail events, like the 2008 financial crisis. “I don’t think the leverage created by derivatives is mean-ingless, because in a liquidity event it will be meaningful.”
Without the derivatives, Paciotti said, Pimco may have to run the ETF the hard way. “In the mutual fund version, the fund is far too big to generate excess re-turn through individual bond selection.” He believes the fund uses derivatives to tilt the portfolio toward different factors eas-ily—doing so through actual bond trad-ing would be like steering the Titanic.
Trading the bonds in a new ETF is possible, but there are downsides. “I don’t think investors would be happy with the results, because of transaction costs,” said Paciotti. “And their ability to move quickly in that type of portfolio would be greatly reduced, which would hurt their alpha.”
One thing everyone agrees on is that the ETF will not be exactly like the mu-tual fund. It will be cheaper and more liquid, but will have a different portfolio than the fund.
No matter the name on the label, in-vestors will have to make a choice be-tween the two products—and do their homework before they buy.
Pimco from page 9
IndexIng... and everythIng else
The latest industry news and data for ETFs and indexing. Three magazines. Two websites. One independent voice.
Subscriptions: www.indexuniverse.com/subscriptions. Advertising and Reprints Inquiries: 415.659.9029
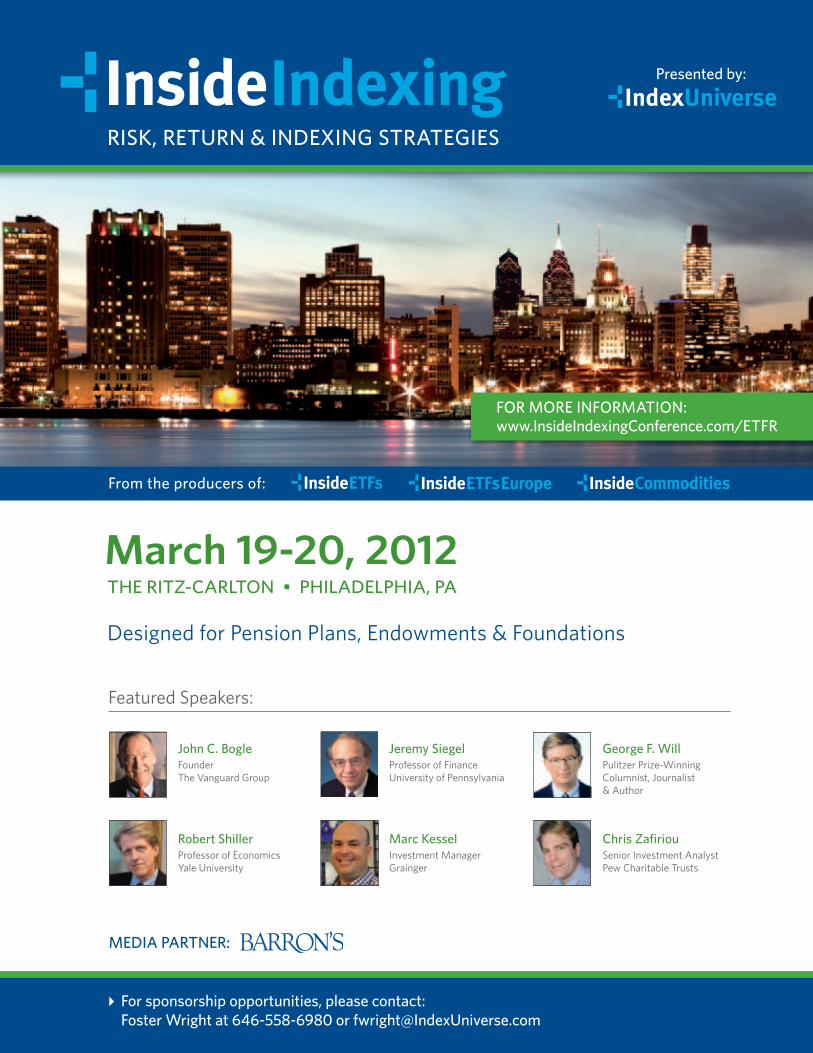
Designed for Pension Plans, Endowments & Foundations
} For sponsorship opportunities, please contact: Foster Wright at 646-558-6980 or [email protected]
From the producers of:
InsideETFs
InsideIndexing
InsideETFsEurope
InsideCommodities
InsideETFs
InsideIndexing
InsideETFsEurope
InsideCommoditiesInsideETFs
InsideIndexing
InsideETFsEurope
InsideCommodities
For more InFormatIon: www.InsideIndexingConference.com/etFr
Featured Speakers:
March 19-20, 2012the ritz-carlton • philadelphia, pa
InsideETFs
InsideIndexing
InsideETFsEurope
InsideCommodities
risk, return & indexing strategies
presented by:
marc KesselInvestment Manager Grainger
Jeremy siegelProfessor of Finance University of Pennsylvania
robert shiller Professor of Economics Yale University
John C. BogleFounder The Vanguard Group
Chris Zafiriou Senior Investment Analyst Pew Charitable Trusts
george F. WillPulitzer Prize-Winning Columnist, Journalist & Author
Media partner:
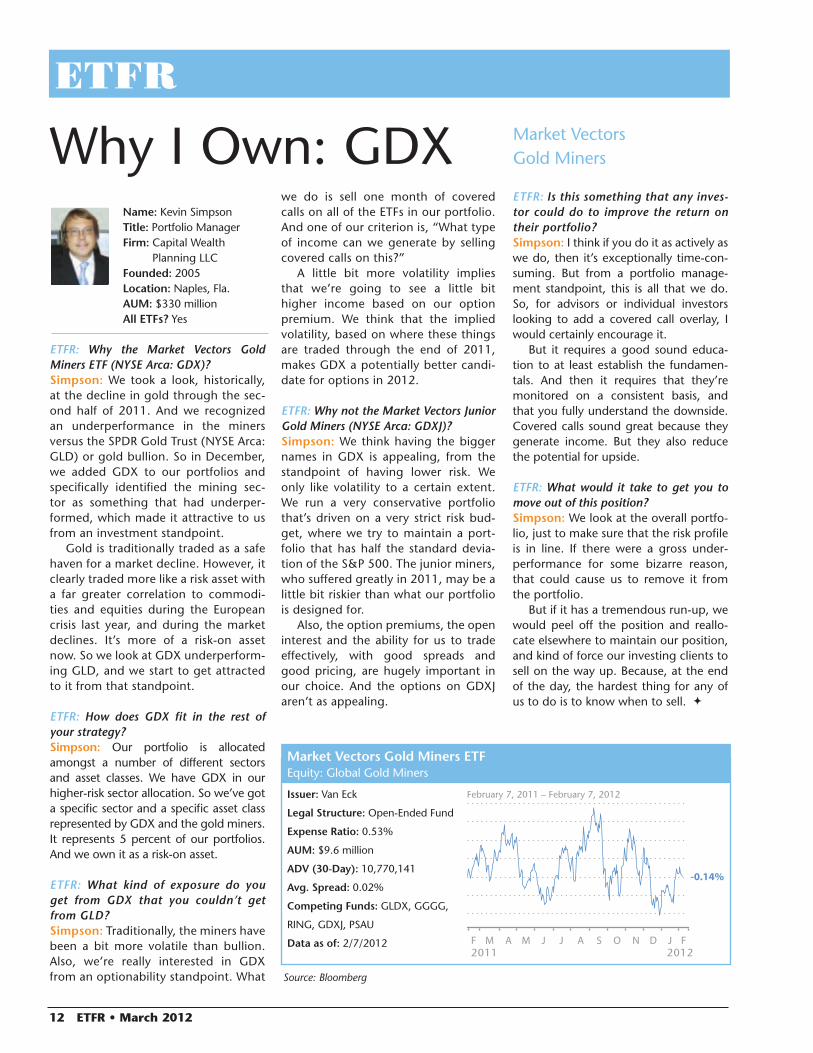
12 ETFR • March 2012
ETFR: Why the Market Vectors Gold Miners ETF (NYSE Arca: GDX)?Simpson: We took a look, historically, at the decline in gold through the sec-ond half of 2011. And we recognized an underperformance in the miners versus the SPDR Gold Trust (NYSE Arca: GLD) or gold bullion. So in December, we added GDX to our portfolios and specifically identified the mining sec-tor as something that had underper-formed, which made it attractive to us from an investment standpoint.
Gold is traditionally traded as a safe haven for a market decline. However, it clearly traded more like a risk asset with a far greater correlation to commodi-ties and equities during the European crisis last year, and during the market declines. It’s more of a risk-on asset now. So we look at GDX underperform-ing GLD, and we start to get attracted to it from that standpoint.
ETFR: How does GDX fit in the rest of your strategy?Simpson: Our portfolio is allocated amongst a number of different sectors and asset classes. We have GDX in our higher-risk sector allocation. So we’ve got a specific sector and a specific asset class represented by GDX and the gold miners. It represents 5 percent of our portfolios. And we own it as a risk-on asset.
ETFR: What kind of exposure do you get from GDX that you couldn’t get from GLD? Simpson: Traditionally, the miners have been a bit more volatile than bullion. Also, we’re really interested in GDX from an optionability standpoint. What
we do is sell one month of covered calls on all of the ETFs in our portfolio. And one of our criterion is, “What type of income can we generate by selling covered calls on this?”
A little bit more volatility implies that we’re going to see a little bit higher income based on our option premium. We think that the implied volatility, based on where these things are traded through the end of 2011, makes GDX a potentially better candi-date for options in 2012.
ETFR: Why not the Market Vectors Junior Gold Miners (NYSE Arca: GDXJ)?Simpson: We think having the bigger names in GDX is appealing, from the standpoint of having lower risk. We only like volatility to a certain extent. We run a very conservative portfolio that’s driven on a very strict risk bud-get, where we try to maintain a port-folio that has half the standard devia-tion of the S&P 500. The junior miners, who suffered greatly in 2011, may be a little bit riskier than what our portfolio is designed for.
Also, the option premiums, the open interest and the ability for us to trade effectively, with good spreads and good pricing, are hugely important in our choice. And the options on GDXJ aren’t as appealing.
ETFR: Is this something that any inves-tor could do to improve the return on their portfolio?Simpson: I think if you do it as actively as we do, then it’s exceptionally time-con-suming. But from a portfolio manage-ment standpoint, this is all that we do. So, for advisors or individual investors looking to add a covered call overlay, I would certainly encourage it.
But it requires a good sound educa-tion to at least establish the fundamen-tals. And then it requires that they’re monitored on a consistent basis, and that you fully understand the downside. Covered calls sound great because they generate income. But they also reduce the potential for upside.
ETFR: What would it take to get you to move out of this position? Simpson: We look at the overall portfo-lio, just to make sure that the risk profile is in line. If there were a gross under-performance for some bizarre reason, that could cause us to remove it from the portfolio.
But if it has a tremendous run-up, we would peel off the position and reallo-cate elsewhere to maintain our position, and kind of force our investing clients to sell on the way up. Because, at the end of the day, the hardest thing for any of us to do is to know when to sell.
Why I Own: GDX Name: Kevin Simpson Title: Portfolio Manager Firm: Capital Wealth
Planning LLC Founded: 2005
Location: Naples, Fla. AUM: $330 million All ETFs? Yes
February 7, 2011 – February 7, 2012
JJ20122011
A S O N DF FAM M J
-0.14%
Market Vectors Gold Miners ETFEquity: Global Gold Miners
Issuer: Van Eck
Legal Structure: Open-Ended Fund
Expense Ratio: 0.53%
AUM: $9.6 million
ADV (30-Day): 10,770,141
Avg. Spread: 0.02%
Competing Funds: GLDX, GGGG,
RING, GDXJ, PSAU
Data as of: 2/7/2012
Market VectorsGold Miners
Source: Bloomberg

ETFR • March 2012 13 ETFR • March 2012 13
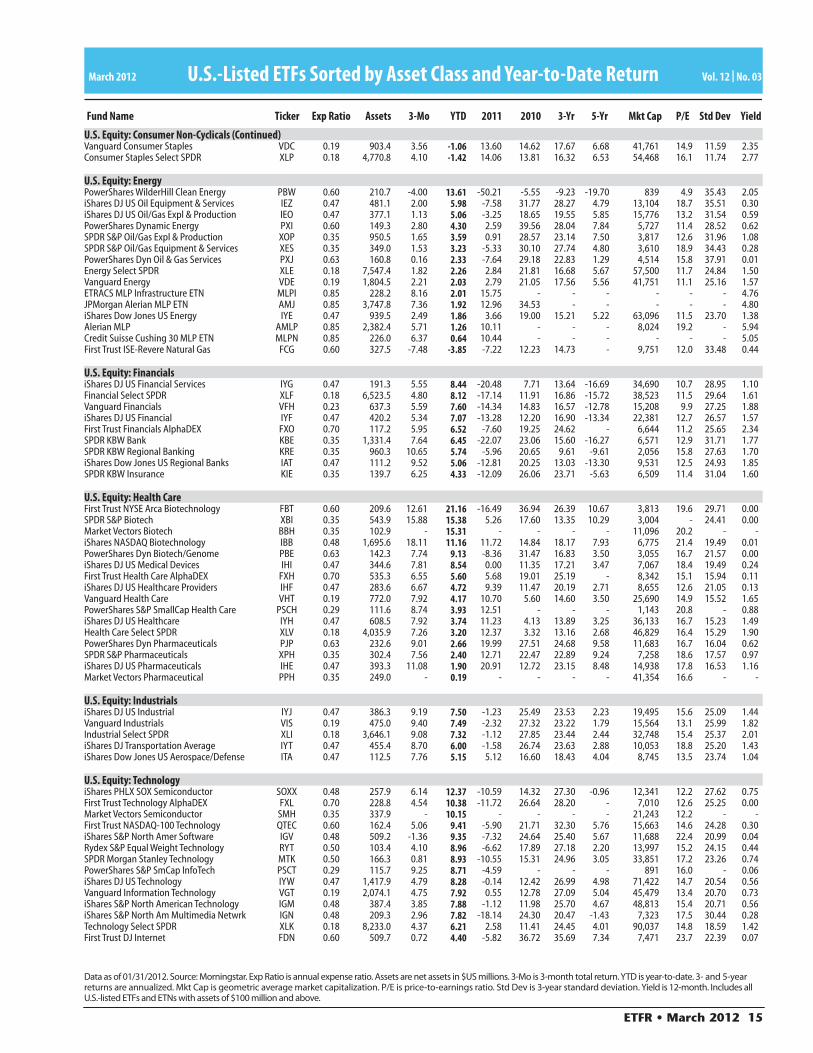
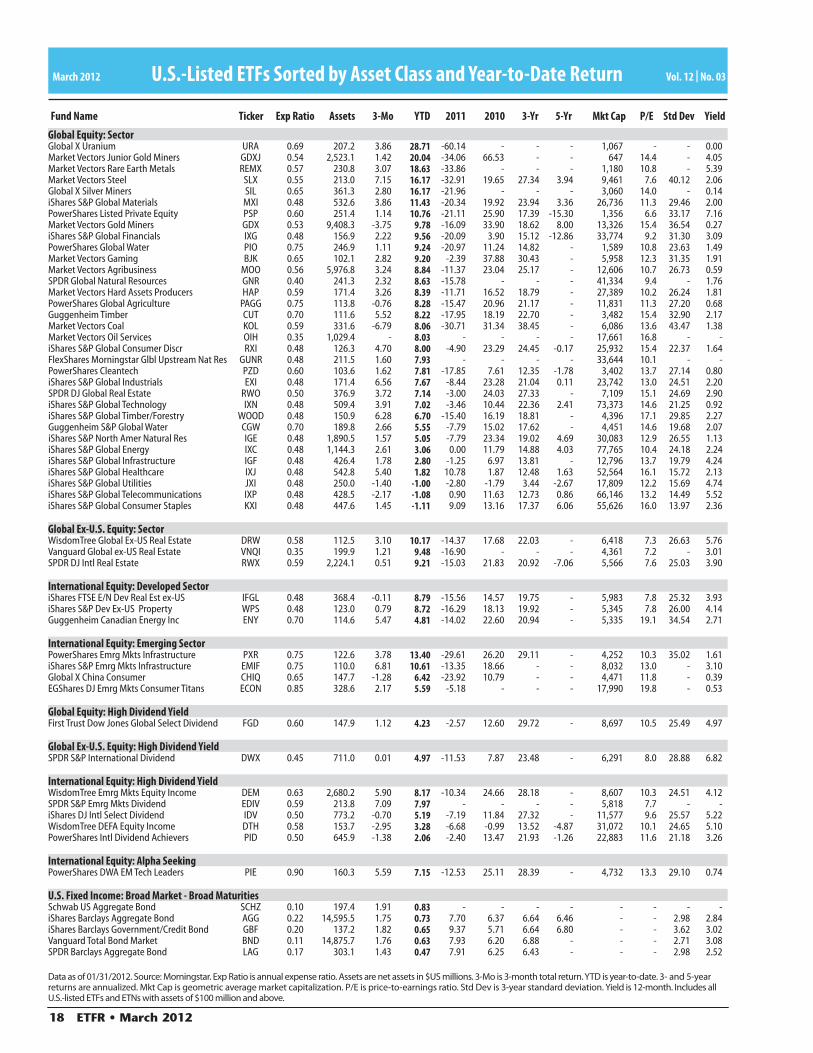
March 2012 Vol. 12 | No. 03U.S.-Listed ETFs Sorted by Asset Class and Year-to-Date Return
Data as of 01/31/2012. Source: Morningstar. Exp Ratio is annual expense ratio. Assets are net assets in $US millions. 3-Mo is 3-month total return. YTD is year-to-date. 3- and 5-year returns are annualized. Mkt Cap is geometric average market capitalization. P/E is price-to-earnings ratio. Std Dev is 3-year standard deviation. Yield is 12-month. Includes all U.S.-listed ETFs and ETNs with assets of $100 million and above.
Fund Name Ticker Exp Ratio Assets 3-Mo YTD 2011 2010 3-Yr 5-Yr Std DevP/EMkt Cap Yield
U.S. Equity: Total MarketPowerShares Dynamic Market PWC 0.60 136.0 3.94 5.28 -5.86 17.33 13.81 -2.24 8,993 10.3 18.69 0.99SPDR Dow Jones Total Market TMW 0.20 162.3 5.66 5.20 0.76 17.33 20.10 0.87 31,064 14.5 18.41 1.73Vanguard Total Stock Market VTI 0.07 20,632.0 5.70 5.07 0.93 17.45 20.40 0.92 25,304 12.6 18.87 1.83iShares Russell 3000 IWV 0.20 3,253.6 5.67 5.07 0.76 16.82 20.08 0.49 28,662 14.5 18.84 1.73iShares Dow Jones US IYY 0.20 584.5 5.52 4.96 1.11 16.50 20.14 0.65 33,422 14.4 18.46 1.75Schwab US Broad Market SCHB 0.06 923.9 5.44 4.86 1.37 17.10 - - 30,509 14.5 - 1.79iShares S&P 1500 ISI 0.20 334.6 5.39 4.62 1.73 16.24 19.80 0.52 35,248 14.5 18.52 1.77iShares MSCI USA EUSA 0.15 132.8 4.75 3.86 2.25 - - - 46,621 14.2 - 1.06WisdomTree Total Dividend DTD 0.28 219.2 6.54 2.90 8.39 16.32 21.24 0.11 38,546 14.0 17.28 2.74WisdomTree Dividend Ex-Financials DTN 0.38 1,149.6 6.00 1.90 11.92 21.44 26.44 1.54 21,727 14.1 18.48 3.11
U.S. Equity: Total Market GrowthFidelity NASDAQ Composite ONEQ 0.31 166.3 5.20 7.89 -0.82 17.79 24.81 3.53 17,083 15.7 20.59 0.79iShares Russell 3000 Growth IWZ 0.25 347.9 5.69 6.06 1.87 17.42 22.28 2.96 31,203 16.4 18.11 1.24
U.S. Equity: Total Market ValueiShares Russell 3000 Value IWW 0.25 306.9 5.44 3.92 -0.31 15.76 17.51 -2.22 26,306 12.8 19.90 2.14
U.S. Equity: Extended CapVanguard Extended Market VXF 0.16 1,279.7 6.94 7.58 -3.64 27.62 25.71 2.45 1,922 13.6 23.08 1.06PowerShares FTSE RAFI US 1500 SmMid PRFZ 0.39 402.6 7.03 7.50 -6.05 28.30 32.02 3.99 937 15.3 28.98 0.91
U.S. Equity: Large CapRydex S&P Equal Weight RSP 0.40 2,918.4 4.91 5.68 -0.68 21.39 26.21 1.71 13,230 14.9 22.42 1.47iShares Russell 1000 IWB 0.15 6,519.1 5.47 4.90 1.21 16.02 19.85 0.45 38,287 14.3 18.41 1.84Vanguard Large-Cap VV 0.12 3,154.6 5.39 4.87 1.40 15.93 19.51 0.73 37,282 12.6 18.40 1.85RevenueShares Large Cap RWL 0.49 172.1 4.82 4.85 0.22 16.81 20.34 - 37,922 11.9 20.12 1.76Schwab US Large-Cap SCHX 0.08 764.5 5.48 4.76 1.55 15.92 - - 42,334 14.3 - 1.80First Trust Large Core AlphaDEX FEX 0.70 295.4 3.61 4.71 -0.44 20.67 23.09 - 14,599 13.0 20.19 1.05iShares MSCI USA ESG Select Social KLD 0.50 172.8 4.04 4.62 1.68 13.89 19.69 0.88 30,218 14.9 18.12 1.38iShares S&P 500 IVV 0.09 28,156.5 5.38 4.61 1.86 15.11 19.19 0.31 50,802 14.2 18.09 1.98SPDR S&P 500 SPY 0.09 99,010.5 5.25 4.61 1.80 15.02 18.98 0.28 50,790 14.2 18.15 1.96iShares Morningstar Large Core JKD 0.20 261.5 6.76 4.59 3.33 12.68 17.88 1.49 64,789 14.5 17.65 2.03Vanguard S&P 500 VOO 0.06 2,650.5 5.34 4.47 1.86 - - - 44,988 12.5 - 1.98Vanguard Mega Cap 300 MGC 0.12 363.7 5.39 4.38 2.29 13.77 18.39 - 55,871 12.3 17.90 1.98iShares S&P 100 OEF 0.20 3,348.7 6.00 4.30 2.76 12.48 17.48 -0.04 108,223 13.3 17.44 1.99PowerShares FTSE RAFI US 1000 PRF 0.39 1,243.9 5.03 4.10 -0.49 19.69 25.09 1.01 32,300 12.8 22.88 1.98iShares Russell Top 200 IWL 0.15 142.7 5.03 4.08 2.99 11.26 - - 78,439 13.7 - 1.84PowerShares S&P 500 High Quality PIV 0.50 150.7 5.75 3.99 6.24 20.50 15.29 -2.01 22,544 14.9 15.85 1.69Rydex Russell Top 50 XLG 0.20 474.3 6.09 3.93 4.17 9.32 16.35 -0.44 147,050 13.4 16.52 1.97iShares MSCI KLD 400 Social DSI 0.50 165.5 4.12 3.84 1.44 11.42 18.84 0.14 35,903 15.6 17.78 1.41SPDR DJ Industrial Average Trust DIA 0.18 12,162.2 6.19 3.46 8.04 13.97 19.47 2.61 113,173 13.6 16.68 2.38Barclays ETN+ S&P Veqtor ETN VQT 0.95 253.6 0.68 2.70 16.23 - - - - - - 0.00WisdomTree LargeCap Dividend DLN 0.28 1,097.3 6.51 2.49 9.44 14.98 20.31 -0.12 61,482 13.7 16.47 2.68PowerShares S&P 500 Low Volatility SPLV 0.25 876.9 3.61 -0.55 - - - - 23,183 15.3 - -
U.S. Equity: Large Cap GrowthPowerShares QQQ QQQ 0.20 31,021.9 4.75 8.42 3.36 19.89 28.60 7.14 60,655 15.7 19.61 0.76Schwab US Large-Cap Growth SCHG 0.13 359.2 5.84 7.32 -0.74 16.85 - - 34,183 16.5 - 0.96Rydex S&P 500 Pure Growth RPG 0.35 292.7 3.23 6.65 0.43 26.90 29.33 5.19 17,993 18.4 21.25 0.42Vanguard Growth VUG 0.12 6,477.5 5.53 6.28 1.80 17.23 21.97 3.28 34,873 14.9 18.10 1.17iShares Morningstar Large Growth JKE 0.25 377.5 4.58 6.16 1.58 12.57 21.55 2.13 58,522 18.0 18.36 0.86iShares Russell 1000 Growth IWF 0.20 15,003.3 5.62 6.04 2.32 16.48 22.19 3.00 41,442 16.3 17.79 1.31Vanguard Mega Cap 300 Growth MGK 0.12 565.5 5.55 5.93 3.07 14.53 21.07 - 50,228 14.6 17.73 1.28iShares Russell Top 200 Growth IWY 0.20 305.1 5.71 5.35 4.61 11.98 - - 84,730 15.4 - 1.50iShares S&P 500 Growth IVW 0.18 6,613.8 4.30 4.11 4.40 14.94 19.86 2.80 60,510 16.0 17.04 1.55PowerShares Dyn Large Cap Growth PWB 0.60 170.4 4.22 4.09 0.06 13.74 18.05 0.25 41,167 19.4 18.17 0.85SPDR 500 Growth SPYG 0.20 215.8 4.11 3.87 4.61 16.25 22.18 3.17 60,579 16.0 17.74 1.58First Trust Large Growth AlphaDEX FTC 0.70 125.9 2.47 3.02 -2.86 23.62 18.77 - 18,895 18.5 18.38 0.68
U.S. Equity: Large Cap ValueFirst Trust Large Cap Value AlphaDEX FTA 0.70 202.2 4.21 5.52 1.40 18.69 25.72 - 11,691 10.4 23.67 1.36iShares S&P 500 Value IVE 0.18 4,356.1 6.48 4.91 -0.71 14.97 18.12 -2.46 41,286 12.4 20.00 2.19SPDR S&P 500 Value Index SPYV 0.20 168.1 5.07 4.84 -0.75 15.51 16.53 -2.11 41,356 12.4 18.70 2.13iShares Russell 1000 Value IWD 0.20 11,640.6 5.23 3.83 0.10 15.44 17.48 -2.27 35,330 12.7 19.56 2.21Vanguard Value VTV 0.12 5,313.7 5.50 3.47 1.06 14.57 17.34 -1.80 39,987 10.8 19.23 2.58Vanguard Mega Cap 300 Value MGV 0.12 365.8 4.71 3.12 1.31 13.16 15.87 - 62,500 10.5 19.04 2.67Schwab US Large-Cap Value SCHV 0.13 289.1 5.11 2.60 3.56 14.86 - - 51,821 12.8 - 2.55iShares Morningstar Large Value JKF 0.25 243.9 4.57 2.24 1.85 14.57 14.34 -3.50 81,436 11.1 17.69 2.84PowerShares Dyn Large Cap Value PWV 0.60 414.7 4.34 1.50 6.35 13.29 15.88 1.99 54,850 11.7 17.39 2.18

14 ETFR • March 201214 ETFR • March 2012
March 2012 Vol. 12 | No. 03U.S.-Listed ETFs Sorted by Asset Class and Year-to-Date Return
Data as of 01/31/2012. Source: Morningstar. Exp Ratio is annual expense ratio. Assets are net assets in $US millions. 3-Mo is 3-month total return. YTD is year-to-date. 3- and 5-year returns are annualized. Mkt Cap is geometric average market capitalization. P/E is price-to-earnings ratio. Std Dev is 3-year standard deviation. Yield is 12-month. Includes all U.S.-listed ETFs and ETNs with assets of $100 million and above.
Fund Name Ticker Exp Ratio Assets 3-Mo YTD 2011 2010 3-Yr 5-Yr Std DevP/EMkt Cap Yield
U.S. Equity: Mid CapRevenueShares Mid Cap RWK 0.54 134.9 6.14 7.65 -3.12 23.21 27.61 - 2,637 12.3 25.18 1.44WisdomTree MidCap Earnings EZM 0.38 132.9 7.85 7.32 0.94 25.60 28.91 - 2,708 12.3 24.40 0.92iShares Morningstar Mid Core JKG 0.25 150.5 7.67 7.06 1.61 26.49 27.00 2.79 5,888 16.6 21.52 1.25Vanguard Mid-Cap VO 0.12 3,484.9 5.63 6.67 -2.07 25.68 25.58 1.90 5,301 14.5 21.23 1.27Schwab US Mid-Cap SCHM 0.13 164.6 6.47 6.63 - - - - 3,859 16.1 - 1.12iShares S&P 400 MidCap IJH 0.21 10,045.6 5.79 6.61 -2.18 26.73 25.00 3.78 3,312 17.6 21.45 1.19SPDR S&P MidCap 400 MDY 0.25 10,329.1 5.66 6.57 -2.16 26.26 24.77 3.56 3,098 16.6 21.31 1.01First Trust Mid Cap Core AlphaDEX FNX 0.70 264.7 5.64 6.13 0.84 26.64 27.42 - 2,536 14.3 23.25 0.48iShares Russell Midcap IWR 0.21 6,398.4 5.31 6.00 -1.78 25.31 25.48 1.81 6,875 16.1 21.27 1.49WisdomTree MidCap Dividend DON 0.38 322.8 5.11 3.34 5.31 21.65 26.15 1.56 3,791 17.3 21.67 2.36
U.S. Equity: Mid Cap GrowthVanguard Mid-Cap Growth VOT 0.12 1,189.8 4.39 8.11 -3.92 29.14 26.17 2.78 5,779 16.6 21.26 0.50Rydex S&P MidCap 400 Pure Growth RFG 0.35 566.5 2.99 7.77 0.19 34.84 34.86 9.82 3,558 20.1 23.54 0.02iShares Morningstar Mid Growth JKH 0.30 170.8 3.13 7.69 -2.89 27.84 25.68 3.14 6,370 22.2 19.78 0.22iShares Russell Mid Cap Growth IWP 0.25 3,067.9 5.00 7.19 -1.88 26.03 26.64 2.94 7,204 19.1 20.88 0.87iShares S&P Mid Cap 400 Growth IJK 0.26 2,807.6 3.84 6.86 -1.34 30.44 27.22 5.70 3,896 20.8 20.92 0.62
U.S. Equity: Mid Cap ValueiShares S&P MidCap 400 Value IJJ 0.27 2,113.8 7.79 6.33 -2.68 22.58 22.74 1.80 2,784 14.9 22.46 1.67Vanguard Mid-Cap Value VOE 0.12 874.4 6.56 5.23 -0.39 21.77 24.77 0.63 4,858 12.8 21.92 2.09iShares Russell Midcap Value IWS 0.26 2,899.0 5.57 4.93 -1.57 24.43 24.40 0.28 6,565 13.9 22.13 2.02
U.S. Equity: Small CapWisdomTree SmallCap Earnings EES 0.38 130.9 9.57 8.52 -1.89 26.97 32.39 - 646 10.6 27.50 1.19RevenueShares Small Cap RWJ 0.54 112.9 9.66 8.26 -0.92 25.96 32.09 - 815 14.1 29.00 0.34First Trust Small Cap Core AlphaDEX FYX 0.70 139.7 8.74 7.52 -0.37 27.35 29.23 - 745 14.9 25.85 0.19iShares Russell 2000 IWM 0.26 15,413.9 7.29 7.15 -4.44 26.90 22.73 1.21 1,026 16.9 24.30 1.30Schwab US Small-Cap SCHA 0.13 574.6 6.15 7.06 -3.08 28.62 - - 1,438 16.6 - 1.15Vanguard Small-Cap VB 0.17 3,993.2 6.74 6.95 -2.77 28.12 26.36 2.78 1,253 13.1 24.67 1.27iShares Morningstar Small Core JKJ 0.25 143.2 6.52 6.84 -5.03 27.68 25.86 1.29 1,660 14.1 25.61 0.95iShares S&P SmallCap 600 IJR 0.20 7,344.1 8.60 6.59 0.79 26.61 24.75 2.73 1,056 18.1 23.52 0.96WisdomTree SmallCap Dividend DES 0.38 286.5 8.18 6.37 -2.01 27.05 24.69 -0.08 831 15.5 25.88 3.18
U.S. Equity: Small Cap GrowthiShares Russell 2000 Growth IWO 0.25 3,767.0 6.59 7.53 -3.00 29.38 25.07 3.18 1,191 19.6 24.06 0.63Vanguard Small-Cap Growth VBK 0.12 2,055.1 5.88 7.22 -1.62 30.95 28.43 4.62 1,301 15.4 24.73 0.51iShares S&P SmallCap 600 Growth IJT 0.25 1,597.6 6.42 5.30 3.26 28.24 26.08 4.38 1,223 19.2 22.28 0.61SPDR S&P SmallCap 600 Growth SLYG 0.25 153.5 5.55 4.77 3.73 30.21 30.72 5.08 1,224 19.2 24.29 0.66
U.S. Equity: Small Cap ValueSPDR S&P SmallCap 600 Value Index SLYV 0.25 123.0 10.67 8.02 -1.74 24.61 25.95 2.36 912 17.0 25.17 1.10iShares S&P SmallCap 600 Value IJS 0.25 1,889.3 10.77 7.90 -1.65 24.70 23.45 1.11 911 17.0 24.90 1.23Vanguard Small-Cap Value VBR 0.23 1,896.1 7.72 6.97 -4.20 25.12 24.22 0.71 1,210 11.5 25.14 2.06iShares Russell 2000 Value IWN 0.40 4,369.8 8.00 6.72 -5.84 24.68 20.57 -0.97 884 14.8 24.73 1.90iShares Morningstar Small Value JKL 0.30 163.0 7.65 5.89 -2.13 25.80 28.32 2.32 1,638 13.9 26.45 2.35
U.S. Equity: Micro CapiShares Russell Microcap IWC 0.67 416.9 8.96 8.67 -9.84 29.55 20.96 -3.01 276 14.4 25.91 1.12
U.S. Equity: Basic MaterialsFirst Trust Materials AlphaDEX FXZ 0.70 143.6 12.44 12.81 -10.38 28.28 33.38 - 4,735 13.8 29.74 0.32Vanguard Materials VAW 0.19 625.7 10.00 11.92 -9.53 24.46 27.38 4.15 9,339 10.5 27.98 1.93iShares DJ US Basic Materials IYM 0.47 635.4 6.89 11.04 -15.22 31.02 30.19 4.69 14,331 12.3 30.46 2.00Materials Select SPDR XLB 0.18 1,941.9 8.66 10.99 -10.92 20.56 23.99 2.93 20,065 13.7 27.65 1.98SPDR S&P Metals and Mining XME 0.35 935.8 -1.01 10.68 -28.16 34.14 28.37 1.46 2,826 14.1 37.06 0.85
U.S. Equity: Consumer CyclicalsiShares DJ US Home Construction ITB 0.47 483.0 22.16 9.93 -9.11 10.43 15.63 -20.12 2,990 28.8 37.58 0.72SPDR S&P Homebuilders XHB 0.35 1,127.9 15.98 9.18 -0.76 17.40 23.76 -12.03 3,189 21.7 34.92 0.82Vanguard Consumer Discr VCR 0.19 381.8 5.93 6.47 3.64 30.57 32.81 2.33 14,683 13.9 23.06 1.30Consumer Discr Select SPDR XLY 0.18 2,733.2 6.49 5.89 5.96 27.49 31.01 2.51 28,294 17.1 21.94 1.47PowerShares Dynamic Media PBS 0.63 119.3 5.31 5.50 -4.30 20.18 26.43 -2.69 5,516 15.7 26.09 0.53First Trust Consumer Discr AlphaDEX FXD 0.70 542.0 1.25 4.99 0.93 32.01 34.64 - 7,147 11.4 27.11 0.61SPDR S&P Retail XRT 0.35 713.3 5.34 4.95 9.72 37.38 42.71 6.91 3,124 16.3 24.24 0.90iShares DJ US Consumer Services IYC 0.47 280.6 6.46 4.82 6.73 23.26 26.19 2.50 24,376 16.9 18.47 1.05
U.S. Equity: Consumer Non-CyclicalsiShares DJ US Consumer Goods IYK 0.47 373.3 3.04 0.93 8.38 18.99 20.18 4.87 36,007 15.5 14.29 2.09PowerShares Dyn Food & Beverage PBJ 0.63 132.6 1.53 0.31 6.16 29.97 17.80 4.68 6,479 15.1 12.84 0.96First Trust Consumer Staples AlphaDEX FXG 0.70 217.7 0.35 -0.42 12.92 19.75 20.17 - 11,369 14.1 14.60 0.76
ETFR • March 2012 15 ETFR • March 2012 15
March 2012 Vol. 12 | No. 03U.S.-Listed ETFs Sorted by Asset Class and Year-to-Date Return
Data as of 01/31/2012. Source: Morningstar. Exp Ratio is annual expense ratio. Assets are net assets in $US millions. 3-Mo is 3-month total return. YTD is year-to-date. 3- and 5-year returns are annualized. Mkt Cap is geometric average market capitalization. P/E is price-to-earnings ratio. Std Dev is 3-year standard deviation. Yield is 12-month. Includes all U.S.-listed ETFs and ETNs with assets of $100 million and above.
Fund Name Ticker Exp Ratio Assets 3-Mo YTD 2011 2010 3-Yr 5-Yr Std DevP/EMkt Cap Yield
U.S. Equity: Consumer Non-Cyclicals (Continued)Vanguard Consumer Staples VDC 0.19 903.4 3.56 -1.06 13.60 14.62 17.67 6.68 41,761 14.9 11.59 2.35Consumer Staples Select SPDR XLP 0.18 4,770.8 4.10 -1.42 14.06 13.81 16.32 6.53 54,468 16.1 11.74 2.77
U.S. Equity: EnergyPowerShares WilderHill Clean Energy PBW 0.60 210.7 -4.00 13.61 -50.21 -5.55 -9.23 -19.70 839 4.9 35.43 2.05iShares DJ US Oil Equipment & Services IEZ 0.47 481.1 2.00 5.98 -7.58 31.77 28.27 4.79 13,104 18.7 35.51 0.30iShares DJ US Oil/Gas Expl & Production IEO 0.47 377.1 1.13 5.06 -3.25 18.65 19.55 5.85 15,776 13.2 31.54 0.59PowerShares Dynamic Energy PXI 0.60 149.3 2.80 4.30 2.59 39.56 28.04 7.84 5,727 11.4 28.52 0.62SPDR S&P Oil/Gas Expl & Production XOP 0.35 950.5 1.65 3.59 0.91 28.57 23.14 7.50 3,817 12.6 31.96 1.08SPDR S&P Oil/Gas Equipment & Services XES 0.35 349.0 1.53 3.23 -5.33 30.10 27.74 4.80 3,610 18.9 34.43 0.28PowerShares Dyn Oil & Gas Services PXJ 0.63 160.8 0.16 2.33 -7.64 29.18 22.83 1.29 4,514 15.8 37.91 0.01Energy Select SPDR XLE 0.18 7,547.4 1.82 2.26 2.84 21.81 16.68 5.67 57,500 11.7 24.84 1.50Vanguard Energy VDE 0.19 1,804.5 2.21 2.03 2.79 21.05 17.56 5.56 41,751 11.1 25.16 1.57ETRACS MLP Infrastructure ETN MLPI 0.85 228.2 8.16 2.01 15.75 - - - - - - 4.76JPMorgan Alerian MLP ETN AMJ 0.85 3,747.8 7.36 1.92 12.96 34.53 - - - - - 4.80iShares Dow Jones US Energy IYE 0.47 939.5 2.49 1.86 3.66 19.00 15.21 5.22 63,096 11.5 23.70 1.38Alerian MLP AMLP 0.85 2,382.4 5.71 1.26 10.11 - - - 8,024 19.2 - 5.94Credit Suisse Cushing 30 MLP ETN MLPN 0.85 226.0 6.37 0.64 10.44 - - - - - - 5.05First Trust ISE-Revere Natural Gas FCG 0.60 327.5 -7.48 -3.85 -7.22 12.23 14.73 - 9,751 12.0 33.48 0.44
U.S. Equity: FinancialsiShares DJ US Financial Services IYG 0.47 191.3 5.55 8.44 -20.48 7.71 13.64 -16.69 34,690 10.7 28.95 1.10Financial Select SPDR XLF 0.18 6,523.5 4.80 8.12 -17.14 11.91 16.86 -15.72 38,523 11.5 29.64 1.61Vanguard Financials VFH 0.23 637.3 5.59 7.60 -14.34 14.83 16.57 -12.78 15,208 9.9 27.25 1.88iShares DJ US Financial IYF 0.47 420.2 5.34 7.07 -13.28 12.20 16.90 -13.34 22,381 12.7 26.57 1.57First Trust Financials AlphaDEX FXO 0.70 117.2 5.95 6.52 -7.60 19.25 24.62 - 6,644 11.2 25.65 2.34SPDR KBW Bank KBE 0.35 1,331.4 7.64 6.45 -22.07 23.06 15.60 -16.27 6,571 12.9 31.71 1.77SPDR KBW Regional Banking KRE 0.35 960.3 10.65 5.74 -5.96 20.65 9.61 -9.61 2,056 15.8 27.63 1.70iShares Dow Jones US Regional Banks IAT 0.47 111.2 9.52 5.06 -12.81 20.25 13.03 -13.30 9,531 12.5 24.93 1.85SPDR KBW Insurance KIE 0.35 139.7 6.25 4.33 -12.09 26.06 23.71 -5.63 6,509 11.4 31.04 1.60
U.S. Equity: Health CareFirst Trust NYSE Arca Biotechnology FBT 0.60 209.6 12.61 21.16 -16.49 36.94 26.39 10.67 3,813 19.6 29.71 0.00SPDR S&P Biotech XBI 0.35 543.9 15.88 15.38 5.26 17.60 13.35 10.29 3,004 - 24.41 0.00Market Vectors Biotech BBH 0.35 102.9 - 15.31 - - - - 11,096 20.2 - -iShares NASDAQ Biotechnology IBB 0.48 1,695.6 18.11 11.16 11.72 14.84 18.17 7.93 6,775 21.4 19.49 0.01PowerShares Dyn Biotech/Genome PBE 0.63 142.3 7.74 9.13 -8.36 31.47 16.83 3.50 3,055 16.7 21.57 0.00iShares DJ US Medical Devices IHI 0.47 344.6 7.81 8.54 0.00 11.35 17.21 3.47 7,067 18.4 19.49 0.24First Trust Health Care AlphaDEX FXH 0.70 535.3 6.55 5.60 5.68 19.01 25.19 - 8,342 15.1 15.94 0.11iShares DJ US Healthcare Providers IHF 0.47 283.6 6.67 4.72 9.39 11.47 20.19 2.71 8,655 12.6 21.05 0.13Vanguard Health Care VHT 0.19 772.0 7.92 4.17 10.70 5.60 14.60 3.50 25,690 14.9 15.52 1.65PowerShares S&P SmallCap Health Care PSCH 0.29 111.6 8.74 3.93 12.51 - - - 1,143 20.8 - 0.88iShares DJ US Healthcare IYH 0.47 608.5 7.92 3.74 11.23 4.13 13.89 3.25 36,133 16.7 15.23 1.49Health Care Select SPDR XLV 0.18 4,035.9 7.26 3.20 12.37 3.32 13.16 2.68 46,829 16.4 15.29 1.90PowerShares Dyn Pharmaceuticals PJP 0.63 232.6 9.01 2.66 19.99 27.51 24.68 9.58 11,683 16.7 16.04 0.62SPDR S&P Pharmaceuticals XPH 0.35 302.4 7.56 2.40 12.71 22.47 22.89 9.24 7,258 18.6 17.57 0.97iShares DJ US Pharmaceuticals IHE 0.47 393.3 11.08 1.90 20.91 12.72 23.15 8.48 14,938 17.8 16.53 1.16Market Vectors Pharmaceutical PPH 0.35 249.0 - 0.19 - - - - 41,354 16.6 - -
U.S. Equity: IndustrialsiShares DJ US Industrial IYJ 0.47 386.3 9.19 7.50 -1.23 25.49 23.53 2.23 19,495 15.6 25.09 1.44Vanguard Industrials VIS 0.19 475.0 9.40 7.49 -2.32 27.32 23.22 1.79 15,564 13.1 25.99 1.82Industrial Select SPDR XLI 0.18 3,646.1 9.08 7.32 -1.12 27.85 23.44 2.44 32,748 15.4 25.37 2.01iShares DJ Transportation Average IYT 0.47 455.4 8.70 6.00 -1.58 26.74 23.63 2.88 10,053 18.8 25.20 1.43iShares Dow Jones US Aerospace/Defense ITA 0.47 112.5 7.76 5.15 5.12 16.60 18.43 4.04 8,745 13.5 23.74 1.04
U.S. Equity: TechnologyiShares PHLX SOX Semiconductor SOXX 0.48 257.9 6.14 12.37 -10.59 14.32 27.30 -0.96 12,341 12.2 27.62 0.75First Trust Technology AlphaDEX FXL 0.70 228.8 4.54 10.38 -11.72 26.64 28.20 - 7,010 12.6 25.25 0.00Market Vectors Semiconductor SMH 0.35 337.9 - 10.15 - - - - 21,243 12.2 - -First Trust NASDAQ-100 Technology QTEC 0.60 162.4 5.06 9.41 -5.90 21.71 32.30 5.76 15,663 14.6 24.28 0.30iShares S&P North Amer Software IGV 0.48 509.2 -1.36 9.35 -7.32 24.64 25.40 5.67 11,688 22.4 20.99 0.04Rydex S&P Equal Weight Technology RYT 0.50 103.4 4.10 8.96 -6.62 17.89 27.18 2.20 13,997 15.2 24.15 0.44SPDR Morgan Stanley Technology MTK 0.50 166.3 0.81 8.93 -10.55 15.31 24.96 3.05 33,851 17.2 23.26 0.74PowerShares S&P SmCap InfoTech PSCT 0.29 115.7 9.25 8.71 -4.59 - - - 891 16.0 - 0.06iShares DJ US Technology IYW 0.47 1,417.9 4.79 8.28 -0.14 12.42 26.99 4.98 71,422 14.7 20.54 0.56Vanguard Information Technology VGT 0.19 2,074.1 4.75 7.92 0.55 12.78 27.09 5.04 45,479 13.4 20.70 0.73iShares S&P North American Technology IGM 0.48 387.4 3.85 7.88 -1.12 11.98 25.70 4.67 48,813 15.4 20.71 0.56iShares S&P North Am Multimedia Netwrk IGN 0.48 209.3 2.96 7.82 -18.14 24.30 20.47 -1.43 7,323 17.5 30.44 0.28Technology Select SPDR XLK 0.18 8,233.0 4.37 6.21 2.58 11.41 24.45 4.01 90,037 14.8 18.59 1.42First Trust DJ Internet FDN 0.60 509.7 0.72 4.40 -5.82 36.72 35.69 7.34 7,471 23.7 22.39 0.07

16 ETFR • March 201216 ETFR • March 2012
March 2012 Vol. 12 | No. 03U.S.-Listed ETFs Sorted by Asset Class and Year-to-Date Return
Data as of 01/31/2012. Source: Morningstar. Exp Ratio is annual expense ratio. Assets are net assets in $US millions. 3-Mo is 3-month total return. YTD is year-to-date. 3- and 5-year returns are annualized. Mkt Cap is geometric average market capitalization. P/E is price-to-earnings ratio. Std Dev is 3-year standard deviation. Yield is 12-month. Includes all U.S.-listed ETFs and ETNs with assets of $100 million and above.
Fund Name Ticker Exp Ratio Assets 3-Mo YTD 2011 2010 3-Yr 5-Yr Std DevP/EMkt Cap Yield
U.S. Equity: TelecommunicationsiShares DJ Telecommunications IYZ 0.47 520.0 1.39 1.14 -7.48 20.72 15.17 -3.55 11,816 15.3 17.71 3.05Vanguard Telecommunication Svcs VOX 0.19 399.7 0.49 -1.05 -2.16 19.52 16.84 -1.40 17,284 13.4 16.45 3.27
U.S. Equity: UtilitiesFirst Trust Utilities AlphaDEX FXU 0.70 370.8 0.06 -3.07 10.45 10.47 14.60 - 7,922 15.5 14.48 1.89iShares DJ US Utilities IDU 0.47 721.2 0.85 -3.33 18.60 7.21 11.78 2.43 11,991 14.5 12.92 3.40Vanguard Utilities VPU 0.19 1,027.0 0.66 -3.60 18.89 7.05 11.43 2.87 10,760 14.3 12.96 3.59Utilities Select SPDR XLU 0.18 6,765.1 0.59 -3.61 19.53 5.35 11.00 2.73 15,726 14.0 12.48 3.95
U.S. Equity: Real EstateiShares DJ US Real Estate IYR 0.47 3,464.9 6.89 6.60 5.46 26.60 30.16 -3.52 8,924 28.9 28.52 3.59First Trust S&P REIT FRI 0.50 398.5 7.12 6.39 8.04 27.73 31.02 - 6,508 37.6 31.15 2.07Schwab U. S. REIT SCHH 0.13 246.2 6.95 6.39 - - - - 8,489 40.3 - 2.12Vanguard REIT VNQ 0.12 10,410.4 7.30 6.38 8.56 28.43 32.75 -1.38 6,225 32.4 29.57 3.32SPDR Dow Jones REIT RWR 0.25 1,671.5 6.85 6.35 8.99 28.03 32.31 -2.52 8,485 40.3 30.54 2.96iShares Cohen & Steers Realty Majors ICF 0.35 2,632.8 6.47 6.01 10.15 29.14 32.25 -3.67 11,777 39.4 31.59 2.80iShares FTSE NAREIT Residential Plus REZ 0.48 177.3 6.49 4.23 16.01 30.81 30.63 - 7,276 42.1 25.89 3.00
U.S. Equity: ThemePowerShares Water Resources PHO 0.60 850.7 6.84 8.37 -10.75 13.27 13.75 -0.05 1,800 16.3 24.14 0.59iShares FTSE NAREIT Mortgage Plus REM 0.48 248.6 6.63 7.42 -9.14 16.49 10.55 - 2,598 6.4 15.71 11.36
U.S. Equity: Alpha-SeekingPowerShares DWA Technical Leaders PDP 0.60 493.9 3.95 5.04 1.53 26.59 23.32 - 8,688 18.2 19.44 0.16
U.S. Equity: High Dividend YieldGuggenheim Multi-Asset Income CVY 0.78 584.2 5.41 4.16 7.55 17.83 29.27 1.36 10,556 13.4 21.57 5.20Vanguard Dividend Appreciation VIG 0.18 9,676.5 5.56 2.60 6.12 14.76 17.45 2.64 39,694 12.9 15.62 2.09SPDR S&P Dividend SDY 0.35 8,792.6 4.20 1.78 7.11 16.42 20.38 1.56 13,829 16.2 18.53 3.17Vanguard High Dividend Yield VYM 0.18 2,759.6 6.33 1.77 10.48 14.25 20.04 0.67 50,300 12.5 17.71 2.88Schwab US Dividend Equity SCHD 0.17 232.7 4.84 1.64 - - - - 64,624 13.8 - -First Trust Value Line Dividend FVD 0.70 393.4 3.87 1.50 8.96 16.08 19.04 2.22 16,138 14.7 16.02 2.57PowerShares Dividend Achievers PFM 0.50 297.2 4.56 1.14 9.07 14.81 17.15 -0.37 56,687 14.3 14.84 2.15WisdomTree Equity Income DHS 0.38 394.5 5.18 0.07 14.22 17.63 24.76 -1.97 36,492 15.4 18.91 3.30iShares DJ Select Dividend DVY 0.40 9,775.9 4.05 0.02 11.73 17.79 20.16 -1.69 10,631 14.3 17.27 3.44PowerShares HiYld Equity Div Achievers PEY 0.50 366.6 4.54 -0.12 8.54 20.92 20.72 -6.32 4,716 17.0 21.08 3.72iShares High Dividend Equity HDV 0.40 1,087.8 4.42 -1.71 - - - - 67,583 15.2 - -First Trust Mstar Dividend Leaders FDL 0.45 465.2 2.97 -2.10 14.36 16.20 23.37 -2.17 42,862 15.1 17.98 3.55
Global EquityiShares MSCI ACWI ACWI 0.34 2,414.3 3.23 5.48 -7.85 12.82 17.86 - 33,790 12.0 21.53 2.27Vanguard Total World Stock VT 0.25 1,117.2 3.10 5.47 -7.50 13.07 17.97 - 29,467 11.2 21.47 2.23iShares S&P Global 100 IOO 0.40 1,014.3 3.17 4.50 -4.18 5.91 14.69 -1.55 105,727 11.2 20.89 2.97
Global Equity Ex-U.S.Vanguard FTSE All-World ex-US SmCap VSS 0.33 889.0 1.81 9.01 -19.60 25.59 - - 1,085 10.6 - 2.92Vanguard Total International Stock VXUS 0.20 574.2 1.98 7.33 - - - - 16,142 10.6 - 2.96Vanguard FTSE All-World ex-US VEU 0.22 6,295.9 1.61 6.86 -14.00 11.80 17.57 - 22,368 10.3 24.29 3.23SPDR S&P World ex-US GWL 0.34 139.3 1.13 6.75 -13.53 11.26 15.04 - 20,138 10.5 23.24 3.06iShares MSCI ACWI ex US ACWX 0.34 851.7 1.71 6.25 -14.03 10.44 16.66 - 24,551 10.7 24.06 2.90SPDR MSCI ACWI ex-US CWI 0.34 453.5 1.28 6.08 -13.80 11.60 17.34 -1.71 27,712 10.4 23.99 2.80
International Equity: Blended DevelopmentiShares MSCI All Country Asia ex-Japan AAXJ 0.67 2,262.9 3.64 10.38 -20.18 16.22 23.37 - 16,628 9.6 28.23 1.90iShares S&P Asia 50 AIA 0.50 194.9 6.26 10.09 -14.25 19.56 25.23 - 59,449 10.1 26.38 2.69
International Equity: DevelopediShares MSCI Singapore EWS 0.52 1,459.5 3.63 14.31 -18.68 24.51 28.53 5.02 13,635 9.8 30.20 3.76iShares MSCI Germany EWG 0.51 2,582.4 0.61 10.98 -17.62 8.31 13.89 -2.53 33,196 10.5 31.08 3.17iShares MSCI Pacific ex-Japan EPP 0.50 3,332.7 2.98 10.15 -13.67 17.77 29.09 4.00 24,048 10.9 27.47 4.00iShares MSCI South Korea EWY 0.59 3,331.2 4.28 9.76 -13.53 29.58 30.58 5.07 18,516 10.3 37.84 1.22iShares MSCI Hong Kong EWH 0.52 2,150.0 5.56 9.24 -16.22 24.16 22.14 3.54 18,334 8.0 25.57 2.43iShares MSCI Australia EWA 0.52 2,864.2 1.67 9.24 -11.61 15.35 31.16 4.03 27,405 11.5 29.44 4.65iShares MSCI EAFE Small Cap SCZ 0.40 1,345.6 2.48 8.83 -15.13 21.51 21.91 - 1,198 11.3 24.06 3.03Schwab International Small-Cap Eq SCHC 0.35 148.3 1.16 8.43 -16.98 - - - 1,536 12.3 - 3.28SPDR S&P International Small Cap GWX 0.59 712.6 2.43 8.03 -15.76 24.96 20.79 - 885 11.6 23.74 2.24iShares MSCI Italy EWI 0.51 122.8 -2.75 8.01 -24.05 -14.20 1.09 -14.09 19,161 8.2 34.42 4.36WisdomTree Intl SmallCap Dividend DLS 0.58 389.5 3.19 8.00 -12.31 19.41 20.26 -2.51 947 10.8 22.06 3.83
ETFR • March 2012 17 ETFR • March 2012 17
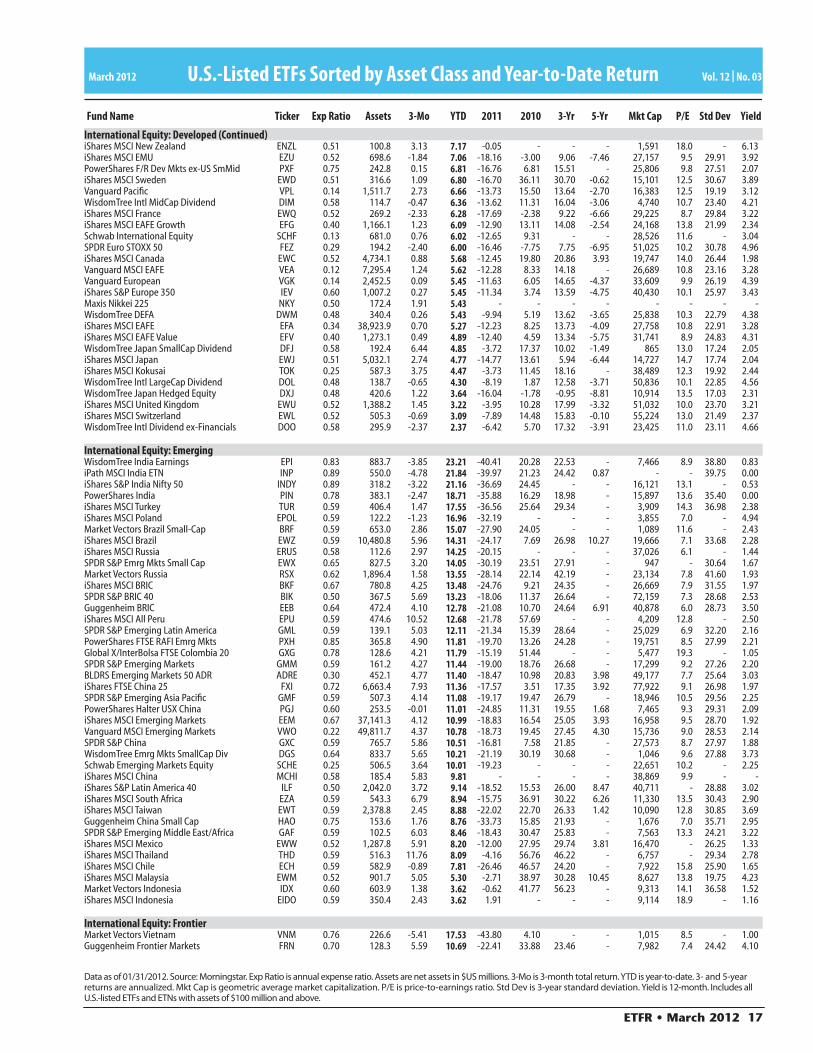
March 2012 Vol. 12 | No. 03U.S.-Listed ETFs Sorted by Asset Class and Year-to-Date Return
Data as of 01/31/2012. Source: Morningstar. Exp Ratio is annual expense ratio. Assets are net assets in $US millions. 3-Mo is 3-month total return. YTD is year-to-date. 3- and 5-year returns are annualized. Mkt Cap is geometric average market capitalization. P/E is price-to-earnings ratio. Std Dev is 3-year standard deviation. Yield is 12-month. Includes all U.S.-listed ETFs and ETNs with assets of $100 million and above.
Fund Name Ticker Exp Ratio Assets 3-Mo YTD 2011 2010 3-Yr 5-Yr Std DevP/EMkt Cap Yield
International Equity: Developed (Continued)iShares MSCI New Zealand ENZL 0.51 100.8 3.13 7.17 -0.05 - - - 1,591 18.0 - 6.13iShares MSCI EMU EZU 0.52 698.6 -1.84 7.06 -18.16 -3.00 9.06 -7.46 27,157 9.5 29.91 3.92PowerShares F/R Dev Mkts ex-US SmMid PXF 0.75 242.8 0.15 6.81 -16.76 6.81 15.51 - 25,806 9.8 27.51 2.07iShares MSCI Sweden EWD 0.51 316.6 1.09 6.80 -16.70 36.11 30.70 -0.62 15,101 12.5 30.67 3.89Vanguard Pacific VPL 0.14 1,511.7 2.73 6.66 -13.73 15.50 13.64 -2.70 16,383 12.5 19.19 3.12WisdomTree Intl MidCap Dividend DIM 0.58 114.7 -0.47 6.36 -13.62 11.31 16.04 -3.06 4,740 10.7 23.40 4.21iShares MSCI France EWQ 0.52 269.2 -2.33 6.28 -17.69 -2.38 9.22 -6.66 29,225 8.7 29.84 3.22iShares MSCI EAFE Growth EFG 0.40 1,166.1 1.23 6.09 -12.90 13.11 14.08 -2.54 24,168 13.8 21.99 2.34Schwab International Equity SCHF 0.13 681.0 0.76 6.02 -12.65 9.31 - - 28,526 11.6 - 3.04SPDR Euro STOXX 50 FEZ 0.29 194.2 -2.40 6.00 -16.46 -7.75 7.75 -6.95 51,025 10.2 30.78 4.96iShares MSCI Canada EWC 0.52 4,734.1 0.88 5.68 -12.45 19.80 20.86 3.93 19,747 14.0 26.44 1.98Vanguard MSCI EAFE VEA 0.12 7,295.4 1.24 5.62 -12.28 8.33 14.18 - 26,689 10.8 23.16 3.28Vanguard European VGK 0.14 2,452.5 0.09 5.45 -11.63 6.05 14.65 -4.37 33,609 9.9 26.19 4.39iShares S&P Europe 350 IEV 0.60 1,007.2 0.27 5.45 -11.34 3.74 13.59 -4.75 40,430 10.1 25.97 3.43Maxis Nikkei 225 NKY 0.50 172.4 1.91 5.43 - - - - - - - -WisdomTree DEFA DWM 0.48 340.4 0.26 5.43 -9.94 5.19 13.62 -3.65 25,838 10.3 22.79 4.38iShares MSCI EAFE EFA 0.34 38,923.9 0.70 5.27 -12.23 8.25 13.73 -4.09 27,758 10.8 22.91 3.28iShares MSCI EAFE Value EFV 0.40 1,273.1 0.49 4.89 -12.40 4.59 13.34 -5.75 31,741 8.9 24.83 4.31WisdomTree Japan SmallCap Dividend DFJ 0.58 192.4 6.44 4.85 -3.72 17.37 10.02 -1.49 865 13.0 17.24 2.05iShares MSCI Japan EWJ 0.51 5,032.1 2.74 4.77 -14.77 13.61 5.94 -6.44 14,727 14.7 17.74 2.04iShares MSCI Kokusai TOK 0.25 587.3 3.75 4.47 -3.73 11.45 18.16 - 38,489 12.3 19.92 2.44WisdomTree Intl LargeCap Dividend DOL 0.48 138.7 -0.65 4.30 -8.19 1.87 12.58 -3.71 50,836 10.1 22.85 4.56WisdomTree Japan Hedged Equity DXJ 0.48 420.6 1.22 3.64 -16.04 -1.78 -0.95 -8.81 10,914 13.5 17.03 2.31iShares MSCI United Kingdom EWU 0.52 1,388.2 1.45 3.22 -3.95 10.28 17.99 -3.32 51,032 10.0 23.70 3.21iShares MSCI Switzerland EWL 0.52 505.3 -0.69 3.09 -7.89 14.48 15.83 -0.10 55,224 13.0 21.49 2.37WisdomTree Intl Dividend ex-Financials DOO 0.58 295.9 -2.37 2.37 -6.42 5.70 17.32 -3.91 23,425 11.0 23.11 4.66
International Equity: EmergingWisdomTree India Earnings EPI 0.83 883.7 -3.85 23.21 -40.41 20.28 22.53 - 7,466 8.9 38.80 0.83iPath MSCI India ETN INP 0.89 550.0 -4.78 21.84 -39.97 21.23 24.42 0.87 - - 39.75 0.00iShares S&P India Nifty 50 INDY 0.89 318.2 -3.22 21.16 -36.69 24.45 - - 16,121 13.1 - 0.53PowerShares India PIN 0.78 383.1 -2.47 18.71 -35.88 16.29 18.98 - 15,897 13.6 35.40 0.00iShares MSCI Turkey TUR 0.59 406.4 1.47 17.55 -36.56 25.64 29.34 - 3,909 14.3 36.98 2.38iShares MSCI Poland EPOL 0.59 122.2 -1.23 16.96 -32.19 - - - 3,855 7.0 - 4.94Market Vectors Brazil Small-Cap BRF 0.59 653.0 2.86 15.07 -27.90 24.05 - - 1,089 11.6 - 2.43iShares MSCI Brazil EWZ 0.59 10,480.8 5.96 14.31 -24.17 7.69 26.98 10.27 19,666 7.1 33.68 2.28iShares MSCI Russia ERUS 0.58 112.6 2.97 14.25 -20.15 - - - 37,026 6.1 - 1.44SPDR S&P Emrg Mkts Small Cap EWX 0.65 827.5 3.20 14.05 -30.19 23.51 27.91 - 947 - 30.64 1.67Market Vectors Russia RSX 0.62 1,896.4 1.58 13.55 -28.14 22.14 42.19 - 23,134 7.8 41.60 1.93iShares MSCI BRIC BKF 0.67 780.8 4.25 13.48 -24.76 9.21 24.35 - 26,669 7.9 31.55 1.97SPDR S&P BRIC 40 BIK 0.50 367.5 5.69 13.23 -18.06 11.37 26.64 - 72,159 7.3 28.68 2.53Guggenheim BRIC EEB 0.64 472.4 4.10 12.78 -21.08 10.70 24.64 6.91 40,878 6.0 28.73 3.50iShares MSCI All Peru EPU 0.59 474.6 10.52 12.68 -21.78 57.69 - - 4,209 12.8 - 2.50SPDR S&P Emerging Latin America GML 0.59 139.1 5.03 12.11 -21.34 15.39 28.64 - 25,029 6.9 32.20 2.16PowerShares FTSE RAFI Emrg Mkts PXH 0.85 365.8 4.90 11.81 -19.70 13.26 24.28 - 19,751 8.5 27.99 2.21Global X/InterBolsa FTSE Colombia 20 GXG 0.78 128.6 4.21 11.79 -15.19 51.44 - - 5,477 19.3 - 1.05SPDR S&P Emerging Markets GMM 0.59 161.2 4.27 11.44 -19.00 18.76 26.68 - 17,299 9.2 27.26 2.20BLDRS Emerging Markets 50 ADR ADRE 0.30 452.1 4.77 11.40 -18.47 10.98 20.83 3.98 49,177 7.7 25.64 3.03iShares FTSE China 25 FXI 0.72 6,663.4 7.93 11.36 -17.57 3.51 17.35 3.92 77,922 9.1 26.98 1.97SPDR S&P Emerging Asia Pacific GMF 0.59 507.3 4.14 11.08 -19.17 19.47 26.79 - 18,946 10.5 29.56 2.25PowerShares Halter USX China PGJ 0.60 253.5 -0.01 11.01 -24.85 11.31 19.55 1.68 7,465 9.3 29.31 2.09iShares MSCI Emerging Markets EEM 0.67 37,141.3 4.12 10.99 -18.83 16.54 25.05 3.93 16,958 9.5 28.70 1.92Vanguard MSCI Emerging Markets VWO 0.22 49,811.7 4.37 10.78 -18.73 19.45 27.45 4.30 15,736 9.0 28.53 2.14SPDR S&P China GXC 0.59 765.7 5.86 10.51 -16.81 7.58 21.85 - 27,573 8.7 27.97 1.88WisdomTree Emrg Mkts SmallCap Div DGS 0.64 833.7 5.65 10.21 -21.19 30.19 30.68 - 1,046 9.6 27.88 3.73Schwab Emerging Markets Equity SCHE 0.25 506.5 3.64 10.01 -19.23 - - - 22,651 10.2 - 2.25iShares MSCI China MCHI 0.58 185.4 5.83 9.81 - - - - 38,869 9.9 - -iShares S&P Latin America 40 ILF 0.50 2,042.0 3.72 9.14 -18.52 15.53 26.00 8.47 40,711 - 28.88 3.02iShares MSCI South Africa EZA 0.59 543.3 6.79 8.94 -15.75 36.91 30.22 6.26 11,330 13.5 30.43 2.90iShares MSCI Taiwan EWT 0.59 2,378.8 2.45 8.88 -22.02 22.70 26.33 1.42 10,090 12.8 30.85 3.69Guggenheim China Small Cap HAO 0.75 153.6 1.76 8.76 -33.73 15.85 21.93 - 1,676 7.0 35.71 2.95SPDR S&P Emerging Middle East/Africa GAF 0.59 102.5 6.03 8.46 -18.43 30.47 25.83 - 7,563 13.3 24.21 3.22iShares MSCI Mexico EWW 0.52 1,287.8 5.91 8.20 -12.00 27.95 29.74 3.81 16,470 - 26.25 1.33iShares MSCI Thailand THD 0.59 516.3 11.76 8.09 -4.16 56.76 46.22 - 6,757 - 29.34 2.78iShares MSCI Chile ECH 0.59 582.9 -0.89 7.81 -26.46 46.57 24.20 - 7,922 15.8 25.90 1.65iShares MSCI Malaysia EWM 0.52 901.7 5.05 5.30 -2.71 38.97 30.28 10.45 8,627 13.8 19.75 4.23Market Vectors Indonesia IDX 0.60 603.9 1.38 3.62 -0.62 41.77 56.23 - 9,313 14.1 36.58 1.52iShares MSCI Indonesia EIDO 0.59 350.4 2.43 3.62 1.91 - - - 9,114 18.9 - 1.16
International Equity: FrontierMarket Vectors Vietnam VNM 0.76 226.6 -5.41 17.53 -43.80 4.10 - - 1,015 8.5 - 1.00Guggenheim Frontier Markets FRN 0.70 128.3 5.59 10.69 -22.41 33.88 23.46 - 7,982 7.4 24.42 4.10
18 ETFR • March 201218 ETFR • March 2012
March 2012 Vol. 12 | No. 03U.S.-Listed ETFs Sorted by Asset Class and Year-to-Date Return
Data as of 01/31/2012. Source: Morningstar. Exp Ratio is annual expense ratio. Assets are net assets in $US millions. 3-Mo is 3-month total return. YTD is year-to-date. 3- and 5-year returns are annualized. Mkt Cap is geometric average market capitalization. P/E is price-to-earnings ratio. Std Dev is 3-year standard deviation. Yield is 12-month. Includes all U.S.-listed ETFs and ETNs with assets of $100 million and above.
Fund Name Ticker Exp Ratio Assets 3-Mo YTD 2011 2010 3-Yr 5-Yr Std DevP/EMkt Cap Yield
Global Equity: SectorGlobal X Uranium URA 0.69 207.2 3.86 28.71 -60.14 - - - 1,067 - - 0.00Market Vectors Junior Gold Miners GDXJ 0.54 2,523.1 1.42 20.04 -34.06 66.53 - - 647 14.4 - 4.05Market Vectors Rare Earth Metals REMX 0.57 230.8 3.07 18.63 -33.86 - - - 1,180 10.8 - 5.39Market Vectors Steel SLX 0.55 213.0 7.15 16.17 -32.91 19.65 27.34 3.94 9,461 7.6 40.12 2.06Global X Silver Miners SIL 0.65 361.3 2.80 16.17 -21.96 - - - 3,060 14.0 - 0.14iShares S&P Global Materials MXI 0.48 532.6 3.86 11.43 -20.34 19.92 23.94 3.36 26,736 11.3 29.46 2.00PowerShares Listed Private Equity PSP 0.60 251.4 1.14 10.76 -21.11 25.90 17.39 -15.30 1,356 6.6 33.17 7.16Market Vectors Gold Miners GDX 0.53 9,408.3 -3.75 9.78 -16.09 33.90 18.62 8.00 13,326 15.4 36.54 0.27iShares S&P Global Financials IXG 0.48 156.9 2.22 9.56 -20.09 3.90 15.12 -12.86 33,774 9.2 31.30 3.09PowerShares Global Water PIO 0.75 246.9 1.11 9.24 -20.97 11.24 14.82 - 1,589 10.8 23.63 1.49Market Vectors Gaming BJK 0.65 102.1 2.82 9.20 -2.39 37.88 30.43 - 5,958 12.3 31.35 1.91Market Vectors Agribusiness MOO 0.56 5,976.8 3.24 8.84 -11.37 23.04 25.17 - 12,606 10.7 26.73 0.59SPDR Global Natural Resources GNR 0.40 241.3 2.32 8.63 -15.78 - - - 41,334 9.4 - 1.76Market Vectors Hard Assets Producers HAP 0.59 171.4 3.26 8.39 -11.71 16.52 18.79 - 27,389 10.2 26.24 1.81PowerShares Global Agriculture PAGG 0.75 113.8 -0.76 8.28 -15.47 20.96 21.17 - 11,831 11.3 27.20 0.68Guggenheim Timber CUT 0.70 111.6 5.52 8.22 -17.95 18.19 22.70 - 3,482 15.4 32.90 2.17Market Vectors Coal KOL 0.59 331.6 -6.79 8.06 -30.71 31.34 38.45 - 6,086 13.6 43.47 1.38Market Vectors Oil Services OIH 0.35 1,029.4 - 8.03 - - - - 17,661 16.8 - -iShares S&P Global Consumer Discr RXI 0.48 126.3 4.70 8.00 -4.90 23.29 24.45 -0.17 25,932 15.4 22.37 1.64FlexShares Morningstar Glbl Upstream Nat Res GUNR 0.48 211.5 1.60 7.93 - - - - 33,644 10.1 - -PowerShares Cleantech PZD 0.60 103.6 1.62 7.81 -17.85 7.61 12.35 -1.78 3,402 13.7 27.14 0.80iShares S&P Global Industrials EXI 0.48 171.4 6.56 7.67 -8.44 23.28 21.04 0.11 23,742 13.0 24.51 2.20SPDR DJ Global Real Estate RWO 0.50 376.9 3.72 7.14 -3.00 24.03 27.33 - 7,109 15.1 24.69 2.90iShares S&P Global Technology IXN 0.48 509.4 3.91 7.02 -3.46 10.44 22.36 2.41 73,373 14.6 21.25 0.92iShares S&P Global Timber/Forestry WOOD 0.48 150.9 6.28 6.70 -15.40 16.19 18.81 - 4,396 17.1 29.85 2.27Guggenheim S&P Global Water CGW 0.70 189.8 2.66 5.55 -7.79 15.02 17.62 - 4,451 14.6 19.68 2.07iShares S&P North Amer Natural Res IGE 0.48 1,890.5 1.57 5.05 -7.79 23.34 19.02 4.69 30,083 12.9 26.55 1.13iShares S&P Global Energy IXC 0.48 1,144.3 2.61 3.06 0.00 11.79 14.88 4.03 77,765 10.4 24.18 2.24iShares S&P Global Infrastructure IGF 0.48 426.4 1.78 2.80 -1.25 6.97 13.81 - 12,796 13.7 19.79 4.24iShares S&P Global Healthcare IXJ 0.48 542.8 5.40 1.82 10.78 1.87 12.48 1.63 52,564 16.1 15.72 2.13iShares S&P Global Utilities JXI 0.48 250.0 -1.40 -1.00 -2.80 -1.79 3.44 -2.67 17,809 12.2 15.69 4.74iShares S&P Global Telecommunications IXP 0.48 428.5 -2.17 -1.08 0.90 11.63 12.73 0.86 66,146 13.2 14.49 5.52iShares S&P Global Consumer Staples KXI 0.48 447.6 1.45 -1.11 9.09 13.16 17.37 6.06 55,626 16.0 13.97 2.36
Global Ex-U.S. Equity: SectorWisdomTree Global Ex-US Real Estate DRW 0.58 112.5 3.10 10.17 -14.37 17.68 22.03 - 6,418 7.3 26.63 5.76Vanguard Global ex-US Real Estate VNQI 0.35 199.9 1.21 9.48 -16.90 - - - 4,361 7.2 - 3.01SPDR DJ Intl Real Estate RWX 0.59 2,224.1 0.51 9.21 -15.03 21.83 20.92 -7.06 5,566 7.6 25.03 3.90
International Equity: Developed SectoriShares FTSE E/N Dev Real Est ex-US IFGL 0.48 368.4 -0.11 8.79 -15.56 14.57 19.75 - 5,983 7.8 25.32 3.93iShares S&P Dev Ex-US Property WPS 0.48 123.0 0.79 8.72 -16.29 18.13 19.92 - 5,345 7.8 26.00 4.14Guggenheim Canadian Energy Inc ENY 0.70 114.6 5.47 4.81 -14.02 22.60 20.94 - 5,335 19.1 34.54 2.71
International Equity: Emerging SectorPowerShares Emrg Mkts Infrastructure PXR 0.75 122.6 3.78 13.40 -29.61 26.20 29.11 - 4,252 10.3 35.02 1.61iShares S&P Emrg Mkts Infrastructure EMIF 0.75 110.0 6.81 10.61 -13.35 18.66 - - 8,032 13.0 - 3.10Global X China Consumer CHIQ 0.65 147.7 -1.28 6.42 -23.92 10.79 - - 4,471 11.8 - 0.39EGShares DJ Emrg Mkts Consumer Titans ECON 0.85 328.6 2.17 5.59 -5.18 - - - 17,990 19.8 - 0.53
Global Equity: High Dividend YieldFirst Trust Dow Jones Global Select Dividend FGD 0.60 147.9 1.12 4.23 -2.57 12.60 29.72 - 8,697 10.5 25.49 4.97
Global Ex-U.S. Equity: High Dividend YieldSPDR S&P International Dividend DWX 0.45 711.0 0.01 4.97 -11.53 7.87 23.48 - 6,291 8.0 28.88 6.82
International Equity: High Dividend YieldWisdomTree Emrg Mkts Equity Income DEM 0.63 2,680.2 5.90 8.17 -10.34 24.66 28.18 - 8,607 10.3 24.51 4.12SPDR S&P Emrg Mkts Dividend EDIV 0.59 213.8 7.09 7.97 - - - - 5,818 7.7 - -iShares DJ Intl Select Dividend IDV 0.50 773.2 -0.70 5.19 -7.19 11.84 27.32 - 11,577 9.6 25.57 5.22WisdomTree DEFA Equity Income DTH 0.58 153.7 -2.95 3.28 -6.68 -0.99 13.52 -4.87 31,072 10.1 24.65 5.10PowerShares Intl Dividend Achievers PID 0.50 645.9 -1.38 2.06 -2.40 13.47 21.93 -1.26 22,883 11.6 21.18 3.26
International Equity: Alpha SeekingPowerShares DWA EM Tech Leaders PIE 0.90 160.3 5.59 7.15 -12.53 25.11 28.39 - 4,732 13.3 29.10 0.74
U.S. Fixed Income: Broad Market - Broad MaturitiesSchwab US Aggregate Bond SCHZ 0.10 197.4 1.91 0.83 - - - - - - - -iShares Barclays Aggregate Bond AGG 0.22 14,595.5 1.75 0.73 7.70 6.37 6.64 6.46 - - 2.98 2.84iShares Barclays Government/Credit Bond GBF 0.20 137.2 1.82 0.65 9.37 5.71 6.64 6.80 - - 3.62 3.02Vanguard Total Bond Market BND 0.11 14,875.7 1.76 0.63 7.93 6.20 6.88 - - - 2.71 3.08SPDR Barclays Aggregate Bond LAG 0.17 303.1 1.43 0.47 7.91 6.25 6.43 - - - 2.98 2.52

ETFR • March 2012 19 ETFR • March 2012 19
March 2012 Vol. 12 | No. 03U.S.-Listed ETFs Sorted by Asset Class and Year-to-Date Return
Data as of 01/31/2012. Source: Morningstar. Exp Ratio is annual expense ratio. Assets are net assets in $US millions. 3-Mo is 3-month total return. YTD is year-to-date. 3- and 5-year returns are annualized. Mkt Cap is geometric average market capitalization. P/E is price-to-earnings ratio. Std Dev is 3-year standard deviation. Yield is 12-month. Includes all U.S.-listed ETFs and ETNs with assets of $100 million and above.
Fund Name Ticker Exp Ratio Assets 3-Mo YTD 2011 2010 3-Yr 5-Yr Std DevP/EMkt Cap Yield
U.S. Fixed Income: Broad Market - Short-TermVanguard Short-Term Bond BSV 0.11 7,593.3 0.69 0.57 2.95 3.89 3.36 - - - 1.69 1.88
U.S. Fixed Income: Broad Market - IntermediateVanguard Intermediate-Term Bond BIV 0.11 2,924.7 2.78 1.53 11.14 9.14 9.71 - - - 4.65 3.56iShares Barclays Intermdt Gov/Cred Bond GVI 0.20 704.9 1.58 0.91 5.96 5.46 5.26 6.05 - - 2.64 2.61
U.S. Fixed Income: Broad Market - Long-TermVanguard Long-Term Bond BLV 0.11 638.4 3.72 0.91 22.93 10.01 13.45 - - - 8.70 4.18
U.S. Fixed Income: GovernmentVanguard Short-Term Govt Bond VGSH 0.14 167.7 0.09 -0.01 1.46 2.29 0.55 0.33 - - - 0.54
U.S. Fixed Income: Treasury - Broad Maturities PowerShares 1-30 Laddered Treasury PLW 0.25 162.6 4.00 0.48 19.98 8.80 7.85 - - - 9.21 2.84
U.S. Fixed Income: Treasury - Short Term iShares Barclays 1-3 Yr Treasury Bond SHY 0.15 11,197.0 0.18 0.08 1.44 2.28 1.53 3.56 - - 1.04 0.81Schwab Short-Term US Treasury SCHO 0.12 192.1 0.25 0.04 1.45 - - - - - - 0.41iShares Barclays Short Treasury Bond SHV 0.15 2,567.7 -0.01 -0.02 0.07 0.12 0.13 1.56 - - 0.12 0.07SPDR Barclays 1-3 Month T-Bill BIL 0.13 1,154.8 -0.02 -0.02 -0.04 -0.04 -0.01 - - - 0.09 0.00PIMCO 1-3 Year US Treasury TUZ 0.09 143.2 0.18 -0.05 1.35 2.43 - - - - - 0.71
U.S. Fixed Income: Treasury - Intermediate iShares Barclays 7-10 Yr Treasury Bond IEF 0.15 5,052.9 3.46 0.86 15.65 9.36 7.43 9.25 - - 6.96 2.53iShares Barclays 3-7 Yr Treasury Bond IEI 0.15 2,554.0 1.57 0.63 8.31 6.31 4.91 7.21 - - 3.95 1.66Schwab Intermediate-Term US Treasury SCHR 0.12 129.1 2.29 0.52 10.35 - - - - - - 1.52SPDR Barclays Intermediate Treasury ITE 0.13 221.1 1.25 0.51 6.50 4.93 3.93 - - - 3.01 1.85
U.S. Fixed Income: Treasury - Long-Term iShares Barclays 10-20 Yr Treasury TLH 0.15 494.7 4.11 0.57 21.64 9.69 9.41 10.26 - - 9.60 2.77iShares Barclays 20+ Yr Treasury TLT 0.15 3,433.1 5.15 -0.32 33.98 9.04 9.44 11.19 - - 15.09 3.31Vanguard Ext Duration Treasury EDV 0.13 197.8 7.40 -1.53 56.14 9.79 11.43 - - - 25.53 2.97
U.S. Fixed Income: AgenciesiShares Barclays Agency Bond AGZ 0.20 373.7 1.42 0.46 4.89 3.74 3.74 - - - 2.12 1.66iShares Barclays MBS Bond MBB 0.31 4,246.8 1.15 0.28 5.87 5.58 5.54 - - - 2.26 3.32Vanguard Mortgage-Backed Securities VMBS 0.15 150.6 1.20 0.23 5.98 5.44 2.63 1.57 - - - 2.13
U.S. Fixed Income: TIPSPIMCO 15+ Year US TIPS LTPZ 0.20 392.2 4.75 3.45 25.06 8.66 - - - - - 3.36iShares Barclays TIPS Bond TIP 0.20 23,024.4 2.99 2.29 13.28 6.13 10.30 8.30 - - 5.88 4.02PIMCO Broad US TIPS TIPZ 0.20 103.0 3.25 2.23 13.88 6.20 - - - - - 3.46SPDR Barclays TIPS IPE 0.18 633.9 3.02 2.22 13.83 6.25 10.31 - - - 6.02 3.87Schwab US TIPS SCHP 0.14 340.3 2.96 2.14 13.41 - - - - - - 2.75FlexShares iBoxx 5-Year Target Duration TIPS TDTF 0.20 172.5 2.72 1.90 - - - - - - - -FlexShares iBoxx 3-Year Target Duration TIPS TDTT 0.20 167.4 1.03 1.32 - - - - - - - -PIMCO 1-5 Year US TIPS STPZ 0.20 940.3 0.69 1.27 4.65 3.51 - - - - - 2.90iShares Barclays 0-5 Year TIPS Bond STIP 0.20 273.0 0.50 1.05 4.46 - - - - - - 2.44
U.S. Fixed Income: Municipal - Broad MarketiShares S&P Natl Municipal Bond MUB 0.25 2,686.3 6.79 3.53 12.99 0.10 7.84 - - - 5.66 3.25PowerShares Insured Natl Muni Bond PZA 0.28 647.7 6.14 3.40 13.69 -0.47 10.54 - - - 6.52 4.34iShares S&P California Muni Bond CMF 0.25 209.9 5.45 2.73 16.46 -2.62 8.02 - - - 6.57 3.58SPDR Barclays Municipal Bond TFI 0.23 1,045.2 6.10 2.48 13.85 -0.51 7.52 - - - 5.31 3.17Market Vectors Short Municipal SMB 0.20 120.0 1.74 0.58 5.50 1.21 3.66 - - - 2.75 1.92
U.S. Fixed Income: Municipal - Short TermSPDR Nuveen Barclays Sh-Trm Muni Bond SHM 0.20 1,490.7 1.55 0.29 3.89 1.02 2.79 - - - 2.00 1.43iShares S&P Short Term Natl Muni Bond SUB 0.25 495.6 0.85 0.03 3.85 0.36 2.13 - - - 1.76 1.28
U.S. Fixed Income: Municipal - IntermediateMarket Vectors Intermediate Muni ITM 0.24 393.6 6.50 2.67 13.21 1.63 7.49 - - - 6.13 3.15PIMCO Intermediate Muni Bond Strategy MUNI 0.35 121.4 3.79 1.34 8.01 3.74 - - - - - 2.21
U.S. Fixed Income: Municipal - High YieldMarket Vectors High-Yield Municipal HYD 0.35 406.9 5.15 3.83 11.03 0.34 - - - - - 5.67
U.S. Fixed Income: Municipal - VRDOPowerShares VRDO Tax-Free Weekly PVI 0.25 442.4 0.11 -0.04 0.65 0.29 0.64 - - - 0.18 0.50

20 ETFR • March 201220 ETFR • March 2012
March 2012 Vol. 12 | No. 03U.S.-Listed ETFs Sorted by Asset Class and Year-to-Date Return
Data as of 01/31/2012. Source: Morningstar. Exp Ratio is annual expense ratio. Assets are net assets in $US millions. 3-Mo is 3-month total return. YTD is year-to-date. 3- and 5-year returns are annualized. Mkt Cap is geometric average market capitalization. P/E is price-to-earnings ratio. Std Dev is 3-year standard deviation. Yield is 12-month. Includes all U.S.-listed ETFs and ETNs with assets of $100 million and above.
Fund Name Ticker Exp Ratio Assets 3-Mo YTD 2011 2010 3-Yr 5-Yr Std DevP/EMkt Cap Yield
U.S. Fixed Income: Municipal - Build America BondsPowerShares Build America Bond BAB 0.29 839.7 5.19 2.83 21.00 9.38 - - - - - 5.10
U.S. Fixed Income: Corporate - Investment Grade - Broad MaturitiesPIMCO Investment Grade Corporate Bond CORP 0.20 191.0 1.31 3.74 5.49 - - - - - - 3.34iShares iBoxx $ Inv Gr Corporate Bond LQD 0.15 18,486.6 2.37 2.15 9.75 9.33 10.65 7.16 - - 6.93 4.32iShares Barclays Credit Bond CFT 0.20 1,208.7 2.10 1.37 9.14 8.42 10.15 7.14 - - 5.15 4.07
U.S. Fixed Income: Corporate - Investment Grade - Short-Term SPDR Barclays Sh-Trm Corporate Bond SCPB 0.12 413.0 0.87 1.13 1.49 2.80 - - - - - 1.73Vanguard Short-Term Corporate Bond VCSH 0.14 2,404.0 1.31 1.08 3.06 5.27 - - - - - 2.29iShares Barclays 1-3 Year Credit Bond CSJ 0.20 9,214.9 0.50 0.58 1.84 2.88 3.82 4.41 - - 2.70 1.90
U.S. Fixed Income: Corporate - Investment Grade - IntermediateVanguard Intermediate Corporate Bond VCIT 0.14 1,186.6 3.17 2.31 8.97 9.97 - - - - - 3.46SPDR Barclays US Intermediate Corp Bond ITR 0.15 239.2 1.94 1.87 5.85 7.16 - - - - - 3.34iShares Barclays Intermediate Credit Bond CIU 0.20 4,499.9 1.32 1.11 5.83 6.83 7.94 6.33 - - 4.21 3.68
U.S. Fixed Income: Corporate - Investment Grade - Long-Term Vanguard Long-Term Corporate Bond VCLT 0.14 470.5 2.19 1.28 17.46 10.62 - - - - - 4.54iShares 10+ Year Credit Bond CLY 0.20 300.8 0.64 0.08 16.90 10.69 - - - - - 4.45
U.S. Fixed Income: Corporate - Investment Grade - Fixed MaturitiesGuggenheim BulletShares 2014 Corporate Bond BSCE 0.24 107.3 1.24 1.34 3.18 - - - - - - 1.96Guggenheim BulletShares 2013 Corporate Bond BSCD 0.24 115.5 0.65 0.53 1.43 - - - - - - 1.37
U.S. Fixed Income: Corporate - High Yield - Broad MaturitiesSPDR Barclays High Yield Bond JNK 0.40 10,593.8 3.87 2.65 4.45 14.20 19.62 - - - 14.85 7.50iShares iBoxx $ HiYld Corporate Bond HYG 0.50 13,209.8 3.52 1.47 6.81 11.96 16.44 - - - 14.09 7.48PowerShares Fundamental HiYld Corp Bond PHB 0.50 717.8 2.91 0.79 7.73 9.07 12.94 - - - 12.24 5.77
U.S. Fixed Income: Corporate - High Yield - Short-TermPIMCO 0-5 Year High Yield Corporate Bond HYS 0.55 162.3 1.35 0.50 - - - - - - - -
U.S. Fixed Income: Corporate - ConvertiblesSPDR Barclays Convertible Bond CWB 0.40 758.0 3.31 6.18 -7.65 14.01 - - 2,162 21.9 - 3.28
U.S. Fixed Income: Corporate - LoansPowerShares Senior Loan BKLN 0.83 225.7 3.12 2.98 - - - - - - - -
U.S. Fixed Income: Corporate - Preferred StockPowerShares Financial Preferred PGF 0.60 1,519.2 4.47 8.18 -1.74 15.99 25.98 0.83 - - 32.91 7.10iShares S&P US Preferred Stock PFF 0.48 7,750.5 3.82 7.07 -2.00 13.83 23.34 - - - 26.75 6.53SPDR Wells Fargo Preferred Stock PSK 0.45 137.1 3.44 5.03 1.17 13.97 - - - - - 6.73PowerShares Preferred PGX 0.50 1,457.8 3.34 4.53 3.54 11.56 17.15 - - - 21.33 6.54
International Fixed Income: Blended DevelopmentSPDR DB Intl Govt Infl-Protected Bond WIP 0.50 1,227.1 2.59 4.64 2.13 6.56 12.14 - - - 12.17 4.45WisdomTree Asia Local Debt ALD 0.55 410.5 1.51 3.85 - - - - - - - -PIMCO Enh Short Maturity Strategy MINT 0.35 1,790.9 0.41 0.31 0.45 1.64 - - - - - 0.95
International Fixed Income: DevelopedSPDR Barclays Sh-Trm Intl Treasury Bond BWZ 0.35 223.5 -2.02 3.38 -0.48 1.59 5.70 - - - 9.78 3.43SPDR Barclays Intl Treasury Bond BWX 0.50 1,733.8 0.54 2.74 3.99 3.82 7.82 - - - 10.22 3.27iShares S&P/Citi 1-3 Yr Intl Treasury Bond ISHG 0.35 166.8 -3.47 1.85 -2.87 1.09 2.86 - - - 10.44 4.46iShares S&P/Citi Intl Treasury Bond IGOV 0.35 298.4 -4.43 -1.25 1.59 1.59 4.08 - - - 10.02 4.07
International Fixed Income: EmergingMarket Vectors EM Lcl Currency Bond EMLC 0.49 563.7 2.57 7.02 -3.04 - - - - - - 5.37WisdomTree Emrg Mkts Local Debt ELD 0.55 1,133.3 2.48 6.44 -2.16 - - - - - - 4.40iShares JPM USD Emrg Mkts Bond EMB 0.60 3,733.2 1.75 1.14 7.65 10.86 14.25 - - - 9.60 4.82PowerShares Emrg Mkts Sov Debt PCY 0.50 1,373.6 1.30 0.63 8.44 10.84 14.48 - - - 9.62 5.43
Commodities: Broad MarketUnited States Commodity USCI 1.08 366.4 -0.46 4.64 -9.50 - - - - - - 0.00GreenHaven Continuous Commodity GCC 0.85 611.8 -2.86 4.58 -9.20 25.19 12.77 - - - 17.74 0.00ETRACS CMCI ETN UCI 0.65 143.0 -0.27 3.96 -8.69 18.61 16.43 - - - 20.27 0.00PowerShares DB Commodity Tracking DBC 0.85 5,950.8 0.40 3.69 -2.58 11.90 11.18 3.85 - - 20.53 0.00ELEMENTS Rogers Intl Commodity ETN RJI 0.75 707.6 0.57 3.29 -7.90 17.86 13.89 - - - 21.21 0.00iShares S&P GSCI Commodity GSG 0.75 1,341.4 1.44 2.40 -3.28 7.17 9.63 -2.85 - - 22.37 0.00iPath S&P GSCI ETN GSP 0.75 119.9 1.99 1.90 -1.40 8.36 10.88 -2.67 - - 22.92 0.00iPath DJ-UBS Commodity ETN DJP 0.75 2,621.4 -3.89 1.80 -14.01 16.23 8.80 -2.56 - - 19.07 0.00

ETFR • March 2012 21 ETFR • March 2012 21
March 2012 Vol. 12 | No. 03U.S.-Listed ETFs Sorted by Asset Class and Year-to-Date Return
Data as of 01/31/2012. Source: Morningstar. Exp Ratio is annual expense ratio. Assets are net assets in $US millions. 3-Mo is 3-month total return. YTD is year-to-date. 3- and 5-year returns are annualized. Mkt Cap is geometric average market capitalization. P/E is price-to-earnings ratio. Std Dev is 3-year standard deviation. Yield is 12-month. Includes all U.S.-listed ETFs and ETNs with assets of $100 million and above.
Fund Name Ticker Exp Ratio Assets 3-Mo YTD 2011 2010 3-Yr 5-Yr Std DevP/EMkt Cap Yield
Commodities: AgricultureELEMENTS RICI Agricultural ETN RJA 0.75 424.6 -2.68 1.56 -16.51 35.01 7.58 - - - 24.22 0.00PowerShares DB Agriculture DBA 0.85 2,038.5 -4.64 0.42 -10.73 22.35 5.16 2.93 - - 17.87 0.00iPath DJ-UBS Grains ETN JJG 0.75 166.6 -1.08 -0.16 -15.18 29.85 4.03 - - - 31.64 0.00iPath DJ-UBS Agriculture ETN JJA 0.75 129.2 -2.84 -0.58 -15.30 38.40 10.23 - - - 26.81 0.00
Commodities: EnergyPowerShares DB Energy DBE 0.75 181.2 1.04 2.32 2.75 2.63 13.09 3.53 - - 24.11 0.00United States 12 Month Oil USL 0.85 171.1 8.53 0.84 0.88 6.52 14.67 - - - 25.76 0.00PowerShares DB Oil DBO 0.75 522.2 8.88 0.42 1.24 2.36 14.33 4.15 - - 28.30 0.00iPath S&P GSCI Crude Oil ETN OIL 0.75 460.0 6.22 -0.72 -1.91 -1.04 8.58 -6.90 - - 31.57 0.00United States Oil USO 0.65 1,245.0 5.82 -0.76 -2.28 -0.71 8.98 -4.75 - - 29.48 0.00United States Natural Gas UNG 0.85 847.3 -41.79 -18.81 -46.09 -40.56 -47.51 - - - 31.65 0.00
Commodities: Industrial MetalsPowerShares DB Base Metals DBB 0.75 375.0 4.03 12.12 -23.66 8.58 23.10 -1.07 - - 27.03 0.00iPath DJ-UBS Copper ETN JJC 0.75 173.3 4.14 10.90 -25.48 29.04 34.04 - - - 31.10 0.00
Commodities: Precious MetalsiShares Silver SLV 0.50 10,376.3 -3.47 19.82 -10.74 82.14 37.12 19.06 - - 43.78 0.00ETFS Physical Silver SIVR 0.30 620.2 -3.43 19.77 -10.45 82.16 - - - - - 0.00ETFS Physical Precious Metal Basket GLTR 0.60 203.3 -0.49 14.23 -2.43 - - - - - - 0.00ETFS Physical Platinum PPLT 0.60 753.9 -0.99 13.82 -21.74 - - - - - - 0.00PowerShares DB Precious Metals DBP 0.75 449.8 -0.05 12.84 3.98 37.56 24.18 19.15 - - 24.99 0.00iShares Gold Trust IAU 0.25 9,872.4 1.25 11.49 9.57 29.46 22.95 21.23 - - 20.74 0.00SPDR Gold GLD 0.40 71,245.7 1.18 11.40 9.57 29.27 22.85 21.19 - - 20.71 0.00ETFS Physical Swiss Gold SGOL 0.39 1,874.6 1.23 11.39 9.58 29.23 - - - - - 0.00PowerShares DB Gold DGL 0.75 411.1 0.82 11.29 8.55 27.89 21.45 19.32 - - 20.74 0.00ETFS Physical Palladium PALL 0.60 447.7 5.87 5.17 -19.16 - - - - - - 0.00
Currency: DevelopedCurrencyShares Australian Dollar FXA 0.40 799.4 1.70 4.11 4.02 17.87 22.56 11.09 - - 15.37 3.83CurrencyShares Swiss Franc FXF 0.40 402.6 -4.72 2.05 -1.08 10.54 7.56 6.39 - - 13.60 0.00CurrencyShares Canadian Dollar FXC 0.40 585.1 -0.53 1.62 -1.78 4.96 6.78 4.40 - - 12.02 0.16CurrencyShares Euro FXE 0.40 247.7 -5.48 1.05 -2.92 -6.87 0.67 1.37 - - 12.73 0.23CurrencyShares Japanese Yen FXY 0.40 684.2 2.47 0.94 5.08 14.20 5.20 - - - 10.21 0.00
Currency: EmergingWisdomTree Dreyfus Emrg Currency CEW 0.55 358.4 0.62 5.43 -7.99 6.40 - - - - - 0.00WisdomTree Dreyfus Chinese Yuan CYB 0.45 443.1 1.31 0.83 1.47 1.21 1.33 - - - 3.13 0.00
Asset AllocationPowerShares CEF Income Composite PCEF 1.62 254.9 6.89 6.01 0.70 - - - 42,004 12.9 - 8.29iShares S&P Growth Allocation AOR 0.31 136.8 3.54 3.53 1.12 11.14 13.65 - 17,614 13.5 11.90 2.34iShares S&P Moderate Allocation AOM 0.31 148.3 2.36 2.31 2.29 7.88 10.38 - 22,876 12.9 7.83 2.28iShares S&P Conservative Allocation AOK 0.30 102.9 2.18 1.67 4.38 7.40 8.43 - 24,001 13.5 4.92 2.32
Alternatives: Absolute ReturnPowerShares DB G10 Currency Harvest DBV 0.75 323.9 0.70 3.37 0.08 0.85 10.02 -0.38 - - 11.50 0.00PowerShares S&P 500 BuyWrite PBP 0.75 102.6 7.13 1.94 4.18 4.89 12.95 - 49,117 13.7 13.17 10.11IQ Hedge Multi-Strategy Tracker QAI 1.06 183.4 1.07 1.69 0.15 2.59 - - 9,777 12.8 - 1.34Cambria Global Tactical GTAA 1.42 132.5 0.13 1.42 -7.30 - - - 8,349 13.4 - 0.82WisdomTree Managed Futures Strategy Fund WDTI 0.95 235.0 -1.20 -1.90 - - - - - - - 0.00
Alternatives: Tactical ToolsiPath S&P Dynamic VIX ETN XVZ 0.95 167.9 3.11 0.80 - - - - - - - -iPath S&P 500 VIX Mid-Term Futures ETN VXZ 0.89 199.4 -10.06 -9.92 -7.76 -14.43 -19.15 - - - 34.66 0.00iPath S&P 500 VIX Short-Term Futures ETN VXX 0.89 817.9 -33.03 -24.40 -5.53 -72.40 -59.96 - - - 66.80 0.00
LeveragedProShares Ultra Silver AGQ 0.95 806.9 -12.31 41.85 -47.47 182.44 45.23 - - - 89.82 0.00Direxion Daily Semiconductor Bull 3X SOXL 1.03 112.4 10.46 39.91 -48.07 - - - 11,140 11.2 - 0.00Direxion Daily Emrg Mkts Bull 3x EDC 1.01 379.1 3.19 34.82 -62.65 27.83 41.22 - - - 86.01 0.71Direxion Daily Gold Miners Bull 2X NUGT 0.95 107.8 -19.34 27.80 -47.69 - - - 16,861 18.1 - 0.00Direxion Daily Technology Bull 3x TYH 2.25 189.8 10.70 26.86 -19.89 21.28 68.45 - - - 63.95 0.00ProShares UltraPro QQQ TQQQ 0.95 172.5 10.76 26.86 -8.05 - - - - - - 0.00ProShares Ultra Gold UGL 0.95 390.6 0.12 23.20 11.72 58.28 40.84 - - - 41.92 0.00ProShares Ultra Basic Materials UYM 0.95 245.7 11.08 22.63 -36.58 57.39 49.98 -8.61 - - 61.09 0.00ProShares UltraPro Russell 2000 URTY 0.98 115.4 16.20 22.48 -37.56 - - - - - - 0.00PowerShares DB Gold Dbl Long ETN DGP 0.75 572.2 -0.46 22.39 10.90 62.37 42.19 - - - 41.45 0.00Direxion Daily Financial Bull 3x FAS 1.02 1,444.8 8.19 22.34 -53.41 13.02 1.43 - - - 75.36 0.00Direxion Daily Small Cap Bull 3x TNA 1.03 834.7 15.27 22.15 -38.10 69.81 38.28 - - - 73.37 0.00Direxion Daily Real Estate Bull 3x DRN 1.03 126.7 16.12 19.74 -5.56 63.51 - - - - - 0.00

22 ETFR • March 201222 ETFR • March 2012
March 2012 Vol. 12 | No. 03U.S.-Listed ETFs Sorted by Asset Class and Year-to-Date Return
Data as of 01/31/2012. Source: Morningstar. Exp Ratio is annual expense ratio. Assets are net assets in $US millions. 3-Mo is 3-month total return. YTD is year-to-date. 3- and 5-year returns are annualized. Mkt Cap is geometric average market capitalization. P/E is price-to-earnings ratio. Std Dev is 3-year standard deviation. Yield is 12-month. Includes all U.S.-listed ETFs and ETNs with assets of $100 million and above.
Fund Name Ticker Exp Ratio Assets 3-Mo YTD 2011 2010 3-Yr 5-Yr Std DevP/EMkt Cap Yield
Leveraged (Continued)ProShares Ultra QQQ QLD 0.95 601.6 8.22 17.27 0.04 36.90 55.57 3.78 - - 40.13 0.00ProShares Ultra Technology ROM 0.95 103.2 7.84 17.10 -7.35 19.91 50.61 0.34 - - 42.25 0.00Direxion Daily Large Cap Bull 3x BGU 1.18 283.3 12.67 14.86 -14.91 39.81 43.97 - - - 56.33 0.00ProShares Ultra Russell 2000 UWM 0.98 221.9 12.82 14.57 -18.34 50.63 36.40 -10.82 - - 48.76 0.00ProShares Ultra Financials UYG 0.95 820.0 8.39 14.42 -32.94 18.04 16.79 -40.43 - - 52.62 0.29ProShares UltraPro S&P 500 UPRO 0.95 301.6 12.61 13.90 -11.88 36.37 - - - - - 0.05ProShares Ultra MidCap 400 MVV 0.95 103.8 9.86 13.51 -13.07 52.88 43.84 -4.24 - - 43.60 0.00ProShares Ultra Real Estate URE 0.95 379.7 12.07 13.43 2.02 48.36 42.57 -28.70 - - 56.73 1.03ProShares Ultra S&P 500 SSO 0.92 1,654.6 9.32 8.97 -2.93 26.86 33.31 -8.94 - - 36.62 0.51ProShares Ultra Dow30 DDM 0.95 274.4 11.78 7.23 10.36 25.37 35.87 -3.40 - - 33.42 0.41Direxion Daily Energy Bull 3x ERX 1.03 345.3 0.43 3.86 -19.85 48.96 17.26 - - - 71.62 0.00ProShares Ultra Oil/Gas DIG 0.95 262.9 2.48 3.69 -4.05 33.69 19.67 -6.01 - - 47.37 0.14ProShares Ultra 7-10 Year Treasury UST 0.95 162.6 6.61 1.95 30.76 - - - - - - 0.02ProShares Ultra DJ-UBS Crude Oil UCO 0.95 253.7 10.36 -1.69 -18.09 -1.46 -0.97 - - - 60.96 0.00VelocityShares Daily 2X VIX Sh-Trm ETN TVIX 1.65 413.2 -60.44 -43.79 -50.63 - - - - - - 0.00
InverseVelocityShares Daily Inv VIX Sh-Trm ETN XIV 1.35 386.8 29.88 30.88 -45.54 - - - - - - 0.00ProShares UltraShort DJ-UBS Crude Oil SCO 0.95 142.2 -15.30 0.13 -23.91 -25.49 -39.59 - - - 54.09 0.00ProShares Short 20+ Yr Treasury TBF 0.95 716.8 -6.17 0.03 -29.56 -12.39 - - - - - 0.00ProShares UltraShort 20+ Yr Treasury TBT 0.93 2,965.6 -12.41 0.00 -51.21 -25.74 -27.69 - - - 28.58 0.00Direxion Daily 30-Yr Treasury Bear 3x TMV 1.14 267.7 -18.63 -0.09 -68.54 -36.69 - - - - - 0.00PowerShares DB US Dollar Bullish UUP 0.75 1,557.2 2.55 -1.56 -1.06 -1.60 -5.18 - - - 10.19 0.00ProShares UltraShort 7-10 Yr Treasury PST 0.95 368.4 -7.29 -2.00 -27.94 -21.51 -19.05 - - - 13.61 0.00ProShares UltraShort Yen YCS 0.95 234.5 -5.15 -2.05 -12.89 -26.43 -14.26 - - - 20.49 0.00ProShares UltraShort Euro EUO 0.95 925.1 10.59 -2.51 0.20 8.61 -7.44 - - - 25.13 0.00ProShares Short Dow30 DOG 0.95 297.5 -7.17 -3.63 -12.47 -15.29 -20.48 -6.63 - - 16.43 0.00ProShares Short S&P 500 SH 0.90 2,082.6 -6.24 -4.40 -7.82 -16.59 -20.77 -5.28 - - 17.75 0.00ProShares Short MSCI EAFE EFZ 0.95 212.1 -3.10 -5.42 2.88 -14.24 -20.12 - - - 22.12 0.00Direxion Daily Energy Bear 3x ERY 1.18 108.3 -17.61 -5.66 -49.84 -60.02 -61.06 - - - 65.93 0.00ProShares Short Financials SEF 0.95 107.2 -7.42 -6.82 1.96 -17.43 -28.08 - - - 27.35 0.00ProShares Short Russell 2000 RWM 0.95 368.2 -9.20 -6.91 -7.77 -27.39 -27.28 -10.88 - - 23.65 0.00ProShares UltraShort Dow 30 DXD 0.95 292.7 -14.43 -7.05 -26.04 -29.76 -38.89 -18.35 - - 32.48 0.00ProShares Short QQQ PSQ 0.95 263.6 -6.01 -7.96 -9.75 -20.61 -27.01 -12.28 - - 18.40 0.00ProShares UltraShort S&P 500 SDS 0.89 2,039.1 -12.94 -8.60 -18.82 -32.21 -39.86 -17.00 - - 34.70 0.00ProShares Short MSCI Emrg Mkts EUM 0.95 209.0 -6.96 -10.33 8.90 -20.92 -29.13 - - - 27.52 0.00Active Bear HDGE 1.85 128.5 -12.03 -10.55 - - - - - - - 0.00ProShares UltraShort MSCI Europe EPV 0.95 142.1 -10.48 -11.74 -18.47 -34.66 - - - - - 0.00ProShares UltraShort Real Estate SRS 0.95 132.2 -16.64 -12.51 -32.45 -51.63 -66.94 -49.17 - - 55.09 0.00ProShares UltraPro Short S&P 500 SPXU 0.95 570.8 -20.19 -12.72 -32.35 -46.51 - - - - - 0.00ProShares UltraShort Financials SKF 0.95 322.9 -15.90 -13.30 -5.36 -35.33 -55.23 -28.10 - - 53.88 0.00ProShares UltraShort Russell 2000 TWM 0.95 260.5 -19.49 -13.57 -23.15 -50.14 -51.65 -29.47 - - 45.75 0.00Direxion Daily Large Cap Bear 3x BGZ 1.02 179.0 -20.76 -13.78 -32.66 -48.74 -58.15 - - - 51.46 0.00ProShares UltraShort QQQ QID 0.95 604.7 -12.38 -15.29 -22.41 -38.90 -49.06 -29.16 - - 35.57 0.00Direxion Daily Small Cap Bear 3x TZA 1.15 969.4 -30.30 -19.37 -43.46 -68.34 -71.09 - - - 66.61 0.00Direxion Daily Financial Bear 3x FAZ 1.15 1,171.6 -24.84 -19.94 -20.96 -51.36 -77.13 - - - 76.08 0.00ProShares UltraShort FTSE China 25 FXP 0.95 165.6 -22.04 -20.68 0.96 -28.30 -51.55 - - - 54.12 0.00ProShares UltraShort Gold GLL 0.95 135.9 -6.94 -20.85 -28.74 -46.28 -42.78 - - - 39.70 0.00ProShares UltraPro Short QQQ SQQQ 0.95 127.4 -19.36 -22.14 -36.85 - - - - - - 0.00Direxion Daily Emrg Mkts Bear 3x EDZ 1.15 151.0 -25.28 -28.44 -2.96 -59.34 -73.43 - - - 77.35 0.00ProShares UltraShort Silver ZSL 0.95 188.7 -8.82 -33.52 -59.60 -79.50 -72.94 - - - 73.56 0.00

From the producers of: InsideETFs
InsideIndexing
InsideETFsEurope
InsideCommodities
InsideETFs
InsideIndexing
InsideETFsEurope
InsideCommodities
InsideETFs
InsideIndexing
InsideETFsEurope
InsideCommodities
Presented by:Complimentary Attendance for INSTITUTIONAL INVESTORSwww.InsideETFsEurope.com/ETFR or call +44 203 514 2195
IndexUniverse returns to Amsterdam for a third year to host the region’s largest ETF event, Inside ETFs Europe. The conference moves to the Hotel Okura to accommodate our growth and provide an exceptional conference experience for all delegates. This event is targeted at institutional investors and consultants. Conference topics will address the key issues of interest to ETF investors: liquidity and trading, structural risks and collateral, regulatory and tax changes, index selection, and a review of the major asset classes.
REGISTER FOR EUROPE’S LARGEST ETF CONFERENCE www.InsideETFsEurope.com/ETFR
conference
2012
3rd annual
InsideETFs
InsideIndexing
InsideETFsEurope
InsideCommodities
BUILDING BETTER PORTFOLIOS WITH ETFs
15-16 May 2012 HOTEL OKURA • AMSTERDAM
SAVE THE DATE!
REGISTER FOR EUROPE’S LARGEST ETF CONFERENCE!
Art: None
CODE: BLK-12-2C PUB/POST: ETFR - March issue; Due Date: PRODUCTION: Barbara Waldorf LIVE: 8” x 10.5”
DESCRIPTION: iShares 2012 Print WORKORDER #: 003660 TRIM: 8.5” x 11”
Delivery Support: 212.237.7000 FILE: 19A-003833-03A-BLK-12-2C.indd SAP #: BLK.BLKBRA.11027.K.011 BLEED: 8.75” x 11.25”
INCOMENEEDS FIXING
WHY FIXED
Call 1-800-iShares to request a prospectus, which includes investment objectives, risks, fees, expenses and other information that you should read and consider carefully before investing. Investing involves risk, including possible loss of principal. Bonds and bond funds will decrease in value as interest rates rise. Transactions in shares of the iShares Funds will result in brokerage commissions and will generate tax consequences. iShares Funds are obliged to distribute portfolio gains to shareholders. There can be no assurance that an active trading market for shares of an ETF will develop or be maintained. Funds distributed by SEI Investments Distribution Co. (“SEI”) and advised by BlackRock Fund Advisors (“BFA”). BlackRock Investments, LLC (“BRIL”), assists in the marketing of the Funds. BFA and BRIL are affiliates of BlackRock Institutional Trust Company, N.A. (“BTC”), none of which is affiliated with SEI. © 2012 BTC. All rights reserved. iShares® is a registered trademark of BTC. BlackRock® is a registered trademark of BlackRock, Inc. iS-6143-0212.
The problem is vexing.
Yields are low and
show no signs of rising.
Fees and taxes can
deplete what little yield
there is. Do you take on
more risk? Do you even
know how much risk you’re actually taking?
Investors traditionally look to fixed income as
a low risk allocation within their portfolios.
So…what do you do? What can you do? More
and more financial advisors and institutional
investors are turning to iShares. iShares ETFs
for fixed income offer a smart way of thinking
about fixed income investing. They are designed to
track an index and maintain consistent, tax-efficient
exposure at a low cost. They provide transparency
(you know exactly what you’re buying). And they
provide liquid access (so you can better adapt to
changing market conditions).
Just ask your financial advisor or broker dealer
today, or go to ishares.com/fixed
Russ Koesterich, iShares Global Chief Investment Strategist. “Low yields, high costs, unexpected taxes. iShares offers a way to fix fixed income.”
THREE iSHARES FIXED INCOME ETFs YOU SHOULD KNOW ABOUT: AGG, LQD AND HYG.