Embed Size (px)
Citation preview

1
In this Issue1 Enhancing India’s
Trade with Bangladesh and Myanmar Across Borders
4 Technical Textile
5 India’s Bilateral Relations with China
6 Investments in Latin America and Caribbean
7 Steel Industry
8 India-Sri Lanka Bilateral Trade and Investment Relations
9 Exim Bank’s Lines of Credit
10 The Quarter That Was
11 Interest Rates Outlook
12 Exim Bank’s Activities
13 Country Scan
14 Currency Currents
15 India’s Trade Performance
16 Trade & Partnership Opportunities
A Quarterly Publication by: EXPORT-IMPORT BANK OF INDIA
www.eximbankindia.in www.eximmitra.in
Head Office: Centre One Building, Floor 21, World Trade Centre Complex, Cuff Parade, Mumbai 400 005.
Tel.: 022 2217 2600 Email : [email protected]
The ‘Act East Policy’ of India envisages promoting economic cooperation, cultural ties and developing strategic relationship with countries in the Asia-Pacific region thereby providing enhanced connectivity to the states of India’s North East Region (NER). In fact, immediate border countries in the East and North Eastern region of India would play important role in the success of Act East Policy. Myanmar, the only member country of Association of Southeast Asian Nations (ASEAN) which borders India, shares a land boundary of around 1,643 km with four Indian states including Manipur, Mizoram, Nagaland and Arunachal Pradesh. Bangladesh is equally critical to the success of India’s ‘Act East’, with 4,096.7 km long border being shared with India states of West Bengal, Assam, Meghalaya, Tripura and Mizoram.
Regional Cooperation such as Bay of Bengal Initiative for Multi-Sectoral Technical and Economic Cooperation (BIMSTEC), which includes Bangladesh, Bhutan, India, Myanmar, Nepal, Sri Lanka and Thailand, become increasingly relevant. BIMSTEC acts a bridge between South Asia and Southeast Asia and also serves as a common platform for intra-regional trade and cooperation among the SAARC and ASEAN members.
IndO-BAngLAdESH BILATERAL TRAdE
Bangladesh is India’s largest trading partner in South Asia, accounting for 37.5 percent of India’s total exports to the region, and 20 percent of India’s total imports from South Asia in 2017. Indo-Bangladesh trade increased by almost two-fold over the past decade to US$ 6.3 billion in 2017 from US$ 3.6 billion in 2008. Over the decade, India’s exports to Bangladesh increased by a CAGR of 6.7 percent to US$ 5.8 billion in 2017 from US$ 3.2 billion in 2008, while India’s imports from Bangladesh increased by a CAGR of 3.8 percent from US$ 329.8 million in 2008 to US$ 459.4 million in 2017. India’s trade surplus
Enhancing India’s Trade with Bangladesh and Myanmar Across Borders
JUnE 2018 VOL. XXXIV ISSUE II
with Bangladesh increased from US$ 2.9 billion in 2008 to US$ 5.3 billion in 2017.
Cotton is the major commodity exported by India to Bangladesh (20 percent of India’s total exports to Bangladesh) in 2017, followed by vehicles other than railway, cereals, mineral fuels, and machinery. India’s major imports from Bangladesh in 2017 included vegetable textile fibres, paper yarn and woven fabric, which accounted for 20.7 percent of the total imports, followed by articles of apparel and clothing, salt, sulphur and cement, and lead and articles.
IndO-MyAnMAR BILATERAL TRAdE
Bilateral trade between India and Myanmar have witnessed a steady growth in recent years, having risen from US$ 1.1 billion in 2008 to more than US$ 1.2 billion in 2017. India maintain a trade surplus with Myanmar in the recent years from a deficit witnessed until 2015, reflecting lower imports of edible vegetables, roots and tubers, as well as timber products from Myanmar vis-à-vis previous years.
India’s exports to Myanmar increased by a CAGR of 12.5 percent to US$ 685.9 million in 2017 from US$ 237.3 million in 2008, while imports from Myanmar decreased from US$ 906.3 million in 2008 to US$ 578.3 million in 2017. On a year-on-year basis, India’s exports to and imports from Myanmar witnessed a sharp decline of 39.9 percent and 46.7 percent, respectively in 2017.
India’s export basket to Myanmar primarily comprised pharmaceutical products, iron and steel, sugars and sugar confectionery, electrical machinery and equipment and vehicles, among others, which together accounted for 51.8 percent of India’s total exports to Myanmar. Edible vegetables, roots and tubers, and timber products together accounted for 91 percent of India’s total imports from Myanmar in 2017. In fact, Myanmar was India’s third largest source of edible vegetables and timber products in 2017.
2
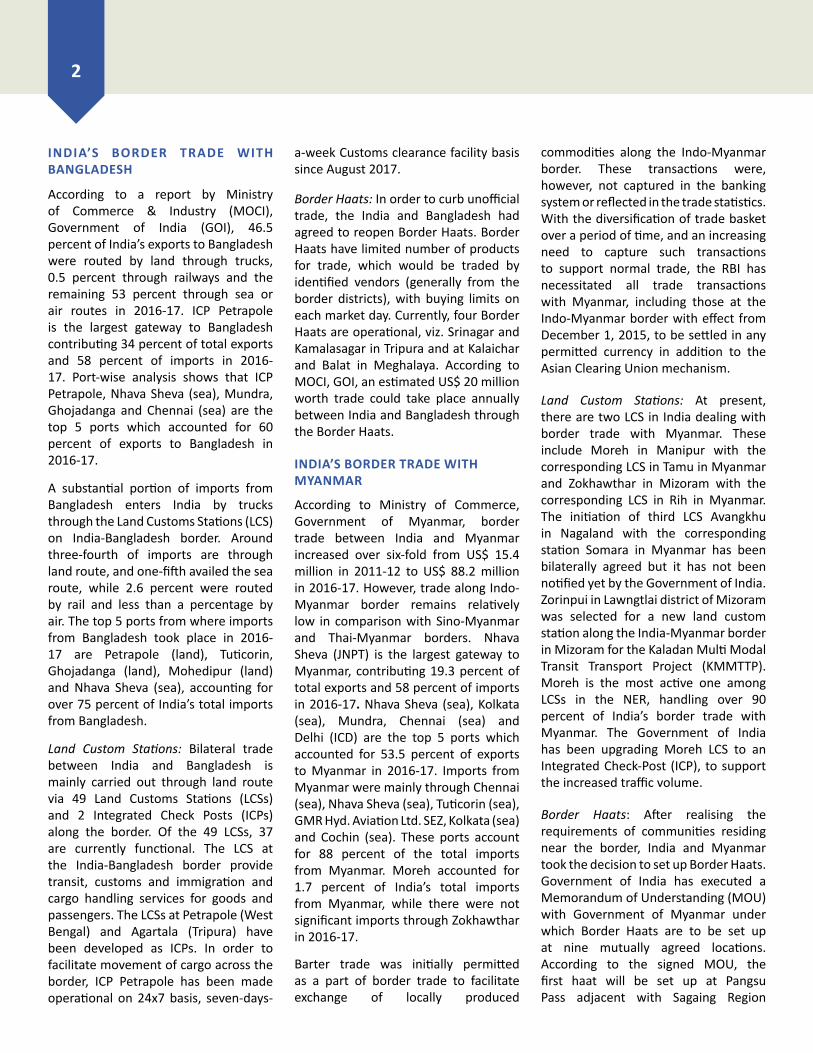
INDIA’S BORDER TRADE WITh BAngLAdESH
According to a report by Ministry of Commerce & Industry (MOCI), Government of India (GOI), 46.5 percent of India’s exports to Bangladesh were routed by land through trucks, 0.5 percent through railways and the remaining 53 percent through sea or air routes in 2016-17. ICP Petrapole is the largest gateway to Bangladesh contributing 34 percent of total exports and 58 percent of imports in 2016-17. Port-wise analysis shows that ICP Petrapole, Nhava Sheva (sea), Mundra, Ghojadanga and Chennai (sea) are the top 5 ports which accounted for 60 percent of exports to Bangladesh in 2016-17.
A substantial portion of imports from Bangladesh enters India by trucks through the Land Customs Stations (LCS) on India-Bangladesh border. Around three-fourth of imports are through land route, and one-fifth availed the sea route, while 2.6 percent were routed by rail and less than a percentage by air. The top 5 ports from where imports from Bangladesh took place in 2016-17 are Petrapole (land), Tuticorin, Ghojadanga (land), Mohedipur (land) and Nhava Sheva (sea), accounting for over 75 percent of India’s total imports from Bangladesh.
Land Custom Stations: Bilateral trade between India and Bangladesh is mainly carried out through land route via 49 Land Customs Stations (LCSs) and 2 Integrated Check Posts (ICPs) along the border. Of the 49 LCSs, 37 are currently functional. The LCS at the India-Bangladesh border provide transit, customs and immigration and cargo handling services for goods and passengers. The LCSs at Petrapole (West Bengal) and Agartala (Tripura) have been developed as ICPs. In order to facilitate movement of cargo across the border, ICP Petrapole has been made operational on 24x7 basis, seven-days-
a-week Customs clearance facility basis since August 2017.
Border Haats: In order to curb unofficial trade, the India and Bangladesh had agreed to reopen Border Haats. Border Haats have limited number of products for trade, which would be traded by identified vendors (generally from the border districts), with buying limits on each market day. Currently, four Border Haats are operational, viz. Srinagar and Kamalasagar in Tripura and at Kalaichar and Balat in Meghalaya. According to MOCI, GOI, an estimated US$ 20 million worth trade could take place annually between India and Bangladesh through the Border Haats.
INDIA’S BORDER TRADE WITh MyAnMAR
According to Ministry of Commerce, Government of Myanmar, border trade between India and Myanmar increased over six-fold from US$ 15.4 million in 2011-12 to US$ 88.2 million in 2016-17. However, trade along Indo-Myanmar border remains relatively low in comparison with Sino-Myanmar and Thai-Myanmar borders. Nhava Sheva (JNPT) is the largest gateway to Myanmar, contributing 19.3 percent of total exports and 58 percent of imports in 2016-17. Nhava Sheva (sea), Kolkata (sea), Mundra, Chennai (sea) and Delhi (ICD) are the top 5 ports which accounted for 53.5 percent of exports to Myanmar in 2016-17. Imports from Myanmar were mainly through Chennai (sea), Nhava Sheva (sea), Tuticorin (sea), GMR Hyd. Aviation Ltd. SEZ, Kolkata (sea) and Cochin (sea). These ports account for 88 percent of the total imports from Myanmar. Moreh accounted for 1.7 percent of India’s total imports from Myanmar, while there were not significant imports through Zokhawthar in 2016-17.
Barter trade was initially permitted as a part of border trade to facilitate exchange of locally produced
commodities along the Indo-Myanmar border. These transactions were, however, not captured in the banking system or reflected in the trade statistics. With the diversification of trade basket over a period of time, and an increasing need to capture such transactions to support normal trade, the RBI has necessitated all trade transactions with Myanmar, including those at the Indo-Myanmar border with effect from December 1, 2015, to be settled in any permitted currency in addition to the Asian Clearing Union mechanism.
Land Custom Stations: At present, there are two LCS in India dealing with border trade with Myanmar. These include Moreh in Manipur with the corresponding LCS in Tamu in Myanmar and Zokhawthar in Mizoram with the corresponding LCS in Rih in Myanmar. The initiation of third LCS Avangkhu in Nagaland with the corresponding station Somara in Myanmar has been bilaterally agreed but it has not been notified yet by the Government of India. Zorinpui in Lawngtlai district of Mizoram was selected for a new land custom station along the India-Myanmar border in Mizoram for the Kaladan Multi Modal Transit Transport Project (KMMTTP). Moreh is the most active one among LCSs in the NER, handling over 90 percent of India’s border trade with Myanmar. The Government of India has been upgrading Moreh LCS to an Integrated Check-Post (ICP), to support the increased traffic volume.
Border Haats: After realising the requirements of communities residing near the border, India and Myanmar took the decision to set up Border Haats. Government of India has executed a Memorandum of Understanding (MOU) with Government of Myanmar under which Border Haats are to be set up at nine mutually agreed locations. According to the signed MOU, the first haat will be set up at Pangsu Pass adjacent with Sagaing Region

3
and Arunachal Pradesh as a pilot project even after signing the Mode of Operation of setting up Border Haats by the designated authorities.
STRATEgIES FOR EnHAnCIng INDIA’S BORDER TRADE WITh BAngLAdESH And MyAnMAR
Need for Improving Border Related Infrastructure: There is an urgent need to improve the necessary border infrastructure at the ICPs and the LCSs to facilitate cross-border movement of goods between India and its neighbouring countries. Major infrastructure requirements include development of land port with modern warehousing facility, food testing facility, IT and telecom support, weighbridge, development of the connecting roads and bridges.
north East as a gateway to Markets in the Asian Region: NER has a potential to serve as a major springboard to penetrate neighbouring market in Asia region. Endowed with abundant rivers, the region offers perfect opportunity to implement a multi-modal mode of transport with the mix of road, rail and river based cargo movement. With the right kind of infrastructure and policy support in place, the NER has a potential to facilitate trade and commerce between India and its neighboring countries and other Asian countries. Coastal shipping, supported by logistics service provider, could be considered for effective movement of cargo between ports in Bangladesh and Myanmar and the NER.
need to Build Connectivity and Related Infrastructure Support: There is a need to strategically build connectivity within and across the states of NER and link with the border trading points. The KMTTP, which is currently underway, will connect Kolkata with Sittwe seaport in Rakhine State, Myanmar by sea. In Myanmar, it will then link Sittwe seaport to Paletwa, Chin State via the Kaladan
river boat route, and then from Paletwa by road to Mizoram state. It thus uses sea, river and road transport modes to facilitate a development corridor in Myanmar and also movement of cargo between Indian mainland and the NER. There is an urgent need to upgrade the transport infrastructure including roads especially trade routes to withstand regular movements of cargo vehicles.
Banking Facility to be streamlined: One major issue to fully shift from border trade to normal trade between India and Myanmar is that there is no standard exchange facility at the LCSs. Thus, it is not economical for Indian traders to do business with Myanmar at the border through official banking channels. Number of Banks authorised in NER to handle foreign currency transaction and L/C facilities is also limited. Further, at the Bangladesh Border Indian banks cannot carry on transaction directly with banks in Bangladesh. At the Indo-Myanmar border, there has been hesitancy regarding trade through banking transaction. To address this issue, conducting joint workshop for stakeholders including banks, traders, government officials, diplomats, and industry representatives, among others, could be a way forward.
need for Increasing Border Haat: With the normalisation of cross-border trade at the Indo-Myanmar, there is an urgent need to strengthen and increase the presence of Border Haats at strategic points. Setting up of Border Haat at the India-Myanmar border will support higher economic activities and engagements between people living in these areas. In addition, an avenue for regular cross-border bus services can also be explored to promote people-to-people connectivity.
Make in India in the nER: Border trade statistics especially at the LCS Moreh and LCS Zokhawthar suggest the need for setting up of manufacturing hub
in the NER. While official imports from Myanmar at the LCS Zokhawthar were confined mostly to areca nut, and occasionally reed broom and black pepper, official exports data has only one traded item, i.e. soyabari. The number of exported items are more diversified at Moreh border, which include imports of wheat flour, bleaching powder, dry chilli and dry grapes, while the only item imported is areca nut. It has been, however, learned that large quantities of other items have been exported from Zokhawthar to Myanmar through informal channel which include fertilizers (locally known as lei chi), medicines, motorcycles, pesticides, cycle parts, and solar gears. In fact, several truckloads of fertilizers and medicines are being supposedly shipped to Myanmar side every week. Similarly, large informal trade also happened at the Moreh LCS border. It is therefore pertinent to identify commodities which are on high demand at the other side of the border and set up a manufacturing unit accordingly, which will at the same time promote the “Make in India” initiative of the Government of India, while supporting job creation.
Promotion of Organic Agro-based Industry in the nER: One of the key industries that the states at NER could focus for exports is the Organic Industry and transform the region into organic hub in India. NER, where agricultural production is predominantly organic by default, can be instrumental in increasing India’s organic agricultural exports. Realising the potential for the development of organic farming, a sum of ` 100 crore had been allocated by the Government of India for the development of organic farming in the NE states way back in 2014-15. This initiative is anticipated to enable the NE states to benefit from the development of commercial organic farming and alter the agricultural mode from inorganic to organic.

4 Technical Textiles
Technical textile is a high technology, sunrise sector which is steadily gaining ground in India. Unlike conventional textiles used traditionally for clothing or furnishing, technical textiles include fibers and materials which are manufactured for their functional properties and associated utilities instead of giving precedence to their aesthetic worth. There are innumerable end user sectors which are benefitted by these products such as automotive, agriculture, aerospace, construction projects, sports, transportation, defence, shipping water treatment as well as in the provision of healthcare services. On the basis of the product properties, utility and end user requirements, the technical textile industry has been segmented into twelve segments namely Agrotech, Buildtech, Clothtech, Geotech, Hometech, Indutech, Meditech, Mobiltech, Oekotech, Packtech and Protech.
The Indian technical textile industry has immense potential for further development and growth. India has a share of approximately 3% of the global technical textile production being estimated at 90,000 MT. India has the uniqueness of having strong raw material (fibre) base – of cotton, manmade fibre, silk, wool and jute. Despite achieving high growth rate, the per capita consumption of technical textiles in India is 1.7 per kg vis-a-vis 10-12 kg in developed countries.
Europe and China are considered the major manufacturers and exporters of this segment of textiles in the global market. With reference to the world imports, the US and the Europe account for the leading shares in the global sphere. India accounts for approximately 4 percent of the global technical textiles exports and nearly 3 percent of the global imports. As per the Ministry of Textiles, GOI the domestic market in India was worth ` 1, 16,217 crore in the year 2017-18, growing at a CAGR of 9.9% during the period 2012-13 to 2017-18. It is anticipated that the industry will be valued at ` 2,00,823 crore by the period 2020-21. In the technical textiles market, Packtech products accounted for majority of
most significant schemes has been the National Technology Mission for Technical Textiles, which was launched for a period of five years (2010-11 to 2014-15) and later extended until 2017. Under this, there are two mini missions – one primarily for standardization, creation of common testing facilities and establishment of Centers of Excellence, while the other mini mission takes into account the support for domestic and export market development of technical textiles by providing assistance to startups and research in the field.
OuTLOOK
While India is currently a net exporter of the technical textile products, the domestic demand for these products is fast increasing, necessitating commensurate increase in domestic capacity. The opportunity in the technical textile sector emanates not just from the growing domestic demand for these products, but also from the high demand in traditional markets such as the US and increasing demand in newer markets such as China, Japan, Korea and Taiwan. For the development of India as a global manufacturing hub it is essential to emphasize on measures such as establishing regulatory norms for mandatory usage of technical textile items in specific industries to increase their consumption, producing better quality products, improving operational standards and giving priority to research, education and training associated with this segment.
the share constituting approximately 41.6% in the period 2017-18, followed by Indutech (11.3%), Hometech (10.5%) and Mobiltech (9.8%) respectively.
TRADETechnical textile is a high technology sunrise sector which has potential for considerable development in India. India is a net exporter of technical textiles products, and the value of exports during the period 2017-18 stood at US$ 1.85 billion. India’s exports have recorded a CAGR of 3.3% in the five year period 2013-14 to 2017-18.
The US is the leading export destination of technical textile products from India, and the value of exports estimated was US$ 336.8 million in 2017-18. The value of exports to the US has recorded a CAGR of 10.6% in the period 2013-14 to 2017-18, and its share in the aggregate exports also rose from 13.9% to 18.2%. China was noted as the second leading in the period 2017-18 followed by Germany and the UK. Other major export destinations of technical textile products from India include Spain, the Netherlands, UAE, Italy, France and Belgium. Packtech Products dominates India’s technical textiles market with a share of 43.2%, followed by Indutech Products (32%), Hometech (11.6%) and Meditech (5.8%).
gOvERnMEnT SCHEMESWith the objective of strengthening the technical textiles industry, the Government of India has launched various support schemes. One of the
2013-14 2014-15 2015-16 2016-17 2017-18
1.62 1.79
1.70 1.56
1.85
1.28 1.44 1.47 1.43
1.74
0.000.200.400.600.801.001.201.401.601.802.00
Exports (US$ bn) Imports (US$ bn)
Source: DGICSS; Exim Bank Analysis
India’s Bilateral Relations with China

5India’s Bilateral Relations with China
BILATERAL TRADE
The last decade witnessed doubling of India’s bilateral trade with China. Since 2000-01, China emerged as the largest trading partner of India replacing the US, accounting for 3 percent share in India’s total imports. In 2008-09, India’s trade with China stood at US$ 41.9 billion comprising US$ 9.4 billion of exports and US$ 32.5 billion of imports by India creating a trade deficit of US$ 25.1 billion. The trade deficit continued to widen across the years touching US$ 62.9 billion by 2017-18. India’s imports from China have increased by a CAGR of 9.9 percent during the last decade vis-à-vis the exports which have increased just by 4 percent. While China continued to be the fourth largest destination of Indian exports in 2017-18 at US$ 13.3 billion, China’s share in India’s exports fell to 4.4 percent from 5 percent in 2008-09. On the other hand, the share of China in India’s imports has increased substantially from 10.4 percent to 16.4 percent in the last decade.
Major exports from India to China during 2017-18 include organic chemicals (15.8 percent), copper and articles (11.6 percent), mineral fuels, oils and product of their distillation (11.3 percent), ores, slag and slash (9.4 percent) and cotton (7.5 percent) which are mainly primary commodities. India’s major imports from China include electrical machinery and equipment (37.6 percent), machinery and mechanical appliances (17.8 percent), organic chemicals (9.3 percent), plastics and articles (3.1 percent) and optical, photographic and medical instrument (2.2 percent) which majorly comprise high-tech products.
BILATERAL InvESTMEnT
During April 1996 to March 2018, the cumulative approved Indian FDI in joint ventures (JV) and wholly owned subsidiaries (FDI outflow) to China stood at US$ 1.5 billion. Indian companies have invested mainly in
manufacturing (pharmaceuticals, refractories, laminated tubes, auto-components, wind energy etc.), IT and IT-enabled services (including IT education, software solutions, and specific software products), trading and banking sector. Some of the prominent Indian companies in China include Ranbaxy, Orchid Pharmaceuticals, Dr. Reddy Laboratories, Aurobindo Pharma, NIIT, Bharat Forge, Infosys, TCS, Satyam Computers, APTECH, Orind Refractories, Essel Packaging, Suzlon Energy, Reliance Industries, KGK Diamonds, Sundaram Fasteners, Binani Cements etc.
During April 2000 to March 2018, cumulative FDI inflows in India from China stood at US$ 2 billion (0.5% of India’s total FDI inflows). Indian banks in China include, among others, State Bank of India, Bank of India, Punjab National Bank, Canara Bank, ICICI Bank, Bank of Baroda, Allahabad Bank, UCO Bank, Indian Overseas Bank and Union Bank of India. Some of the Chinese companies present in India include, among others, State-owned companies like Sinosteel, Shougang International, Baoshan Iron & Steel Ltd, Sany Heavy Industry Ltd, Chongqing Lifan Industry Ltd, China
Dongfang International and SinoHydro Corporation. Chinese private sector companies in India include, among others, Huawei Technologies, ZTE, TCL, Haier and BBK Electronics Corporation.
OTHER AREAS OF COOPERATIOn
The economic and commercial relations between the two countries are facilitated through various dialogue mechanism such as Joint Economic Group, Strategic Economic Dialogues, the NITI Ayog and the Development Research Center Dialogue and the Financial Dialogue. Some of the other institutionalized dialogue mechanisms between the two countries include the Joint Working Group (JWG) on Trade, JWG on Collaboration in Skill Development and Vocational Education, JWG on Information and Communication Technology & High-Technology, Joint Study Group and Joint Task Force on Regional Trading Agreement (RTA), India-China Joint Working Group on Agriculture, India-China Joint Working Group on Cooperation in Energy and the Joint Study Group on BCIM Economic Corridor.
41.9 42.4
57.6
73.4 65.8 65.9
72.3 70.7 71.5
89.6
-23.1 -19.2 -29.3
-37.2 -38.7 -36.2 -48.5 -52.7 -51.1
-62.9
2008-09 2009-10 2010-11 2011-12 2012-13 2013-14 2014-15 2015-16 2016-17 2017-18US$
Bill
ion
India's Exports to China India's Import from China
Total Trade Trade Balance
India’s Bilateral Trade with China
Source: Ministry of Commerce and Industry, GoI; Exim Bank Analysis

6 Investments in Latin America and Caribbean
The Latin America and Caribbean (LAC) region is home to around 637.7 million people with a combined GDP of US$ 4.9 trillion. This region has made significant economic progress in the last few decades. The region’s GDP per capita (in PPP terms) increased more than threefold from US$ 4,565 in 1980 to US$ 15,649 in 2017. The LAC region has a young, educated and skilled workforce, and is considered a top investment destination due to its growing industrial and manufacturing strength, and continuous improvements in the ease of doing business parameters. It is also endowed with rich reserves of agricultural and natural resources like oil, silver, gold, copper, coal, bauxite, lithium and nickel, besides others.
The FDI inflows into the LAC region have grown by 29% to reach US$ 151 billion in 2017 from US$ 117 billion in 2007, and are projected to be around US$ 140 billion in 2018. The region has witnessed a moderation in FDI inflows in last few years due to a slowdown in economic activity, weak commodity prices and higher exchange rate volatility. LAC has absorbed cumulative investments of US$ 1.7 trillion during the period 2007 to 2017, and therefore, remains an important destination for global investments flows.
In terms of capital inflows, Mexico was the largest recipient of the investment inflows in the LAC region in 2017, absorbing nearly 40% of the total capital investment inflows during the year, followed by Brazil, which absorbed 15% of the total capital investment inflows. Other major capital investment recipients in LAC were- Peru (7%), Uruguay (6%), and Chile (6%).
With regards to sectors attracting largest investments in the LAC region, communications remained the biggest capital investment attracting sector
with a share of 14.4% in the total capital investment inflows. It was followed by alternative and renewable energy (12.2%), metals (9.6%), coal, oil and natural gas (6.9%), and paper, printing and packaging (6.7%).
During the period 2007 to 2017, the US has emerged as the biggest sources of investments in the LAC region, cumulatively. The FDIs from US amounted to US$ 239.3 billion, which is a little over one-fifth of total FDI inflows in the LAC region. The US is followed by Spain (with FDIs of US$ 121.1 billion), and Germany (US$ 64.5 billion). The top 10 investors are dominated by developed countries, with recent emergence of Asian countries like China, which is now the 9th largest investor in the region, with cumulative investments worth US$ 46.7 billion and a share of 4%; and India which is now the 22nd largest investor in the region with cumulative investments of around US$ 8.4 billion and a share of 1%.
IndIAn InvESTMEnTS In LAC REgIOn
India’s partnership with LAC is in the growing stage. During the period April 1996 to March 2011, India’s Outward FDI (OFDI) to LAC region,
cumulatively stood at US$ 6.3 billion, which accounted for 4.7% of the total OFDIs originating from India during the period. Indian OFDI, which stood at US$ 3.8 billion in 2011-12, grew by 21% to reach US$ 4.6 billion, in 2013-14 and declined thereafter and stood at US$ 622.1 million in 2017-18 (Figure 1), mainly reflecting fall in OFDI to British Virgin Islands and Cayman Islands (top destinations for Indian FDIs). Sectoral composition of these investments have been tilted towards agriculture & mining sector, with a substantial share of 78.2% in 2015-16, followed by manufacturing (9%).
During the period April 2011 to November 2017, the British Virgin Island was the largest destination of India’s OFDI in LAC region attracting 45.9% of Indian investments, followed by Cayman Island (32.9%), Panama (13.8%), Bermuda (3.4%), and Brazil (1.5%).
Sectors l ike communications, automotive, alternative / renewable energy, metals, business services, financial services, food and tobacco, and hydrocarbons, among others, present opportunities for the Indian investors for enhancing investments in the LAC region.
2011-12 2012-13 2013-14 2014-15 2015-16 2016-17 2017-18
3827.3
2840.1
4631.9
1134.8 1117.1 930.4
622.1
US$
Mill
ion
Figure 1: India’s OFdI to LAC
Source: RBI; Exim Bank Analysis
Steel Industry

7Steel Industry
BACkgROUnd
The Steel Industry of India is one of the vital sectors of the Indian economy. The steel sector contributes over 2% to India’s GDP. According to the World Steel Association, the global crude steel production was registered at 1689 MT in 2017, with China producing almost 50% of the world crude steel. India is the third largest producer of the crude steel in the world, producing almost 6% of the global crude steel in 2017.
IndIAn SCEnARIO
The Indian steel industry recorded a milestone performance with its crude steel production crossing the 100 MT mark for the first time. In 2017-18, the production of crude steel was registered at 102.3 MT, a growth of 4.5% compared to the last year. The crude steel capacity of India reached 134.6 MT, a growth of 5%, with a capacity utilization rate of 76% during the year. While the top 6 steel players in the Indian market produced 59.4 MT in 2017-18 and registered a growth of 6.1% over 2016-17, other players produced 42.9 MT in 2017-18, registering a lower growth of 1.1%, during the same period.
During 2017-18, production for sale stood at 104.9 MT, witnessing a growth of 3.1% over 2016-17, in which contribution of the non-alloy steel segment stood at 94.8 MT and the rest being from alloy steel segment, which registered a significant 20.7% growth. In 2017-18, consumption of total finished steel stood at 90.7 MT, a growth of 7.9% vis-à-vis the year 2016-17.
TRADEIndia’s total trade in steel increased from 11.5 MT in 2013-14 to 17.0 MT in 2017-18, registering an average annual growth of 10.9%. During this
period, while India’s imports recorded an average growth of 14.8%, annually, India’s exports registered a growth of 20.9%. The trade deficit in the steel trade fell to as low as (-) 7.6 MT in 2015-16, before reaching a surplus of 2.2 MT in 2017-18.
IMPACT OF US TARIFF IMPOSITIOn
With effect from March 23, 2018, the US introduced levies on imports of two commodities - a 25% tariff on some articles of steel and a 10% tariff on some articles of aluminium. As far as impact on India is concerned, though India is a significant producer and consumer of both metals, it does not have a significant share in the export market, especially in USA. For instance, India’s share in imports of articles of steel by the US is only 1.6% and 2.2% in case of aluminium articles. Thus, the impact on India due to the imposition of US’ tariffs might appear to be low.
However, US share in India’s exports of steel articles was recorded at 18.1% in 2017 and it was the second largest for these articles from India. In 2013, 2014 and 2015, the US was the top destination for Indian exports of these articles. Similarly, the share of US in
India’s export of aluminium articles was 13.5% in 2017, with the country being the second largest destination.
OuTLOOK
In an attempt to protect the domestic steel industry from cheaper imports, the Government had applied safeguard duty on some steel products in 2015 (which was extended till March 2018). At the same time the Union Cabinet approved the National Steel Policy (NSP) 2017 in order to create a globally competitive steel industry in India. NSP 2017 targets 300 million tonnes (MT) steel-making capacity and 160 kg per capita steel consumption by 2030. Additionally, several government initiatives focused on affordable housing, expansion of railway networks, development of domestic shipbuilding industry, opening up of defence sector for private participation, and the anticipated growth in the automobile sector, are expected to create significant demand for steel in the country. Albeit, the industry has been reeling under NPAs but there has been consolidation post settlements of dues through various means. This is expected to lead to better capacity utilisation, synergy improvement and economies of scale.
6.0 5.6 4.1
8.2 9.6
5.5
9.3 11.7
7.2 7.4
0.5 -3.7
-7.6
1.0
2.2
-10.0
-5.0
0.0
5.0
10.0
15.0
Values: US$ bn India’s Trade in Steel
2013-14 2014-15 2015-16 2016-17 2017-18
Source: Joint Plant Committee (JPC)
Exports Imports Trade Balance

8 India-Sri Lanka Bilateral Trade and Investment Relations
India and Sri Lanka have been connected by a legacy of cultural, religious and linguistic ties since the pre-colonial era. Over the years, this has evolved into a political and commercial bond through cooperation in the fields of development, education, culture and defence. Given its geographical proximity, strategic location in the Indian Ocean and natural resources, Sri Lanka has been one of the priority destinations for India’s trade and investments. Bilateral Economic ties have increased during 1990s with liberalisation routing into both the economies.
Consequently, over the last decade, India’s exports to Sri Lanka have increased to US$ 3.1 billion in 2017, up from US$ 2.8 billion in 2008. Similarly, India’s imports from Sri Lanka have also increased marginally to US$ 0.6 billion in 2017 from US$ 0.5 billion in 2008. India has maintained a trade surplus with Sri Lanka over the years, which stood at US$ 2.6 billion in 2017, up from US$ 2.3 billion in 2008 (Chart).
The major commodities exported by India to Sri Lanka during 2017 include petroleum products, which accounted for a share of 16.6 percent of India’s
total exports to Sri Lanka, followed by transport vehicles (12.5 percent), iron and steel (6.7 percent), cereals (5.2 percent), ships, boat and floating structures (4.9 percent), and cotton (4.9 percent), among others.
The major commodities imported from Sri Lanka in 2017 include coffee, tea and spices, which accounted for a share of 16.5 percent of India’s total imports from Sri Lanka, followed by aircraft, spacecraft and their parts (10.9 percent), residue from food industry & animal fodder (8 percent), edible fruits and nuts (7.4 percent), wood pulp (4.8 percent) and electrical machinery and equipment (4 percent), among others.
BILATERAL InvESTMEnT BETWEEn INDIA AND SRI LANKA
India and Sri Lanka signed a Bilateral Investment Promotion and Protection Agreement (BIPPA) on January 22, 1997, which came into force on February 13, 1998. According to data from the Ministry of Finance, Government of India (GOI) and the Reserve Bank of India (RBI), India’s approved cumulative investments in Sri Lanka during April 1996 to March 2018 amounted to US$ 1.5 billion.
According to fDi Markets database, India has emerged as the largest investor in Sri Lanka during 2007 to 2016 with US$ 5.3 billion investments in 61 FDI projects, resulting in creation of 14,196 jobs. It accounts for 30.7 percent of total investments made in Sri Lanka during this period. Coal, oil and natural gas received the highest investment which amounted to US$ 1.9 billion, followed by real estate (US$ 1.2 billion), financial services (US$ 0.6 billion), hotels & tourism (US$ 0.5 billion) and automotive OEMs (US$ 0.2 billion) during this period. Some of the Indian companies that have invested in Sri Lanka include Indian Oil Corporation (IOC), NTPC Ltd. (National Thermal Power Corporation Ltd.), Mahindra & Mahindra (M&M), ITC, Bharti Airtel, Life Insurance Corporation of India Ltd. (LIC), MRF Lanka, TVS Group, Ambuja Cement, among others. Some Indian banks present in Sri Lanka include State Bank of India (SBI), Indian Overseas Bank (IOB), Indian Bank, ICICI Bank and Axis Bank. Lanka LIC, a subsidiary of LIC of India, is also operating in Sri Lanka in the insurance sector.
Similarly, Sri Lanka has invested capital of amount US$ 0.6 billion in 15 greenfield projects in India during 2007 to 2016. The major sectors in which Sri Lanka has invested are transportation (US$ 360.6 million), financial services, textiles, and food and tobacco. Some of the Sri Lankan companies investing in India include CL Synergy, Bank of Ceylon, Fashion 365 Retail, Apexaura, Kandurata Umbrella Industries and Odel, among others. Bank of Ceylon is operating in India with its services limited only to commercial operations and catering primarily to Sri Lankans.
Chart : India’s Bilateral Trade with Sri Lanka (US$ Billion)
Source: ITC Trademap
0.0
1.0
2.0
3.0
4.0
5.0
6.0
7.0
2008 2009 2010 2011 2012 2013 2014 2015 2016 2017
2.8
1.7
3.3
4.53.8
4.8
6.4
5.5
4.1
3.1
2.6
5.8
2.3
0.5 0.3 0.5 0.7 0.7 0.5 0.6 0.8 0.6 0.6
India's Exports to Sri Lanka India's Imports from Sri Lanka Trade Balance

9Exim Bank’s Lines of Credit
Exim Bank of India (Exim Bank) has placed special emphasis on extension of Lines of Credit (LOCs) as an effective market entry mechanism with particular focus on small and medium enterprises. Exim Bank’s LOCs provides a risk-free, non-recourse export financing option to the Indian exporting community, which helps them penetrate new markets and enhance their export volumes in the existing markets overseas. Exim Bank extends LOCs to overseas financial institutions, regional development banks, sovereign governments and other entities overseas, to enable buyers in those countries to import developmental and infrastructural projects, equipment, goods and services from India, on deferred credit terms. Exim Bank also extends LOCs with the support of Government of India (GOI). Under the Lines of Credit extended with the support of Government of India, Exim Bank reimburses 100 percent of contract value to the Indian exporters, upfront upon the shipment of goods and at least 75 percent of goods and services of total contract value should be sourced from India. LOCs have also enabled India to demonstrate project execution capabilities in the emerging markets. LOCs have helped to gather considerable momentum in the recent years, especially in the developing countries of Africa, Asia, Latin America, Oceania and the CIS. The Bank has now in place 234 Lines of Credit, covering over 62 countries in Africa, Asia, Latin America, Oceania and the CIS, with credit commitments of over US$ 22.79 billion, available for financing exports from India. LOCs are thus an effective instrument for promoting and facilitating India’s exports of projects, goods and services to developing countries.
Exim Bank, with the support of Government of India, has signed six LOCs as given below during the period April-June 2018:
(i) An LOC of US$ 66.6 million was extended to the Government of Rwanda for Base-Butero-Kidaho road project in Rwanda. With the above LOC, Exim
Bank, till date, has extended five LOCs to Rwanda, with the support of GOI, taking the total value of LOCs extended to US$ 347.65 million. The earlier LOCs extended to Government of Rwanda were for financing Nyaborongo Hydro-power project, Export Targeted Modern Irrigated Agricultural Project and Establishment of 10 Vocational Training Centres and business incubation centres in Rwanda.
(ii) An LOC of US$ 500 million was extended to the Government of Tanzania for Water Supply schemes in 17 towns in Tanzania. With the above LOC, Exim Bank, till date, has extended six LOCs to Tanzania, with the support of GOI, taking the total value of LOCs to US$ 1.12 billion. The earlier LOCs were extended for export of tractors, pumps and equipments from India, Financing the purchase of vehicles, Water supply schemes to Dar-es-Salaam, Extension of Lake Victoria Pipeline to Tabora, Igunga and Nzega and Rehabilitation and improvement of water supply system in Zanzibar.
(iii) Two LOCs of US$ 70 million and US$ 90.3 million were extended to the Government of Cuba for setting up a 51 MW wind energy farm and establishment of a 50 MW Co-generation power plant in Cuba respectively. With the above LOCs, Exim Bank, till date, has extended five LOCs to Cuba, with the support of GOI, taking the total value of LOCs to US$ 173.06 million. The earlier LOCs were extended for Milk Powder Processing Plant, Bulk Blending Fertilizer Plant and Modernization of an Injectable products plant in Cuba.
(iv) Two LOCs of US$ 3.5 million and US$ 27.5 million were extended to the Government of Suriname for Servicing and maintenance of 3 Chetak Helicopters and Up-gradation of Transmission Network Infrastructure & Power Generation in Suriname respectively. With the above LOCs, Exim Bank, till date, has extended seven LOCs to Suriname, with the support of GOI, taking the total value of LOCs extended
to US$ 78.05 million. The earlier LOCs extended to Suriname were for Water Supply Project, Supply of crash fire tenders and Purchase of helicopters in Suriname.
For further information, please contactNadeem Panjetan Chief General Manager Export-Import Bank of India, Ground floor, Statesman House,148 Barakhamba Road,New Delhi-110001 Telephone: (011) 23474851 Fax: (011) 23322758[E-mail: [email protected]]
Success Story: Mozambique
Exim Bank extended an LOC of USD 19.72 mn to the Government of Mozambique for Rural Drinking Water Development Project in Mozambique. The project has increased the rural water coverage of the respective provinces from 30% to 50%. The Project has impacted lives of 824,500 people directly benefitting from gaining improved access to clean water. Clean water sources have helped local community in combating water borne diseases such as cholera, chronic diarrhea and improved their standards in health, hygiene and sanitation.

10
ExIM BAnk’S STUdy TITLEd ‘TRAdE In EnvIROnMEnTAL gOOdS: A PERSPECTIvE’
Exim Bank has published a study entitled ‘Trade in Environmental Goods: A Perspective.’ The Study analyses the trade pattern in goods that have been identified as Environmental Goods by various country groupings. The Study traces the timeline of the various discussions related to Environmental Goods at the WTO’s Committee on Trade and Environment Special Session (CTESS), since the Doha Ministerial Conference, 2001. The Study discusses the approaches put forward by various nations, including the United States and China (List Approach); India and Argentina (Environmental Project Approach and Integrated Approach) and Brazil (Request and Offer Approach). The Study observes that India has a relatively low share in exports of Environmental Goods as agreed upon by the APEC members (the APEC List). Environmental Goofs categories such as ‘Renewable Energy Plant’ and ‘Management of Solid and Hazardous Waste and Recycling Systems’ together accounted for more than half of India’s total exports of US$ 3.1 billion of such goods during 2015.
ExIM BAnk’S COnCEPT On TRAdE FInAnCE RATIFIEd dURIng CHOgM
An idea mooted by the Exim Bank was formalized during the recently concluded Commonwealth Heads of Government Meeting (CHOGM) in London. The Commonwealth Small States Trade Finance Facility (CSSTFF), conceptualized by Exim Bank, was signed during CHOGM-2018, which was also attended by the Hon’ble Prime Minister of India. CSSTFF is expected to substantially increase the availability of short-term credit (trade finance) for the Commonwealth member states which are mostly dependent
on imports. Of the 53 Commonwealth member countries, 31 are small island states mainly in the Caribbean and the Pacific region. These island states lack scale and are not self-sufficient economies, needing to import most items including consumables. With the heightened risk perception on banks since the financial crisis, especially small banks in developing countries, and the Basel regulations on capital requirements, trade finance has become scarce. The CSSTFF addresses this constraint to ensure that trade flows are not hindered to these small island states. The Commonwealth Secretariat, London, had appointed Exim Bank to prepare a pre-feasibility report for setting up of a trade finance facility. Based on the recommendations of Exim Bank, the Commonwealth Secretariat constituted a Working Group comprising Exim Bank, International Finance Corporation-Washington and the Central Bank of Malta (the facility was to be housed in Malta).
ExIM BAnk’S STUdy TITLEd ‘EnHAnCIng IndIA’S EngAgEMEnT In HEALTHCARE SECTOR OF CLMv COUnTRIES’ RELEASEd
Exim Bank’s study titled ‘Enhancing India’s Engagement in Healthcare Sector of CLMV Countries’ was released by Shri Suresh Prabhu, Hon’ble Minister of Commerce & Industry, Government of India and H.E. HOR Namhong, Deputy Prime
Minister of the Kingdom of Cambodia during the Inaugural Session of the 5th India-CLMV Business Conclave held at Phnom Penh, Cambodia. Exim Bank’s study analyses the existing situation of the healthcare sector in the CLMV countries, the challenges in its development and strategies for improving the healthcare system in the region. The study notes that current healthcare infrastructure in the region is inadequate. The CLMV region has experienced an epidemiological transition in the recent years from communicable diseases to non-communicable diseases, requiring specialist hospitals to meet the requirements of the changing healthcare scenario in these economies. Insurance coverage is low in the region except for Vietnam, with high out of pocket expenditures on healthcare.
ExIM BAnk’S RELEASES STUdy TITLEd ‘ExPORT STRATEgy FOR MAdHyA PRAdESH’
Exim Bank has conducted a study on ‘Export Strategy for Madhya Pradesh’ for the Government of Madhya Pradesh (GoMP). The Study was released by the Hon’ble Minister of State, GoMP, Department of MSME, Shri Sanjay Satyendra Pathak, in the presence of Shri V.L. Kantha Rao, Principal Secretary, GoMP, Department of MSME. The Study maps the export potential of the State and identifies Strategies for export promotion from MP. Tracing the past export performance of the State, the Study observes the export registered an average annual growth of 1.7 percent between 2012-13 and 2016-17 to reach US$ 4.4 billion. This growth was higher than India’s overall exports, which recorded a decline during the same period.
The Quarter That Was Interest Rate Outlook

11
The key determinants for interest rates in an economy include the monetary policy of the Central Bank, prospects for economic growth, inflation, global liquidity and uncertainty.
INFLATION TRENDSRetail price inflation, measured by the Consumer Price Index (CPI), rose for the second consecutive month increasing to 4.9 percent in May 2018 from 4.6 percent in April 2018. Food inflation rose to 3.1 percent in May 2018 as compared to 2.8 percent in the previous month. The fuel & light group recorded a rise in inflation to 5.8 percent in May 2018 from 5.2 percent in the previous month.
The Reserve Bank of India (RBI) has revised upwards its projections for CPI inflation to 4.7 percent in the second half (H2) of 2018-19, from the earlier projection of 4.4 percent in H2 of 2018-19. One of the main factors which has contributed to this revision is the steep rise in crude oil prices.
ECOnOMIC gROWTHIndia’s real gross value added (GVA) increased by 6.5 percent in 2017-18, as compared to 7.1 percent in 2016-17. The services sector witnessed an acceleration in growth. Agriculture sector, on the other hand, witnessed a moderation in growth from 6.3 percent in 2016-17 to 3.4 percent in 2017-18. There was a sharp fall in the growth of mining activity from 13.0 percent to 2.9 percent, manufacturing from 7.9 to 5.7 percent and electricity from 9.2 to 7.2 percent. The construction sector reported a significant jump in its growth to 5.7 percent growth during the year, from 1.3 percent growth in 2016-17. The RBI expects India’s economy to grow by 7.4 percent in 2018-19, supported by robust investment activity following the improvement in capacity utilisation and credit offtake. It further expects the buoyant global demand to encourage exports and provide a further boost to investment. Even
Interest Rate Outlook
though RBI expects sharp rise in prices of petroleum products which is likely to adversely impact disposable incomes, it expects rural and urban consumption to remain healthy.
Agriculture and Rural Incomes: As per Third Advance Estimates for 2017-18, released by the Department of Agriculture, Cooperation & Farmers Welfare, total food grains production in the country is estimated at 279.51 million tonnes, which is 1.6 percent higher than the previous year’s.
Industrial Production: Industrial activity, as measured by the Index of Industrial Production (IIP), was 4.9 percent higher during April 2018 as compared to that of the previous year. Manufacturing output expanded by 5.2 percent in April 2018. In terms of industries, 15 out of the 23 industry groups in the manufacturing sector showed positive growths during the month of March 2018 as compared to the year ago period.
Private Consumption: Private Consumption, which is the largest component of India’s GDP, grew by 6.7 percent during 2017-18. Consumer sentiments as evinced by the BSE-CMIE-UMich index improved for the third consecutive month in May 2018.
Investments: According to CMIE’s CapEx database, 2,496 new projects were announced in 2017-18 with investments of ` 6.6 trillion. These were lower by 52 percent in value terms as compared to 2016-17. Investments stalled because business conditions were tepid. As per the early results of the RBI’s April-June round of the industrial outlook survey, activity in the manufacturing sector is expected to moderate marginally in the second quarter of 2018-19 on account of deterioration in the overall business situation and order book.
gLOBAL LIQUIdITyOn account of improving real economic data, and continued strong labour market gains, the Federal Open
Market Committee (FOMC) increased the federal funds rate by 25 bps to a target range of 1.75–2.00 percent in June 2018. With the US Fed hikes, global liquidity is expected to be impacted, and is expected to result in a reallocation of funds. In the past, India benefited tremendously from foreign capital attracted by the interest rate differential between India and the US. A steady increase in rates in the US is expected to raise the borrowing costs for carry trade and reduce risk adjusted returns investors receive from India, thus making it less attractive for foreign investors.
RBI MOnETARy POLICy
In the Second Bi-monthly Monetary Policy Statement 2018-19, the Monetary Policy Committee hiked the policy repo rate under the liquidity adjustment facility by 25 basis points to 6.25 percent. On account of the steady rise in rates in the US, domestic interest rates are likely to go up to stem capital outflows and the ensuing pressure on the rupee. Increase in fed rate, coupled with escalating trade tensions and macroeconomic concerns is already affecting foreign institutional investments in India. According to Bloomberg, overseas investors sold equity worth nearly ` 6,000 crore and debt worth over ` 41,000 crore so far in 2018, the worst outflow since 2009.
OuTLOOK
Inflation is expected to remain moderate in 2018-19. Economic activity is expected to accelerate on account of strong private consumption, recovery in exports and infrastructure investment. Capital flows are reducing due to the increase in US Fed rate and macroeconomic uncertainty, putting pressure on the rupee. Given these developments, especially increased inflation pressure stoked by higher oil prices, RBI is expected to further increase the repo rate, going forward.

12
SEMINARS & WORKShOPS ORgAnISEd By ExIMIUS CEnTRE FOR LEARnIngExim Bank partnered with several industry associations to organise seminars and workshops in various cities in India. Exim Bank in association with ASSOCHAM organised national conferences on ‘Role of Trade Finance for Inclusive Growth’ in Kolkata, Ahmedabad and New Delhi. An Export Clinic was organised in partnership with CII in Coimbatore for the benefit of exporter community in the region. World Trade Centre (Mumbai) and Exim Bank jointly organised a series of seminars in Maharashtra on the theme of ‘Opportunities for MSMEs in Export Market’ marking the World Trade Day. These seminars were organised in Nashik, Ahmednagar, Kolhapur, Ichalkaranji and Nagpur, and were mainly focussed on building export capability of MSMEs in the region. Exim Bank also organised a seminar along with Asian Development Bank (ADB) on ‘Business Opportunities in ADB-funded Projects’ in Kolkata.
To capitalise on the potential of exports from Punjab, Exim Bank, in association with Federation of Indian Exporters Organisation (FIEO), organised an interactive meeting on ‘Trade & Business Opportunities’ in Jalandhar. Jalandhar is one of the major industrial centres of Punjab and contributed ` 2265.5 crores from exports in 2016-17. The city is a sports goods manufacturing hub and is the largest exporter of sports goods in Asia. Speakers from the Industries Ministry, Government of Punjab, Taxation Department, ECGC Ltd., Directorate General of Foreign Trade and Exim Bank shared their insights with the audience comprising of traders, businessmen and manufacturers from Punjab.
To participate in seminars & workshops organised by Exim Bank, visit our website to register: www.eximbankindia.in/upcoming-events.
ACTIvITIES OF MARkETIng AdvISORy SERvICESExim Bank in association with the Bamboo and Cane Development Institute, Agartala and the North East Handicrafts, Assam, recently organized a design development and technical training workshop for bamboo and cane craftsmen in the Barpeta district of Assam. The objective of the workshop was to enable the craftsmen to design new products for both domestic and international markets.The workshop provided a significant opportunity for artisans to receive information on methods of treatment of raw materials and innovative ideas for development of new products with a wider appeal. The workshop was conducted for a month at a facility set-up by Mr. Manendra Deka, National Awardee in bamboo craft, in Barpeta. A total of 200 prototypes were developed during the programme, which were appreciated by the Regional Director (North Eastern Region), Office of Development Commissioner (Handicrafts) and District Commissioner of Barpeta.In another intervention, the Bank supported Sanganer Block Printing in Rajasthan, in association with an e-commerce company. The training programme was organized for 10 artisans in Sanganer, Rajasthan, with the objective to create an exquisite collection, highlighting the artistic nature of the products. The design input and skill development training was provided by senior designers of the e-commerce company. The participants (master craftsmen and weavers) prepared sample prototypes during the programme, based on which more products will be developed which be available for sale on the e-commerce platform, therefore, providing a market opportunity for the artisans.Exim Bank, through its Marketing Advisory Services, plays a promotional role to create and enhance export capabilities and international competitiveness of Indian companies. Exim Bank assists in identification of opportunities overseas and seeks to help Indian exporting firms in their globalization efforts by proactively assisting in locating overseas distributors / buyers / partners for their products and services. The Bank extends support and promotes grassroots enterprises by providing specific interventions such as assistance in skill development, product development and export readiness.For further information, please contact: [email protected]
nEW InITIATIvEExim Bank based on its internal Export Leading Index Model, forecasts India’s total merchandise exports to witness a growth rate of 10.6 percent and non-oil exports to witness a growth rate of 6 percent during the first quarter of 2018-19 viz. April-June 2018, over the corresponding quarter of the previous year. The forecasts are based on Exim Bank’s Export Leading Index (ELI) model, which witnessed an underlying growth of 7.5% for total merchandise exports and 7.3% for non-oil exports. Forecast of growth in India’s total merchandise exports and non-oil exports would continue to be released on a quarterly basis, during the first week of the months of June, September, December, and March for the corresponding quarters, with continuous improvisation to the model. The next growth forecasts for India’s exports for the quarter July-September 2018 would be released during the first week of September 2018.The model and the forecast results have been reviewed by a standing technical committee of domain experts comprising Professor Saikat Sinha Roy, Professor & Coordinator, Centre for Advanced Studies, Department of Economics, Jadavpur University, Kolkata; Dr. Sarat Dhal, Director, Department of Economic and Policy Research, Reserve Bank of India, Kolkata; Professor N. R. Bhanumurthy, Professor, National Institute of Public Finance and Policy (NIPFP), New Delhi; and Professor C. Veeramani, Professor, Indira Gandhi Institute of Development Research (IGIDR), Mumbai.As part of its continued research initiatives, Exim Bank has developed an in-house model to generate an ELI for India to track and forecast the movement in India’s exports on a quarterly basis. The ELI gauges the outlook for the country’s exports and is essentially developed as a leading indicator to forecast growth in total merchandise and non-oil exports of the country, on a quarterly basis, based on several external and domestic factors that could impact exports of the country.
Exim Bank’s Activities
ACTIvITIES OF ExIMIUS CEnTRE FOR LEARnIng

13
EThIOPIAEthiopia’s real GDP growth grew by an estimated 9.1% in 2017 up from 7.6% in 2016, owing to improvement in agriculture sector driven by public investments. The average consumer price inflation was seen at 9.8% in 2017, up from 7.3% in 2016, driven by devaluation of currency in late-2017, coupled with continued pressures arising from drought and rising international fuel prices. Birr (local currency of Ethiopia) depreciated from an average of Birr 21.73: US$ 1 in 2016 to Birr 23.95: US$ 1 in 2017, as a result of devaluation of the Birr by 15% relative to the U.S. dollar in October 2017, by the National Bank of Ethiopia (NBE), for reducing overvaluation and enhancing export competitiveness. Ethiopia’s current account deficit widened slightly, in absolute terms, to an estimated US$ 8.4 billion (11.4% of the GDP) in 2017, as compared to US$ 8.3 billion (11.8% of the GDP) in 2016. Ethiopia’s real GDP growth is forecast to ease to 7.6% in 2018, and further down to 7.1% in 2019, amidst potential constraints in the agriculture expansion including the preponderance of smallholder farmers and continued low productivity. The Birr will continue to be managed closely by the central bank, and the pattern of depreciation is likely to continue. The currency is, thus, forecast to weaken to Birr 27.75:US$1 in 2018, and further to Birr 28.95:US$ 1 in 2019. The current account deficit is also likely to widen in 2018 to US$ 9.3 billion (12.8% of GDP), mainly owing to large trade deficit arising from rising imports, driven by high demand for capital goods—particularly inputs for the expanding manufacturing sector.
IRANIran’s real GDP growth eased to an estimated 3.5% in 2017, as compared to 13.4% recorded in 2016, as the impact of previous year’s boost in oil production and exports dissipated. The average consumer price inflation increased to 10% in 2017 from 8.7% in the previous year, reflecting higher food prices and gradually rising demand. The local currency of Iran (Iranian rial) is estimated
Country Scan
to have depreciated to an estimated IR 33,226: US$ 1 in 2017 from IR 30,915: US$ 1 in 2016, and the current account surplus increased to an estimated US$ 18 billion (4.1% of GDP) in 2017 compared to US$ 16.4 billion (3.9% of GDP) in 2016. With US secondary sanctions expected to be reintroduced over the course of the next six months (between August and November, 2018), Iran is likely to experience a number of major constraints on economic growth led by reduction in Iran’s oil exports, as well as a likely deterioration in investor and consumer sentiments. Consequently, real GDP growth is expected to moderate further to 1.9% in 2018, and further down to -2.6% in 2019. The official exchange rate is expected to depreciate averaging to IR 40,536: US$ 1 in 2018, and further to IR 49,454: US$ 1 in 2019, as confidence in the rial collapses further due to the speculation over the nuclear deal’s longevity. However, a likely combination of high oil prices as compared to the previous two years, and much lower imports as both consumption and investment-driven demand declines, is expected to maintain the trade surplus in 2018 and 2019. Consequently, the current account is expected to remain in surplus, averaging at US$ 25.2 billion (6% of GDP) in 2018.
SAuDI ARABIA
Real GDP of Saudi Arabia contracted by 0.7% in 2017, driven by OPEC oil production cuts as compared to a growth of 1.7% in 2016. Consumer price inflation was seen at -0.8% in 2017, down from a positive inflation growth of 2.9% in 2016. The local currency of Saudi Arabia, the Saudi riyal (SR), is pegged to the US dollar at SR 3.75: US$ 1. Current account balance of Saudi Arabia improved from a deficit of US$ 23.8 billion (3.7% of GDP) in 2016 to surplus of US$ 15.3 billion (2.2% of GDP) in 2017. Saudi Arabia’s real GDP is expected to return to a positive growth rate of 1% in 2018, largely supported by non-oil activity, such as in services and manufacturing, as the rate of hiring in the non-oil sector is picking up pace, and investor confidence
is recovering, as a likely result of higher oil prices, which remain the underlying driver of the economy. Inflation in 2018 is expected to rise to an average of 4.4%, reflecting the impact of fresh fuel and electricity subsidy cuts, which will have knock-on effects on the general price level, and, more importantly, the recent introduction of VAT. The current account is likely to remain in surplus in 2018 at 7% of GDP, buttressed by gently expanding oil production and rising export volumes of aluminium, phosphates and petrochemicals.
TURkEyReal GDP of Turkey grew by an estimated 7% in 2017, as compared to 3.3% in 2016, supported by government stimulus measures, government credit guarantees, political pressure on banks to extend credit and a pickup in global demand. Consumer price inflation of Turkey increased to 11.1% in 2017 (well above the Central Bank medium term target of 5%), from 7.8% in the previous year, resulting from weakening of its local currency, the Turkish Lira (TL), which depreciated to TL 3.6:US$ 1 in 2017, from TL 3.0: US$ 1 in 2016. The current account deficit also widened to US$ 42.4 billion in 2017 (5.0% of GDP) from US$ 32.6 billion (3.8% of GDP) in 2016. Turkey’s real GDP growth is expected to ease to 4.2% in 2018, reflecting the impact of tax increases, higher interest rates, the withdrawal of government stimulus measures introduced to support the economy after the coup attempt in July 2016 and a gradual tightening of global liquidity. The pace of depreciation of the Lira is expected to slow during 2018, keeping the currency broadly stable in real terms. On an average, the Lira is expected to depreciate to TL 3.845: US$ 1 in 2018. Current account deficit during 2018 is expected to narrow slightly to 4.7% of GDP, as a weaker Lira and the lifting of Russian sanctions are expected to boost Turkey’s main exports. However, Turkey’s external financing needs would still be difficult to meet if global liquidity is constrained and investor confidence deteriorates.

14
SWISS FRAnC
The Swiss franc weakened to the symbolic level of 1.20 versus the euro earlier this year before strengthening again in recent weeks to trade at around 1.155.
During June, the Swiss franc weakened nearly 0.3 percent to 1.162 against the euro after voters in Switzerland rejected plan to transform Switzerland’s financial landscape by barring commercial banks from electronically creating money when they lend. The Swiss National Bank had opposed the initiative, which would have made it the only authority allowed to create new money in Switzerland, saying it would limit its ability to conduct monetary policy.
Analysts had argued an acceptance of the initiative could have triggered renewed upward pressure on the franc as speculators bet against the SNB’s weakened ability to intervene in the currency markets. The SNB acknowledged the result, saying adoption of the initiative would have made it much harder to control inflation in Switzerland.
uS DOLLAR
The US dollar retains a firm undertone and has rather out performed relative to expectations over the past quarter. The currency weakened steadily through late 2017 and into early 2018 amid fears over dysfunction in Washington and a growing appreciation among investors for the improving fundamental prospects outside of the USA. The US dollar’s recent rebound has been quite abrupt, however, driven by position-adjustment initially but fuelled more
recently by a jolt of political concerns in Europe and the ongoing focus on trade discussions between the US and its major trading partners.
The US dollar’s share of currency reserves reported to the International Monetary Fund fell in first quarter of 2018 to a fresh four-year low. The share of dollar reserves shrank for five consecutive quarters as the greenback weakened in the first three months of 2018 on expectations faster growth outside the United States and bets that other major central banks would consider reducing stimulus. Still the dollar has remained the biggest reserve currency by far.
However, the dollar strengthened in the second quarter on fears about a global trade war and the European Central Bank signalling it would not raise interest rates until latter half of 2019.
During June 2018, the Dollar index (the index that tracks the greenback against the euro, yen, sterling and three other currencies), reached 95.31, the highest since last July last year.
Data on June 29, 2018 showed so-called core personal consumption expenditures (PCE) price index, the Fed’s preferred gauge of US inflation, rose 2.0 percent from a year earlier, the biggest gain since April 2012. That kept alive expectations that the Fed will raise rates at least once and possibly twice by the end of year. Yet investors are also becoming wary of possible disruptions
from the trade disputes triggered by US President Donald Trump’s protectionist “America First” policy.
The US has also threatened to impose duties on up to $450 billion of Chinese imports, with the first $34 billion portion set to go into effect on July 6.
JAPAnESE yEn
The dollar extended gains against the Japanese currency to a high of 110.90 yen in June 2018. The Japanese currency was unmoved by the Bank of Japan’s tankan business sentiment survey, which showed a slight dip in big Japanese manufacturers’ sentiment.
The yen tends to benefit during geopolitical or financial stress as Japan is the world’s biggest creditor nation and there is an assumption that Japanese investors will repatriate funds should a crisis materialize.
The JPY may continue to attract temporary, safe-haven demand. Regional currency prospects continue to be clouded by geo-political and trade risks. However, rising interest rates and generally tighter monetary conditions do represent a clear and present threat to the more highly leveraged (current account deficit) economies, as economies have to compete more aggressively for funding and investors shift exposure to “safer”, surplus currencies which have tended to out-perform in recent months.
Currency Currents India’s Trade Performance

15India’s Trade Performance
INDICATORS 2011-12 2012-13 2013-14 2014-15 2015-16 2016-17 2017-18gdP (at current prices, US$ bn) 1874.3 1863.6 1919.4 2043.3 2147.2f 2271.0f 2585.0f
Real gdP growth (%) 6.7 5.5 6.4 7.5 8.0 7.1p 6.7f
Sectoral Share in gdP (%) Agriculture & allied activities 18.5 18.3 18.6 18.0 17.5 17.4re 17.1re
Industry 32.5 31.7 30.8 30.2 29.6 28.8 re 29.1re
Services 49.0 50.0 50.6 51.8 52.9 53.8 re 53.8re
Inflation rate (CPI, annual avg. %) 8.3 10.2 9.5 5.9 4.9 3.8 3.6 Inflation rate (WPI, annual avg. %) 8.9 7.4 6 2 -2.5 1.7 2.8 gross Fiscal deficit (% of gdP) 5.9 4.9 4.5 4.1 3.9 3.5e 3.5e
Exchange Rate (`/US$, avg.) 47.9 54.4 60.5 61.1 65.5 67.1 64.4 Exchange Rate (`/€, avg.) 65.9 70.1 81.2 77.5 72.3 73.6 72.1 Exports (US$ bn) 306 300.4 314.4 310.3 262.3 276.5 303.3 % change 22.5 -1.8 4.7 -1.3 -15.5 5.4 9.9^ Oil Exports (US$ bn) 56.7 60.9 63.2 56.7 30.6 31.6 37.4 % change 55.9 7.3 3.8 -10.2 -46.1 3.4 18.5^ non-oil Exports (US$ bn) 249.2 239.5 251.2 253.6 231.7 244.9 265.9 % change 16.8 -3.9 4.9 0.9 -8.6 5.7 8.7^Imports (US$ bn) 489.3 490.7 450.2 448 381 382.7 464.7 % change 32.3 0.3 -8.3 -0.5 -15 0.5 20.9^ Oil Imports (US$ bn) 155 164 164.8 138.3 82.9 86.9 108.6 % change 46.2 5.9 0.4 -16 -40 4.7 24.9^ Non-oil Imports (US$ bn) 334.3 326.7 285.4 309.7 298.1 295.9 356.1 % change 26.7 -2.3 -12.6 8.5 -3.8 -0.7 19.7^Trade Balance (US$ bn) -183.3 -190.3 -135.8 -137.7 -118.7 -106.2 -161.4 Services Exports (US$ bn) 140.9 145.7 151.8 158.1 154.3 163.1 195.1 Software Exports (US$ bn) 62.2 65.9 69.4 73.1 74.2 73.7 77.3Services Imports (US$ bn) 76.9 80.8 78.7 81.6 84.6 95.7 117.5 Services Balance (US$ bn) 64 64.9 73.1 76.5 69.7 67.4 77.6 Current Account Balance (US$ bn) -78.2 -87.8 -32.4 -26.8 -22.1 -15.2 -48.7 CAB as percentage of GDP (%) -4.2 -4.8 -1.7 -1.3 -1.1 -0.7 -1.9 Forex Reserves (US$ bn) 294.4 292 304.2 341.6 360.2 370 424.4 External debt (US$ bn) 360.8 409.4 446.2 474.7 484.8 471.3 529.7 External Debt to GDP Ratio (%) 20.5 22.3 23.9 23.2 23.4 20.2 20.5 Short Term Debt (US$ bn) 78.2 96.7 91.7 85.5 83.4 88 102.2 Short Term Debt / Total Debt (%) 21.7 23.6 20.5 18 17.2 18.6 19.3 Total Debt Service Ratio (%) 6 5.9 5.9 7.6 8.8 8.3 7.5 FdI (US$ bn) 46.6 34.3 36 45.1 55.6 60 61.0GDRs/ADRs (US$ bn) 0.6 0.2 0.02 1.3 0.4 - -FIIs (net) (US$ bn) 16.8 27.6 5 40.9 -4 7.7 22.2 FdI Outflows (US$ bn) 10.9 7.1 9.2 4 8.9 7 9.3
16
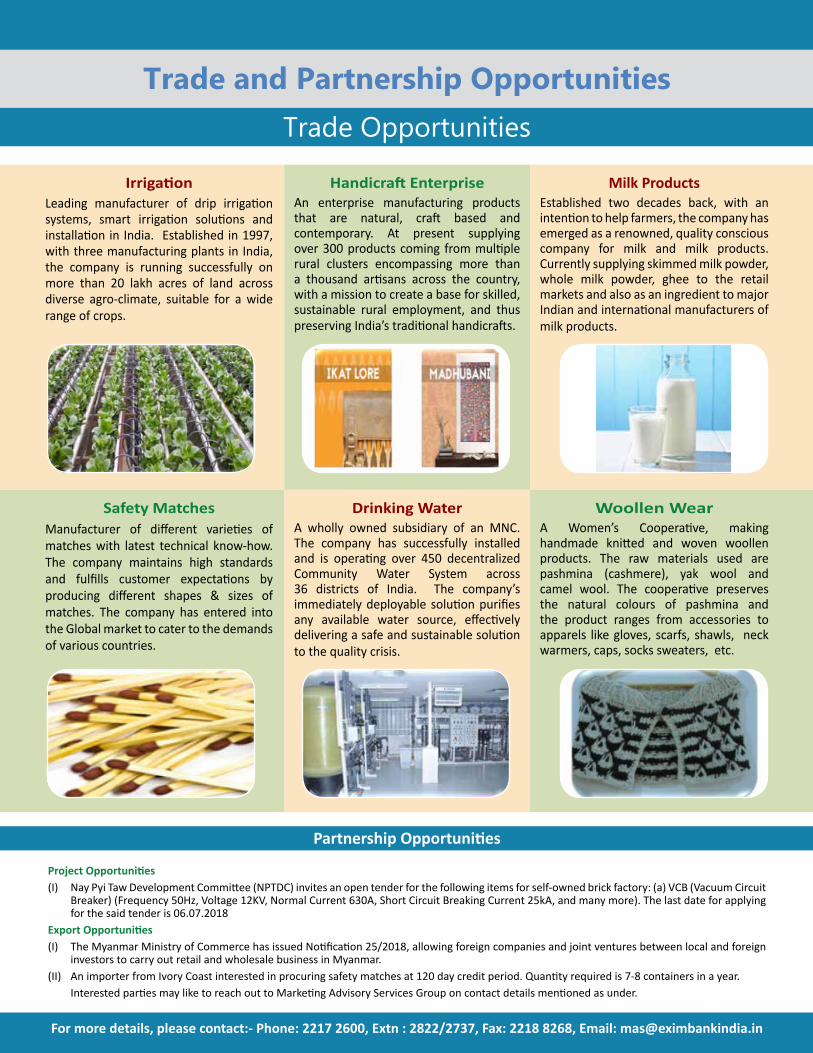
IrrigationLeading manufacturer of drip irrigation systems, smart irrigation solutions and installation in India. Established in 1997, with three manufacturing plants in India, the company is running successfully on more than 20 lakh acres of land across diverse agro-climate, suitable for a wide range of crops.
Handicraft EnterpriseAn enterprise manufacturing products that are natural, craft based and contemporary. At present supplying over 300 products coming from multiple rural clusters encompassing more than a thousand artisans across the country, with a mission to create a base for skilled, sustainable rural employment, and thus preserving India’s traditional handicrafts.
Milk Products Established two decades back, with an intention to help farmers, the company has emerged as a renowned, quality conscious company for milk and milk products. Currently supplying skimmed milk powder, whole milk powder, ghee to the retail markets and also as an ingredient to major Indian and international manufacturers of milk products.
Safety MatchesManufacturer of different varieties of matches with latest technical know-how. The company maintains high standards and fulfills customer expectations by producing different shapes & sizes of matches. The company has entered into the Global market to cater to the demands of various countries.
Drinking WaterA wholly owned subsidiary of an MNC. The company has successfully installed and is operating over 450 decentralized Community Water System across 36 districts of India. The company’s immediately deployable solution purifies any available water source, effectively delivering a safe and sustainable solution to the quality crisis.
Woollen WearA Women’s Cooperative, making handmade knitted and woven woollen products. The raw materials used are pashmina (cashmere), yak wool and camel wool. The cooperative preserves the natural colours of pashmina and the product ranges from accessories to apparels like gloves, scarfs, shawls, neck warmers, caps, socks sweaters, etc.
Partnership Opportunities
Project Opportunities(I) Nay Pyi Taw Development Committee (NPTDC) invites an open tender for the following items for self-owned brick factory: (a) VCB (Vacuum Circuit
Breaker) (Frequency 50Hz, Voltage 12KV, Normal Current 630A, Short Circuit Breaking Current 25kA, and many more). The last date for applying for the said tender is 06.07.2018
Export Opportunities(I) The Myanmar Ministry of Commerce has issued Notification 25/2018, allowing foreign companies and joint ventures between local and foreign
investors to carry out retail and wholesale business in Myanmar.(II) An importer from Ivory Coast interested in procuring safety matches at 120 day credit period. Quantity required is 7-8 containers in a year. Interested parties may like to reach out to Marketing Advisory Services Group on contact details mentioned as under.
For more details, please contact:- Phone: 2217 2600, Extn : 2822/2737, Fax: 2218 8268, Email: [email protected]
Trade and Partnership OpportunitiesTrade Opportunities