Embed Size (px)
Citation preview
How oilsands dEVEloPMEnT is rEsHaPing Canada’s EConoMy
NathaN Lemphers • DaN WoyNiLLoWicz
may 2012
In the Shadowof the Boom
In the Shadow of the Boom How oilsands development is reshaping Canada’s
economy
Nathan Lemphers and Dan Woynillowicz
May 2012
The Pembina Institute 2 In the Shadow of the Boom
In the Shadow of the Boom: How oilsands development is reshaping Canada’s economy Nathan Lemphers and Dan Woynillowicz May 2012 Communications management: Julia Kilpatrick Editor: Roberta Franchuk Contributors: Amy Taylor Cover design: Steven Cretney
©2012 The Pembina Foundation and The Pembina Institute
All rights reserved. Permission is granted to reproduce all or part of this publication for non-commercial purposes, as long as you cite the source.
Recommended citation: Lemphers, Nathan and Dan Woynillowicz. In the Shadow of the Boom: How oilsands development is reshaping Canada’s economy. The Pembina Institute, 2012.
This report was prepared by the Pembina Institute for the Pembina Foundation for Environmental Research and Education. The Pembina Foundation is a national registered charitable organization that enters into agreements with environmental research and education experts, such as the Pembina Institute, to deliver on its work.
ISBN 1-897390-33-5
The Pembina Institute Box 7558 Drayton Valley, Alberta Canada T7A 1S7 Phone: 780-542-6272 Email: [email protected]
Additional copies of this publication may be downloaded from the websites of the Pembina Foundation (www.pembinafoundation.org) or the Pembina Institute (www.pembina.org).
About the Pembina Institute The Pembina Institute is a national non-profit think tank that advances sustainable energy solutions through research, education, consulting and advocacy. It promotes environmental, social and economic sustainability in the public interest by developing practical solutions for communities, individuals, governments and businesses. The Pembina Institute provides policy research leadership and education on climate change, energy issues, green economics, energy efficiency and conservation, renewable energy, and environmental governance. Over the past 20 years the Pembina Institute has provided policy and technical solutions to address the issues of oilsands development, including participation in the regulatory review of oilsands projects, fee-for-service consulting for oilsands companies, policy research and analysis, and engagement in multistakeholder initiatives supporting oilsands policy, cumulative environmental impact management, and regional environmental monitoring. For more information about the Pembina Institute, visit www.pembina.org or contact [email protected].

The Pembina Institute 3 In the Shadow of the Boom
About the Authors Nathan Lemphers is a senior policy analyst in the Pembina Institute's oilsands program. Since 2009, Nathan has examined the topics of oilsands economics and environmental management. In particular, Nathan's research has examined the liability management of oilsands mines, the economics of the proposed Northern Gateway Pipeline, the macroeconomic effects of oilsands development and the transboundary environmental impacts of the oilsands. Beyond his policy-related work with the Institute, Nathan has contributed to private and public consulting projects on such topics as offshore oil and gas drilling regulations, wetlands policy, sustainable design and sustainability reporting. Nathan is also a frequent media spokesperson for the Institute on oilsands related
issues. Nathan holds a master's degree in city planning with a certificate in environmental planning and policy from the Massachusetts Institute of Technology. He also holds a bachelor of science in environmental and conservation sciences from the University of Alberta.
Dan Woynillowicz is the director of strategy and communications with the Pembina Institute, and is passionate about energy policy and politics. Dan joined the Institute in 2001 as a policy analyst and led the Institute’s oilsands program from 2003 through 2007. He has authored or contributed to numerous reports on environmental, climate change and economic policy related to oilsands development, including the Institute’s groundbreaking 2005 report, Oilsands Fever: The environmental implications of Canada’s oilsands rush. In addition to managing the Institute’s strategy and communications team, Dan collaborates with diverse stakeholders to advance policy change, testifies before regulatory and legislative bodies and is a frequent media commentator on energy issues. He holds a master’s degree in environment and management from Royal Roads University, where he conducted research on corporate climate change strategy as a Social Science and Humanities Research Council scholar. He also holds a bachelor of science in environmental science from the University of Calgary.
Acknowledgements The authors would like to thank the following Pembina Institute staff for their contributions to the research and review of this report: Devika Shah, Ed Whittingham, Jen Grant, Julia Kilpatrick, Katie Goplen, Lindsay Fischer, Marc Huot, Matt McCulloch, Randy Lucas, Roberta Franchuk, Simon Dyer, Steven Cretney and Taryn Mackenzie-Mohr.
Also, many thanks to the following reviewers for their valuable insights and sage guidance: Amy Taylor, Phillip Colmar and three anonymous reviewers.
Any errors contained in this report are the authors and do not reflect the views or endorsement of any of the reviewers.
The Pembina Institute 4 In the Shadow of the Boom
In the Shadow of the Boom How oilsands development is reshaping Canada’s
economy
Contents Executive summary .................................................................................................................... 7
1. Introduction ........................................................................................................................ 13
2. Rise of the oilsands........................................................................................................... 17 2.1 Increasing oil prices and oilsands production ............................................................... 17 2.2 An economic windfall .................................................................................................... 19
2.2.1 Gross domestic product ........................................................................................ 19 2.2.2 Public revenue — royalties and taxes ................................................................... 21 2.2.3 Employment .......................................................................................................... 23 2.2.4 Economic growth models ...................................................................................... 23
3. In the shadow of the boom ............................................................................................... 26 3.1 The rise and risks of a petro-loonie............................................................................... 26 3.2 Oilsands fever: A Canadian strain of Dutch disease..................................................... 29 3.3 Clear winners and losers amidst a restructuring economy ........................................... 35
3.3.1 Divergent terms of trade........................................................................................ 36 3.3.2 Shifting dominance in exports ............................................................................... 37 3.3.3 Non-commodity exports struggling to compete ..................................................... 38 3.3.4 Impacts on labour.................................................................................................. 41
4. The economic implications of the oilsands boom.......................................................... 43 4.1 Provincial fault lines and the national fabric .................................................................. 43
4.1.1 Economic decline in the manufacturing heartland................................................. 44 4.1.2 Alberta reaps the lion’s share of oilsands’ benefits ............................................... 47 4.1.3 Regional differences in inflation ............................................................................ 49 4.1.4 Tax policies exacerbate regional imbalance ......................................................... 52
4.2 Oil price volatility and the revenue rollercoaster ........................................................... 53 4.2.1 The volatile nature of oil prices.............................................................................. 53
The Pembina Institute 5 In the Shadow of the Boom
4.2.2 Riding the public revenue rollercoaster ................................................................. 55 4.3 Canada’s carbon gamble and the 21st century energy economy .................................. 57
5. Conclusions and a path forward ...................................................................................... 62 5.1 Conclusions................................................................................................................... 62 5.2 A suggested path forward ............................................................................................. 63
List of Figures Figure 1. Average annual world oil prices, 2000–2035............................................................... 17 Figure 2. Alberta oilsands production, 1967–2010 ..................................................................... 18 Figure 3. Canadian crude oil production forecast, 2010–2025 ................................................... 19 Figure 4. GDP of selected economic sectors in Canada, 1999–2010 ........................................ 20 Figure 5. Natural gas price and gross new Canadian natural gas production, 2004–2010 ........ 21 Figure 6. Proportion of resource revenue from oilsands and natural gas in Alberta, 2000–2010
............................................................................................................................................ 22 Figure 7. Price of West Texas Intermediate compared to Canadian/U.S. exchange rate, 1951–
2011 .................................................................................................................................... 28 Figure 8. Timeline: Diagnosis of Dutch disease in Canada ........................................................ 34 Figure 9. Terms of trade for Canada, 1981–2011 ...................................................................... 36 Figure 10. Total terms of trade versus terms of trade for the automobile sector, 2002–2011 .... 37 Figure 11. Change in nominal Canadian exports, 2000–2011 ................................................... 38 Figure 12. Canada’s top two export products, 2001–2010 ......................................................... 39 Figure 13. Trends in Canadian and U.S international competitiveness, unit labour costs and
labour productivity, 1994–2011........................................................................................... 40 Figure 14. Comparing Canadian business investment in residential structures to investment in
machinery and equipment, 1960–2010............................................................................... 41 Figure 15. Changes in employment by sector ............................................................................ 42 Figure 16. Change in provincial real GDP growth, 2000–2010 .................................................. 45 Figure 17. Trends in sectoral and provincial exports, 1990–2010 .............................................. 46 Figure 18. Unemployment rates by province, January 2000–March 2012 ................................. 47 Figure 19. Regional distribution in Canada of GDP impacts from oilsands investment and
operation in Alberta, 2010–2035......................................................................................... 48 Figure 20. Change in the Consumer Price Index in Canada by region, 2000–2010 .................. 50 Figure 21. Profit margins in Canada’s energy and manufacturing sectors, 1988–2006 ............. 54 Figure 22. Federal tax from oil and gas extraction and support activities, 2000–2009............... 57
The Pembina Institute 6 In the Shadow of the Boom
List of Tables Table 1. Federal tax treatment of the oil and gas sector and foregone federal revenue, 2009 .. 52
The Pembina Institute 7 In the Shadow of the Boom
Executive summary In 1995, a national group of oil industry and government representatives set an ambitious goal: by 2020, they wanted to see Canada’s oilsands producing between 800,000 and 1.2 million barrels of oil each day.1 But less than 10 years later, Canada had already surpassed that goal2 — and today, oilsands production is on track to reach nearly 3.5 million barrels per day by 2020.3
This rapid and unprecedented expansion of Canada’s oilsands has come at a time when the negative environmental and climate impacts of oil and gas production and use are under intense global scrutiny. The federal government has indicated it sees promoting the ongoing expansion and export of Canadian oil and gas as a top priority,4 and has taken steps to fundamentally weaken environmental oversight and protection to fast-track industry projects.
The polarizing rhetoric on both sides of the issue has made it difficult to have a reasonable, facts-based discussion about the pace and scale of oilsands expansion in Canada and how the rush to develop the oilsands is affecting Canada’s economy. Yet that discussion is critically needed today.
Over the past decade the value of the Canadian dollar has appreciated steadily and dramatically relative to the U.S. dollar, climbing to US$1.10 in 2007 from a low of US$0.61 in 2002,5 and hovering around parity for the past year or so. While numerous factors affect the value of the Canadian dollar, its sharp rise over the past decade has closely followed trends in the price of resource commodities, especially oil.6,7 The increasing correlation between oil prices and the Canadian dollar has led many to dub it a “petro-currency.”
There are some benefits to having a stronger currency; for example, consumers are able to purchase foreign goods or travel to other countries for less, and Canadian companies can (if they
1 National Oil Sands Task Force, The Oil Sands: A New Energy Vision for Canada (1995), 33. 2 Between 1995 and 2004 Alberta’s crude bitumen production increased from 482,000 barrels per day to 1.1 million barrels per day. Data was converted from cubic metres to barrels using a factor of 6.2929 barrels/ cubic metre. Source of 1995 data: Alberta Energy and Utilities Board, Alberta’s Reserves 2003 and Supply/Demand Outlook 2004-2013, ST98-2004 – Graphs and Data – Section 2 Crude Bitumen. (2004). http://www.ercb.ca/docs/products/STs/st98-2004.pdf; Source of 2004 data: Alberta Energy and Utilities Board, Alberta’s Reserves 2004 and Supply/Demand Outlook 2005-2014 ST98-2005 (2005), 2-2. http://www.ercb.ca/docs/products/sts/st98-2005.pdf 3 Alberta Energy Resources Conservation Board, Alberta’s Energy Reserves 2010 and Supply/Demand Outlook 2011-2020, ST98-2011 (2011), Figure S3.8. http://www.ercb.ca/docs/products/STs/st98_current.pdf 4 Stephen Harper, speech, World Economic Forum in Davos, Switzerland, January 26, 2012. http://www.pm.gc.ca/eng/media.asp?category=2&pageId=46&id=4606 5 These represent the lowest and highest exchange rates during the period January 2000 through January 2012, as documented by the Bank of Canada. Source: http://www.bankofcanada.ca/rates/exchange/can-us-rate-lookup/ 6 Dinara Millington, Carlos Murillo, Zoey Walden and Jon Rozhon, Canadian Oil Sands Supply Costs and Development Projects (2011-2045), Study no. 128 (Canadian Energy Research Institute, 2012), 23. 7 Statistics Canada, CANSIM Table 176-0064, Foreign exchange rates in Canadian dollars.
Executive summary
The Pembina Institute 8 In the Shadow of the Boom
choose) upgrade machinery and equipment from foreign suppliers more cheaply, thereby enhancing productivity. But a rising currency doesn’t necessarily float all boats.
When the value of a country’s currency is closely correlated with the value of a commodity, it can lead a country to contract what is often referred to as “Dutch disease.” The term was coined by The Economist in 1977 to describe a phenomenon that occurred in the 1960’s in the Netherlands, when the country discovered and began to aggressively develop offshore natural gas.8 Dutch disease occurs when the real exchange rate of a country appreciates to the point where the country’s manufactured goods become too expensive to export, ultimately leading to the decline or even demise of the manufacturing sector.9 This decline has broader implications for the economy because, relative to the resource sector, the manufacturing sector tends to be more innovative and can develop technologies that spill over into other sectors.10,11 A contraction in the manufacturing sector means fewer spillover benefits; if left unchecked, this could lead to lower rates of growth throughout the economy when the resource boom subsides.12,13
Compared to the Dutch experience in the 1970s, the current Canadian context is unique in many ways; therefore the simple label of Dutch disease fails to capture what is happening in the Canadian economy. Rather, it seems clear that Canada is undergoing changes, both positive and negative, that are unique to both the nature of its domestic economy and Canada’s role in a shifting global economy. The result appears to be a uniquely Canadian strain of the Dutch disease that could be called “oilsands fever” — a strain that is beginning to create clear winners and losers in Canada’s economy and could pose a significant risk to Canada’s competitiveness in the emerging clean energy economy.
Overall, Canada’s economy has fared relatively well over the past decade, especially in light of the recent global recession. Between 2001 and 2010, Canada’s total GDP grew by 1.7 per cent, with growth in 2010 at 3.3 per cent.14 However, not all sectors of the Canadian economy have fared as well as the oilsands, and provincial fault lines have emerged, with the economic disparity creating tension among regions. The projected level of future oilsands development and the current efforts of the federal government to fast-track that development seem likely to
8 “The Dutch Disease,” The Economist, November 26, 1977, 82–83. 9 Martin Lefebvre, “Petrocurrency”: Good or Bad for Canadaʼs Economy?, Economic Viewpoint (Desjardins, 2006), 9. http://www.desjardins.com/en/a_propos/etudes_economiques/actualites/point_vue_economique/pve61011.pdf 10 Philippe Bergevin, Energy Resources: Boon or Curse for the Canadian? prepared by Parliamentary Information and Research Service, PRB 05-86E (2006). http://www.parl.gc.ca/Content/LOP/researchpublications/prb0586-e.htm 11 The recent increases in amounts of non-valued added natural resources (e.g. coal, oilsands, potash, lumber) exported from Canada limits the spillover effect from the resource sector on the Canadian economy. 12 Mohammad Shakeri and Richard Gray, Has Canada caught Dutch Disease? Policy Brief #20 (Canadian Agricultural Innovation and Regulation Network, (2010), 3. 13 Paul Krugman, “The narrow moving band, the Dutch disease, and the competitive consequences of Mrs. Thatcher: Notes on trade in the presence of dynamic,” Journal of Development Economics 27 (1987). 14 Industry Canada, “GDP Canadian Economy,” NAICS 11-91, Canadian Industry Statistics. http://www.ic.gc.ca/eic/site/cis-sic.nsf/eng/h_00013.html
The current Canadian context is unique in many ways. The simple label of Dutch disease fails to capture what is happening in the Canadian economy.
Executive summary
The Pembina Institute 9 In the Shadow of the Boom
exacerbate those tensions.
Since 2001 there has been a remarkable increase in Canada’s exports from energy, industrial and agricultural sectors. This increase has masked a considerable drop in exports from the machinery and equipment, automotive and consumer goods and forestry sectors. The export of Canadian manufactured goods has been contracting due to a variety of factors, including the global shift of manufacturing to China, reduced U.S. demand and the high value of the loonie relative to the U.S. dollar. To cope, many manufacturing companies have begun to shift their focus to serving the resource sector, further contributing to an economy that is increasingly unbalanced and reliant on commodities known for their high price volatility.15
Outside Alberta, companies can have an incredibly difficult time attracting and retaining employees when oilsands production is booming. Those that don’t have enough staff to complete their work will either lose business to outside competitors or shut their doors permanently.16 Changes in employment in Canada further demonstrate the downward trend in the manufacturing sector. Compared to other sectors in the economy, employment in the manufacturing sector has not recovered from the 2008-09 recession.17 Between 2004 and 2010, over 550,000 jobs were lost in the manufacturing sector, representing 3.2 per cent of all employed Canadians.18,19 While not all these jobs losses are from the rising loonie and other jobs have been created elsewhere in the economy, it is the rate, scale and regionalization of job loss from the manufacturing sector that is particularly concerning.
In 2008, the OECD noted that oilsands development is “generating large regional disparities,” and suggested that Canada’s historic system of equalization among have and have-not provinces may be inadequate to address these disparities.20 The decline in Canada’s manufacturing sector affects residents of Ontario and Quebec most profoundly.21 Meanwhile, Statistics Canada data shows the resource-based economies of Alberta, Saskatchewan and Newfoundland and Labrador have been growing over the last decade, relative to the economies of provinces in central Canada.22 In other words, the commodity-rich provinces are increasing their dominance of Canadian exports and outperforming exports from the traditionally strong manufacturing base in
15 MRB Partners, O Canada (Part I) and Uh-Oh Canada (Part II) (2011), 16. 16 Mark Carney, “Capitalizing on the Commodity Boom: the Role of Monetary Policy,” speech, University of Calgary Haskayne School of Business, June 19, 2008. http://www.bankofcanada.ca/2008/06/speeches/capitalizing-commodity-boom-role-monetary-policy/ 17 OECD, OECD Economic Surveys: Canada (2010). http://www.oecd.org/document/56/0,3746,en_2649_34111_45925432_1_1_1_1,00.html 18 Ibid. 19 Statistics Canada, “Labour force characteristics.” http://www.statcan.gc.ca/tables-tableaux/sum-som/l01/cst01/econ10-eng.htm 20 OECD, OECD Economic Surveys: Canada (2008), 109. Available at http://www.oecd.org/document/3/0,3746,en_2649_34111_40732867_1_1_1_1,00.html 21 Jules Dufort, Impact of the Exchange Rate Appreciation on Quebec Export and GDP Growth,” Ministere du Developpement economiqu et regional et de la recherché (2004), 9. 22 Statistics Canada, Provincial and Territorial Economic Accounts Review, 13-016-X (2010). http://www.statcan.gc.ca/pub/13-016-x/13-016-x2011001-eng.htm
Executive summary
The Pembina Institute 10 In the Shadow of the Boom
central Canada.23 While Canada is exploiting its comparative advantage with respect to natural resource extraction, the rate of change is causing significant challenges in central Canada — making it difficult for this region to adjust to incredibly rapid structural changes in the economy.
The question of who wins and who loses because of oilsands development has become highly politicized as regional economic power has shifted;24,25 unfortunately, the recent war of words between the leaders of Alberta and Ontario indicates that having a constructive dialogue about this issue remains a challenge.26
The Canadian Energy Research Institute (CERI) has modeled the regional economic impacts of oilsands development over the next 25 years. Based on their considerable assumptions — including no constraints to pipeline development and parity of the Canadian dollar for a quarter century — CERI estimates that Alberta will realize by far the greatest share of benefits from the surge in oilsands development, with 94 per cent ($4.9 trillion) of the GDP associated with oilsands investment and operations occurring within the province. The remaining six per cent of GDP will be realized in Ontario (3.0 per cent or $142 billion), British Columbia (1.3 per cent or $63 billion), and Quebec (0.66 per cent or $31 billion).27
However, it’s not all good news for Alberta. As oilsands development has expanded, the province has struggled with an overheated economy. Only Alberta’s inflation rates were well above the national average four out of the past 10 years, while all other provinces saw inflation within 0.8 per cent of the average value.28,29 One of the main factors behind Alberta’s high inflation rate is the shortage of labour and materials in the oilsands sector. Operators’ willingness to pay top dollar for scarce material and high wages to attract and retain skilled labour has driven up operating costs for the oilsands 250 per cent since 2000.30 A high dollar hurts revenue for
23 Until 2008, Southern Ontario was the only region in Canada without a Federal Development Agency, ostensibly because of their historically robust economy. But in the February 2009 federal budget, a Southern Ontario Development Agency was created to “promote economic diversification and restructuring in Canada’s industrial core.” In: Michel Beine, Charles S. Bos and Serge Coulombe, Does the Canadian Economy suffer from the Dutch Disease? Tinbergen Institute Discussion Paper 2009-096/4 (2009). 24 Barbara Yaffe, “Mulcair faces a ‘western front’ on oilsands,” Financial Post, May 9, 2012. http://business.financialpost.com/2012/05/09/mulcair-faces-a-western-front-on-oil-sands/ 25 Roger Gibbins, “Gibbins: Oilsands criticism reveals Mulcair’s naivete,” Canada.com, May 8, 2012, http://www.canada.com/opinion/op-ed/Gibbins+Oilsands+criticism+reveals+Mulcair+naivete/6581515/story.html 26 Karen Howlett and Dawn Walton, “Redford's energy vision clashes with McGuinty's,” Globe and Mail, February 27, 2012. http://www.theglobeandmail.com/news/politics/mcguinty-rebuffs-redfords-oil-sands-plea/article2351145/ 27 Afshin Honarvar, Dinara Millington, Jon Rozhon, Thorn Walden, and Carlos Murillo, Economic Impacts of Staged Oil Sands Projects in Alberta (2010–2035) Study no. 125 (Canadian Energy Research Institute, 2011), 31. 28 Inflation rate is the percentage increase in the price of goods and services. In Canada, the consumer price index, which tracks the price of a fixed basket of consumer goods, is used to measure inflation. 29 Inflation rate was calculated as a percentage change of yearly total CPI figures from Statistics Canada, CANSIM Table 326-0021, “Consumer Price Index, 2009 basket.” http://www5.statcan.gc.ca/cansim/a05?lang=eng&id=3260021 30 Dave Cooper, “Inflation holds oilsands in grip: economist,” Edmonton Journal, December 2, 2011 http://www2.canada.com/edmontonjournal/news/business/story.html?id=4ce3d206-a791-4bb0-8732-000a68586d16
Executive summary
The Pembina Institute 11 In the Shadow of the Boom
Alberta as well; with every one-cent increase over a 12-month period, the Alberta Treasury loses $247 million.31
The federal government has left no doubt that it sees expanding oilsands production and establishing access to new markets via pipeline as a critical nation-building project for Canada.32 But this drive to expand the oilsands is creating significant regional imbalances with respect to GDP growth, employment, inflation and competitiveness.
As noted, the OECD warned about these “large regional disparities” created by oilsands development nearly four years ago.33 Meanwhile, oilsands production has increased 47 per cent since 2008 and the federal government is undertaking sweeping changes to fast-track permitting for oilsands-related projects, opening the door to even more rapid development.34 In that context, the regional economic imbalance among provinces is likely to worsen, given federal efforts to encourage the growth in oilsands without any corresponding efforts to address the economic downsides being experienced in other provinces and sectors.
The following suggestions outline a path forward for near-term action to address the most acute effects of Canada’s oilsands fever already being felt, while also encouraging vision and leadership to navigate Canada toward a sustainable energy future:
1. Establish a Federal Savings Fund for oil and gas revenues. In other countries that are heavily dependent on oil exports, like Norway, non-renewable resource funds have been established to save for the future, to counteract the appreciation of the local currency, to provide resources to soften the impacts of the boom and bust cycles of resource-dependent economies, and to smooth a transition to a clean energy economy.
2. Eliminate preferential tax treatment for the oil and gas sector. Canada’s oil and gas sector benefits from federal tax breaks totaling $1.3 billion in 2009, yet the OECD has shown these benefits lead to foregone federal revenue and increase economic disparity between resource-rich provinces and other regions. Both the OECD and the International Energy Agency have recommended removing inefficient fossil fuel subsidies,35 and Canada has pledged, along with other G20 nations, to phase out such subsidies over the medium term.36
3. Convene an expert panel of the Royal Society of Canada on oilsands and the Canadian economy. The RSC has the independence, objectivity and credibility to undertake an expert
31 Alberta Finance, Economic Outlook: Budget 2012, 88. http://www.finance.alberta.ca/publications/budget/budget2012/fiscal-plan-economic-outlook.pdf 32 Peter O’Neil, “Oil industry’s ‘nation-building’ pipeline won’t be stopped by protestors: Natural Resources Minister,” National Post, December 6, 2011. http://news.nationalpost.com/2011/12/06/oil-industrys-nation-building-pipeline-wont-be-stopped-by-protesters-natural-resources-minister/ 33 OECD, OECD Economic Surveys: Canada (2008), 109. 34 Blakes, “Canadian Government Introduces Legislation to Streamline Environmental Approvals,” May 1, 2012. http://www.blakes.com/english/view_bulletin.asp?ID=5343 35 OECD, “OECD and IEA recommend reforming fossil-fuel subsidies to improve the economy and the environment,” media release, October 4, 2011. http://www.oecd.org/document/35/0,3746,en_21571361_44315115_48804623_1_1_1_1,00.html 36 Jeff Mason and Darren Ennis, "G20 agrees on phase-out of fossil fuel subsidies," Reuters, September 25, 2009. http://www.reuters.com/article/2009/09/26/us-g20-energy-idUSTRE58O18U20090926
Executive summary
The Pembina Institute 12 In the Shadow of the Boom
review of these economic issues and provide public policy recommendations to ensure informed decisions are made about how oilsands development occurs within Canada’s economy.
4. Initiate a federal committee study on regional competitiveness in a high-dollar era. The House of Commons standing committee on Industry, Science and Technology is well-positioned to undertake a study on regional economic competitiveness and the high dollar. The study should look at trends in the restructuring of the Canadian economy and associated regional disparities, and aim to identify actions that the federal government can take to ensure a robust, diverse economy that supports economic growth and competitiveness throughout Canada.
5. Continue cooperating to establish a Canadian energy strategy that aims to achieve the following objectives: • Provide accessible, fair and efficient energy services to current and future generations of
Canadians; • Create opportunities for Canada to compete in the international marketplace as a leader in
innovative clean energy technologies and solutions; • Demonstrate leadership on climate change through constructive international engagement
and domestic actions to fulfill Canada’s commitments to greenhouse gas emission reduction; and,
• Protect and restore Canada’s environment by establishing, monitoring and enforcing science-based limits on impacts to our air, land and water.
The Pembina Institute 13 In the Shadow of the Boom
1. Introduction Speeding up the growth of Canada’s mining and energy industries, especially the oilsands, has emerged as a clear goal of the federal government. This can be seen, for example, in recent attempts to weaken environmental laws and expedite the regulatory review and approval of major industrial projects (see Box 1). But to suggest that such projects have been or are being unduly constrained is to ignore the unprecedented, and unexpected, rate and scale of oilsands development over the past two decades, which exceeded even the loftiest of ambitions.
In 1995, the National Oil Sands Task Force, a collective of oil industry and government representatives, laid out an ambitious 25-year strategy that envisioned doubling or even tripling oilsands production to reach between 800,000 and 1.2 million barrels per day by 2020.37 But oilsands production passed the 1-million-barrels-per-day mark by 200438 — 16 years earlier than expected — and over the past five years, the equivalent of one large oilsands mine has been approved each year. This rapid development has been fuelled by strong growth in demand for transportation fuels, technological advances, and a favourable fiscal regime (both provincial and federal).
Box 1. Speeding up growth by weakening federal environmental laws
Under the guise of achieving “responsible resource development” and removing barriers to economic progress, the federal government has used the 2012 budget to speed up the growth of Western Canada’s mining and energy industries, and in particular Alberta’s oilsands sector. But it is more than just an exercise in cutting unnecessary red tape; the proposed changes represent a systematic and fundamental weakening of Canada’s environmental protection laws.
The federal government’s 2012 budget changed or repealed almost every major federal environmental law, and numerous other laws that contained environmental provisions. These changes include:39 • Reducing the number of environmental reviews that will take place, offloading the responsibility to
provinces and territories wherever possible; • Making federal environmental assessments less comprehensive when they do occur, and setting
strict limits on how long reviews can take and who will be allowed to participate; • Providing federal cabinet with “ministerial discretion” to approve projects wherever it sees fit —
regardless of the outcome of a review by third party tribunals like the National Energy Board — in order to speed up energy project approvals; (continued)
37 National Oil Sands Task Force, The Oil Sands: A New Energy Vision for Canada (1995), 33. 38 Between 1995 and 2004 Alberta’s crude bitumen production increased from 482,000 barrels per day to 1.1 million barrels per day. Data was converted from cubic metres to barrels using a factor of 6.2929 barrels/cubic metre. Source of 1995 data: Alberta Energy and Utilities Board, Alberta’s Reserves 2003 and Supply/Demand Outlook 2004-2013, ST98-2004 – Graphs and Data – Section 2 Crude Bitumen. (2004). http://www.ercb.ca/docs/products/STs/st98-2004.pdf; Source of 2004 data: Alberta Energy and Utilities Board, Alberta’s Reserves 2004 and Supply/Demand Outlook 2005-2014 ST98-2005 (2005), 2-2. http://www.ercb.ca/docs/products/sts/st98-2005.pdf 39 Ecojustice, "Budget bill puts environmental laws on chopping block," media release, April 26, 2012. http://www.ecojustice.ca/blog/media-centre/press-releases/budget-bill-puts-environmental-laws-on-chopping-block
Introduction
The Pembina Institute 14 In the Shadow of the Boom
• Narrowing the application of the Fisheries Act, thereby allowing fisheries protection to be delegated to provinces, whose ability to regulate is limited or unclear;
• Exempting the National Energy Board (and other federal agencies) from requirements that would otherwise ensure protections are in place for species at risk and their critical habitat when issuing permits.
Despite sustained public concern about the pace of oilsands development and the ability of government to manage the corresponding environmental and socioeconomic impacts — concerns that have been echoed by the Royal Society of Canada40 and Alberta’s Oil Sands Ministerial Strategy Committee41 — new oilsands projects have received approval to increase total production to 5.1 million barrels per day.42 While not all of this production capacity can be built immediately, it is now estimated that oilsands production will reach nearly 3.5 million barrels per day by the start of the next decade,43 more than triple the Task Force’s 2020 target.
The rise in concern about the environmental and climate change impacts associated with oilsands development has increasingly sparked rebuttals focusing on the economic benefits of oilsands development, suggesting a trade-off between environmental protection and economic prosperity is necessary.
While economic growth and environmental protection can (and should) coexist, oilsands development has both positive and negative impacts on the Canadian economy. Any responsible, credible and constructive discussion about current and future oilsands development must take into account the full range of corresponding economic impacts being felt across Canada.
As Canada emerges from the 2008-09 recession, it is clear that the oilsands sector has a new and distinct stature, both functionally and symbolically. It is imperative that Canadians understand what this means for our economy, now and into the future. The federal government has described the role of oilsands development in Canada’s economy as “one of the most important economic engines in the country,”44 “a cornerstone of our national economy”45 and “a key driver of the Canadian economy.”46
40 In 2010 the Royal Society of Canada issued an expert panel report, Environmental and Health Impacts of Canada’s Oil Sands Industry, which found that “The environmental regulatory capacity of the Alberta and Canadian Governments does not appear to have kept pace with the rapid growth of the oil sands industry over the past decade.” The full report is available at: http://www.rsc.ca/documents/expert/RSC%20report%20complete%20secured%209Mb.pdf 41 In 2006 the Oil Sands Ministerial Strategy Committee issued Investing in our Future: Responding to the rapid growth of oil sands development (the Radke Report), which detailed the impacts of the pace of oilsands development on infrastructure, housing, transportation and a range of public services (e.g. health care and education). The full report is available at: www.assembly.ab.ca/lao/library/egovdocs/2006/alec/158408.pdf 42 R.B. Dunbar, Existing and Proposed Canadian Commercial Oil Sands Projects (Strategy West, 2011). strategywest.com/downloads/StratWest_OSProjects_2011_01.pdf 43 Alberta Energy Resources Conservation Board, Alberta’s Energy Reserves 2010 and Supply/Demand Outlook 2011-2020, ST98-2011(2011), Figure S3.8. http://www.ercb.ca/docs/products/STs/st98_current.pdf 44 Joe Oliver, “Forging New Paths Toward Canada’s Energy Future,” speech, Calgary Chamber of Commerce (January 25, 2012). Available at http://www.nrcan.gc.ca/media-room/speeches/2012/13/3703 45 Joe Oliver, “Creating Jobs and Prosperity: Canada as a Resource Superpower,” speech, Toronto Board of Trade (October 13, 2011). Available at http://www.nrcan.gc.ca/media-room/speeches/88/3127
Introduction
The Pembina Institute 15 In the Shadow of the Boom
There has been considerable attention paid to the economic benefits of oilsands development, which are routinely cited in the media by champions of unlimited oilsands expansion. But much less attention has been paid to the way in which the growth of the oilsands sector is reshaping Canada’s economy, particularly how it is creating clear winners and losers across different economic sectors and regions of our country.
This creates both immediate consequences, such as rapidly growing regional disparities, and longer-term risks, like increasing concentration of the Canadian economy on natural resource commodities like the oilsands. After all, as the Alberta Premier’s Council on Economic Strategy has noted, “…we must plan for the eventuality that oil sands production will almost certainly be displaced at some point in the future by lower-cost and/or lower-emission alternatives. We may have heavy oil to sell, but few or no profitable markets wishing to buy.”47
David Emerson, a former federal cabinet minister, recently wrote that “…governments and others involved in the development and stewardship of resources need constantly to think of future generations of Canadians and their claim on publicly owned resource assets and the environment. This naturally presents the question of the speed and nature of development and exploitation of resources — to extract now or sometime in the future, for example — and includes the nature and extent of environmental protection and restoration.”48
Similarly, economist Jim Stanford has suggested that, “Canadians should think carefully about the costs and benefits of this historic shift in our national economic direction, and make the most of our ability to influence the course of our own economic destiny.”49 Neglecting to give adequate consideration to the issues Emerson and Stanford raise when making decisions about oilsands development is likely to have detrimental implications for both Canada’s environment and its economy. Yet it appears that the federal government is making decisions that, in the end, will only serve to exacerbate both the environmental and economic issues that have already arisen from the current approach to oilsands development to date.
Prime Minister Harper frequently describes his government as a fiscally responsible and effective manager of the economy. At the World Economic Forum in Davos, Switzerland, this past January, the Prime Minister said, “…as we all know, both from the global crises of the past few years and from past experience in our own countries, easy choices now mean fewer choices later.”50
This report documents how exploiting the oilsands has been and apparently continues to be an “easy choice.” Oil prices are high, oil demand from developing countries like China and India is soaring, and Canada is home to the world’s third-largest oil reserve in the oilsands. These 46 Environment Canada, “Canada and Alberta Take Action to Implement World Class Monitoring System for the Oil Sands,” media release, February 3, 2012. http://www.ec.gc.ca/default.asp?lang=En&n=714D9AAE-1&news=BC73B2E3-F93C-4294-A6BF-22C9DC689F7C 47 Government of Alberta, Shaping Albertaʼs Future: Report of the Premier's Council for Economic Strategy (2011), 6. 48 David Emerson, “Reversing the Curse: starting with energy,” Policy Options (February 2012), 53. 49 Jim Stanford, A Cure for Dutch Disease: Active sector strategies for Canada’s economy. (Canadian Centre for Policy Alternatives, 2012), 2. http://www.policyalternatives.ca/publications/reports/cure-dutch-disease 50 Stephen Harper, speech, World Economic Forum in Davos, Switzerland, January 26, 2012. http://www.pm.gc.ca/eng/media.asp?category=2&pageId=46&id=4606
Introduction
The Pembina Institute 16 In the Shadow of the Boom
realities leave no question that there is much money to be made in expanding development and increasing production from the oilsands. In the same speech, Prime Minister Harper used the prospect of increased resource development to foreshadow the weakening of Canada’s environmental assessment and protection laws (see Box 1), stating, “…we will make it a national priority to ensure we have the capacity to export our energy products beyond the United States and specifically to Asia. In this regard, we will soon take action to ensure that major energy and mining projects are not subject to unnecessary regulatory delays – that is, delay merely for the sake of delay.”51
But is extracting and exporting Canada’s natural resources, particularly oilsands, as much and as quickly as possible really the best way to“… seize and to master our future, to be a model of confidence, growth, and prosperity in the 21st century,” as the Prime Minister put it in Davos?52
Are the decisions being made to expedite further growth in the oilsands sector clearly in the best interest of Canadians, both environmentally and economically? This is the primary question this report aims to address.
Our analysis starts with an introduction to the various economic trends and forces that are being influenced by the pace and scale of oilsands development (both current and projected). Chapter 2 provides an overview of the rise of the oilsands amidst increasing oil prices over the past decade, and the impact the growth of this industry has had on various parts of Canada’s economy. Chapter 3 assesses the impact that high oil prices and booming oilsands production has had on the Canadian dollar, and surveys recent literature exploring whether or to what extent Canada’s economy is experiencing Dutch disease. Chapter 4 delves into the provincial fault lines being triggered by recent economic trends, and discusses both the near-term impacts and longer-term risks associated with Canada’s current economic trajectory, and the role of oilsands development within it. Finally, Chapter 5 draws conclusions based on this research and suggests a path forward to support a constructive discussion and decisions about the future of our economy, with the aim of ensuring both a healthy environment and a thriving economy.
51 Ibid. 52 Ibid.
The Pembina Institute 17 In the Shadow of the Boom
2. Rise of the oilsands 2.1 Increasing oil prices and oilsands production
“High [oil] prices are easy enough to explain. Voracious demand in emerging economies is colliding with constraints on production. Old oil fields are producing less, and new fields are more expensive to develop. Governments with access to cheaper resources have restricted investment in new supplies, for various reasons. Faced with popular discontent, petrostates in the Middle East and North Africa, for example, are spending their oil revenues on trying to placate their burgeoning populations with subsidized food, gasoline, and other necessities.”
— Robert McNally and Michael Levi, “A Crude Predicament.”53
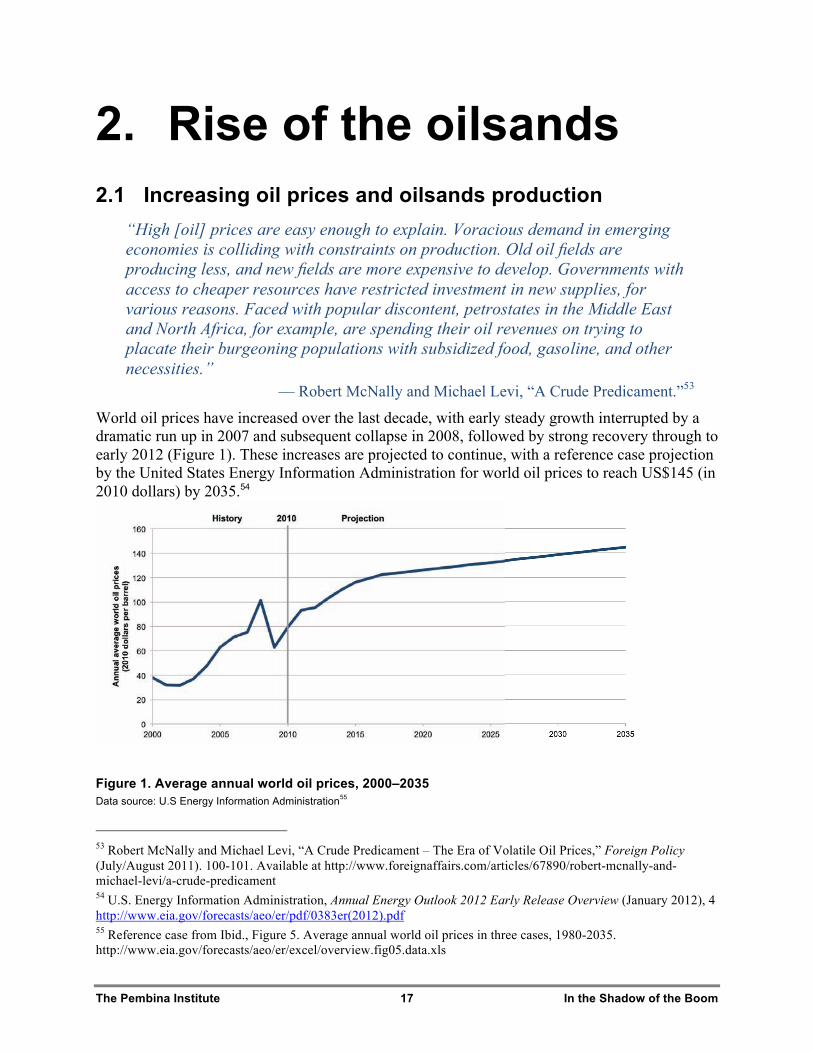
World oil prices have increased over the last decade, with early steady growth interrupted by a dramatic run up in 2007 and subsequent collapse in 2008, followed by strong recovery through to early 2012 (Figure 1). These increases are projected to continue, with a reference case projection by the United States Energy Information Administration for world oil prices to reach US$145 (in 2010 dollars) by 2035.54
Figure 1. Average annual world oil prices, 2000–2035 Data source: U.S Energy Information Administration55
53 Robert McNally and Michael Levi, “A Crude Predicament – The Era of Volatile Oil Prices,” Foreign Policy (July/August 2011). 100-101. Available at http://www.foreignaffairs.com/articles/67890/robert-mcnally-and-michael-levi/a-crude-predicament 54 U.S. Energy Information Administration, Annual Energy Outlook 2012 Early Release Overview (January 2012), 4 http://www.eia.gov/forecasts/aeo/er/pdf/0383er(2012).pdf 55 Reference case from Ibid., Figure 5. Average annual world oil prices in three cases, 1980-2035. http://www.eia.gov/forecasts/aeo/er/excel/overview.fig05.data.xls
Rise of the oilsands
The Pembina Institute 18 In the Shadow of the Boom
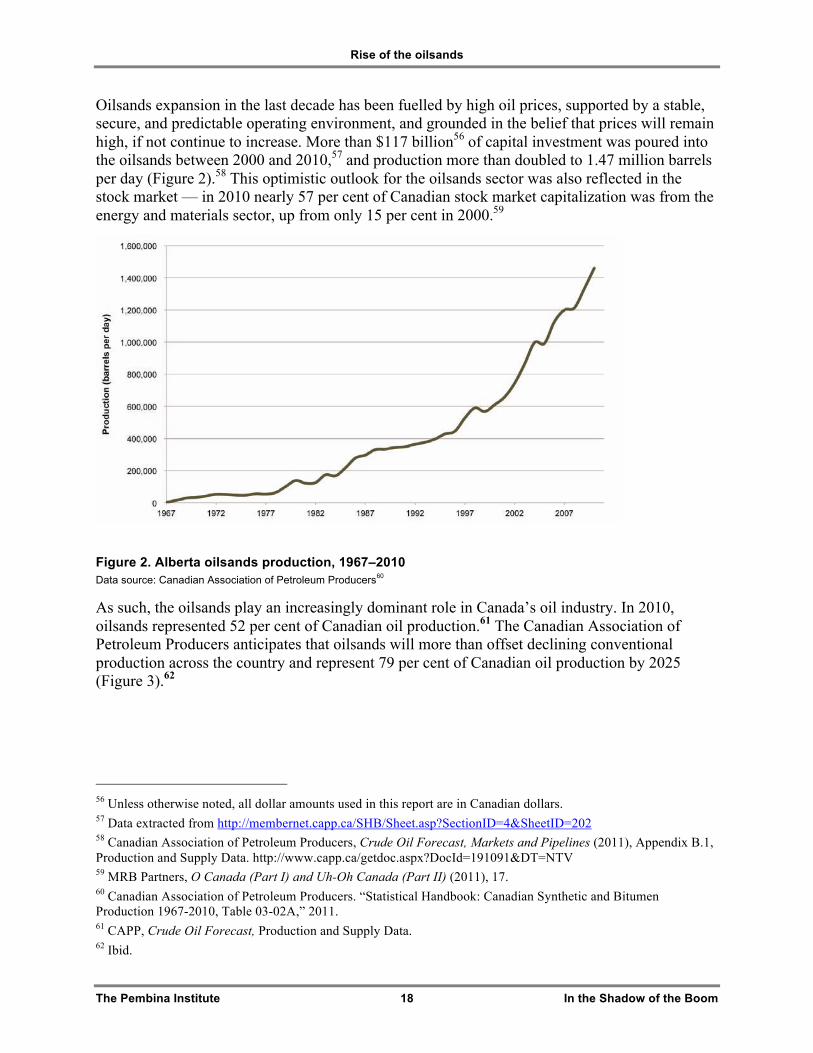
Oilsands expansion in the last decade has been fuelled by high oil prices, supported by a stable, secure, and predictable operating environment, and grounded in the belief that prices will remain high, if not continue to increase. More than $117 billion56 of capital investment was poured into the oilsands between 2000 and 2010,57 and production more than doubled to 1.47 million barrels per day (Figure 2).58 This optimistic outlook for the oilsands sector was also reflected in the stock market — in 2010 nearly 57 per cent of Canadian stock market capitalization was from the energy and materials sector, up from only 15 per cent in 2000.59
Figure 2. Alberta oilsands production, 1967–2010 Data source: Canadian Association of Petroleum Producers60
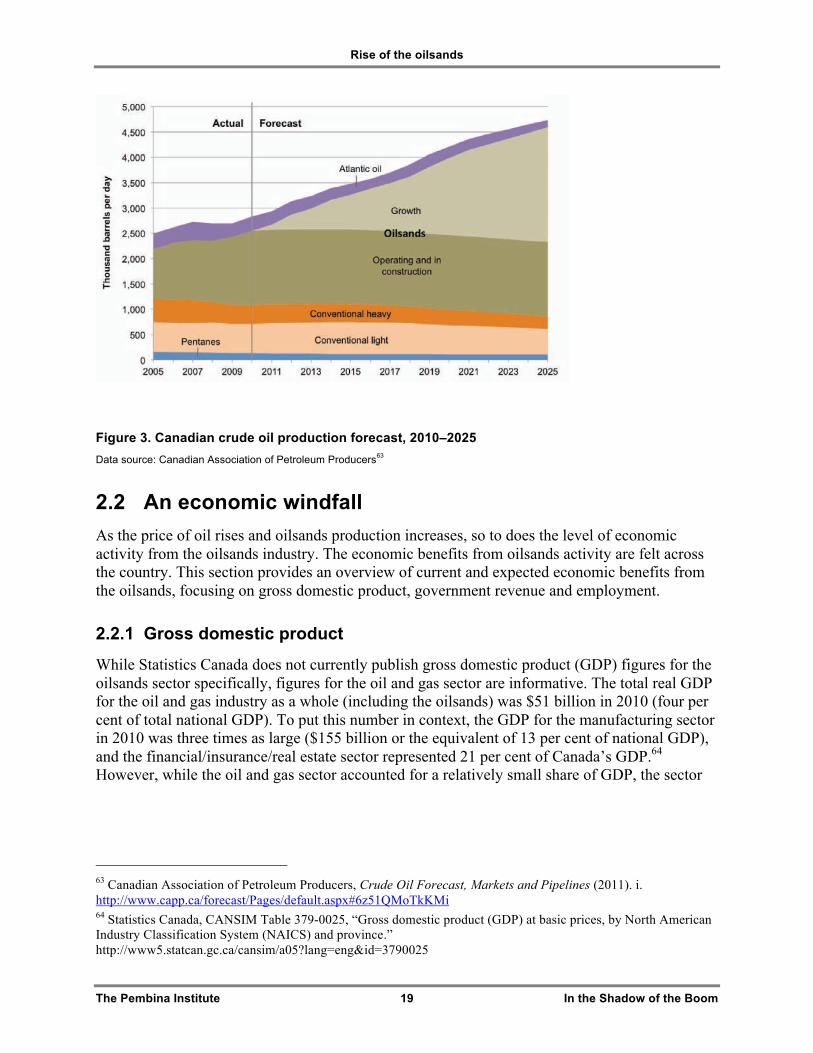
As such, the oilsands play an increasingly dominant role in Canada’s oil industry. In 2010, oilsands represented 52 per cent of Canadian oil production.61 The Canadian Association of Petroleum Producers anticipates that oilsands will more than offset declining conventional production across the country and represent 79 per cent of Canadian oil production by 2025 (Figure 3).62
56 Unless otherwise noted, all dollar amounts used in this report are in Canadian dollars. 57 Data extracted from http://membernet.capp.ca/SHB/Sheet.asp?SectionID=4&SheetID=202 58 Canadian Association of Petroleum Producers, Crude Oil Forecast, Markets and Pipelines (2011), Appendix B.1, Production and Supply Data. http://www.capp.ca/getdoc.aspx?DocId=191091&DT=NTV 59 MRB Partners, O Canada (Part I) and Uh-Oh Canada (Part II) (2011), 17. 60 Canadian Association of Petroleum Producers. “Statistical Handbook: Canadian Synthetic and Bitumen Production 1967-2010, Table 03-02A,” 2011. 61 CAPP, Crude Oil Forecast, Production and Supply Data. 62 Ibid.
Rise of the oilsands
The Pembina Institute 19 In the Shadow of the Boom
Figure 3. Canadian crude oil production forecast, 2010–2025 Data source: Canadian Association of Petroleum Producers63
2.2 An economic windfall As the price of oil rises and oilsands production increases, so to does the level of economic activity from the oilsands industry. The economic benefits from oilsands activity are felt across the country. This section provides an overview of current and expected economic benefits from the oilsands, focusing on gross domestic product, government revenue and employment.
2.2.1 Gross domestic product
While Statistics Canada does not currently publish gross domestic product (GDP) figures for the oilsands sector specifically, figures for the oil and gas sector are informative. The total real GDP for the oil and gas industry as a whole (including the oilsands) was $51 billion in 2010 (four per cent of total national GDP). To put this number in context, the GDP for the manufacturing sector in 2010 was three times as large ($155 billion or the equivalent of 13 per cent of national GDP), and the financial/insurance/real estate sector represented 21 per cent of Canada’s GDP.64 However, while the oil and gas sector accounted for a relatively small share of GDP, the sector
63 Canadian Association of Petroleum Producers, Crude Oil Forecast, Markets and Pipelines (2011). i. http://www.capp.ca/forecast/Pages/default.aspx#6z51QMoTkKMi 64 Statistics Canada, CANSIM Table 379-0025, “Gross domestic product (GDP) at basic prices, by North American Industry Classification System (NAICS) and province.” http://www5.statcan.gc.ca/cansim/a05?lang=eng&id=3790025
Rise of the oilsands
The Pembina Institute 20 In the Shadow of the Boom
had the fastest growing GDP in 2010 at 6.4 per cent, 3.0 percentage points higher than the national average.65
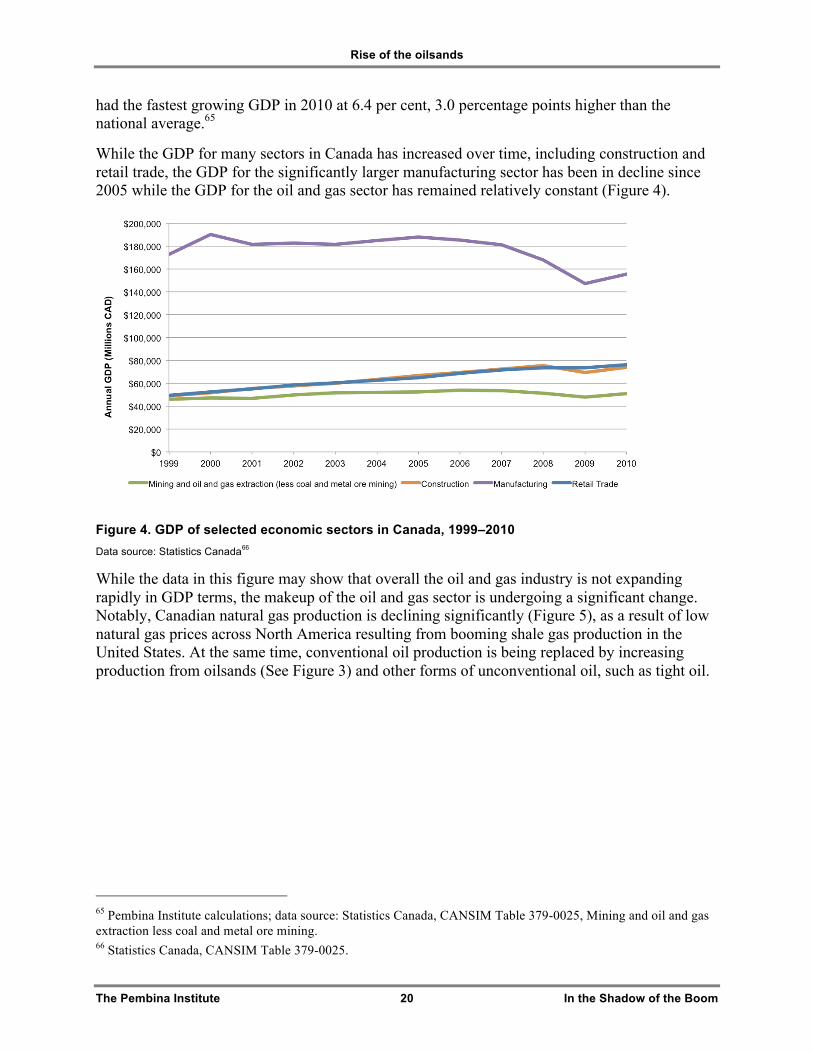
While the GDP for many sectors in Canada has increased over time, including construction and retail trade, the GDP for the significantly larger manufacturing sector has been in decline since 2005 while the GDP for the oil and gas sector has remained relatively constant (Figure 4).
Figure 4. GDP of selected economic sectors in Canada, 1999–2010 Data source: Statistics Canada66
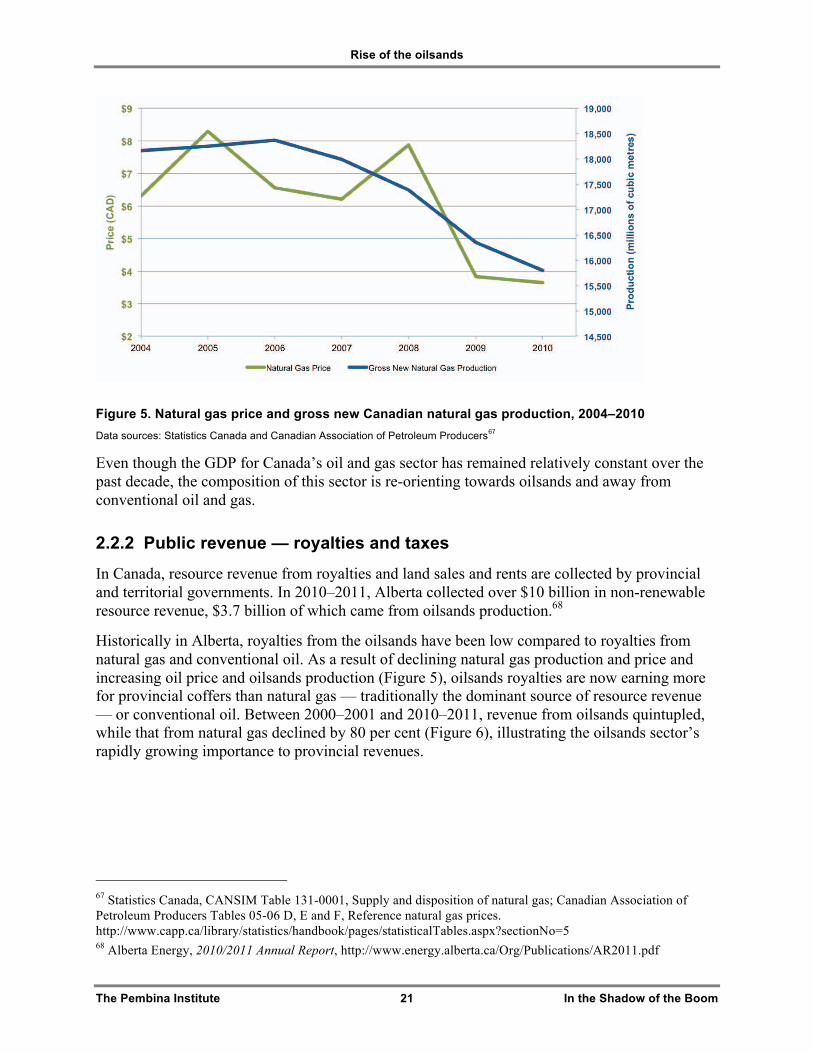
While the data in this figure may show that overall the oil and gas industry is not expanding rapidly in GDP terms, the makeup of the oil and gas sector is undergoing a significant change. Notably, Canadian natural gas production is declining significantly (Figure 5), as a result of low natural gas prices across North America resulting from booming shale gas production in the United States. At the same time, conventional oil production is being replaced by increasing production from oilsands (See Figure 3) and other forms of unconventional oil, such as tight oil.
65 Pembina Institute calculations; data source: Statistics Canada, CANSIM Table 379-0025, Mining and oil and gas extraction less coal and metal ore mining. 66 Statistics Canada, CANSIM Table 379-0025.
Rise of the oilsands
The Pembina Institute 21 In the Shadow of the Boom
Figure 5. Natural gas price and gross new Canadian natural gas production, 2004–2010 Data sources: Statistics Canada and Canadian Association of Petroleum Producers67
Even though the GDP for Canada’s oil and gas sector has remained relatively constant over the past decade, the composition of this sector is re-orienting towards oilsands and away from conventional oil and gas.
2.2.2 Public revenue — royalties and taxes
In Canada, resource revenue from royalties and land sales and rents are collected by provincial and territorial governments. In 2010–2011, Alberta collected over $10 billion in non-renewable resource revenue, $3.7 billion of which came from oilsands production.68
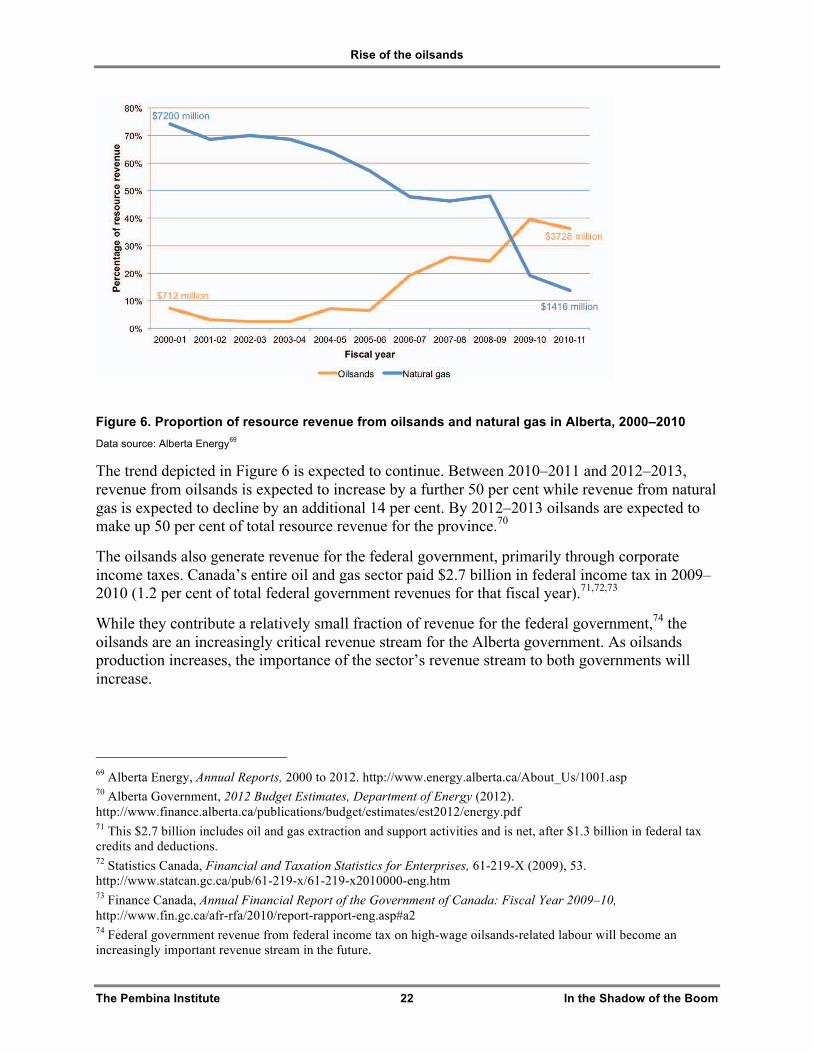
Historically in Alberta, royalties from the oilsands have been low compared to royalties from natural gas and conventional oil. As a result of declining natural gas production and price and increasing oil price and oilsands production (Figure 5), oilsands royalties are now earning more for provincial coffers than natural gas — traditionally the dominant source of resource revenue — or conventional oil. Between 2000–2001 and 2010–2011, revenue from oilsands quintupled, while that from natural gas declined by 80 per cent (Figure 6), illustrating the oilsands sector’s rapidly growing importance to provincial revenues.
67 Statistics Canada, CANSIM Table 131-0001, Supply and disposition of natural gas; Canadian Association of Petroleum Producers Tables 05-06 D, E and F, Reference natural gas prices. http://www.capp.ca/library/statistics/handbook/pages/statisticalTables.aspx?sectionNo=5 68 Alberta Energy, 2010/2011 Annual Report, http://www.energy.alberta.ca/Org/Publications/AR2011.pdf
Rise of the oilsands
The Pembina Institute 22 In the Shadow of the Boom
Figure 6. Proportion of resource revenue from oilsands and natural gas in Alberta, 2000–2010 Data source: Alberta Energy69
The trend depicted in Figure 6 is expected to continue. Between 2010–2011 and 2012–2013, revenue from oilsands is expected to increase by a further 50 per cent while revenue from natural gas is expected to decline by an additional 14 per cent. By 2012–2013 oilsands are expected to make up 50 per cent of total resource revenue for the province.70
The oilsands also generate revenue for the federal government, primarily through corporate income taxes. Canada’s entire oil and gas sector paid $2.7 billion in federal income tax in 2009–2010 (1.2 per cent of total federal government revenues for that fiscal year).71,72,73
While they contribute a relatively small fraction of revenue for the federal government,74 the oilsands are an increasingly critical revenue stream for the Alberta government. As oilsands production increases, the importance of the sector’s revenue stream to both governments will increase.
69 Alberta Energy, Annual Reports, 2000 to 2012. http://www.energy.alberta.ca/About_Us/1001.asp 70 Alberta Government, 2012 Budget Estimates, Department of Energy (2012). http://www.finance.alberta.ca/publications/budget/estimates/est2012/energy.pdf 71 This $2.7 billion includes oil and gas extraction and support activities and is net, after $1.3 billion in federal tax credits and deductions. 72 Statistics Canada, Financial and Taxation Statistics for Enterprises, 61-219-X (2009), 53. http://www.statcan.gc.ca/pub/61-219-x/61-219-x2010000-eng.htm 73 Finance Canada, Annual Financial Report of the Government of Canada: Fiscal Year 2009–10, http://www.fin.gc.ca/afr-rfa/2010/report-rapport-eng.asp#a2 74 Federal government revenue from federal income tax on high-wage oilsands-related labour will become an increasingly important revenue stream in the future.
Rise of the oilsands
The Pembina Institute 23 In the Shadow of the Boom
2.2.3 Employment
There is limited publicly available data on the historical employment levels related to the oilsands. In 2011, there were 20,304 workers directly employed in oilsands operations in Canada.75 Modelling by the Canadian Energy Research Institute (CERI) has suggested that in 2011, 339,000 direct (including operations and construction), indirect and induced jobs76 in Canada can be attributed to the oilsands industry (117,000, 106,000 and 116,000 jobs, respectively).77 This represented two per cent of all jobs in Canada.78
2.2.4 Economic growth models While historical economic growth in the oilsands sector has garnered significant attention in recent years, more recently the focus has shifted to projections of future growth. The Canadian Energy Research Institute has recently published a number of reports that outline the economic impacts of oilsands projects on the Canadian economy.79 While there have been other reports that have modelled the economic impacts of the oilsands, such as Catching the Brass Ring from the University of Calgary School of Public Policy (which uses CERI’s economic model) and a Wood Mackenzie report prepared for the Government of Alberta, CERI’s reports are by far the most cited.80,81
CERI’s economic analyses have been widely referenced by the Canadian Association of Petroleum Producers,82 Alberta Premier Alison Redford,83 federal Natural Resources Minister Joe Oliver84 and federal Finance Minister Jim Flaherty.85 In all these cases, CERI’s analysis has
75 Petroleum Human Resources Council of Canada, The decade ahead: oil sands labour market outlook to 2021, Petroleum Labour Market Information (Spring 2012), http://www.petrohrsc.ca/media/19695/final_oil_sands_labour_market_outlook_to_2021_fact_sheet.pdf 76 Direct jobs are the immediate jobs generated by a project or development, indirect jobs are the employment changes occurring in other businesses/industries that supply inputs to the project industry, and induced jobs are the jobs that result when the wages earned from the direct and indirect jobs are spent. 77 Please see the caveats later in this chapter regarding CERI’s modelling. Canadian Energy Research Institute, Pacific Access: Linking Oil Sands Supply to New and Existing Markets, forthcoming (2012). 78 Statistics Canada, “Labour force characteristics.” http://www.statcan.gc.ca/tables-tableaux/sum-som/l01/cst01/econ10-eng.htm 79 Canadian Energy Research Institute: Economic Impacts of New Oil Sands Projects (2010–2035), Study No. 124 (2011); Canadian Oil Sands Supply Costs and Development Projects (2010–2044), Study No. 122 (2011); Economic Impacts of Staged Oil Sands Projects in Alberta (2010–2035), Study No. 125 (2011); and Canadian Oil Sands Supply Costs and Development Projects (2011–2045) (2012). All available at http://www.ceri.ca/. 80 M.C. Moore, D. Hackett, S. Grissom, D. Crisan, A. Honarvar, “Catching the Brass Ring: Oil Market Diversification Potential for Canada,” School of Public Policy Research Papers 4, no. 16 (2011). http://policyschool.ucalgary.ca/?q=content/catching-brass-ring-oil-market-diversification-potential-canada 81 Wood Mackenzie, A Netback Impact Analysis of West Coast Export Capacity, prepared for Alberta Energy (2011). 82 Canadian Association of Petroleum Producers, Upstream Dialogue: The Facts on Oilsands (2011). http://www.capp.ca/getdoc.aspx?DocId=191939&DT=NTV 83 Karen Howlett and Dawn Walton, “Redford's energy vision clashes with McGuinty's,” Globe and Mail, February 27, 2012. http://www.theglobeandmail.com/news/politics/mcguinty-rebuffs-redfords-oil-sands-plea/article2351145/ 84 Gordon Hamilton, “Oliver sells benefits of oilsands development,” Vancouver Sun, January 24, 2012. http://www.vancouversun.com/business/Oliver+sells+benefits+oilsands+development/6039796/story.html
Rise of the oilsands
The Pembina Institute 24 In the Shadow of the Boom
been used publicly to justify continued oilsands expansion without consideration of the limitations inherent in this type of analysis (see Box 2), particularly when it comes to projecting economic impacts over the long term.
Box 2. Limitations to economic growth modelling of the oilsands
CERI’s reports use a proprietary input/output model developed to forecast the anticipated economic benefits over time from oilsands development across both Canada and the United States. While input/output models are effective tools for sector-specific economic impacts over the short term, in general they have considerable limitations in predicting economy-wide economic impact over the long term. For instance, they do not account for the effect of higher oil prices on the economy or acknowledge the use of higher-priced foreign crude oil that is currently imported to meet nearly half of Canadian demand.86
All economic models are premised upon a number of significant assumptions. Due to the nature of these assumptions in the CERI input/output model, the benefits it predicts are likely to be significantly overstated. While CERI does clearly identify the assumptions contained in its model, those who cite the results publicly — for example, industry lobbyists and politicians — consistently fail to mention the limitations of these outputs.
For example, CERI unrealistically assumes that the Canadian dollar will stay at par with the U.S. dollar for 35 years.87 Given the strong link between the Canadian dollar and the price of oil, described in more detail in Section 3.1, it is very likely that a rising price of oil will push the Canadian dollar above parity in the future. This has significant financial impact on both the public and private sector. For example, for every one-cent appreciation of the Canadian dollar, revenues to the Alberta treasury fall by $247 million,88while Suncor reportedly loses $37 million in annual net earnings.89
CERI does acknowledge the negative relationship between the exchange rate and the value of oil; however, it states that fiscal and monetary policies will be implemented to “prevent excessive appreciation.”90 But it remains uncertain whether fiscal and monetary policy interventions by the Canadian government and Bank of Canada would be effective in stemming excessive appreciation, let alone whether such efforts would be undertaken. Given the sensitivity of the public treasury and private sector earnings to the appreciation of the dollar, the outputs of an economic model that assumes a static value of the dollar should be approached very cautiously.
As with any economic forecast, CERI’s projections should only be considered with an understanding of the assumptions and limitations of their methodology — something that has been lacking from the public discourse in which CERI’s analysis is frequently cited.
85 Government of Canada, Budget 2012, page 88. http://www.budget.gc.ca/2012/plan/pdf/Plan2012-eng.pdf 86 Robyn Allan, An analysis of Canadian oil expansion economics (2012), 4. http://www.robynallan.com/wp-content/uploads/2012/04/An-Analysis-of-Canadian-Oil-Expansion-Economics-April-10-2012.pdf 87 Afshin Honarvar, Jon Rozhon, Dinara Millington, Thorn Walden, Carlos Murillo and Zoey Walden, Economic Impacts of New Oil Sands Projects in Alberta (2010–2035), Study no. 124 (Canadian Energy Research Institute, 2011), 34. 88 Alberta Finance, Economic Outlook: Budget 2012, 88. http://www.finance.alberta.ca/publications/budget/budget2012/fiscal-plan-economic-outlook.pdf 89 Allan, An analysis of Canadian oil expansion economics. 90 Dinara Millington, Carlos Murillo, Zoey Walden and Jon Rozhon, Canadian Oil Sands Supply Costs and Development Projects (2011-2045), Study no. 128 (Canadian Energy Research Institute, 2012), 23.
Rise of the oilsands
The Pembina Institute 25 In the Shadow of the Boom
For the purposes of this report, the results from CERI Study 125 Economic Impacts of Staged Development of Oil Sands Projects in Alberta (2010–2035) will be highlighted because this study estimates the economic benefits of both existing and proposed oilsands development based on four infrastructure development (i.e. new pipeline) scenarios. One of the development scenarios, Case 4, assumes that pipeline capacity will not be a constraint for oilsands development. This represents the most bullish oilsands development forecast currently modelled by CERI. The key economic impacts projected in this case include:91
• Canadian GDP will gain $4.9 trillion from investment and operation of oilsands projects between 2010 and 2035.
• Direct, indirect and induced oilsands employment will grow from 339,000 in 2011 to 1.6 million in 2035.92
• Alberta royalties from oilsands will grow from $3.56 billion in 2010 to $65.2 billion in 2035.
At first glance, these are impressive numbers. However, it is critical to remember the limitations of the model, and its built-in assumptions (Box 2). Relying on such modelling to justify increased oilsands expansion presents the benefits of such development — but the model is not designed to consider or produce figures representing the economic costs associated with booming oilsands development.
There have been and will continue to be tangible economic benefits from oilsands development to the Canadian economy. As oilsands production continues to increase, those benefits will also increase, creating an incredible boom for the oilsands sector. But what lies in the shadow of the boom? Are there negative economic impacts that will be created by this boom? What impact will the boom have on Canada’s broader economy? The following chapter tackles these important questions.
91 CERI, Economic Impacts of Staged Oil Sands Projects in Alberta. 92 Updated numbers from Study 125 are included for employment from Canadian Energy Research Institute Pacific Access: Linking Oil Sands Supply to New and Existing Markets, forthcoming (2012).
The Pembina Institute 26 In the Shadow of the Boom
3. In the shadow of the boom
Behind the economic growth of the oilsands sector lie a number of disconcerting trends in the Canadian economy that must be an important part of any discussion on the role of oilsands development. This chapter examines the Canadian dollar’s tight relationship with the price of oil, the extent to which the Canadian economy may be afflicted with “Dutch disease,” and the economic winners and losers during an oilsands boom.
3.1 The rise and risks of a petro-loonie “Most traders would have on their screen a graph of the Canadian dollar and a graph of WTI [West Texas Intermediate — the benchmark crude oil price for North America], and they will trade according to that...There is more than oil influencing the dollar, but it is the easiest thing to look at.”
— Charles St-Arnaud, economist at Nomura Securities Inc.93
Over the past decade the value of the Canadian dollar has appreciated steadily and dramatically relative to the U.S. dollar, from a low of US$0.61 in 2002 to a high of US$1.10 in 2007;94 it has been hovering around parity for the past year. But the rapid rise of the loonie has some currency analysts suggesting that the real worth of the loonie is lower than where it has been trading, with speculators pushing its value up.95
According to one recent study, international organizations have pegged the value of Canada’s currency at about 81 cents U.S.96 Similarly, Arthur Donner (a Toronto-based economic consultant and former adviser to the federal and Ontario governments) and Doug Peters (former chief economist of the Toronto-Dominion Bank and a former secretary of state (finance) in the federal government) recently wrote that, “Although there’s no scientific way of determining what represents fair value for the loonie, most analysts would place it in the 80- to 90-cent US
93 Jeremy Torobin and Shawn McCarthy, “Loonie is more than just a ‘petro-dollar,’ Carney says,” Globe and Mail, April 18, 2012. 94 These represent the lowest and highest exchange rates during the period January 2000 through January 2012, as documented by the Bank of Canada. Source: http://www.bankofcanada.ca/rates/exchange/can-us-rate-lookup/ 95 Tavia Grant, "Is the Canadian dollar overvalued?," Globe and Mail, January 12, 2010. http://www.theglobeandmail.com/globe-investor/investment-ideas/is-the-canadian-dollar-overvalued/article1328960/ 96 Stanford, A Cure for Dutch Disease, 2.
In the shadow of the boom
The Pembina Institute 27 In the Shadow of the Boom
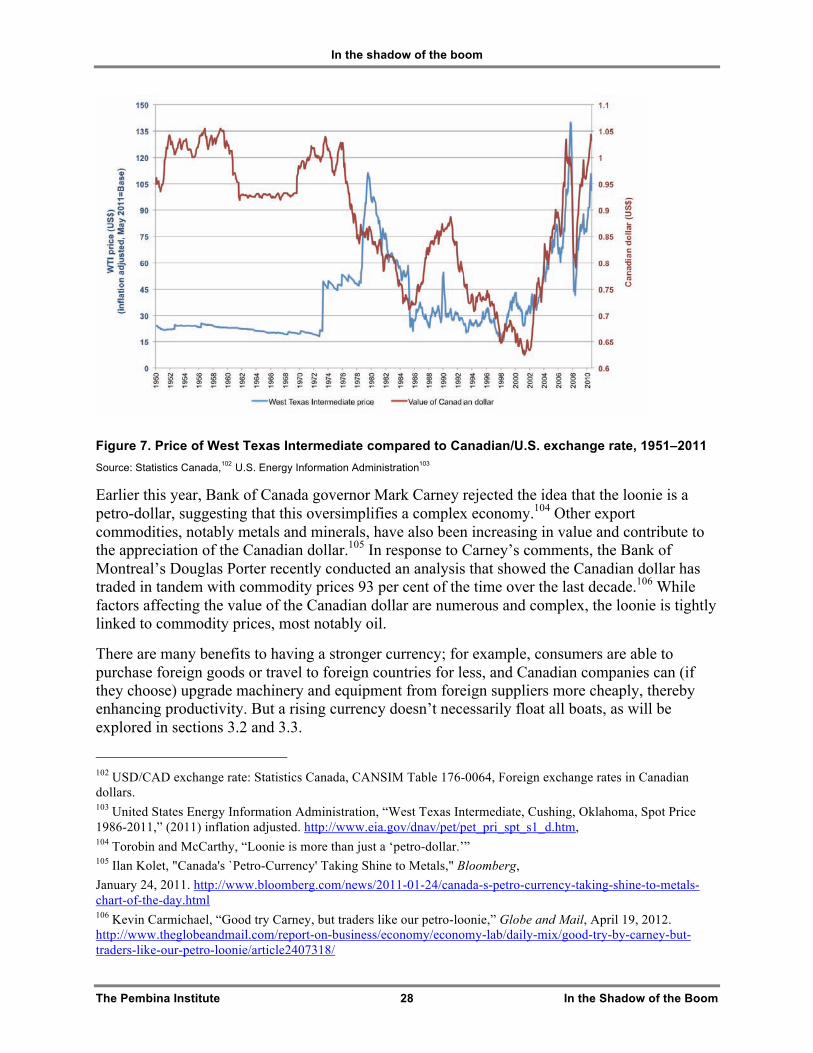
range.”97 This would suggest that the Canadian dollar is over-valued, which leads to both positive and negative economic impacts.
While numerous factors affect the value of the Canadian dollar, such as the interest rate spread98 and the value of the U.S. dollar relative to the currencies of its other major trading partners, the increasingly correlated relationship between the price of oil and the Canadian dollar has led many to dub it a “petro-currency.” As is clearly illustrated in Figure 7, this rise in the value of the Canadian dollar has closely followed trends in the price of oil.
In 2006, analysis by Desjardins Economic Studies found that the correlation between the price of oil and the value of the Canadian dollar had never been higher, concluding, “…the Canadian dollar remains first and foremost a natural resource currency.”99 Similarly, in early 2012, CERI’s regression analysis on historical data found an 82 per cent correlation between oil prices and the Canadian/U.S. exchange rate.100 The period from May 1999 to May 2011 shows an even stronger correlation of 0.92101
97 Arthur Donner and Doug Peters, "Canada’s current account deficit is a huge drain," Globe and Mail, April 9, 2012. http://www.theglobeandmail.com/news/opinions/opinion/canadas-current-account-deficit-is-a-huge-drain/article2393565/ 98 According to the World Bank, “Interest rate spread is the interest rate charged by banks on loans to prime customers minus the interest rate paid by commercial or similar banks for demand, time, or savings deposits.” World Bank, “Interest rate spread.” http://data.worldbank.org/indicator/FR.INR.LNDP 99 Martin Lefebvre, “Petrocurrency”: Good or Bad for Canadaʼs Economy?, Economic Viewpoint (Desjardins, 2006), 5. http://www.desjardins.com/en/a_propos/etudes_economiques/actualites/point_vue_economique/pve61011.pdf 100 CERI, Canadian Oil Sands Supply Costs and Development Projects. 101 Correlation between WTI (inflation adjusted) and real USD/CAD exchange rate is 0.92. USD/CAD exchange rate mean = 0.81 (SD = 0.13). WTI mean = $59.05 USD (SD = 26.73)
In the shadow of the boom
The Pembina Institute 28 In the Shadow of the Boom
Figure 7. Price of West Texas Intermediate compared to Canadian/U.S. exchange rate, 1951–2011 Source: Statistics Canada,102 U.S. Energy Information Administration103
Earlier this year, Bank of Canada governor Mark Carney rejected the idea that the loonie is a petro-dollar, suggesting that this oversimplifies a complex economy.104 Other export commodities, notably metals and minerals, have also been increasing in value and contribute to the appreciation of the Canadian dollar.105 In response to Carney’s comments, the Bank of Montreal’s Douglas Porter recently conducted an analysis that showed the Canadian dollar has traded in tandem with commodity prices 93 per cent of the time over the last decade.106 While factors affecting the value of the Canadian dollar are numerous and complex, the loonie is tightly linked to commodity prices, most notably oil.
There are many benefits to having a stronger currency; for example, consumers are able to purchase foreign goods or travel to foreign countries for less, and Canadian companies can (if they choose) upgrade machinery and equipment from foreign suppliers more cheaply, thereby enhancing productivity. But a rising currency doesn’t necessarily float all boats, as will be explored in sections 3.2 and 3.3.
102 USD/CAD exchange rate: Statistics Canada, CANSIM Table 176-0064, Foreign exchange rates in Canadian dollars. 103 United States Energy Information Administration, “West Texas Intermediate, Cushing, Oklahoma, Spot Price 1986-2011,” (2011) inflation adjusted. http://www.eia.gov/dnav/pet/pet_pri_spt_s1_d.htm, 104 Torobin and McCarthy, “Loonie is more than just a ‘petro-dollar.’” 105 Ilan Kolet, "Canada's `Petro-Currency' Taking Shine to Metals," Bloomberg, January 24, 2011. http://www.bloomberg.com/news/2011-01-24/canada-s-petro-currency-taking-shine-to-metals-chart-of-the-day.html 106 Kevin Carmichael, “Good try Carney, but traders like our petro-loonie,” Globe and Mail, April 19, 2012. http://www.theglobeandmail.com/report-on-business/economy/economy-lab/daily-mix/good-try-by-carney-but-traders-like-our-petro-loonie/article2407318/
In the shadow of the boom
The Pembina Institute 29 In the Shadow of the Boom
3.2 Oilsands fever: A Canadian strain of Dutch disease When the value of a country’s currency is closely correlated with the value of a commodity, it can lead a country to contract what is often referred to as “Dutch disease.” The term was coined by The Economist to describe a phenomenon that occurred in the 1960s in the Netherlands, when the country discovered and began to aggressively develop offshore natural gas.107 Dutch disease occurs when the real exchange rate of a country appreciates to the point where the country’s manufactured goods become too expensive to export, ultimately leading to the decline or even demise of the manufacturing sector.108 This has broader implications for the economy because the manufacturing sector tends to be more innovative than the resource sector and can develop technologies that spill over into other areas.109,110 If the manufacturing sector declines, those spillover benefits also decline. If left unchecked, this progression could lead to lower rates of growth throughout the economy when the resource boom subsides.111,112
A review of the literature turns up numerous papers, studies and reports produced by academics, think tanks and government departments over the past few decades that explore the phenomenon of Dutch disease. A survey of this literature is presented before turning to the recent “on the ground” trends in the Canadian economy.
Over the past twenty years economists have markedly changed their descriptions of Dutch disease and the Canadian economy. One 1989 study of Canada’s economy from 1962–1983 found evidence of structural adjustments that suggested Dutch disease.113 A 2005 Bank of Canada survey noted that about 50 per cent of Canadian firms surveyed were adversely affected by the appreciation of the Canadian dollar, with particular sensitivity in the textile mill, wood products, printing, chemicals, plastics and rubber, fabricated metal, computer and electronics sectors.114 Of the firms surveyed that were negatively affected, 77 per cent experienced lower profit margins on foreign sales because of the high-valued Canadian dollar.115
In 2006, an assessment by a Canadian bank and the Library of Parliament found increasing symptoms and signs of Dutch disease but noted that the “effects on the economy on the whole
107 “The Dutch Disease,” The Economist, November 26, 1977, 82–83. 108 Lefebvre, “Petrocurrency,” 9. 109 Philippe Bergevin, Energy Resources: Boon or Curse for the Canadian? prepared by Parliamentary Information and Research Service, PRB 05-86E (2006). http://www.parl.gc.ca/Content/LOP/researchpublications/prb0586-e.htm 110 The recent increases in amounts of non-valued added natural resources (e.g. coal, oilsands, potash, lumber) exported from Canada limits the spillover effect from the resource sector on the Canadian economy. 111 Mohammad Shakeri and Richard Gray, Has Canada caught Dutch Disease? Policy Brief #20 (Canadian Agricultural Innovation and Regulation Network, (2010), 3. 112 Paul Krugman, “The narrow moving band, the Dutch disease, and the competitive consequences of Mrs. Thatcher: Notes on trade in the presence of dynamic,” Journal of Development Economics 27 (1987). 113 Mohammed I. Ansari, “The Dutch disease: The Canadian evidence,” Weltwirtschaftliches Archiv 125, no. 4 (1989). 114 Jean Mair, “How the Appreciation of the Canadian Dollar Has Affected Canadian Firms: Evidence from the Bank of Canada,” Bank of Canada Review (Autumn 2005). http://www.bankofcanada.ca/2005/10/publications/periodicals/boc-review/autumn-2005-2/ 115 Ibid.
In the shadow of the boom
The Pembina Institute 30 In the Shadow of the Boom
promise to be limited” and that “expansion of oil sands production should be, on average, beneficial for the Canadian economy.”116,117
Not all economists point to the Dutch disease as the explanation for the country’s declining manufacturing sector. A 2007 Statistics Canada paper suggested that Canada was not, in fact, suffering from Dutch disease but had developed “China syndrome.”118 China syndrome is characterized by a structural shift away from manufacturing and towards the services sector, driven by increased supply of low-cost non-durable manufactured products from China.119 The paper noted that Canada’s market integration with China has not only increased imports of Chinese-manufactured products into Canada but has also created increased global demand for commodity feedstocks.120 As a result, the study suggested that China is driving an economic restructuring in Canada, with the textiles, clothing, forestry and automotive industries most impacted.121
The OECD’s 2008 Economic Survey of Canada undertook a careful examination of the restructuring of Canada’s economy, noting, “Canada confronts the challenge of a natural-resource shock having highly asymmetric impacts across the federation, in particular the large concentration of oil and gas in Alberta and the shifting of collateral costs to other regions.”122 While the survey concluded, “so far, there are no clear signs of Dutch disease,” it cautioned that the risk of developing symptoms as the oil sector grows requires careful monitoring.123 In particular, the survey identified several issues requiring attention, including:124
• profound effects on the relative revenue-raising capacities of different provinces, which would stretch the capabilities of the equalization system, creating an unprecedented source of imbalance in the Canadian federation,
• corporate tax preferences to the resource sector (including generous tax write-offs for exploration and development expenses in the resource sector, and deductibility of provincial resource levies from the federal corporate tax base) that further add to the natural advantage of resource-rich regions, and,
• fiscal migration due to the attraction of low taxes and high public spending (as opposed to inherent productivity differences) that could amplify the excessive movement of resources from exposed traditional sectors toward the non-renewable resource sector.
Following the 2008–09 recession, a 2010 Conference Board of Canada report noted: “Canadian firms are now being exposed to the Dutch disease virus. Some firms will not be able to adapt quickly enough to the upward shift in the loonie, just as some firms were unable to adapt to 116 Lefebvre, “Petrocurrency,” 9. 117 Bergevin, Energy Resources: Boon or Curse for the Canadian?, 12. 118 Ryan Macdonald, “Not Dutch Disease, Itʼs China Syndrome,” Canadian Economic Observer, 11-010 (2007). http://www.statcan.gc.ca/pub/11-010-x/00807/10305-eng.htm 119 Ibid. 120 Ibid. 121 Ibid. 122 OECD, OECD Economic Surveys: Canada (2008), 43. Available at http://www.oecd.org/document/3/0,3746,en_2649_34111_40732867_1_1_1_1,00.html 123 Ibid., 25. 124 Ibid., 87.
In the shadow of the boom
The Pembina Institute 31 In the Shadow of the Boom
earlier structural changes (such as the Free Trade Agreement, or much higher energy and commodity prices). These firms will fall prey and could well succumb to the Dutch disease.”125
“As the commodity-driven loonie rises, it becomes too expensive to produce innovative goods and services in Canada. Canadian firms exporting such world-beating products as asset management services (Manulife), regional jets (Bombardier) and addicting handhelds (RIM) have been forced by the strong dollar to move at least part of their operations to lower-cost jurisdictions. That’s Dutch disease. That’s the weakness of a strong loonie.”
— Daniel Trefler, “The Loonacy of Parity.”126
Also in 2010, researchers at the University of Saskatchewan found that 53 of 80 industries modelled experienced, on average, a 0.93 per cent decrease in annual growth as a result of an increase in energy prices (after controlling for other major factors, including energy use).127 They concluded that there is “…some evidence of Dutch Disease in the Canadian economy (at least in some industries)” and recommended that future research investigate “…what Canada can do to immunize its economy against this disease and avoid permanent lower rates of growth resulting from a contraction of tradable innovative industries.”128
In 2011, the Montreal-based investment strategy firm Macro Research Board (MRB) Partners announced that a “severe case of Dutch disease has dramatically reduced the breadth of the Canadian business sector over the past decade, hollowing out manufactured goods' exporters and making the nation increasingly reliant on commodity demand.”129 MRB has called the appreciating Canadian dollar a “severe drag on non-commodity exporters,”130 and believes the non-commodity export sector (e.g. vehicles) is no longer competitive and rapidly losing market share.131
Writing in Policy Options in late 2011, economists from Canada Economic Development explored some of the unique attributes of Canada’s experience with Dutch disease noting, “…facts on the ground strongly suggest that Canada might suffer from its own strain of the Dutch disease.”132 Unlike the classic Dutch example, in which the true impact is not felt until the end of the resource boom when a deteriorated manufacturing sector can not fill the economic void, Canada’s geography means that “certain regions of Canada suffer the adverse
125 Glen Hodgson, Learning to Live With a Strong Canadian Dollar (Conference Board of Canada, 2010), 7. 126 Daniel Trefler, “The Loonacy of Parity: How a strong dollar is weakening Canada,” Globe and Mail, October 16, 2010. http://www.theglobeandmail.com/news/opinions/opinion/the-loonacy-of-parity-how-a-strong-dollar-is-weakening-canada/article1759483/ 127 Shakeri and Gray, Has Canada caught Dutch Disease?, 5. 128 Ibid., 2 129 MRB Partners, O Canada (Part I) and Uh-Oh Canada (Part II), 23. 130 Ibid., 3. 131 Ibid., 4. 132 Célestin Bimenyimana and Luc Valée, “Curing the Dutch disease in Canada,” Policy Options (November 2011), 75.
In the shadow of the boom
The Pembina Institute 32 In the Shadow of the Boom
consequences of a resource boom almost immediately, not only once the resource boom has faltered.”133
A 2012 report published by the Institute for Research on Public Policy (IRPP) investigated the links between energy prices, exchange rates and output trends in 80 subindustries of the manufacturing sector between 1992-2007,134 and concluded that “Canada suffers form a mild case of the Dutch disease.”135 Based upon its statistical analysis, it found that at the level of major manufacturing industry groups, 11 of 18 industries experienced “a decline in output due to rising energy prices and the associated exchange rate increase.”136 Disaggregating these major groups into their subindustries found that while nine subindustries benefited from a strengthened Canadian dollar, 25 subindustries suffered from Dutch disease.137 As noted above, a central concern associated with Dutch disease is the loss of innovation capacity associated with a weakened manufacturing sector. However, the IRPP study suggested, “the distribution of R&D spending combined with the industry-level analysis of the Dutch disease suggests that this is not a likely outcome in Canada.”138
A forthcoming study by economists Michael Beine, Charles Bos and Serge Coulombe, and commissioned by Industry Canada, noted that many commentators “…underline the opposition between economic benefits and environmental costs. Nevertheless, this view neglects that the economic effects display a bright and a dark side.”139 The study explicitly focused on understanding the dynamics of the Canada/U.S. exchange rate and the price of oil, seeking to understand the extent to which the decrease in manufacturing employment could be ascribed to the rise in oil prices. It found that between 2002-2008 Canada was suffering from at least a partial case of Dutch disease, with 42 per cent of the appreciation of the Canada/U.S exchange rate driven by commodity and energy prices,140 and this appreciation accounting for between 33 and 39 per cent of the decline in employment in the manufacturing sector.141 The study concludes “the economics of the tar sands has its own dark side” — Dutch disease — with the “losers… regionally located in Southern Ontario and Quebec, which in turn might increase regional frictions and fragmentation in a country that is highly decentralized.”142
In recent months, public discourse has centred around trends in sectors of the Canadian economy — notably the continued rise of resource commodities and decline of manufacturing — that have sparked interprovincial tension. Asked recently to comment on Dutch disease, Bank of Canada
133 Ibid., 76. 134 Mohammad Shakeri, Richard S. Gray and Jeremy Leonard, Dutch Disease or failure to compete? A Diagnosis of Canada’s Manufacturing Woes, IRPP Study No. 30. (Institute for Research on Public Policy, 2012), 4. 135 Ibid. 23. 136 Ibid. 15. 137 Ibid. 13. 138 Ibid. 18. 139 Michel Beine, Charles S. Bos and Serge Coulombe, “Does the Canadian Economy Suffer from the Dutch Disease?” (Forthcoming in Resource and Energy Economics), 2. http://aix1.uottawa.ca/~scoulomb/pages/dutchdiseaserev_forthcoming.pdf 140 Ibid., 18. 141 Ibid., 24. 142 Ibid., 24.
In the shadow of the boom
The Pembina Institute 33 In the Shadow of the Boom
governor Mark Carney noted that Canada’s export performance was not solely being affected by the strength of the Canadian dollar, but also by poor productivity performance and current export market orientation.143 Economist Jack Mintz, writing in the National Post, similarly suggested that Dutch disease explains little about changes in the Canadian economy, noting that “…manufacturing in Ontario, industrial states and the United States in general has been on a steady decline for 35 years.”144 Conversely, economist Jim Stanford contends that Canada’s version of Dutch disease has contributed to an “…overall deterioration in labour market, productivity, and international trade indicators that…has been negative for Canada as a whole.”145
The relationship between oil prices, the Canadian dollar and the state of sectors and industries (whether they are expanding or contracting) is undoubtedly complex and subject to varying interpretations. That said, in recent years (see Figure 8) there is an increasingly common view that Canada is experiencing some significant changes within the economy that are related, at least in part, to the dramatic rise in value of the Canadian dollar and the role of oilsands in our economy.
143 Mark Carney, interview, The House, CBC Radio, April 21, 2012. http://www.cbc.ca/thehouse/promonoblog/2012/04/21/house-additions-mark-carney/ 144 Jack Mintz, "No Dutch disease here," Financial Post, March 3, 2012. http://www.nationalpost.com/todays-paper/Dutch+disease+here/6244951/story.html 145 Stanford, A Cure for Dutch Disease, 2-3.
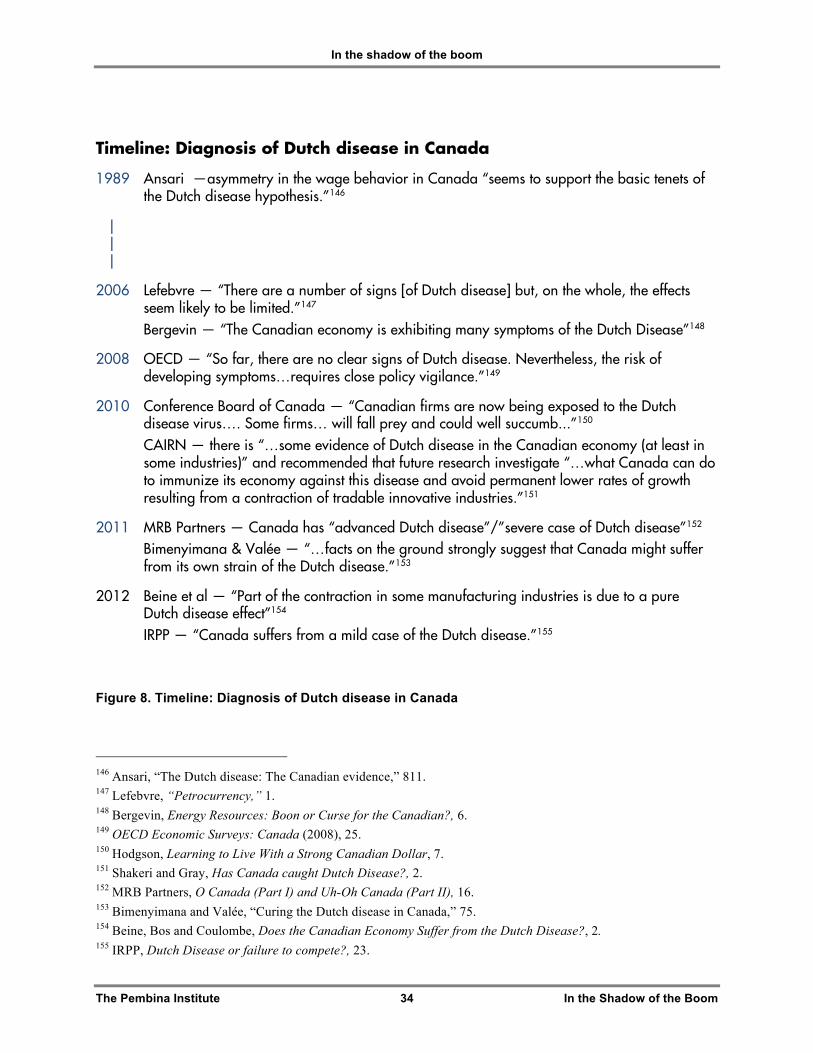
In the shadow of the boom
The Pembina Institute 34 In the Shadow of the Boom
Timeline: Diagnosis of Dutch disease in Canada
1989 Ansari —asymmetry in the wage behavior in Canada “seems to support the basic tenets of the Dutch disease hypothesis.”146
| | |
2006 Lefebvre — “There are a number of signs [of Dutch disease] but, on the whole, the effects seem likely to be limited.”147
Bergevin — “The Canadian economy is exhibiting many symptoms of the Dutch Disease”148
2008 OECD — “So far, there are no clear signs of Dutch disease. Nevertheless, the risk of developing symptoms…requires close policy vigilance.”149
2010 Conference Board of Canada — “Canadian firms are now being exposed to the Dutch disease virus…. Some firms… will fall prey and could well succumb...”150
CAIRN — there is “…some evidence of Dutch disease in the Canadian economy (at least in some industries)” and recommended that future research investigate “…what Canada can do to immunize its economy against this disease and avoid permanent lower rates of growth resulting from a contraction of tradable innovative industries.”151
2011 MRB Partners — Canada has “advanced Dutch disease”/”severe case of Dutch disease”152 Bimenyimana & Valée — “…facts on the ground strongly suggest that Canada might suffer
from its own strain of the Dutch disease.”153
2012 Beine et al — “Part of the contraction in some manufacturing industries is due to a pure Dutch disease effect”154
IRPP — “Canada suffers from a mild case of the Dutch disease.”155
Figure 8. Timeline: Diagnosis of Dutch disease in Canada
146 Ansari, “The Dutch disease: The Canadian evidence,” 811. 147 Lefebvre, “Petrocurrency,” 1. 148 Bergevin, Energy Resources: Boon or Curse for the Canadian?, 6. 149 OECD Economic Surveys: Canada (2008), 25. 150 Hodgson, Learning to Live With a Strong Canadian Dollar, 7. 151 Shakeri and Gray, Has Canada caught Dutch Disease?, 2. 152 MRB Partners, O Canada (Part I) and Uh-Oh Canada (Part II), 16. 153 Bimenyimana and Valée, “Curing the Dutch disease in Canada,” 75. 154 Beine, Bos and Coulombe, Does the Canadian Economy Suffer from the Dutch Disease?, 2. 155 IRPP, Dutch Disease or failure to compete?, 23.
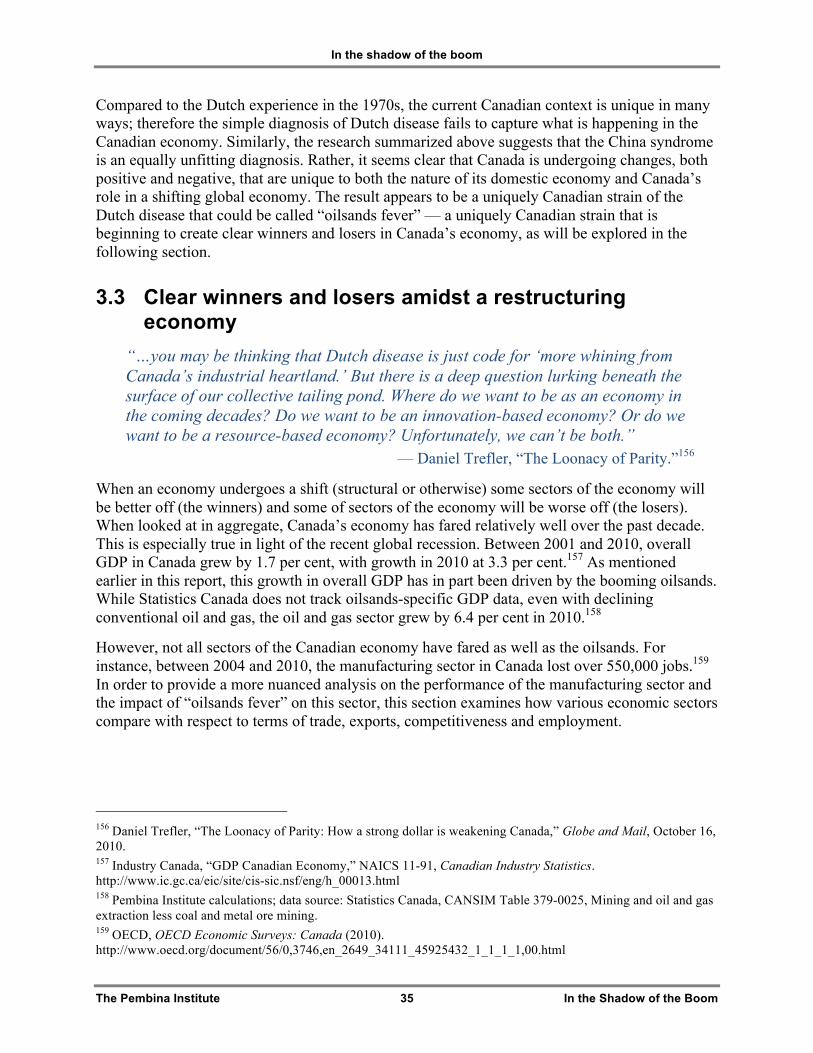
In the shadow of the boom
The Pembina Institute 35 In the Shadow of the Boom
Compared to the Dutch experience in the 1970s, the current Canadian context is unique in many ways; therefore the simple diagnosis of Dutch disease fails to capture what is happening in the Canadian economy. Similarly, the research summarized above suggests that the China syndrome is an equally unfitting diagnosis. Rather, it seems clear that Canada is undergoing changes, both positive and negative, that are unique to both the nature of its domestic economy and Canada’s role in a shifting global economy. The result appears to be a uniquely Canadian strain of the Dutch disease that could be called “oilsands fever” — a uniquely Canadian strain that is beginning to create clear winners and losers in Canada’s economy, as will be explored in the following section.
3.3 Clear winners and losers amidst a restructuring economy
“…you may be thinking that Dutch disease is just code for ‘more whining from Canada’s industrial heartland.’ But there is a deep question lurking beneath the surface of our collective tailing pond. Where do we want to be as an economy in the coming decades? Do we want to be an innovation-based economy? Or do we want to be a resource-based economy? Unfortunately, we can’t be both.”
— Daniel Trefler, “The Loonacy of Parity.”156
When an economy undergoes a shift (structural or otherwise) some sectors of the economy will be better off (the winners) and some of sectors of the economy will be worse off (the losers). When looked at in aggregate, Canada’s economy has fared relatively well over the past decade. This is especially true in light of the recent global recession. Between 2001 and 2010, overall GDP in Canada grew by 1.7 per cent, with growth in 2010 at 3.3 per cent.157 As mentioned earlier in this report, this growth in overall GDP has in part been driven by the booming oilsands. While Statistics Canada does not track oilsands-specific GDP data, even with declining conventional oil and gas, the oil and gas sector grew by 6.4 per cent in 2010.158
However, not all sectors of the Canadian economy have fared as well as the oilsands. For instance, between 2004 and 2010, the manufacturing sector in Canada lost over 550,000 jobs.159 In order to provide a more nuanced analysis on the performance of the manufacturing sector and the impact of “oilsands fever” on this sector, this section examines how various economic sectors compare with respect to terms of trade, exports, competitiveness and employment.
156 Daniel Trefler, “The Loonacy of Parity: How a strong dollar is weakening Canada,” Globe and Mail, October 16, 2010. 157 Industry Canada, “GDP Canadian Economy,” NAICS 11-91, Canadian Industry Statistics. http://www.ic.gc.ca/eic/site/cis-sic.nsf/eng/h_00013.html 158 Pembina Institute calculations; data source: Statistics Canada, CANSIM Table 379-0025, Mining and oil and gas extraction less coal and metal ore mining. 159 OECD, OECD Economic Surveys: Canada (2010). http://www.oecd.org/document/56/0,3746,en_2649_34111_45925432_1_1_1_1,00.html
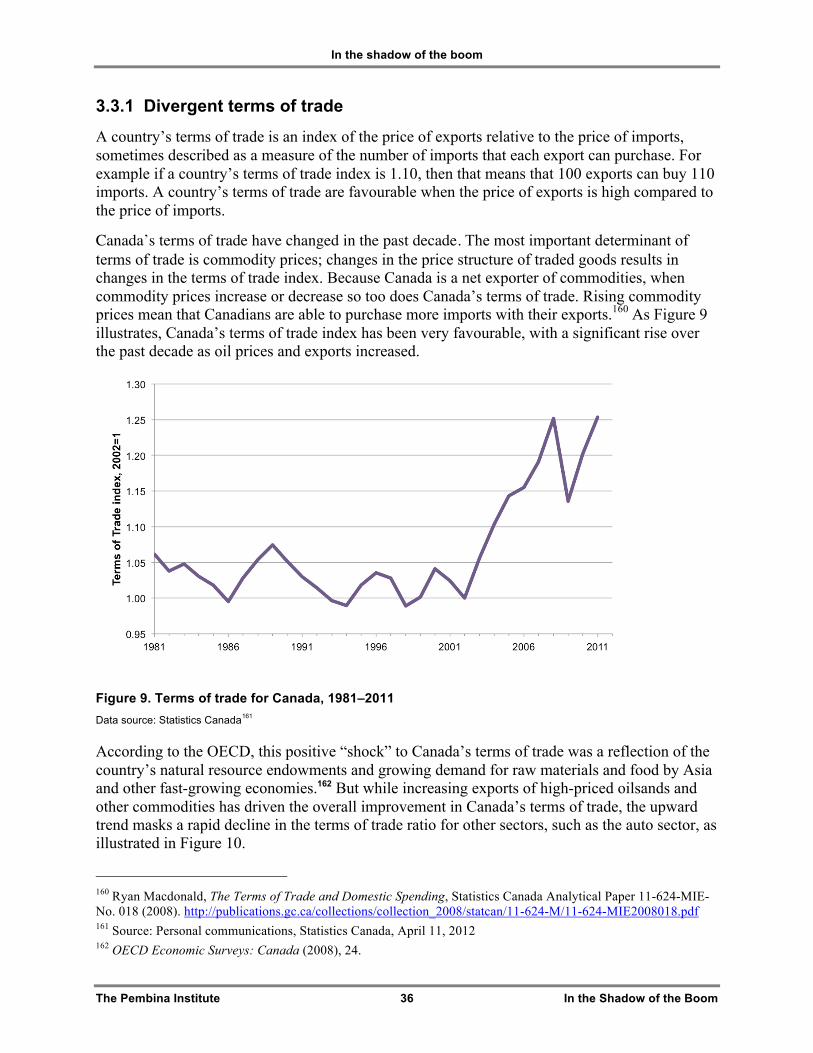
In the shadow of the boom
The Pembina Institute 36 In the Shadow of the Boom
3.3.1 Divergent terms of trade
A country’s terms of trade is an index of the price of exports relative to the price of imports, sometimes described as a measure of the number of imports that each export can purchase. For example if a country’s terms of trade index is 1.10, then that means that 100 exports can buy 110 imports. A country’s terms of trade are favourable when the price of exports is high compared to the price of imports.
Canada’s terms of trade have changed in the past decade. The most important determinant of terms of trade is commodity prices; changes in the price structure of traded goods results in changes in the terms of trade index. Because Canada is a net exporter of commodities, when commodity prices increase or decrease so too does Canada’s terms of trade. Rising commodity prices mean that Canadians are able to purchase more imports with their exports.160 As Figure 9 illustrates, Canada’s terms of trade index has been very favourable, with a significant rise over the past decade as oil prices and exports increased.
Figure 9. Terms of trade for Canada, 1981–2011 Data source: Statistics Canada161
According to the OECD, this positive “shock” to Canada’s terms of trade was a reflection of the country’s natural resource endowments and growing demand for raw materials and food by Asia and other fast-growing economies.162 But while increasing exports of high-priced oilsands and other commodities has driven the overall improvement in Canada’s terms of trade, the upward trend masks a rapid decline in the terms of trade ratio for other sectors, such as the auto sector, as illustrated in Figure 10.
160 Ryan Macdonald, The Terms of Trade and Domestic Spending, Statistics Canada Analytical Paper 11-624-MIE-No. 018 (2008). http://publications.gc.ca/collections/collection_2008/statcan/11-624-M/11-624-MIE2008018.pdf 161 Source: Personal communications, Statistics Canada, April 11, 2012 162 OECD Economic Surveys: Canada (2008), 24.
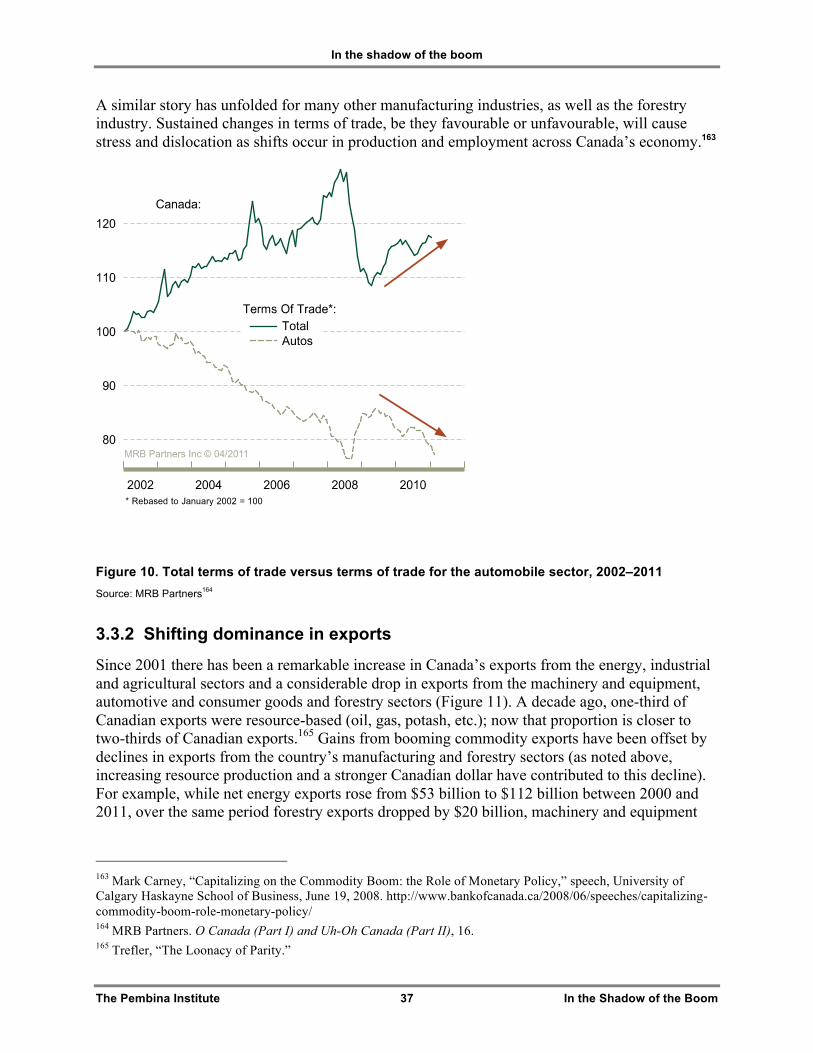
In the shadow of the boom
The Pembina Institute 37 In the Shadow of the Boom
A similar story has unfolded for many other manufacturing industries, as well as the forestry industry. Sustained changes in terms of trade, be they favourable or unfavourable, will cause stress and dislocation as shifts occur in production and employment across Canada’s economy.163
Figure 10. Total terms of trade versus terms of trade for the automobile sector, 2002–2011 Source: MRB Partners164
3.3.2 Shifting dominance in exports
Since 2001 there has been a remarkable increase in Canada’s exports from the energy, industrial and agricultural sectors and a considerable drop in exports from the machinery and equipment, automotive and consumer goods and forestry sectors (Figure 11). A decade ago, one-third of Canadian exports were resource-based (oil, gas, potash, etc.); now that proportion is closer to two-thirds of Canadian exports.165 Gains from booming commodity exports have been offset by declines in exports from the country’s manufacturing and forestry sectors (as noted above, increasing resource production and a stronger Canadian dollar have contributed to this decline). For example, while net energy exports rose from $53 billion to $112 billion between 2000 and 2011, over the same period forestry exports dropped by $20 billion, machinery and equipment
163 Mark Carney, “Capitalizing on the Commodity Boom: the Role of Monetary Policy,” speech, University of Calgary Haskayne School of Business, June 19, 2008. http://www.bankofcanada.ca/2008/06/speeches/capitalizing-commodity-boom-role-monetary-policy/ 164 MRB Partners. O Canada (Part I) and Uh-Oh Canada (Part II), 16. 165 Trefler, “The Loonacy of Parity.”
In the shadow of the boom
The Pembina Institute 38 In the Shadow of the Boom
exports dropped by $29 billion, and automotive product exports dropped by nearly $39 billion.166 This decline in other sectors is masked by the rise in resource commodities, which in turn is being driven by oilsands.
Figure 11. Change in nominal Canadian exports, 2000–2011 Data source: Statistics Canada167
3.3.3 Non-commodity exports struggling to compete
As discussed in Section 3.2, part of the reason why non-commodity exports have been struggling is due to the “China syndrome” and the global shift of manufacturing to China. However, as described above, the high-valued loonie is also a major reason why the Canadian manufacturing sector is contracting. Investment strategy and consulting firm MacroResearchBoard (MRB) has called the appreciating Canadian dollar a “severe drag on non-commodity exporters.”168 MRB believes the non-commodity export sector is no longer competitive and is rapidly losing market share.169 The appreciation of the Canadian dollar has the strongest negative effect on the textile mills, wood products, printing, chemicals, plastics and rubber, fabricated metal, computer and electronics sectors.170
166 Statistics Canada, CANSIM Table 228-0043, “Merchandise imports and exports by sector and sub-sector, customs and balance of payments basis, for all countries.” http://www5.statcan.gc.ca/cansim/a05?lang=eng&id=2280043 167 Ibid. 168 MRB Partners, O Canada (Part I) and Uh-Oh Canada (Part II). 169 Ibid. 170 Mair, “How the Appreciation of the Canadian Dollar Has Affected Canadian Firms.”
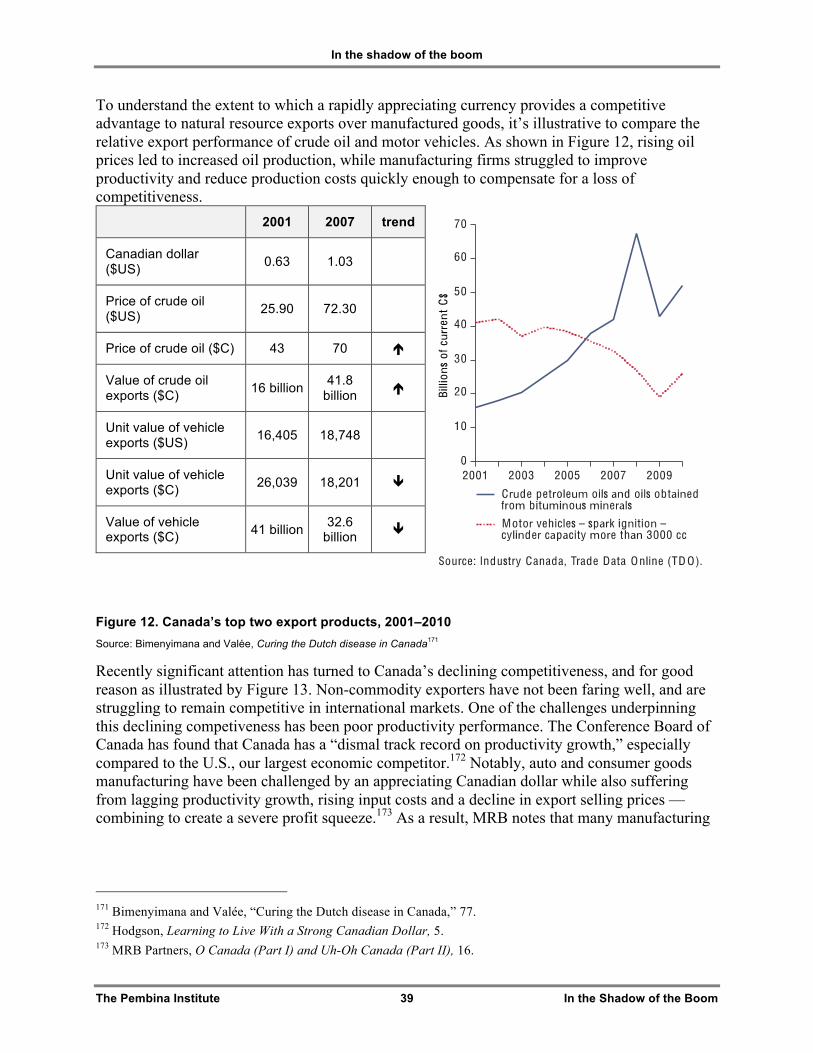
In the shadow of the boom
The Pembina Institute 39 In the Shadow of the Boom
To understand the extent to which a rapidly appreciating currency provides a competitive advantage to natural resource exports over manufactured goods, it’s illustrative to compare the relative export performance of crude oil and motor vehicles. As shown in Figure 12, rising oil prices led to increased oil production, while manufacturing firms struggled to improve productivity and reduce production costs quickly enough to compensate for a loss of competitiveness.
2001 2007 trend
Canadian dollar ($US) 0.63 1.03
Price of crude oil ($US) 25.90 72.30
Price of crude oil ($C) 43 70
Value of crude oil exports ($C) 16 billion 41.8
billion
Unit value of vehicle exports ($US) 16,405 18,748
Unit value of vehicle exports ($C) 26,039 18,201
Value of vehicle exports ($C) 41 billion 32.6
billion
Figure 12. Canada’s top two export products, 2001–2010 Source: Bimenyimana and Valée, Curing the Dutch disease in Canada171
Recently significant attention has turned to Canada’s declining competitiveness, and for good reason as illustrated by Figure 13. Non-commodity exporters have not been faring well, and are struggling to remain competitive in international markets. One of the challenges underpinning this declining competiveness has been poor productivity performance. The Conference Board of Canada has found that Canada has a “dismal track record on productivity growth,” especially compared to the U.S., our largest economic competitor.172 Notably, auto and consumer goods manufacturing have been challenged by an appreciating Canadian dollar while also suffering from lagging productivity growth, rising input costs and a decline in export selling prices — combining to create a severe profit squeeze.173 As a result, MRB notes that many manufacturing
171 Bimenyimana and Valée, “Curing the Dutch disease in Canada,” 77. 172 Hodgson, Learning to Live With a Strong Canadian Dollar, 5. 173 MRB Partners, O Canada (Part I) and Uh-Oh Canada (Part II), 16.
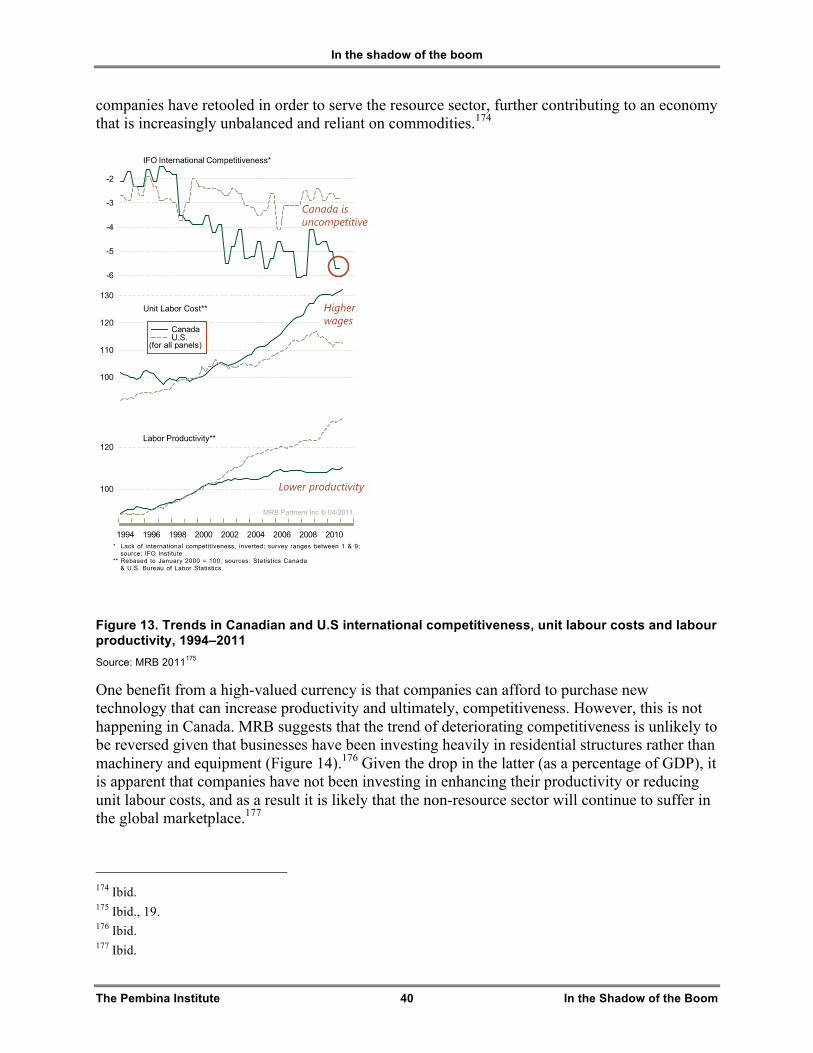
In the shadow of the boom
The Pembina Institute 40 In the Shadow of the Boom
companies have retooled in order to serve the resource sector, further contributing to an economy that is increasingly unbalanced and reliant on commodities.174
Figure 13. Trends in Canadian and U.S international competitiveness, unit labour costs and labour productivity, 1994–2011 Source: MRB 2011175
One benefit from a high-valued currency is that companies can afford to purchase new technology that can increase productivity and ultimately, competitiveness. However, this is not happening in Canada. MRB suggests that the trend of deteriorating competitiveness is unlikely to be reversed given that businesses have been investing heavily in residential structures rather than machinery and equipment (Figure 14).176 Given the drop in the latter (as a percentage of GDP), it is apparent that companies have not been investing in enhancing their productivity or reducing unit labour costs, and as a result it is likely that the non-resource sector will continue to suffer in the global marketplace.177
174 Ibid. 175 Ibid., 19. 176 Ibid. 177 Ibid.
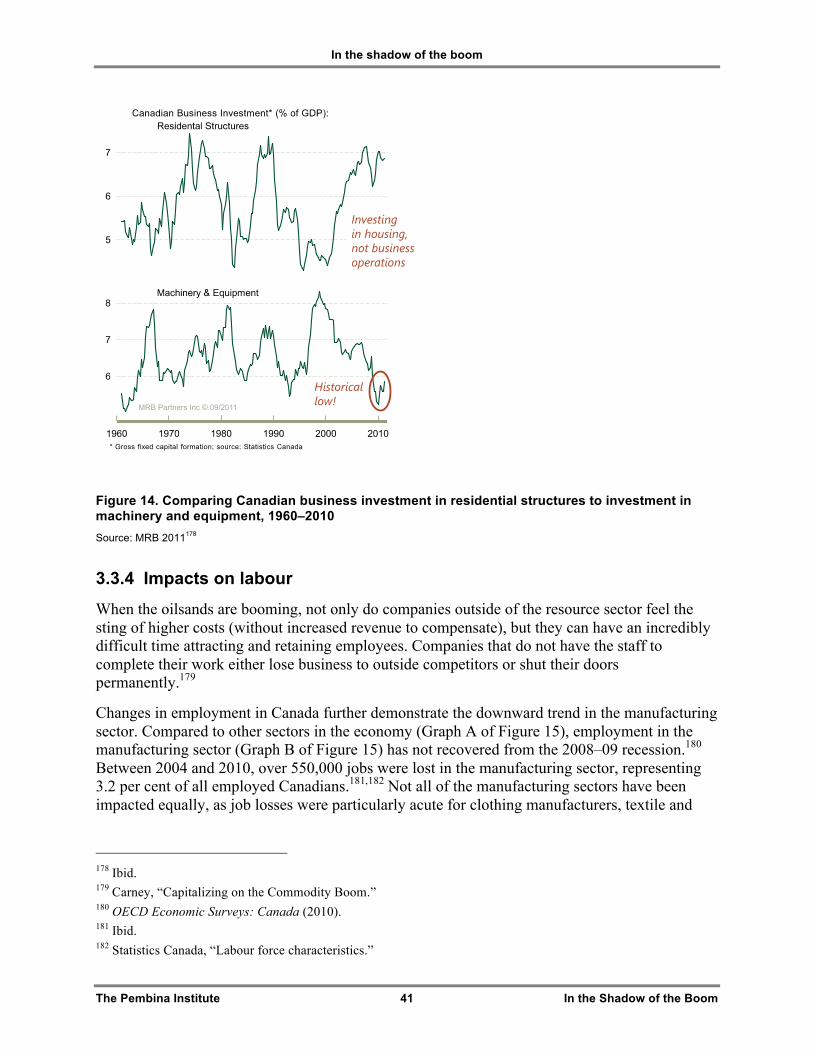
In the shadow of the boom
The Pembina Institute 41 In the Shadow of the Boom
Figure 14. Comparing Canadian business investment in residential structures to investment in machinery and equipment, 1960–2010 Source: MRB 2011178
3.3.4 Impacts on labour
When the oilsands are booming, not only do companies outside of the resource sector feel the sting of higher costs (without increased revenue to compensate), but they can have an incredibly difficult time attracting and retaining employees. Companies that do not have the staff to complete their work either lose business to outside competitors or shut their doors permanently.179
Changes in employment in Canada further demonstrate the downward trend in the manufacturing sector. Compared to other sectors in the economy (Graph A of Figure 15), employment in the manufacturing sector (Graph B of Figure 15) has not recovered from the 2008–09 recession.180 Between 2004 and 2010, over 550,000 jobs were lost in the manufacturing sector, representing 3.2 per cent of all employed Canadians.181,182 Not all of the manufacturing sectors have been impacted equally, as job losses were particularly acute for clothing manufacturers, textile and
178 Ibid. 179 Carney, “Capitalizing on the Commodity Boom.” 180 OECD Economic Surveys: Canada (2010). 181 Ibid. 182 Statistics Canada, “Labour force characteristics.”
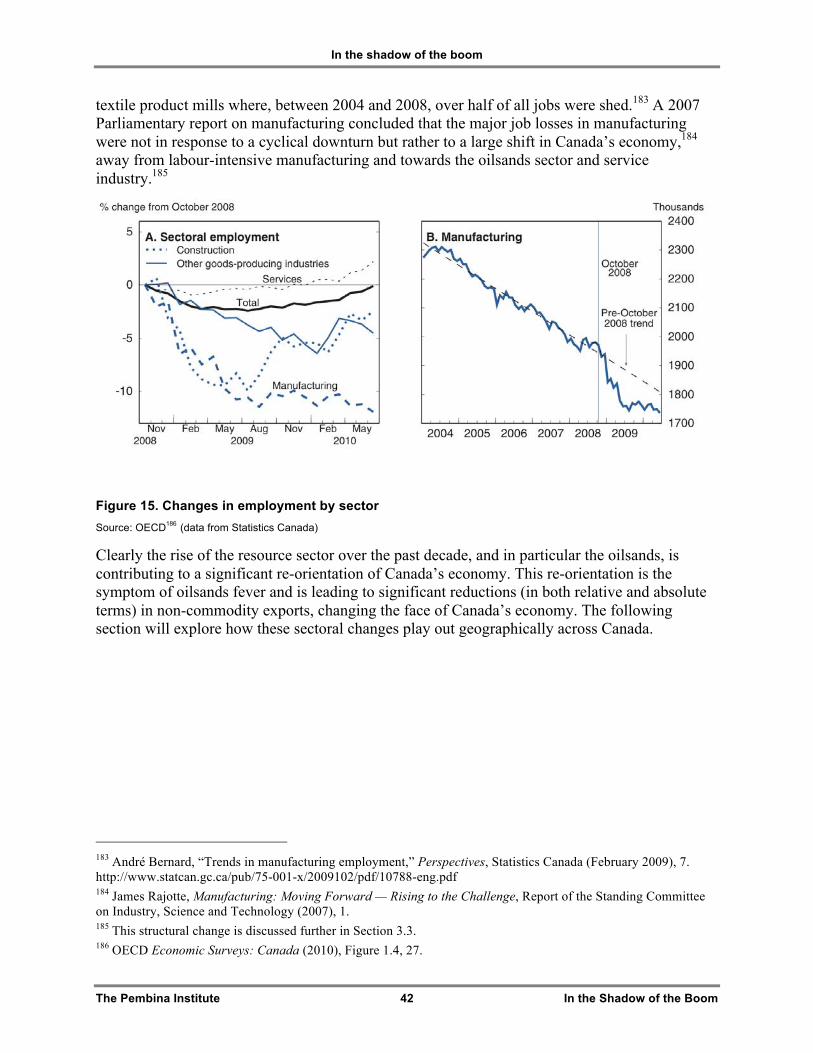
In the shadow of the boom
The Pembina Institute 42 In the Shadow of the Boom
textile product mills where, between 2004 and 2008, over half of all jobs were shed.183 A 2007 Parliamentary report on manufacturing concluded that the major job losses in manufacturing were not in response to a cyclical downturn but rather to a large shift in Canada’s economy,184 away from labour-intensive manufacturing and towards the oilsands sector and service industry.185
Figure 15. Changes in employment by sector Source: OECD186 (data from Statistics Canada)
Clearly the rise of the resource sector over the past decade, and in particular the oilsands, is contributing to a significant re-orientation of Canada’s economy. This re-orientation is the symptom of oilsands fever and is leading to significant reductions (in both relative and absolute terms) in non-commodity exports, changing the face of Canada’s economy. The following section will explore how these sectoral changes play out geographically across Canada.
183 André Bernard, “Trends in manufacturing employment,” Perspectives, Statistics Canada (February 2009), 7. http://www.statcan.gc.ca/pub/75-001-x/2009102/pdf/10788-eng.pdf 184 James Rajotte, Manufacturing: Moving Forward — Rising to the Challenge, Report of the Standing Committee on Industry, Science and Technology (2007), 1. 185 This structural change is discussed further in Section 3.3. 186 OECD Economic Surveys: Canada (2010), Figure 1.4, 27.
The Pembina Institute 43 In the Shadow of the Boom
4. The economic implications of the oilsands boom
4.1 Provincial fault lines and the national fabric “We [western Canadians] kind of joke about this eastern alienation. But then I usually sober them down and say, ‘You remember how you felt when you thought you were out of it. ... Nobody in the country should ever feel out of it like that again.’ It’s interesting, audiences will applaud that ... they remember.”
– Preston Manning, Manning Centre for Building Democracy187
In 2008, the OECD noted that oilsands development is “generating large regional disparities, especially because some provinces are affected by negative externalities through the currency appreciation and have questioned the appropriateness of current inter-provincial redistribution mechanisms.”188 It is apparent that the economic impacts of oilsands development, both positive and negative, continue to strain relationships between provinces; for example, note the war of words earlier this year between Ontario Premier McGuinty and Alberta Premier Redford regarding the “petro-dollar” and the relative benefits of oilsands development,189 and more recently between federal NDP leader Thomas Mulcair,190 western provincial leaders and western thought leaders over the Dutch disease.191 Given the projected oilsands development and the current priority of the federal government on further fast-tracking that development, while minimizing its own role, it is likely that this current turf war between Alberta and Ontario is a sign of things to come.
This section looks at regional differences created by the oilsands boom and the economic losses from contraction of the manufacturing sector with respect to GDP growth, employment and inflation. The chapter concludes by examining the impact that oil price volatility can have on
187 Jane Taber, "As political centre shifts, Manning now fears ‘eastern alienation,’" Globe and Mail, January 24, 2012. http://www.theglobeandmail.com/news/politics/ottawa-notebook/as-political-centre-shifts-manning-now-fears-eastern-alienation/article2312763/?utm_medium=Feeds%3A%20RSS%2FAtom&utm_source=Home&utm_content=2312763 188 OECD Economic Surveys: Canada (2008), 109 189 Howlett and Walton, “Redford's energy vision clashes with McGuinty's.” 190 Barbara Yaffe, “Mulcair faces a ‘western front’ on oilsands,” Financial Post, May 9, 2012. http://business.financialpost.com/2012/05/09/mulcair-faces-a-western-front-on-oil-sands/ 191 Roger Gibbins, “Gibbins: Oilsands criticism reveals Mulcair’s naivete,” Canada.com, May 8, 2012, http://www.canada.com/opinion/op-ed/Gibbins+Oilsands+criticism+reveals+Mulcair+naivete/6581515/story.html
The economic implications of the oilsands boom
The Pembina Institute 44 In the Shadow of the Boom
government revenue, drawing from Alberta’s challenge with balancing oil development and the provincial budget.
4.1.1 Economic decline in the manufacturing heartland
“At its most basic, Canada’s struggle pits resource producers against non-resource manufacturers; the former capitalizing on a global economic boom, the latter victim to a premium exchange rate, a slumping U.S., and competition from overseas players (whose very success, in a cruel twist of irony, is behind so much of the demand for Canada’s resources). Given resource concentration and the orientation of production/trade, Canada’s industry struggle is easily translated along provincial boundaries.”
— Warren Lovely, “Canada’s Contemporary Class Struggle.”192
As was explored in Chapter 3, manufacturing sectors are struggling to compete and have begun to decline, while the oilsands and other resource sectors boom. On the ground, this dichotomy is playing out along provincial boundaries. For example, the manufacturing-heavy provinces of Quebec and Ontario have fared worse than other regions in Canada.193 In its Provincial and Territorial Economic Accounts Review, Statistics Canada observed, “The size of the resource-based economies of Alberta, Saskatchewan and Newfoundland and Labrador has been increasing relative to the central Canadian economies over the last decade.”194 Looking at real GDP growth between 2000 and 2010, Ontario and Quebec (at 16 and 18 per cent, respectively) lagged behind the rest of the nation (Figure 16).
192 Jeff Rubin, “Fueling Inflation,” CIBC World Markets StrategeEcon (October 2007). 8. http://research.cibcwm.com/economic_public/download/soct07.pdf 193 Jules Dufort, Impact of the Exchange Rate Appreciation on Quebec Export and GDP Growth,” Ministere du Developpement economiqu et regional et de la recherché (2004), 9. 194 Statistics Canada, Provincial and Territorial Economic Accounts Review, 13-016-X (2010). http://www.statcan.gc.ca/pub/13-016-x/13-016-x2011001-eng.htm
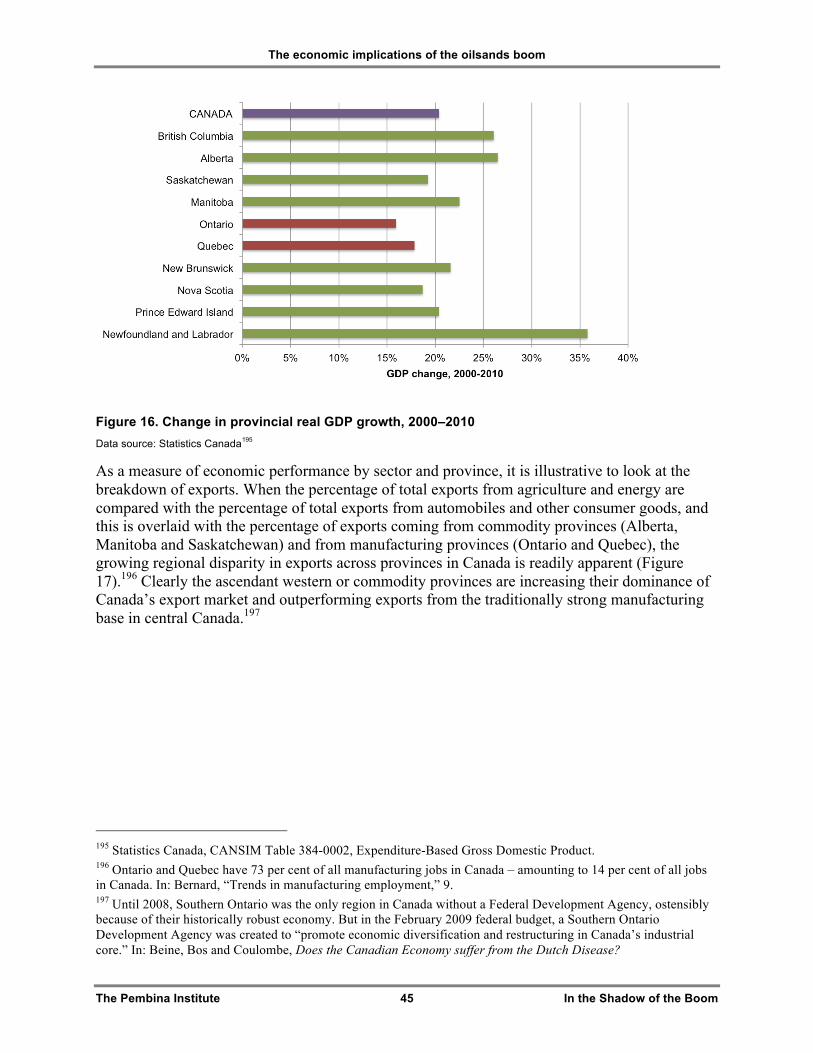
The economic implications of the oilsands boom
The Pembina Institute 45 In the Shadow of the Boom
Figure 16. Change in provincial real GDP growth, 2000–2010 Data source: Statistics Canada195
As a measure of economic performance by sector and province, it is illustrative to look at the breakdown of exports. When the percentage of total exports from agriculture and energy are compared with the percentage of total exports from automobiles and other consumer goods, and this is overlaid with the percentage of exports coming from commodity provinces (Alberta, Manitoba and Saskatchewan) and from manufacturing provinces (Ontario and Quebec), the growing regional disparity in exports across provinces in Canada is readily apparent (Figure 17).196 Clearly the ascendant western or commodity provinces are increasing their dominance of Canada’s export market and outperforming exports from the traditionally strong manufacturing base in central Canada.197
195 Statistics Canada, CANSIM Table 384-0002, Expenditure-Based Gross Domestic Product. 196 Ontario and Quebec have 73 per cent of all manufacturing jobs in Canada – amounting to 14 per cent of all jobs in Canada. In: Bernard, “Trends in manufacturing employment,” 9. 197 Until 2008, Southern Ontario was the only region in Canada without a Federal Development Agency, ostensibly because of their historically robust economy. But in the February 2009 federal budget, a Southern Ontario Development Agency was created to “promote economic diversification and restructuring in Canada’s industrial core.” In: Beine, Bos and Coulombe, Does the Canadian Economy suffer from the Dutch Disease?
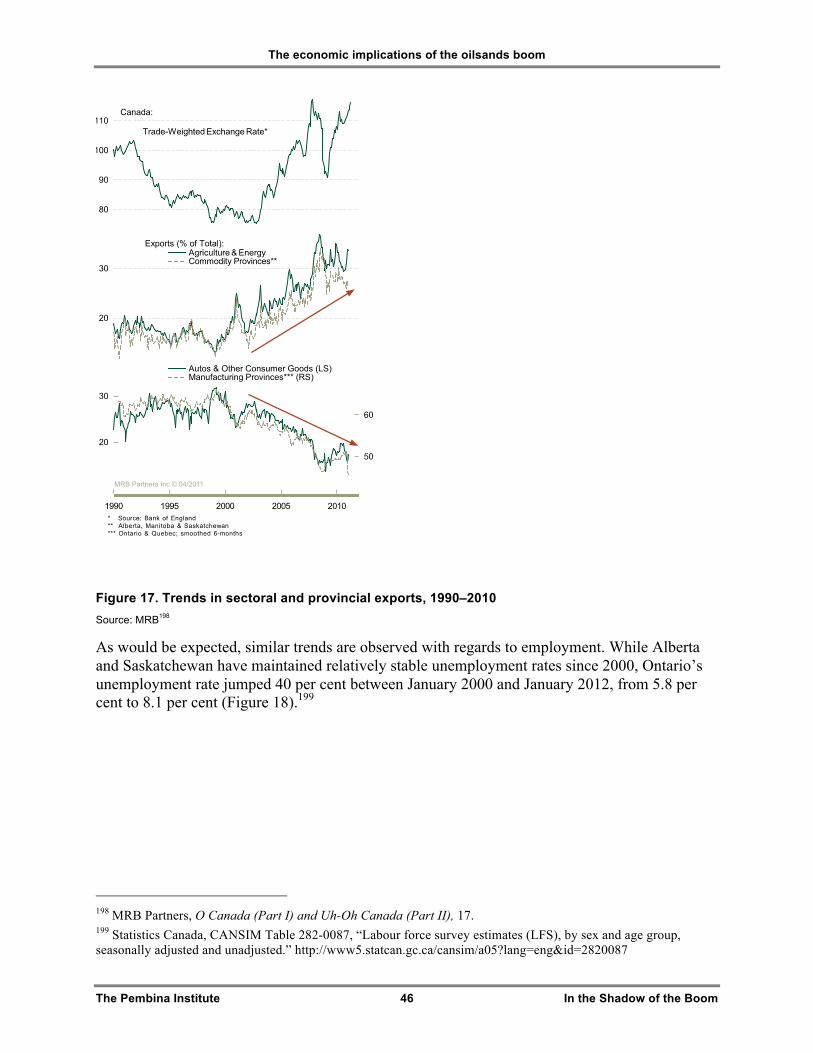
The economic implications of the oilsands boom
The Pembina Institute 46 In the Shadow of the Boom
Figure 17. Trends in sectoral and provincial exports, 1990–2010 Source: MRB198
As would be expected, similar trends are observed with regards to employment. While Alberta and Saskatchewan have maintained relatively stable unemployment rates since 2000, Ontario’s unemployment rate jumped 40 per cent between January 2000 and January 2012, from 5.8 per cent to 8.1 per cent (Figure 18).199
198 MRB Partners, O Canada (Part I) and Uh-Oh Canada (Part II), 17. 199 Statistics Canada, CANSIM Table 282-0087, “Labour force survey estimates (LFS), by sex and age group, seasonally adjusted and unadjusted.” http://www5.statcan.gc.ca/cansim/a05?lang=eng&id=2820087
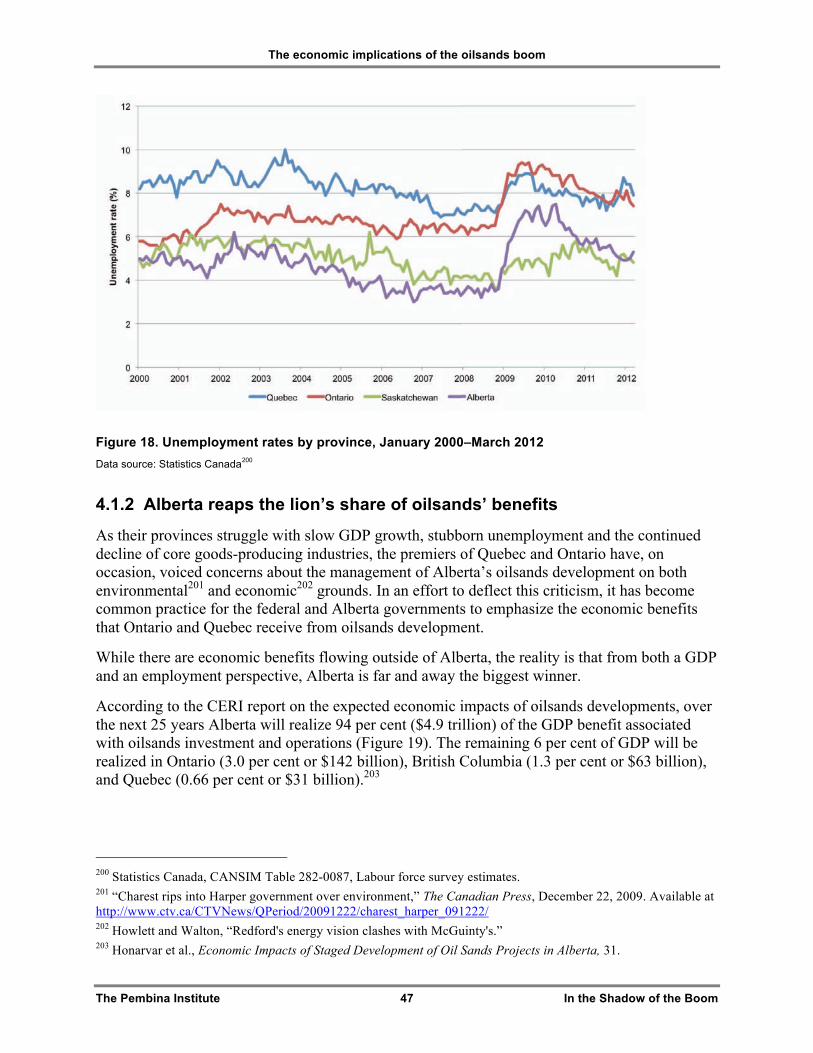
The economic implications of the oilsands boom
The Pembina Institute 47 In the Shadow of the Boom
Figure 18. Unemployment rates by province, January 2000–March 2012Data source: Statistics Canada200
4.1.2 Alberta reaps the lion’s share of oilsands’ benefits
As their provinces struggle with slow GDP growth, stubborn unemployment and the continued decline of core goods-producing industries, the premiers of Quebec and Ontario have, on occasion, voiced concerns about the management of Alberta’s oilsands development on both environmental201 and economic202 grounds. In an effort to deflect this criticism, it has become common practice for the federal and Alberta governments to emphasize the economic benefits that Ontario and Quebec receive from oilsands development.
While there are economic benefits flowing outside of Alberta, the reality is that from both a GDP and an employment perspective, Alberta is far and away the biggest winner.
According to the CERI report on the expected economic impacts of oilsands developments, over the next 25 years Alberta will realize 94 per cent ($4.9 trillion) of the GDP benefit associated with oilsands investment and operations (Figure 19). The remaining 6 per cent of GDP will be realized in Ontario (3.0 per cent or $142 billion), British Columbia (1.3 per cent or $63 billion), and Quebec (0.66 per cent or $31 billion).203
200 Statistics Canada, CANSIM Table 282-0087, Labour force survey estimates. 201 “Charest rips into Harper government over environment,” The Canadian Press, December 22, 2009. Available at http://www.ctv.ca/CTVNews/QPeriod/20091222/charest_harper_091222/ 202 Howlett and Walton, “Redford's energy vision clashes with McGuinty's.” 203 Honarvar et al., Economic Impacts of Staged Development of Oil Sands Projects in Alberta, 31.
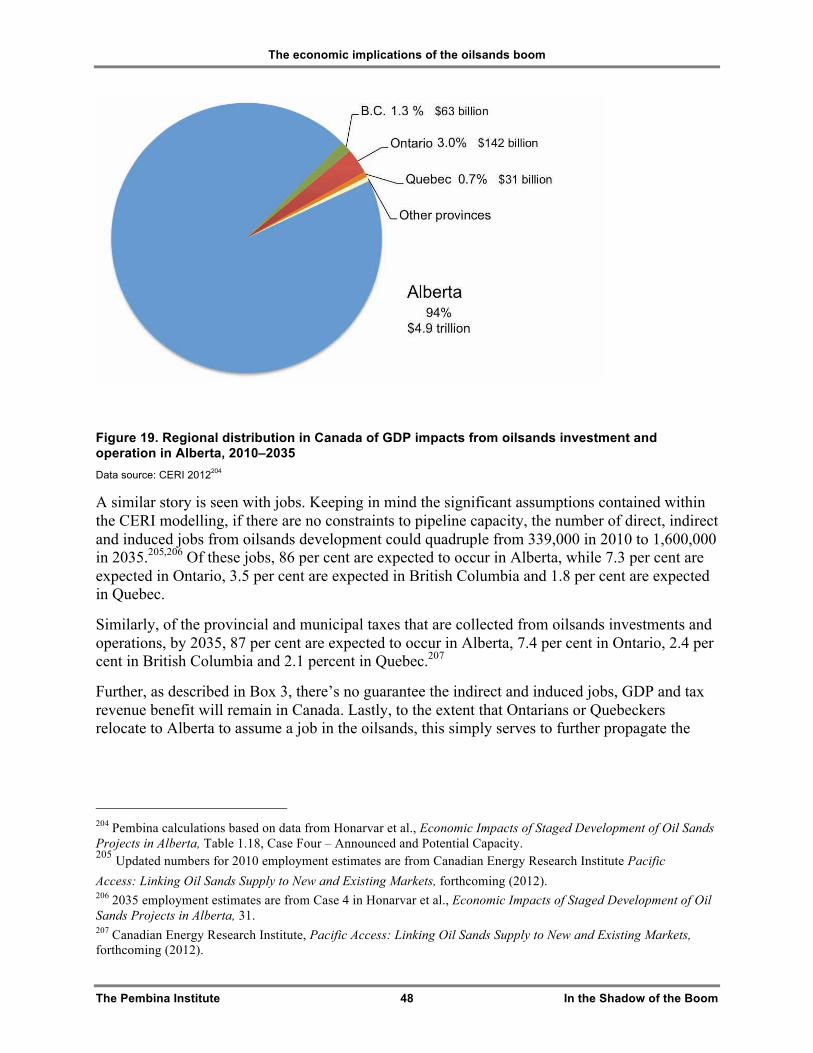
The economic implications of the oilsands boom
The Pembina Institute 48 In the Shadow of the Boom
Figure 19. Regional distribution in Canada of GDP impacts from oilsands investment and operation in Alberta, 2010–2035 Data source: CERI 2012204
A similar story is seen with jobs. Keeping in mind the significant assumptions contained within the CERI modelling, if there are no constraints to pipeline capacity, the number of direct, indirect and induced jobs from oilsands development could quadruple from 339,000 in 2010 to 1,600,000 in 2035.205,206 Of these jobs, 86 per cent are expected to occur in Alberta, while 7.3 per cent are expected in Ontario, 3.5 per cent are expected in British Columbia and 1.8 per cent are expected in Quebec.
Similarly, of the provincial and municipal taxes that are collected from oilsands investments and operations, by 2035, 87 per cent are expected to occur in Alberta, 7.4 per cent in Ontario, 2.4 per cent in British Columbia and 2.1 percent in Quebec.207
Further, as described in Box 3, there’s no guarantee the indirect and induced jobs, GDP and tax revenue benefit will remain in Canada. Lastly, to the extent that Ontarians or Quebeckers relocate to Alberta to assume a job in the oilsands, this simply serves to further propagate the
204 Pembina calculations based on data from Honarvar et al., Economic Impacts of Staged Development of Oil Sands Projects in Alberta, Table 1.18, Case Four – Announced and Potential Capacity. 205 Updated numbers for 2010 employment estimates are from Canadian Energy Research Institute Pacific Access: Linking Oil Sands Supply to New and Existing Markets, forthcoming (2012). 206 2035 employment estimates are from Case 4 in Honarvar et al., Economic Impacts of Staged Development of Oil Sands Projects in Alberta, 31. 207 Canadian Energy Research Institute, Pacific Access: Linking Oil Sands Supply to New and Existing Markets, forthcoming (2012).
The economic implications of the oilsands boom
The Pembina Institute 49 In the Shadow of the Boom
effects of oilsands fever in Ontario and Quebec, a phenomenon referred to as a labour re-allocation effect.208
Box 3. No guarantee economic benefits will stay in Canada
While CERI projects that indirect and induced jobs will be created outside of Alberta (with associated GDP benefits and public revenue from personal and corporate income tax), oilsands producers are not obliged to source equipment or supplies from within Canada. For example, economist Jim Stanford recently noted that while Ontario-made trucks are sold to mining operations across the Americas, Europe and Africa, Ontario doesn’t supply trucks to mining operations in the oilsands. Oilsands companies instead import trucks from companies like U.S-based Caterpillar.209 Absent some policy measure, it’s quite likely even more jobs will be sourced offshore. In 2010, the Globe and Mail reported that several oilsands firms were in discussion with Accenture, a management consulting and outsourcing firm.210 Accenture’s managing director in Canada stated, “We estimate that 40 to 60 per cent of all job titles and all work could be moved and be done remotely from Fort McMurray…And maybe half of that could be moved offshore now.”211
But this approach is not entirely new to the oilsands sector, as several oilsands companies have already begun increasing their use of offshore work. For example, the same media story reported that, “Imperial Oil Ltd. is using South Korean manufacturers to build hundreds of components for its $8-billion (Canadian) Kearl mine, and engineering firms are increasingly using employees in Texas and overseas to design new oil sands projects.”212
While promises of jobs and associated economic benefits are being used to drum up support for the oilsands outside of Alberta, there are no guarantees they will actually materialize, especially as oilsands development heats up and companies look for any and every opportunity to reduce costs.
4.1.3 Regional differences in inflation
As the oilsands sector has boomed, Alberta has been challenged by an overheated economy. Over the past 10 years, all other provinces except Alberta have had inflation rates213 within 0.8 percentage points of the national average (Figure 20). In Alberta, by contrast, inflation rates have spiked above all other provinces in five years out of the past decade, peaking at 5.0 per cent in 2007, 2.8 percentage points above the national inflation rate.
208 Michel Beine, Serge Coulombe and Wessel N. Vermeulen, Dutch Disease and the Mitigation Effect of Migration: Evidence from Canadian Provinces, CESifo Working Paper Series No. 3813 (2012), 26 http://www.michelbeine.be/pdf/Beine, Coulombe and Vermeulen.pdf 209 Jim Stanford, “How about ‘Buy Canadian’ for resource projects?” Globe and Mail, March 14, 2012. http://www.theglobeandmail.com/news/opinions/opinion/how-about-buy-canadian-for-resource-projects/article2368348/ 210 Nathan Vanderklippe, “Oil sands firms look at outsourcing” Globe and Mail, December 26, 2010. Available at http://www.ctv.ca/generic/generated/static/business/article1849899.html 211 Ibid. 212 Ibid. 213 Inflation rate is the percentage increase in the price of goods and services. In Canada, the consumer price index, which tracks the price of a fixed basket of consumer goods, is used to measure inflation.
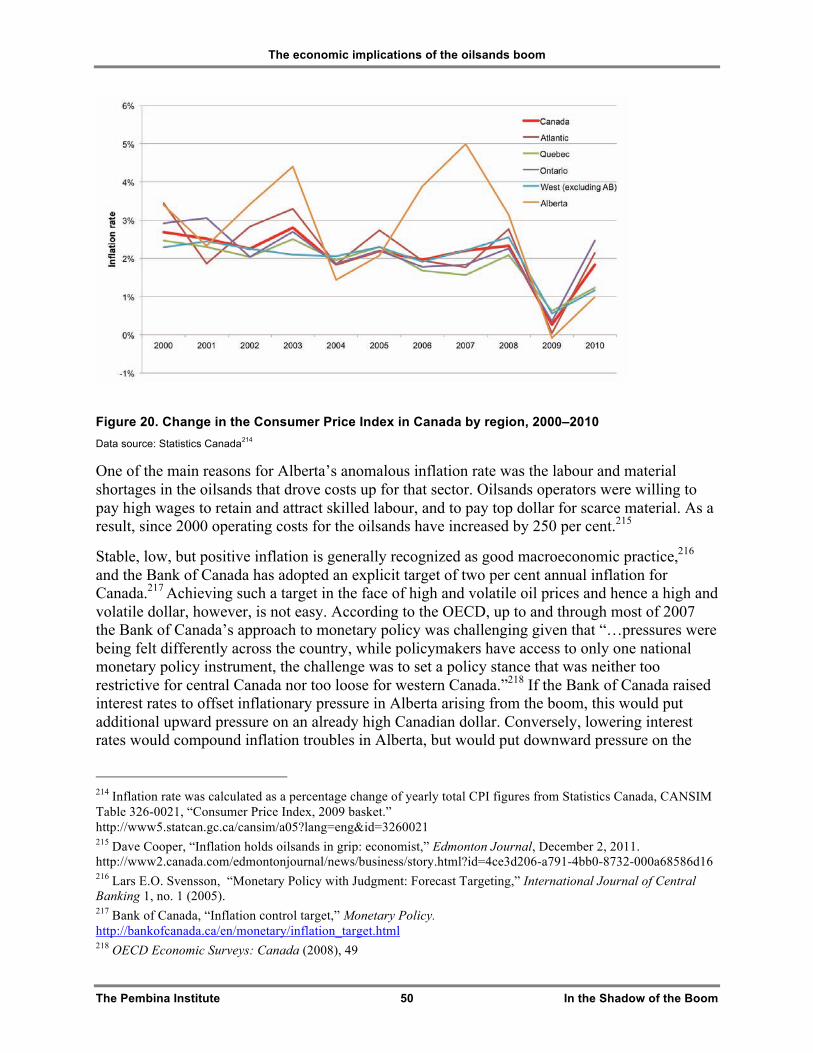
The economic implications of the oilsands boom
The Pembina Institute 50 In the Shadow of the Boom
Figure 20. Change in the Consumer Price Index in Canada by region, 2000–2010 Data source: Statistics Canada214
One of the main reasons for Alberta’s anomalous inflation rate was the labour and material shortages in the oilsands that drove costs up for that sector. Oilsands operators were willing to pay high wages to retain and attract skilled labour, and to pay top dollar for scarce material. As a result, since 2000 operating costs for the oilsands have increased by 250 per cent.215
Stable, low, but positive inflation is generally recognized as good macroeconomic practice,216 and the Bank of Canada has adopted an explicit target of two per cent annual inflation for Canada.217 Achieving such a target in the face of high and volatile oil prices and hence a high and volatile dollar, however, is not easy. According to the OECD, up to and through most of 2007 the Bank of Canada’s approach to monetary policy was challenging given that “…pressures were being felt differently across the country, while policymakers have access to only one national monetary policy instrument, the challenge was to set a policy stance that was neither too restrictive for central Canada nor too loose for western Canada.”218 If the Bank of Canada raised interest rates to offset inflationary pressure in Alberta arising from the boom, this would put additional upward pressure on an already high Canadian dollar. Conversely, lowering interest rates would compound inflation troubles in Alberta, but would put downward pressure on the
214 Inflation rate was calculated as a percentage change of yearly total CPI figures from Statistics Canada, CANSIM Table 326-0021, “Consumer Price Index, 2009 basket.” http://www5.statcan.gc.ca/cansim/a05?lang=eng&id=3260021 215 Dave Cooper, “Inflation holds oilsands in grip: economist,” Edmonton Journal, December 2, 2011. http://www2.canada.com/edmontonjournal/news/business/story.html?id=4ce3d206-a791-4bb0-8732-000a68586d16 216 Lars E.O. Svensson, “Monetary Policy with Judgment: Forecast Targeting,” International Journal of Central Banking 1, no. 1 (2005). 217 Bank of Canada, “Inflation control target,” Monetary Policy. http://bankofcanada.ca/en/monetary/inflation_target.html 218 OECD Economic Surveys: Canada (2008), 49
The economic implications of the oilsands boom
The Pembina Institute 51 In the Shadow of the Boom
dollar.219 Clearly, implementing monetary policy when one province is above the inflation target and other provinces are below the target can be very challenging.
For example, in mid-2007 inflation was higher than the Bank of Canada’s two per cent target — but this average disguised the fact that while Ontario and Quebec had year-over-year-all-items price increases below two per cent, Alberta was experiencing prices increases of five per cent. When then-Governor of the Bank of Canada David Dodge increased interest rates to rein in the overheated Alberta economy, the rest of Canada suffered “collateral damage.”220
Compounding the challenge for federal policymakers who are trying to tackle Alberta’s distortionary inflation is the fact that the Bank of Canada often follows the lead of the United States Federal Reserve. The Federal Reserve has held firm to an ultra-low interest rate of zero to one-quarter per cent since 2009 and commits to do so until at least late 2014.221 Canada’s economic interdependence with the United States necessarily limits the ability for the Bank of Canada to raise their interest rate to control domestic inflation, despite growing regional economic imbalances.
RBC Economics expects “boom like” conditions in 2012 and 2013, and while it expects “a more orderly affair than the 2004–2006 boom,”222 there is evidence to suggest that this may be overly optimistic. The oilsands sector is heating up once again; from steel to labour, oilsands input costs are on the rise, and project costs already match those of the last oilsands boom. Many oilsands development projects are progressing in stages to offset costs, while the number of workers in remote work camps, 34,490 in 2011, is nearly one-third higher than it was during the pre-recession boom.223
The myth says that oilsands and their pipelines are becoming a nation-building project for Canada.224 In reality, oilsands development is creating significant regional imbalances with respect to GDP growth, employment and inflation. The vast majority of the economic and employment benefits occur in Alberta, while many of the benefits that could flow to other Canadian provinces might actually end up in the U.S. and overseas as oilsands producers seek to minimize costs. Clearly, oilsands development is a comparative advantage for Alberta; however, Alberta’s advantage is making it more difficult for other regions in Canada to cope with the larger shift happening in the national economy.
219 Bank of Canada, Monetary Policy Report – July 2009 (2009) http://www.bankofcanada.ca/publications-research/periodicals/mpr/?y=2009 220 Michael Mendelson, “Alberta's inflation is everyone's interest,” Globe and Mail, July 11, 2007. 221 Pedro Nicolaci da Costa and Mark Felsenthal, “Federal Reserve keeps key interest rate on hold, offers few clues on stimulus,” Financial Post, April 25, 2012. http://business.financialpost.com/2012/04/25/federal-reserve-keeps-key-interest-rate-on-hold-offers-few-clues-on-stimulus/ 222 http://www.rbc.com/economics/market/pdf/provfcst.pdf 223 Nathan Vanderklippe, “Oil sands companies brace for higher costs,” Globe and Mail, January 29, 2012. http://www.theglobeandmail.com/report-on-business/industry-news/energy-and-resources/oil-sands-companies-brace-for-higher-costs/article2318968/ 224 Peter O’Neil, “Oil industry’s ‘nation-building’ pipeline won’t be stopped by protestors: Natural Resources Minister,” National Post, December 6, 2011. http://news.nationalpost.com/2011/12/06/oil-industrys-nation-building-pipeline-wont-be-stopped-by-protesters-natural-resources-minister/
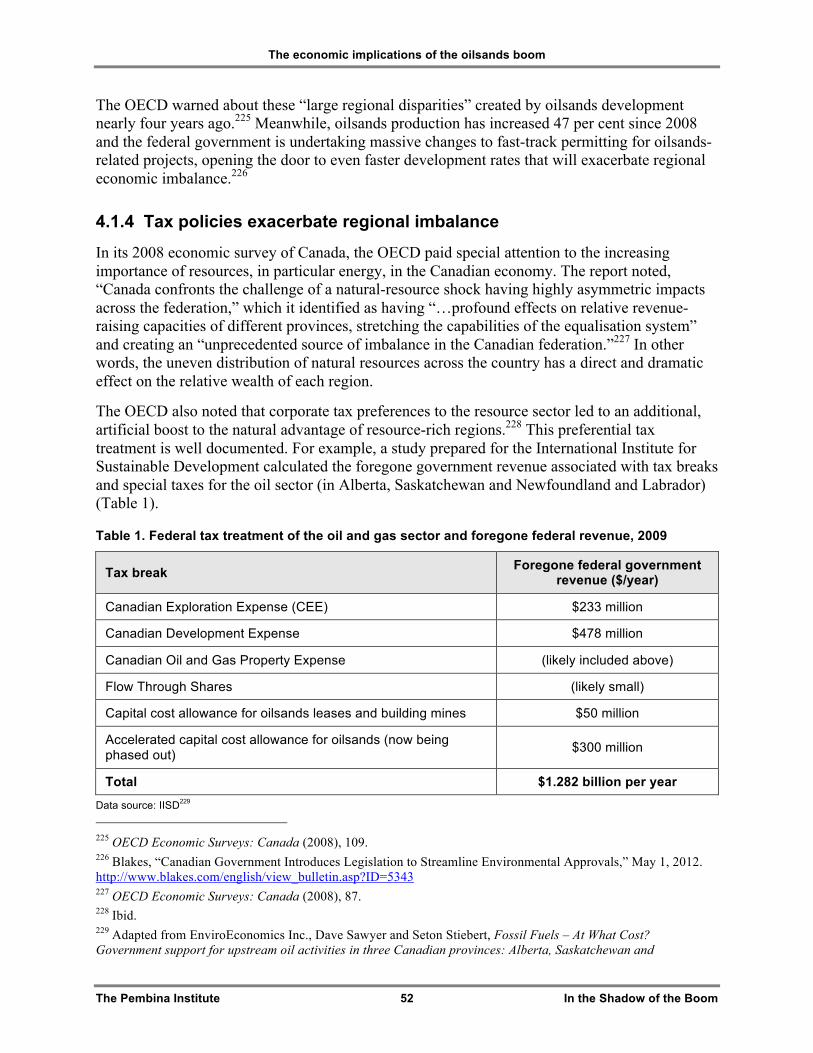
The economic implications of the oilsands boom
The Pembina Institute 52 In the Shadow of the Boom
The OECD warned about these “large regional disparities” created by oilsands development nearly four years ago.225 Meanwhile, oilsands production has increased 47 per cent since 2008 and the federal government is undertaking massive changes to fast-track permitting for oilsands-related projects, opening the door to even faster development rates that will exacerbate regional economic imbalance.226
4.1.4 Tax policies exacerbate regional imbalance
In its 2008 economic survey of Canada, the OECD paid special attention to the increasing importance of resources, in particular energy, in the Canadian economy. The report noted, “Canada confronts the challenge of a natural-resource shock having highly asymmetric impacts across the federation,” which it identified as having “…profound effects on relative revenue-raising capacities of different provinces, stretching the capabilities of the equalisation system” and creating an “unprecedented source of imbalance in the Canadian federation.”227 In other words, the uneven distribution of natural resources across the country has a direct and dramatic effect on the relative wealth of each region.
The OECD also noted that corporate tax preferences to the resource sector led to an additional, artificial boost to the natural advantage of resource-rich regions.228 This preferential tax treatment is well documented. For example, a study prepared for the International Institute for Sustainable Development calculated the foregone government revenue associated with tax breaks and special taxes for the oil sector (in Alberta, Saskatchewan and Newfoundland and Labrador) (Table 1).
Table 1. Federal tax treatment of the oil and gas sector and foregone federal revenue, 2009
Tax break Foregone federal government revenue ($/year)
Canadian Exploration Expense (CEE) $233 million
Canadian Development Expense $478 million
Canadian Oil and Gas Property Expense (likely included above)
Flow Through Shares (likely small)
Capital cost allowance for oilsands leases and building mines $50 million
Accelerated capital cost allowance for oilsands (now being phased out) $300 million
Total $1.282 billion per year Data source: IISD229
225 OECD Economic Surveys: Canada (2008), 109. 226 Blakes, “Canadian Government Introduces Legislation to Streamline Environmental Approvals,” May 1, 2012. http://www.blakes.com/english/view_bulletin.asp?ID=5343 227 OECD Economic Surveys: Canada (2008), 87. 228 Ibid. 229 Adapted from EnviroEconomics Inc., Dave Sawyer and Seton Stiebert, Fossil Fuels – At What Cost? Government support for upstream oil activities in three Canadian provinces: Alberta, Saskatchewan and
The economic implications of the oilsands boom
The Pembina Institute 53 In the Shadow of the Boom
In addition to these generous tax write-offs, the OECD noted that provincial resource royalties are deducted from the federal corporate tax base, thus reducing the amount of federal income tax that corporations must pay.230 As a result, national taxpayers bear part of the burden of higher provincial royalty payments, accentuating regional inequities.231 Recent changes to the Alberta royalty regime, which see the royalty rate vary over a range of oil prices,232 will only increase this tax-shifting effect.
4.2 Oil price volatility and the revenue rollercoaster
4.2.1 The volatile nature of oil prices
Box 4. Oil prices naturally tend toward extremes
“The world will be stuck with wild price swings for the foreseeable future. Already, the consequences for economics and geopolitics are stark.
“Big shifts in oil prices complicate economic decisions. Companies in many sectors avoid investing in new facilities and equipment that may be profitable at low oil prices but are all but useless if prices soar… Companies that make investments on the basis of low oil prices and are later forced to pay more wind up cutting back on spending elsewhere, depressing the entire economy.
“Greater oil price volatility will also bedevil macroeconomic policy officials and central bankers. Policymakers may have to compensate for depressed demand by lowering interest rates or pursuing fiscal stimulus. On the other hand, rapidly rising oil prices could fuel inflation, prompting monetary policy officials to raise interest rates, which could further hamper economic growth. The precise causal links between oil prices and the well-being of national economies are murky and much debated, but as the economist James Hamilton has noted, all but one of the 11 recessions the United States has experienced since World War II were associated with a rapid increase in the price of oil.”
— Robert McNally and Michael Levi233
As discussed above, the relationship between the value of the Canadian dollar and oil prices has created numerous challenges that have rippled through the Canadian economy. But the challenge of having a petro-dollar does not rest solely in its effects on the Canadian dollar.
Thomas Courchene, an economist at Queen’s University, has suggested that the major problem facing Canada’s economy is not with the appreciation of the Canadian dollar but rather the volatility — and that both the public and private sectors alike face this problem.234 While petroleum economists and energy analysts may disagree on the future price of oil, both groups
Newfoundland and Labrador, prepared for the Global Subsidies Initiative of the International Institute for Sustainable Development (2010), 40, Table 5. www.iisd.org/gsi/sites/default/files/ffs_awc_3canprovinces.pdf 230 OECD Economic Surveys: Canada (2008), 87. 231 Ibid., 88. 232 Alberta Energy, New Royalty Framework: Example Oil Sands Royalty Rates (2007) http://www.energy.gov.ab.ca/Org/pdfs/RoyaltyTerms_OilSands.pdf 233 McNally and Levi, “A Crude Predicament,” 105-106. 234 Thomas Courchene, “A cure for Canadaʼs case of Dutch disease: why are we allowing the exchange rate to determine regional fortunes?” Globe and Mail, October 29, 2007.
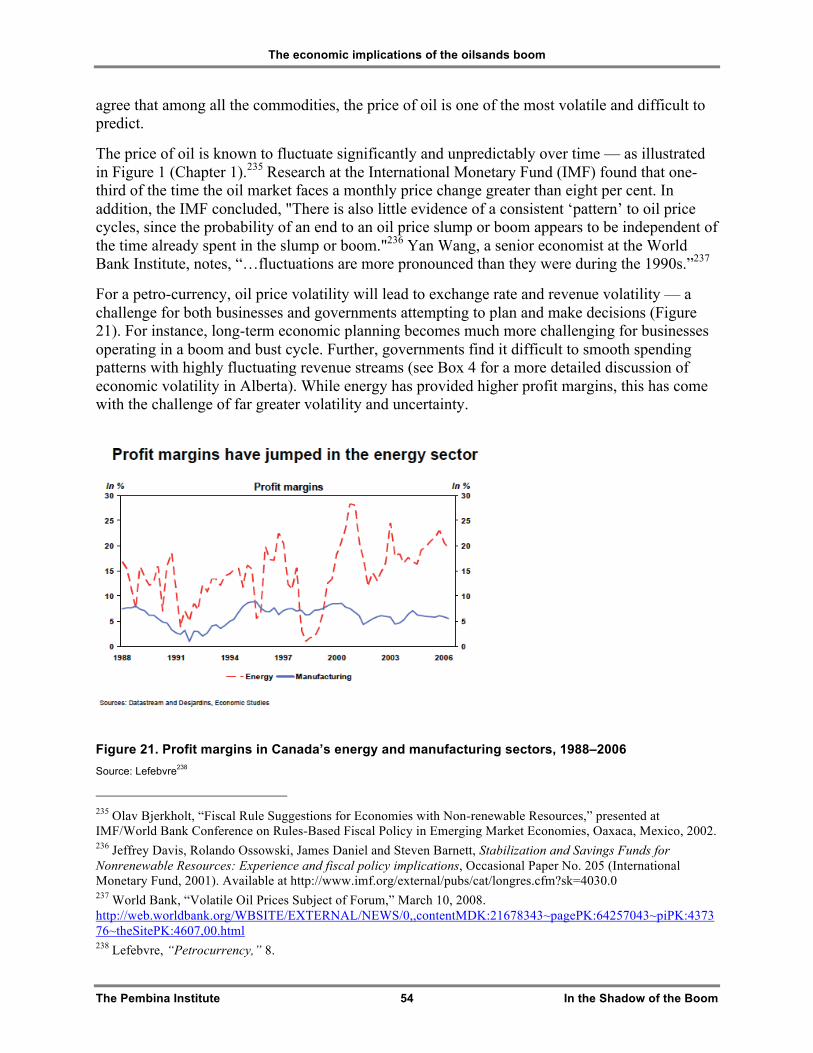
The economic implications of the oilsands boom
The Pembina Institute 54 In the Shadow of the Boom
agree that among all the commodities, the price of oil is one of the most volatile and difficult to predict.
The price of oil is known to fluctuate significantly and unpredictably over time — as illustrated in Figure 1 (Chapter 1).235 Research at the International Monetary Fund (IMF) found that one-third of the time the oil market faces a monthly price change greater than eight per cent. In addition, the IMF concluded, "There is also little evidence of a consistent ‘pattern’ to oil price cycles, since the probability of an end to an oil price slump or boom appears to be independent of the time already spent in the slump or boom."236 Yan Wang, a senior economist at the World Bank Institute, notes, “…fluctuations are more pronounced than they were during the 1990s.”237
For a petro-currency, oil price volatility will lead to exchange rate and revenue volatility — a challenge for both businesses and governments attempting to plan and make decisions (Figure 21). For instance, long-term economic planning becomes much more challenging for businesses operating in a boom and bust cycle. Further, governments find it difficult to smooth spending patterns with highly fluctuating revenue streams (see Box 4 for a more detailed discussion of economic volatility in Alberta). While energy has provided higher profit margins, this has come with the challenge of far greater volatility and uncertainty.
Figure 21. Profit margins in Canada’s energy and manufacturing sectors, 1988–2006 Source: Lefebvre238
235 Olav Bjerkholt, “Fiscal Rule Suggestions for Economies with Non-renewable Resources,” presented at IMF/World Bank Conference on Rules-Based Fiscal Policy in Emerging Market Economies, Oaxaca, Mexico, 2002. 236 Jeffrey Davis, Rolando Ossowski, James Daniel and Steven Barnett, Stabilization and Savings Funds for Nonrenewable Resources: Experience and fiscal policy implications, Occasional Paper No. 205 (International Monetary Fund, 2001). Available at http://www.imf.org/external/pubs/cat/longres.cfm?sk=4030.0 237 World Bank, “Volatile Oil Prices Subject of Forum,” March 10, 2008. http://web.worldbank.org/WBSITE/EXTERNAL/NEWS/0,,contentMDK:21678343~pagePK:64257043~piPK:437376~theSitePK:4607,00.html 238 Lefebvre, “Petrocurrency,” 8.
The economic implications of the oilsands boom
The Pembina Institute 55 In the Shadow of the Boom
4.2.2 Riding the public revenue rollercoaster
"Riding this roller-coaster of non-renewable resource revenue is not workable going into the future"
— Ron Liepert, former Alberta Finance Minister 239
In its 2008 Economic Survey of Canada, the OECD noted, “The dependence of the economy, Alberta’s in particular, on oil revenues poses vulnerability and sustainability challenges. Indeed, economic stabilization is more difficult because of the reliance on fossil fuel revenues that are uncertain (in terms of value and timing) and unstable (because of the volatility of oil prices).”240
Looking at the data of Alberta’s economic performance over the past decade, the rollercoaster ride associated with economic reliance on the oilsands is made starkly apparent.
Compared to all other provinces, in the last 10 years Alberta has experienced the greatest volatility in percentage change in GDP. Alberta’s GDP growth exceeded all other provinces from 2003 to 2007 but experienced the largest drop in GDP growth during the recent recession when it went from plus 6.5 per cent in 2006 to minus 4.8 per cent in 2009.241 Between 2008 and 2009, oilsands investments in Alberta dropped by nearly 50 per cent or $10.1 billion.242
According to an analysis by the C.D. Howe Institute, the volatility of Alberta’s government revenues was twice that of B.C., Saskatchewan or Ontario. However, when resource revenue is excluded from revenue calculations, Alberta’s income is no more volatile than that of other provinces — a clear indication that Alberta’s revenue volatility comes from its oil and gas revenue,243 which is increasingly dominated by the oilsands.
The uncertainty associated with not knowing how much revenue will be collected over what time period can lead to spending peaks and troughs that mirror those of oil price fluctuations. The C.D. Howe Institute warns that adjusting to the volatility in revenue carries economic, social and political costs.244 Any sort of long-term economic planning is undermined by the government’s impaired ability to accurately forecast oil revenues.245 Indeed, Alberta and Saskatchewan, the two provinces in Canada most reliant on energy revenues, are also the two provinces with the poorest track record of meeting budget targets.246
As the Canada West Foundation wrote in 2006, “…natural resources will remain our greatest friend — but possibly our greatest curse as well…It is fairly reasonable to assume that oil and gas demand will remain strong for at least the next few years; but it is also reasonable to imagine
239 Richard Blackwell, “Alberta Finance Minister warns on overspending,” Globe and Mail, February 15, 2012. 240 OECD Economic Surveys: Canada (2008), 109. 241 Statistics Canada, CANSIM Table 379-0025. 242 Alberta Energy, “Facts and Statistics,” About Oil Sands. http://www.energy.alberta.ca/oilsands/791.asp 243 Stuart Landon and Constance Smith, “Energy Prices and Alberta Government Revenue Volatility,” Commentary 313 (C.D. Howe Institute, 2010), 20. www.cdhowe.org/pdf/Commentary_313.pdf 244 Ibid. 245 Ibid., 1. 246 Colin Busby and William B.P. Robson, “Target Practice Needed: Canada’s 2010 Fiscal Accountability Rankings,” Backgrounder 129. (C.D. Howe Institute, 2010). cdhowe.org/pdf/backgrounder_129.pdf
The economic implications of the oilsands boom
The Pembina Institute 56 In the Shadow of the Boom
some event — a major technological breakthrough, a major world recession, a steep drop in demand due to changing consumer habits — that would see energy prices fall. …The danger lies in our heavy reliance on them and the boom and bust economic cycle they help perpetuate.”247
But while Alberta’s experience on the revenue rollercoaster should serve as a cautionary tale, the federal government remains seemingly ignorant of the extent to which the rise and fall of oil prices will increasingly affect its revenues in the future. While Alberta wants off this revenue rollercoaster, it seems the federal government is eagerly waiting next in line for the ride. In fact, federal Natural Resources Minister Joe Oliver recently praised Alberta’s economic model, stating, “…Today, energy accounts for one quarter of Alberta’s GDP, nearly 70 per cent of Alberta’s exports and 35 per cent of Alberta Government revenues. I think we can agree that's good news, and I can assure you our government wants Albertans and all Canadians to continue to hear that kind of news.”248
It’s rare to hear a speech by federal cabinet ministers supporting the oilsands in which they fail to state that public revenues from oilsands development “…will pay for important social programs such as health care and education and benefit all Canadians.”249 But as the contribution of oilsands to total GDP and government revenue rises, the federal government’s vulnerability to the volatile nature of the global oil market becomes more pronounced.
As discussed in Chapter 2, in 2009–10 the oil and gas sector contributed $2.7 billion (1.2 per cent) of revenue to federal coffers through corporate income tax.250,251,252 But as is seen in Figure 22, federal income tax revenue from oil and gas extraction has also been quite volatile. For prudent economic managers, this scenario offers as many challenges as opportunities — something the federal government has yet to address.
247 Todd Hirsch, Coming Up NEXT: The Transformation of Western Canada’s Economy (Canada West Foundation, 2006), 107. https://canadawestfoundation.worldsecuresystems.com/pdf-docs/publications/2006-Coming-Up-Next-The-Transformation-of-Western-Canada’s-Economy-ENGLISH.pdf 248 Joe Oliver, “Forging New Paths Toward Canada’s Energy Future.” 249 Joe Oliver, "Announcement: Completion of an Important Milestone for the Joslyn North Mine Project," speech, Ottawa, Ont. (December 8, 2011) Available at http://www.nrcan.gc.ca/media-room/speeches/130/3360. 250 This includes oil and gas extraction and support activities. 251 Statistics Canada, Financial and Taxation Statistics for Enterprises, 53. 252 Finance Canada, Annual Financial Report of the Government of Canada: Fiscal Year 2009–10.
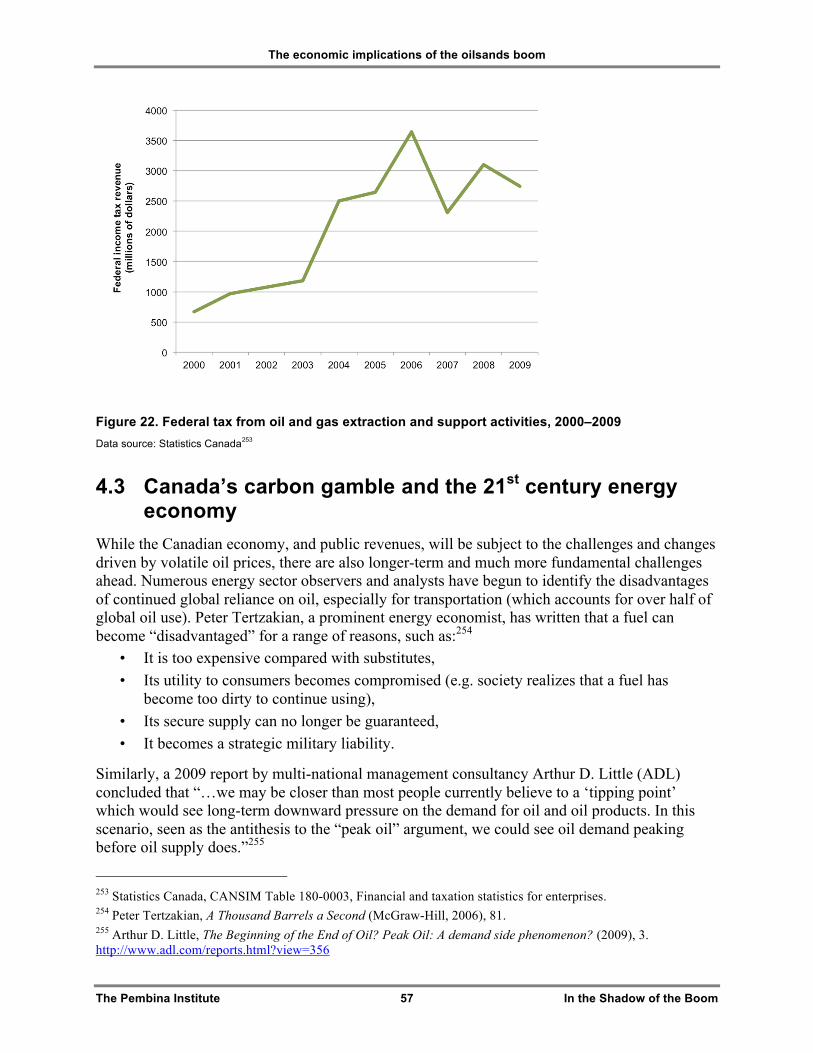
The economic implications of the oilsands boom
The Pembina Institute 57 In the Shadow of the Boom
Figure 22. Federal tax from oil and gas extraction and support activities, 2000–2009 Data source: Statistics Canada253
4.3 Canada’s carbon gamble and the 21st century energy economy
While the Canadian economy, and public revenues, will be subject to the challenges and changes driven by volatile oil prices, there are also longer-term and much more fundamental challenges ahead. Numerous energy sector observers and analysts have begun to identify the disadvantages of continued global reliance on oil, especially for transportation (which accounts for over half of global oil use). Peter Tertzakian, a prominent energy economist, has written that a fuel can become “disadvantaged” for a range of reasons, such as:254
• It is too expensive compared with substitutes, • Its utility to consumers becomes compromised (e.g. society realizes that a fuel has
become too dirty to continue using), • Its secure supply can no longer be guaranteed, • It becomes a strategic military liability.
Similarly, a 2009 report by multi-national management consultancy Arthur D. Little (ADL) concluded that “…we may be closer than most people currently believe to a ‘tipping point’ which would see long-term downward pressure on the demand for oil and oil products. In this scenario, seen as the antithesis to the “peak oil” argument, we could see oil demand peaking before oil supply does.”255
253 Statistics Canada, CANSIM Table 180-0003, Financial and taxation statistics for enterprises. 254 Peter Tertzakian, A Thousand Barrels a Second (McGraw-Hill, 2006), 81. 255 Arthur D. Little, The Beginning of the End of Oil? Peak Oil: A demand side phenomenon? (2009), 3. http://www.adl.com/reports.html?view=356
The economic implications of the oilsands boom
The Pembina Institute 58 In the Shadow of the Boom
ADL recognizes three factors that have the power to significantly affect oil markets: • the political undesirability of extreme price volatility, • security of supply, and • climate change.
These factors are mutually reinforcing, and policy responses to them can increase their market effects even more. 256
Of particular interest and importance to ADL analysts is the extent to which these factors will shape the policy frameworks in major consuming markets, most notably China.257 They conclude that “…It is not stretching credulity to suggest that the Chinese authorities, as they look forward to the prospective growth of their national vehicle fleet into the hundreds of millions, would prefer these vehicles to be powered by something other than the internal combustion engine, with its associated reliance on imported oil. We can therefore suggest that more fundamental changes than fuel efficiency may well be on the way, in terms of both technology and mobility behaviours, and that we may see China taking a leading role in this respect.”258
In the U.S. Department of Energy’s (DOE) 2011 Strategic Plan, Energy Secretary Chu wrote “…our excessive dependence on oil is taking us down an increasingly costly, insecure, and environmentally dangerous path.”259 But it’s not just the DOE that is recognizing these risks and taking action to reduce reliance on oil; the U.S. Department of Defense (DOD) is similarly motivated. Writing in the Joint Force Quarterly, a publication of the U.S. National Defense University, Amory Lovins of the Rocky Mountain Institute put it starkly: “The United States can and must make oil obsolete as a strategic commodity.”260
In its 2010 report Fueling the Future Force — Preparing the Department of Defense for a Post-Petroleum Era, the Center for a New American Security articulated the geostrategic and operational risks of the American military’s use of oil, and made recommendations for getting the U.S military off of petroleum by 2040.261 Similarly, the Pew Project on National Security, Energy and Climate issued a report that documented a comprehensive survey of the wide range of initiatives already underway by the U.S. Navy, Airforce, Army and Marine Corps to reduce their reliance on fossil fuels.262
256 Ibid. 257 Ibid., 2. 258 Ibid., 5. 259 U.S. Department of Energy, Strategic Plan (2011), 2. http://energy.gov/sites/prod/files/2011_DOE_Strategic_Plan_.pdf 260 Amory Lovins, “DOD’s energy challenge as strategic opportunity,” Joint Force Quarterly 57 (2010), 42. http://www.ndu.edu/press/lib/images/jfq-57/lovins.pdf 261 Christine Parthemore and John Nagl, Fueling the Future Force – Preparing the Department of Defense for a Post-Petroleum Era (Centre for New American Security, 2010), http://www.cnas.org/node/5023 262 Pew Project on National Security, Energy and Climate, “Reenergizing America’s Defense - How the Armed Forces Are Stepping Forward to Combat Climate Change and Improve the U.S. Energy Posture (2010). http://pewclimatesec-cdn-remembers.s3.amazonaws.com/172e73107e0952fd86378269bdeb62f6.pdf
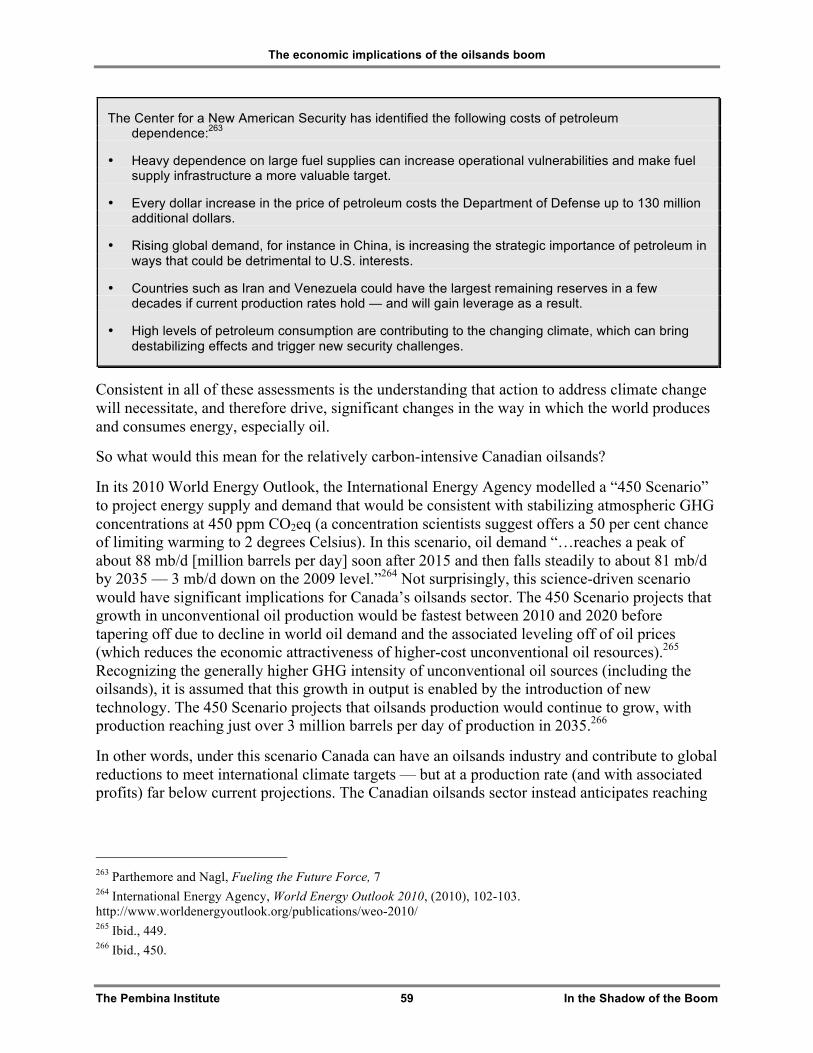
The economic implications of the oilsands boom
The Pembina Institute 59 In the Shadow of the Boom
The Center for a New American Security has identified the following costs of petroleum dependence:263
• Heavy dependence on large fuel supplies can increase operational vulnerabilities and make fuel supply infrastructure a more valuable target.
• Every dollar increase in the price of petroleum costs the Department of Defense up to 130 million additional dollars.
• Rising global demand, for instance in China, is increasing the strategic importance of petroleum in ways that could be detrimental to U.S. interests.
• Countries such as Iran and Venezuela could have the largest remaining reserves in a few decades if current production rates hold — and will gain leverage as a result.
• High levels of petroleum consumption are contributing to the changing climate, which can bring destabilizing effects and trigger new security challenges.
Consistent in all of these assessments is the understanding that action to address climate change will necessitate, and therefore drive, significant changes in the way in which the world produces and consumes energy, especially oil.
So what would this mean for the relatively carbon-intensive Canadian oilsands?
In its 2010 World Energy Outlook, the International Energy Agency modelled a “450 Scenario” to project energy supply and demand that would be consistent with stabilizing atmospheric GHG concentrations at 450 ppm CO2eq (a concentration scientists suggest offers a 50 per cent chance of limiting warming to 2 degrees Celsius). In this scenario, oil demand “…reaches a peak of about 88 mb/d [million barrels per day] soon after 2015 and then falls steadily to about 81 mb/d by 2035 — 3 mb/d down on the 2009 level.”264 Not surprisingly, this science-driven scenario would have significant implications for Canada’s oilsands sector. The 450 Scenario projects that growth in unconventional oil production would be fastest between 2010 and 2020 before tapering off due to decline in world oil demand and the associated leveling off of oil prices (which reduces the economic attractiveness of higher-cost unconventional oil resources).265 Recognizing the generally higher GHG intensity of unconventional oil sources (including the oilsands), it is assumed that this growth in output is enabled by the introduction of new technology. The 450 Scenario projects that oilsands production would continue to grow, with production reaching just over 3 million barrels per day of production in 2035.266
In other words, under this scenario Canada can have an oilsands industry and contribute to global reductions to meet international climate targets — but at a production rate (and with associated profits) far below current projections. The Canadian oilsands sector instead anticipates reaching
263 Parthemore and Nagl, Fueling the Future Force, 7 264 International Energy Agency, World Energy Outlook 2010, (2010), 102-103. http://www.worldenergyoutlook.org/publications/weo-2010/ 265 Ibid., 449. 266 Ibid., 450.
The economic implications of the oilsands boom
The Pembina Institute 60 In the Shadow of the Boom
3 million barrels per day by 2020,267 15 years earlier than the IEA predictions, with a future proposed rate of 9 million barrels per day.268,269
It’s noteworthy, then, that the federal government has committed to the Copenhagen Accord,270 which sets a goal of limiting the long-term average increase in the global temperature to 2°C above pre-industrial levels. To achieve this goal, it is widely acknowledged that the concentration of greenhouse gases in the atmosphere must be stabilized at a level no higher than 450 parts per million of carbon dioxide equivalent (ppm CO2eq).271
But even as it made these commitments, the federal government has been tempering ambitions and expectations about how it will manage greenhouse gases, in part because of the potential implications for the development of the oilsands. As mentioned above, it seems unlikely, if not impossible, that Canada can both deliver on its international commitments and realize its aspirations for rapid and significant growth in the oilsands sector. Perhaps it should then be of little surprise that the federal government continues to delay its promised regulations to reduce greenhouse gas pollution from the oil and gas sector.
While this appears to serve short-term interests of the oil and gas sector, increasing numbers of oil companies are advocating for a price on carbon.272 Moreover, the government’s lack of action does not acknowledge the shift towards low-carbon energy alternatives that is occurring in countries around the world and that will define the 21st century energy economy. Increasingly, it appears the federal government is betting against the world taking science-based action to address climate change, and therefore assumes that the global demand for fossil fuel-based energy will remain high — but as explained below (Box 5), this bet appears unlikely to pay off.
267 Canadian Association of Petroleum Producers, Crude Oil Forecast, Markets and Pipelines (2011). 268 Dunbar, Existing and Proposed Canadian Commercial Oil Sands Projects. 269 Oilsands Review, “Oilsands Projects – Statistics,” http://www.oilsandsreview.com/statistics/projects.asp 270 Environment Canada, "Canada Lists Emissions Target under the Copenhagen Accord," media release February 1, 2010. http://www.ec.gc.ca/default.asp?lang=En&n=714D9AAE-1&news=EAF552A3-D287-4AC0-ACB8-A6FEA697ACD6 271 IEA, World Energy Outlook 2010, 380. 272 Suncor Energy, “Greenhouse Gas Emission Management Q&A – Sustainability.” http://sustainability.suncor.com/2011/en/responsible/3518.aspx
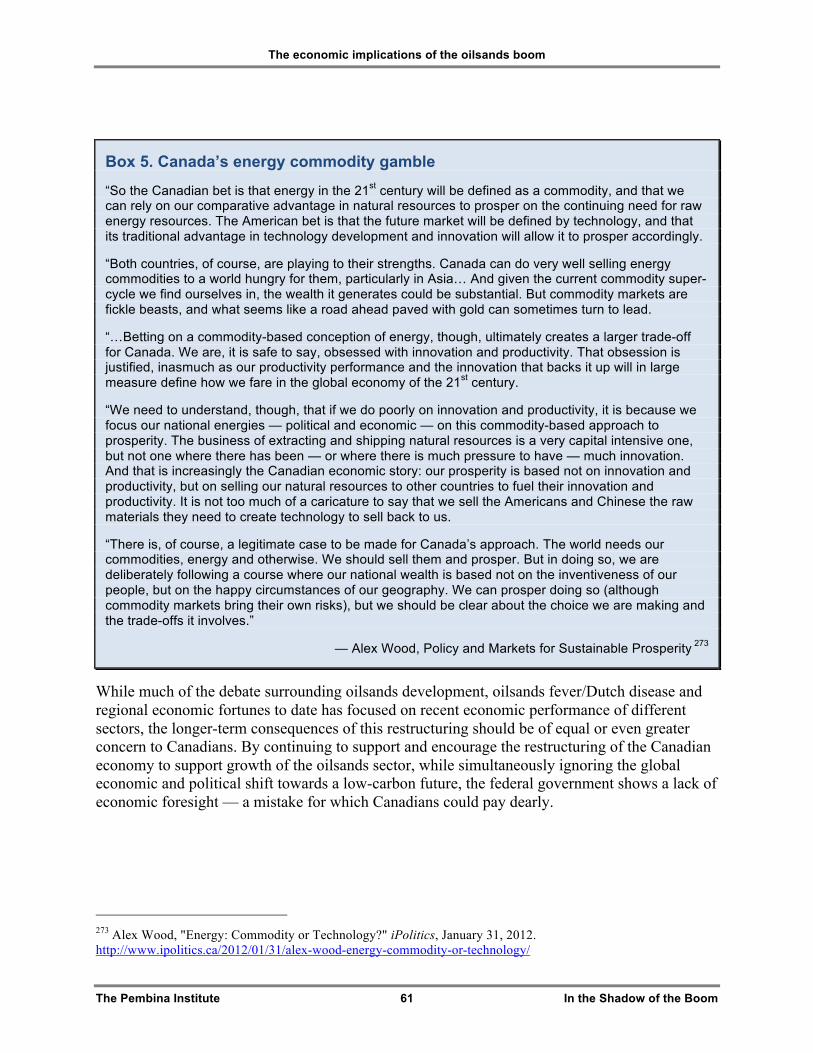
The economic implications of the oilsands boom
The Pembina Institute 61 In the Shadow of the Boom
Box 5. Canada’s energy commodity gamble
“So the Canadian bet is that energy in the 21st century will be defined as a commodity, and that we can rely on our comparative advantage in natural resources to prosper on the continuing need for raw energy resources. The American bet is that the future market will be defined by technology, and that its traditional advantage in technology development and innovation will allow it to prosper accordingly.
“Both countries, of course, are playing to their strengths. Canada can do very well selling energy commodities to a world hungry for them, particularly in Asia… And given the current commodity super-cycle we find ourselves in, the wealth it generates could be substantial. But commodity markets are fickle beasts, and what seems like a road ahead paved with gold can sometimes turn to lead.
“…Betting on a commodity-based conception of energy, though, ultimately creates a larger trade-off for Canada. We are, it is safe to say, obsessed with innovation and productivity. That obsession is justified, inasmuch as our productivity performance and the innovation that backs it up will in large measure define how we fare in the global economy of the 21st century.
“We need to understand, though, that if we do poorly on innovation and productivity, it is because we focus our national energies — political and economic — on this commodity-based approach to prosperity. The business of extracting and shipping natural resources is a very capital intensive one, but not one where there has been — or where there is much pressure to have — much innovation. And that is increasingly the Canadian economic story: our prosperity is based not on innovation and productivity, but on selling our natural resources to other countries to fuel their innovation and productivity. It is not too much of a caricature to say that we sell the Americans and Chinese the raw materials they need to create technology to sell back to us.
“There is, of course, a legitimate case to be made for Canada’s approach. The world needs our commodities, energy and otherwise. We should sell them and prosper. But in doing so, we are deliberately following a course where our national wealth is based not on the inventiveness of our people, but on the happy circumstances of our geography. We can prosper doing so (although commodity markets bring their own risks), but we should be clear about the choice we are making and the trade-offs it involves.”
— Alex Wood, Policy and Markets for Sustainable Prosperity 273
While much of the debate surrounding oilsands development, oilsands fever/Dutch disease and regional economic fortunes to date has focused on recent economic performance of different sectors, the longer-term consequences of this restructuring should be of equal or even greater concern to Canadians. By continuing to support and encourage the restructuring of the Canadian economy to support growth of the oilsands sector, while simultaneously ignoring the global economic and political shift towards a low-carbon future, the federal government shows a lack of economic foresight — a mistake for which Canadians could pay dearly.
273 Alex Wood, "Energy: Commodity or Technology?" iPolitics, January 31, 2012. http://www.ipolitics.ca/2012/01/31/alex-wood-energy-commodity-or-technology/
The Pembina Institute 62 In the Shadow of the Boom
5. Conclusions and a path forward
5.1 Conclusions “…natural resources will remain our greatest friend — but possibly our greatest curse as well…It is fairly reasonable to assume that oil and gas demand will remain strong for at least the next few years; but it is also reasonable to imagine some event — a major technological breakthrough, a major world recession, a steep drop in demand due to changing consumer habits — that would see energy prices fall. …The danger lies in our heavy reliance on them and the boom and bust economic cycle they help perpetuate. Economic diversification will remain a difficult goal to achieve.”
— Todd Hirsch, Coming Up NEXT274
Relative to the size of the resource, Canada’s oilsands have only begun to be exploited; yet even at this stage the industry is making significant contributions to Alberta’s GDP, public revenues and employment. In the shadow of this boom, however, other sectors and regions of the Canadian economy are undergoing considerable restructuring. Booming oilsands development has led the Canadian dollar to closely track the price of oil, contributing to the already significant challenges of the manufacturing sector, and creating a unique strain of Dutch disease in Canada. The Canadian manifestation of Dutch disease, oilsands fever, is contributing to an accelerated decline in our country’s once formidable manufacturing sector, a decline that has been somewhat masked by the substantial economic output from the oilsands.
Alberta’s booming economy has benefited from, and contributed to, a tilting of the economic playing field toward oilsands development. This has come at the expense of a diversified manufacturing base in other provinces, limiting their ability to compete for valuable investment capital and ensure a robust, diverse and productive national economy. Further, to the extent that the oilsands sector continues to play an increasingly dominant role in the economy, and federal revenues, both the private and public sectors will be at much greater risk of suffering from the inherent volatility of the global oil market.
The federal government’s recent actions — the “Responsible Resource Development” plan — to reduce environmental oversight and restrict public participation in decisions about major industrial and resource developments like the oilsands risk taking Canada in the wrong direction. These actions risk locking us in to an economy that lacks the resilience, innovative capacity, inclusiveness and diversity needed to ensure sustained Canadian competitiveness and prosperity.
274 Todd Hirsch, Coming Up NEXT: The Transformation of Western Canada’s Economy (Canada West Foundation, 2006), 107.
Conclusions and a path forward
The Pembina Institute 63 In the Shadow of the Boom
Rather than engaging in an informed and constructive discussion about how to collectively manage the economic and environmental impacts in the best interest of all Canadians, the federal government and proponents of oilsands growth have suggested such a conversation is too divisive, and appear set on stifling any meaningful debate. Such a dismissive attitude is more likely to exacerbate, rather than resolve, tensions that have emerged in light of legitimate concerns about the distribution of economic costs and benefits and the fast-growing environmental footprint of the oilsands sector.
Accelerating the development of the oilsands regardless of economic, social or environmental cost would only serve to increase the near-term economic downsides of oilsands across the country, and the associated regional tension. These actions may ultimately limit the long-term competitiveness of the Canadian economy, especially as the global economy shifts towards lower-carbon and potentially lower-cost energy. What is needed, given this context, is leadership to assess and understand the challenges and choices at hand, and to dispatch public policy tools to mitigate the short-term impacts of oilsands fever while facilitating the longer-term transformation of our economy to ensure its competitiveness in a carbon-constrained future.
5.2 A suggested path forward Canadians deserve an informed, inclusive discussion and debate about the future of our economy. While Canada appears blessed with an abundance of energy resources, how we manage the development of these resources — environmentally and economically — has ramifications that will affect all Canadians, both current and future generations. The following suggestions outline a path for near-term action to address the most acute effects of the oilsands fever already being felt, while also informing the vision and leadership necessary to navigate Canada into a sustainable energy future.
1. Establish a federal savings fund for oil and gas-related revenues
“The curse of natural resources presents a real threat. One thing is clear: Canada needs to stop funding the current operating expenses of governments from the monetization of resource assets. Long-term investment funds, managed professionally, would provide a way of generating long-term benefits from cashing out such assets and ultimately contributing to the long-term stable tax base.”
— David Emerson, “Reversing the Curse.”275
Through corporate income taxes paid by oilsands producers, the federal government is a direct beneficiary of the economic growth associated with oilsands development. But as the relative contribution from this activity grows, so grows the risk to the government given the volatility of the global oil marketplace and its cyclical booms and busts. As former federal cabinet minister David Emerson has noted, “Energy and natural resource markets are notoriously volatile. The more government spending relies on such revenues, the more fiscal volatility and instability becomes embedded in fiscal frameworks.”276 In other countries that are heavily dependent on oil 275 David Emerson, “Reversing the Curse: starting with energy,” Policy Options (February 2012), 53. 276 Ibid., 55.
Conclusions and a path forward
The Pembina Institute 64 In the Shadow of the Boom
exports, like Norway, non-renewable resource funds have been established. The purpose of these funds can be four-fold:
1. To save for the future (as non-renewable revenues will inevitably decline over time) 2. By placing the bulk of the fund assets in foreign currencies, to counteract the appreciation
of the local currency and the emergence of Dutch disease effects, and 3. To be drawn from as needed to smooth out the economic boom and bust cycles that are
typically associated with economies whose currency depends on the volatile price of oil or other commodities.
4. To smooth the transition to a clean energy economy by supporting clean energy technology development and deployment, and improving workforce transition towards this growing sector.
Clearly, Canada would find benefit from each of these objectives.
While there has been little enthusiasm from federal officials for such a proposal, partly due to the complexity of calculating how much Ottawa earns from energy, OECD economist Peter Jarrett has suggested that it would be possible to set up and publish a model to estimate revenue flow, which could then be used to set up the fund.277
We suggest that starting with Budget 2013 the federal government: 1. Establish a federal savings fund, 2. Develop a model to estimate and allocate federal revenue associated with oil and gas
development, 3. Establish criteria for the fund, including holding assets in foreign currencies, and when
and how the fund can be drawn down, and 4. Implement a phase-in period for the allocation of revenues associated with the
exploitation of non-renewable resources. 5. Once implemented, expand to other non-renewable resource revenues.
2. Eliminate preferential tax treatment for the oil and gas sector
Both the OECD and International Energy Agency have repeatedly recommended that countries remove inefficient fossil fuel subsidies.278 In 2009 G20 countries, including Canada, agreed to phase out fossil fuel subsidies over the medium term.279
As described in this report, the oil and gas sector still benefits from federal tax breaks, totalling $1.3 billion in 2009. As noted by the OECD, these corporate tax breaks don’t just lead to foregone federal tax revenue, they also further accentuate inequalities between resource-rich versus manufacturing regions of the country.
277 Heather Scoffield, “Canada urged to amass oil wealth,” Globe and Mail, June 11, 2008. 278 OECD, “OECD and IEA recommend reforming fossil-fuel subsidies to improve the economy and the environment,” media release, October 4, 2011. http://www.oecd.org/document/35/0,3746,en_21571361_44315115_48804623_1_1_1_1,00.html 279 Jeff Mason and Darren Ennis, "G20 agrees on phase-out of fossil fuel subsidies," Reuters, September 25, 2009. http://www.reuters.com/article/2009/09/26/us-g20-energy-idUSTRE58O18U20090926
Conclusions and a path forward
The Pembina Institute 65 In the Shadow of the Boom
Given that this tax treatment is unnecessary and contributes to detrimental side effects, we suggest that the federal government develop and implement a plan to phase out such treatment.
3. Convene an expert panel of the Royal Society of Canada on oilsands and the Canadian economy
The Royal Society of Canada, Canada’s national academies of arts, humanities and sciences, plays numerous roles of public benefit, but “…perhaps none is more important than the preparation of expert assessments on critical issues of public policy.”280 In 2010 the society published the Environmental and Health Impacts of Canada's Oil Sands Industry, an independent review of published, peer-reviewed literature that has worked to dispel many of the myths — both positive and negative — about the environmental impacts of oilsands development.281
As our research has demonstrated, there is a growing body of literature exploring the near-term and long-term economic impacts, both positive and negative, of oilsands development. But as with the environmental debate, the emerging economic debate is rapidly escalating to become polarized and politicized.
The Royal Society of Canada has the independence, objectivity and credibility to undertake an expert review of these economic issues and provide public policy recommendations to ensure informed decisions are made about how oilsands development occurs within Canada’s economy. Therefore, we recommend that the society move to convene an expert panel to review, assess and make recommendations on the role of oilsands in the Canadian economy.
4. Initiate a federal committee study on regional competitiveness in a high-dollar era
In response to the highly appreciated Canadian dollar, the Conference Board of Canada advised first and foremost that a “do nothing approach is not a viable option”282 Despite this, a recent Bank of Canada survey of Canadian businesses found that 41 per cent of companies adversely affected by the appreciating Canadian dollar had no plan to respond.283
Various academics and organizations have suggested solutions to the high dollar — from fixed exchange rates or a monetary union with the United States,284 to the establishment of Sector Development Councils,285 to more aggressive research and development investment subsidies286 to support enhanced manufacturing productivity and more. But the federal government has given
280 Royal Society of Canada, “Expert Panels Overview.” http://www.rsc.ca/expertpanels.php 281 P. Gosselin, S. Hrudey, A. Naeth, A. Plourde, R. Therrien, G Van Der Kraak and Z. Xu, The Royal Society of Canada Expert Panel: Environmental and Health Impacts of Canada’s Oilsands Industry (2010), 296. http://www.rsc.ca/documents/expert/ RSC%20report%20complete%20secured%209Mb.pdf. 282 Hodgson, Learning to Live With a Strong Canadian Dollar, 1. 283 Mair, “How the Appreciation of the Canadian Dollar Has Affected Canadian Firms.” 284 Courchene, “A cure for Canada’s case of Dutch disease.” 285 Stanford, A Cure for Dutch Disease, 7. 286 Bimenyimana and Valée, “Curing the Dutch disease in Canada.”
Conclusions and a path forward
The Pembina Institute 66 In the Shadow of the Boom
little consideration to the regional challenges of a high dollar, let alone possible solutions such as those listed above.
The House of Commons Standing Committee on Industry, Science and Technology is well-positioned287 to undertake a study on regional economic competitiveness and the high dollar. The study should look at trends in the restructuring of the Canadian economy and associated regional disparities, and aim to identify actions that the federal government can take to ensure a robust, diverse economy that supports economic growth and competitiveness across Canada.
5. Continue cooperating to establish a Canadian energy strategy
“Compared with most of the great energy exporting nations, we [Canada] have a great ability to diversify our economy — we have a well educated work-force, health immigration levels to build our population and well developed infrastructure. The question for Canada should not be limited to: How can we develop energy resources? Instead, we should ask: How can our energy resources best help us to build a competitive economy and a great society for generations to come?”
— Bob Elton, “How can Canada develop its energy riches to build a great future?”288
There is growing agreement across sectors and provinces that Canada needs some form of a national energy strategy to ensure responsible decisions are made regarding how we produce and consume energy. In July 2011, the Canadian Council of Energy Ministers discussed the topic at their annual meeting, and it will be re-visited this fall when ministers convene in Charlottetown in September.289 Alberta Premier Alison Redford has made the establishment of a “Canadian energy strategy” a key priority, and intends to build support within the Council of the Federation.290 Numerous other stakeholders have also initiated discussions about the development of such a strategy, and momentum appears to be building. Given the scale of both the opportunities and challenges associated with energy production and use, and their national economic and environmental implications, all such efforts are to be applauded and supported.
The process by which a Canadian energy strategy is created is critically significant to its successful implementation. Drawing from the Pembina Institute’s involvement in multiple 287 Industry Canada works in partnership with the members of the Industry Portfolio to leverage resources and exploit synergies in a number of specific areas:
• innovation through science and technology — helping firms and not-for-profit institutions more rapidly turn ideas into new products and services
• trade and investment — encouraging more firms in more sectors to export to more markets, and helping Canadian firms attract a larger share of foreign direct investment
• growth of small and medium-sized enterprises — providing access to capital, information and services • economic growth of Canadian communities — fostering new approaches to community economic
development, based on community strengths and information infrastructures Source: Industry Canada, “Industry Portfolio.” http://www.ic.gc.ca/eic/site/ic1.nsf/eng/h_00022.html 288 Bob Elton, “How can Canada develop its energy riches to build a great future?” National Post, April 23, 2012. 289 Natural Resources Canada, "Energy Ministers support collaborative approach to energy," media release July 19, 2011. http://www.nrcan.gc.ca/media-room/news-release/2011/63/1763 290 "Canadian energy strategy key to Alberta's future: Redford," Edmonton Journal, January 16, 2012.
Conclusions and a path forward
The Pembina Institute 67 In the Shadow of the Boom
national energy strategy dialogues over the past four years, we think an effective collaborative process must be designed to embrace the following principles of engagement:291
a. Inclusivity – The process must engage all relevant sectors, regions, and communities in the energy system, via a diverse range of channels, including digital and face-to-face conversations.
b. Transparency and accessibility – All steps in the process must be transparent so that Canadians can understand what is happening, how their interests are being considered, and how they will participate in the key decisions that affect them.
c. Research excellence and rigour – Success will depend in part on access to appropriate technical support and the very best science and research. Moreover, such support needs to overcome the stifling problem of “dueling science and economics,” and instead provide a single, independent source of information and analysis to inform discussions and decision-making.
d. Iterative, adaptive and enduring – Given the sheer scale and complexity of energy production and use, a collaborative process will need to be both iterative—allowing for multiple cycles of problem definition, analysis and experimentation— and adaptive, so that it is well matched to changing contexts and circumstances and well equipped to revisit issues and areas as new information emerges. Such a process will also need to be longer term, able to outlast any single government, and capable of learning from its own successes and failures.
Similarly, a successful strategy must reflect objectives that effectively balance economic prosperity and environmental sustainability. We support a Canadian energy strategy designed to achieve the following objectives:
1. Provide accessible, fair and efficient energy services to current and future generations of Canadians;
2. Create opportunities for Canada to compete in the international marketplace as a leader in innovative clean energy technologies and solutions, while creating enduring and stable employment for Canadians;
3. Demonstrate leadership on climate change through constructive international engagement and domestic actions to fulfill Canada’s commitments to reduce greenhouse gas emissions; and
4. Protect and restore Canada’s environment by establishing, monitoring and enforcing science-based limits on impacts to our air, land and water.
291 Marlo Raynolds, "Built To Last: A Successful Energy-Strategy Design Process." In Towards a Canadian Energy Strategy, proceedings of the Winnipeg Dialogue, March 31 to April 1, 2011. http://pubs.pembina.org/reports/winnipeg-paper-nes-intro-march-2011.pdf