Embed Size (px)
Citation preview

In The Name of God


Iran
Non-Communicable Diseases Risk Factors Surveillance
Data Book For
2009
By: Jalil Koohpayehzadeh, MD-MPH
Head of NCD Risk Factors Surveillance office, Center for NCD Control and Prevention
Fereshteh Asgari, MD-MPH
Senior Expert of NCD Risk Factors Surveillance office, Center for NCD Control and Prevention
Ali Rafei, MSc
Expert of NCD Risk Factors Surveillance office, Center for NCD Control and Prevention
Supported by: Dr. Ahmad Kousha, Head of Center for NCD Control and Prevention
Under Supervision of:
National NCD Risk Factors Surveillance Committee


I
Contents
Acknowledgement: ........................................................................................................................V
Foreword ...................................................................................................................................... VI
Introduction to the country ............................................................................................................ 8
Executive Summary ....................................................................................................................... 9
1. Demographic Information Results and Response Proportion ............................................ 15
2. Tobacco use ........................................................................................................................ 22
3. Fruit, Vegetable and type of oil Consumption ................................................................... 36
4. Physical Activity ................................................................................................................ 46
5. Blood Pressure and Diabetes History ................................................................................. 66
6. Physical Measurements/ Raised Blood Pressure ................................................................ 82
7. Raised Risk ......................................................................................................................... 97
Appendix .................................................................................................................................... 104
Fish Consumption ................................................................................................................... 105
Insurance Coverage ................................................................................................................ 108
Traffic Accident Risk Factors ................................................................................................. 112
IRAN STEPS Fact Sheet 2009 ............................................................................................... 120

II
List of tables Number Title Page Table 1 Age group and sex of respondents 15 Table 2 Employment status in urban areas 16 Table 3 Employment status in rural areas 17 Table 4 Employment status in all areas 18 Table 5 Unpaid work and unemployed in urban areas 19 Table 6 Unpaid work and unemployed in rural areas 20 Table 7 Unpaid work and unemployed in all areas 21 Table 8 Percentage of current smokers 22 Table 9 Smoking status of all respondents by sex and age group in urban areas 23 Table 10 Smoking status of all respondents by sex and age group in rural areas 24 Table 11 Smoking status of all respondents by sex and age group in all areas 25 Table 12 Current daily smokers among all smokers 26 Table 13 Mean amount of tobacco used by daily smokers by type in urban areas 27 Table 14 Mean amount of tobacco used by daily smokers by type in rural areas 28 Table 15 Mean amount of tobacco used by daily smokers by type in all areas 29 Table 16 Mean age started smoking for current smoker by sex and age group 30 Table 17 Mean duration of smoking for current smokers by sex and age group 31 Table 18 Ex-daily smokers among all respondents 32 Table 19 Mean years since cessation 33 Table 20 Daily tobacco users 34 Table 21 Current tobacco users 35 Table 22 Mean number of days fruit consumed in a typical week 36 Table 23 Mean number of days vegetables consumed in a typical week 37 Table 24 Mean number of servings of fruit on average per day 38 Table 25 Mean number of servings of vegetable on average per day 39 Table 26 Mean number of servings of fruit and/or vegetables on average per day 40 Table 27 Number of servings of fruit and/or vegetables on average per day in urban areas 41 Table 28 Number of servings of fruit and/or vegetables on average per day in rural areas 42 Table 29 Number of servings of fruit and/or vegetables on average per day in all areas 43 Table 30 Consuming < 5 servings of fruit and/or vegetables on average per day 44 Table 31 Type of oil or fat most often used for meal preparation in household 45 Table 32 Level of total physical activity in urban areas 47 Table 33 Level of total physical activity in rural areas 48 Table 34 Level of total physical activity in all areas 49 Table 35 Mean minutes of total physical activity on average per day 50 Table 36 Mean minutes of transport -related physical activity on average per day 51 Table 37 Mean minutes of recreation-related physical activity on average per day 52 Table 38 Median minutes of work-related physical activity on average per day 53 Table 39 Median minutes of transport-related physical activity on average per day 54 Table 40 Median minutes of recreation-related physical activity on average per day 55 Table 41 No work -related physical activity 56

III
Number Title Page Table 42 No transport -related physical activity 57 Table 43 No recreation-related physical activity 58 Table 44 Composition of total physical activity in urban areas 59 Table 45 Composition of total physical activity in rural areas 60 Table 46 Composition of total physical activity in all areas 61 Table 47 No vigorous-related physical activity 62 Table 48 Minutes spent in sedentary activities on average per day in urban areas 63 Table 49 Minutes spent in sedentary activities on average per day in rural areas 64 Table 50 Minutes spent in sedentary activities on average per day in all areas 65 Table 51 Raised blood pressure diagnosed by doctor or health worker in last 12 months 67 Table 52 Currently taking blood pressure drugs prescribed by doctor or health worker 68 Table 53 Advised by doctor or health worker to have special prescribed diet 69 Table 54 Advised by doctor or health worker to lose weight 70 Table 55 Advised by doctor or health worker to stop smoking 71 Table 56 Advised by doctor or health worker to start or do more exercise 72 Table 57 Currently taking herbal or traditional remedy for high blood pressure 73 Table 58 Diabetes diagnosed by doctor or health worker in last 12 month 74 Table 59 Currently taking insulin prescribed for diabetes by doctor or health worker 75 Table 60 Currently taking oral drugs prescribed for diabetes by doctor or health worker 76 Table 61 Advised by doctor or health worker to have special prescribed diet 77 Table 62 Advised by doctor or health worker to lose weight 78 Table 63 Advised by doctor or health worker to stop smoking 79 Table 64 Advised by doctor or health worker to start or do more exercise 80 Table 65 Currently taking herbal or traditional treatment for diabetes 81 Table 66 Mean height (cm) 82 Table 67 Mean weight (kg) 83 Table 68 Waist circumference (cm) 84 Table 69 Mean BMI (kg/m2) 85 Table 70 BMI classifications in urban areas 87 Table 71 BMI classifications in rural areas 88 Table 72 BMI classifications in all areas 89 Table 73 Mean systolic blood pressure (mmHg) 90 Table 74 Mean diastolic blood pressure (mmHg) 91 Table 75 SBP ≥140 and/or DBP ≥ 90 mmHg 92 Table 76 SBP ≥140 and/or DBP ≥ 90 mmHg or currently on medication for raised blood pressure 93 Table 77 Currently on medication for raised blood pressure 94 Table 78 SBP ≥160 and/or DBP ≥ 100 mmHg 95 Table 79 SBP ≥160 and/or DBP ≥ 100 mmHg or currently on medication for raised blood pressure 96 Table 80 Raised Risk in urban areas 98 Table 81 Raised Risk in rural areas 99 Table 82 Raised Risk in all areas 100 Table 83 Raised Risk in urban areas 101

IV
Number Title Page Table 84 Raised Risk in rural areas 102 Table 85 Raised Risk in all areas 103 Table 86 Number of servings of fish on average per week in urban areas 105 Table 87 Number of servings of fish on average per week in rural areas 106 Table 88 Number of servings of fish on average per week in all areas 107 Table 89 Percentage who are insured by sex and age group 108 Table 90 Insurance Type in urban areas 109 Table 91 Insurance Type in rural areas 110 Table 92 Insurance Type in all areas 111 Table 93 Percentage who sit on front seat of car 112 Table 94 Percentage who traffic by motorcycle 113 Table 95 Fastening seat belt among those who sit on front seat in urban areas 114 Table 96 Fastening seat belt among those who sit on front seat in rural areas 115 Table 97 Fastening seat belt among those who sit on front seat in all areas 116 Table 98 Using helmet among those who traffic by motorcycle in urban areas 117 Table 99 Using helmet among those who traffic by motorcycle in rural areas 118 Table 100 Using helmet among those who traffic by motorcycle in all areas 119
V
Acknowledgement: This Report was successfully conducted at NCD Risk Factor Surveillance office of Center for
Non-Communicable Diseases Control, with the hard work, participation and collaboration of 41 universities and faculties Health Deputies undercovering of Iran Ministry of Health and Medical Education, leadership of Iran Non-Communicable Diseases Risk Factors Committee (Dr. F. Azizi, Dr. A. Haghdoost, Dr. K. Mohamad, Dr. A. Esteghamati Dr. A. Meisami, Dr. M. Forozanfar, Dr. A Keshtkar, Dr. R. Heshmat).
We thank all related experts in Diseases Control and Prevention units of Health Deputy of universities, laboratory managers and staffs and participation of step survey team and researchers who managed and implemented all aspects of the survey activities and data processing. We gratefully acknowledge the previous Minister of Health; Dr. K. Bagheri Lankarani, the previous Deputy of Health; Dr. S. Alavian and the best thank of the head of Center for Communicable Diseases Control; Dr. M. Gouya.
We also thank Dr. A. Delavari, Dr. R. Ramezani, Dr. S. Alikhani and Dr. M. Abbasi, and local staffs; A. Dormiani, E. Hojatzadeh, S. Bejani, and S. Bagheri, Laboratory manager; Dr. A. Safaei and others. In addition we would like to appreciate the World Health Organization and STEPs team of WHO office in Geneva and Cairo.

VI
Foreword With the changing lifestyle and dietary habits in the world, the Middle East region is expected to face one of
the world’s greatest increases in the non-communicable diseases (NCDs) burden and related risk factors over coming decades. Most of this increase is anticipated to affect the economically productive age of 45-64 year, although in most of developed countries it is in >65 years old. The Islamic Republic of Iran is in the population transmutation and significant health states. PHC in Iran is a strong network of health care affaires with a proper coverage in rural areas, so that health improvement has been experienced on communicable diseases well controlled.
Now burden of non-communicable diseases is dominated as an important priority in health promotion by considering urbanization and aging growing. Iran has initiated some plans including new tobacco control legislation, injury control and safe dietary, health education campaigns to prevent NCDs added and a numbers of NCDs intervention programs to manage diabetes, cardiovascular diseases and cancer faces to NCDs burden. In this document the NCD risk factors (tobacco, diet, physical activity, body weight, blood pressure, blood glucose and lipids) in Iran, are presented.
The results are based on a nationwide survey of over 30,000 Iranian aged 15-64 conducted in 2009. The survey is part of global effort, stepwise approach to surveillance of Non Communicable Diseases (STEPs), to collect qualified information to public health plans. Until now it is the 5TH round of steps in Iran which can prepare a picture of risk factors of NCDs in different age groups. The non-communicable risk factors surveillance office in center for non communicable diseases Control Cooperation with universities health deputies NCDs units’ experts and health staffs and research centers, produced this report as a request by the world health organization for the ministry of health to monitor its current state of NCDs and related risk factors.
41 universities and faculties health staff played an essential role in planning and implementing this study. Their commitment is gratefully acknowledged. Also supporting by several thousand people whose taking part willingness in this study is very appreciated. This document will encourage further collaboration in continuing to collect qualify information that will help policy makers health planning and services in different parts of Iran. Now Iran has a strong network and structure of these groups with good quality of technical support and assistance to run the survey periodically and monitor the NCDs trends.
Dr. H. Ghazizadeh Hashemi Minister of Health and Medical Education

VII
Chronic diseases are responsible for 60% deaths and 47% of global burden of diseases in the world in 2020. 80% of chronic disease deaths occur in low and middle income countries. The major risk factors are preventable and account for 80% of deaths from heart disease and stroke. Iran is the second most populous country in the Middle East region. From major groups of diseases and injuries, non-communicable diseases cause the most disease burden in Iran: 45% for males and 33% for females from all-causes total burden for both sexes. Obesity and overweight, arterial hypertension, inadequate physical activity, hypercholesterolemia, and addiction are the first 5 risk factors causing the highest proportion of burden: 68% of risk factor burden, 11% of total burden of disease, with 1.6 million DALYs altogether based on the Ministry of Health’s Burden of Disease Study, 2003.
Implementing Systematic NCD common risk factors Surveillance via STEPs, the WHO recommended NCD surveillance tool, offers a common approach to defining core variables for surveys with the goal of achieving data comparability over time within and between countries. This tool offers an entry point to get started or improved in NCD activities and strengthen infrastructure for monitoring and evaluating of NCD control program and prepare a qualified supportive infrastructure for NCD preventive research.
National NCD risk factor surveillance system of Iran has been established since 2005 through which continuous large-scale surveillance surveys conducted to find out the existing situation of NCD risk factors in 15 to 64 year-old Iranian citizens and disseminating produced information and focuses on advocacy to capacity building for running three national policies; to counter low physical activity, unhealthy diet and smoking, by considering a national strategy which included all intra and extra sectoral coordination affaires.
It is planned for subsequent and continues similar surveys to follow the trend of these risks and will hold up-to-date risk-factor data for each of the 30 provinces and country level trend. This report presented the results of the third national Survey of Risk Factors of Non-Communicable Diseases (NCD-SuRF) of Iran, provided the demographic, anthropometric, behavioral and biochemical characteristics of a nationally representative sample of 30000 Iranians, aged 15-64. Summary profiles of available country and provincial level data will be updated continuously and published at regular intervals.
Dr. A.A. Sayyari Deputy for Health- MOH

8 Iran NCD Risk Factors STEPs Report
Introduction to the country
• Geographical location: Asia; Middle East • Neighbors: Afghanistan, Armenia, Azerbaijan, Iraq, Pakistan, Turkmenistan, Turkey • Location: Middle East Region • Size: 1648195 Sq Km. • Population: 70495782 (1385 census), Second most populous country in the region • Population annual average growth: 1.6% • Population by age: 0-15 (25.1%), 15-65 (69.7%) 65 and over (5.2%). • Urban population: 68% • GDP: US$114 billion • 3 common death causes: Accident, CVD, Cancers
Iran NCD Risk Factors STEPs Report 9
Executive Summary Stepwise Non-communicable Diseases Risk Factors Survey in Iran (Iran – STEPs) is a surveillance tool recommended by WHO. Iran STEPs was planned as a nationwide system to all over the country in cooperation with 41 universities, to obtain a valid and continuous evidence to assist the effective affairs of prevention and control programs representative of 15-64 years old. Objectives:
• To develop infrastructure for NCDs risk factor surveillance and strengthen the monitoring and evaluating of NCD control intervention program priorities.
• To provide national and provincial reliable and up-to-date information resources on risk factors to map prevalence, trend and distribution.
• To prepare a tool for evidence-based public health decision making with the ultimate aim of containing and reducing the emerging epidemic of non-communicable diseases
• To prepare a supportive infrastructure for NCD preventive research to view effective interventions • To promote the level of knowledge, reinforcement and enlargement of public health capacity in NCD
prevention and PHC services. The planning and running of survey was based on the World Health Organization STEPs as the third round in Iran. It was a population base cross sectional survey, representative the national pattern of NCDs risk factors, among 15- 64 years old. Data collection questionnaire was categorized in sequential three-step process as follows:
STEP 1: Interview-based on demographic and behavioral risk factors including tobacco use, diet, physical activity, history of high blood pressure, diabetes and additional issues such as: fastening front seat belt and insurance coverage.
STEP 2: Physiological measures of health risk factors such as blood pressure, body mass and waist
girth circumference.
STEP 3: Biochemical measures of health risks including fasting blood glucose and blood lipids.
All aspects of survey were managed by Iran steps team.
The sample size was 30,000 participants aged 15-64 years old from 30 provinces across Iran.
10 Iran NCD Risk Factors STEPs Report
Methodology: The third round of national STEPs was conducted in March 2007 based on “ WHO Stepwise approach” to surveillance for NCD risk factors with respect of standardized data collection as well as sufficient flexibility in appropriate a variety of country situations and setting. It was comprised 30000 Iranian citizens aged 15-64 years old. All selected participants were invited to participate by receiving informed consent. This survey was conducted by using a cluster sampling. Each cluster was selected by randomly method and stratified by age and sex stratum. Sampling frame was defined in 50 clusters for every 30 provinces. Each cluster was selected based on random cluster sampling. 10 male and 10 female, 20 samples in each age group, living in neighboring households in 5 age groups stratum. There is no distinction between rural and urban areas in samples, so that the samples were selected proportional to urban- rural population. This sample size approximates a 0.06 % sampling fraction of the target population in the 15-64 year age group. It was agreed that approximately 1000 samples participate in each province in urban/rural population size proportionally. STEPs staff participated intensive training program techniques, through demonstrations and role-plays, and practiced interview and engaged in discussions to clarify issues surrounding item and technical and medical requirements follow the same process for the first and second survey. All participants were visited by trained interviewers and all selected individuals were invited to participate in all three steps. Steps questionnaire: The core questions in 3 steps instrument remained unchanged. Additional items relating to NCD control and prevention to be included by survey team agreement as optional and expanded questions. Step 1: Demographic and Behavioral Assessments: Data for step 1 were collected in 6 different domains: demographic information, diet, physical activity, tobacco use, history of hypertension and diabetes. Occupation, sex, age, province and area of evidence were included in demographic information and diet information; consist of fruit and vegetable servings consumed per day for a usual week and common type of oil or fat used by the family. Step 2: Physical measurements Weight, height, waist circumference and blood pressure were measured, in light clothing without shoes, by portable calibrated electronic weighting scale, a portable height scale and constant tension tape at the end of a normal expiration (except for female participants who were pregnant) and calibrated. Omron M7 sphygmomanometer (HEM-780-E), average of 5 minutes for 3 measurement intervals respectively. Quality control for each measurement was monitored through periodic checks conducted by STEPs team supervisors in provinces. Blood pressure was measured three items and the mean value of them was recorded for analysis. Step 3: Biochemical risk factor measurements Fasting plasma glucose, triglycerides, total cholesterol, high density lipoprotein, low density lipoprotein level were determined. Laboratory personnel in MOH and universities, who were familiar with the STEP 3 protocols, ensured quality control and supervised the process.

Iran NCD Risk Factors STEPs Report 11
Questionnaire Processing and Method of Analysis Data collection were done in 30 provinces by related steps team and entered into EpiInfo 6 data base. The double data entry was done after data cleaning activities by related steps staffs. All data checked in the view of duplicated record, incompleteness and invalid code and values. Weighting the survey data was computed based on 2006 Iranian national census, in considering calculated missing data weight, to match the age, sex, and provinces stratum. Data analysis were conducted using Stata version 10 and weighted frequency estimates presented with 95% confidence interval and significant P values less than 0.05 for all variables by 5 age groups and sex in each provinces. Tobacco use
• The prevalence of current smoking in urban area was 11.67% overall with the higher proportion for males (21.69%) than females (1.40%).
• The prevalence of current smoking in rural area was 12.02% overall with the higher proportion for males (22.75%) than females (1.02%).
• The prevalence of current smoking was 11.79% overall with the higher proportion for males (22.06%) than females (1.26%).
• Among all respondents in urban area, 10.89% were daily smokers: 20.45% of males and 1.09% of females.
• Among all respondents in rural area, 10.73% were daily smokers: 20.31% of males and 0.91% of females. • Among all respondents, 10.82% were daily smokers: 20.39% of males and 1.02% of females. • The mean age at which daily smoking started was 20.10 years in urban area. • The mean age at which daily smoking started was 21.35 years in rural area. • The mean age at which daily smoking started was 20.12 years. • Among current smokers, the average number of manufactured cigarettes smoked per day in urban area
was 13.27; 13.13 of males and 13.40 of females, without significant difference. • Among current smokers, the average number of manufactured cigarettes smoked per day in rural area was
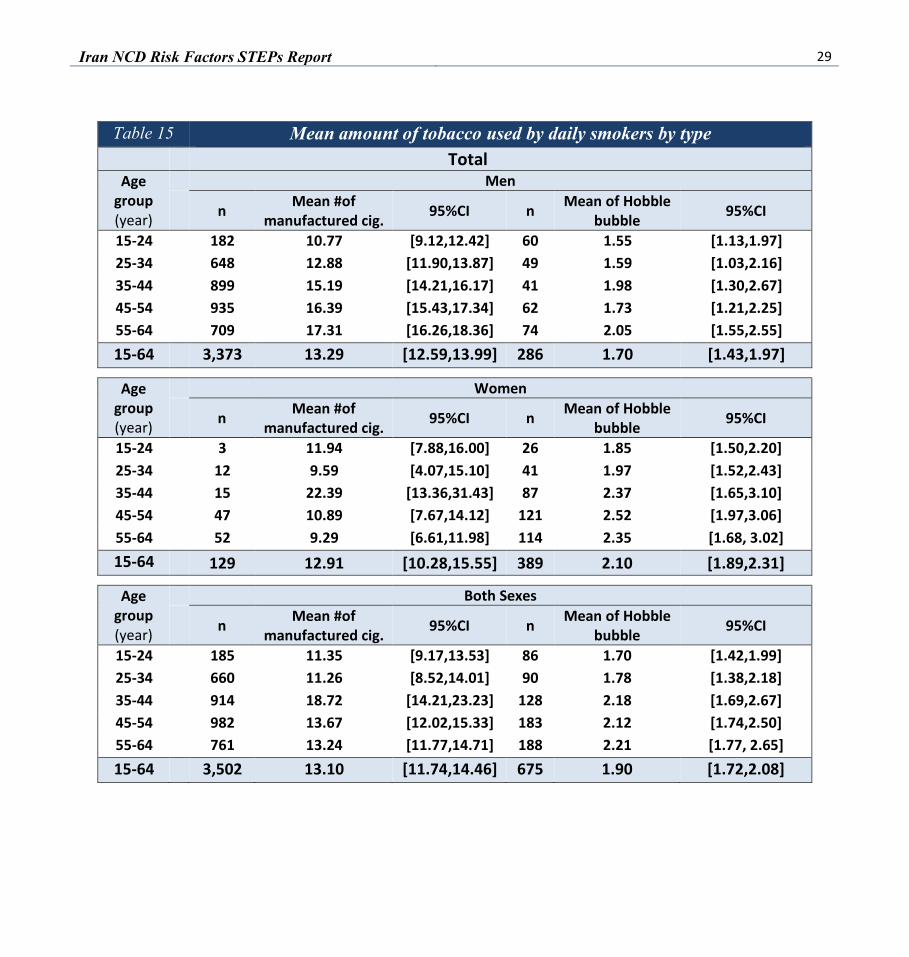
12.91; 13.58 of males and 11.85 of females, without significant difference. • Among current smokers, the average number of manufactured cigarettes smoked per day was 13.10; 13.29
of males and 12.91 of females, without significant difference. Fruits and vegetables consumption
• The overall prevalence of eating less than 5 servings of fruit and vegetables reported per day was 85.85%; 87.95% for males and 83.7% for females in urban area.
• The overall prevalence of eating less than 5 servings of fruit and vegetables reported per day was 92.44%; 93.82% for males and 91.04% for females in rural area.
• The overall prevalence of eating less than 5 servings of fruit and vegetables reported per day was 88.2%; 90.02% for males and 86.33% for females.
12 Iran NCD Risk Factors STEPs Report
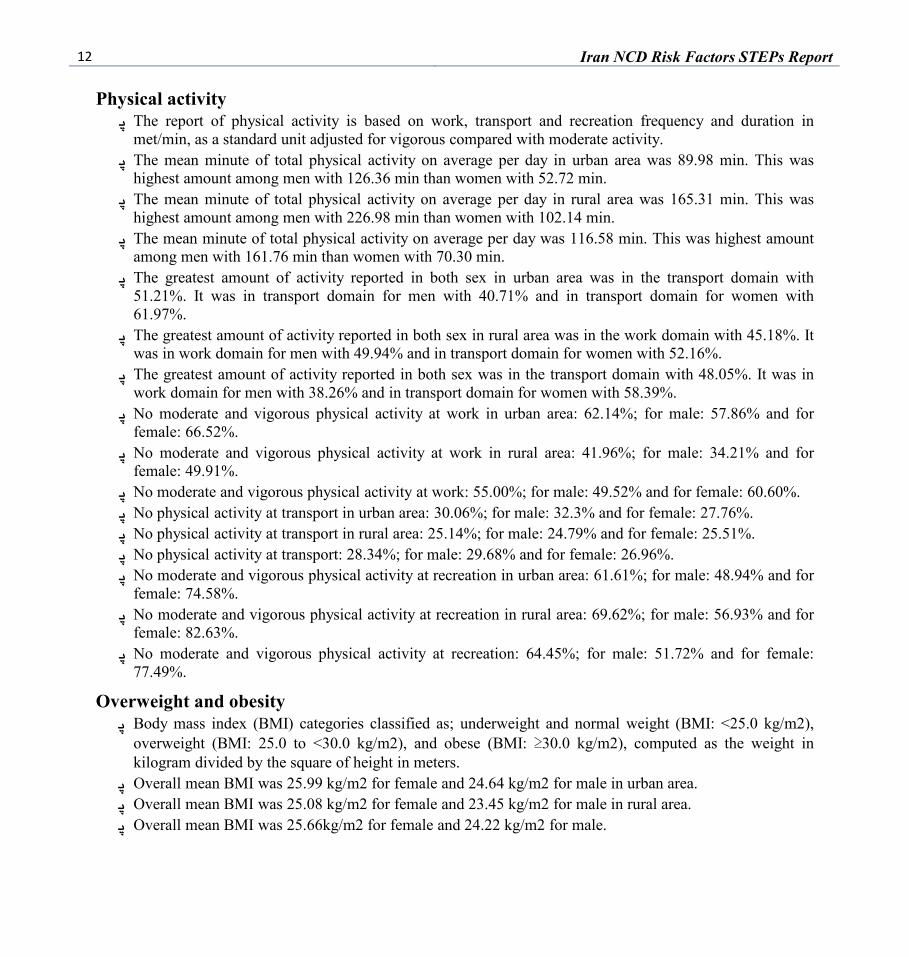
Physical activity • The report of physical activity is based on work, transport and recreation frequency and duration in
met/min, as a standard unit adjusted for vigorous compared with moderate activity. • The mean minute of total physical activity on average per day in urban area was 89.98 min. This was
highest amount among men with 126.36 min than women with 52.72 min. • The mean minute of total physical activity on average per day in rural area was 165.31 min. This was
highest amount among men with 226.98 min than women with 102.14 min. • The mean minute of total physical activity on average per day was 116.58 min. This was highest amount
among men with 161.76 min than women with 70.30 min. • The greatest amount of activity reported in both sex in urban area was in the transport domain with
51.21%. It was in transport domain for men with 40.71% and in transport domain for women with 61.97%.
• The greatest amount of activity reported in both sex in rural area was in the work domain with 45.18%. It was in work domain for men with 49.94% and in transport domain for women with 52.16%.
• The greatest amount of activity reported in both sex was in the transport domain with 48.05%. It was in work domain for men with 38.26% and in transport domain for women with 58.39%.
• No moderate and vigorous physical activity at work in urban area: 62.14%; for male: 57.86% and for female: 66.52%.
• No moderate and vigorous physical activity at work in rural area: 41.96%; for male: 34.21% and for female: 49.91%.
• No moderate and vigorous physical activity at work: 55.00%; for male: 49.52% and for female: 60.60%. • No physical activity at transport in urban area: 30.06%; for male: 32.3% and for female: 27.76%. • No physical activity at transport in rural area: 25.14%; for male: 24.79% and for female: 25.51%. • No physical activity at transport: 28.34%; for male: 29.68% and for female: 26.96%. • No moderate and vigorous physical activity at recreation in urban area: 61.61%; for male: 48.94% and for
female: 74.58%. • No moderate and vigorous physical activity at recreation in rural area: 69.62%; for male: 56.93% and for
female: 82.63%. • No moderate and vigorous physical activity at recreation: 64.45%; for male: 51.72% and for female:
77.49%.
Overweight and obesity • Body mass index (BMI) categories classified as; underweight and normal weight (BMI: <25.0 kg/m2),
overweight (BMI: 25.0 to <30.0 kg/m2), and obese (BMI: ≥30.0 kg/m2), computed as the weight in kilogram divided by the square of height in meters.
• Overall mean BMI was 25.99 kg/m2 for female and 24.64 kg/m2 for male in urban area. • Overall mean BMI was 25.08 kg/m2 for female and 23.45 kg/m2 for male in rural area. • Overall mean BMI was 25.66kg/m2 for female and 24.22 kg/m2 for male.

Iran NCD Risk Factors STEPs Report 13
• The proportion of overweight or obese was 47.21% in both sex; 50.96% in female and. 43.56% in male in urban area.
• The proportion of overweight or obese was 38.12% in both sex; 45.61% in female and. 30.8% in male in rural area.
• The proportion of overweight or obese was 44.03% in both sex; 49.08% in female and. 39.1% in male. • A significant proportion of underweight is 12.17% in 15-24 age group compared with 6.05% in all age
groups in urban area. • A significant proportion of underweight is 14.02% in 15-24 age group compared with 8.16% in all age
groups in rural area. • A significant proportion of underweight is 12.84% in 15-24 age group compared with 6.8% in all age
groups. • 16.65% of respondents were obese with more proportion in females: 21.96%, than males: 11.47% in
urban area. It is increased after age 45-54 years. • 12.59% of respondents were obese with more proportion in females: 17.77%, than males: 7.53% in rural
area. It is increased after age 45-54 years. • 15.22 % of respondents were obese with more proportion in females: 10.1%, than males: 20.47%. It is
increased after age 45-54 years. High blood pressure
• 16.49% of all had raised blood pressure (SBP≥140 or DBP≥90 or currently on anti-hypertensive medication) in urban area. The total proportion was: 17.27% for males and 15.69% for females while the difference was significant in age group proportion by sex.
• 15.35% of all had raised blood pressure (SBP≥140 or DBP≥90 or currently on anti-hypertensive medication) in rural area. The total proportion was: 13.83% for males and 16.91% for females while the difference was significant in age group proportion by sex.
• 16.09% of all had raised blood pressure (SBP≥140 or DBP≥90 or currently on anti-hypertensive medication). The total proportion was: 16.07% for males and 16.12% for females while the difference was significant in age group proportion by sex.
Raised risk for NCDs
• Five common and critical risk factors for NCDs were selected to assess STEPs NCD risk factors-raised risk by WHO recommendation: current daily smokers, overweight or obese (BMI≥25.0kg/m2), raised blood pressure (SBP≥140 and/or DBP≥90 mmHg or currently on medication for raised blood pressure), consuming less than 5 servings of fruits and vegetables per day and low level of physical activity(<600 MET-minutes).
• 4.08% of 15-44 years were low risk to NCDs (none of the 5 risk factors), compared with 1.15% in 45-64 years which is significant in men than women in urban area.
• 2.98% of 15-44 years were low risk to NCDs (none of the 5 risk factors), compared with 0.91% in 45-64 years which is significant in men than women in rural area.
14 Iran NCD Risk Factors STEPs Report
• 3.68% of 15-44 years were low risk to NCDs (none of the 5 risk factors),compared with 1.06% in 45-64 years which is significant in men than women.

Iran NCD Risk Factors STEPs Report 15
1. Demographic Information Results and Response Proportion: Table 1 Age group and sex of respondents
Urban area Age group
(year) Men Women Both sexes
n % n % n % 15-24 1,652 50.11 1,645 49.89 3,297 100.00 25-34 1,627 50.02 1,626 49.98 3,253 100.00 35-44 1,640 50.29 1,621 49.71 3,261 100.00 45-54 1,616 50.03 1,614 49.97 3,230 100.00 55-64 1,601 50.06 1,597 49.94 3,198 100.00 15-64 8,136 50.10 8,103 49.90 16,239 100.00
Rural area Age group
(year) Men Women Both sexes
n % n % n % 15-24 1,380 49.98 1,381 50.02 2,761 100.00 25-34 1,353 49.63 1,373 50.37 2,726 100.00 35-44 1,367 50.05 1,364 49.95 2,731 100.00 45-54 1,356 49.51 1,383 50.49 2,739 100.00 55-64 1,348 50.09 1,343 49.91 2,691 100.00 15-64 6,804 49.85 6,844 50.15 13,648 100.00
Total Age group
(year) Men Women Both sexes
n % n % n % 15-24 3,032 50.05 3,026 49.95 6,058 100.00 25-34 2,980 49.84 2,999 50.16 5,979 100.00 35-44 3,007 50.18 2,985 49.82 5,992 100.00 45-54 2,972 49.78 2,998 50.22 5,970 100.00 55-64 2,949 50.08 2,940 49.92 5,889 100.00 15-64 14,940 49.99 14,948 50.01 29,888 100.00

16 Iran NCD Risk Factors STEPs Report
Employment status: This Table describes proportion of respondents in paid employment, which is best, their main work status
over the last 12 months, and those who are unpaid. Unpaid includes persons who are non-paid, students, homemakers, retired, and unemployed.
Table 2 Employment status Urban area
Age group (year)
Men n %Government
employee %Non-government
employee %Self-
employed %Unpaid
15-24 1,622 1.60 2.59 21.58 74.23 25-34 1,551 15.09 11.67 55.58 17.67 35-44 1,579 25.97 9.75 56.05 8.23 45-54 1,556 18.12 4.18 48.20 29.50 55-64 1,565 5.30 3.07 33.67 57.96 15-64 7,873 13.15 6.22 42.86 37.77
Age group (year)
Women n %Government
employee %Non-government
employee %Self-
employed %Unpaid
15-24 1,639 0.85 0.98 1.46 96.71 25-34 1,610 6.09 3.17 3.85 86.89 35-44 1,610 9.69 1.37 3.04 85.90 45-54 1,608 3.86 0.56 1.87 93.72 55-64 1,594 0.82 0.38 1.19 97.62 15-64 8,061 4.26 1.29 2.28 92.17
Age group (year)
Both Sexes n %Government
employee %Non-government
employee %Self-
employed %Unpaid
15-24 3,261 1.23 1.78 11.47 85.53 25-34 3,161 10.50 7.34 29.23 52.93 35-44 3,189 17.75 5.52 29.29 47.44 45-54 3,164 10.87 2.34 24.65 62.14 55-64 3,159 3.04 1.71 17.28 77.97 15-64 15,934 8.65 3.73 22.33 65.29

Iran NCD Risk Factors STEPs Report 17
Table 3 Employment status Rural area
Age group (year)
Men
n %Government employee
%Non-government employee
%Self-employed %Unpaid
15-24 1,305 1.38 1.46 32.26 64.90 25-34 1,223 7.20 6.30 71.87 14.64 35-44 1,219 12.63 3.53 73.58 10.25 45-54 1,191 7.39 3.19 70.03 19.40 55-64 1,205 1.91 0.83 66.80 30.46 15-64 6,143 6.04 3.04 62.45 28.47
Age group (year)
Women
n %Government employee
%Non-government employee
%Self-employed %Unpaid
15-24 1,370 0.51 0.88 2.12 96.50 25-34 1,362 2.06 0.81 3.08 94.05 35-44 1,350 1.26 0.30 1.70 96.74 45-54 1,366 0.59 0.15 1.68 97.58 55-64 1,333 0.23 0.00 0.75 99.0 15-64 6,781 0.93 0.43 1.87 96.77
Age group (year)
Both Sexes
n %Government employee
%Non-government employee
%Self-employed %Unpaid
15-24 2,675 0.93 1.16 16.82 81.08 25-34 2,585 4.49 3.40 35.63 56.48 35-44 2,569 6.66 1.83 35.81 55.70 45-54 2,557 3.75 1.56 33.52 61.17 55-64 2,538 1.02 0.39 32.11 66.47 15-64 1,292 3.36 1.67 30.66 64.31

18 Iran NCD Risk Factors STEPs Report
Table 4 Employment status Total
Age group (year)
Men
n %Government employee
%Non-government employee
%Self-employed
%Unpaid
15-24 2,927 1.50 2.08 26.34 70.07 25-34 2,774 9.30 9.30 62.76 16.33 35-44 2,798 20.16 7.04 63.69 9.11 45-54 2,747 13.47 3.75 57.66 25.12 55-64 2,770 3.83 2.09 48.09 45.99 15-64 14,016 10.03 4.83 51.44 33.70
Age group (year)
Women
n %Government employee
%Non-government employee
%Self-employed %Unpaid
15-24 3,009 0.70 0.93 1.76 96.61 25-34 2,972 4.24 2.09 3.50 90.17 35-44 2,960 5.84 0.88 2.43 90.84 45-54 2,975 2.35 0.37 1.78 95.50 55-64 2,927 0.55 0.20 0.99 98.26 15-64 14,843 2.74 0.90 2.10 94.27
Age group (year)
Both Sexes
n %Government employee
%Non-government employee
%Self-employed %Unpaid
15-24 5,936 1.10 1.50 13.88 83.52 25-34 5,746 7.80 5.57 32.11 54.52 35-44 5,758 12.80 3.87 32.20 51.13 45-54 5,722 7.69 1.99 28.61 61.71 55-64 5,697 2.14 1.12 23.89 72.85 15-64 28,859 6.28 2.81 26.06 64.85

Iran NCD Risk Factors STEPs Report 19
Unpaid work and unemployed Proportion of respondents based on their main work status over the last 12 months in unpaid work is
described in this table.
Table 5 Unpaid work and unemployed Urban area
Age Group (years)
Men
n %Non-paid %Student %Solider %Home-maker %Retired
Unemployed
%Able to work
%Not able to work
15-24 1,204 0.50 82.72 3.57 0.00 0.25 12.04 0.91 25-34 274 1.46 40.88 2.92 2.55 0.00 45.99 6.20 35-44 130 2.31 5.38 0.00 6.92 30.00 33.85 21.54 45-54 459 0.87 0.44 0.00 1.96 74.29 11.76 10.68 55-64 907 0.22 0.44 0.00 0.88 77.62 8.16 12.68 15-64 2,974 0.64 37.69 1.71 1.11 36.55 14.90 7.40
Age Group (years)
Women
n %Non-paid %Student %Solider %Home-maker %Retired
Unemployed
%Able to work
%Not able to work
15-24 1,585 0.25 54.83 0.00 35.96 0.06 8.77 0.13 25-34 1,399 0.29 4.15 0.00 89.92 0.14 5.36 0.14 35-44 1,383 0.22 0.36 0.00 98.26 0.43 0.58 0.14 45-54 1,507 0.33 0.13 0.00 93.83 5.37 0.07 0.27 55-64 1,556 0.19 0.00 0.00 91.58 6.94 0.32 0.96 15-64 7,430 0.26 12.57 0.00 81.10 2.66 3.07 0.34
Age Group (years)
Both sexes
n %Non-paid %Student %Solider %Home-maker %Retired
Unemployed
%Able to work
%Not able to work
15-24 2,789 0.36 66.87 1.54 20.44 0.14 10.18 0.47 25-34 1,673 0.48 10.16 0.48 75.61 0.12 12.01 1.14 35-44 1,513 0.40 0.79 0.00 90.42 2.97 3.44 1.98 45-54 1,966 0.46 0.20 0.00 72.38 21.46 2.80 2.70 55-64 2,463 0.20 0.16 0.00 58.18 32.97 3.21 5.28 15-64 10,404 0.37 19.75 0.49 58.24 12.35 6.45 2.35

20 Iran NCD Risk Factors STEPs Report
Table 6 Unpaid work and unemployed
Rural area
Age Group (years)
Men
n %Non-paid %Student %Solider %Home-maker %Retired
Unemployed
%Able to work
%Not able to work
15-24 847 4.01 70.25 4.25 0.94 0.00 18.89 1.65 25-34 179 11.73 16.76 1.12 2.23 0.00 59.22 8.94 35-44 125 5.60 0.80 0.00 4.80 10.40 52.80 25.60 45-54 231 6.93 0.00 0.00 3.03 35.50 27.27 27.27 55-64 367 2.18 0.54 0.27 1.91 34.88 18.80 41.42 15-64 1,749 2.18 35.91 2.23 1.83 12.75 26.53 15.84
Age Group (years)
Women
n %Non-paid %Student %Solider %Home-maker %Retired
Unemployed
%Able to work
%Not able to work
15-24 1,322 2.04 28.97 0.00 58.70 0.00 10.21 0.08 25-34 1,281 1.80 1.64 0.00 92.90 0.16 3.28 0.23 35-44 1,306 2.37 0.15 0.00 96.86 0.08 0.31 0.23 45-54 1,333 2.10 0.08 0.00 96.77 0.15 0.45 0.45 55-64 1,320 1.44 0.00 0.00 95.53 0.53 0.68 1.82 15-64 6,562 1.95 6.20 0.00 88.11 0.18 2.99 0.56
Age Group (years)
Both sexes
n %Non-paid %Student %Solider %Home-maker %Retired
Unemployed
%Able to work
%Not able to work
15-24 2,169 2.81 45.09 1.66 36.15 0.00 13.60 0.69 25-34 1,460 3.01 3.49 0.14 81.78 0.14 10.14 1.30 35-44 1,431 2.66 0.21 0.00 88.82 0.98 4.89 2.45 45-54 1,564 2.81 0.06 0.00 82.93 5.37 4.41 4.41 55-64 1,687 1.60 0.12 0.06 75.16 8.00 4.62 10.43 15-64 8,311 2.57 12.45 0.47 69.96 2.83 7.94 3.78

Iran NCD Risk Factors STEPs Report 21
Table 7 Unpaid work and unemployed
Total
Age Group (years)
Men
n %Non-paid %Student %Solider %Home-maker %Retired
Unemployed
%Able to work
%Not able to work
15-24 2,051 1.95 77.57 3.85 0.39 0.15 14.87 1.22 25-34 453 5.52 31.35 2.21 2.43 0.00 51.21 7.28 35-44 255 3.92 3.14 0.00 5.88 20.39 43.14 23.53 45-54 690 2.90 0.29 0.00 2.32 61.30 16.96 16.23 55-64 1274 0.78 0.47 0.08 1.18 65.31 11.22 20.96 15-64 4,723 2.22 37.03 1.91 1.38 27.74 19.20 10.52
Age Group (years)
Women
n %Non-paid %Student %Solider %Home-maker %Retired
Unemployed
%Able to work
%Not able to work
15-24 2,907 1.07 43.07 00.00 46.30 0.03 9.43 0.10 25-34 2,680 1.01 2.95 00.00 91.34 0.15 4.37 0.19 35-44 2,689 1.26 0.26 00.00 97.58 0.26 0.45 0.19 45-54 2,841 1.16 0.11 00.00 95.21 2.92 0.25 0.35 55-64 2,876 0.76 0.00 00.00 93.39 4.00 0.49 1.36 15-64 13,993 1.05 9.58 00.00 84.39 1.50 3.03 0.44
Age Group (years)
Both sexes
n %Non-paid %Student %Solider %Home-maker %Retired
Unemployed
%Able to work
%Not able to work
15-24 4,958 1.43 57.34 1.59 27.31 0.08 11.68 0.56 25-34 3,133 1.66 7.05 0.32 78.49 0.13 11.14 1.21 35-44 2,944 1.49 0.51 0.00 89.64 2.00 4.14 2.21 45-54 3,531 1.50 0.14 0.00 77.06 14.33 3.51 3.46 55-64 4,150 0.77 0.14 0.02 65.08 22.82 3.78 7.37 15-64 18,716 1.35 16.51 0.48 63.44 8.12 7.11 2.99

22 Iran NCD Risk Factors STEPs Report
2. Tobacco use To assess the state of current smokers, all respondents were asked if they currently smoke (daily and non daily) any
tobacco products such as cigarettes, cigars or pipes, also the mean amount, age started and duration of smoking, percentage of ex-daily smokers among all respondent and the mean duration, in years, since ex- daily smokers quit smoking daily.
Table 8 Percentage of current smokers Urban area
Age group (year)
Men Women Both sexes
n %Current smoker 95% CI n %Current
smoker 95% CI n %Current smoker 95%CI
15-24 1,652 7.88 [7.32,8.47] 1,643 0.50 [0.33,0.77] 3,295 4.23 [3.939,4.532] 25-34 1,627 23.09 [22.23,23.97] 1,626 1.52 [1.26,1.83] 3,253 12.49 [12.02,12.97] 35-44 1,640 33.24 [32.59,33.89] 1,621 1.57 [1.30,1.89] 3,261 17.71 [17.34,18.09] 45-54 1,614 38.3 [37.81,38.79] 1,614 2.63 [2.45,2.82] 3,228 20.69 [20.42,20.96] 55-64 1,600 27.04 [26.80,27.29] 1,597 2.97 [2.85,3.08] 3,197 14.82 [14.68,14.96] 15-64 8,133 21.69 [20.38,23.07] 8,101 1.40 [0.97,2.02] 16,234 11.67 [10.96,12.42]
Rural area Age
group (year)
Men Women Both sexes
n %Current smoker 95% CI n %Current
smoker 95% CI n %Current smoker 95%CI
15-24 1,380 7.85 [6.95,8.87] 1,380 0 --- 2,760 3.96 [3.51,4.48] 25-34 1,353 27.13 [26.15,28.13] 1,372 1.56 [1.20,2.03] 2,725 14.56 [13.95,15.20] 35-44 1,367 37.04 [36.34,37.74] 1,364 0.52 [0.45,0.60] 2,731 19.14 [18.78,19.50] 45-54 1,355 33.24 [32.80,33.68] 1,382 2.79 [2.63,2.96] 2,737 18.21 [17.99,18.42] 55-64 1,348 26.29 [26.07,26.52] 1,342 2.41 [2.29,2.53] 2,690 14.17 [14.05,14.28] 15-64 6,803 22.75 [20.97,24.62] 6,840 1.02 [0.61,1.71] 13,643 12.02 [11.01,13.10]
Total Age
group (year)
Men Women Both sexes
n %Current smoker 95% CI n %Current
smoker 95% CI n %Current smoker 95%CI
15-24 3,032 7.86 [7.368,8.401] 3,023 0.31 [0.20,0.47] 6,055 4.21 [3.87,4.40] 25-34 2,980 24.49 [23.84,25.16] 2,998 1.53 [1.31,1.80] 5,978 13.21 [12.83,13.60] 35-44 3,007 34.53 [34.05,35.02] 2,985 1.20 [1.02,1.40] 5,992 18.19 [17.92,18.47] 45-54 2,969 36.55 [36.20,36.90] 2,997 2.68 [2.56,2.82] 5,966 19.83 [19.64,20.02] 55-64 2,948 26.79 [26.60,26.98] 2,939 2.77 [2.69,2.84] 5,887 14.59 [14.49,14.69] 15-64 14,936 22.06 [20.91,23.24] 14,942 1.26 [0.94,1.70] 29,878 11.79 [11.16,12.44]
Iran NCD Risk Factors STEPs Report 23
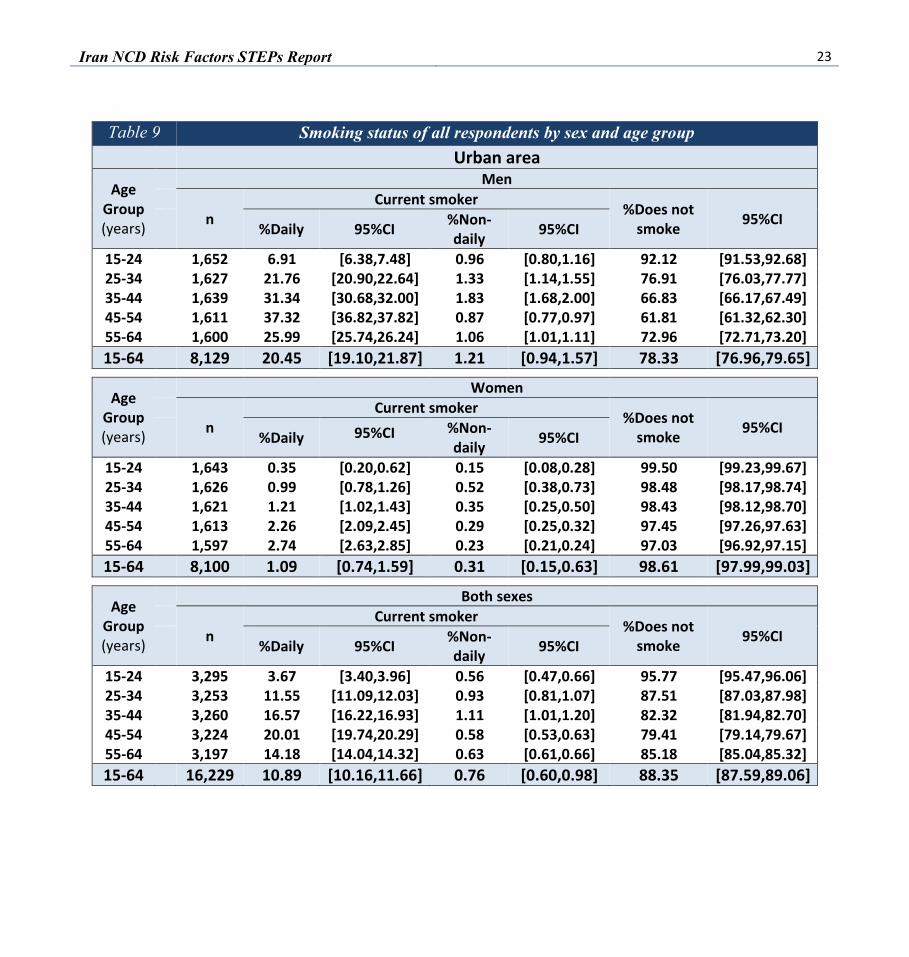
Table 9 Smoking status of all respondents by sex and age group Urban area
Age Group (years)
Men
n Current smoker %Does not
smoke 95%CI %Daily 95%CI %Non-
daily 95%CI
15-24 1,652 6.91 [6.38,7.48] 0.96 [0.80,1.16] 92.12 [91.53,92.68] 25-34 1,627 21.76 [20.90,22.64] 1.33 [1.14,1.55] 76.91 [76.03,77.77] 35-44 1,639 31.34 [30.68,32.00] 1.83 [1.68,2.00] 66.83 [66.17,67.49] 45-54 1,611 37.32 [36.82,37.82] 0.87 [0.77,0.97] 61.81 [61.32,62.30] 55-64 1,600 25.99 [25.74,26.24] 1.06 [1.01,1.11] 72.96 [72.71,73.20] 15-64 8,129 20.45 [19.10,21.87] 1.21 [0.94,1.57] 78.33 [76.96,79.65]
Age Group (years)
Women
n Current smoker %Does not
smoke 95%CI %Daily 95%CI %Non-
daily 95%CI
15-24 1,643 0.35 [0.20,0.62] 0.15 [0.08,0.28] 99.50 [99.23,99.67] 25-34 1,626 0.99 [0.78,1.26] 0.52 [0.38,0.73] 98.48 [98.17,98.74] 35-44 1,621 1.21 [1.02,1.43] 0.35 [0.25,0.50] 98.43 [98.12,98.70] 45-54 1,613 2.26 [2.09,2.45] 0.29 [0.25,0.32] 97.45 [97.26,97.63] 55-64 1,597 2.74 [2.63,2.85] 0.23 [0.21,0.24] 97.03 [96.92,97.15] 15-64 8,100 1.09 [0.74,1.59] 0.31 [0.15,0.63] 98.61 [97.99,99.03]
Age Group (years)
Both sexes
n Current smoker %Does not
smoke 95%CI %Daily 95%CI %Non-
daily 95%CI
15-24 3,295 3.67 [3.40,3.96] 0.56 [0.47,0.66] 95.77 [95.47,96.06] 25-34 3,253 11.55 [11.09,12.03] 0.93 [0.81,1.07] 87.51 [87.03,87.98] 35-44 3,260 16.57 [16.22,16.93] 1.11 [1.01,1.20] 82.32 [81.94,82.70] 45-54 3,224 20.01 [19.74,20.29] 0.58 [0.53,0.63] 79.41 [79.14,79.67] 55-64 3,197 14.18 [14.04,14.32] 0.63 [0.61,0.66] 85.18 [85.04,85.32] 15-64 16,229 10.89 [10.16,11.66] 0.76 [0.60,0.98] 88.35 [87.59,89.06]

24 Iran NCD Risk Factors STEPs Report
Table 10 Smoking status of all respondents by sex and age group Rural area
Age Group (years)
Men
n Current smoker %Does not
smoke 95%CI %Daily 95%CI %Non-
daily 95%CI
15-24 1,379 5.61 [4.97,6.32] 2.15 [1.74,2.66] 92.24 [91.25,93.12] 25-34 1,352 23.31 [22.59,24.03] 3.75 [3.29,4.28] 72.94 [71.93,73.93] 35-44 1,367 35.23 [34.58,35.90] 1.80 [1.66,1.95] 62.96 [62.26,63.66] 45-54 1,354 31.5 [31.06,31.94] 1.63 [1.53,1.73] 66.87 [66.43,67.31] 55-64 1,348 25.24 [25.03,25.46] 1.05 [1.01,1.10] 73.71 [73.48,73.93] 15-64 6,800 20.31 [18.96,21.74] 2.37 [1.69,3.30] 77.32 [75.46,79.08]
Age Group (years)
Women
n Current smoker %Does not
smoke 95%CI %Daily 95%CI %Non-
daily 95%CI
15-24 1,380 0 --- 0 --- 100 --- 25-34 1,372 1.56 [1.20,2.03] 0 --- 98.44 [97.97,98.8] 35-44 1,364 0.52 [0.45,0.60] 0 --- 99.48 [99.4,99.55] 45-54 1,382 2.16 [2.02,2.32] 0.62 [0.54,0.72] 97.21 [97.04,97.37] 55-64 1,342 1.98 [1.86,2.10] 0.43 [0.40,0.46] 97.59 [97.46,97.71] 15-64 6,840 0.91 [0.51,1.63] 0.11 [0.05,0.24] 98.98 [98.29,99.39]
Age Group (years)
Both sexes
n Current smoker %Does not
smoke 95%CI %Daily 95%CI %Non-
daily 95%CI
15-24 2,759 2.83 [2.507,3.194] 1.09 [0.88,1.34] 96.08 [95.58,96.53] 25-34 2,724 12.62 [12.14,13.12] 1.91 [1.67,2.17] 85.47 [84.83,86.09] 35-44 2,731 18.22 [17.88,18.56] 0.92 [0.85,0.99] 80.87 [80.50,81.23] 45-54 2,736 17.02 [16.81,17.22] 1.13 [1.06,1.21] 81.85 [81.63,82.07] 55-64 2,690 13.43 [13.31,13.54] 0.74 [0.71,0.77] 85.83 [85.72,85.95] 15-64 13,640 10.73 [9.95,11.57] 1.25 [0.90,1.73] 88.02 [86.93,89.02]

Iran NCD Risk Factors STEPs Report 25
Table 11 Smoking status of all respondents by sex and age group Total
Age Group (years)
Men
n Current smoker %Does not
smoke 95%CI %Daily 95%CI %Non-
daily 95%CI
15-24 3,031 6.43 [6.00,6.89] 1.40 [1.19,1.64] 92.17 [91.63,92.67] 25-34 2,979 22.29 [21.69,22.91] 2.17 [1.97,2.40] 75.53 [74.86,76.19] 35-44 3,006 32.67 [32.19,33.15] 1.82 [1.708,1.94] 65.51 [65.02,65.99] 45-54 2,965 35.30 [34.95,35.66] 1.13 [1.06,1.21] 63.57 [63.21,63.92] 55-64 2,984 25.73 [25.55,25.92] 1.05 [1.02,1.09] 73.21 [73.02,73.40] 15-64 14,929 20.39 [19.32,21.51] 1.62 [1.28,2.05] 77.99 [76.80,79.13]
Age Group (years)
Women
n Current smoker %Does not
smoke 95%CI %Daily 95%CI %Non-
daily 95%CI
15-24 3,023 0.22 [0.13,0.38] 0.92 [0.05,0.15] 99.68 [99.52,99.79] 25-34 2,998 1.19 [0.99,1.43] 0.34 [0.24,0.47] 98.47 [98.20,98.69] 35-44 2,985 0.96 [0.84,1.11] 0.23 [0.17,0.32] 98.80 [98.60,98.97] 45-54 2,996 2.23 [2.11,2.36] 0.40 [0.37,0.44] 97.37 [97.23,97.49] 55-64 2,939 2.47 [2.40,2.54] 0.30 [0.29,0.31] 97.23 [97.15,97.30] 15-64 14,941 1.02 [0.75,1.39] 0.23 [0.13,0.44] 98.74 [98.30,99.06]
Age Group (years)
Both sexes
n Current smoker %Does not
smoke 95%CI %Daily 95%CI %Non-
daily 95%CI
15-24 6,054 3.35 [3.13,3.59] 0.75 [0.64,0.87] 95.89 [95.61,96.15] 25-34 5,977 11.92 [11.58,12.28] 1.27 [1.16,1.40] 86.80 [86.42,87.18] 35-44 5,991 17.13 [16.87,17.39] 1.04 [0.97,1.11] 81.83 [81.55,82.10] 45-54 5,961 18.97 [18.79,19.16] 0.77 [0.73,0.81] 80.25 [80.06,80.44] 55-64 5,887 13.92 [13.82,14.02] 0.67 [0.65,0.69] 85.41 [85.31,85.51] 15-64 29,870 10.82 [10.24,11.43] 0.93 [0.75,1.16] 88.24 [87.58,88.86]

26 Iran NCD Risk Factors STEPs Report
Table 12 Current daily smokers among all smokers Urban area
Age group (year)
Men Women Both sexes
n % Daily smokers 95% CI n % Daily
smokers 95% CI n % Daily smokers 95% CI
15-24 137 87.23 [84.44,89.59] 6 70.46 [50.40,84.84] 143 21.07 [68.86,86.38] 25-34 380 94.45 [93.51,95.26] 11 64.38 [55.93,72.02] 391 79.67 [75.49,83.29] 35-44 516 94.18 [93.64,94.68] 10 82.34 [77.82,86.11] 526 88.38 [86.16,90.28] 45-54 564 97.71 [97.45,97.95] 30 85.58 [83.40,87.51] 594 91.72 [90.64,92.69] 55-64 432 95.46 [95.24,95.68] 35 88.66 [87.71,89.54] 467 92.01 [91.54,92.45] 15-64 2,029 92.28 [89.24,94.52] 92 74.25 [50.91,88.91] 2,121 83.38 [71.46,90.95]
Rural area
Age group (year)
Men Women Both sexes
n % Daily smokers 95% CI n % Daily
smokers 95% CI n % Daily smokers 95% CI
15-24 87 73.48 [69.60,77.03] 0 0 --- 87 73.48 [71.13,75.71] 25-34 350 85.33 [83.67,86.85] 6 100 --- 356 92.54 [91.50,93.47] 35-44 466 94.97 [94.57,95.33] 8 100 --- 474 97.43 [97.19,97.66] 45-54 441 95.12 [94.80,95.42] 29 86.2 [82.99,88.89] 470 90.72 [89.49,91.82] 55-64 330 95.21 [95.00,95.41] 29 76.53 [73.80,79.05] 359 85.72 [84.65,86.74] 15-64 1,674 84.75 [79.70,88.72] 72 94.66 [89.98,97.22] 1,746 88.56 [84.98,91.37]
Total Age
group (year)
Men Women Both sexes
n % Daily smokers 95% CI n % Daily
smokers 95% CI n % Daily smokers 95% CI
15-24 224 82.02 [79.38,84.38] 6 70.46 [52.88,83.52] 230 76.29 [67.56,83.26] 25-34 730 90.94 [90.07,91.75] 17 75.64 [69.48,80.90] 747 83.42 [80.42,86.05] 35-44 982 94.48 [94.12,94.83] 18 88.05 [84.70,90.74] 1,000 91.33 [89.72,92.70] 45-54 1,005 96.85 [96.66,97.03] 59 85.87 [84.47,87.16] 1,064 91.43 [90.74,92.07] 55-64 762 95.38 [95.22,95.54] 64 84.62 [83.83,85.39] 826 89.92 [89.51,90.31]
15-64 3,703 89.43 [86.33,91.90] 164 77.96 [56.79,90.49] 3,867 83.76 [73.45,90.59]
Iran NCD Risk Factors STEPs Report 27
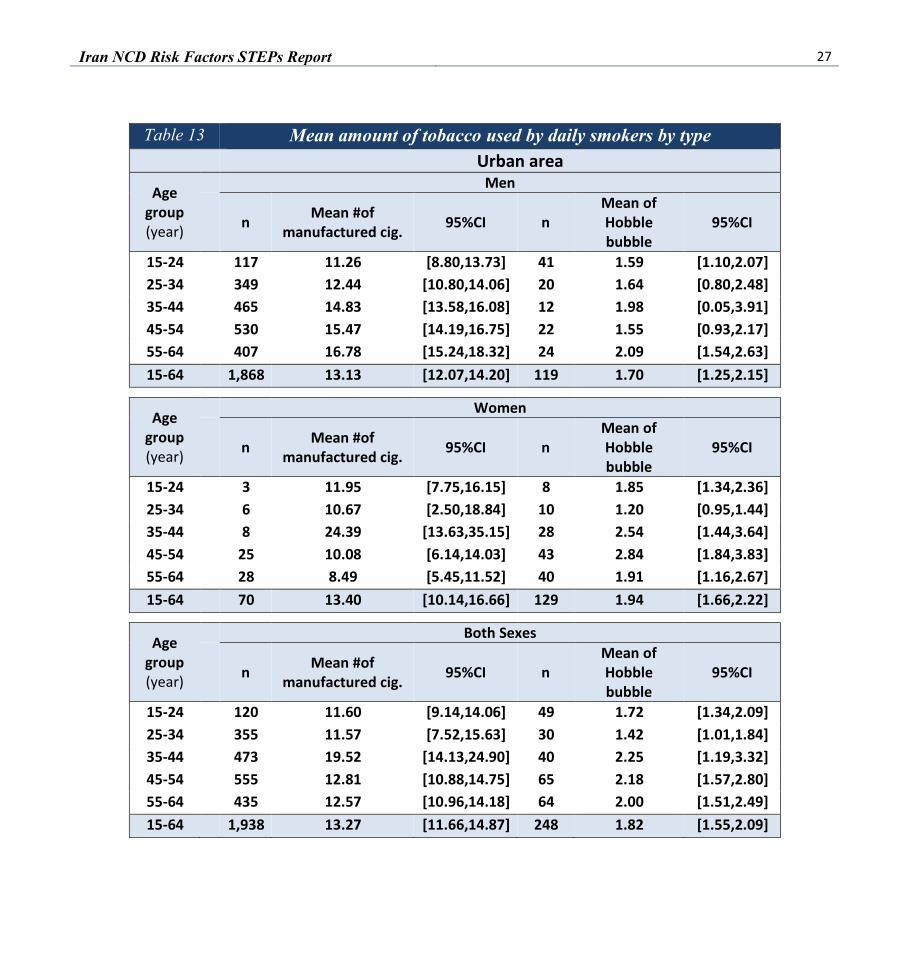
Table 13 Mean amount of tobacco used by daily smokers by type Urban area
Age group (year)
Men
n Mean #of manufactured cig. 95%CI n
Mean of Hobble bubble
95%CI
15-24 117 11.26 [8.80,13.73] 41 1.59 [1.10,2.07] 25-34 349 12.44 [10.80,14.06] 20 1.64 [0.80,2.48] 35-44 465 14.83 [13.58,16.08] 12 1.98 [0.05,3.91] 45-54 530 15.47 [14.19,16.75] 22 1.55 [0.93,2.17] 55-64 407 16.78 [15.24,18.32] 24 2.09 [1.54,2.63] 15-64 1,868 13.13 [12.07,14.20] 119 1.70 [1.25,2.15]
Age group (year)
Women
n Mean #of manufactured cig. 95%CI n
Mean of Hobble bubble
95%CI
15-24 3 11.95 [7.75,16.15] 8 1.85 [1.34,2.36] 25-34 6 10.67 [2.50,18.84] 10 1.20 [0.95,1.44] 35-44 8 24.39 [13.63,35.15] 28 2.54 [1.44,3.64] 45-54 25 10.08 [6.14,14.03] 43 2.84 [1.84,3.83] 55-64 28 8.49 [5.45,11.52] 40 1.91 [1.16,2.67] 15-64 70 13.40 [10.14,16.66] 129 1.94 [1.66,2.22]
Age group (year)
Both Sexes
n Mean #of manufactured cig. 95%CI n
Mean of Hobble bubble
95%CI
15-24 120 11.60 [9.14,14.06] 49 1.72 [1.34,2.09] 25-34 355 11.57 [7.52,15.63] 30 1.42 [1.01,1.84] 35-44 473 19.52 [14.13,24.90] 40 2.25 [1.19,3.32] 45-54 555 12.81 [10.88,14.75] 65 2.18 [1.57,2.80] 55-64 435 12.57 [10.96,14.18] 64 2.00 [1.51,2.49] 15-64 1,938 13.27 [11.66,14.87] 248 1.82 [1.55,2.09]

28 Iran NCD Risk Factors STEPs Report
Table 14 Mean amount of tobacco used by daily smokers by type Rural area
Age group (year)
Men
n Mean #of manufactured cig. 95%CI n Mean of Hobble
bubble 95%CI
15-24 65 9.81 [7.28,12.34] 19 1.43 [1.06,1.80] 25-34 299 13.69 [12.32,15.05] 29 1.50 [1.17,1.84] 35-44 434 15.76 [14.43,17.08] 29 1.99 [1.74,2.24] 45-54 405 18.30 [16.48,20.10] 40 2.19 [1.45,2.93] 55-64 302 18.44 [16.90,19.98] 50 2.01 [1.00,3.02] 15-64 1,505 13.58 [12.46,14.70] 167 1.69 [1.47,1.90]
Age group (year)
Women
n Mean #of manufactured cig. 95%CI n Mean of Hobble
bubble 95%CI
15-24 0 --- --- 18 1.87 [1.47,2.26] 25-34 6 7.89 [1.07,14.72] 31 2.41 [2.01,2.81] 35-44 7 17.54 [0.00,35.73] 59 2.12 [1.48,2.76] 45-54 22 12.17 [5.72,18.62] 78 2.24 [1.83,2.66] 55-64 24 11.07 [6.92,15.23] 74 2.83 [2.00,3.66] 15-64 59 11.85 [6.45,17.24] 260 2.17 [1.94,2.40]
Age group (year)
Both Sexes
n Mean #of manufactured cig. 95%CI n Mean of Hobble
bubble 95%CI
15-24 65 9.81 [7.28,12.34] 37 1.64 [1.33,1.96] 25-34 305 10.84 [7.52,14.16] 60 1.95 [1.70,2.20] 35-44 441 16.63 [7.72,25.54] 88 2.05 [1.71,2.39] 45-54 427 15.27 [11.78,18.76] 118 2.22 [1.73,2.71] 55-64 326 14.70 [12.36,17.04] 124 2.43 [1.78,3.08] 15-64 1,564 12.91 [10.78,15.05] 427 1.93 [1.75,2.10]
Iran NCD Risk Factors STEPs Report 29
Table 15 Mean amount of tobacco used by daily smokers by type Total
Age group (year)
Men n Mean #of
manufactured cig. 95%CI n Mean of Hobble bubble 95%CI
15-24 182 10.77 [9.12,12.42] 60 1.55 [1.13,1.97] 25-34 648 12.88 [11.90,13.87] 49 1.59 [1.03,2.16] 35-44 899 15.19 [14.21,16.17] 41 1.98 [1.30,2.67] 45-54 935 16.39 [15.43,17.34] 62 1.73 [1.21,2.25] 55-64 709 17.31 [16.26,18.36] 74 2.05 [1.55,2.55] 15-64 3,373 13.29 [12.59,13.99] 286 1.70 [1.43,1.97]
Age group (year)
Women
n Mean #of manufactured cig. 95%CI n Mean of Hobble
bubble 95%CI
15-24 3 11.94 [7.88,16.00] 26 1.85 [1.50,2.20] 25-34 12 9.59 [4.07,15.10] 41 1.97 [1.52,2.43] 35-44 15 22.39 [13.36,31.43] 87 2.37 [1.65,3.10] 45-54 47 10.89 [7.67,14.12] 121 2.52 [1.97,3.06] 55-64 52 9.29 [6.61,11.98] 114 2.35 [1.68, 3.02] 15-64 129 12.91 [10.28,15.55] 389 2.10 [1.89,2.31]
Age group (year)
Both Sexes
n Mean #of manufactured cig. 95%CI n Mean of Hobble
bubble 95%CI
15-24 185 11.35 [9.17,13.53] 86 1.70 [1.42,1.99] 25-34 660 11.26 [8.52,14.01] 90 1.78 [1.38,2.18] 35-44 914 18.72 [14.21,23.23] 128 2.18 [1.69,2.67] 45-54 982 13.67 [12.02,15.33] 183 2.12 [1.74,2.50] 55-64 761 13.24 [11.77,14.71] 188 2.21 [1.77, 2.65] 15-64 3,502 13.10 [11.74,14.46] 675 1.90 [1.72,2.08]

30 Iran NCD Risk Factors STEPs Report
Table 16 Mean age started smoking for current smoker by sex and age group Urban areas
Age Group (years)
Men Women Both Sexes
n Mean age 95% CI n Mean
age 95% CI n Mean age 95% CI
15-24 119 17.08 [16.16,17.99] 3 14.93 [13.09,16.76] 122 16.01 [14.92,17.10] 25-34 347 19.24 [18.64,19.83] 6 20.62 [17.16,24.09] 353 19.92 [18.15,21.69] 35-44 464 20.64 [19.80,21.48] 8 23.77 [19.38,28.15] 472 22.17 [19.98,24.36] 45-54 534 21.65 [20.94,22.36] 25 29.31 [24.23,34.40] 559 25.43 [22.87,28.00] 55-64 395 23.67 [21.88,25.45] 27 30.05 [21.96,38.15] 422 26.91 [22.80,31.02] 15-64 1,859 19.32 [18.92,19.71] 69 20.90 [19.45,22.36] 1,928 20.10 [19.32,20.88]
Rural areas Age
Group (years)
Men Women Both Sexes
n Mean age 95% CI n Mean
age 95% CI n Mean age 95% CI
15-24 66 17.56 [15.92,19.20] 0 --- --- 66 17.56 [15.92,19.20] 25-34 297 18.67 [18.14,19.19] 6 23.36 [18.51,28.21] 303 20.97 [18.57,23.37] 35-44 411 20.78 [19.95,21.62] 7 22.70 [18.06,27.35] 418 21.73 [19.28,24.17] 45-54 403 21.44 [20.61,22.27] 25 26.14 [19.99,32.30] 428 23.76 [20.75,26.77] 55-64 300 23.52 [22.60,24.45] 20 31.14 [21.85,40.44] 320 27.39 [22.49,32.29] 15-64 1,477 19.34 [18.66,20.01] 58 24.58 [21.59,27.58] 1,535 21.35 [20.23,22.48]
Total Age
Group (years)
Men Women Both Sexes
n Mean age 95% CI n Mean
age 95% CI n Mean age 95% CI
15-24 185 17.23 [16.48,17.99] 3 14.92 [13.15,16.69] 188 16.09 [15.11,17.07] 25-34 644 19.03 [18.54,19.52] 12 21.68 [18.84,24.52] 656 20.33 [18.92,21.74] 35-44 875 20.69 [20.11,21.27] 15 23.43 [20.16,26.70] 890 22.03 [20.40,23.66] 45-54 937 21.58 [21.01,22.15] 50 27.84 [24.06,31.63] 987 24.67 [22.78,26.56] 55-64 695 23.62 [22.54,24.69] 47 30.36 [24.20,36.53] 742 27.04 [23.91,30.18] 15-64 3,336 19.32 [18.98,19.66] 127 20.95 [19.60,22.30] 3,463 20.12 [19.42,20.83]
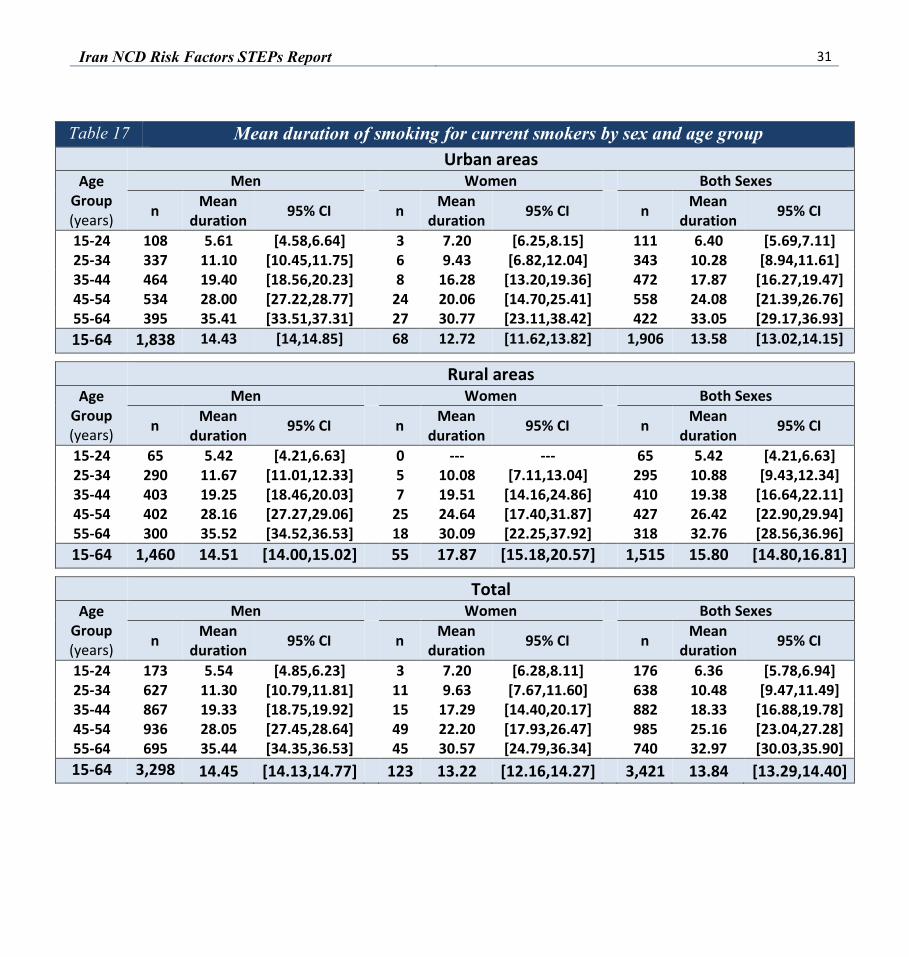
Iran NCD Risk Factors STEPs Report 31
Table 17 Mean duration of smoking for current smokers by sex and age group Urban areas
Age Group (years)
Men Women Both Sexes
n Mean duration 95% CI n Mean
duration 95% CI n Mean duration 95% CI
15-24 108 5.61 [4.58,6.64] 3 7.20 [6.25,8.15] 111 6.40 [5.69,7.11] 25-34 337 11.10 [10.45,11.75] 6 9.43 [6.82,12.04] 343 10.28 [8.94,11.61] 35-44 464 19.40 [18.56,20.23] 8 16.28 [13.20,19.36] 472 17.87 [16.27,19.47] 45-54 534 28.00 [27.22,28.77] 24 20.06 [14.70,25.41] 558 24.08 [21.39,26.76] 55-64 395 35.41 [33.51,37.31] 27 30.77 [23.11,38.42] 422 33.05 [29.17,36.93] 15-64 1,838 14.43 [14,14.85] 68 12.72 [11.62,13.82] 1,906 13.58 [13.02,14.15]
Rural areas Age
Group (years)
Men Women Both Sexes
n Mean duration 95% CI n Mean
duration 95% CI n Mean duration 95% CI
15-24 65 5.42 [4.21,6.63] 0 --- --- 65 5.42 [4.21,6.63] 25-34 290 11.67 [11.01,12.33] 5 10.08 [7.11,13.04] 295 10.88 [9.43,12.34] 35-44 403 19.25 [18.46,20.03] 7 19.51 [14.16,24.86] 410 19.38 [16.64,22.11] 45-54 402 28.16 [27.27,29.06] 25 24.64 [17.40,31.87] 427 26.42 [22.90,29.94] 55-64 300 35.52 [34.52,36.53] 18 30.09 [22.25,37.92] 318 32.76 [28.56,36.96] 15-64 1,460 14.51 [14.00,15.02] 55 17.87 [15.18,20.57] 1,515 15.80 [14.80,16.81]
Total Age
Group (years)
Men Women Both Sexes
n Mean duration 95% CI n Mean
duration 95% CI n Mean duration 95% CI
15-24 173 5.54 [4.85,6.23] 3 7.20 [6.28,8.11] 176 6.36 [5.78,6.94] 25-34 627 11.30 [10.79,11.81] 11 9.63 [7.67,11.60] 638 10.48 [9.47,11.49] 35-44 867 19.33 [18.75,19.92] 15 17.29 [14.40,20.17] 882 18.33 [16.88,19.78] 45-54 936 28.05 [27.45,28.64] 49 22.20 [17.93,26.47] 985 25.16 [23.04,27.28] 55-64 695 35.44 [34.35,36.53] 45 30.57 [24.79,36.34] 740 32.97 [30.03,35.90] 15-64 3,298 14.45 [14.13,14.77] 123 13.22 [12.16,14.27] 3,421 13.84 [13.29,14.40]

32 Iran NCD Risk Factors STEPs Report
The percentage of ex-daily smokers among all respondents and the mean, in duration years, since ex-daily smokers quit smoking daily also the percentage of daily and current (daily plus non-daily) tobacco users, includes smoking and smokeless are shown, in tables 11-14, respectively.
Table 18 Ex-daily smokers among all respondents Urban areas
Age Group (years)
Men Women Both Sexes
n %ex daily smokers 95% CI n %ex daily
smokers 95% CI n %ex daily smokers 95% CI
15-24 1,531 1.14 [0.92,1.42] 1,639 0.10 [0.05,0.21] 3,170 0.63 [0.51,0.77] 25-34 1,267 5.19 [4.67,5.77] 1,620 0.07 [0.05,0.10] 2,887 2.68 [2.41,2.97] 35-44 1,159 7.64 [7.12,8.21] 1,613 0.19 [0.15,0.24] 2,772 3.99 [3.72,4.29] 45-54 1,060 11.15 [10.73,11.58] 1,588 0.83 [0.72,0.95] 2,648 6.055 [5.84,6.28] 55-64 1,179 15.6 [15.36,15.84] 1,566 0.51 [0.48,0.53] 2,745 7.93 [7.81,8.06] 15-64 6,196 5.64 [4.64,6.83] 8,026 0.23 [0.12,0.44] 14,222 2.97 [2.45,3.58]
Rural areas Age
Group (years)
Men Women Both Sexes
n %ex daily smokers 95% CI n %ex daily
smokers 95% CI n %ex daily smokers 95% CI
15-24 1,307 1.02 [0.83,1.24] 1,380 0 --- 2,687 0.51 [0.42,0.63] 25-34 1,039 6.28 [5.74,6.86] 1,365 0.14 [0.09,0.22] 2,404 3.26 [2.99,3.50] 35-44 926 10.15 [9.67,10.65] 1,354 0.26 [0.20,0.33] 2,280 5.30 [5.05,5.57] 45-54 931 13.57 [13.25,13.9] 1,356 0.93 [0.85,1.03] 2,287 7.33 [7.15,7.52] 55-64 1,032 14.58 [14.36,14.79] 1,318 1.95 [1.87,2.02] 2,350 8.16 [8.05,8.28] 15-64 5,235 6.58 [5.78,7.49] 6,773 0.34 [0.21,0.54] 12,008 3.50 [3.06,3.99]
Total Age
Group (years)
Men Women Both Sexes
n %ex daily smokers 95% CI n %ex daily
smokers 95% CI n %ex daily smokers 95% CI
15-24 2,838 1.09 [0.93,1.28] 3,019 0.64 [0.03,0.13] 5,857 0.58 [0.49,0.68] 25-34 2,306 5.56 [5.18,5.97] 2,985 0.09 [0.06,0.12] 5,291 2.87 [2.68,3.08] 35-44 2,085 8.44 [8.07,8.82] 2,967 0.21 [0.18,0.25] 5,052 4.41 [4.22,4.60] 45-54 1,991 12.02 [11.75,12.29] 2,945 0.86 [0.80,0.94] 4,936 6.51 [6.37,6.65] 55-64 2,211 15.25 [15.09,15.42] 2,884 1.01 [0.98,1.04] 5,095 8.02 [7.93,8.10] 15-64 11,431 5.95 [5.22,6.77] 14,800 0.26 [0.18,0.39] 26,231 3.14 [2.77,3.56]

Iran NCD Risk Factors STEPs Report 33
Table 19 Mean years since cessation Urban areas
Age Group (years)
Men Women Both Sexes
n Mean years 95% CI n Mean
years 95% CI n Mean years 95% CI
15-24 18 3.27 [0.89,5.66] 1 0.87 --- 19 2.08 [0.88,3.29] 25-34 48 5.06 [3.39,6.73] 2 1.96 [0.59,3.33] 50 3.54 [2.50,4.57] 35-44 73 10.44 [6.91,13.96] 3 4.25 [0.00,10.77] 76 7.41 [4.22,10.59] 45-54 142 13.38 [8.20,18.57] 12 9.40 [0.00,19.26] 154 11.42 [5.88,16.96] 55-64 185 16.40 [12.96,19.85] 13 12.96 [4.31,21.61] 198 14.65 [10.11,19.20] 15-64 466 7.23 [5.61,8.85] 31 3.70 [1.84,5.56] 497 5.49 [4.33,6.65]
Rural areas Age
Group (years)
Men Women Both Sexes
n Mean years 95% CI n Mean
years 95% CI n Mean years 95% CI
15-24 16 2.65 [1.38,3.93] 0 --- --- 16 2.65 [1.38,3.93] 25-34 51 4.27 [3.19,5.36] 2 10.09 [9.44,10.74] 53 7.13 [6.49,7.77] 35-44 84 8.61 [6.86,10.36] 3 5.45 [0.00,12.23] 87 7.05 [3.51,10.61] 45-54 126 12.32 [8.76,15.88] 7 14.58 [7.62,21.53] 133 13.43 [9.55,17.32] 55-64 127 16.29 [13.98,18.60] 18 15.47 [4.18,26.76] 145 15.87 [9.99,21.75] 15-64 404 6.32 [5.44,7.19] 30 10.25 [7.42,13.09] 434 7.83 [6.49,9.17]
Total Age
Group (years)
Men Women Both Sexes
n Mean years 95% CI n Mean
years 95% CI n Mean years 95% CI
15-24 34 3.06 [1.58,4.58] 1 0.87 --- 35 1.97 [1.21,2.74] 25-34 99 4.74 [3.68,5.80] 4 6.20 [1.27,11.13] 103 5.46 [2.97,7.94] 35-44 157 9.72 [7.60,11.84] 6 4.74 [0.50,9.42] 163 7.28 [4.73,9.82] 45-54 268 12.99 [9.74,16.24] 19 10.15 [2.03,18.26] 287 11.59 [7.24,15.93] 55-64 312 16.36 [14.02,18.70] 31 14.75 [6.71,22.79] 343 15.54 [11.29,19.80] 15-64 870 6.88 [6.00,7.77] 61 5.11 [3.16,7.05] 931 6.00 [4.94,7.07]

34 Iran NCD Risk Factors STEPs Report
Table 20 Daily tobacco users Urban areas
Age Group (years)
Men Women Both Sexes
n %Daily users 95% CI n %Daily
users 95% CI n %Daily users 95% CI
15-24 1,652 10.39 [9.718,11.10] 1,643 1.01 [0.75,1.35] 3,295 5.74 [5.39,6.11] 25-34 1,627 23.28 [22.44,24.14] 1,626 1.55 [1.33,1.82] 3,253 12.60 [12.14,13.08] 35-44 1,639 31.99 [31.35,32.64] 1,621 2.51 [2.28,2.75] 3,260 17.54 [17.19,17.89] 45-54 1,612 39.07 [38.57,39.56] 1,613 4.30 [4.12,4.50] 3,225 21.90 [21.62,22.19] 55-64 1,600 27.21 [26.96,27.46] 1,597 5.08 [4.96,5.21] 3,197 15.97 [15.83,16.12] 15-64 8,130 22.52 [20.99,24.14] 8,100 2.13 [1.70,2.66] 16,230 12.45 [11.65,13.29]
Rural areas Age
Group (years)
Men Women Both Sexes
n %Daily users 95% CI n %Daily
users 95% CI n %Daily users 95% CI
15-24 1,379 6.71 [6.05,7.43] 1,380 1.74 [1.48,2.04] 2,759 4.25 [3.89,4.63] 25-34 1,352 24.60 [23.85,25.36] 1,372 3.85 [3.43,4.316] 2,724 14.40 [13.91,14.91] 35-44 1,367 36.42 [35.78,37.06] 1,364 3.86 [3.68,4.04] 2,731 20.46 [20.12,20.79] 45-54 1,354 33.23 [32.78,33.67] 1,382 6.72 [6.478,6.969] 2,736 20.14 [19.89,20.39] 55-64 1,348 27.55 [27.33,27.78] 1,342 6.94 [6.80,7.09] 2,690 17.09 [16.97,17.2] 15-64 6,800 21.64 [20.29,23.05] 6,840 3.67 [2.96,4.55] 13,640 12.76 [11.91,13.67]
Total Age
Group (years)
Men Women Both Sexes
n %Daily users 95% CI n %Daily
users 95% CI n %Daily users 95% CI
15-24 3,031 9.03 [8.46,9.64] 3,023 1.28 [1.08,1.51] 6,054 5.19 [4.893,5.515] 25-34 2,979 23.74 [23.13,24.36] 2,998 2.35 [2.12,2.61] 5,977 13.23 [12.88,13.59] 35-44 3,006 33.50 [33.02,33.99] 2,985 2.98 [2.81,3.15] 5,991 18.54 [18.28,18.81] 45-54 2,966 37.04 [36.70,37.42] 2,996 5.14 [5.00,5.30] 5,962 21.30 [21.11,21.51] 55-64 2,948 27.32 [27.14,27.51] 2,939 5.73 [5.64,5.82] 5,887 16.36 [16.26,16.47] 15-64 14,930 22.19 [20.95,23.47] 14,941 2.67 [2.27,3.15] 29,871 12.55 [11.88,13.25]

Iran NCD Risk Factors STEPs Report 35
Table 21 Current tobacco users Urban areas
Age Group (years)
Men Women Both Sexes
n %Current users 95% CI n %Current
users 95% CI n %Current users 95% CI
15-24 1,652 13.54 [12.8,14.32] 1,643 1.88 [1.51,2.34] 3,295 7.77 [7.29,8.27] 25-34 1,627 24.50 [23.64,25.38] 1,626 2.08 [1.81,2.38] 3,253 13.48 [13.02,13.96] 35-44 1,640 34.78 [34.14,35.43] 1,621 3.64 [3.31,4.01] 3,261 19.52 [19.14,19.9] 45-54 1,614 40.21 [39.73,40.69] 1,614 5.17 [4.96,5.39] 3,228 22.91 [22.63,23.19] 55-64 1,600 28.43 [28.18,28.68] 1,597 5.49 [5.36,5.62] 3,197 16.78 [16.63,16.93] 15-64 8,133 24.72 [23.21,26.30] 8,101 2.93 [2.35,3.64] 16,234 13.96 [13.1,14.86]
Rural areas Age
Group (years)
Men Women Both Sexes
n %Current users 95% CI n %Current
users 95% CI n %Current users 95% CI
15-24 1,380 9.56 [8.62,10.58] 1,380 1.77 [1.51,2.06] 2,760 5.70 [5.20,6.25] 25-34 1,353 28.72 [27.72,29.74] 1,372 4.08 [3.62,4.58] 2,725 16.61 [15.97,17.26] 35-44 1,367 38.38 [37.71,39.06] 1,364 4.03 [3.85,4.23] 2,731 21.54 [21.19,21.90] 45-54 1,355 35.04 [34.59,35.50] 1,382 7.25 [7.00,7.51] 2,737 21.32 [21.07,21.58] 55-64 1,348 28.77 [28.54,29.01] 1,342 7.44 [7.29,7.59] 2,690 17.94 [17.81,18.07] 15-64 6,803 24.42 [22.58,26.35] 6,840 3.87 [3.13,4.78] 13,643 14.27 [13.15,15.46]
Total Age
Group (years)
Men Women Both Sexes
n %Current users 95% CI n %Current
users 95% CI n %Current users 95% CI
15-24 3,032 12.08 [11.41,12.78] 3,023 1.83 [1.581,2.138] 6,055 7.01 [6.62,7.41] 25-34 2,980 25.96 [25.30,26.64] 2,998 2.78 [2.527,3.058] 5,978 14.57 [14.18,14.97] 35-44 3,007 36.01 [35.52,36.51] 2,985 3.781 [3.556,4.019] 5,992 20.21 [19.92,20.50] 45-54 2,969 38.42 [38.07,38.78] 2,997 5.89 [5.744,6.055] 5,966 22.36 [22.16,22.57] 55-64 2,948 28.55 [28.36,28.30] 2,939 6.17 [6.085,6.268] 5,887 17.19 [17.08,17.29] 15-64 14,936 24.58 [23.31,25.91] 14,942 3.25 [2.772,3.825] 29,878 14.05 [13.32,14.81]

36 Iran NCD Risk Factors STEPs Report
3. Fruit, Vegetable and type of oil Consumption To assess dietary behaviors, respondent were asked how often they consumed fruit and vegetables in a typical week,
the average of consumption on one of those days. Also the mean number of fruit, vegetable, and combined fruit and vegetable servings on average per day are viewed as followed.
Table 22 Mean number of days fruit consumed in a typical week Urban areas
Age Group (years)
Men Women Both Sexes
n Mean number of days 95% CI n Mean number
of days 95% CI n Mean number of days 95% CI
15-24 1597 4.35 [4.19,4.51] 1592 4.70 [4.54,4.86] 3189 4.53 [4.404.66] 25-34 1559 4.26 [4.07,4.45] 1555 4.73 [4.56,4.90] 3114 4.49 [4.36,4.62] 35-44 1556 4.42 [4.25,4.60] 1528 4.65 [4.45,4.85] 3084 4.53 [4.36,4.62] 45-54 1490 4.08 [3.88,4.27] 1487 4.40 [4.22,4.57] 2977 4.23 [4.09,4.38] 55-64 1463 3.93 [3.71,4.14] 1442 4.33 [4.14,4.51] 2905 4.13 [3.97,4.29] 15-64 7665 4.28 [4.17,4.39] 7604 4.36 [4.52,4.75] 15269 4.45 [4.36,4.55]
Rural areas Age
Group (years)
Men Women Both Sexes
n Mean number of days 95% CI n Mean number
of days 95% CI n Mean number of days 95% CI
15-24 1258 3.26 [3.10,3.42] 1260 3.54 [3.363.73] 2518 3.40 [3.25,3.55] 25-34 1207 3.43 [3.29,3.57] 1234 3.73 [3.53,3.93] 2441 3.58 [3.43,3.73] 35-44 1161 3.19 [3.02,3.35] 1165 3.59 [3.42,3.76] 2326 3.39 [3.24,3.53] 45-54 1117 3.22 [3.06,3.38] 1159 3.44 [3.26,3.62] 2276 3.33 [3.18,3.47] 55-64 1068 3.11 [2.94,3.28] 1084 3.27 [3.06,3.46] 2152 3.19 [3.02,3.35] 15-64 5811 3.28 [3.15,3.40] 5902 3.57 [3.42,3.72] 11713 3.42 [3.29,3.55]
Total Age
Group (years)
Men Women Both Sexes
n Mean number of days 95% CI n Mean number
of days 95% CI n Mean number of days 95% CI
15-24 2855 3.96 [3.84,4.08] 2852 4.28 [4.16,4.39] 5707 4.12 [4.02,4.21] 25-34 2766 3.98 [3.85,4.11] 2789 4.38 [4.25,4.52] 5555 4.18 [4.07,4.28] 35-44 2717 4.02 [3.88,4.16] 2693 4.29 [4.16,4.43] 5410 4.15 [4.04,4.27] 45-54 2607 3.79 [3.65,3.93] 2647 4.07 [3.92,4.22] 5254 3.93 [3.81,4.04] 55-64 2531 3.66 [3.52,3.81] 2526 3.96 [3.82,4.10] 5057 3.82 [3.81,4.04] 15-64 13476 3.94 [3.85,4.02] 13507 4.26 [4.17,4.35] 26983 4.09 [4.01,4.18]

Iran NCD Risk Factors STEPs Report 37
Table 23 Mean number of days vegetables consumed in a typical week Urban areas
Age Group (years)
Men Women Both Sexes
n Mean
number of days
95% CI n Mean
number of days
95% CI n Mean
number of days
95% CI
15-24 1,557 4.35 [4.19,4.51] 1,594 4.72 [4.59,4.86] 3,151 4.54 [4.42,4.65] 25-34 1,542 4.45 [4.25,4.66] 1,570 4.95 [4.76,5.13] 3,112 4.70 [4.53,4.86] 35-44 1,567 4.58 [4.40,4.76] 1,579 5.13 [4.94,5.31] 3,146 4.85 [4.70,5.00] 45-54 1,539 4.59 [4.39,4.79] 1,566 4.88 [4.68,5.08] 3,105 4.73 [4.58,4.89] 55-64 1,495 4.48 [4.30,4.67] 1,521 4.82 [4.64,5.00] 3,016 4.65 [4.51,4.79] 15-64 7,700 4.46 [4.32,4.60] 7,830 4.88 [4.76,5.00] 15,530 4.67 [4.56,4.78]
Rural areas Age
Group (years)
Men Women Both Sexes
n Mean
number of days
95% CI n Mean
number of days
95% CI n Mean
number of days
95% CI
15-24 1,283 4.45 [4.29,4.61] 1292 4.67 [4.46,4.87] 2,575 4.56 [4.40,4.72] 25-34 1,261 4.46 [4.29,4.6] 1271 4.86 [4.66,5.05] 2,532 4.66 [4.49,4.82] 35-44 1,258 4.55 [4.40,4.70] 1260 4.86 [4.68,5.04] 2,518 4.70 [4.56,4.84] 45-54 1,230 4.51 [4.31,4.71] 1270 4.77 [4.59,4.96] 2,500 4.64 [4.48,4.80] 55-64 1,194 4.44 [4.22,4.65] 1188 4.63 [4.452,4.81] 2,382 4.54 [4.38,4.69] 15-64 6,226 4.48 [4.35,4.61] 6281 4.76 [4.60,4.93] 12,507 4.62 [4.48,4.75]
Total Age
Group (years)
Men Women Both Sexes
n Mean
number of days
95% CI n Mean
number of days
95% CI n Mean
number of days
95% CI
15-24 2,840 4.38 [4.26,4.51] 2,886 4.70 [4.59,4.81] 5,726 4.54 [4.44,4.63] 25-34 2,803 4.45 [4.32,4.59] 2,841 4.91 [4.78,5.04] 5,644 4.68 [4.57,4.79] 35-44 2,825 4.56 [4.43,4.70] 2,839 5.03 [4.90,5.16] 5,644 4.79 [4.69,4.90] 45-54 2,769 4.56 [4.42,4.71] 2,837 4.84 [4.70,4.98] 5,606 4.70 [4.58,4.82] 55-64 2,689 4.47 [4.33,4.60] 2,709 4.75 [4.62,4.88] 5,398 4.61 [4.50,4.72] 15-64 13,926 4.46 [4.37,4.56] 14,112 4.84 [4.74,4.93] 28,038 4.65 [4.56,4.73]

38 Iran NCD Risk Factors STEPs Report
Table 24 Mean number of servings of fruit on average per day Urban areas
Age Group (years)
Men Women Both Sexes
n Mean
number of servings
95% CI n Mean
number of servings
95% CI n Mean
number of servings
95% CI
15-24 1,572 1.53 [1.38,1.67] 1,568 1.66 [1.51,1.82] 3,140 1.59 [1.48,1.71] 25-34 1,536 1.41 [1.29,1.53] 1,529 1.59 [1.44,1.74] 3,065 1.50 [1.39,1.61] 35-44 1,520 1.40 [1.30,1.49] 1,498 1.52 [1.43,1.62] 3,018 1.46 [1.38,1.53] 45-54 1,466 1.22 [1.10,1.35] 1,444 1.35 [1.25,1.45] 2,910 1.29 [1.20,1.38] 55-64 1,425 1.12 [1.04,1.20] 1,406 1.26 [1.15,1.37] 2,831 1.19 [1.11,1.27] 15-64 7,519 1.41 [1.31,1.50] 7,445 1.55 [1.46,1.65] 14,964 1.48 [1.40,1.56]
Rural areas Age
Group (years)
Men Women Both Sexes
n Mean
number of servings
95% CI n Mean
number of servings
95% CI n Mean
number of servings
95% CI
15-24 1,234 1.06 [0.977,1.15] 1,230 1.07 [1.00,1.15] 2,464 1.07 [1.00,1.14] 25-34 1,187 1.05 [0.982,1.12] 1,210 1.12 [1.04,1.19] 2,397 1.08 [1.02,1.14] 35-44 1,134 0.96 [0 .87,1.04] 1,136 1.06 [1.00,1.13] 2,270 1.01 [.94,1.08] 45-54 1,089 0.94 [0.867,1.02] 1,122 1.01 [0.94,1.08] 2,211 0.98 [.92,1.04] 55-64 1,041 0.83 [0.77,0.89] 1,057 0.87 [0.79,.96] 2,098 0.85 [.79,.92] 15-64 5,685 1.01 [0.95,1.07] 5,755 1.06 [1.00,1.12] 11,440 1.04 [0.98,1.09]
Total Age
Group (years)
Men Women Both Sexes
n Mean
number of servings
95% CI n Mean
number of servings
95% CI n Mean
number of servings
95% CI
15-24 2,806 1.36 [1.26,1.45] 2,798 1.45 [1.35,1.54] 5,604 1.40 [1.33,1.47] 25-34 2,723 1.28 [1.20,1.37] 2,739 1.42 [1.33,1.52] 5,462 1.35 [1.28,1.42] 35-44 2,654 1.25 [1.18,1.32] 2,634 1.37 [1.29,1.44] 5,288 1.31 [1.25,1.37] 45-54 2,555 1.13 [1.05,1.21] 2,567 1.23 [1.15,1.31] 5,122 1.18 [1.12,1.24] 55-64 2,466 1.02 [0.96,1.08] 2,463 1.12 [1.05,1.20] 4,929 1.07 [1.02,1.13] 15-64 13,204 1.27 [1.20,1.33] 13,201 1.38 [1.31,1.44] 26,405 1.32 [1.27,1.38]

Iran NCD Risk Factors STEPs Report 39
Table 25 Mean number of servings of vegetable on average per day Urban areas
Age Group (years)
Men Women Both Sexes
n Mean
number of servings
95% CI n Mean
number of servings
95% CI n Mean
number of servings
95% CI
15-24 1,503 1.36 [1.23,1.49] 1539 1.48 [1.37,1.60] 2462 1.42 [1.31,1.53] 25-34 1,497 1.38 [1.22,1.54] 1517 1.57 [1.44,1.70] 2434 1.47 [1.34,1.61] 35-44 1,514 1.50 [1.32,1.68] 1525 1.67 [1.51,1.82] 2417 1.58 [1.43,1.73] 45-54 1,500 1.49 [1.29,1.69] 1504 1.61 [1.44,1.78] 2398 1.55 [1.389,1.71] 55-64 1,425 1.33 [1.22,1.45] 1451 1.50 [1.37,1.62] 2271 1.42 [1.32,1.52] 15-64 7,439 1.41 [1.27,1.54] 7536 1.56 [1.44,1.67] 11982 1.48 [1.36,1.59]
Rural areas Age
Group (years)
Men Women Both Sexes
n Mean
number of servings
95% CI n Mean
number of servings
95% CI n Mean
number of servings
95% CI
15-24 1,222 1.30 [1.211.39] 1240 1.50 [1.401.61] 2462 1.40 [1.32 1.48] 25-34 1,209 1.34 [1.261.42] 1225 1.52 [1.401.64] 2434 1.43 [1.34 1.48] 35-44 1,210 1.34 [1.241.44] 1207 1.56 [1.431.69] 2417 1.45 [1.35 1.55] 45-54 1,182 1.30 [1.231.39] 1216 1.50 [1.391.61] 2398 1.40 [1.32 1.48] 55-64 1,143 1.28 [1.191.37] 1128 1.38 [1.281.48] 2271 1.33 [1.26 1.40] 15-64 5,966 1.32 [1.251.39] 6016 1.51 [1.421.60] 11982 1.41 [1.34 1.49]
Total Age
Group (years)
Men Women Both Sexes
n Mean
number of servings
95% CI n Mean
number of servings
95% CI n Mean
number of servings
95% CI
15-24 2,725 1.34 [1.251.42] 2,779 1.49 [1.411.56] 5,504 1.41 [1.341.48] 25-34 2,706 1.36 [1.261.46] 2,742 1.55 [1.461.64] 5,448 1.45 [1.371.54] 35-44 2,724 1.44 [1.331.55] 2,732 1.63 [1.521.73] 5,456 1.53 [1.441.62] 45-54 2,682 1.42 [1.291.55] 2,721 1.57 [1.451.68] 5,403 1.49 [1.391.60] 55-64 2,568 1.31 [1.231.39] 2,579 1.45 [1.371.54] 5,147 1.38 [1.311.45] 15-64 13,405 1.37 [1.291.46] 13,553 1.54 [1.461.61] 26,958 1.45 [1.381.53]
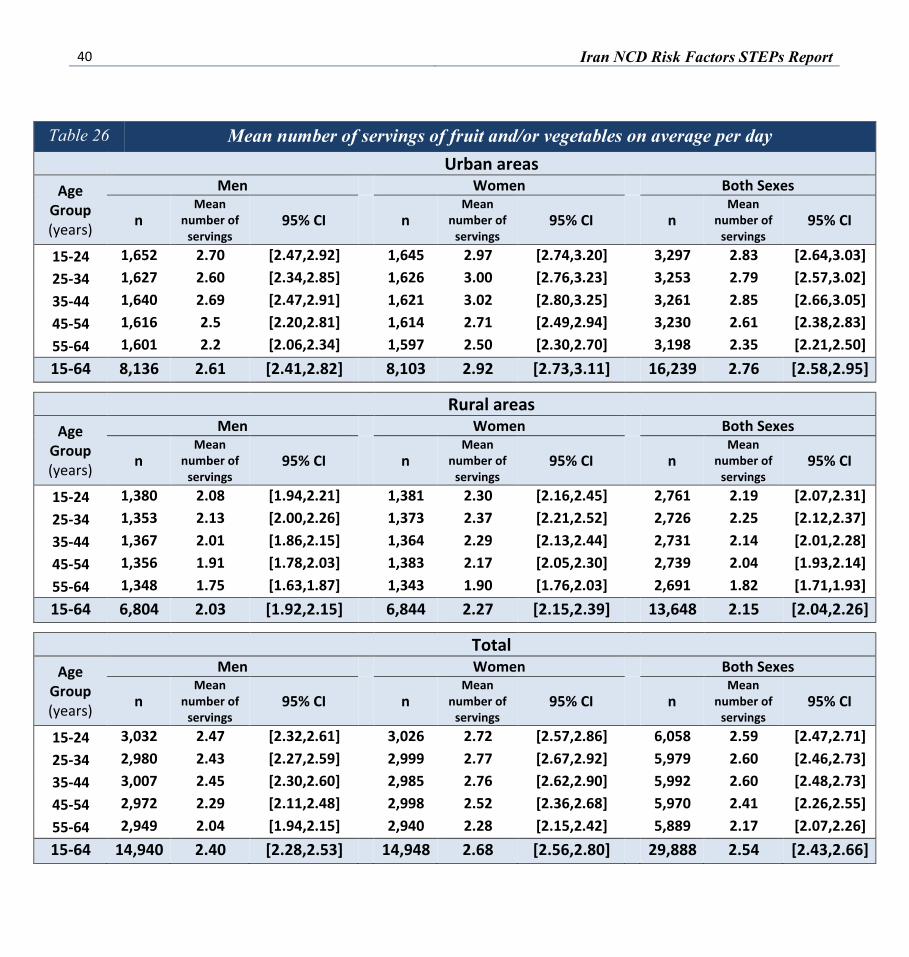
40 Iran NCD Risk Factors STEPs Report
Table 26 Mean number of servings of fruit and/or vegetables on average per day Urban areas
Age Group (years)
Men Women Both Sexes
n Mean
number of servings
95% CI n Mean
number of servings
95% CI n Mean
number of servings
95% CI
15-24 1,652 2.70 [2.47,2.92] 1,645 2.97 [2.74,3.20] 3,297 2.83 [2.64,3.03] 25-34 1,627 2.60 [2.34,2.85] 1,626 3.00 [2.76,3.23] 3,253 2.79 [2.57,3.02] 35-44 1,640 2.69 [2.47,2.91] 1,621 3.02 [2.80,3.25] 3,261 2.85 [2.66,3.05] 45-54 1,616 2.5 [2.20,2.81] 1,614 2.71 [2.49,2.94] 3,230 2.61 [2.38,2.83] 55-64 1,601 2.2 [2.06,2.34] 1,597 2.50 [2.30,2.70] 3,198 2.35 [2.21,2.50] 15-64 8,136 2.61 [2.41,2.82] 8,103 2.92 [2.73,3.11] 16,239 2.76 [2.58,2.95]
Rural areas Age
Group (years)
Men Women Both Sexes
n Mean
number of servings
95% CI n Mean
number of servings
95% CI n Mean
number of servings
95% CI
15-24 1,380 2.08 [1.94,2.21] 1,381 2.30 [2.16,2.45] 2,761 2.19 [2.07,2.31] 25-34 1,353 2.13 [2.00,2.26] 1,373 2.37 [2.21,2.52] 2,726 2.25 [2.12,2.37] 35-44 1,367 2.01 [1.86,2.15] 1,364 2.29 [2.13,2.44] 2,731 2.14 [2.01,2.28] 45-54 1,356 1.91 [1.78,2.03] 1,383 2.17 [2.05,2.30] 2,739 2.04 [1.93,2.14] 55-64 1,348 1.75 [1.63,1.87] 1,343 1.90 [1.76,2.03] 2,691 1.82 [1.71,1.93] 15-64 6,804 2.03 [1.92,2.15] 6,844 2.27 [2.15,2.39] 13,648 2.15 [2.04,2.26]
Total Age
Group (years)
Men Women Both Sexes
n Mean
number of servings
95% CI n Mean
number of servings
95% CI n Mean
number of servings
95% CI
15-24 3,032 2.47 [2.32,2.61] 3,026 2.72 [2.57,2.86] 6,058 2.59 [2.47,2.71] 25-34 2,980 2.43 [2.27,2.59] 2,999 2.77 [2.67,2.92] 5,979 2.60 [2.46,2.73] 35-44 3,007 2.45 [2.30,2.60] 2,985 2.76 [2.62,2.90] 5,992 2.60 [2.48,2.73] 45-54 2,972 2.29 [2.11,2.48] 2,998 2.52 [2.36,2.68] 5,970 2.41 [2.26,2.55] 55-64 2,949 2.04 [1.94,2.15] 2,940 2.28 [2.15,2.42] 5,889 2.17 [2.07,2.26] 15-64 14,940 2.40 [2.28,2.53] 14,948 2.68 [2.56,2.80] 29,888 2.54 [2.43,2.66]

Iran NCD Risk Factors STEPs Report 41
Table 27 Number of servings of fruit and/or vegetables on average per day Urban areas
Age group (year)
Men
n %no fruit
and/or vegetables
%95CI %1-2 servings %95CI %3-4
servings %95CI %≥5 servings %95CI
15-24 1,652 16.91 [15.93,17.93] 47.80 [46.32,49.30] 22.54 [21.42,23.69] 12.75 [11.68,13.90] 25-34 1,627 18.93 [18.00,19.90] 48.43 [47.26,49.60] 20.97 [20.03,21.94] 11.60 [10.80,12.60] 35-44 1,640 17.29 [16.69,17.91] 44.71 [43.90,45.52] 25.90 [25.16,26.66] 12.09 [11.53,12.69] 45-54 1,616 22.80 [22.32,23.30] 45.80 [45.24,46.36] 19.60 [19.18,20.03] 11.80 [11.38,12.23] 55-64 1,601 24.66 [24.42,24.89] 49.04 [48.78,49.31] 16.22 [16.02,16.43] 10.08 [9.917,10.24] 15-64 8,136 18.77 [16.53,21.25] 47.22 [44.44,50.02] 21.96 [19.93,24.12] 12.05 [9.741,14.81]
Age group (year)
Women
n %no fruit
and/or vegetables
%95CI %1-2 servings %95CI %3-4
servings %95CI %≥5 servings %95CI
15-24 1,645 13.86 [12.96,14.80] 44.86 [43.61,46.10] 25.29 [24.20,26.42] 15.99 [15.03,17.01] 25-34 1,626 13.67 [12.89,14.49] 44.50 [43.53,45.47] 24.63 [23.75,25.54] 17.20 [16.32,18.12] 35-44 1,621 14.70 [14.10,15.32] 40.99 [40.26,41.72] 26.61 [26.00,27.23] 17.70 [17.08,18.33] 45-54 1,614 20.30 [19.90,20.70] 42.89 [42.42,43.37] 20.91 [20.45,21.38] 15.90 [15.50,16.30] 55-64 1,597 22.13 [21.88,22.38] 45.98 [45.67,46.29] 20.30 [20.08,20.52] 11.59 [11.37,11.81] 15-64 8,103 15.36 [13.34,17.64] 43.89 [41.44,46.37] 24.45 [22.48,26.54] 16.30 [14.07,18.79]
Age group (year)
Both Sexes
n %no fruit
and/or vegetables
%95CI %1-2 servings %95CI %3-4
servings %95CI %≥5 servings %95CI
15-24 3,297 15.40 [14.65,16.17] 46.35 [45.22,47.48] 23.90 [23.06,24.77] 14.36 [13.47,15.29] 25-34 3,253 16.35 [15.67,17.04] 46.50 [45.66,47.34] 22.77 [22.11,23.44] 14.39 [13.64,15.17] 35-44 3,261 16.02 [15.55,16.51] 42.89 [42.24,43.53] 26.25 [25.77,26.74] 14.84 [14.35,15.35] 45-54 3,230 21.57 [21.19,21.95] 44.36 [44.00,44.73] 20.25 [19.93,20.57] 13.82 [13.47,14.18] 55-64 3,198 23.37 [23.19,23.56] 47.49 [47.27,47.70] 18.30 [18.13,18.46] 10.85 [10.71,10.99] 15-64 1,623 17.09 [15.21,19.15] 45.58 [43.30,47.87] 23.19 [21.49,24.98] 14.15 [12.05,16.53]

42 Iran NCD Risk Factors STEPs Report
Table 28 Number of servings of fruit and/or vegetables on average per day Rural areas
Age group (year)
Men
n %no fruit
and/or vegetables
%95CI %1-2 servings %95CI %3-4
servings %95CI %≥5 servings %95CI
15-24 1380 24.98 [23.87,26.13] 52.22 [51.12,53.32] 15.92 [15.02,16.88] 6.873 [6.233,7.574] 25-34 1353 26.02 [25.36,26.69] 47.59 [46.76,48.41] 19.69 [18.88,20.53] 6.704 [6.252,7.185] 35-44 1367 26.49 [25.89,27.1] 50.82 [50.12,51.53] 17.27 [16.79,17.75] 5.423 [5.141,5.719] 45-54 1356 30.71 [30.23,31.19] 49.26 [48.83,49.7] 13.97 [13.64,14.3] 6.065 [5.899,6.235] 55-64 1348 31.78 [31.55,32.01] 50.45 [50.15,50.75] 15.06 [14.81,15.32] 2.71 [2.652,2.771] 15-64 6804 26.71 [24.47,29.08] 50.26 [47.96,52.55] 16.85 [15.11,18.74] 6.182 [5.034,7.57]
Age group (year)
Women
n %no fruit
and/or vegetables
%95CI %1-2 servings %95CI %3-4
servings %95CI %≥5 servings %95CI
15-24 1381 22.45 [21.23,23.72] 48.99 [47.45,50.53] 18.88 [17.94,19.85] 9.681 [8.934,10.48] 25-34 1373 19.3 [18.55,20.06] 51.91 [50.99,52.83] 19.69 [18.99,20.41] 9.102 [8.447,9.803] 35-44 1364 22.84 [22.3,23.39] 48.11 [47.31,48.92] 19.61 [19.14,20.1] 9.439 [9.038,9.855] 45-54 1383 26.55 [26.15,26.94] 45.77 [45.33,46.2] 20.07 [19.75,20.39] 7.615 [7.369,7.868] 55-64 1343 30.06 [29.79,30.33] 47.58 [47.28,47.88] 16.38 [16.17,16.6] 5.979 [5.859,6.102] 15-64 6844 22.76 [20.31,25.42] 49.07 [46.03,52.12] 19.2 [17.46,21.07] 8.964 [7.367,10.87]
Age group (year)
Both Sexes
n %no fruit
and/or vegetables
%95CI %1-2 servings %95CI %3-4
servings %95CI %≥5 servings %95CI
15-24 2761 23.73 [22.75,24.74] 50.62 [49.53,51.71] 17.39 [16.66,18.14] 8.263 [7.659,8.911] 25-34 2726 22.72 [22.19,23.25] 49.71 [49.06,50.36] 19.69 [19.11,20.28] 7.883 [7.413,8.379] 35-44 2731 24.7 [24.22,25.18] 49.49 [48.9,50.09] 18.42 [18.05,18.79] 7.391 [7.106,7.687] 45-54 2739 28.65 [28.32,28.99] 47.54 [47.17,47.9] 16.98 [16.71,17.26] 6.83 [6.678,6.986] 55-64 2691 30.91 [30.7,31.12] 48.99 [48.78,49.2] 15.73 [15.54,15.92] 4.37 [4.296,4.446] 15-64 13648 24.76 [22.62,27.04] 49.67 [47.31,52.03] 18.01 [16.44,19.69] 7.556 [6.339,8.984]

Iran NCD Risk Factors STEPs Report 43
Table 29 Number of servings of fruit and/or vegetables on average per day Total
Age group (year)
Men
n %no fruit
and/or vegetables
%95CI %1-2 servings %95CI %3-4
servings %95CI %≥5 servings %95CI
15-24 3,032 19.88 [19.09,20.69] 49.43 [48.46,50.41] 20.10 [19.35,20.88] 10.59 [9.897,11.32] 25-34 2,980 21.40 [20.73,22.07] 48.14 [47.34,48.93] 20.52 [19.94,21.13] 9.94 [9.423,10.49] 35-44 3,007 20.43 [20.03,20.85] 46.80 [46.23,47.36] 22.95 [22.47,23.44] 9.81 [9.441,10.2] 45-54 2,972 25.54 [25.20,25.88] 47.00 [46.59,47.40] 17.65 [17.35,17.96] 9.81 [9.543,10.09] 55-64 2,949 27.07 [26.90,27.25] 49.52 [49.32,49.72] 15.83 [15.68,15.98] 7.57 [7.453,7.704] 15-64 14,940 21.58 [19.88,23.38] 48.30 [46.38,50.23] 20.14 [18.77,21.59] 9.97 [8.508,11.67]
Age group (year)
Women
n %no fruit
and/or vegetables
%95CI %1-2 servings %95CI %3-4
servings %95CI %≥5 servings %95CI
15-24 3,026 17.07 [16.36,17.79] 46.40 [45.45,47.35] 22.90 [22.08,23.74] 13.64 [12.97,14.34] 25-34 2,999 15.64 [15.12,16.18] 47.10 [46.34,47.86] 22.90 [22.08,23.74] 14.36 [13.76,14.98] 35-44 2,985 17.54 [17.14,17.96] 43.48 [42.94,44.02] 24.17 [23.69,24.65] 14.81 [14.42,15.22] 45-54 2,998 22.50 [22.19,22.82] 43.89 [43.51,44.27] 20.16 [20.30,20.93] 13.00 [12.7,13.3] 55-64 2,940 24.92 [24.75,25.09] 46.54 [46.34,46.75] 18.92 [18.77,19.08] 9.61 [9.494,9.74] 15-64 14,948 18.03 [16.55,19.61] 45.74 [43.72,47.77] 22.56 [21.02,24.17] 13.67 [12.14,15.37]
Age group (year)
Both Sexes
n %no fruit
and/or vegetables
%95CI %1-2 servings %95CI %3-4
servings %95CI %≥5 servings %95CI
15-24 6,058 18.49 [17.88,19.10] 47.93 [47.18,48.68] 21.49 [20.89,22.10] 12.10 [11.52,12.70] 25-34 5,979 18.57 [18.11,19.04] 47.63 [47.02,48.24] 21.69 [21.25,22.14] 12.11 [11.65,12.59] 35-44 5,992 19.02 [18.69,19.35] 45.17 [44.72,45.62] 23.55 [23.20,23.90] 12.27 [11.95,12.59] 45-54 5,970 24.04 [23.78,24.30] 45.46 [45.17,45.76] 19.11 [18.88,19.35] 11.38 [11.14,11.63] 55-64 5,889 25.98 [25.85,26.11] 48.01 [47.85,48.16] 17.40 [17.28,17.52] 8.61 [8.518,8.709] 15-64 29,888 19.82 [18.44,21.29] 47.04 [45.34,48.73] 21.34 [20.13,22.60] 11.80 [10.43,13.33]

44 Iran NCD Risk Factors STEPs Report
Table 30 Consuming < 5 servings of fruit and/or vegetables on average per day Urban areas
Age Group (years)
Men Women Both Sexes
n % < five servings per day
95% CI n % < five servings per day
95% CI n % < five servings per day
95% CI
15-24 1,652 87.25 [86.10,88.32] 1,645 84.01 [82.99,84.97] 3,297 85.64 [84.71,86.53] 25-34 1,627 88.33 [87.40,89.20] 1,626 82.80 [81.88,83.68] 3,253 85.61 [84.83,86.36] 35-44 1,640 87.91 [87.31,88.47] 1,621 82.30 [81.67,82.92] 3,261 85.16 [84.65,85.65] 45-54 1,616 88.20 [87.77,88.62] 1,614 84.10 [83.70,84.50] 3,230 86.18 [85.82,86.53] 55-64 1,601 89.92 [89.76,90.08] 1,597 88.41 [88.19,88.63] 3,198 89.15 [89.01,89.29] 15-64 8,136 87.95 [85.19,90.26] 8,103 83.70 [81.21,85.93] 16,239 85.85 [83.47,87.95]
Rural areas Age
Group (years)
Men Women Both Sexes
n % < five servings per day
95% CI n % < five servings per day
95% CI n % < five servings per day
95% CI
15-24 1,380 93.13 [92.43,93.77] 1,381 90.32 [89.52,91.07] 2,761 91.74 [91.09,92.34] 25-34 1,353 93.30 [92.81,93.75] 1,373 90.90 [90.20,91.55] 2,726 92.12 [91.62,92.59] 35-44 1,367 94.58 [94.28,94.86] 1,364 90.56 [90.14,90.96] 2,731 92.61 [92.31,92.89] 45-54 1,356 93.93 [93.76,94.10] 1,383 92.39 [92.13,92.63] 2,739 93.17 [93.01,93.32] 55-64 1,348 97.29 [97.23,97.35] 1,343 94.02 [93.90,94.14] 2,691 95.63 [95.55,95.70] 15-64 6,804 93.82 [92.43,94.97] 6,844 91.04 [89.13,92.63] 13,648 92.44 [91.02,93.66]
Total Age
Group (years)
Men Women Both Sexes
n % < five servings per day
95% CI n % < five servings per day
95% CI n % < five servings per day
95% CI
15-24 3,032 89.41 [88.68,90.10] 3,026 86.36 [85.66,87.03] 6,058 87.90 [87.30,88.48] 25-34 2,980 90.06 [89.51,90.58] 2,999 85.64 [85.02,86.24] 5,979 87.89 [87.41,88.35] 35-44 3,007 90.18 [89.80,90.56] 2,985 85.19 [84.78,85.58] 5,992 87.73 [87.41,88.05] 45-54 2,972 90.19 [89.91,90.46] 2,998 87.00 [86.70,87.30] 5,970 88.62 [88.37,88.86] 55-64 2,949 92.42 [92.30,92.55] 2,940 90.38 [90.26,90.51] 5,889 91.39 [91.29,91.48] 15-64 14,940 90.02 [88.33,91.49] 14,948 86.33 [84.63,87.86] 29,888 88.20 [86.67,89.57]

Iran NCD Risk Factors STEPs Report 45
The type of oil or fat most often used for meal preparation, were asked in households and presented only for both sexes because results are for the household not individuals.
Table 31 Type of oil or fat most often used for meal preparation in household Both sexes
Location %Vegetable oil 95%CI Sat
%Vegetable oil 95%CI Unsat
%Lard 95% CI
%Butter 95% CI
%Margarine 95% CI
%None used 95% CI
%Other 95% CI
Urban areas 40.86
[37.89,43.9] 56.96
[54.1,59.78] 0.15
[0.09,0.26] 0.72
[0.54,0.97] 0.02
[0.005,0.06] 0.74
[0.46,1.18] 0.54
[0.35,0.85]
Rural areas 64.13
[61.71,66.48] 32.52
[29.85,35.31] 0.46
[0.27,0.78] 2.10
[1.54,2.86] 0.01
[0.001,0.04] 0.68
[0.34,1.38] 0.097
[0.40,0.21]
Total 49.15 [45.97,52.33]
49.15 [45.97,52.33]
0.26 [0.17,0.40]
1.22 [0.95,1.56]
0.01 [0.005,0.04]
0.72 [0.49,1.06]
0.39 [0.25,0.59]

46 Iran NCD Risk Factors STEPs Report
4. Physical Activity Physical activity data analysis which is done based on WHO guide lines, can be very complicated.
The guidelines clarify the results of the physical activity data and also provide valuable information on the classifications to report related data.
MET (Metabolic Equivalent) values are applied to vigorous and moderate intensity variables in the work, transport and recreation domains. These have been calculated using an average of the typical types of activity undertaken. Calculating total physical activity and different types of activities have been grouped together and given a MET value based on the intensity of the activity. Survey participants were asked to report on the frequency and duration of physical activity as part of work, travel to and from places and recreational activities separately including:
• The work involves vigorous-intensity activity that causes large increases in breathing or heart rate for at least 10 minutes continuously, moderate-intensity activity, that causes small increases in breathing or heart rate such as brisk walking for at least 10 minutes continuously, how many days and how much time they spend doing vigorous and moderate -intensity activities at work on a typical day.
• In transportation they walk or use a bicycle for at least 10 minutes continuously, how many days and how much time in a typical week.
• In recreational activities if any involve vigorous or moderate- intensity sports, fitness or recreational activities that cause large increases in breathing or heart rate for at least 10 minutes continuously, how many days and how much time In sedentary behavior also, how much time they usually spend sitting or reclining on a typical day. The Following Section Presents physical activity levels in terms of low, moderate and high, mean and mediam minutes of; total; work-related, transport-related and recreation-related physical activity on average per day and no physical activity in any parts and composition of Total physical activity by sex and age groups.

Iran NCD Risk Factors STEPs Report 47
Table 32 Level of total physical activity Urban areas
Age group (year)
Men
n %Low %95CI %Moderate %95CI %High 95%CI
15-24 1,652 24.56 [23.32,25.84] 26.90 [25.87,27.95] 48.55 [47.20,49.90] 25-34 1,627 32.02 [31.12,32.93] 24.66 [23.74,25.60] 43.32 [42.30,44.34] 35-44 1,640 37.15 [36.41,37.90] 25.65 [25.01,26.30] 37.20 [36.42,37.99] 45-54 1,616 42.84 [42.25,43.43] 28.34 [27.91,28.78] 28.82 [28.31,29.33] 55-64 1,601 42.34 [42.06,42.62] 30.75 [30.52,30.98] 26.91 [26.62,27.20] 15-64 8,136 32.35 [29.84,34.96] 26.52 [25.05,28.05] 41.13 [38.44,43.87]
Age group (year)
Women
n %Low %95CI %Moderate %95CI %High 95%CI
15-24 1,645 51.66 [50.31,53.00] 33.38 [32.16,34.62] 14.96 [13.94,16.05] 25-34 1,626 55.09 [53.93,56.24] 31.08 [29.99,32.19] 13.83 [13.02,14.69] 35-44 1,621 53.49 [52.69,54.30] 30.86 [30.18,31.55] 15.64 [15.03,16.28] 45-54 1,614 48.24 [47.68,48.80] 35.97 [35.45,36.49] 15.79 [15.39,16.20] 55-64 1,597 61.28 [60.99,61.57] 27.35 [27.11,27.59] 11.37 [11.20,11.55] 15-64 8,103 53.12 [50.29,55.92] 32.23 [30.17,34.37] 14.65 [12.70,16.83]
Age group (year)
Both Sexes
n %Low %95CI %Moderate %95CI %High 95%CI
15-24 3,297 37.98 [36.94,39.03] 30.11 [29.29,30.94] 31.92 [30.95,32.90] 25-34 3,253 43.36 [42.55,44.16] 27.81 [27.10,28.53] 28.83 [28.07,29.60] 35-44 3,261 45.16 [44.54,45.78] 28.21 [27.73,28.68] 26.63 [26.13,27.14] 45-54 3,230 45.5 [45.04,45.97] 32.11 [31.76,32.46] 22.39 [22.04,22.74] 55-64 3,198 51.96 [51.74,52.18] 29.02 [28.87,29.17] 19.02 [18.83,19.20] 15-64 16,239 42.61 [40.25,45.00] 29.34 [28.05,30.67] 28.05 [26.00,30.20]
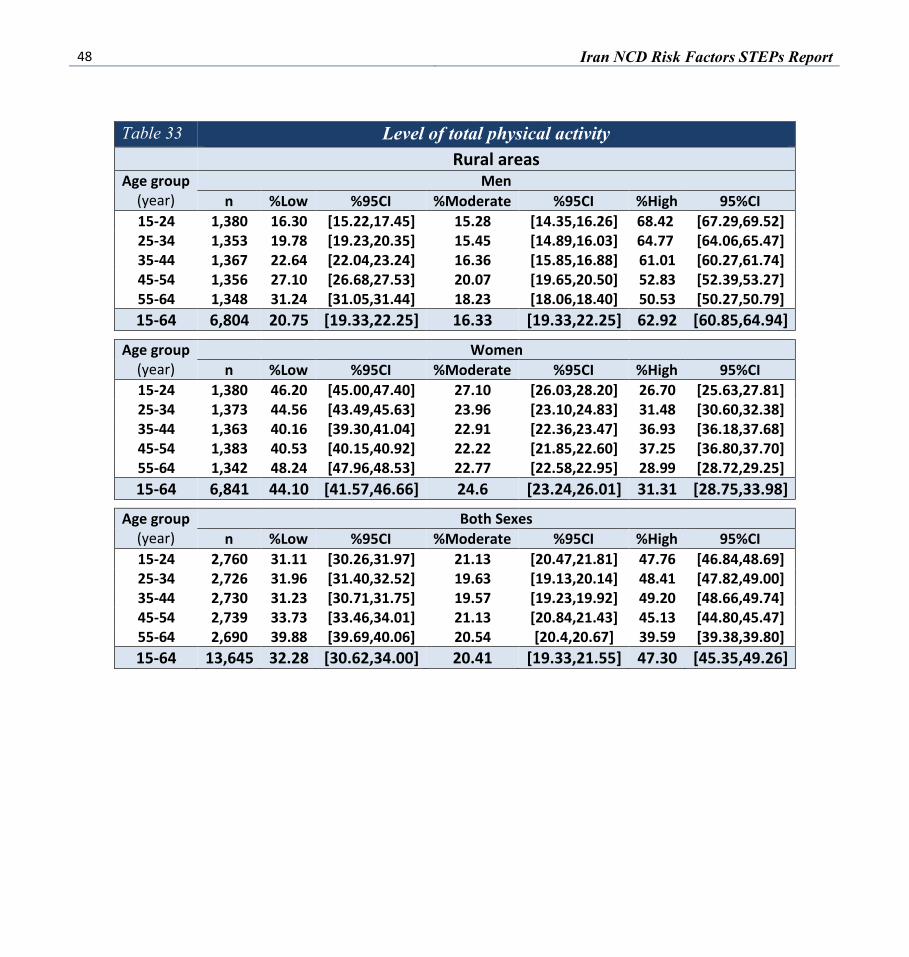
48 Iran NCD Risk Factors STEPs Report
Table 33 Level of total physical activity Rural areas
Age group (year)
Men n %Low %95CI %Moderate %95CI %High 95%CI
15-24 1,380 16.30 [15.22,17.45] 15.28 [14.35,16.26] 68.42 [67.29,69.52] 25-34 1,353 19.78 [19.23,20.35] 15.45 [14.89,16.03] 64.77 [64.06,65.47] 35-44 1,367 22.64 [22.04,23.24] 16.36 [15.85,16.88] 61.01 [60.27,61.74] 45-54 1,356 27.10 [26.68,27.53] 20.07 [19.65,20.50] 52.83 [52.39,53.27] 55-64 1,348 31.24 [31.05,31.44] 18.23 [18.06,18.40] 50.53 [50.27,50.79] 15-64 6,804 20.75 [19.33,22.25] 16.33 [19.33,22.25] 62.92 [60.85,64.94]
Age group (year)
Women n %Low %95CI %Moderate %95CI %High 95%CI
15-24 1,380 46.20 [45.00,47.40] 27.10 [26.03,28.20] 26.70 [25.63,27.81] 25-34 1,373 44.56 [43.49,45.63] 23.96 [23.10,24.83] 31.48 [30.60,32.38] 35-44 1,363 40.16 [39.30,41.04] 22.91 [22.36,23.47] 36.93 [36.18,37.68] 45-54 1,383 40.53 [40.15,40.92] 22.22 [21.85,22.60] 37.25 [36.80,37.70] 55-64 1,342 48.24 [47.96,48.53] 22.77 [22.58,22.95] 28.99 [28.72,29.25] 15-64 6,841 44.10 [41.57,46.66] 24.6 [23.24,26.01] 31.31 [28.75,33.98]
Age group (year)
Both Sexes n %Low %95CI %Moderate %95CI %High 95%CI
15-24 2,760 31.11 [30.26,31.97] 21.13 [20.47,21.81] 47.76 [46.84,48.69] 25-34 2,726 31.96 [31.40,32.52] 19.63 [19.13,20.14] 48.41 [47.82,49.00] 35-44 2,730 31.23 [30.71,31.75] 19.57 [19.23,19.92] 49.20 [48.66,49.74] 45-54 2,739 33.73 [33.46,34.01] 21.13 [20.84,21.43] 45.13 [44.80,45.47] 55-64 2,690 39.88 [39.69,40.06] 20.54 [20.4,20.67] 39.59 [39.38,39.80] 15-64 13,645 32.28 [30.62,34.00] 20.41 [19.33,21.55] 47.30 [45.35,49.26]
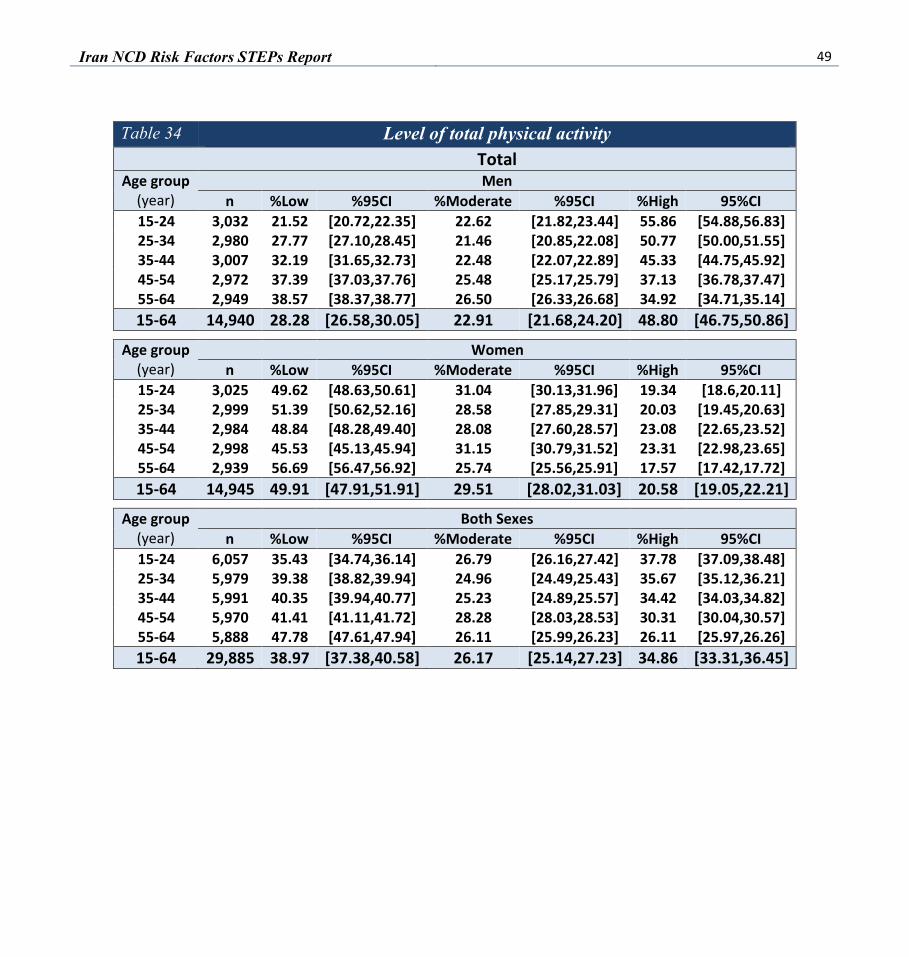
Iran NCD Risk Factors STEPs Report 49
Table 34 Level of total physical activity Total
Age group (year)
Men n %Low %95CI %Moderate %95CI %High 95%CI
15-24 3,032 21.52 [20.72,22.35] 22.62 [21.82,23.44] 55.86 [54.88,56.83] 25-34 2,980 27.77 [27.10,28.45] 21.46 [20.85,22.08] 50.77 [50.00,51.55] 35-44 3,007 32.19 [31.65,32.73] 22.48 [22.07,22.89] 45.33 [44.75,45.92] 45-54 2,972 37.39 [37.03,37.76] 25.48 [25.17,25.79] 37.13 [36.78,37.47] 55-64 2,949 38.57 [38.37,38.77] 26.50 [26.33,26.68] 34.92 [34.71,35.14] 15-64 14,940 28.28 [26.58,30.05] 22.91 [21.68,24.20] 48.80 [46.75,50.86]
Age group (year)
Women n %Low %95CI %Moderate %95CI %High 95%CI
15-24 3,025 49.62 [48.63,50.61] 31.04 [30.13,31.96] 19.34 [18.6,20.11] 25-34 2,999 51.39 [50.62,52.16] 28.58 [27.85,29.31] 20.03 [19.45,20.63] 35-44 2,984 48.84 [48.28,49.40] 28.08 [27.60,28.57] 23.08 [22.65,23.52] 45-54 2,998 45.53 [45.13,45.94] 31.15 [30.79,31.52] 23.31 [22.98,23.65] 55-64 2,939 56.69 [56.47,56.92] 25.74 [25.56,25.91] 17.57 [17.42,17.72] 15-64 14,945 49.91 [47.91,51.91] 29.51 [28.02,31.03] 20.58 [19.05,22.21]
Age group (year)
Both Sexes n %Low %95CI %Moderate %95CI %High 95%CI
15-24 6,057 35.43 [34.74,36.14] 26.79 [26.16,27.42] 37.78 [37.09,38.48] 25-34 5,979 39.38 [38.82,39.94] 24.96 [24.49,25.43] 35.67 [35.12,36.21] 35-44 5,991 40.35 [39.94,40.77] 25.23 [24.89,25.57] 34.42 [34.03,34.82] 45-54 5,970 41.41 [41.11,41.72] 28.28 [28.03,28.53] 30.31 [30.04,30.57] 55-64 5,888 47.78 [47.61,47.94] 26.11 [25.99,26.23] 26.11 [25.97,26.26] 15-64 29,885 38.97 [37.38,40.58] 26.17 [25.14,27.23] 34.86 [33.31,36.45]

50 Iran NCD Risk Factors STEPs Report
Table 35 Mean minutes of total physical activity on average per day Urban areas
Age Group (years)
Men Women Both Sexes
n Mean minutes 95% CI n Mean
minutes 95% CI n Mean minutes 95% CI
15-24 1,652 128.20 [116.11,140.44] 1,645 53.07 [46.66,59.48] 3,297 91.04 [83.70,98.37] 25-34 1,627 138.29 [125.18,151.41] 1,626 53.23 [44.71,61.75] 3,253 96.49 [87.10,105.87] 35-44 1,640 126.81 [112.43,141.19] 1,621 54.17 [47.88,60.46] 3,261 91.20 [87.10,105.87] 45-54 1,616 112.20 [95.26,129.14] 1,614 55.26 [48.45,62.08] 3,230 84.09 [82.81,99.60] 55-64 1,601 95.00 [82.62,107.39] 1,597 40.53 [35.66,45.39] 3,198 67.34 [74.40,93.78] 15-64 8,136 126.36 [116.82,135.90] 8,103 52.72 [47.53,57.90] 16,239 89.98 [83.56,96.40]
Rural areas Age
Group (years)
Men Women Both Sexes
n Mean minutes 95% CI n Mean
minutes 95% CI n Mean minutes 95% CI
15-24 1,380 214.35 [197.66,231.04] 1,381 85.14 [76.219,94.06] 2,761 150.37 [140.32,160.42] 25-34 1,353 255.43 [236.97,273.90] 1,373 99.93 [89.26,110.60] 2,726 179.01 [167.08,190.93] 35-44 1,367 236.34 [213.94,258.74] 1,364 122.78 [111.12,134.43] 2,731 180.67 [167.74,193.59] 45-54 1,356 204.33 [190.94,217.72] 1,383 127.16 [114.08,140.24] 2,739 166.23 [155.57,176.88] 55-64 1,348 201.04 [181.87,220.20] 1,343 98.92 [88.72,109.10] 2,691 149.17 [138.06,160.29] 15-64 6,804 226.98 [213.28,240.67] 6,844 102.14 [94.34,109.94] 13,648 165.31 [156.23,174.39]
Total Age
Group (years)
Men Women Both Sexes
n Mean minutes 95% CI n Mean
minutes 95% CI n Mean minutes 95% CI
15-24 3,032 159.95 [150.26,169.64] 3,026 65.04 [59.84,70.23] 6,058 112.95 [106.83,119.07] 25-34 2,980 179.00 [167.75,190.25] 2,999 69.63 [63.35,75,91] 5,979 125.25 [117.71,132.78] 35-44 3,007 164.22 [152.37,176.06] 2,985 78.14 [72.28,83.99] 5,992 122.02 [114.55,129.48] 45-54 2,972 144.07 [133.01,155.14] 2,998 80.48 [73.07,87.90] 5,970 112.68 [105.24,120,12] 55-64 2,949 130.98 [119.96,142.00] 2,940 61.07 [55.44,66.70] 5,889 95.48 [88.65,102.31] 15-64 14,940 161.76 [153.77,169.76] 14,948 70.30 [65.87,74.74] 29,888 116.58 [111.01,122.16]

Iran NCD Risk Factors STEPs Report 51
Table 36 Mean minutes of transport -related physical activity on average per day Urban areas
Age Group (years)
Men Women Both Sexes
n Mean
minutes 95% CI n
Mean minutes
95% CI n Mean
minutes 95% CI
15-24 1,650 38.96 [34.88,43.05] 1,642 22.37 [19.86,24.88] 3,292 30.75 [28.07,33.43] 25-34 1,625 27.78 [23.98,31.57] 1,621 19.99 [18.02,21.97] 3,246 23.95 [21.79,26.12] 35-44 1,638 25.21 [20.79,29.62] 1,619 23.30 [20.01,26.59] 3,257 24.27 [21.65,26.89] 45-54 1,615 25.89 [22.82,28.95] 1,611 26.02 [22.81,29.23] 3,226 25.95 [23.50,28.41] 55-64 1,597 35.41 [29.90,40.92] 1,595 19.58 [17.26,21.91] 3,192 27.37 [24.41,30.33] 15-64 8,125 31.60 [29.47,33.72] 8,088 22.19 [20.45,23.94] 16,213 26.95 [25.43,28.47]
Rural areas Age
Group (years)
Men Women Both Sexes
n Mean
minutes 95% CI n
Mean minutes
95% CI n Mean
minutes 95% CI
15-24 1,378 52.10 [45.67,58.54] 1,378 28.06 [24.94,31.18] 2,756 40.20 [36.36,44.04] 25-34 1,348 47.09 [41.94,52.23] 1,370 29.87 [25.92,33.83] 2,718 38.63 [35.36,41.90] 35-44 1,367 47.03 [41.82,52.23] 1,363 35.41 [31.02,39.80] 2,730 41.33 [37.70,44.96] 45-54 1,352 46.63 [42.26,50.99] 1,378 36.33 [32.72,39.94] 2,730 41.54 [38.41,44.67] 55-64 1,348 52.56 [46.98,58.14] 1,343 30.79 [27.28,34.30] 2,691 41.50 [38.17,44.84] 15-64 6,793 49.19 [45.43,52.95] 6,832 31.11 [28.38,33.85] 13,625 40.26 [37.61,42.91]
Total Age
Group (years)
Men Women Both Sexes
n Mean
minutes 95% CI n
Mean minutes
95% CI n Mean
minutes 95% CI
15-24 3,028 43.78 [40.42,47.15] 3,020 24.49 [22.51,26.47] 6,048 34.23 [32.09,36.37] 25-34 2,973 34.47 [31.34,37.60] 2,991 23.47 [21.47,25.46] 5,964 29.06 [27.09,31.03] 35-44 3,005 32.66 [29.46,35.86] 2,982 27.52 [24.94,30.10] 5,987 30.14 [27.97,32.31] 45-54 2,967 33.04 [30.34,35.74] 2,990 29.64 [26.97,32.31] 5,957 31.36 [29.19,33.53] 55-64 2,945 41.24 [37.24,45.24] 2,938 23.53 [21.61,25.44] 5,883 32.24 [29.92,34.57] 15-64 14,918 37.75 [35.67,39.84] 14,921 25.37 [23.99,26.75] 29,839 31.63 [30.12,33.15]
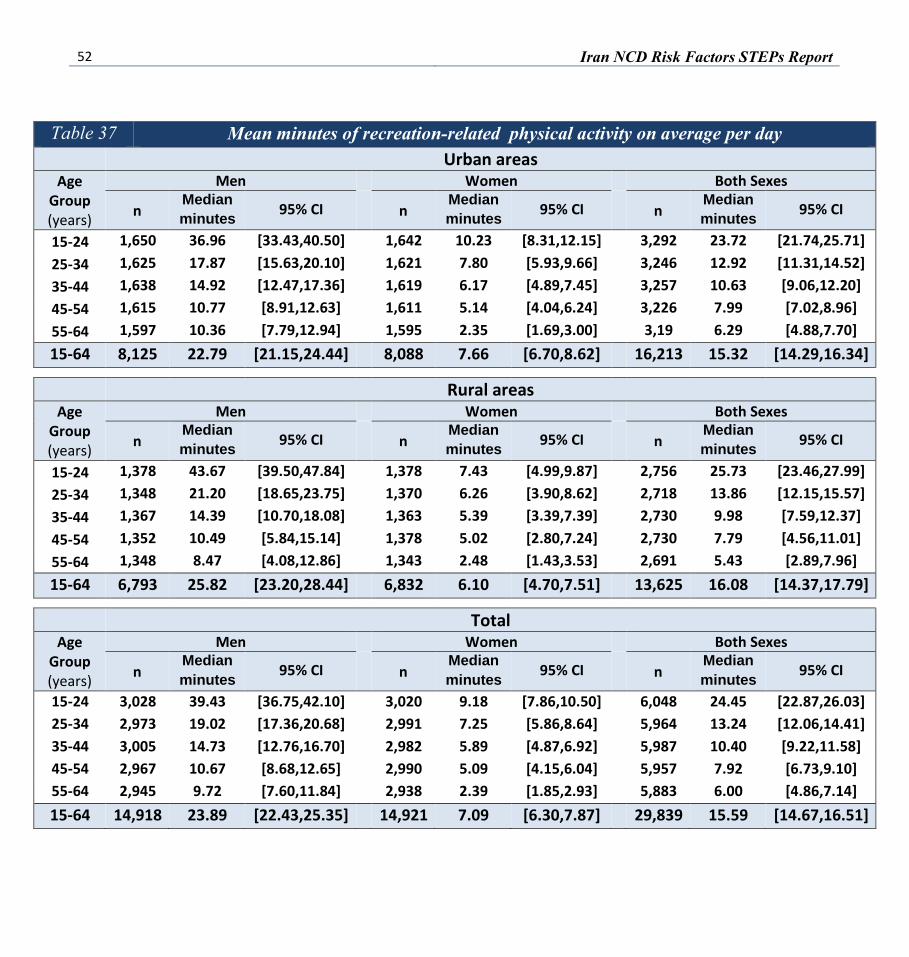
52 Iran NCD Risk Factors STEPs Report
Table 37 Mean minutes of recreation-related physical activity on average per day Urban areas
Age Group (years)
Men Women Both Sexes
n Median minutes 95% CI n
Median minutes 95% CI n
Median minutes 95% CI
15-24 1,650 36.96 [33.43,40.50] 1,642 10.23 [8.31,12.15] 3,292 23.72 [21.74,25.71] 25-34 1,625 17.87 [15.63,20.10] 1,621 7.80 [5.93,9.66] 3,246 12.92 [11.31,14.52] 35-44 1,638 14.92 [12.47,17.36] 1,619 6.17 [4.89,7.45] 3,257 10.63 [9.06,12.20] 45-54 1,615 10.77 [8.91,12.63] 1,611 5.14 [4.04,6.24] 3,226 7.99 [7.02,8.96] 55-64 1,597 10.36 [7.79,12.94] 1,595 2.35 [1.69,3.00] 3,19 6.29 [4.88,7.70] 15-64 8,125 22.79 [21.15,24.44] 8,088 7.66 [6.70,8.62] 16,213 15.32 [14.29,16.34]
Rural areas Age
Group (years)
Men Women Both Sexes
n Median minutes 95% CI n
Median minutes 95% CI n
Median minutes 95% CI
15-24 1,378 43.67 [39.50,47.84] 1,378 7.43 [4.99,9.87] 2,756 25.73 [23.46,27.99] 25-34 1,348 21.20 [18.65,23.75] 1,370 6.26 [3.90,8.62] 2,718 13.86 [12.15,15.57] 35-44 1,367 14.39 [10.70,18.08] 1,363 5.39 [3.39,7.39] 2,730 9.98 [7.59,12.37] 45-54 1,352 10.49 [5.84,15.14] 1,378 5.02 [2.80,7.24] 2,730 7.79 [4.56,11.01] 55-64 1,348 8.47 [4.08,12.86] 1,343 2.48 [1.43,3.53] 2,691 5.43 [2.89,7.96] 15-64 6,793 25.82 [23.20,28.44] 6,832 6.10 [4.70,7.51] 13,625 16.08 [14.37,17.79]
Total Age
Group (years)
Men Women Both Sexes
n Median minutes 95% CI n
Median minutes 95% CI n
Median minutes 95% CI
15-24 3,028 39.43 [36.75,42.10] 3,020 9.18 [7.86,10.50] 6,048 24.45 [22.87,26.03] 25-34 2,973 19.02 [17.36,20.68] 2,991 7.25 [5.86,8.64] 5,964 13.24 [12.06,14.41] 35-44 3,005 14.73 [12.76,16.70] 2,982 5.89 [4.87,6.92] 5,987 10.40 [9.22,11.58] 45-54 2,967 10.67 [8.68,12.65] 2,990 5.09 [4.15,6.04] 5,957 7.92 [6.73,9.10] 55-64 2,945 9.72 [7.60,11.84] 2,938 2.39 [1.85,2.93] 5,883 6.00 [4.86,7.14] 15-64 14,918 23.89 [22.43,25.35] 14,921 7.09 [6.30,7.87] 29,839 15.59 [14.67,16.51]
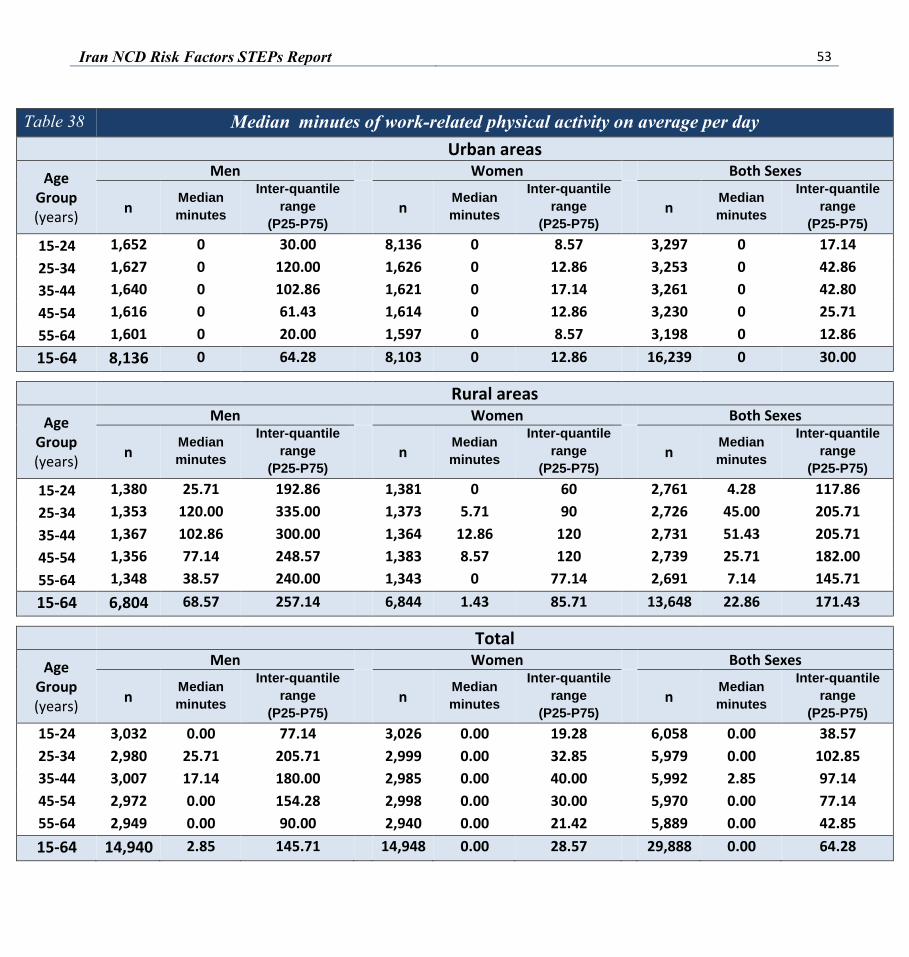
Iran NCD Risk Factors STEPs Report 53
Table 38 Median minutes of work-related physical activity on average per day Urban areas
Age Group (years)
Men Women Both Sexes
n Median minutes
Inter-quantile range
(P25-P75) n
Median minutes
Inter-quantile range
(P25-P75) n
Median minutes
Inter-quantile range
(P25-P75) 15-24 1,652 0 30.00 8,136 0 8.57 3,297 0 17.14 25-34 1,627 0 120.00 1,626 0 12.86 3,253 0 42.86 35-44 1,640 0 102.86 1,621 0 17.14 3,261 0 42.80 45-54 1,616 0 61.43 1,614 0 12.86 3,230 0 25.71 55-64 1,601 0 20.00 1,597 0 8.57 3,198 0 12.86 15-64 8,136 0 64.28 8,103 0 12.86 16,239 0 30.00
Rural areas Age
Group (years)
Men Women Both Sexes
n Median minutes
Inter-quantile range
(P25-P75) n
Median minutes
Inter-quantile range
(P25-P75) n
Median minutes
Inter-quantile range
(P25-P75) 15-24 1,380 25.71 192.86 1,381 0 60 2,761 4.28 117.86 25-34 1,353 120.00 335.00 1,373 5.71 90 2,726 45.00 205.71 35-44 1,367 102.86 300.00 1,364 12.86 120 2,731 51.43 205.71 45-54 1,356 77.14 248.57 1,383 8.57 120 2,739 25.71 182.00 55-64 1,348 38.57 240.00 1,343 0 77.14 2,691 7.14 145.71 15-64 6,804 68.57 257.14 6,844 1.43 85.71 13,648 22.86 171.43
Total Age
Group (years)
Men Women Both Sexes
n Median minutes
Inter-quantile range
(P25-P75) n
Median minutes
Inter-quantile range
(P25-P75) n
Median minutes
Inter-quantile range
(P25-P75) 15-24 3,032 0.00 77.14 3,026 0.00 19.28 6,058 0.00 38.57 25-34 2,980 25.71 205.71 2,999 0.00 32.85 5,979 0.00 102.85 35-44 3,007 17.14 180.00 2,985 0.00 40.00 5,992 2.85 97.14 45-54 2,972 0.00 154.28 2,998 0.00 30.00 5,970 0.00 77.14 55-64 2,949 0.00 90.00 2,940 0.00 21.42 5,889 0.00 42.85 15-64 14,940 2.85 145.71 14,948 0.00 28.57 29,888 0.00 64.28

54 Iran NCD Risk Factors STEPs Report
Table 39 Median minutes of transport-related physical activity on average per day Urban areas
Age Group (years)
Men Women Both Sexes
n Median minutes
Inter-quantile range
(P25-P75) n
Median minutes
Inter-quantile range
(P25-P75) n
Median minutes
Inter-quantile range
(P25-P75) 15-24 1,650 20.00 50.00 1,642 12.86 30.00 3,292 17.14 34.28 25-34 1,625 12.86 30.00 1,621 11.43 25.71 3,246 12.86 30.00 35-44 1,638 10.00 30.00 1,619 12.86 30.00 3,257 12.86 30.00 45-54 1,615 12.86 30.00 1,611 15.00 27.14 3,226 15.00 30.00 55-64 1,597 17.14 51.43 1,595 8.57 25.71 3,192 12.86 34.28 15-64 8,125 15.00 38.57 8,088 12.86 30.00 16,213 12.86 30.00
Rural areas Age
Group (years)
Men Women Both Sexes
n Median minutes
Inter-quantile range
(P25-P75) n
Median minutes
Inter-quantile range
(P25-P75) n
Median minutes
Inter-quantile range
(P25-P75) 15-24 1,378 25.71 53.57 1,378 12.86 30.00 2,756 17.14 48.57 25-34 1,348 17.14 60.00 1,370 12.86 34.28 2,718 15.00 51.43 35-44 1,367 20.00 60.00 1,363 15.00 50.00 2,730 17.14 58.57 45-54 1,352 20.00 60.00 1,378 17.14 50.00 2,730 19.28 60.00 55-64 1,348 25.71 54.28 1,342 10.71 34.28 2,691 17.14 60.00 15-64 6,793 21.43 60.00 6,832 12.86 34.28 13,625 17.14 51.43
Total Age
Group (years)
Men Women Both Sexes
n Median minutes
Inter-quantile range
(P25-P75) n
Median minutes
Inter-quantile range
(P25-P75) n
Median minutes
Inter-quantile range
(P25-P75) 15-24 3,028 22.85 56.28 3,020 12.85 30.00 6,048 17.14 42.85 25-34 2,973 15.00 40.00 2,991 12.85 25.71 5,964 12.85 30.00 35-44 3,005 12.85 38.57 2,982 12.85 30.00 5,987 12.85 34.28 45-54 2,967 17.14 38.57 2,990 17.14 32.00 5,957 17.14 38.57 55-64 2,945 20.00 60.00 2,938 8.57 30.00 5,883 12.85 42.85 15-64 14,918 17.14 51.42 14,921 12.85 30.00 29,839 15.00 34.28
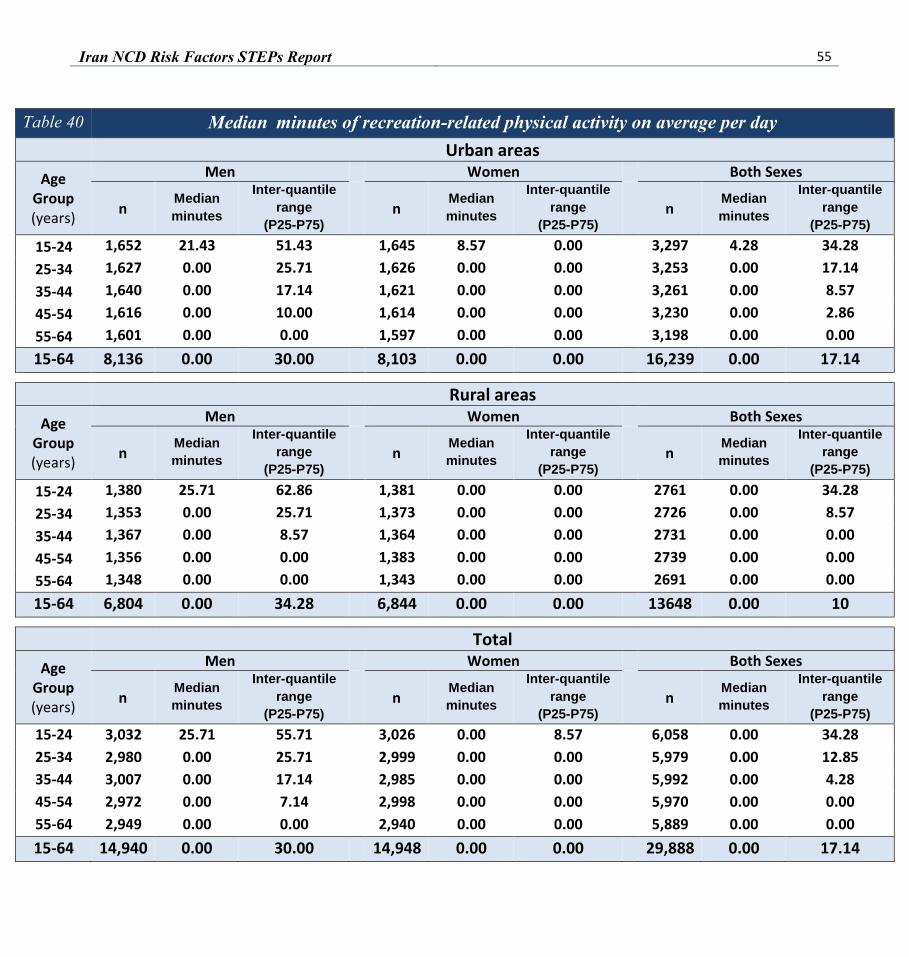
Iran NCD Risk Factors STEPs Report 55
Table 40 Median minutes of recreation-related physical activity on average per day Urban areas
Age Group (years)
Men Women Both Sexes
n Median minutes
Inter-quantile range
(P25-P75) n
Median minutes
Inter-quantile range
(P25-P75) n
Median minutes
Inter-quantile range
(P25-P75) 15-24 1,652 21.43 51.43 1,645 8.57 0.00 3,297 4.28 34.28 25-34 1,627 0.00 25.71 1,626 0.00 0.00 3,253 0.00 17.14 35-44 1,640 0.00 17.14 1,621 0.00 0.00 3,261 0.00 8.57 45-54 1,616 0.00 10.00 1,614 0.00 0.00 3,230 0.00 2.86 55-64 1,601 0.00 0.00 1,597 0.00 0.00 3,198 0.00 0.00 15-64 8,136 0.00 30.00 8,103 0.00 0.00 16,239 0.00 17.14
Rural areas Age
Group (years)
Men Women Both Sexes
n Median minutes
Inter-quantile range
(P25-P75) n
Median minutes
Inter-quantile range
(P25-P75) n
Median minutes
Inter-quantile range
(P25-P75) 15-24 1,380 25.71 62.86 1,381 0.00 0.00 2761 0.00 34.28 25-34 1,353 0.00 25.71 1,373 0.00 0.00 2726 0.00 8.57 35-44 1,367 0.00 8.57 1,364 0.00 0.00 2731 0.00 0.00 45-54 1,356 0.00 0.00 1,383 0.00 0.00 2739 0.00 0.00 55-64 1,348 0.00 0.00 1,343 0.00 0.00 2691 0.00 0.00 15-64 6,804 0.00 34.28 6,844 0.00 0.00 13648 0.00 10
Total Age
Group (years)
Men Women Both Sexes
n Median minutes
Inter-quantile range
(P25-P75) n
Median minutes
Inter-quantile range
(P25-P75) n
Median minutes
Inter-quantile range
(P25-P75) 15-24 3,032 25.71 55.71 3,026 0.00 8.57 6,058 0.00 34.28 25-34 2,980 0.00 25.71 2,999 0.00 0.00 5,979 0.00 12.85 35-44 3,007 0.00 17.14 2,985 0.00 0.00 5,992 0.00 4.28 45-54 2,972 0.00 7.14 2,998 0.00 0.00 5,970 0.00 0.00 55-64 2,949 0.00 0.00 2,940 0.00 0.00 5,889 0.00 0.00 15-64 14,940 0.00 30.00 14,948 0.00 0.00 29,888 0.00 17.14

56 Iran NCD Risk Factors STEPs Report
Table 41 No work -related physical activity Urban areas
Age Group (years)
Men Women Both Sexes
n %no
activity at work
%95CI n %no
activity at work
%95CI n %no
activity at work
%95CI
15-24 1,652 63.9 [62.44,65.33] 1,645 69.87 [68.32,71.38] 3,297 66.86 [65.72,67.97] 25-34 1,627 50.57 [49.42,51.72] 1,626 65.10 [63.91,66.28] 3,253 57.71 [56.79,58.63] 35-44 1,640 52.24 [51.45,53.02] 1,621 61.80 [60.96,62.63] 3,261 56.92 [56.29,57.56] 45-54 1,616 58.7 [58.04,59.36] 1,614 64.66 [64.10,65.22] 3,230 61.65 [61.14,62.15] 55-64 1,601 67.87 [67.62,68.11] 1,597 70.09 [69.81,70.38] 3,198 69.00 [68.77,69.23] 15-64 8,136 57.86 [54.49,61.16] 8,103 66.52 [63.05,69.82] 16,239 62.14 [59.36,64.84]
Rural areas Age
Group (years)
Men Women Both Sexes
n %no
activity at work
%95CI n %no
activity at work
%95CI n %no
activity at work
%95CI
15-24 1,380 41.62 [40.42,42.83] 1,381 55.5 [54.37,56.61] 2,761 48.49 [47.56,49.42] 25-34 1,353 26.19 [25.26,27.13] 1,373 47.59 [46.54,48.64] 2,726 36.71 [36.02,37.41] 35-44 1,367 28.43 [27.76,29.11] 1,364 42.51 [41.72,43.31] 2,731 35.33 [34.82,35.85] 45-54 1,356 34.39 [33.99,34.79] 1,383 46.39 [45.96,46.82] 2,739 40.31 [39.99,40.64] 55-64 1,348 41.32 [41.07,41.58] 1,343 55.25 [54.92,55.57] 2,691 48.39 [48.15,48.63] 15-64 6,804 34.21 [32.13,36.35] 6,844 49.91 [46.94,52.88] 13,648 41.96 [39.93,44.02]
Total Age
Group (years)
Men Women Both Sexes
n %no
activity at work
%95CI n %no
activity at work
%95CI n %no
activity at work
%95CI
15-24 3,032 55.70 [54.69,56.70] 3,026 64.57 [63.57,65.56] 6,058 60.09 [59.29,60.88] 25-34 2,980 42.09 [41.30,42.89] 2,999 58.95 [58.10,59.80] 5,979 50.38 [49.70,51.05] 35-44 3,007 44.11 [43.53,44.68] 2,985 55.06 [54.49,55.63] 5,992 49.48 [49.01,49.94] 45-54 2,972 50.29 [49.90,50.69] 2,998 58.26 [57.83,58.68] 5,970 54.22 [53.89,54.55] 55-64 2,949 58.86 [58.67,59.05] 2,940 64.87 [64.64,65.09] 5,889 61.91 [61.73,62.09] 15-64 14,940 49.52 [47.41,51.64] 14,948 60.60 [58.13,63.02] 29,888 55.00 [53.00,56.97]
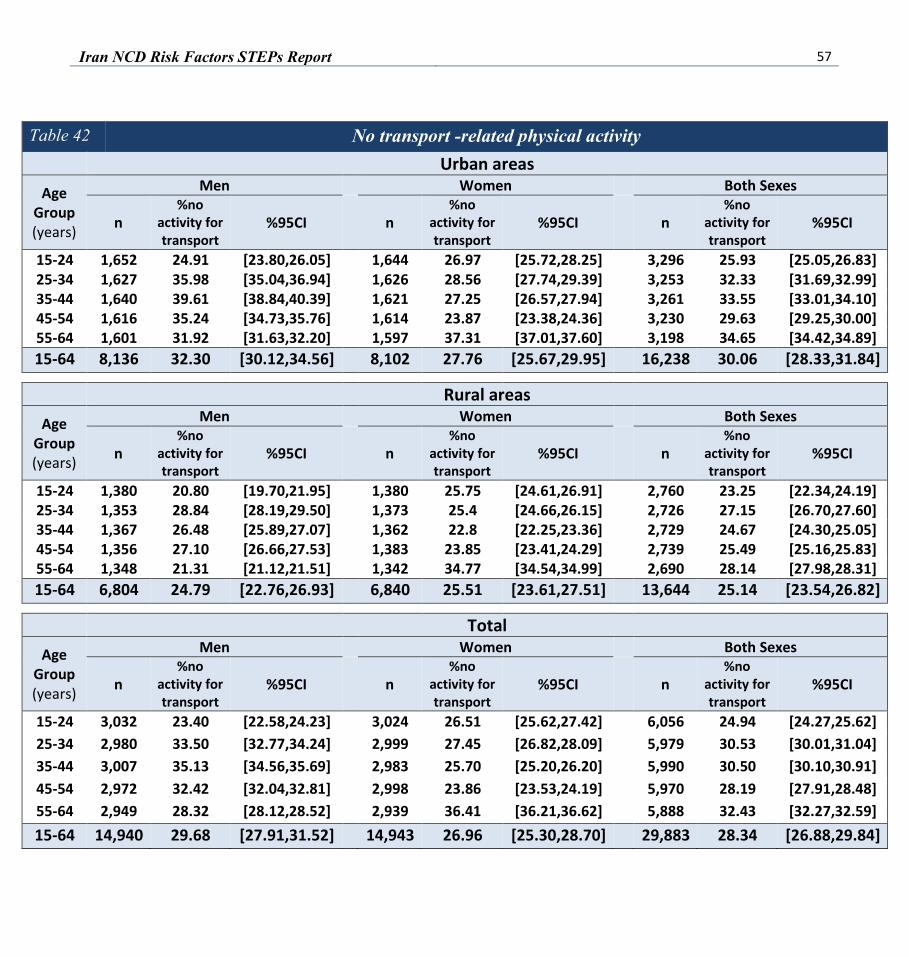
Iran NCD Risk Factors STEPs Report 57
Table 42 No transport -related physical activity Urban areas
Age Group (years)
Men Women Both Sexes
n %no
activity for transport
%95CI n %no
activity for transport
%95CI n %no
activity for transport
%95CI
15-24 1,652 24.91 [23.80,26.05] 1,644 26.97 [25.72,28.25] 3,296 25.93 [25.05,26.83] 25-34 1,627 35.98 [35.04,36.94] 1,626 28.56 [27.74,29.39] 3,253 32.33 [31.69,32.99] 35-44 1,640 39.61 [38.84,40.39] 1,621 27.25 [26.57,27.94] 3,261 33.55 [33.01,34.10] 45-54 1,616 35.24 [34.73,35.76] 1,614 23.87 [23.38,24.36] 3,230 29.63 [29.25,30.00] 55-64 1,601 31.92 [31.63,32.20] 1,597 37.31 [37.01,37.60] 3,198 34.65 [34.42,34.89] 15-64 8,136 32.30 [30.12,34.56] 8,102 27.76 [25.67,29.95] 16,238 30.06 [28.33,31.84]
Rural areas Age
Group (years)
Men Women Both Sexes
n %no
activity for transport
%95CI n %no
activity for transport
%95CI n %no
activity for transport
%95CI
15-24 1,380 20.80 [19.70,21.95] 1,380 25.75 [24.61,26.91] 2,760 23.25 [22.34,24.19] 25-34 1,353 28.84 [28.19,29.50] 1,373 25.4 [24.66,26.15] 2,726 27.15 [26.70,27.60] 35-44 1,367 26.48 [25.89,27.07] 1,362 22.8 [22.25,23.36] 2,729 24.67 [24.30,25.05] 45-54 1,356 27.10 [26.66,27.53] 1,383 23.85 [23.41,24.29] 2,739 25.49 [25.16,25.83] 55-64 1,348 21.31 [21.12,21.51] 1,342 34.77 [34.54,34.99] 2,690 28.14 [27.98,28.31] 15-64 6,804 24.79 [22.76,26.93] 6,840 25.51 [23.61,27.51] 13,644 25.14 [23.54,26.82]
Total Age
Group (years)
Men Women Both Sexes
n %no
activity for transport
%95CI n %no
activity for transport
%95CI n %no
activity for transport
%95CI
15-24 3,032 23.40 [22.58,24.23] 3,024 26.51 [25.62,27.42] 6,056 24.94 [24.27,25.62] 25-34 2,980 33.50 [32.77,34.24] 2,999 27.45 [26.82,28.09] 5,979 30.53 [30.01,31.04] 35-44 3,007 35.13 [34.56,35.69] 2,983 25.70 [25.20,26.20] 5,990 30.50 [30.10,30.91] 45-54 2,972 32.42 [32.04,32.81] 2,998 23.86 [23.53,24.19] 5,970 28.19 [27.91,28.48] 55-64 2,949 28.32 [28.12,28.52] 2,939 36.41 [36.21,36.62] 5,888 32.43 [32.27,32.59] 15-64 14,940 29.68 [27.91,31.52] 14,943 26.96 [25.30,28.70] 29,883 28.34 [26.88,29.84]

58 Iran NCD Risk Factors STEPs Report
Table 43 No recreation-related physical activity Urban areas
Age Group (years)
Men Women Both Sexes
n %no
activity at recreation
%95CI n %no
activity at recreation
%95CI n %no
activity at recreation
%95CI
15-24 1,652 29.83 [28.54,31.17] 1,645 66.63 [65.42,67.81] 3,297 48.05 [46.97,49.13] 25-34 1,627 50.82 [49.81,51.82] 1,626 75.63 [74.78,76.46] 3,253 63.01 [62.23,63.78] 35-44 1,640 60.38 [59.58,61.16] 1,621 78.39 [77.67,79.10] 3,261 69.21 [68.67,69.74] 45-54 1,616 68.46 [67.96,68.95] 1,614 80.68 [80.26,81.10] 3,230 74.50 [74.19,74.80] 55-64 1,601 75.84 [75.62,76.07] 1,597 90.77 [90.64,90.90] 3,198 83.43 [83.29,83.56] 15-64 8,136 48.94 [46.56,51.33] 8,103 74.58 [72.46,76.59] 16,239 61.61 [59.65,63.53]
Rural areas Age
Group (years)
Men Women Both Sexes
n %no
activity at recreation
%95CI n %no
activity at recreation
%95CI n %no
activity at recreation
%95CI
15-24 1,380 32.92 [31.81,34.06] 1,381 76.64 [75.42,77.81] 2,761 54.57 [53.65,55.48] 25-34 1,353 58.82 [58.05,59.58] 1,373 82.85 [81.83,83.81] 2,726 70.63 [70.08,71.17] 35-44 1,367 72.11 [71.41,72.80] 1,364 86.13 [85.45,86.78] 2,731 78.98 [78.42,79.53] 45-54 1,356 82.30 [81.92,82.67] 1,383 88.11 [87.70,88.51] 2,739 85.17 [84.83,85.50] 55-64 1,348 88.63 [88.46,88.78] 1,343 93.68 [93.54,93.82] 2,691 91.19 [91.07,91.32] 15-64 6,804 56.93 [54.91,58.92] 6,844 82.63 [80.03,84.95] 13,648 69.62 [67.90,71.30]
Total Age
Group (years)
Men Women Both Sexes
n %no
activity at recreation
%95CI n %no
activity at recreation
%95CI n %no
activity at recreation
%95CI
15-24 3,032 30.97 [30.09,31.87] 3,026 70.36 [69.50,71.21] 6,058 50.48 [49.78,51.17] 25-34 2,980 53.60 [52.84,54.35] 2,999 78.16 [77.50,78.81] 5,979 65.67 [65.13,66.21] 35-44 3,007 64.39 [63.83,64.94] 2,985 81.10 [80.64,81.54] 5,992 72.58 [72.22,72.93] 45-54 2,972 73.25 [72.90,73.60] 2,998 83.29 [82.98,83.59] 5,970 78.21 [77.97,78.44] 55-64 2,949 80.18 [80.01,80.36] 2,940 91.80 [91.69,91.90] 5,889 86.08 [85.98,86.18] 15-64 14,940 51.72 [50.00,53.44] 14,948 77.49 [75.97,78.93] 29,888 64.45 [63.13,65.74]
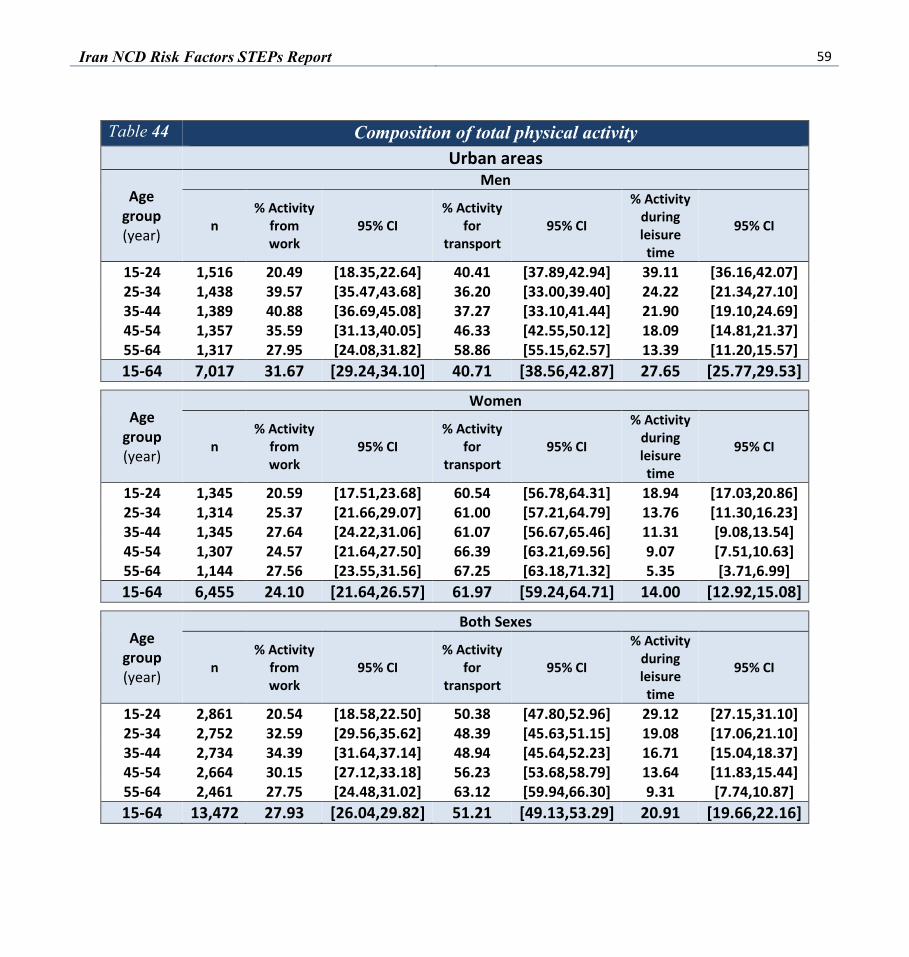
Iran NCD Risk Factors STEPs Report 59
Table 44 Composition of total physical activity Urban areas
Age group (year)
Men
n % Activity
from work
95% CI % Activity
for transport
95% CI
% Activity during leisure time
95% CI
15-24 1,516 20.49 [18.35,22.64] 40.41 [37.89,42.94] 39.11 [36.16,42.07] 25-34 1,438 39.57 [35.47,43.68] 36.20 [33.00,39.40] 24.22 [21.34,27.10] 35-44 1,389 40.88 [36.69,45.08] 37.27 [33.10,41.44] 21.90 [19.10,24.69] 45-54 1,357 35.59 [31.13,40.05] 46.33 [42.55,50.12] 18.09 [14.81,21.37] 55-64 1,317 27.95 [24.08,31.82] 58.86 [55.15,62.57] 13.39 [11.20,15.57] 15-64 7,017 31.67 [29.24,34.10] 40.71 [38.56,42.87] 27.65 [25.77,29.53]
Age group (year)
Women
n % Activity
from work
95% CI % Activity
for transport
95% CI
% Activity during leisure time
95% CI
15-24 1,345 20.59 [17.51,23.68] 60.54 [56.78,64.31] 18.94 [17.03,20.86] 25-34 1,314 25.37 [21.66,29.07] 61.00 [57.21,64.79] 13.76 [11.30,16.23] 35-44 1,345 27.64 [24.22,31.06] 61.07 [56.67,65.46] 11.31 [9.08,13.54] 45-54 1,307 24.57 [21.64,27.50] 66.39 [63.21,69.56] 9.07 [7.51,10.63] 55-64 1,144 27.56 [23.55,31.56] 67.25 [63.18,71.32] 5.35 [3.71,6.99] 15-64 6,455 24.10 [21.64,26.57] 61.97 [59.24,64.71] 14.00 [12.92,15.08]
Age group (year)
Both Sexes
n % Activity
from work
95% CI % Activity
for transport
95% CI
% Activity during leisure time
95% CI
15-24 2,861 20.54 [18.58,22.50] 50.38 [47.80,52.96] 29.12 [27.15,31.10] 25-34 2,752 32.59 [29.56,35.62] 48.39 [45.63,51.15] 19.08 [17.06,21.10] 35-44 2,734 34.39 [31.64,37.14] 48.94 [45.64,52.23] 16.71 [15.04,18.37] 45-54 2,664 30.15 [27.12,33.18] 56.23 [53.68,58.79] 13.64 [11.83,15.44] 55-64 2,461 27.75 [24.48,31.02] 63.12 [59.94,66.30] 9.31 [7.74,10.87] 15-64 13,472 27.93 [26.04,29.82] 51.21 [49.13,53.29] 20.91 [19.66,22.16]

60 Iran NCD Risk Factors STEPs Report
Table 45 Composition of total physical activity Rural areas
Age group (year)
Men
n % Activity from work 95% CI
% Activity for
transport 95% CI
% Activity during leisure time
95% CI
15-24 1299 36.86 [34.18,39.54] 33.11 [30.64,35.58] 30.16 [28.54,31.78] 25-34 1238 59.57 [56.50,62.64] 26.73 [24.59,28.86] 13.88 [12.06,15.71] 35-44 1248 58.25 [55.06,61.44] 32.91 [30.03,35.79] 8.83 [7.679,9.98] 45-54 1188 55.94 [53.33,58.55] 38.52 [35.63,41.42] 5.72 [4.28,7.17] 55-64 1164 48.27 [44.33,52.21] 48.12 [44.14,52.10] 3.61 [2.68,4.55] 15-64 6137 49.94 [48.06,51.82] 33.09 [31.48,34.71] 17.09 [16.27,17.91]
Age group (year)
Women
n % Activity from work 95% CI
% Activity for
transport 95% CI
% Activity during leisure time
95% CI
15-24 1,164 34.66 [31.81,37.52] 54.78 [51.75,57.81] 10.73 [8.58,12.88] 25-34 1,184 42.23 [38.83,45.60] 49.64 [46.63,52.66] 8.23 [5.73,10.73] 35-44 1,182 45.87 [41.75,49.99] 49.30 [45.87,52.73] 4.93 [3.24,6.63] 45-54 1,163 44.12 [40.52,47.71] 51.71 [48.12,55.30] 4.38 [3.05,5.70] 55-64 1,034 40.99 [37.09,44.89] 56.19 [52.60,59.78] 2.83 [1.75,3.90] 15-64 5,727 40.31 [37.63,42.99] 52.16 [49.66,54.66] 7.67 [6.367,8.96]
Age group (year)
Both Sexes
n % Activity from work 95% CI
% Activity for
transport 95% CI
% Activity during leisure time
95% CI
15-24 2,463 35.77 [33.57,37.98] 43.84 [41.63,46.05] 20.54 [19.09,22.00] 25-34 2,422 51.05 [48.82,53.28] 37.99 [36.04,39.94] 11.11 [9.74,12.48] 35-44 2,430 52.18 [50.02,54.34] 40.95 [38.92,42.97] 6.92 [5.83,8.01] 45-54 2,351 50.10 [47.63,52.58] 45.03 [42.50,47.57] 5.06 [3.88,6.23] 55-64 2,198 44.57 [41.28,47.87] 52.22 [49.12,55.31] 3.21 [2.38,4.05] 15-64 11,864 45.18 [43.37,46.50] 42.51 [40.82,44.20] 12.43 [11.69,13.17]

Iran NCD Risk Factors STEPs Report 61
Table 46 Composition of total physical activity Total areas
Age group (year)
Men
n % Activity from work 95% CI
% Activity for
transport 95% CI
% Activity during leisure time
95% CI
15-24 2,815 26.59 [24.73,28.45] 37.69 [35.79,39.60] 35.77 [33.84,37.70] 25-34 2,676 46.69 [44.01,49.36] 32.84 [30.63,35.05] 20.54 [18.54,22.54] 35-44 2,637 47.06 [44.33,49.79] 35.71 [33.02,38.41] 17.24 [15.16,19.33] 45-54 2,545 42.79 [39.97,45.60] 43.57 [40.71,46.44] 13.71 [11.60,15.82] 55-64 2,481 35.15 [32.52,37.77] 55.04 [52.36,57.72] 9.92 [8.30,11.54] 15-64 13,154 38.26 [36.66,39.86] 37.95 [36.46,39.46] 23.84 [22.53,25.14]
Age group (year)
Women
n % Activity from work 95% CI
% Activity for
transport 95% CI
% Activity during leisure time
95% CI
15-24 2,509 25.94 [23.85,2.02] 58.35 [56.04,60.66] 15.82 [14.28,17.35] 25-34 2,498 31.51 [29.01,34.01] 56.86 [54.20,59.52] 11.74 [10.10,13.39] 35-44 2,527 34.18 [31.83,36.53] 56.85 [54.30,59.39] 9.02 [7.62,10.41] 45-54 2,471 31.54 [29.07,34.06] 61.15 [58.63,63.67] 7.39 [6.25,8.53] 55-64 2,178 32.39 [29.46,35.32] 63.26 [60.21,66.31] 4.44 [3.39,5.49] 15-64 12,183 30.05 [28.29,31.80] 58.39 [56.57,60.22] 11.65 [10.80,12.51]
Age group (year)
Both Sexes
n % Activity from work 95% CI
% Activity for
transport 95% CI
% Activity during leisure time
95% CI
15-24 5,324 26.27 [24.75,27.79] 47.92 [46.26,49.58] 25.89 [24.57,27.21] 25-34 5,174 39.23 [37.18,41.28] 44.64 [42.73,46.55] 16.21 [14.91,17.52] 35-44 5,164 40.74 [38.82,42.67] 46.07 [44.05,48.10] 13.21 [11.97,14.45] 45-54 5,016 37.23 [35.10,39.37] 52.25 [50.15,54.35] 10.59 [9.31,11.87] 55-64 4,659 33.75 [31.50,35.99] 59.21 [56.94,61.48] 7.14 [6.12,8.15] 15-64 25,337 34.20 [32.80,35.60] 48.05 [46.65,49.46] 17.82 [16.96,18.68]

62 Iran NCD Risk Factors STEPs Report
Table 47 No vigorous-related physical activity Urban areas
Age Group (years)
Men Women Both Sexes
n %no
activity for transport
%95CI n %no
activity for transport
%95CI n %no
activity for transport
%95CI
15-24 1,651 41.9 [40.47,43.34] 1,644 85.99 [84.75,87.14] 3,295 63.73 [62.63,64.81] 25-34 1,625 55.89 [55.09,56.69] 1,624 90.76 [90.04,91.42] 3,249 73.03 [72.49,73.55] 35-44 1,639 64.46 [63.83,65.09] 1,618 89.52 [88.94,90.08] 3,257 76.75 [76.37,77.11] 45-54 1,615 74.19 [73.70,74.67] 1,611 92.90 [92.58,93.2] 3,226 83.43 [83.08,83.76] 55-64 1,600 84.98 [84.82,85.14] 1,596 93.30 [93.08,93.51] 3,196 89.20 [89.06,89.35] 15-64 8,130 56.70 [54.60,58.79] 8,093 89.26 [86.82,91.29] 16,223 72.79 [71.05,74.46]
Rural areas Age
Group (years)
Men Women Both Sexes
n %no
activity for transport
%95CI n %no
activity for transport
%95CI n %no
activity for transport
%95CI
15-24 1,380 31.73 [43.54,45.28] 1,380 84.90 [83.84,85.90] 2,760 58.06 [57.27,58.83] 25-34 1,352 44.41 [43.54,45.28] 1,373 84.21 [83.50,84.91] 2,725 63.97 [63.42,64.52] 35-44 1,366 49.40 [48.72,50.07] 1,361 82.75 [82.21,83.26] 2,727 65.74 [65.28,66.21] 45-54 1,354 59.65 [59.13,60.17] 1,382 83.63 [83.28,83.96] 2,736 71.49 [71.14,71.84] 55-64 1,348 67.19 [66.94,67.44] 1,342 89.13 [88.96,89.30] 2,690 78.33 [78.18,78.48] 15-64 6,800 44.22 [42.09,46.37] 6,838 84.46 [82.30,86.41] 13,638 64.10 [62.55,65.62]
Total Age
Group (years)
Men Women Both Sexes
n %no
activity for transport
%95CI n %no
activity for transport
%95CI n %no
activity for transport
%95CI
15-24 3,031 38.15 [37.28,39.03] 3,023 85.61 [84.84,86.35] 6,054 61.65 [61.02,62.28] 25-34 2,977 51.90 [51.24,52.56] 2,997 88.46 [87.93,88.96] 5,974 69.87 [69.44,70.28] 35-44 3,005 59.31 [58.81,59.81] 2,979 87.15 [86.74,87.55] 5,984 72.96 [72.63,73.28] 45-54 2,969 69.16 [68.81,69.51] 2,994 89.65 [89.42,89.88] 5,963 79.28 [79.03,79.52] 55-64 2,948 78.94 [78.79,79.09] 2,938 91.83 [91.69,91.97] 5,886 85.49 [85.37,85.60] 15-64 14,930 52.32 [50.74,53.89] 14,931 87.58 [85.98,89.02] 29,861 69.74 [68.53,70.92]

Iran NCD Risk Factors STEPs Report 63
Table 48 Minutes spent in sedentary activities on average per day Urban areas
Age group (year)
Men
n Mean minutes 95% CI Median
minutes
Inter-quartile range
(P25-P75) 15-24 1,652 270.35 [258.29,282.40] 240 180 25-34 1,627 248.64 [234.79,262.50] 240 240 35-44 1,640 250.43 [239.25,261.61] 240 240 45-54 1,616 277.34 [260.99,293.69] 240 197.5 55-64 1,601 306.55 [291.59,321.50] 300 240 15-64 8,136 264.29 [253.56,275.03] 240 110
Age group (year)
Women
n Mean minutes 95% CI Median
minutes
Inter-quartile range
(P25-P75) 15-24 1,645 308.25 [296.03,320.47] 300 240 25-34 1,626 266.94 [254.68,279.21] 240 240 35-44 1,621 252.51 [237.07,267.95] 240 210 45-54 1,614 273.85 [259.45,288.26] 240 180 55-64 1,597 297.10 [283.86,310.35] 240 240 15-64 8,103 282.25 [271.50,293.01] 240 180
Age group (year)
Both Sexes
n Mean minutes 95% CI Median
minutes
Inter-quartile range
(P25-P75) 15-24 3,297 289.11 [278.49,299.74] 260 210 25-34 3,253 257.64 [246.32,268.95] 240 240 35-44 3,261 251.45 [239.78,263.11] 240 240 45-54 3,230 275.62 [262.84,288.40] 240 180 55-64 3,198 301.75 [289.49,314.01] 300 240 15-64 16,239 273.17 [263.21,283.12] 240 180

64 Iran NCD Risk Factors STEPs Report
Table 49 Minutes spent in sedentary activities on average per day Rural areas
Age group (year)
Men
n Mean minutes 95% CI Median
minutes
Inter-quartile range
(P25-P75) 15-24 1,380 248.48 [234.80,262.17] 240 167.5 25-34 1,353 238.69 [226.97,250.41] 240 180 35-44 1,367 241.93 [229.57,254.29] 240 180 45-54 1,356 246.25 [234.21,258.29] 240 180 55-64 1,348 276.06 [263.08,289.04] 240 180 15-64 6,804 246.26 [236.20,256.32] 240 180
Age group (year)
Women
n Mean minutes 95% CI Median
minutes
Inter-quartile range
(P25-P75) 15-24 1,381 284.82 [267.82,301.81] 270 240 25-34 1,373 254.50 [240.35,268.65] 240 180 35-44 1,364 245.94 [232.38,259.49] 240 225 45-54 1,383 250.40 [237.22,263.57] 240 240 55-64 1,343 291.77 [276.80,306.74] 240 240 15-64 6,844 266.00 [253.43,278.56] 240 180
Age group (year)
Both Sexes
n Mean minutes 95% CI Median
minutes
Inter-quartile range
(P25-P75) 15-24 2,761 266.47 [252.74,280.21] 240 180 25-34 2,726 246.46 [235.13,257.79] 240 205 35-44 2,731 243.89 [233.90,253.88] 240 180 45-54 2,739 248.30 [238.05,258.55] 240 220 55-64 2,691 284.04 [271.88,296.19] 240 210 15-64 13,648 256.01 [245.56,266.45] 240 180

Iran NCD Risk Factors STEPs Report 65
Table 50 Minutes spent in sedentary activities on average per day Total
Age group (year)
Men
n Mean minutes 95% CI Median
minutes
Inter-quartile range
(P25-P75) 15-24 3,032 262.30 [253.52,271.07] 240.00 180.00 25-34 2,980 245.18 [234.98,255.38] 240.00 210.00 35-44 3,007 247.53 [238.45,256.60] 240.00 210.00 45-54 2,972 266.58 [255.85,277.31] 240.00 195.00 55-64 2,949 296.20 [285.38,307.01] 240.00 240.00 15-64 14,940 257.89 [250.01,265.78] 240.00 210.00
Age group (year)
Women
n Mean minutes 95% CI Median
minutes
Inter-quartile range
(P25-P75) 15-24 3,026 299.50 [309.84,309.15] 300.00 240.00 25-34 2,999 262.57 [252.26,272.88] 240.00 180.00 35-44 2,985 250.21 [240.31,260.11] 240.00 210.00 45-54 2,998 265.64 [254.75,276.52] 240.00 210.00 55-64 2,940 295.22 [284.84,305.61] 240.00 240.00 15-64 14,948 276.36 [267.93,284.78] 240.00 180.00
Age group (year)
Both Sexes
n Mean minutes 95% CI Median
minutes
Inter-quartile range
(P25-P75) 15-24 6,058 280.72 [272.77,288.67] 240.00 180.00 25-34 5,979 253.73 [244.70,262.76] 240.00 220.00 35-44 5,992 248.84 [240.55,257.13] 240.00 210.00 45-54 5,970 266.12 [256.92,275.31] 240.00 210.00 55-64 5,889 295.70 [286.46,304.94] 240.00 240.00 15-64 29,888 267.02 [259.42,274.61] 240.00 180.00

66 Iran NCD Risk Factors STEPs Report
5. Blood Pressure and Diabetes History The histories of raised blood pressure and diabet diagnosis and treatment results were
assessed among all participants. They were asked about if they have been told by a doctor or other health worker elevated blood pressure (hypertension) and diabetes during the past 12 months, currently receiving any of the following treatments/advice for high blood pressure or diabetes prescribed by a doctor or other health worker, drugs (medication) that they have taken, percentage of respondents who received lifestyle advice from a doctor or health worker to treat raised blood pressure and diabetes and who currently taking any herbal or traditional remedy for high blood pressure or diabetes. All datas analysed by sex and age groups are as follows:
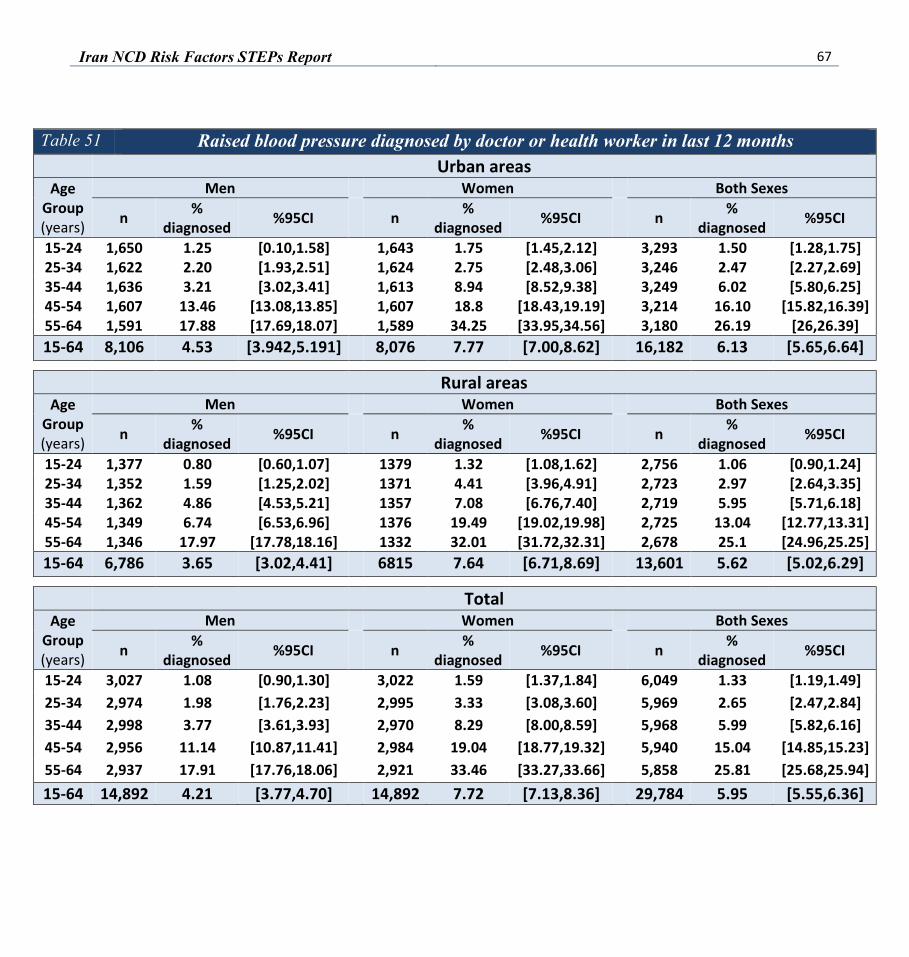
Iran NCD Risk Factors STEPs Report 67
Table 51 Raised blood pressure diagnosed by doctor or health worker in last 12 months Urban areas
Age Group (years)
Men Women Both Sexes
n % diagnosed %95CI n %
diagnosed %95CI n % diagnosed %95CI
15-24 1,650 1.25 [0.10,1.58] 1,643 1.75 [1.45,2.12] 3,293 1.50 [1.28,1.75] 25-34 1,622 2.20 [1.93,2.51] 1,624 2.75 [2.48,3.06] 3,246 2.47 [2.27,2.69] 35-44 1,636 3.21 [3.02,3.41] 1,613 8.94 [8.52,9.38] 3,249 6.02 [5.80,6.25] 45-54 1,607 13.46 [13.08,13.85] 1,607 18.8 [18.43,19.19] 3,214 16.10 [15.82,16.39] 55-64 1,591 17.88 [17.69,18.07] 1,589 34.25 [33.95,34.56] 3,180 26.19 [26,26.39] 15-64 8,106 4.53 [3.942,5.191] 8,076 7.77 [7.00,8.62] 16,182 6.13 [5.65,6.64]
Rural areas Age
Group (years)
Men Women Both Sexes
n % diagnosed %95CI n %
diagnosed %95CI n % diagnosed %95CI
15-24 1,377 0.80 [0.60,1.07] 1379 1.32 [1.08,1.62] 2,756 1.06 [0.90,1.24] 25-34 1,352 1.59 [1.25,2.02] 1371 4.41 [3.96,4.91] 2,723 2.97 [2.64,3.35] 35-44 1,362 4.86 [4.53,5.21] 1357 7.08 [6.76,7.40] 2,719 5.95 [5.71,6.18] 45-54 1,349 6.74 [6.53,6.96] 1376 19.49 [19.02,19.98] 2,725 13.04 [12.77,13.31] 55-64 1,346 17.97 [17.78,18.16] 1332 32.01 [31.72,32.31] 2,678 25.1 [24.96,25.25] 15-64 6,786 3.65 [3.02,4.41] 6815 7.64 [6.71,8.69] 13,601 5.62 [5.02,6.29]
Total Age
Group (years)
Men Women Both Sexes
n % diagnosed %95CI n %
diagnosed %95CI n % diagnosed %95CI
15-24 3,027 1.08 [0.90,1.30] 3,022 1.59 [1.37,1.84] 6,049 1.33 [1.19,1.49] 25-34 2,974 1.98 [1.76,2.23] 2,995 3.33 [3.08,3.60] 5,969 2.65 [2.47,2.84] 35-44 2,998 3.77 [3.61,3.93] 2,970 8.29 [8.00,8.59] 5,968 5.99 [5.82,6.16] 45-54 2,956 11.14 [10.87,11.41] 2,984 19.04 [18.77,19.32] 5,940 15.04 [14.85,15.23] 55-64 2,937 17.91 [17.76,18.06] 2,921 33.46 [33.27,33.66] 5,858 25.81 [25.68,25.94] 15-64 14,892 4.21 [3.77,4.70] 14,892 7.72 [7.13,8.36] 29,784 5.95 [5.55,6.36]

68 Iran NCD Risk Factors STEPs Report
Table 52 Currently taking blood pressure drugs prescribed by doctor or health worker Urban areas
Age Group (years)
Men Women Both Sexes
n % taking meds %95CI n % taking
meds %95CI n % taking meds %95CI
15-24 1,599 0.42 [0.29,0.62] 1,597 0.19 [0.12,0.31] 3,196 0.31 [0.23,0.41] 25-34 1,576 1.41 [1.14,1.75] 1,583 1.17 [0.99,1.38] 3,159 1.29 [1.13,1.47] 35-44 1,591 1.96 [1.73,2.22] 1,582 4.06 [3.82,4.31] 3,173 2.99 [2.81,3.18] 45-54 1,573 10.96 [10.60,11.32] 1,581 17.96 [17.55,18.37] 3,154 14.41 [14.13,14.70] 55-64 1,563 17.72 [17.54,17.89] 1,572 36.61 [36.34,36.87] 3,135 27.31 [27.15,27.47] 15-64 7,902 3.46 [2.93,4.07] 7,915 5.97 [5.41,6.58] 15,817 4.70 [4.29,5.14]
Rural areas Age
Group (years)
Men Women Both Sexes
n % taking meds %95CI n % taking
meds %95CI N % taking meds %95CI
15-24 1,341 0.02 [0.01,0.04] 1,335 0.70 [0.50,0.99] 2,676 0.36 [0.26,0.50] 25-34 1,315 1.17 [0.87,1.56] 1,337 2.01 [1.68,2.39] 2,652 1.58 [1.29,1.93] 35-44 1,334 2.56 [2.30,2.86] 1,326 5.07 [4.76,5.40] 2,660 3.79 [3.59,4.00] 45-54 1,324 5.21 [5.00,5.43] 1,351 17.74 [17.21,18.27] 2,675 11.4 [11.11,11.69] 55-64 1,319 15.29 [15.08,15.50] 1,320 29.06 [28.8,29.33] 2,639 22.28 [22.13,22.44] 15-64 6,633 2.47 [2.04,2.98] 6,669 6.00 [5.146,6.98] 13,302 4.21 [3.77,4.70]
Total Age
Group (years)
Men Women Both Sexes
n % taking meds %95CI n % taking
meds %95CI N % taking meds %95CI
15-24 2,940 0.27 [0.19,0.39] 2,932 0.38 [0.29,0.50] 5,872 0.33 [0.26,0.40] 25-34 2,891 1.33 [1.12,1.57] 2,920 1.46 [1.29,1.65] 5,811 1.39 [1.24,1.56] 35-44 2,925 2.17 [2.03,2.30] 2,908 4.41 [4.21,4.61] 5,833 3.27 [3.15,3.38] 45-54 2,897 8.96 [8.73,9.20] 2,933 17.88 [17.59,18.16] 5,830 13.37 [13.18,13.55] 55-64 2,882 16.89 [16.76,17.02] 2,892 33.95 [33.76,34.14] 5,774 25.55 [25.43,25.67] 15-64 14,535 3.11 [2.74,3.52] 14,585 5.98 [5.50,6.47] 29,120 4.53 [4.22,4.87]

Iran NCD Risk Factors STEPs Report 69
Table 53 Advised by doctor or health worker to have special prescribed diet Urban areas
Age Group (years)
Men Women Both Sexes
n % %95CI n % %95CI N % %95CI
15-24 1,598 0.40 [0.28,0.57] 1,597 0.77 [0.56,1.06] 3,195 0.58 [0.45,0.76] 25-34 1,576 1.39 [1.16,1.67] 1,583 1.43 [1.24,1.66] 3,159 1.41 [1.23,1.62] 35-44 1,591 3.69 [3.47,3.93] 1,580 7.25 [6.86,7.66] 3,171 5.44 [5.21,5.67] 45-54 1,572 9.19 [8.91,9.48] 1,580 14.97 [14.61,15.33] 3,152 12.04 [11.79,12.30] 55-64 1,562 14.96 [14.80,15.11] 1,567 34.27 [34.00,34.55] 3,129 24.77 [24.61,24.92] 15-64 7,899 3.36 [2.84,3.97] 7,907 6.28 [5.46,7.22] 15,806 4.80 [4.22,5.46]
Rural areas Age
Group (years)
Men Women Both Sexes
n % %95CI n % %95CI N % %95CI
15-24 1,341 0.31 [0.22,0.45] 1,333 1.13 [0.85,1.49] 2,674 0.72 [.57,.897] 25-34 1,315 1.66 [1.40,1.96] 1,336 2.73 [2.40,3.11] 2,651 2.19 [1.94,2.47] 35-44 1,334 2.91 [2.70,3.14] 1,325 6.32 [5.98,6.69] 2,659 4.59 [4.407,4.77] 45-54 1,324 7.08 [6.82,7.35] 1,350 17.76 [17.38,18.15] 2,674 12.35 [12.1,12.61] 55-64 1,318 15.94 [15.74,16.15] 1,320 28.86 [28.60,29.12] 2,638 22.50 [22.34,22.66] 15-64 6,632 3.05 [2.55,3.64] 6,664 6.55 [5.63,7.62] 13,296 4.78 [4.17,5.47]
Total Age
Group (years)
Men Women Both Sexes
n % %95CI n % %95CI n % %95CI
15-24 2,939 0.36 [0.29,0.48] 2,930 0.90 [0.73,1.12] 5,869 0.63 [.5356,.7516] 25-34 2,891 1.48 [1.31,1.69] 2,919 1.89 [1.72,2.08] 5,810 1.68 [1.541,1.844] 35-44 2,925 3.42 [3.26,3.60] 2,905 6.92 [6.66,7.20] 5,830 5.14 [4.973,5.314] 45-54 2,896 8.46 [8.26,8.66] 2,931 15.94 [15.71,16.18] 5,827 12.15 [11.99,12.32] 55-64 2,880 15.29 [15.17,15.41] 2,887 32.36 [32.16,32.56] 5,767 23.96 [23.83,24.08] 15-64 14,531 3.24 [2.88,3.659] 14,572 6.38 [5.826,6.983] 29,103 4.79 [4.421,5.201]

70 Iran NCD Risk Factors STEPs Report
Table 54 Advised by doctor or health worker to lose weight Urban areas
Age Group (years)
Men Women Both Sexes
n % %95CI n % %95CI n % %95CI
15-24 1,598 0.79 [0.59,1.05] 1,597 0.42 [0.29,0.60] 3,195 0.60 [0.49,0.75] 25-34 1,576 1.08 [0.88,1.30] 1,583 2.09 [1.84,2.37] 3,159 1.58 [1.40,1.77] 35-44 1,591 3.41 [3.18,3.66] 1,581 5.91 [5.58,6.26] 3,172 4.64 [4.46,4.83] 45-54 1,573 8.69 [8.38,9.00] 1,580 12.96 [12.65,13.28] 3,153 10.8 [10.59,11.01] 55-64 1,561 12.11 [11.94,12.27] 1,568 24.43 [24.19,24.67] 3,129 18.36 [18.21,18.52] 15-64 7,899 3.11 [2.49,3.88] 7,909 5.13 [4.41,5.98] 15,808 4.11 [3.61,4.68]
Rural areas Age
Group (years)
Men Women Both Sexes
n % %95CI n % %95CI n % %95CI
15-24 1,341 0.35 [0.23,0.53] 1,332 0.996 [0.71,1.39] 2,673 0.67 [0.52,0.87] 25-34 1,315 1.27 [1.03,1.55] 1,336 2.98 [2.60,3.41] 2,651 2.11 [1.83,2.42] 35-44 1,334 2.43 [2.23,2.60] 1,325 5.59 [5.22,5.98] 2,659 3.98 [3.78,4.19] 45-54 1,324 3.88 [3.70,4.06] 1,349 12.87 [12.52,13.22] 2,673 8.32 [8.12,8.51] 55-64 1,318 8.89 [8.75,9.03] 1,320 19.4 [19.16,19.64] 2,638 14.23 [14.08,14.37] 15-64 6,632 1.99 [1.61,2.46] 6,662 5.15 [4.16,6.36] 13,294 3.55 [2.97,4.25]
Total Age
Group (years)
Men Women Both Sexes
n % %95CI n % %95CI n % %95CI
15-24 2,939 0.62 [0.49,0.78] 2,929 0.63 [0.50,0.79] 5,868 0.62 [0.53,0.73] 25-34 2,891 1.14 [1.00,1.30] 2,919 2.40 [2.19,2.64] 5,810 1.76 [1.61,1.92] 35-44 2,925 3.07 [2.90,3.25] 2,906 5.80 [5.56,6.04] 5,831 4.41 [4.26,4.56] 45-54 2,897 7.02 [6.81,7.23] 2,930 12.93 [12.70,13.16] 5,827 9.93 [9.78,10.09] 55-64 2,879 11.01 [10.89,11.13] 2,888 22.65 [22.48,22.83] 5,767 16.92 [16.81,17.04] 15-64 14,531 2.72 [2.33,3.16] 14,572 5.14 [4.57,5.77] 29,103 3.918 [3.55,4.32]

Iran NCD Risk Factors STEPs Report 71
Table 55 Advised by doctor or health worker to stop smoking Urban areas
Age Group (years)
Men Women Both Sexes
n % %95CI n % %95CI n % %95CI
15-24 1,596 1.02 [0.72,1.43] 1,597 1.05 [0.74,1.49] 3,193 1.03 [0.74,1.44] 25-34 1,576 1.67 [1.38,2.03] 1,581 0.78 [0.58,1.05] 3,157 1.24 [1.02,1.50] 35-44 1,589 3.01 [2.78,3.25] 1,581 2.30 [2.08,2.55] 3,170 2.66 [2.48,2.86] 45-54 1,572 6.06 [5.80,6.33] 1,579 1.89 [1.77,2.00] 3,151 3.99 [3.86,4.14] 55-64 1,560 7.67 [7.54,7.80] 1,568 4.58 [4.46,4.69] 3,128 6.10 [6.02,6.18] 15-64 7,893 2.64 [1.90,3.66] 7,906 1.56 [0.96,2.53] 15,799 2.11 [1.48,3.00]
Rural areas Age
Group (years)
Men Women Both Sexes
n % %95CI n % %95CI n % %95CI
15-24 1,340 0.60 [0.40,0.89] 1,331 0.31 [0.17,0.57] 2,671 0.46 [0.29,0.71] 25-34 1,315 2.02 [1.71,2.38] 1,335 0.85 [0.62,1.18] 2,650 1.45 [1.20,1.74] 35-44 1,333 3.57 [3.32,3.80] 1,324 1.65 [1.46,1.87] 2,657 2.63 [2.48,2.79] 45-54 1,324 4.39 [4.13,4.66] 1,348 3.27 [3.10,3.45] 2,672 3.84 [3.68,4.01] 55-64 1,318 6.16 [6.06,6.26] 1,319 5.23 [5.11,5.35] 2,637 5.69 [5.61,5.76] 15-64 6,630 2.37 [1.73,3.25] 6,657 1.42 [0.83,2.40] 13,287 1.90 [1.32,2.73]
Total Age
Group (years)
Men Women Both Sexes
n % %95CI n % %95CI n % %95CI
15-24 2,936 0.86 [0.65,1.14] 2,928 0.77 [0.55,1.08] 5,864 0.81 [0.60,1.10] 25-34 2,891 1.79 [1.58,2.04] 2,916 0.80 [0.66,0.98] 5,807 1.31 [1.15,1.48] 35-44 2,922 3.20 [3.02,3.39] 2,905 2.07 [1.90,2.26] 5,827 2.65 [2.50,2.79] 45-54 2,896 5.47 [5.30,5.66] 2,928 2.36 [2.27,2.46] 5,824 3.94 [3.83,4.05] 55-64 2,878 7.15 [7.05,7.26] 2,887 4.80 [4.72,4.89] 5,765 5.96 [5.89,6.02] 15-64 14,523 2.54 [1.99,3.24] 14,564 1.50 [1.02,2.20] 29,087 2.03 [1.54,2.66]

72 Iran NCD Risk Factors STEPs Report
Table 56 Advised by doctor or health worker to start or do more exercise Urban areas
Age Group (years)
Men Women Both Sexes
n % %95CI n % %95CI n % %95CI
15-24 1,598 1.39 [1.09,1.76] 1,597 0.62 [0.46,0.84] 3,195 1.01 [0.83,1.23] 25-34 1,576 2.75 [2.40,3.16] 1,583 2.02 [1.74,2.34] 3,159 2.39 [2.14,2.67] 35-44 1,591 4.20 [3.91,4.51] 1,581 7.06 [6.67,7.47] 3,172 5.60 [5.35,5.87] 45-54 1,572 11.33 [10.97,11.71] 1,580 13.41 [13.08,13.73] 3,152 12.36 [12.09,12.63] 55-64 1,561 14.62 [14.41,14.82] 1,568 23.44 [23.19,23.69] 3,129 19.1 [18.93,19.26] 15-64 7,898 4.41 [3.58,5.42] 7,909 5.39 [4.58,6.33] 15,807 4.89 [4.21,5.68]
Rural areas Age
Group (years)
Men Women Both Sexes
n % %95CI n % %95CI n % %95CI
15-24 1,340 0.33 [0.22,0.49] 1,331 1.21 [0.89,1.65] 2,671 0.77 [0.60,0.98] 25-34 1,315 2.11 [1.78,2.50] 1,335 2.39 [2.07,2.76] 2,650 2.25 [1.97,2.57] 35-44 1,333 3.49 [3.23,3.77] 1,324 5.69 [5.31,6.10] 2,657 4.57 [4.35,4.80] 45-54 1,324 4.13 [3.95,4.32] 1,350 11.44 [11.05,11.84] 2,674 7.74 [7.51,7.96] 55-64 1,318 10.56 [10.41,10.70] 1,320 18.09 [17.89,18.30] 2,638 14.38 [14.26,14.51] 15-64 6,630 2.54 [2.02,3.19] 6,660 4.82 [3.76,6.16] 13,290 3.67 [2.98,4.50]
Total Age
Group (years)
Men Women Both Sexes
n % %95CI n % %95CI n % %95CI
15-24 2,938 0.99 [0.81,1.22] 2,928 0.84 [0.69,1.02] 5,866 0.92 [0.79,1.07] 25-34 2,891 2.53 [2.28,2.81] 2,918 2.14 [1.95,2.36] 5,809 2.34 [2.16,2.54] 35-44 2,924 3.96 [3.75,4.18] 2,905 6.58 [6.32,6.85] 5,829 5.24 [5.08,5.42] 45-54 2,896 8.84 [8.61,9.07] 2,931 12.71 [12.48,12.95] 5,827 10.75 [10.57,10.93] 55-64 2,879 13.23 [13.10,13.37] 2,888 21.55 [21.37,21.73] 5,767 17.46 [17.34,17.58] 15-64 14,528 3.76 [3.21,4.38] 14,570 5.192 [4.61,5.84] 29,098 4.46 [3.99,4.98]

Iran NCD Risk Factors STEPs Report 73
Table 57 Currently taking herbal or traditional remedy for high blood pressure Urban areas
Age Group (years)
Men Women Both Sexes
n % %95CI n % %95CI n % %95CI
15-24 1,600 0.26 [0.15,0.43] 1,600 0.04 [0.03,0.08] 3,200 0.15 [0.10,0.24] 25-34 1,577 0.51 [0.36,0.72] 1,586 0.25 [0.19,0.33] 3,163 0.38 [0.30,0.49] 35-44 1,594 0.82 [0.74,0.92] 1,585 2.20 [1.99,2.44] 3,179 1.50 [1.39,1.62] 45-54 1,575 1.93 [1.79,2.08] 1,583 3.87 [3.71,4.05] 3,158 2.89 [2.78,3.00] 55-64 1,563 5.94 [5.81,6.08] 1,572 9.19 [9.03,9.35] 3,135 7.59 [7.48,7.71] 15-64 7,909 1.02 [0.76,1.36] 7,926 1.62 [1.32,2.00] 15,835 1.31 [1.13,1.53]
Rural areas Age
Group (years)
Men Women Both Sexes
n % %95CI n % %95CI n % %95CI
15-24 1,342 0.04 [0.02,0.07] 1,333 0.12 [0.06,0.25] 2,675 0.08 [0.04,0.14] 25-34 1,317 0.19 [0.13,0.26] 1,339 0.45 [0.36,0.58] 2,656 0.32 [0.26,0.38] 35-44 1,334 0.07 [0.06,0.09] 1,328 1.47 [1.31,1.65] 2,662 0.76 [0.68,0.85] 45-54 1,325 2.36 [2.24,2.50] 1,351 3.91 [3.75,4.08] 2,676 3.13 [3.01,3.24] 55-64 1,318 3.82 [3.71,3.94] 1,321 8.52 [8.39,8.65] 2,639 6.21 [6.14,6.28] 15-64 6,636 0.63 [0.47,0.84] 6,672 1.53 [1.17,1.99] 13,308 1.07 [0.87,1.32]
Total Age
Group (years)
Men Women Both Sexes
n % %95CI n % %95CI n % %95CI
15-24 2,942 0.17 [0.11,0.27] 2,933 0.07 [0.04,0.11] 5,875 0.12 [0.08,0.17] 25-34 2,894 0.39 [0.29,0.53] 2,925 0.32 [0.26,0.38] 5,819 0.35 [0.29,0.43] 35-44 2,928 0.56 [0.50,0.63] 2,913 1.94 [1.80,2.10] 5,841 1.24 [1.16,1.32] 45-54 2,900 2.08 [1.98,2.17] 2,935 3.88 [3.76,4.01] 5,835 2.97 [2.89,3.05] 55-64 2,881 5.22 [5.13,5.31] 2,893 8.95 [8.85,9.06] 5,774 7.11 [7.04,7.19] 15-64 14,545 0.88 [0.70,1.11] 14,599 1.58 [1.35,1.86] 29,144 1.23 [1.08,1.40]

74 Iran NCD Risk Factors STEPs Report
Table 58 Diabetes diagnosed by doctor or health worker in last 12 months Urban areas
Age Group (years)
Men Women Both Sexes
n % diagnosed %95CI n %
diagnosed %95CI n % diagnosed %95CI
15-24 217 1.32 [0.88,1.97] 377 2.37 [1.63,3.44] 594 1.84 [1.41,2.39] 25-34 417 2.45 [1.88,3.19] 603 4.24 [3.72,4.84] 1,020 3.33 [2.90,3.83] 35-44 614 5.18 [4.58,5.86] 777 7.96 [7.29,8.68] 1,391 6.54 [6.10,7.02] 45-54 708 10.09 [9.68,10.52] 918 15.04 [14.57,15.53] 1,626 12.54 [12.26,12.83] 55-64 818 16.65 [16.38,16.93] 1,036 25.11 [24.86,25.36] 1,854 20.95 [20.76,21.13] 15-64 2,774 4.47 [3.30,6.029] 3,711 7.08 [5.93,8.45] 6,485 5.76 [4.88,6.78]
Rural areas Age
Group (years)
Men Women Both Sexes
n % diagnosed %95CI n %
diagnosed %95CI n % diagnosed %95CI
15-24 95 1.46 [0.70,3.00] 207 1.67 [1.12,2.50] 302 1.57 [1.05,2.34] 25-34 237 3.30 [2.56,4.23] 430 3.95 [3.30,4.70] 667 3.62 [3.16,4.13] 35-44 393 4.12 [3.73,4.53] 593 8.83 [8.15,9.57] 986 6.43 [6.05,6.82] 45-54 487 8.98 [8.62,9.36] 703 12.92 [12.52,13.32] 1,190 10.92 [10.63,11.22] 55-64 528 13.11 [12.82,13.41] 689 16.56 [16.30,16.82] 1,217 14.86 [14.67,15.06] 15-64 1,740 4.16 [2.92,5.90] 2,622 6.04 [4.76,7.65] 4,362 5.09 [4.16,6.22]
Total Age
Group (years)
Men Women Both Sexes
N % diagnosed %95CI n %
diagnosed %95CI n % diagnosed %95CI
15-24 312 1.35 [0.94,1.93] 584 2.16 [1.58,2.94] 896 1.75 [1.39,2.21] 25-34 654 2.70 [2.23,3.27] 1,033 4.15 [3.74,4.59] 1,687 3.41 [3.09,3.76] 35-44 1,007 4.87 [4.46,5.32] 1,370 8.24 [7.76,8.74] 2,377 6.52 [6.20,6.86] 45-54 1,195 9.77 [9.46,10.10] 1,622 14.38 [14.05,14.71] 2,817 12.05 [11.83,12.27] 55-64 1,346 15.63 [15.41,15.85] 1,725 22.51 [22.31,22.72] 3,071 19.13 [18.97,19.28] 15-64 4,514 4.38 [3.51,5.45] 6,334 6.76 [5.81,7.86] 10,848 5.56 [4.86,6.34]

Iran NCD Risk Factors STEPs Report 75
Table 59 Currently taking insulin prescribed for diabetes by doctor or health worker Urban areas
Age Group (years)
Men Women Both Sexes
n % taking insulin %95CI n % taking
insulin %95CI n % taking insulin %95CI
15-24 7 39.84 [26.5,54.87] 9 6.68 [2.97,14.32] 16 23.42 [16.40,32.28] 25-34 13 11.12 [6.65,18.01] 33 19.58 [14.41,26.04] 46 15.28 [11.63,19.80] 35-44 44 2.334 [1.74,3.13] 94 8.89 [7.01,11.2] 138 5.55 [4.55,6.74] 45-54 115 15.62 [14.36,16.98] 192 2.19 [1.95,2.46] 307 8.99 [8.33,9.70] 55-64 219 14.31 [13.76,14.89] 347 12.97 [12.63,13.31] 566 13.63 [13.32,13.94] 15-64 398 20.62 [9.80,38.32] 675 10.29 [4.35,22.41] 1,073 15.52 [9.09,25.21]
Rural areas Age
Group (years)
Men Women Both Sexes
n % taking insulin %95CI n % taking
insulin %95CI n % taking insulin %95CI
15-24 3 26.65 [11.44,50.52] 9 25.21 [15.06,39.06] 12 25.94 [16.51,38.28] 25-34 8 7.42 [4.32,12.47] 27 13.54 [9.49,18.95] 35 25.94 [7.73,13.93] 35-44 31 7.60 [6.10,9.42] 58 5.17 [4.12,6.48] 89 6.41 [5.349,7.66] 45-54 58 9.93 [9.14,10.78] 118 11.38 [10.51,12.33] 176 10.65 [10.02,11.30] 55-64 92 11.29 [10.42,12.23] 146 5.99 [5.71,6.28] 238 8.61 [8.10,9.12] 15-64 192 14.95 [3.36,47.05] 358 15.44 [6.24,33.36] 550 15.19 [6.86,30.33]
Total Age
Group (years)
Men Women Both Sexes
n % taking insulin %95CI n % taking
insulin %95CI n % taking insulin %95CI
15-24 10 38.3 [26.31,51.91] 18 14.1 [9.01,21.40] 28 26.32 [19.73,34.17] 25-34 21 9.95 [6.753,14.45] 60 17.22 [13.64,21.51] 81 13.53 [11.03,16.49] 35-44 75 3.65 [3.05,4.37] 152 7.50 [6.20,9.04] 227 5.54 [4.814,6.373] 45-54 173 14.37 [13.29,15.53] 311 5.09 [4.77,5.42] 484 9.79 [9.231,10.38] 55-64 311 13.60 [13.16,14.06] 493 11.32 [11.07,11.58] 804 12.44 [12.19,12.70] 15-64 590 19.81 [9.463,36.85] 1,034 12.36 [6.639,21.87] 1,624 16.13 [9.746,25.51]

76 Iran NCD Risk Factors STEPs Report
Table 60 Currently taking oral drugs prescribed for diabetes by doctor or health worker Urban areas
Age Group (years)
Men Women Both Sexes
n % taking meds %95CI n % taking
meds %95CI n % taking meds %95CI
15-24 7 50.84 [35.35,66.17] 9 27.3 [15.97,42.60] 16 39.18 [28.06,51.56] 25-34 13 17.15 [11.16,25.43] 33 19.72 [15.94,24.14] 46 18.41 [14.49,23.11] 35-44 43 42.12 [37.02,47.38] 96 19.72 [39.81,44.02] 139 42.01 [39.21,44.86] 45-54 115 67.26 [65.20,69.24] 193 72.38 [71.01,73.71] 308 69.79 [68.39,71.15] 55-64 219 77.38 [76.84,77.91] 349 80.05 [79.69,80.41] 568 78.74 [78.43,79.04] 15-64 397 44.29 [25.76,64.56] 680 37.45 [24.69,52.22] 1,077 40.91 [27.59,55.71]
Rural areas Age
Group (years)
Men Women Both Sexes
n % taking meds %95CI n % taking
meds %95CI n % taking meds %95CI
15-24 3 36.68 [27.27,47.22] 9 0 --- 12 18.52 [13.94,24.18] 25-34 8 32.00 [22.94,42.65] 27 42.67 [34.77,50.96] 35 37.24 [31.02,43.92] 35-44 31 56.78 [52.02,61.42] 58 64.16 [61.56,66.68] 89 60.40 [57.94,62.80] 45-54 58 52.79 [50.78,54.78] 119 63.94 [62.52,65.32] 177 58.29 [57.13,59.45] 55-64 93 68.92 [68.28,69.56] 146 71.96 [71.31,72.60] 239 70.46 [69.97,70.95] 15-64 193 43.37 [29.77,58.03] 359 35.91 [26.67,46.33] 552 39.68 [30.97,49.10]
Total Age
Group (years)
Men Women Both Sexes
n % taking meds %95CI n % taking
meds %95CI n % taking meds %95CI
15-24 10 49.19 [36.13,62.36] 18 16.36 [10.49,24.62] 28 32.94 [25.79,40.98] 25-34 21 21.81 [16.25,28.61] 60 28.68 [23.82,34.08] 81 25.18 [21.35,29.45] 35-44 74 45.81 [42.23,49.43] 154 50.06 [48.17,51.96] 228 47.89 [45.88,49.92] 45-54 173 64.08 [62.62,65.52] 313 69.59 [68.57,70.60] 486 66.80 [65.82,67.77] 55-64 312 75.38 [74.92,75.84] 495 78.15 [77.84,78.47] 807 76.79 [76.51,77.06] 15-64 590 45.05 [30.44,60.57] 1,040 36.8 [27.87,46.75] 1,630 40.98 [32.08,50.51]

Iran NCD Risk Factors STEPs Report 77
Table 61 Advised by doctor or health worker to have special prescribed diet Urban areas
Age Group (years)
Men Women Both Sexes
n % %95CI n % %95CI n % %95CI
15-24 7 58.02 [43.01,71.68] 9 76.93 [62.68,86.87] 16 67.38 [58.92,74.84] 25-34 13 8.72 [5.513,13.53] 33 81.54 [77.93,84.67] 46 44.51 [41.77,47.28] 35-44 43 68.59 [63.58,73.21] 95 70.67 [68.29,72.95] 138 69.61 [66.94,72.16] 45-54 115 83.3 [81.95,84.57] 192 85.03 [84.32,85.72] 307 84.15 [83.33,84.95] 55-64 219 68.64 [67.89,69.37] 348 78.67 [78.24,79.09] 567 73.73 [73.33,74.13] 15-64 397 51.03 [35.20,66.66] 677 78.14 [61.96,88.69] 1,074 64.42 [56.33,71.76]
Rural areas Age
Group (years)
Men Women Both Sexes
n % %95CI n % %95CI n % %95CI
15-24 3 63.32 [52.78,72.73] 9 46.42 [34.36,58.90] 12 54.95 [48.11,61.62] 25-34 8 46.84 [36.77,57.18] 27 32.39 [25.86,39.69] 35 39.74 [33.78,46.02] 35-44 31 91.81 [90.09,93.25] 58 62.28 [58.60,65.82] 89 77.33 [75.05,79.46] 45-54 56 82.98 [81.06,84.74] 119 76.89 [75.44,78.27] 177 79.97 [78.92,80.99] 55-64 92 68.25 [67.00,69.47] 146 86.12 [85.65,86.58] 238 77.33 [76.62,78.01] 15-64 192 67.12 [50.36,80.42] 359 52.35 [37.56,66.74] 551 59.82 [49.44,69.39]
Total Age
Group (years)
Men Women Both Sexes
n % %95CI n % %95CI n % %95CI
15-24 10 58.63 [45.29,70.82] 18 64.70 [53.71,74.34] 28 61.64 [53.01,69.59] 25-34 21 20.68 [15.54,26.99] 60 62.35 [56.99,67.44] 81 41.16 [37.35,45.09] 35-44 74 74.44 [70.42,78.08] 153 67.57 [65.39,69.67] 227 71.07 [68.82,73.22] 45-54 173 83.23 [82.26,84.16] 312 82.48 [81.75,83.19] 485 82.86 [82.26,83.44] 55-64 311 68.54 [67.93,69.15] 494 80.42 [80.05,80.79] 805 74.58 [74.23,74.92] 15-64 589 55.44 [40.42,69.53] 1,037 67.99 [54.55,78.99] 1,626 61.64 [52.36,70.14]

78 Iran NCD Risk Factors STEPs Report
Table 62 Advised by doctor or health worker to lose weight Urban areas
Age Group (years)
Men Women Both Sexes
n % %95CI n % %95CI n % %95CI
15-24 7 59.57 [42.81,74.35] 9 17.85 [9.995,29.82] 16 38.91 [29.37,49.38] 25-34 13 6.67 [4.188,10.46] 33 52.79 [45.80,59.68] 46 29.34 [25.54,33.45] 35-44 43 56.99 [52.01,61.83] 95 61.97 [59.62,64.27] 138 59.43 [56.92,61.89] 45-54 115 55.59 [53.94,57.22] 192 65.15 [64.02,66.26] 307 60.31 [59.35,61.25] 55-64 219 46.84 [46.19,47.48] 347 53.20 [52.70,53.69] 566 50.07 [49.66,50.47] 15-64 397 43.92 [28.73,60.34] 676 43.43 [31.55,56.10] 1,073 43.68 [33.38,54.54]
Rural areas Age
Group (years)
Men Women Both Sexes
n % %95CI n % %95CI n % %95CI
15-24 3 26.65 [11.44,50.52] 9 48.33 [36.25,60.60] 12 37.38 [27.85,48.01] 25-34 8 56.54 [46.08,66.45] 27 22.22 [17.24,28.16] 35 39.67 [34.11,45.52] 35-44 31 59.42 [55.44,63.28] 58 57.94 [54.28,61.52] 89 58.70 [55.88,61.46] 45-54 58 63.53 [61.44,65.57] 119 48.54 [46.94,50.14] 177 56.13 [54.85,57.40] 55-64 92 44.77 [43.64,45.90] 146 50.21 [49.51,50.91] 238 47.53 [46.84,48.23] 15-64 192 46.42 [25.42,68.77] 359 43.48 [31.03,56.82] 551 44.97 [33.15,57.39]
Total Age
Group (years)
Men Women Both Sexes
n % %95CI n % %95CI n % %95CI
15-24 10 55.74 [41.70,68.92] 18 30.06 [21.38,40.45] 28 43.02 [34.81,51.64] 25-34 21 22.31 [16.78,29.03] 60 40.86 [35.71,46.22] 81 31.43 [27.52,35.62] 35-44 74 57.60 [53.73,61.38] 153 60.48 [58.25,62.66] 227 59.01 [56.77,61.21] 45-54 173 57.33 [55.84,58.80] 312 59.95 [58.98,60.91] 485 58.62 [57.72,59.52] 55-64 311 46.35 [45.77,46.93] 493 52.49 [52.09,52.89] 804 49.47 [49.11,49.83] 15-64 589 46.93 [32.41,61.99] 1,036 43.77 [32.90,55.28] 1,625 45.37 [35.70,55.41]
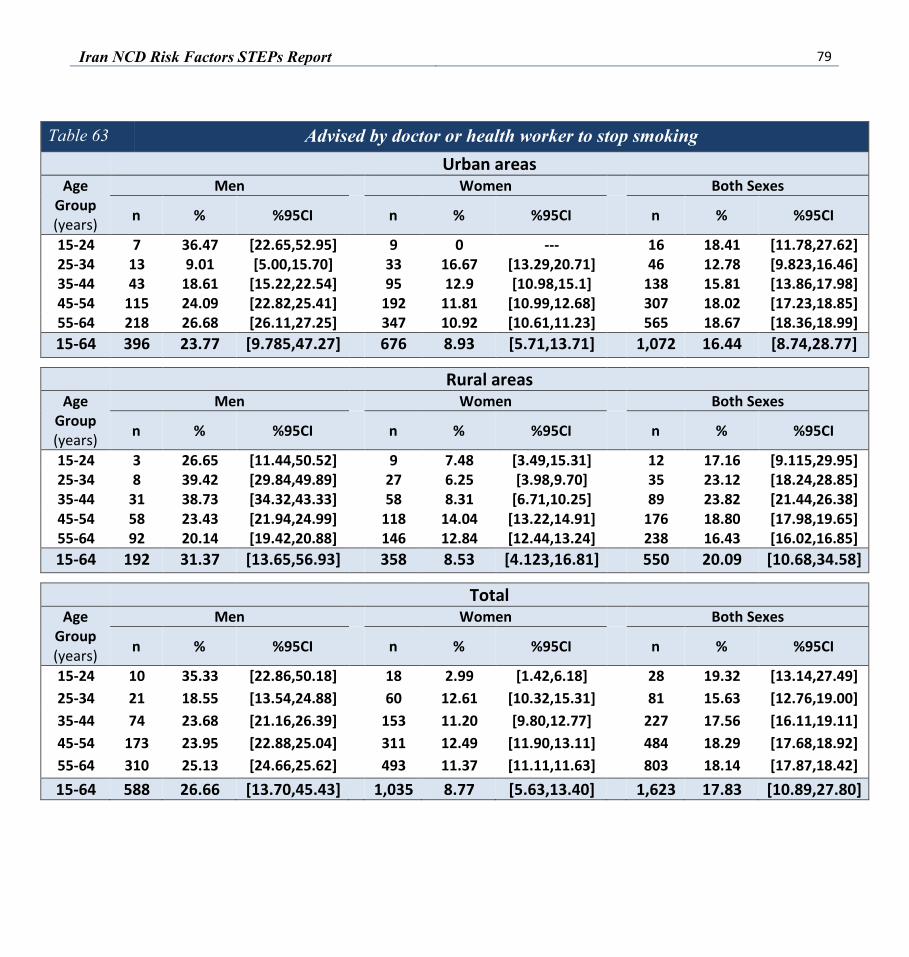
Iran NCD Risk Factors STEPs Report 79
Table 63 Advised by doctor or health worker to stop smoking Urban areas
Age Group (years)
Men Women Both Sexes
n % %95CI n % %95CI n % %95CI
15-24 7 36.47 [22.65,52.95] 9 0 --- 16 18.41 [11.78,27.62] 25-34 13 9.01 [5.00,15.70] 33 16.67 [13.29,20.71] 46 12.78 [9.823,16.46] 35-44 43 18.61 [15.22,22.54] 95 12.9 [10.98,15.1] 138 15.81 [13.86,17.98] 45-54 115 24.09 [22.82,25.41] 192 11.81 [10.99,12.68] 307 18.02 [17.23,18.85] 55-64 218 26.68 [26.11,27.25] 347 10.92 [10.61,11.23] 565 18.67 [18.36,18.99] 15-64 396 23.77 [9.785,47.27] 676 8.93 [5.71,13.71] 1,072 16.44 [8.74,28.77]
Rural areas Age
Group (years)
Men Women Both Sexes
n % %95CI n % %95CI n % %95CI
15-24 3 26.65 [11.44,50.52] 9 7.48 [3.49,15.31] 12 17.16 [9.115,29.95] 25-34 8 39.42 [29.84,49.89] 27 6.25 [3.98,9.70] 35 23.12 [18.24,28.85] 35-44 31 38.73 [34.32,43.33] 58 8.31 [6.71,10.25] 89 23.82 [21.44,26.38] 45-54 58 23.43 [21.94,24.99] 118 14.04 [13.22,14.91] 176 18.80 [17.98,19.65] 55-64 92 20.14 [19.42,20.88] 146 12.84 [12.44,13.24] 238 16.43 [16.02,16.85] 15-64 192 31.37 [13.65,56.93] 358 8.53 [4.123,16.81] 550 20.09 [10.68,34.58]
Total Age
Group (years)
Men Women Both Sexes
n % %95CI n % %95CI n % %95CI
15-24 10 35.33 [22.86,50.18] 18 2.99 [1.42,6.18] 28 19.32 [13.14,27.49] 25-34 21 18.55 [13.54,24.88] 60 12.61 [10.32,15.31] 81 15.63 [12.76,19.00] 35-44 74 23.68 [21.16,26.39] 153 11.20 [9.80,12.77] 227 17.56 [16.11,19.11] 45-54 173 23.95 [22.88,25.04] 311 12.49 [11.90,13.11] 484 18.29 [17.68,18.92] 55-64 310 25.13 [24.66,25.62] 493 11.37 [11.11,11.63] 803 18.14 [17.87,18.42] 15-64 588 26.66 [13.70,45.43] 1,035 8.77 [5.63,13.40] 1,623 17.83 [10.89,27.80]

80 Iran NCD Risk Factors STEPs Report
Table 64 Advised by doctor or health worker to start or do more exercise Urban areas
Age Group (years)
Men Women Both Sexes
n % %95CI n % %95CI n % %95CI
15-24 7 51.68 [36.79,66.28] 9 17.85 [9.99,29.82] 16 34.93 [26.10,44.93] 25-34 13 71.51 [60.46,80.47] 33 50.10 [43.22,56.98] 46 60.99 [54.98,66.68] 35-44 43 55.42 [50.13,60.59] 95 56.93 [53.94,59.87] 138 56.16 [53.17,59.10] 45-54 115 77.00 [75.39,78.53] 192 66.99 [66.13,67.85] 307 72.06 [71.22,72.88] 55-64 219 62.40 [61.87,63.01] 347 54.94 [54.47,55.42] 566 58.64 [58.27,59.00] 15-64 397 61.50 [40.54,78.91] 676 42.10 [30.12,55.23] 1,073 51.95 [39.79,63.89]
Rural areas Age
Group (years)
Men Women Both Sexes
n % %95CI n % %95CI n % %95CI
15-24 3 26.65 [11.44,50.52] 9 59.65 [47.08,71.07] 12 42.99 [33.67,52.84] 25-34 8 63.96 [53.27,73.43] 27 22.85 [17.79,28.84] 35 43.75 [38.19,49.48] 35-44 31 50.85 [46.53,55.15] 58 50.53 [47.1,53.95] 89 50.69 [48.02,53.35] 45-54 58 54.16 [52.05,56.26] 119 43.96 [42.44,45.48] 177 49.12 [47.80,50.45] 55-64 92 49.17 [48.12,50.23] 146 46.38 [45.75,47.00] 238 47.75 [47.13,48.38] 15-64 192 45.87 [24.91,68.41] 359 45.54 [33.28,58.36] 551 45.71 [34.69,57.16]
Total Age
Group (years)
Men Women Both Sexes
n % %95CI n % %95CI n % %95CI
15-24 10 48.77 [35.52,62.20] 18 34.59 [25.07,45.53] 28 41.75 [33.48,50.51] 25-34 21 69.14 [60.97,76.26] 60 39.46 [34.35,44.82] 81 54.55 [49.86,59.17] 35-44 74 54.27 [50.41,58.08] 153 54.56 [52.17,56.93] 227 54.41 [52.18,56.63] 45-54 173 71.99 [70.68,73.26] 312 59.75 [58.84,60.66] 485 65.95 [65.16,66.72] 55-64 311 59.32 [58.75,59.88] 493 52.92 [52.52,53.33] 804 56.07 [55.72,56.42] 15-64 589 58.77 [42.51,73.32] 1,036 43.98 [32.44,56.21] 1,625 51.47 [41.12,61.69]
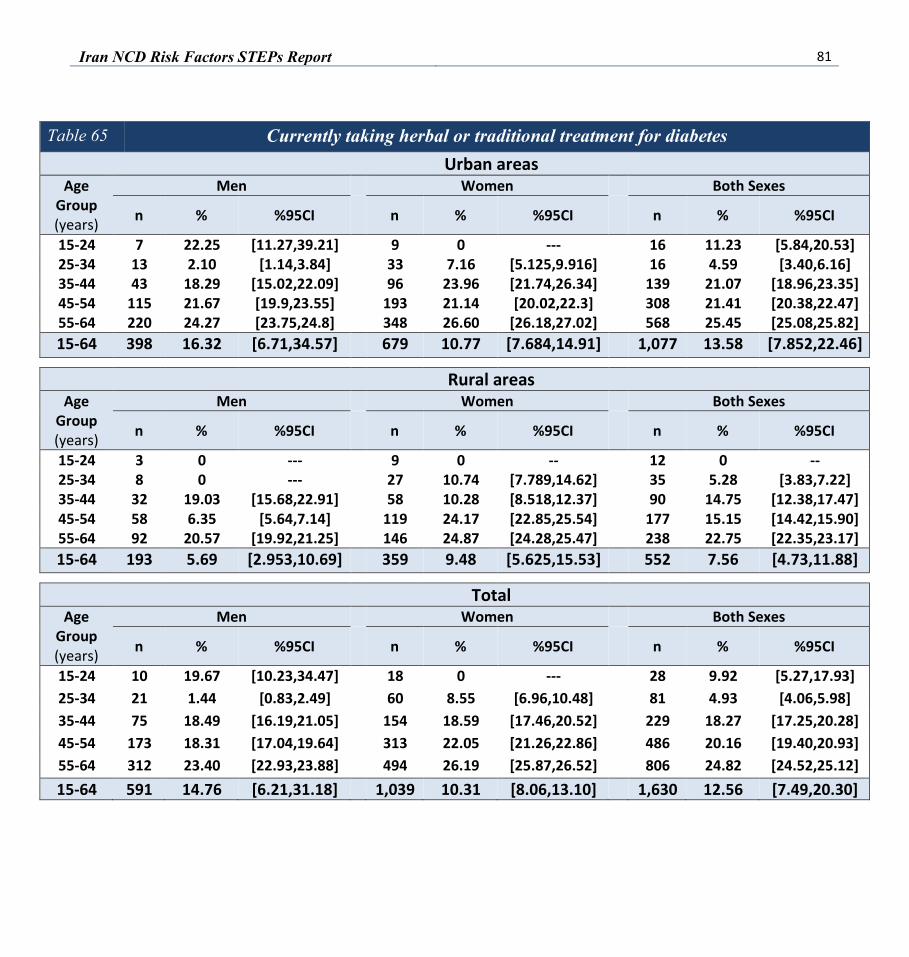
Iran NCD Risk Factors STEPs Report 81
Table 65 Currently taking herbal or traditional treatment for diabetes Urban areas
Age Group (years)
Men Women Both Sexes
n % %95CI n % %95CI n % %95CI
15-24 7 22.25 [11.27,39.21] 9 0 --- 16 11.23 [5.84,20.53] 25-34 13 2.10 [1.14,3.84] 33 7.16 [5.125,9.916] 16 4.59 [3.40,6.16] 35-44 43 18.29 [15.02,22.09] 96 23.96 [21.74,26.34] 139 21.07 [18.96,23.35] 45-54 115 21.67 [19.9,23.55] 193 21.14 [20.02,22.3] 308 21.41 [20.38,22.47] 55-64 220 24.27 [23.75,24.8] 348 26.60 [26.18,27.02] 568 25.45 [25.08,25.82] 15-64 398 16.32 [6.71,34.57] 679 10.77 [7.684,14.91] 1,077 13.58 [7.852,22.46]
Rural areas Age
Group (years)
Men Women Both Sexes
n % %95CI n % %95CI n % %95CI
15-24 3 0 --- 9 0 -- 12 0 -- 25-34 8 0 --- 27 10.74 [7.789,14.62] 35 5.28 [3.83,7.22] 35-44 32 19.03 [15.68,22.91] 58 10.28 [8.518,12.37] 90 14.75 [12.38,17.47] 45-54 58 6.35 [5.64,7.14] 119 24.17 [22.85,25.54] 177 15.15 [14.42,15.90] 55-64 92 20.57 [19.92,21.25] 146 24.87 [24.28,25.47] 238 22.75 [22.35,23.17] 15-64 193 5.69 [2.953,10.69] 359 9.48 [5.625,15.53] 552 7.56 [4.73,11.88]
Total Age
Group (years)
Men Women Both Sexes
n % %95CI n % %95CI n % %95CI
15-24 10 19.67 [10.23,34.47] 18 0 --- 28 9.92 [5.27,17.93] 25-34 21 1.44 [0.83,2.49] 60 8.55 [6.96,10.48] 81 4.93 [4.06,5.98] 35-44 75 18.49 [16.19,21.05] 154 18.59 [17.46,20.52] 229 18.27 [17.25,20.28] 45-54 173 18.31 [17.04,19.64] 313 22.05 [21.26,22.86] 486 20.16 [19.40,20.93] 55-64 312 23.40 [22.93,23.88] 494 26.19 [25.87,26.52] 806 24.82 [24.52,25.12] 15-64 591 14.76 [6.21,31.18] 1,039 10.31 [8.06,13.10] 1,630 12.56 [7.49,20.30]

82 Iran NCD Risk Factors STEPs Report
6. Physical Measurements/ Raised Blood Pressure This part presents data on height, weight, and body mass index among in all respondent participating
in step 2 (excluding pregnant women for weight and BMI). Waist measurement was also taken as a measure of central obesity, which is considered to be a risk factor for cardiovascular diseases.
The prevalence of hypertension (a mean systolic pressure>140 mmHg and/or a mean diastolic pressure> 90 mmHg and/or self-reported current use of anti-hypertensive medication), whether and/ or not they had previously been told by a health worker that they had elevated blood pressure, was identified based on systolic and diastolic measurements of blood pressure in three times among all respondents, excluding those currently on medication for raised blood pressure. Thresholds for hypertension were computed according to the WHO guidelines.
All respondents were asked if they have been treated for raised blood pressure with drugs (medication) prescribed by a doctor or other health worker during the past two weeks.

Iran NCD Risk Factors STEPs Report 83
Anthropometric Index
Table 66 Mean height (cm) Urban areas
Age Group (years)
Men Women
n Mean 95% CI n Mean 95% CI
15-24 1,650 174.06 [173.41,174.71] 1,641 160.47 [160.09,160.85] 25-34 1,627 174.07 [173.54,174.60] 1,616 159.16 [158.64,159.68] 35-44 1,634 172.06 [171.41,172.71] 1,621 158.29 [157.82,158.76] 45-54 1,608 170.32 [169.65,171.00] 1,611 156.65 [156.19,157.11] 55-64 1,598 168.09 [167.52,168.65] 1,592 154.78 [154.26,155.30] 15-64 8,117 172.82 [172.45,173.19] 8,081 158.85 [158.57,159.13]
Rural areas Age
Group (years)
Men Women
n Mean 95% CI n Mean 95% CI
15-24 1,379 170.54 [169.97,171.11] 1,379 157.98 [157.44,158.52] 25-34 1,347 171.53 [171.00,172.07] 1,367 157.23 [156.74,157.72] 35-44 1,360 169.79 [169.22,170.36] 1,361 155.94 [155.47,156.41] 45-54 1,351 168.29 [167.59,168.99] 1,380 155.16 [154.55,155.78] 55-64 1,343 166.72 [166.07,167.36] 1,338 153.71 [153.14,154.29] 15-64 6,780 170.12 [169.83,170.41] 6,825 156.76 [156.41,157.10]
Total Age
Group (years)
Men Women
n Mean 95% CI n Mean 95% CI
15-24 3,029 172.76 [173.33,173.19] 3,020 159.54 [159.20,159.88] 25-34 2,974 173.19 [172.76,173.61] 2,983 158.48 [158.10,158.85] 35-44 2,994 171.28 [170.83,171.73] 2,982 157.47 [157.11,157.82] 45-54 2,959 169.62 [169.18,170.05] 2,992 156.13 [155.79,156.46] 55-64 2,941 167.62 [167.22,168.02] 2,930 154.40 [154.06,154.74] 15-64 14,897 171.86 [171.59,172.12] 14,907 158.09 [157.88,158.30]

84 Iran NCD Risk Factors STEPs Report
Table 67 Mean weight (kg) Urban areas
Age Group (years)
Men Women
n Mean 95% CI n Mean 95% CI
15-24 1,650 69.24 [68.03,70.45] 1,584 58.90 [58.1,59.78] 25-34 1,620 75.53 [74.42,76.65] 1,516 66.19 [65.14,67.23] 35-44 1,630 76.92 [75.63,78.21] 1,577 70.98 [69.77,72.19] 45-54 1,608 76.21 [75.18,77.24] 1,603 71.61 [70.67,72.55] 55-64 1,594 73.90 [72.80,74.99] 1,587 70.81 [69.93,71.70] 15-64 8,102 73.50 [72.88,74.13] 7,867 65.44 [64.89,65.99]
Rural areas Age
Group (years)
Men Women
n Mean 95% CI n Mean 95% CI
15-24 1,372 63.51 [62.54,64.49] 1,336 55.96 [55.29,56.63] 25-34 1,350 69.62 [68.54,70.70] 1,293 62.82 [62.01,63.63] 35-44 1,361 70.87 [70.00,71.75] 1,334 66.33 [65.60,67.06] 45-54 1,353 70.50 [69.34,71.67] 1,373 66.15 [65.04,67.26] 55-64 1,341 69.30 [68.49,70.11] 1,335 63.92 [62.90,64.93] 15-64 6,777 67.74 [67.17,68.31] 6,671 61.48 [60.98,61.98]
Total Age
Group (years)
Men Women
n Mean 95% CI N Mean 95% CI
15-24 3,022 67.14 [66.38,67.90] 2,920 57.79 [57.19,58.39] 25-34 2,970 73.47 [72.64,74.31] 2,809 64.99 [64.22,65.76] 35-44 2,991 74.85 [73.99,75.71] 2,911 69.35 [68.59,70.12] 45-54 2,961 74.23 [73.44,75.02] 2,977 69.71 [68.96,70.45] 55-64 2,935 72.33 [71.56,73.10] 2,922 68.38 [67.68,69.08] 15-64 14,879 71.47 [71.04,71.89] 14,539 64.02 [63.63,64.41]

Iran NCD Risk Factors STEPs Report 85
Table 68 Waist circumference (cm) Urban areas
Age Group (years)
Men Women
n Mean 95% CI n Mean 95% CI
15-24 1,650 81.45 [80.53,82.37] 1,586 75.62 [74.89,76.35] 25-34 1,627 87.61 [86.70,88.52] 1,515 83.96 [82.85,85.06] 35-44 1,638 91.18 [90.16,92.19] 1,579 90.02 [89.00,91.03] 45-54 1,611 93.16 [92.20,94.12] 1,604 94.82 [93.53,96.11] 55-64 1,598 94.01 [92.95,95.08] 1,590 97.04 [95.96,98.11] 15-64 8,124 82.61 [82.09,83.13] 7,874 84.35 [83.71,84.98]
Rural areas Age
Group (years)
Men Women
n Mean 95% CI N Mean 95% CI
15-24 1,375 77.29 [76.41,78.17] 1,336 75.61 [75.00,76.23] 25-34 1,349 83.07 [82.23,83.91] 1,297 83.00 [82.15,83.85] 35-44 1,362 86.28 [85.38,87.18] 1,332 88.54 [87.59,89.48] 45-54 1,353 87.99 [86.98,89.00] 1,375 92.14 [90.73,93.55] 55-64 1,345 89.10 [88.08,90.12] 1,338 91.80 [90.71,92.90] 15-64 6,784 82.61 [82.09,83.13] 6,678 83.12 [82.54,83.70]
Total Age
Group (years)
Men Women
n Mean 95% CI n Mean 95% CI
15-24 3,025 79.92 [79.24,80.60] 2,922 75.61 [75.04,76.19] 25-34 2,976 86.03 [85.35,86.71] 2,812 83.61 [82.86,84.37] 35-44 3,000 89.50 [88.78,90.22] 2,911 89.49 [88.76,90.23] 45-54 2,964 91.37 [90.58,92.15] 2,980 93.88 [92.92,94.85] 55-64 2,943 92.34 [91.58,93.10] 2,928 95.19 [94.35,96.03] 15-64 14,908 85.57 [85.15,86.00] 14,553 83.91 [83.44,84.39]

86 Iran NCD Risk Factors STEPs Report
Table 69 Mean BMI (kg/m2) Urban areas
Age Group (years)
Men Women Both Sexes
n Mean %95CI n Mean %95CI n Mean %95CI
15-24 1,618 22.91 [22.59,23.23] 1,558 22.99 [22.65,23.34] 3,176 22.95 [22.70,23.20] 25-34 1,610 24.93 [24.62,25.24] 1,501 26.04 [25.63,26.45] 3,111 25.48 [25.24,25.71] 35-44 1,620 25.93 [25.54,26.31] 1,574 28.31 [27.88,28.75] 3,194 27.10 [26.84,27.35] 45-54 1,598 26.25 [25.98,26.52] 1,598 29.14 [28.80,29.48] 3,196 27.68 [27.44,27.92] 55-64 1,588 26.20 [25.84,26.57] 1,575 29.50 [29.11,29.89] 3,163 27.88 [27.59,28.17] 15-64 8,034 24.64 [24.47,24.81] 7,806 25.99 [25.76,26.22] 15,840 25.31 [25.16,25.45]
Rural areas Age
Group (years)
Men Women Both Sexes
n Mean %95CI n Mean %95CI n Mean %95CI
15-24 1,335 21.94 [21.66,22.23] 1,307 22.55 [22.30,22.80] 2,642 22.24 [22.03,22.46] 25-34 1,336 23.62 [23.28,23.95] 1,276 25.38 [25.01,25.76] 2,612 24.49 [24.19,24.78] 35-44 1,350 24.61 [24.32,24.90] 1,316 27.16 [26.88,27.45] 2,666 25.86 [25.68,26.05] 45-54 1,335 24.89 [24.53,25.24] 1,359 27.52 [27.05,27.90] 2,694 26.19 [25.85,26.52] 55-64 1,330 24.92 [24.67,25.17] 1,316 27.13 [26.66,27.59] 2,646 26.04 [25.76,26.32] 15-64 6,686 23.45 [23.26,23.63] 6,574 25.08 [24.87,25.29] 13,260 24.25 [24.09,24.42]
Total Age
Group (years)
Men Women Both Sexes
n Mean %95CI n Mean %95CI n Mean %95CI
15-24 2,953 22.55 [22.34,22.77] 2,865 22.82 [22.58,23.06] 5,818 22.69 [22.52,22.85] 25-34 2,946 24.47 [24.24,24.70] 2,777 25.80 [25.49,26.11] 5,723 25.13 [24.94,25.31] 35-44 2,970 25.47 [25.23,25.72] 2,890 27.91 [27.63,28.19] 5,860 26.67 [26.49,26.85] 45-54 2,933 25.78 [25.55,26.01] 2,958 28.57 [28.29,28.86] 5,891 27.16 [26.96,27.36] 55-64 2,918 25.76 [25.51,26.01] 2,891 28.66 [28.36,28.97] 5,809 27.24 [27.02,27.45] 15-64 14,720 24.22 [24.10,24.33] 14,381 25.66 [25.50,25.82] 29,101 24.93 [24.83,25.03]

Iran NCD Risk Factors STEPs Report 87
Table 70 BMI classifications Urban areas
Age group (year)
Men
n % Under-
weight <18.5
95% CI % Normal
weight 18.5-24.9
95% CI % Over-weight
25.0-29.9 95% CI
15-24 1,618 11.89 [11.13,12.69] 62.36 [61.24,63.48] 18.79 [17.67,19.96] 25-34 1,610 4.11 [3.79,4.46] 49.03 [48.01,50.06] 36.27 [35.31,37.25] 35-44 1,620 3.35 [3.08,3.65] 39.72 [38.86,40.59] 41.1 [40.15,42.05] 45-54 1,598 1.71 [1.63,1.79] 39.11 [38.64,39.57] 42.96 [42.46,43.47] 55-64 1,588 2.87 [2.78,2.96] 37.13 [36.86,37.40] 41.84 [41.61,42.08] 15-64 8,034 6.38 [5.58,7.29] 50.05 [48.16,51.95] 32.09 [30.11,34.14]
Age group (year)
Women
n % Under-
weight <18.5
95% CI % Normal
weight 18.5-24.9
95% CI % Over-weight
25.0-29.9 95% CI
15-24 1,558 12.45 [11.60,13.36] 63.46 [62.11,64.80] 16.59 [15.66,17.56] 25-34 1,501 3.21 [2.95,3.50] 45.74 [44.77,46.72] 31.17 [30.29,32.07] 35-44 1,574 1.36 [1.26,1.46] 25.94 [25.28,26.60] 39.88 [39.09,40.66] 45-54 1,598 0.48 [0.43,0.53] 20.51 [20.07,20.96] 38.76 [38.23,39.29] 55-64 1,575 0.92 [0.88,0.96] 17.22 [17.06,17.39] 39.02 [38.74,39.30] 15-64 7,806 5.71 [4.85,6.70] 43.33 [41.47,45.21] 29.00 [27.43,30.62]
Age group (year)
Both Sexes
n % Under-
weight <18.5
95% CI % Normal
weight 18.5-24.9
95% CI % Over-weight
25.0-29.9 95% CI
15-24 3,176 12.17 [11.64,12.72] 62.91 [62.14,63.67] 17.70 [16.96,18.47] 25-34 3,111 3.67 [3.47,3.88] 47.42 [46.76,48.08] 33.77 [33.11,34.43] 35-44 3,194 2.38 [2.22,2.54] 32.97 [32.42,33.51] 40.50 [39.90,41.10] 45-54 3,196 1.10 [1.05,1.16] 29.93 [29.62,30.23] 40.89 [40.59,41.18] 55-64 3,163 1.88 [1.83,1.93] 27.02 [26.85,27.19] 40.41 [40.24,40.58] 15-64 15,840 6.05 [5.46,6.69] 46.73 [45.43,48.04] 30.56 [15.58,17.78]

88 Iran NCD Risk Factors STEPs Report
Table 71 BMI classifications Rural areas
Age group (year)
Men
n % Under-
weight <18.5
95% CI % Normal
weight 18.5-24.9
95% CI % Over-weight
25.0-29.9 95% CI
15-24 1335 15.16 [14.31,16.04] 68.88 [67.80,69.95] 11.40 [10.59,12.27] 25-34 1336 6.25 [5.87,6.65] 62.90 [61.88,63.92] 25.06 [24.16,25.99] 35-44 1350 5.10 [4.88,5.33] 49.75 [49.25,50.26] 34.30 [33.78,34.82] 45-54 1335 4.43 [4.27,4.60] 51.02 [50.50,51.53] 32.52 [32.10,32.95] 55-64 1330 3.92 [3.82,4.02] 51.30 [51.04,51.56] 32.11 [31.89,32.33] 15-64 6686 8.86 [7.77,10.08] 60.34 [58.38,62.27] 23.27 [21.54,25.09]
Age group (year)
Women
n % Under-
weight <18.5
95% CI % Normal
weight 18.5-24.9
95% CI % Over-weight
25.0-29.9 95% CI
15-24 1307 12.86 [12.09,13.66] 63.31 [62.18,64.42] 18.66 [17.73,19.62] 25-34 1276 6.43 [5.98,6.91] 45.35 [44.42,46.28] 30.03 [29.26,30.81] 35-44 1316 3.10 [2.92,3.28] 32.81 [32.27,33.36] 35.61 [34.88,36.35] 45-54 1359 2.90 [2.77,3.03] 29.68 [29.28,30.08] 36.27 [35.86,36.68] 55-64 1316 2.79 [2.72,2.85] 36.59 [36.36,36.82] 31.67 [31.49,31.85] 15-64 6574 7.44 [6.53,8.47] 46.95 [45.14,48.76] 27.84 [26.28,29.46]
Age group (year)
Both Sexes
n % Under-
weight <18.5
95% CI % Normal
weight 18.5-24.9
95% CI % Over-weight
25.0-29.9 95% CI
15-24 2642 14.02 [13.37,14.69] 66.12 [65.21,67.02] 14.99 [14.25,15.77] 25-34 2612 6.34 [6.04,6.65] 54.28 [53.56,54.99] 27.50 [26.84,28.18] 35-44 2666 4.12 [3.97,4.27] 41.45 [41.08,41.81] 34.94 [34.45,35.43] 45-54 2694 3.68 [3.56,3.79] 40.48 [40.15,40.82] 34.37 [34.11,34.63] 55-64 2646 3.34 [3.28,3.41] 43.83 [43.66,44.00] 31.89 [31.73,32.05] 15-64 13260 8.16 [7.37,9.02] 53.73 [52.23,55.21] 25.53 [24.15,26.96]

Iran NCD Risk Factors STEPs Report 89
Table 72 BMI classifications Total
Age group (year)
Men
n % Under-
weight <18.5
95% CI % Normal
weight 18.5-24.9
95% CI % Over-weight
25.0-29.9 95% CI
15-24 2,953 13.08 [12.52,13.66] 64.74 [63.84,65.63] 16.09 [15.37,16.84] 25-34 2,946 4.85 [4.589,5.138] 53.86 [53.13,54.58] 32.37 [31.65,33.10] 35-44 2,970 3.95 [3.762,4.151] 43.15 [42.63,43.67] 38.77 [38.22,39.33] 45-54 2,933 2.64 [2.572,2.728] 43.21 [42.88,43.55] 39.36 [39.02,39.70] 55-64 2,918 3.22 [3.159,3.295] 41.93 [41.75,42.12] 38.54 [38.36,38.72] 15-64 14,720 7.26 [6.621,7.955] 53.65 [52.27,55.02] 29.00 [27.72,30.31]
Age group (year)
Women
n % Under-
weight <18.5
95% CI % Normal
weight 18.5-24.9
95% CI % Over-weight
25.0-29.9 95% CI
15-24 2,865 12.6 [12.04,13.19] 63.40 [62.51,64.29] 17.37 [16.69,18.07] 25-34 2,777 4.35 [4.09,4.64] 45.60 [44.87,46.34] 30.77 [30.14,31.40] 35-44 2,890 1.96 [1.87,2.06] 28.34 [27.88,28.79] 38.39 [37.88,38.90] 45-54 2,958 1.32 [1.26,1.38] 23.70 [23.38,24.02] 37.88 [37.54,38.22] 55-64 2,891 1.57 [1.54,1.61] 24.03 [23.88,24.18] 36.44 [36.26,36.62] 15-64 14,381 6.32 [5.69,7.00] 44.59 [43.26,45.94] 28.61 [27.53,29.72]
Age group (year)
Both Sexes
n % Under-
weight <18.5
95% CI % Normal
weight 18.5-24.9
95% CI % Over-weight
25.0-29.9 95% CI
15-24 5,818 12.84 [12.45,13.25] 64.08 [63.46,64.69] 16.72 [16.22,17.24] 25-34 5,723 4.61 [4.41,4.80] 49.80 [49.30,50.30] 31.58 [31.11,32.06] 35-44 5,860 2.97 [2.87,3.08] 35.89 [35.52,36.25] 38.58 [38.21,38.96] 45-54 5,891 1.99 [1.94,2.04] 33.58 [33.33,33.83] 38.63 [38.41,38.86] 55-64 5,888 2.39 [2.35,2.43] 32.84 [32.68,33.00] 37.47 [37.33,37.62] 15-64 29,885 6.80 [6.37,7.25] 49.17 [48.02,50.33] 28.81 [27.74,29.90]

90 Iran NCD Risk Factors STEPs Report
Table 73 Mean systolic blood pressure (mmHg) Urban areas
Age Group (years)
Men Women Both Sexes
n Mean %95CI n Mean %95CI n Mean %95CI
15-24 1,645 118.83 [118.02,119.64] 1,637 107.5 [106.24,107.86] 3,282 112.99 [112.37,113.62] 25-34 1,614 120.31 [119.43,121.18] 1,608 109.49 [108.55,110.44] 3,222 114.99 [114.29,115.69] 35-44 1,599 122.29 [121.24,123.34] 1,548 116.78 [115.75,117.82] 3,147 119.59 [118.79,120.39] 45-54 1,442 126.19 [125.01,127.36] 1,322 123.56 [122.17,124.95] 2,764 124.89 [123.92,125.86] 55-64 1,298 133.53 [131.89,135.18] 1,055 131.06 [128.92,133.20] 2,353 132.28 [130.90,133.65] 15-64 7,598 121.77 [121.22,122.31] 7,170 113.24 [112.63,113.86] 14,768 117.56 [117.08,118.04]
Rural areas Age
Group (years)
Men Women Both Sexes
n Mean %95CI n Mean %95CI n Mean %95CI
15-24 1,379 118.34 [117.41,119.26] 1,373 111.08 [110.11,112.04] 2,752 114.74 [113.99,115.49] 25-34 1,346 119.06 [118.29,119.83] 1,355 113.08 [112.02,114.14] 2,701 116.12 [115.44,116.80] 35-44 1,337 122.05 [121.11,122.99] 1,308 118.06 [117.14,118.98] 2,645 120.09 [119.45,120.73] 45-54 1,288 125.52 [123.95,127.09] 1,175 125.95 [123.69,128.21] 2,463 125.73 [124.71,126.75] 55-64 1,164 132.92 [131.19,134.66] 970 131.56 [130.09,133.03] 2,134 132.23 [130.93,133.53] 15-64 6,514 121.10 [120.61,121.59] 6,181 116.20 [115.62,116.78] 12,695 118.68 [118.23,119.12]
Total Age
Group (years)
Men Women Both Sexes
n Mean %95CI n Mean %95CI n Mean %95CI
15-24 3,024 118.64 [118.03,119.25] 3,010 108.55 [107.94,109.15] 6,034 113.64 [113.17,114.12] 25-34 2,960 119.87 [119.25,120.49] 2,963 110.74 [110.05,111.44] 5,923 115.38 [114.89,115.88] 35-44 2,936 122.20 [121.41,122.99] 2,856 117.22 [116.46,117.98] 5,792 119.76 [119.18,120.34] 45-54 2,730 125.94 [125.06,126.82] 2,498 124.39 [123.21,125.58] 5,228 125.18 [124.47,125.89] 55-64 2,462 133.32 [132.17,134.46] 2,025 131.25 [129.72,132.77] 4,487 132.27 [131.32,133.21] 15-64 14,112 121.53 [121.11,121.94] 13,352 114.31 [113.85,114.77] 27,464 117.96 [117.60,118.32]

Iran NCD Risk Factors STEPs Report 91
Table 74 Mean diastolic blood pressure (mmHg) Urban areas
Age Group (years)
Men Women Both Sexes
n Mean %95CI n Mean %95CI n Mean %95CI
15-24 1,645 75.22 [74.50,75.95] 1,637 72.32 [71.73,72.90] 3,282 73.78 [73.36,74.21] 25-34 1,612 77.65 [76.80,78.49] 1,607 74.89 [74.17,75.60] 3,219 76.29 [75.64,76.94] 35-44 1,598 80.49 [79.64,81.34] 1,546 79.96 [79.21,80.71] 3,144 80.23 [79.60,80.86] 45-54 1,442 82.19 [81.17,83.21] 1,321 82.54 [81.65,83.43] 2,763 82.36 [81.71,83.02] 55-64 1,296 84.33 [83.33,85.34] 1,054 83.81 [82.64,84.98] 2,350 84.07 [83.26,84.88] 15-64 7,593 78.32 [77.83,78.81] 7,165 76.48 [76.09,76.87] 14,758 77.41 [77.05,77.78]
Rural areas Age
Group (years)
Men Women Both Sexes
n Mean %95CI n Mean %95CI n Mean %95CI
15-24 1,379 72.26 [71.58,72.93] 1,373 72.48 [71.77,73.19] 2,752 72.37 [71.82,72.91] 25-34 1,344 74.42 [73.73,75.11] 1,354 75.41 [74.65,76.17] 2,698 74.91 [74.47,75.34] 35-44 1,337 77.83 [77.14,78.52] 1,307 78.72 [77.99,79.45] 2,644 78.27 [77.76,78.78] 45-54 1,288 79.60 [78.56,80.64] 1,173 81.58 [80.14,83.03] 2,461 80.58 [79.99,81.17] 55-64 1,163 82.36 [81.62,83.11] 969 83.25 [82.12,84.38] 2,132 82.81 [82.10,83.53] 15-64 6,511 75.46 [75.10,75.82] 6,176 76.29 [75.81,76.77] 12,687 75.87 [75.52,76.22]
Total Age
Group (years)
Men Women Both Sexes
n Mean %95CI n Mean %95CI n Mean %95CI
15-24 3,024 74.12 [73.62,74.63] 3,010 72.37 [71.91,72.84] 6,034 73.26 [72.90,73.61] 25-34 2,956 76.52 [75.94,77.10] 2,961 75.07 [74.52,75.61] 5,917 75.80 [75.36,76.25] 35-44 2,935 79.58 [78.99,80.18] 2,853 79.53 [78.97,80.08] 5,788 79.55 [79.12,79.98] 45-54 2,730 81.25 [80.53,81.98] 2,495 82.20 [81.45,82.95] 5,225 81.72 [81.23,82.21] 55-64 2,459 83.65 [82.97,84.33] 2,023 83.60 [82.79,84.40] 4,482 83.62 [83.08,84.17] 15-64 14,104 77.30 [76.95,77.65] 13,342 76.41 [76.08,76.74] 27,446 76.86 [76.58,77.14]

92 Iran NCD Risk Factors STEPs Report
Table 75 SBP ≥140 and/or DBP ≥ 90 mmHg Urban areas
Age Group (years)
Men Women Both Sexes
n % %95CI n % %95CI n % %95CI
15-24 1,652 7.85 [7.19,8.57] 1,645 3.45 [3.08,3.87] 3,297 5.67 [5.26,6.11] 25-34 1,627 12.21 [11.57,12.87] 1,626 5.77 [5.42,6.13] 3,253 9.04 [8.66,9.44] 35-44 1,640 19.29 [18.70,19.90] 1,621 18.83 [18.31,19.37] 3,261 19.07 [18.64,19.51] 45-54 1,616 29.57 [29.09,30.05] 1,614 33.61 [33.23,34.00] 3,230 31.57 [31.22,31.91] 55-64 1,601 41.87 [41.61,42.14] 1,597 46.65 [46.38,46.93] 3,198 44.30 [44.13,44.47] 15-64 8,136 16.13 [14.72,17.65] 8,103 13.73 [12.69,14.84] 16,239 14.94 [13.97,15.97]
Rural areas Age
Group (years)
Men Women Both Sexes
n % %95CI n % %95CI n % %95CI
15-24 1,380 6.61 [5.92,7.38] 1,381 4.10 [3.664,4.593] 2,761 5.37 [4.95,5.83] 25-34 1,353 8.97 [8.51,9.45] 1,373 8.70 [7.926,9.535] 2,726 8.83 [8.35,9.35] 35-44 1,367 12.67 [12.31,13.04] 1,364 19.44 [18.91,19.97] 2,731 15.99 [15.65,16.33] 45-54 1,356 24.22 [23.77,24.67] 1,383 35.77 [35.19,36.35] 2,739 29.92 [29.56,30.28] 55-64 1,348 41.80 [41.52,42.08] 1,343 49.44 [49.18,49.69] 2,691 45.68 [45.47,45.88] 15-64 6,804 12.93 [11.98,13.94] 6,844 15.30 [14.34,16.31] 13,648 14.10 [13.34,14.90]
Total Age
Group (years)
Men Women Both Sexes
n % %95CI n % %95CI n % %95CI
15-24 3,032 7.39 [6.94,7.87] 3,026 3.69 [3.39,4.02] 6,058 5.56 [5.27,5.86] 25-34 2,980 11.08 [10.63,11.55] 2,999 6.79 [6.45,7.16] 5,979 8.97 [8.66,9.29] 35-44 3,007 17.03 [16.60,17.47] 2,985 19.04 [18.65,19.44] 5,992 18.02 [17.71,18.33] 45-54 2,972 27.72 [27.37,28.07] 2,998 34.36 [34.02,34.70] 5,970 31.00 [30.73,31.26] 55-64 2,949 41.85 [41.66,42.04] 2,940 47.63 [47.43,47.83] 5,889 44.79 [44.64,44.93] 15-64 14,940 15.02 [14.00,16.10] 14,948 14.28 [13.48,15.12] 29,888 14.66 [13.93,15.41]

Iran NCD Risk Factors STEPs Report 93
Table 76 SBP ≥140 and/or DBP ≥ 90 mmHg or currently on medication for raised blood pressure Urban areas
Age Group (years)
Men Women Both Sexes
n % %95CI n % %95CI n % %95CI
15-24 1,652 8.18 [7.53,8.89] 1,644 3.67 [3.29,4.09] 3,296 5.95 [5.53,6.39] 25-34 1,627 13.02 [12.33,13.75] 1,626 6.47 [6.09,6.86] 3,253 9.80 [9.40,10.22] 35-44 1,639 20.01 [19.41,20.62] 1,619 20.02 [19.51,20.55] 3,258 20.02 [19.59,20.45] 45-54 1,615 32.67 [32.13,33.21] 1,614 39.11 [38.66,39.55] 3,229 35.85 [35.48,36.22] 55-64 1,600 45.97 [45.71,46.24] 1,597 57.78 [57.51,58.04] 3,197 51.97 [51.81,52.12] 15-64 8,133 17.27 [15.84,18.79] 8,100 15.69 [14.71,16.71] 16,233 16.49 [15.56,17.45]
Rural areas Age
Group (years)
Men Women Both Sexes
n % %95CI n % %95CI n % %95CI
15-24 1,380 7.03 [6.35,7.78] 1,380 4.51 [4.05,5.00] 2,760 5.78 [5.37,6.22] 25-34 1,353 9.37 [8.88,9.88] 1,372 9.31 [8.53,10.15] 2,725 9.34 [8.85,9.85] 35-44 1,367 13.75 [13.39,14.11] 1,364 21.03 [20.50,21.57] 2,731 17.32 [17.00,17.64] 45-54 1,355 25.74 [25.31,26.18] 1,383 39.12 [38.57,39.68] 2,738 32.35 [31.99,32.71] 55-64 1,348 45.51 [45.24,45.79] 1,341 57.75 [57.53,57.98] 2,689 51.73 [51.54,51.92] 15-64 6,803 13.83 [12.84,14.87] 6,840 16.91 [15.93,17.92] 13,643 15.35 [14.59,16.13]
Total Age
Group (years)
Men Women Both Sexes
n % %95CI n % %95CI n % %95CI
15-24 3,032 7.75 [7.30,8.24] 3,024 3.98 [3.67,4.31] 6,056 5.88 [5.59,6.19] 25-34 2,980 11.75 [11.29,12.24] 2,998 7.46 [7.10,7.83] 5,978 9.64 [9.33,9.97] 35-44 3,006 17.87 [17.43,18.31] 2,983 20.38 [19.98,20.78] 5,989 19.10 [18.79,19.41] 45-54 2,970 30.27 [29.90,30.64] 2,998 39.10 [38.75,39.46] 5,968 34.63 [34.36,34.90] 55-64 2,948 45.27 [45.63,46.01] 2,938 57.77 [57.58,57.96] 5,886 51.89 [51.76,52.02] 15-64 14,936 16.07 [15.05,17.15] 14,941 16.12 [15.33,16.95] 29,877 16.09 [15.39,16.82]

94 Iran NCD Risk Factors STEPs Report
Table 77 Currently on medication for raised blood pressure Urban areas
Age Group (years)
Men Women Both Sexes
n % %95CI n % %95CI n % %95CI
15-24 1,599 0.42 [0.29,0.62] 1,597 0.19 [0.12,0.31] 3,196 0.31 [0.23,0.41] 25-34 1,576 1.41 [1.14,1.75] 1,583 1.17 [0.99,1.38] 3,159 1.30 [1.13,1.47] 35-44 1,591 1.96 [1.73,2.22] 1,582 4.06 [3.82,4.31] 3,173 2.90 [2.81,3.18] 45-54 1,573 10.96 [10.60,11.32] 1,581 17.96 [17.55,18.37] 3,154 14.41 [14.13,14.70] 55-64 1,563 17.72 [17.54,17.89] 1,572 36.61 [36.34,36.87] 3,135 27.31 [27.15,27.47] 15-64 7,902 3.46 [2.93,4.07] 7,915 5.97 [5.41,6.58] 15,817 4.70 [4.29,5.14]
Rural areas Age
Group (years)
Men Women Both Sexes
n % %95CI n % %95CI n % %95CI
15-24 1,341 0.02 [0.01,0.04] 1,335 0.70 [0.50,0.99] 2,676 0.36 [0.26,0.50] 25-34 1,315 1.17 [0.87,1.56] 1,337 2.01 [1.68,2.40] 2,652 1.58 [1.29,1.93] 35-44 1,334 2.56 [2.30,2.86] 1,326 5.07 [4.76,5.40] 2,660 3.79 [3.59,4.00] 45-54 1,324 5.21 [5.00,5.43] 1,351 17.74 [17.21,18.27] 2,675 11.40 [11.11,11.69] 55-64 1,319 15.29 [15.08,15.50] 1,320 29.06 [28.80,29.33] 2,639 22.28 [22.13,22.44] 15-64 6,633 2.47 [2.04,2.98] 6,669 6.00 [5.15,6.98] 13,302 4.21 [3.77,4.70]
Total Age
Group (years)
Men Women Both Sexes
n % %95CI n % %95CI n % %95CI
15-24 2,940 0.27 [0.19,0.39] 2,932 0.38 [0.29,0.50] 5,872 0.32 [0.26,0.40] 25-34 2,891 1.32 [1.12,1.57] 2,920 1.46 [1.29,1.65] 5,811 1.39 [1.24,1.56] 35-44 2,925 2.16 [2.03,2.30] 2,908 4.41 [4.21,4.61] 5,833 3.26 [3.15,3.38] 45-54 2,897 8.96 [8.73,9.20] 2,933 17.88 [17.59,18.16] 5,830 13.37 [13.18,13.55] 55-64 2,882 16.89 [16.76,17.02] 2,892 33.95 [33.76,34.14] 5,774 25.55 [25.43,25.67] 15-64 14,535 3.11 [2.74,3.52] 14,585 5.98 [5.52,6.47] 29,120 4.35 [4.21,4.86]

Iran NCD Risk Factors STEPs Report 95
Table 78 SBP ≥160 and/or DBP ≥ 100 mmHg Urban areas
Age Group (years)
Men Women Both Sexes
n % %95CI n % %95CI n % %95CI
15-24 1,652 1.42 [1.21,1.66] 1,645 0.06 [0.03,0.10] 3,297 0.75 [0.64,0.87] 25-34 1,627 1.50 [1.26,1.78] 1,626 1.14 [0.95,1.36] 3,253 1.32 [1.17,1.49] 35-44 1,640 4.03 [3.76,4.31] 1,621 4.14 [3.95,4.34] 3,261 4.08 [3.91,4.26] 45-54 1,616 9.18 [8.90,9.47] 1,614 11.14 [10.87,11.42] 3,230 10.15 [9.94,10.36] 55-64 1,601 18.22 [17.99,18.45] 1,597 17.57 [17.35,17.79] 3,198 17.89 [17.72,18.06] 15-64 8,136 4.03 [3.49,4.64] 8,103 3.72 [3.26,4.25] 16,239 3.88 [3.48,4.32]
Rural areas Age
Group (years)
Men Women Both Sexes
n % %95CI n % %95CI n % %95CI
15-24 1,380 1.12 [0.80,1.55] 1,381 0.65 [0.49,0.86] 2,761 0.89 [0.68,1.15] 25-34 1,353 0.40 [0.32,0.50] 1,373 1.33 [1.17,1.52] 2,726 0.86 [0.77,0.96] 35-44 1,367 2.10 [1.95,2.26] 1,364 3.85 [3.66,4.04] 2,731 2.96 [2.82,3.10] 45-54 1,356 6.07 [5.84,6.31] 1,383 12.58 [12.21,12.95] 2,739 9.28 [9.09,9.47] 55-64 1,348 14.01 [13.82,14.2] 1,343 18.73 [18.51,18.95] 2,691 16.4 [16.29,16.52] 15-64 6,804 2.60 [2.13,3.17] 6,844 4.20 [3.74,4.71] 13,648 3.39 [3.01,3.82]
Total Age
Group (years)
Men Women Both Sexes
n % %95CI n % %95CI n % %95CI
15-24 3,032 1.30 [1.12,1.52] 3,026 0.28 [0.21,0.36] 6,058 0.80 [0.69,0.91] 25-34 2,980 1.11 [0.95,1.30] 2,999 1.20 [1.07,1.35] 5,979 1.16 [1.05,1.27] 35-44 3,007 3.37 [3.18,3.56] 2,985 4.03 [3.87,4.21] 5,992 3.69 [3.57,3.82] 45-54 2,972 8.10 [7.90,8.31] 2,998 11.64 [11.42,11.87] 5,970 9.85 [9.69,10.01] 55-64 2,949 16.79 [16.63,16.95] 2,940 17.98 [17.82,18.13] 5,889 17.39 [17.27,17.51] 15-64 14,940 3.53 [3.11,4.01] 14,948 3.89 [3.52,4.30] 29,888 3.71 [3.39,4.05]
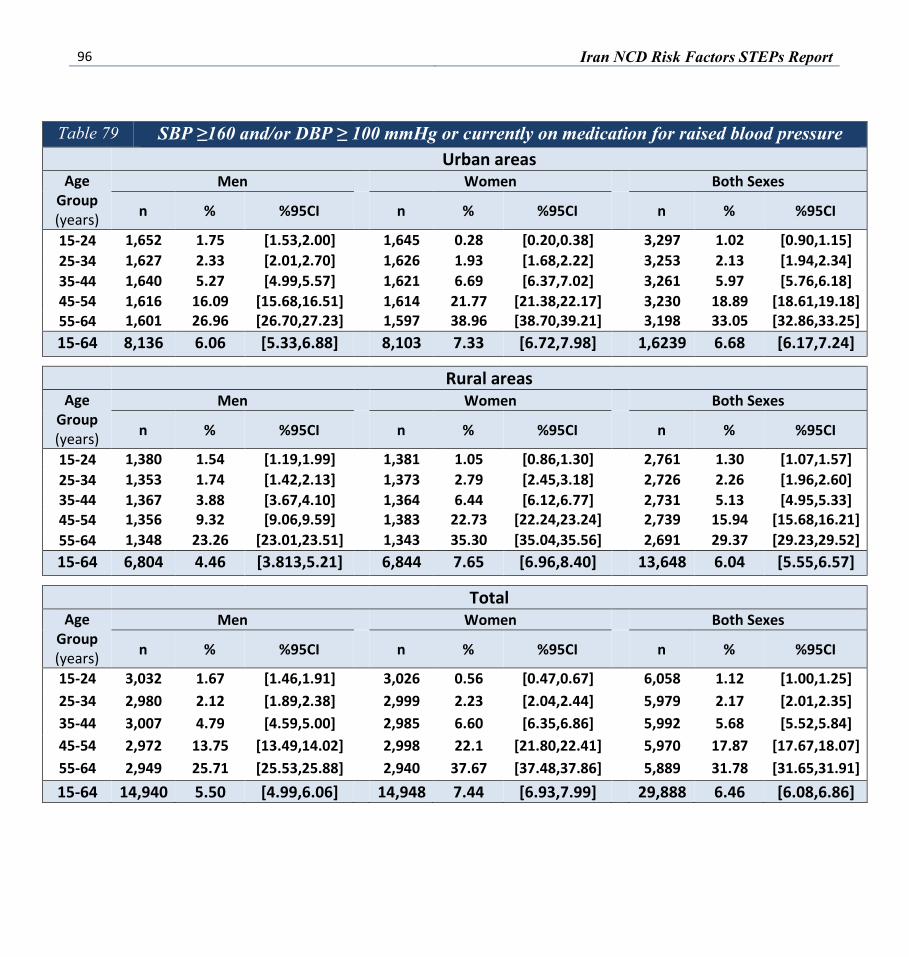
96 Iran NCD Risk Factors STEPs Report
Table 79 SBP ≥160 and/or DBP ≥ 100 mmHg or currently on medication for raised blood pressure Urban areas
Age Group (years)
Men Women Both Sexes
n % %95CI n % %95CI n % %95CI
15-24 1,652 1.75 [1.53,2.00] 1,645 0.28 [0.20,0.38] 3,297 1.02 [0.90,1.15] 25-34 1,627 2.33 [2.01,2.70] 1,626 1.93 [1.68,2.22] 3,253 2.13 [1.94,2.34] 35-44 1,640 5.27 [4.99,5.57] 1,621 6.69 [6.37,7.02] 3,261 5.97 [5.76,6.18] 45-54 1,616 16.09 [15.68,16.51] 1,614 21.77 [21.38,22.17] 3,230 18.89 [18.61,19.18] 55-64 1,601 26.96 [26.70,27.23] 1,597 38.96 [38.70,39.21] 3,198 33.05 [32.86,33.25] 15-64 8,136 6.06 [5.33,6.88] 8,103 7.33 [6.72,7.98] 1,6239 6.68 [6.17,7.24]
Rural areas Age
Group (years)
Men Women Both Sexes
n % %95CI n % %95CI n % %95CI
15-24 1,380 1.54 [1.19,1.99] 1,381 1.05 [0.86,1.30] 2,761 1.30 [1.07,1.57] 25-34 1,353 1.74 [1.42,2.13] 1,373 2.79 [2.45,3.18] 2,726 2.26 [1.96,2.60] 35-44 1,367 3.88 [3.67,4.10] 1,364 6.44 [6.12,6.77] 2,731 5.13 [4.95,5.33] 45-54 1,356 9.32 [9.06,9.59] 1,383 22.73 [22.24,23.24] 2,739 15.94 [15.68,16.21] 55-64 1,348 23.26 [23.01,23.51] 1,343 35.30 [35.04,35.56] 2,691 29.37 [29.23,29.52] 15-64 6,804 4.46 [3.813,5.21] 6,844 7.65 [6.96,8.40] 13,648 6.04 [5.55,6.57]
Total Age
Group (years)
Men Women Both Sexes
n % %95CI n % %95CI n % %95CI
15-24 3,032 1.67 [1.46,1.91] 3,026 0.56 [0.47,0.67] 6,058 1.12 [1.00,1.25] 25-34 2,980 2.12 [1.89,2.38] 2,999 2.23 [2.04,2.44] 5,979 2.17 [2.01,2.35] 35-44 3,007 4.79 [4.59,5.00] 2,985 6.60 [6.35,6.86] 5,992 5.68 [5.52,5.84] 45-54 2,972 13.75 [13.49,14.02] 2,998 22.1 [21.80,22.41] 5,970 17.87 [17.67,18.07] 55-64 2,949 25.71 [25.53,25.88] 2,940 37.67 [37.48,37.86] 5,889 31.78 [31.65,31.91] 15-64 14,940 5.50 [4.99,6.06] 14,948 7.44 [6.93,7.99] 29,888 6.46 [6.08,6.86]

Iran NCD Risk Factors STEPs Report 97
7. Raised Risk Raised risk as a comprehensive assessment on Steps NCD risk factors is measured based on WHO definition: - Percentage of respondents with 0, 1-3, or 4-5 of the following risk factors:
• Current daily smoker • Less than 5 servings of fruits & vegetables per day • Low level of activity (<600 MET -minutes) • Overweight or obese (BMI ≥ 25 kg/m2) • Raised BP (SBP ≥ 140 and/or DBP ≥ 90 mmHge or currently on medication for raised BP).
- Percentage of respondents with 0, 1-2, or 3 of these the following risk factors: • Current daily smoker • Less than 5 servings of fruits & vegetables per day • Low level of activity (<600 MET - minutes) describe the raised risk and viewed in related tables
by sex and age groups.

98 Iran NCD Risk Factors STEPs Report
Table 80 Raised Risk Urban areas
Age group (year)
Men
n % with 0 risk factors
% with 1-3 risk factors
% with 4-5 risk factors
15-24 1,619 6.27 [5.52,7.12] 92.39 [91.51,93.18] 1.34 [1.14,1.58] 25-34 1,610 2.53 [2.26,2.83] 92.11 [91.56,92.62] 5.36 [4.93,5.84] 35-44 1,621 1.43 [1.28,1.60] 85.78 [85.24,86.30] 12.79 [12.29,13.31] 45-54 1,595 0.96 [0.87,1.06] 80.19 [79.75,80.62] 18.85 [18.42,19.29] 55-64 1,587 0.69 [0.66,0.73] 79.83 [79.61,80.04] 19.48 [19.26,19.70] 15-44 4,850 3.75 [2.85,4.91] 90.68 [89.17,92.00] 5.57 [4.63,6.68] 45-64 3,182 0.87 [0.46,1.61] 80.06 [77.42,82.46] 19.07 [16.65,21.75]
Age group (year)
Women
n % with 0 risk factors
% with 1-3 risk factors
% with 4-5 risk factors
15-24 1,556 6.32 [5.63,7.08] 92.79 [92.04,93.49] 0.89 [0.66,1.20] 25-34 1,501 4.60 [4.05,5.23] 92.55 [91.91,93.15] 2.85 [2.57,3.15] 35-44 1,572 1.05 [0.92,1.20] 90.31 [89.87,90.74] 8.64 [8.24,9.06] 45-54 1,597 1.97 [1.80,2.17] 82.88 [82.50,83.26] 15.14 [14.8,15.49] 55-64 1,575 0.51 [0.48,0.54] 71.33 [71.06,71.59] 28.16 [27.90,28.43] 15-44 4,629 4.42 [3.25,5.99] 92.11 [90.44,93.50] 3.47 [2.72,4.42] 45-64 3,172 1.44 [0.76,0.76] 78.66 [76.17,80.97] 19.9 [17.64,22.36]
Age group (year)
Both Sexes
n % with 0 risk factors
% with 1-3 risk factors
% with 4-5 risk factors
15-24 3,175 6.29 [5.75,6.89] 92.59 [91.98,93.15] 1.12 [0.95,1.30] 25-34 3,111 3.55 [3.22,3.90] 92.32 [91.93,92.70] 4.13 [3.88,4.39] 35-44 3,193 1.24 [1.14,1.35] 88.00 [87.62,88.37] 10.76 [10.42,11.11] 45-54 3,192 1.46 [1.36,1.56] 81.52 [81.24,81.80] 17.02 [16.76,17.29] 55-64 3,162 0.60 [0.57,0.63] 75.51 [75.35,75.67] 23.89 [23.73,24.05] 15-44 9,479 4.08 [3.22,5.14] 91.38 [90.20,92.43] 4.54 [3.93,5.24] 45-64 6,354 1.15 [0.72,1.83] 79.37 [77.60,81.03] 19.48 [17.48,21.24]
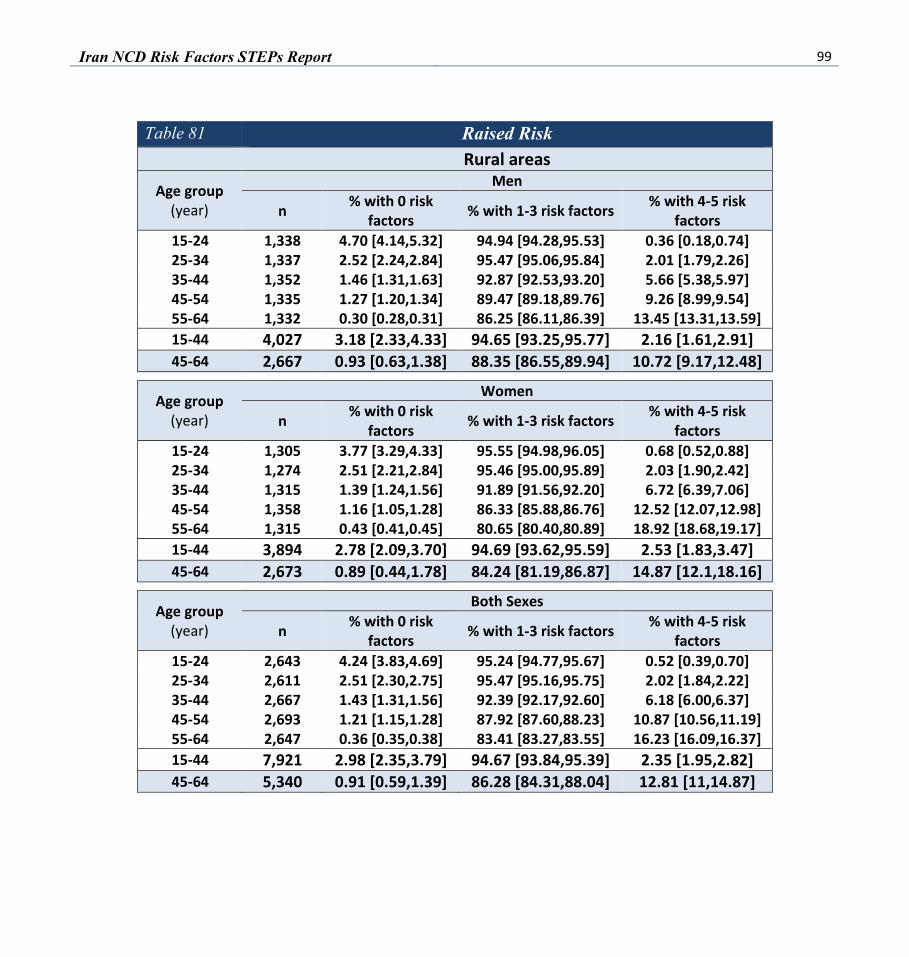
Iran NCD Risk Factors STEPs Report 99
Table 81 Raised Risk Rural areas
Age group (year)
Men
n % with 0 risk factors % with 1-3 risk factors % with 4-5 risk
factors 15-24 1,338 4.70 [4.14,5.32] 94.94 [94.28,95.53] 0.36 [0.18,0.74] 25-34 1,337 2.52 [2.24,2.84] 95.47 [95.06,95.84] 2.01 [1.79,2.26] 35-44 1,352 1.46 [1.31,1.63] 92.87 [92.53,93.20] 5.66 [5.38,5.97] 45-54 1,335 1.27 [1.20,1.34] 89.47 [89.18,89.76] 9.26 [8.99,9.54] 55-64 1,332 0.30 [0.28,0.31] 86.25 [86.11,86.39] 13.45 [13.31,13.59] 15-44 4,027 3.18 [2.33,4.33] 94.65 [93.25,95.77] 2.16 [1.61,2.91] 45-64 2,667 0.93 [0.63,1.38] 88.35 [86.55,89.94] 10.72 [9.17,12.48]
Age group (year)
Women
n % with 0 risk factors % with 1-3 risk factors % with 4-5 risk
factors 15-24 1,305 3.77 [3.29,4.33] 95.55 [94.98,96.05] 0.68 [0.52,0.88] 25-34 1,274 2.51 [2.21,2.84] 95.46 [95.00,95.89] 2.03 [1.90,2.42] 35-44 1,315 1.39 [1.24,1.56] 91.89 [91.56,92.20] 6.72 [6.39,7.06] 45-54 1,358 1.16 [1.05,1.28] 86.33 [85.88,86.76] 12.52 [12.07,12.98] 55-64 1,315 0.43 [0.41,0.45] 80.65 [80.40,80.89] 18.92 [18.68,19.17] 15-44 3,894 2.78 [2.09,3.70] 94.69 [93.62,95.59] 2.53 [1.83,3.47] 45-64 2,673 0.89 [0.44,1.78] 84.24 [81.19,86.87] 14.87 [12.1,18.16]
Age group (year)
Both Sexes
n % with 0 risk factors % with 1-3 risk factors % with 4-5 risk
factors 15-24 2,643 4.24 [3.83,4.69] 95.24 [94.77,95.67] 0.52 [0.39,0.70] 25-34 2,611 2.51 [2.30,2.75] 95.47 [95.16,95.75] 2.02 [1.84,2.22] 35-44 2,667 1.43 [1.31,1.56] 92.39 [92.17,92.60] 6.18 [6.00,6.37] 45-54 2,693 1.21 [1.15,1.28] 87.92 [87.60,88.23] 10.87 [10.56,11.19] 55-64 2,647 0.36 [0.35,0.38] 83.41 [83.27,83.55] 16.23 [16.09,16.37] 15-44 7,921 2.98 [2.35,3.79] 94.67 [93.84,95.39] 2.35 [1.95,2.82] 45-64 5,340 0.91 [0.59,1.39] 86.28 [84.31,88.04] 12.81 [11,14.87]

100 Iran NCD Risk Factors STEPs Report
Table 82 Raised Risk Total areas
Age group (year)
Men
n % with 0 risk factors
% with 1-3 risk factors % with 4-5 risk factors
15-24 2,957 5.69 [5.20,6.23] 93.32 [92.77,93.83] 0.98 [0.84,1.14] 25-34 2,947 2.52 [2.32,2.74] 93.28 [92.92,93.61] 4.19 [3.92,4.49] 35-44 2,973 1.44 [1.33,1.56] 88.20 [87.86,88.54] 10.36 [10.03,10.69] 45-54 2,929 1.06 [1.00,1.14] 83.38 [83.07,83.69] 15.55 [15.24,15.86] 55-64 2,919 0.56 [0.54,0.57] 82.01 [81.86,82.16] 17.43 [17.28,17.58] 15-44 8,877 3.54 [2.91,4.31] 92.09 [91.11,92.96] 4.36 [3.76,5.05] 45-64 5,848 0.89 [0.59,1.33] 82.90 [80.88,84.74] 16.21 [14.37,18.24]
Age group (year)
Women
n % with 0 risk factors
% with 1-3 risk factors % with 4-5 risk factors
15-24 2,861 5.38 [4.88,5.87] 93.83 [93.29,94.33] 0.81 [0.66,1.00] 25-34 2,775 3.86 [3.52,4.22] 93.58 [93.16,93.99] 2.55 [2.33,2.80] 35-44 2,887 1.16 [1.06,1.28] 90.86 [90.57,91.14] 7.97 [7.70,8.24] 45-54 2,956 1.68 [1.57,1.81] 84.09 [83.80,84.36] 14.23 [13.96,14.49] 55-64 2,890 0.48 [0.46,0.49] 74.60 [74.43,74.78] 24.91 [24.74,25.09] 15-44 8,523 3.83 [3.07,4.75] 93.04 [92.00,93.96] 3.12 [2.62,3.73] 45-64 5,846 1.24 [0.77,2.00] 80.61 [78.83,82.29] 18.14 [16.46,19.95]
Age group (year)
Both Sexes
n % with 0 risk factors
% with 1-3 risk factors % with 4-5 risk factors
15-24 5,818 5.52 [5.15,5.93] 93.57 [93.16,93.96] 0.89 [0.79,1.01] 25-34 5,722 3.18 [2.97,3.40] 93.43 [93.15,93.69] 3.39 [3.21,3.57] 35-44 5,860 1.30 [1.23,1.39] 89.51 [89.26,89.74] 9.18 [8.96,9.41] 45-54 5,885 1.37 [1.30,1.44] 83.73 [83.51,83.95] 14.90 [14.67,15.12] 55-64 5,809 0.52 [0.50,0.53] 78.25 [78.14,78.36] 21.23 [21.12,21.34] 15-44 17,400 3.68 [3.11,4.36] 92.56 [91.78,93.27] 3.75 [3.34,4.21] 45-64 11,694 1.06 [0.77,1.47] 81.76 [80.38,83.06] 17.17 [15.82,18.61]
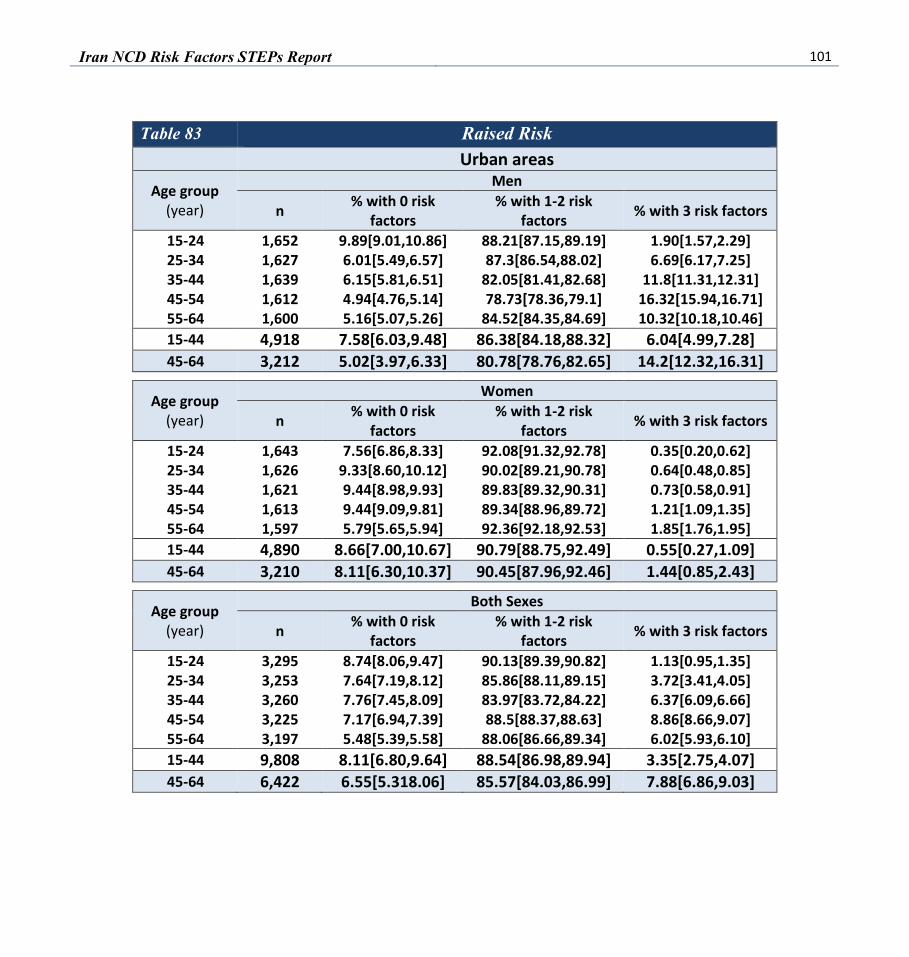
Iran NCD Risk Factors STEPs Report 101
Table 83 Raised Risk Urban areas
Age group (year)
Men
n % with 0 risk factors
% with 1-2 risk factors % with 3 risk factors
15-24 1,652 9.89[9.01,10.86] 88.21[87.15,89.19] 1.90[1.57,2.29] 25-34 1,627 6.01[5.49,6.57] 87.3[86.54,88.02] 6.69[6.17,7.25] 35-44 1,639 6.15[5.81,6.51] 82.05[81.41,82.68] 11.8[11.31,12.31] 45-54 1,612 4.94[4.76,5.14] 78.73[78.36,79.1] 16.32[15.94,16.71] 55-64 1,600 5.16[5.07,5.26] 84.52[84.35,84.69] 10.32[10.18,10.46] 15-44 4,918 7.58[6.03,9.48] 86.38[84.18,88.32] 6.04[4.99,7.28] 45-64 3,212 5.02[3.97,6.33] 80.78[78.76,82.65] 14.2[12.32,16.31]
Age group (year)
Women
n % with 0 risk factors
% with 1-2 risk factors % with 3 risk factors
15-24 1,643 7.56[6.86,8.33] 92.08[91.32,92.78] 0.35[0.20,0.62] 25-34 1,626 9.33[8.60,10.12] 90.02[89.21,90.78] 0.64[0.48,0.85] 35-44 1,621 9.44[8.98,9.93] 89.83[89.32,90.31] 0.73[0.58,0.91] 45-54 1,613 9.44[9.09,9.81] 89.34[88.96,89.72] 1.21[1.09,1.35] 55-64 1,597 5.79[5.65,5.94] 92.36[92.18,92.53] 1.85[1.76,1.95] 15-44 4,890 8.66[7.00,10.67] 90.79[88.75,92.49] 0.55[0.27,1.09] 45-64 3,210 8.11[6.30,10.37] 90.45[87.96,92.46] 1.44[0.85,2.43]
Age group (year)
Both Sexes
n % with 0 risk factors
% with 1-2 risk factors % with 3 risk factors
15-24 3,295 8.74[8.06,9.47] 90.13[89.39,90.82] 1.13[0.95,1.35] 25-34 3,253 7.64[7.19,8.12] 85.86[88.11,89.15] 3.72[3.41,4.05] 35-44 3,260 7.76[7.45,8.09] 83.97[83.72,84.22] 6.37[6.09,6.66] 45-54 3,225 7.17[6.94,7.39] 88.5[88.37,88.63] 8.86[8.66,9.07] 55-64 3,197 5.48[5.39,5.58] 88.06[86.66,89.34] 6.02[5.93,6.10] 15-44 9,808 8.11[6.80,9.64] 88.54[86.98,89.94] 3.35[2.75,4.07] 45-64 6,422 6.55[5.318.06] 85.57[84.03,86.99] 7.88[6.86,9.03]

102 Iran NCD Risk Factors STEPs Report
Table 84 Raised Risk Rural areas
Age group (year)
Men
n % with 0 risk factors % with 1-2 risk factors % with 3 risk
factors 15-24 1,379 5.88 [5.26,6.55] 93.12 [92.30,93.86] 1.01[0.70,1.45] 25-34 1,352 4.63 [4.26,5.04] 90.29 [89.83,90.74] 5.07[4.68,5.50] 35-44 1,367 3.07 [2.86,3.30] 89.71 [89.35,90.06] 7.22[6.93,7.52] 45-54 1,354 3.11 [2.98,3.23] 87.99 [87.67,88.30] 8.91[8.62,9.20] 55-64 1,348 1.53 [1.49,1.57] 90.67 [90.52,90.82] 7.80[7.67,7.94] 15-44 4,098 4.79 [3.70,6.19] 91.34 [89.91,92.59] 3.86[3.18,4.69] 45-64 2,702 2.56 [1.92,3.40] 88.92 [86.79,90.74] 8.52[6.93,10.44]
Age group (year)
Women
n % with 0 risk factors % with 1-2 risk factors % with 3 risk
factors 15-24 1,380 5.91 [5.34,6.55] 94.09 [93.45,94.66] 0 25-34 1,372 5.98 [5.53,6.46] 92.68 [92.18,93.15] 1.34 [0.99,1.82] 35-44 1,363 5.63 [5.31,5.96] 94.19 [93.86,94.50] 0.18 [0.14,0.22] 45-54 1,382 5.11 [4.93,5.30] 94.13 [93.94,94.31] 0.76 [0.69,0.84] 55-64 1,342 3.48 [3.39,3.58] 95.93 [95.84,96.02] 0.58 [0.55,0.62] 15-44 4,115 5.87 [4.68,7.35] 93.61 [92.27,94.74] 0.51 [0.16,1.59] 45-64 2,724 4.51 [3.40,5.96] 94.79 [93.49,95.84] 0.70 [0.41,1.19]
Age group (year)
Both Sexes
n % with 0 risk factors % with 1-2 risk factors % with 3 risk
factors 15-24 2,759 5.89 [5.38,6.45] 93.60 [92.99,94.15] 0.51 [0.35,0.73] 25-34 2,724 5.29 [4.95,5.66] 91.47 [91.10,91.82] 3.24 [2.91,3.61] 35-44 2,730 4.33 [4.11,4.55] 91.91 [91.65,92.16] 3.78 [3.62,3.92] 45-54 2,736 4.09 [3.98,4.21] 91.02 [90.86,91.18] 4.89 [4.74,5.03] 55-64 2,690 2.52 [2.46,2.58] 93.34 [93.25,93.44] 4.14 [4.07,4.21] 15-44 8,213 5.33 [4.33,6.54] 92.47 [91.38,93.43] 2.20 [1.74,2.77] 45-64 5,426 3.54 [2.85,4.39] 91.87 [90.71,92.91] 4.58 [3.78,5.54]
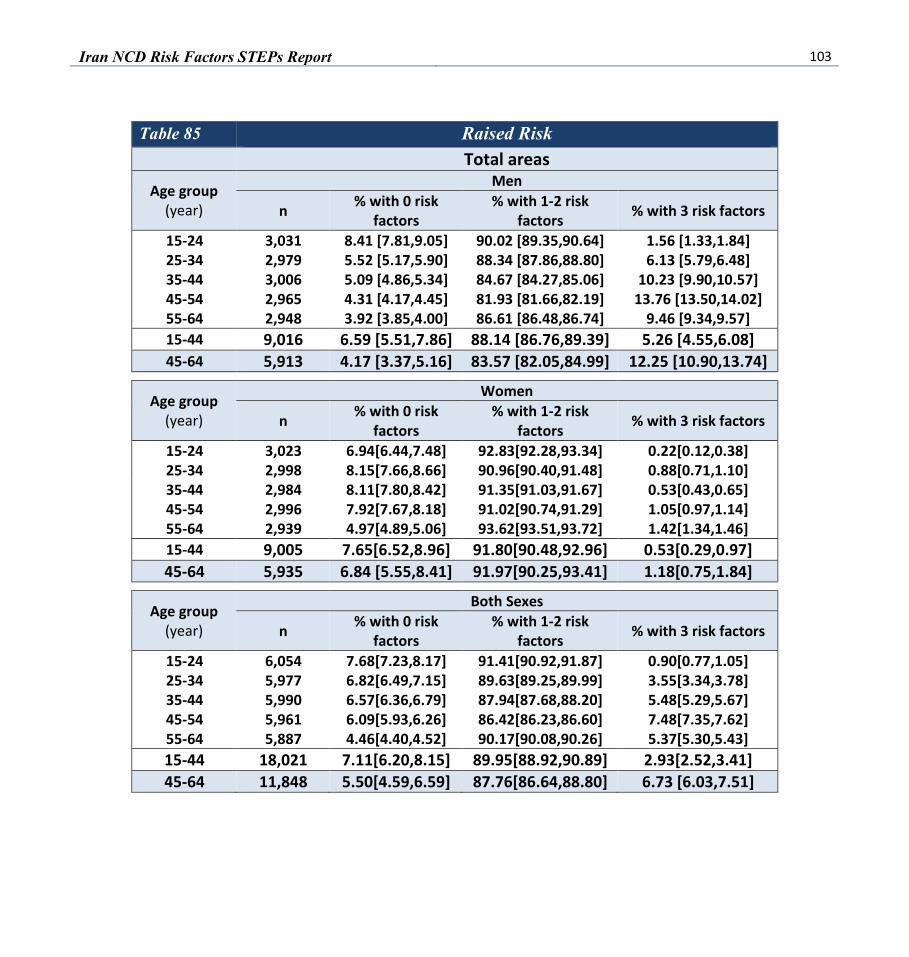
Iran NCD Risk Factors STEPs Report 103
Table 85 Raised Risk Total areas
Age group (year)
Men
n % with 0 risk factors
% with 1-2 risk factors % with 3 risk factors
15-24 3,031 8.41 [7.81,9.05] 90.02 [89.35,90.64] 1.56 [1.33,1.84] 25-34 2,979 5.52 [5.17,5.90] 88.34 [87.86,88.80] 6.13 [5.79,6.48] 35-44 3,006 5.09 [4.86,5.34] 84.67 [84.27,85.06] 10.23 [9.90,10.57] 45-54 2,965 4.31 [4.17,4.45] 81.93 [81.66,82.19] 13.76 [13.50,14.02] 55-64 2,948 3.92 [3.85,4.00] 86.61 [86.48,86.74] 9.46 [9.34,9.57] 15-44 9,016 6.59 [5.51,7.86] 88.14 [86.76,89.39] 5.26 [4.55,6.08] 45-64 5,913 4.17 [3.37,5.16] 83.57 [82.05,84.99] 12.25 [10.90,13.74]
Age group (year)
Women
n % with 0 risk factors
% with 1-2 risk factors % with 3 risk factors
15-24 3,023 6.94[6.44,7.48] 92.83[92.28,93.34] 0.22[0.12,0.38] 25-34 2,998 8.15[7.66,8.66] 90.96[90.40,91.48] 0.88[0.71,1.10] 35-44 2,984 8.11[7.80,8.42] 91.35[91.03,91.67] 0.53[0.43,0.65] 45-54 2,996 7.92[7.67,8.18] 91.02[90.74,91.29] 1.05[0.97,1.14] 55-64 2,939 4.97[4.89,5.06] 93.62[93.51,93.72] 1.42[1.34,1.46] 15-44 9,005 7.65[6.52,8.96] 91.80[90.48,92.96] 0.53[0.29,0.97] 45-64 5,935 6.84 [5.55,8.41] 91.97[90.25,93.41] 1.18[0.75,1.84]
Age group (year)
Both Sexes
n % with 0 risk factors
% with 1-2 risk factors % with 3 risk factors
15-24 6,054 7.68[7.23,8.17] 91.41[90.92,91.87] 0.90[0.77,1.05] 25-34 5,977 6.82[6.49,7.15] 89.63[89.25,89.99] 3.55[3.34,3.78] 35-44 5,990 6.57[6.36,6.79] 87.94[87.68,88.20] 5.48[5.29,5.67] 45-54 5,961 6.09[5.93,6.26] 86.42[86.23,86.60] 7.48[7.35,7.62] 55-64 5,887 4.46[4.40,4.52] 90.17[90.08,90.26] 5.37[5.30,5.43] 15-44 18,021 7.11[6.20,8.15] 89.95[88.92,90.89] 2.93[2.52,3.41] 45-64 11,848 5.50[4.59,6.59] 87.76[86.64,88.80] 6.73 [6.03,7.51]

104 Iran NCD Risk Factors STEPs Report
Appendix

Iran NCD Risk Factors STEPs Report 105
Fish Consumption
Table 86 Number of servings of fish on average per week Urban areas
Age group (year)
Men
n %no fish consum
ption %95CI %1
servings %95CI %2 servings %95CI %3
servings %95CI %≥4 servings %95CI
15-24 1,648 66.29 [64.83,67.73] 21.78 [20.73,22.86] 8.32 [7.66,9.03] 2.86 [2.47,3.30] 0.74 [0.58,0.96] 25-34 1,623 62.62 [61.73,63.51] 25.66 [24.88,26.45] 7.56 [7.12,8.04] 3.31 [3.00,3.66] 0.84 [0.65,1.07] 35-44 1,636 63.29 [62.41,64.15] 23.03 [22.25,23.82] 10.66 [10.19,11.15] 2.04 [1.91,2.17] 0.99 [0.89,1.09] 45-54 1,613 65.54 [65.02,66.06] 23.67 [23.19,24.16] 7.94 [7.65,8.25] 1.99 [1.88,2.10] 0.85 [0.79,0.92] 55-64 1,597 70.76 [70.49,71.02] 19.54 [19.29,19.79] 6.48 [6.36,6.60] 2.22 [2.16,2.27] 1.01 [0.93,1.08] 15-64 8,117 64.98 [62.12,67.74] 23.12 [21.02,25.36] 8.39 [7.22,9.72] 2.67 [2.16,3.30] 0.84 [0.58,1.23]
Age group (year)
Women
n %no fish consum
ption %95CI %1
servings %95CI %2 servings %95CI %3
servings %95CI %≥4 servings %95CI
15-24 1,643 63.22 [61.98,64.43] 23.86 [22.75,25.01] 10.03 [9.32,10.79] 1.94 [1.62,2.33] 0.94 [0.77,1.16] 25-34 1,620 62.52 [61.49,63.53] 24.29 [23.39,25.23] 9.86 [9.22,10.55] 2.29 [2.12,2.48] 1.03 [0.85,1.24] 35-44 1,619 63.44 [62.65,64.23] 24.39 [23.73,25.07] 9.36 [9.06,9.66] 2.32 [2.17,2.47] 0.49 [0.43,0.55] 45-54 1,612 70.18 [69.65,70.71] 19.20 [18.77,19.64] 7.33 [7.12,7.56] 2.79 [2.63,2.95] 0.49 [0.45,0.54] 55-64 1,595 71.93 [71.65,72.21] 18.40 [18.17,18.63] 5.57 [5.46,5.69] 2.82 [2.74,2.89] 1.28 [1.23,1.34] 15-64 8,089 64.58 [61.75,67.31] 23.09 [20.81,25.55] 9.21 [8.02,10.56] 2.27 [1.83,2.81] 0.85 [0.57,1.26]
Age group (year)
Both Sexes
n %no fish consum
ption %95CI %1
servings %95CI %2 servings %95CI %3
servings %95CI %≥4 servings %95CI
15-24 3,291 64.77 [63.68,65.84] 22.81 [21.92,23.72] 9.17 [8.63,9.74] 2.41 [2.14,2.70] 0.84 [0.70,1.02] 25-34 3,243 62.57 [61.83,63.31] 24.99 [24.36,25.63] 8.69 [8.26,9.15] 2.81 [2.62,3.02] 0.93 [0.80,1.09] 35-44 3,255 63.36 [62.69,64.03] 23.7 [23.16,24.25] 10.02 [9.72,10.33] 2.17 [2.06,2.29] 0.74 [0.68,0.81] 45-54 3,225 67.83 [67.41,68.26] 21.46 [21.10,21.83] 7.64 [7.44,7.85] 2.38 [2.29,2.48] 0.68 [0.63,0.72] 55-64 3,192 71.35 [71.11,71.6] 18.96 [18.75,19.17] 6.02 [5.94,6.10] 2.52 [2.47,2.57] 1.15 [1.10,1.19] 15-64 16,206 64.78 [62.22,67.26] 23.1 [21.18,25.15] 8.79 [7.79,9.91] 2.47 [2.10,2.91] 0.85 [0.63,1.14]

106 Iran NCD Risk Factors STEPs Report
Table 87 Number of servings of fish on average per week Rural areas
Age group (year)
Men
n %no fish consum
ption %95CI %1
servings %95CI %2 servings %95CI %3
servings %95CI %≥4 servings %95CI
15-24 1,371 67.55 [66.28,68.79] 18.06 [17.14,19.01] 7.98 [7.41,8.58] 3.07 [2.71,3.48] 3.35 [2.86,3.91] 25-34 1,348 64.59 [63.68,65.49] 19.58 [18.73,20.46] 8.38 [7.83,8.95] 3.79 [3.54,4.05] 3.67 [3.27,4.11] 35-44 1,363 67.53 [66.85,68.20] 17.93 [17.30,18.58] 9.06 [8.64,9.50] 3.06 [2.85,3.29] 2.41 [2.22,2.62] 45-54 1,352 69.45 [68.96,69.94] 16.69 [16.32,17.06] 7.58 [7.32,7.85] 3.17 [3.00,3.35] 3.12 [2.96,3.28] 55-64 1,343 73.71 [73.44,73.99] 15.68 [15.46,15.90] 6.07 [5.95,6.18] 1.98 [1.94,2.03] 2.56 [2.49,2.63] 15-64 6,777 67.42 [64.75,69.99] 18.10 [16.16,20.21] 8.10 [7.04,9.31] 3.20 [2.60,3.93] 3.18 [2.24,4.48]
Age group (year)
Women
n %no fish consum
ption %95CI %1
servings %95CI %2 servings %95CI %3
servings %95CI %≥4 servings %95CI
15-24 1,376 67.41 [66.17,68.62] 16.27 [15.33,17.25] 9.17 [8.56,9.82] 3.36 [3.03,3.74] 3.79 [3.36,4.27] 25-34 1,368 65.43 [64.31,66.54] 19.41 [18.39,20.47] 8.47 [7.98,8.98] 3.85 [3.56,4.16] 2.85 [2.51,3.22] 35-44 1,361 68.85 [68.17,69.52] 16.75 [16.25,17.27] 8.53 [8.28,8.78] 3.16 [2.97,3.37] 2.71 [2.50,2.94] 45-54 1,374 69.42 [69.03,69.80] 17.98 [17.61,18.34] 6.34 [6.18,6.51] 3.47 [3.30,3.64] 2.79 [2.66,2.93] 55-64 1,335 74.52 [74.25,74.80] 12.48 [12.28,12.69] 7.60 [7.44,7.75] 2.17 [2.11,2.22] 3.23 [3.15,3.31] 15-64 6,814 67.91 [65.04,70.66] 17.12 [15.01,19.46] 8.4 [7.32,9.61] 3.38 [2.77,4.12] 3.18 [2.29,4.41]
Age group (year)
Both Sexes
n %no fish consum
ption %95CI %1
servings %95CI %2 servings %95CI %3
servings %95CI %≥4 servings %95CI
15-24 2,747 67.48 [66.38,68.56] 17.17 [16.42,17.95] 8.57 [8.14,9.01] 3.22 [2.95,3.51] 3.57 [3.15,4.03] 25-34 2,716 65.00 [64.15,65.85] 19.50 [18.69,20.32] 8.42 [8.01,8.85] 3.82 [3.62,4.03] 3.26 [2.92,3.64] 35-44 2,724 68.18 [67.58,68.76] 17.35 [16.91,17.80] 8.80 [8.56,9.05] 3.11 [2.94,3.29] 2.56 [2.41,2.72] 45-54 2,726 69.43 [69.05,69.81] 17.32 [16.99,17.66] 6.97 [6.80,7.14] 3.32 [3.17,3.46] 2.96 [2.83,3.09] 55-64 2,678 74.13 [73.87,74.38] 14.05 [13.87,14.25] 6.84 [6.73,6.96] 2.08 [2.04,2.11] 2.90 [2.84,2.96] 15-64 13,591 67.67 [65.06,70.16] 17.61 [15.81,19.58] 8.25 [7.34,9.25] 3.29 [2.78,3.89] 3.18 [2.30,4.37]
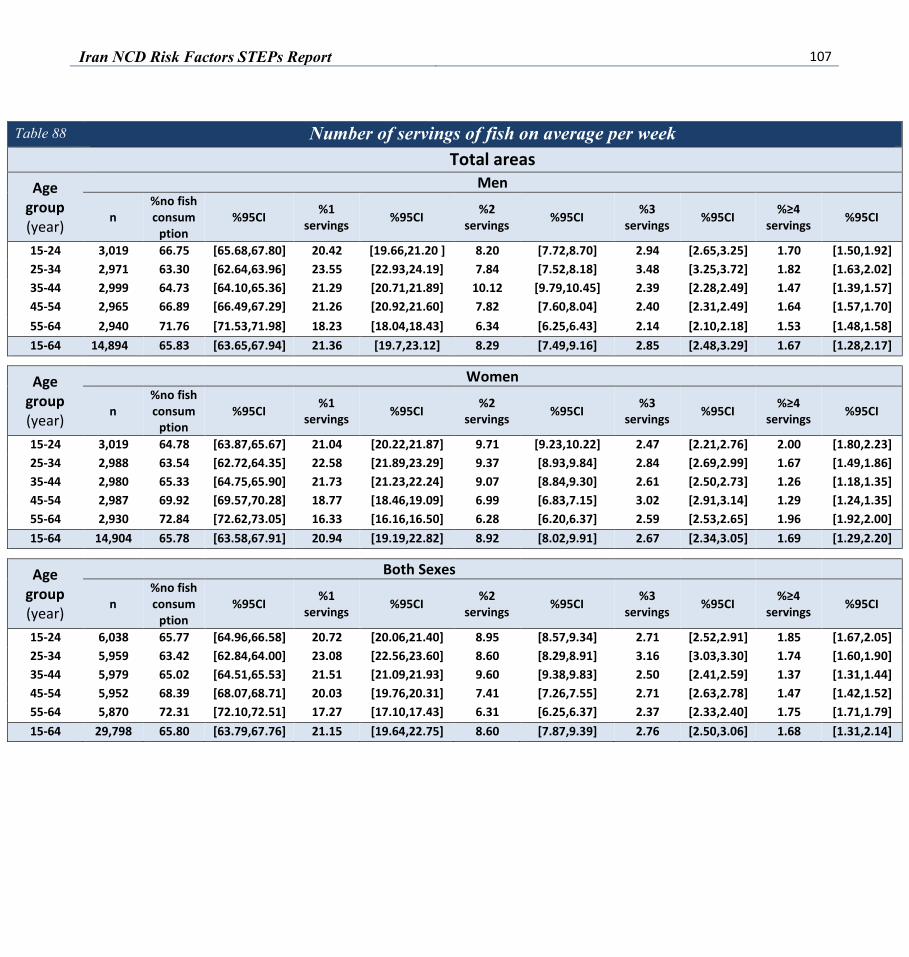
Iran NCD Risk Factors STEPs Report 107
Table 88 Number of servings of fish on average per week Total areas
Age group (year)
Men
n %no fish consum
ption %95CI %1
servings %95CI %2 servings %95CI %3
servings %95CI %≥4 servings %95CI
15-24 3,019 66.75 [65.68,67.80] 20.42 [19.66,21.20 ] 8.20 [7.72,8.70] 2.94 [2.65,3.25] 1.70 [1.50,1.92] 25-34 2,971 63.30 [62.64,63.96] 23.55 [22.93,24.19] 7.84 [7.52,8.18] 3.48 [3.25,3.72] 1.82 [1.63,2.02] 35-44 2,999 64.73 [64.10,65.36] 21.29 [20.71,21.89] 10.12 [9.79,10.45] 2.39 [2.28,2.49] 1.47 [1.39,1.57] 45-54 2,965 66.89 [66.49,67.29] 21.26 [20.92,21.60] 7.82 [7.60,8.04] 2.40 [2.31,2.49] 1.64 [1.57,1.70] 55-64 2,940 71.76 [71.53,71.98] 18.23 [18.04,18.43] 6.34 [6.25,6.43] 2.14 [2.10,2.18] 1.53 [1.48,1.58] 15-64 14,894 65.83 [63.65,67.94] 21.36 [19.7,23.12] 8.29 [7.49,9.16] 2.85 [2.48,3.29] 1.67 [1.28,2.17]
Age group (year)
Women
n %no fish consum
ption %95CI %1
servings %95CI %2 servings %95CI %3
servings %95CI %≥4 servings %95CI
15-24 3,019 64.78 [63.87,65.67] 21.04 [20.22,21.87] 9.71 [9.23,10.22] 2.47 [2.21,2.76] 2.00 [1.80,2.23] 25-34 2,988 63.54 [62.72,64.35] 22.58 [21.89,23.29] 9.37 [8.93,9.84] 2.84 [2.69,2.99] 1.67 [1.49,1.86] 35-44 2,980 65.33 [64.75,65.90] 21.73 [21.23,22.24] 9.07 [8.84,9.30] 2.61 [2.50,2.73] 1.26 [1.18,1.35] 45-54 2,987 69.92 [69.57,70.28] 18.77 [18.46,19.09] 6.99 [6.83,7.15] 3.02 [2.91,3.14] 1.29 [1.24,1.35] 55-64 2,930 72.84 [72.62,73.05] 16.33 [16.16,16.50] 6.28 [6.20,6.37] 2.59 [2.53,2.65] 1.96 [1.92,2.00] 15-64 14,904 65.78 [63.58,67.91] 20.94 [19.19,22.82] 8.92 [8.02,9.91] 2.67 [2.34,3.05] 1.69 [1.29,2.20]
Age group (year)
Both Sexes
n %no fish consum
ption %95CI %1
servings %95CI %2 servings %95CI %3
servings %95CI %≥4 servings %95CI
15-24 6,038 65.77 [64.96,66.58] 20.72 [20.06,21.40] 8.95 [8.57,9.34] 2.71 [2.52,2.91] 1.85 [1.67,2.05] 25-34 5,959 63.42 [62.84,64.00] 23.08 [22.56,23.60] 8.60 [8.29,8.91] 3.16 [3.03,3.30] 1.74 [1.60,1.90] 35-44 5,979 65.02 [64.51,65.53] 21.51 [21.09,21.93] 9.60 [9.38,9.83] 2.50 [2.41,2.59] 1.37 [1.31,1.44] 45-54 5,952 68.39 [68.07,68.71] 20.03 [19.76,20.31] 7.41 [7.26,7.55] 2.71 [2.63,2.78] 1.47 [1.42,1.52] 55-64 5,870 72.31 [72.10,72.51] 17.27 [17.10,17.43] 6.31 [6.25,6.37] 2.37 [2.33,2.40] 1.75 [1.71,1.79] 15-64 29,798 65.80 [63.79,67.76] 21.15 [19.64,22.75] 8.60 [7.87,9.39] 2.76 [2.50,3.06] 1.68 [1.31,2.14]

108 Iran NCD Risk Factors STEPs Report
Insurance Coverage Table 89 Percentage who are insured by sex and age group
Urban areas Age
Group (years)
Men Women Both Sexes
n % 95% CI n % 95% CI n % 95% CI
15-24 1,649 64.48 [63.12,65.81] 1,644 73.40 [72.34,74.43] 3,293 68.90 [67.92,69.86] 25-34 1,619 61.54 [60.67,62.40] 1,623 73.04 [72.22,73.84] 3,242 67.19 [66.62,67.76] 35-44 1,638 68.34 [67.64,69.03] 1,619 77.85 [77.29,78.41] 3,257 73.00 [72.51,73.49] 45-54 1,615 74.48 [73.98,74.96] 1,611 78.43 [78.01,78.84] 3,226 76.43 [76.07,76.79] 55-64 1,598 82.22 [82.01,82.44] 1,595 85.40 [85.17,85.63] 3,193 83.84 [83.65,84.02] 15-64 8,119 66.88 [64.70,68.98] 8,092 75.60 [73.62,77.48] 16,211 71.19 [69.41,72.90]
Rural areas Age
Group (years)
Men Women Both Sexes
n % 95% CI n % 95% CI n % 95% CI
15-24 1,375 93.95 [93.15,94.66] 1,374 95.28 [94.45,95.99] 2,749 94.61 [93.92,95.23] 25-34 1,351 91.88 [91.05,92.64] 1,367 94.53 [93.80,95.18] 2,718 93.18 [92.44,93.86] 35-44 1,363 93.56 [92.98,94.09] 1,360 95.66 [95.37,95.93] 2,723 94.59 [94.29,94.87] 45-54 1,354 94.94 [94.68,95.18] 1,378 94.83 [94.38,95.25] 2,732 94.89 [94.60,95.15] 55-64 1,344 96.93 [96.81,97.04] 1,339 97.25 [97.15,97.34] 2,683 97.09 [96.99,97.19] 15-64 6,787 93.66 [91.68,95.19] 6,818 95.24 [93.06,96.75] 13,605 94.44 [92.45,95.93]
Total Age
Group (years)
Men Women Both Sexes
n % 95% CI n % 95% CI n % 95% CI
15-24 3,024 75.30 [74.26,76.30] 3,018 81.55 [80.74,82.34] 6,042 78.39 [77.60,79.16] 25-34 2,970 72.12 [71.34,72.89] 2,990 80.59 [80.00,81.15] 5,960 76.28 [75.75,76.80] 35-44 3,001 76.95 [76.45,77.44] 2,979 84.07 [83.67,84.46] 5,980 80.44 [80.09,80.78] 45-54 2,969 81.55 [81.24,81.86] 2,990 84.18 [83.87,84.48] 5,959 82.85 [82.60,83.09] 55-64 2,942 87.21 [87.06,87.36] 2,934 89.57 [89.42,89.72] 5,876 88.41 [88.28,88.53] 15-64 14,906 76.36 [74.37,78.24] 14,911 82.66 [81.09,84.12] 29,817 79.47 [77.85,81.00]
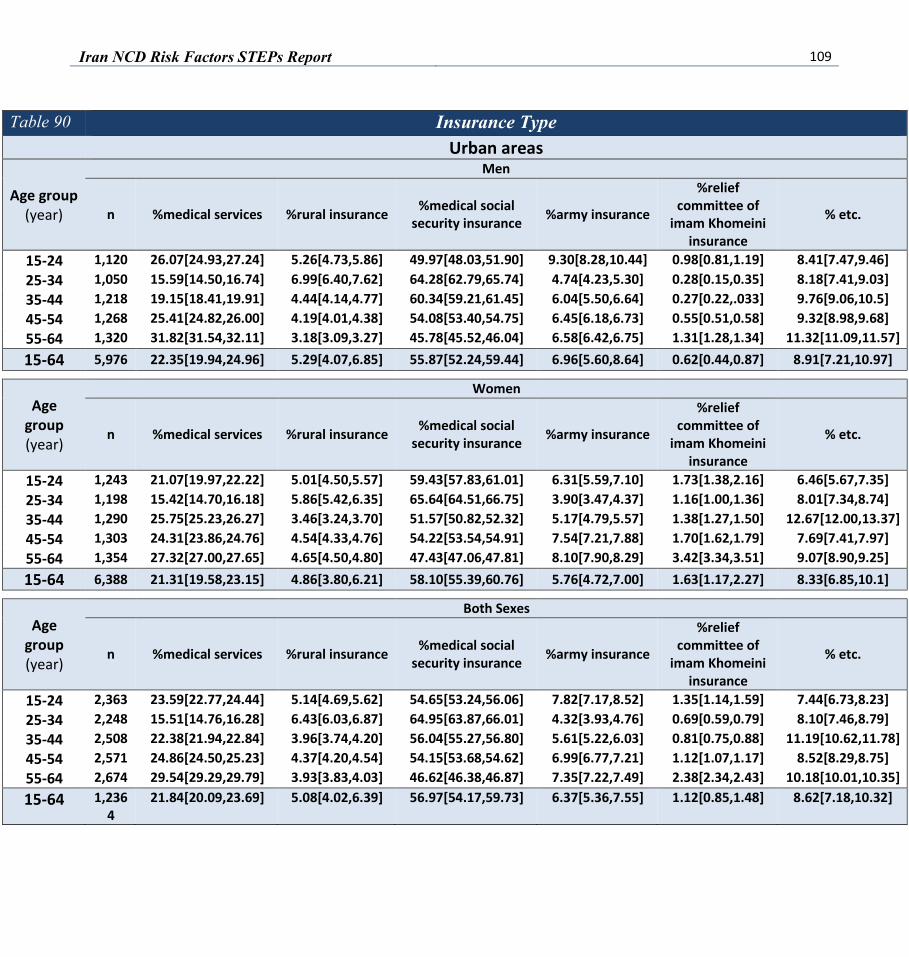
Iran NCD Risk Factors STEPs Report 109
Table 90 Insurance Type Urban areas
Age group (year)
Men
n %medical services %rural insurance %medical social security insurance %army insurance
%relief committee of
imam Khomeini insurance
% etc.
15-24 1,120 26.07[24.93,27.24] 5.26[4.73,5.86] 49.97[48.03,51.90] 9.30[8.28,10.44] 0.98[0.81,1.19] 8.41[7.47,9.46] 25-34 1,050 15.59[14.50,16.74] 6.99[6.40,7.62] 64.28[62.79,65.74] 4.74[4.23,5.30] 0.28[0.15,0.35] 8.18[7.41,9.03] 35-44 1,218 19.15[18.41,19.91] 4.44[4.14,4.77] 60.34[59.21,61.45] 6.04[5.50,6.64] 0.27[0.22,.033] 9.76[9.06,10.5] 45-54 1,268 25.41[24.82,26.00] 4.19[4.01,4.38] 54.08[53.40,54.75] 6.45[6.18,6.73] 0.55[0.51,0.58] 9.32[8.98,9.68] 55-64 1,320 31.82[31.54,32.11] 3.18[3.09,3.27] 45.78[45.52,46.04] 6.58[6.42,6.75] 1.31[1.28,1.34] 11.32[11.09,11.57] 15-64 5,976 22.35[19.94,24.96] 5.29[4.07,6.85] 55.87[52.24,59.44] 6.96[5.60,8.64] 0.62[0.44,0.87] 8.91[7.21,10.97]
Age group (year)
Women
n %medical services %rural insurance %medical social security insurance %army insurance
%relief committee of
imam Khomeini insurance
% etc.
15-24 1,243 21.07[19.97,22.22] 5.01[4.50,5.57] 59.43[57.83,61.01] 6.31[5.59,7.10] 1.73[1.38,2.16] 6.46[5.67,7.35] 25-34 1,198 15.42[14.70,16.18] 5.86[5.42,6.35] 65.64[64.51,66.75] 3.90[3.47,4.37] 1.16[1.00,1.36] 8.01[7.34,8.74] 35-44 1,290 25.75[25.23,26.27] 3.46[3.24,3.70] 51.57[50.82,52.32] 5.17[4.79,5.57] 1.38[1.27,1.50] 12.67[12.00,13.37] 45-54 1,303 24.31[23.86,24.76] 4.54[4.33,4.76] 54.22[53.54,54.91] 7.54[7.21,7.88] 1.70[1.62,1.79] 7.69[7.41,7.97] 55-64 1,354 27.32[27.00,27.65] 4.65[4.50,4.80] 47.43[47.06,47.81] 8.10[7.90,8.29] 3.42[3.34,3.51] 9.07[8.90,9.25] 15-64 6,388 21.31[19.58,23.15] 4.86[3.80,6.21] 58.10[55.39,60.76] 5.76[4.72,7.00] 1.63[1.17,2.27] 8.33[6.85,10.1]
Age group (year)
Both Sexes
n %medical services %rural insurance %medical social security insurance %army insurance
%relief committee of
imam Khomeini insurance
% etc.
15-24 2,363 23.59[22.77,24.44] 5.14[4.69,5.62] 54.65[53.24,56.06] 7.82[7.17,8.52] 1.35[1.14,1.59] 7.44[6.73,8.23] 25-34 2,248 15.51[14.76,16.28] 6.43[6.03,6.87] 64.95[63.87,66.01] 4.32[3.93,4.76] 0.69[0.59,0.79] 8.10[7.46,8.79] 35-44 2,508 22.38[21.94,22.84] 3.96[3.74,4.20] 56.04[55.27,56.80] 5.61[5.22,6.03] 0.81[0.75,0.88] 11.19[10.62,11.78] 45-54 2,571 24.86[24.50,25.23] 4.37[4.20,4.54] 54.15[53.68,54.62] 6.99[6.77,7.21] 1.12[1.07,1.17] 8.52[8.29,8.75] 55-64 2,674 29.54[29.29,29.79] 3.93[3.83,4.03] 46.62[46.38,46.87] 7.35[7.22,7.49] 2.38[2.34,2.43] 10.18[10.01,10.35] 15-64 1,236
4 21.84[20.09,23.69] 5.08[4.02,6.39] 56.97[54.17,59.73] 6.37[5.36,7.55] 1.12[0.85,1.48] 8.62[7.18,10.32]

110 Iran NCD Risk Factors STEPs Report
Table 91 Insurance Type Rural areas
Age group (year)
Men
n %medical services %rural insurance %medical social
security insurance %army insurance
%relief committee of
imam Khomeini insurance
% etc.
15-24 1,299 5.04[4.52,5.62] 77.51[76.05,78.90] 14.36[13.14,15.67] 1.90[1.63,2.21] 0.21[0.15,0.31] 0.98[0.81,1.19] 25-34 1,256 5.58[5.12,6.08] 75.02[74.08,75.94] 17.58[16.75,18.45] 1.02[0.87,1.20] 0.11[0.08,0.16] 0.68[0.56,0.82] 35-44 1,295 10.32[9.97,10.67] 68.36[67.68,69.03] 18.39[17.69,19.10] 1.40[1.08,1.72] 0.16[0.12,0.22] 1.38[1.24,1.54] 45-54 1,301 9.36[9.01,9.71] 70.29[69.69,70.89] 17.18[16.58,17.80] 1.53[1.41,1.66] 0.20[0.17,0.23] 1.43[1.35,1.52] 55-64 1,310 8.28[8.12,8.43] 72.91[72.67,73.14] 14.22[14.03,14.42] 2.52[2.41,2.64] 1.02[0.98,1.06] 1.06[1.02,1.1] 15-64 6,461 6.92[5.84,8.19] 73.94[71.04,76.65] 16.30[13.95,18.95] 1.57[1.08,2.28] 0.23[0.13,0.42] 1.04[0.76,1.42]
Age group (year)
Women
n %medical services %rural insurance %medical social
security insurance %army insurance
%relief committee of
imam Khomeini insurance
% etc.
15-24 1,326 4.73[4.05,5.52] 78.41[76.93,79.83] 14.69[13.81,15.60] 0.78[0.58,1.04] 0.63[0.45,0.88] 0.76[0.58,0.99] 25-34 1,315 5.71[5.12,6.35] 76.87[75.97,77.74] 15.82[14.96,16.71] 0.59[0.48,0.72] 0.28[0.20,0.37] 0.74[0.59,0.93] 35-44 1,316 8.89[8.44,9.36] 69.18[68.41,69.94] 18.41[17.86,18.96] 2.42[2.16,2.72] 0.41[0.36,0.48] 0.68[0.61,0.76] 45-54 1,333 4.66[4.48,4.86] 74.43[73.89,74.97] 16.19[15.75,16.64] 1.84[1.71,1.98] 0.66[0.59,0.75] 2.21[2.09,2.34] 55-64 1,308 6.50[6.36,6.64] 71.83[71.54,72.12] 14.30[14.10,14.50] 3.85[3.74,3.96] 1.99[1.88,2.06] 1.56[1.50,1.62] 15-64 6,598 5.85[4.47,7.63] 75.36[72.14,78.33] 15.82[13.61,18.32] 1.38[.968,1.97] 0.60[0.35,1.03] 0.98[0.69,1.39]
Age group (year)
Both Sexes
n %medical services %rural insurance %medical social
security insurance %army insurance
%relief committee of
imam Khomeini insurance
% etc.
15-24 2,625 4.89[4.44,5.38] 77.96[76.68,79.18] 14.52[13.67,15.42] 1.34[1.14,1.59] 0.43[0.32,0.55] 0.87[0.73,1.04] 25-34 2,571 5.64[5.27,6.04] 75.93[75.16,76.68] 16.71[16.06,17.39] 0.81[0.71,0.92] 0.19[0.15,0.24] 0.71[0.60,0.84] 35-44 2,611 9.62[9.30,9.95] 68.76[68.13,69.39] 18.40[17.86,18.95] 1.90[1.66,2.17] 0.29[0.25,0.33] 1.04[0.95,1.13] 45-54 2,634 7.04[6.80,7.29] 72.34[71.86,72.82] 16.69[16.27,17.12] 1.68[1.57,1.80] 0.43[0.38,0.48] 1.82[1.74,1.90] 55-64 2,618 7.37[7.25,7.49] 72.36[72.14,72.58] 14.26[14.09,14.43] 3.19[3.09,3.30] 1.50[1.46,1.54] 1.31[1.27,1.35] 15-64 13,059 6.40[5.36,7.61] 74.65[71.75,77.34] 16.06[14.02,18.33] 1.48[1.09,2.00] 0.41[0.27,0.62] 1.01[0.77,1.32]

Iran NCD Risk Factors STEPs Report 111
Table 92 Insurance Type Total areas
Age group (year)
Men
n %medical servicies %rural insurance %medical social security insurance %army insurance
%relief committee of
imam Khomeini insurance
% etc.
15-24 2,419 16.84[15.99,17.73] 36.97[35.03,38.95] 34.34[32.85,35.86] 6.05[5.45,6.72] 0.64[0.54,0.77] 5.15[4.59,5.78] 25-34 2,306 11.35[10.68,12.06] 35.77[34.47,37.1] 44.52[43.25,45.8] 3.16[2.85,3.51] 0.18[0.13,.248] 5.01[4.55,5.51] 35-44 2,513 15.74[15.26,16.23] 29.13[28.24,30.04] 44.13[43.11,45.16] 4.24[3.89,4.63] 0.23[0.19,0.27] 6.52[6.09,6.99] 45-54 2,569 19.28[18.89,19.66] 29.45[28.88,30.03] 39.98[39.45,40.52] 4.57[4.39,4.76] 0.41[0.39,0.44] 6.31[6.07,6.56] 55-64 2,630 23.10[22.9,23.31] 28.99[28.68,29.31] 34.10[33.9,34.30] 5.08[4.96,5.20] 1.20[1.17,1.23] 7.52[7.36,7.69] 15-64 12,437 15.93[14.18,17.85] 33.72[29.1,38.67] 39.51[35.9,43.24] 4.71[3.85,5.74] 0.45[0.33,0.62] 5.67[4.57,7.02]
Age group (year)
Women
n %medical servicies %rural insurance %medical social security insurance %army insurance
%relief committee of
imam Khomeini insurance
% etc.
15-24 2,569 14.19[13.34,15.08] 35.91[34.03,37.83] 40.60[39.22,41.99] 3.98[3.52,4.50] 1.26[1.05,1.52] 4.06[3.58,4.59] 25-34 2,513 11.59[11.06,12.15] 33.88[32.55,35.24] 45.98[44.88,47.08] 2.59[2.33,2.87] 0.81[0.71,0.94] 5.14[4.71,5.62] 35-44 2,606 19.21[18.81,19.61] 28.96[28.19,29.74] 38.70[38.1,39.31] 4.10[3.85,4.37] 1.01[0.93,1.09] 8.02[7.59,8.47] 45-54 2,637 16.91[16.57,17.25] 30.87[30.24,31.51] 39.89[39.4,40.39] 5.39[5.17,5.61] 1.31[1.25,1.37] 5.62[5.44,5.82] 55-64 2,662 19.47[19.24,19.71] 29.98[29.65,30.32] 34.94[34.68,35.2] 6.49[6.36,6.63] 2.87[2.82,2.93] 6.24[6.12,6.36] 15-64 12,987 15.15[13.54,16.9] 33.06[28.46,38.02] 41.16[38.09,44.29] 4.00[3.27,4.88] 1.22[0.91,1.63] 5.41[4.41,6.62]
Age group (year)
Both Sexes
n %medical servicies %rural insurance %medical social security insurance %army insurance
%relief committee of
imam Khomeini insurance
% etc.
15-24 4,988 15.53[14.82,16.27] 36.44[34.58,38.35] 37.44[36.16,38.73] 5.03[4.61,5.48] 0.95[0.83,1.09] 4.61[4.17,5.09] 25-34 4,819 11.47[11.00,11.96] 34.84[33.58,36.13] 45.24[44.16,46.31] 2.88[2.64,3.15] 0.49[0.43,0.56] 5.07[4.67,5.51] 35-44 5,119 17.44[17.12,17.76] 29.05[28.24,29.87] 41.47[40.74,42.2] 4.17[3.92,4.44] 0.61[0.57,0.65] 7.26[6.90,7.64] 45-54 5,206 18.11[17.82,18.4] 30.15[29.56,30.74] 39.94[39.53,40.35] 4.97[4.83,5.13] 0.86[0.82,0.89] 5.97[5.81,6.14] 55-64 5,292 21.26[21.07,21.45] 29.49[29.18,29.81] 34.53[34.34,34.72] 5.80[5.70,5.90] 2.05[2.02,2.08] 6.87[6.76,6.99] 15-64 25,424 15.54[14.06,17.16] 33.39[28.83,38.30] 40.33[37.12,43.61] 4.36[3.68,5.16] 0.83[0.65,1.06] 5.54[4.59,6.71]

112 Iran NCD Risk Factors STEPs Report
Traffic Accident Risk Factors
Table 93 Percentage who sit on front seat of car Urban areas
Age Group (years)
Men Women Both Sexes
n % 95% CI n % 95% CI n % 95% CI
15-24 1,652 94.44 [93.61,95.16] 1,645 83.68 [82.82,84.51] 3,297 89.11 [88.48,89.71] 25-34 1,626 94.56 [94.06,95.02] 1,625 85.51 [84.56,86.40] 3,251 90.11 [89.59,90.61] 35-44 1,640 95.74 [95.36,96.08] 1,621 88.27 [87.88,88.66] 3,261 92.08 [91.82,92.33] 45-54 1,616 94.86 [94.58,95.12] 1,614 81.04 [80.47,81.61] 3,230 88.04 [87.72,88.35] 55-64 1,601 92.70 [92.55,92.85] 1,597 78.23 [77.98,78.47] 3,198 85.35 [85.18,85.52] 15-64 8,135 94.65 [93.34,95.71] 8,102 84.27 [82.09,86.23] 16,237 89.52 [88.06,90.82]
Rural areas Age
Group (years)
Men Women Both Sexes
n % 95% CI n % 95% CI n % 95% CI
15-24 1,380 93.01 [92.31,93.65] 1,380 74.27 [73.04,75.47] 2,760 83.73 [83.13,84.32] 25-34 1,353 94.51 [94.07,94.92] 1,373 77.21 [76.49,77.92] 2,726 86.01 [85.63,86.39] 35-44 1,367 93.94 [93.53,94.32] 1,364 76.67 [76.11,77.22] 2,731 85.47 [85.14,85.80] 45-54 1,356 94.02 [93.83,94.21] 1,383 78.03 [77.69,78.36] 2,739 86.12 [85.93,86.32] 55-64 1,347 92.41 [92.27,92.54] 1,341 72.65 [72.40,72.90] 2,688 82.37 [82.22,82.53] 15-64 6,803 93.66 [92.29,94.81] 6,841 75.83 [73.67,77.88] 13,644 84.86 [83.73,85.92]
Total Age
Group (years)
Men Women Both Sexes
n % 95% CI n % 95% CI n % 95% CI
15-24 3,032 93.91 [93.35,94.43] 3,025 80.17 [79.4,80.92] 6,057 87.11 [86.67,87.54] 25-34 2,979 94.54 [94.19,94.87] 2,998 82.59 [82.00,83.17] 5,977 88.67 [88.33,89.00] 35-44 3,007 95.12 [94.86,95.37] 2,985 84.22 [83.88,84.55] 5,992 89.78 [89.57,89.98] 45-54 2,972 94.57 [94.38,94.75] 2,998 79.97 [79.57,80.37] 5,970 87.36 [87.14,87.58] 55-64 2,948 92.60 [92.49,92.71] 2,938 76.27 [76.08,76.45] 5,886 84.31 [84.18,84.43] 15-64 14,938 94.30 [93.42,95.07] 14,944 81.23 [79.66,82.72] 29,882 87.84 [86.89,88.74]

Iran NCD Risk Factors STEPs Report 113
Table 94 Percentage who traffic by motorcycle Urban areas
Age Group (years)
Men Women Both Sexes
n % 95% CI n % 95% CI n % 95% CI
15-24 1,652 56.84 [55.34,58.32] 1,645 37.01 [35.36,38.70] 3,297 47.02 [45.61,48.44] 25-34 1,625 55.54 [54.20,56.88] 1,625 36.89 [35.62,38.19] 3,250 46.38 [45.18,47.58] 35-44 1,640 48.42 [47.60,49.24] 1,619 33.00 [32.14,33.87] 3,259 40.86 [40.15,41.57] 45-54 1,616 40.07 [39.45,40.71] 1,613 30.46 [29.91,31.01] 3,229 35.33 [34.83,35.82] 55-64 1,600 34.24 [33.88,34.60] 1,597 25.40 [25.14,25.67] 3,197 29.75 [29.47,30.04] 15-64 8,133 51.30 [47.68,54.91] 8,099 34.60 [30.70,38.72] 16,232 43.05 [39.46,46.72]
Rural areas Age
Group (years)
Men Women Both Sexes
n % 95% CI n % 95% CI n % 95% CI
15-24 1,380 78.55 [77.46,79.60] 1,380 56.60 [55.41,57.79] 2,760 67.68 [66.68,68.67] 25-34 1,353 78.99 [78.06,79.89] 1,373 55.36 [54.18,56.53] 2,726 67.38 [66.44,68.30] 35-44 1,367 70.30 [69.68,70.92] 1,364 52.05 [51.28,52.82] 2,731 61.36 [60.76,61.95] 45-54 1,356 66.24 [65.77,66.70] 1,383 50.15 [49.53,50.78] 2,739 58.30 [57.86,58.73] 55-64 1,347 59.54 [59.21,59.88] 1,341 45.86 [45.58,46.14] 2,688 52.59 [52.34,52.85] 15-64 6,803 74.31 [71.49,76.93] 6,841 53.88 [50.60,57.12] 13,644 64.22 [61.43,66.91]
Total Age
Group (years)
Men Women Both Sexes
n % 95% CI n % 95% CI n % 95% CI
15-24 3,032 64.83 [63.51,66.13] 3,025 44.32 [42.74,45.92] 6,057 54.67 [53.31,56.04] 25-34 2,978 63.70 [62.49,64.90] 2,998 43.38 [42.22,44.55] 5,976 53.72 [52.60,54.83] 35-44 3,007 55.89 [55.14,56.64] 2,983 39.66 [38.87,40.46] 5,990 47.94 [47.24,48.64] 45-54 2,972 49.13 [48.56,49.69] 2,997 37.35 [36.81,37.88] 5,969 43.31 [42.83,43.79] 55-64 2,947 42.82 [42.49,43.15] 2,938 32.60 [32.35,32.86] 5,885 37.63 [37.36,37.91] 15-64 14,936 59.42 [55.78,62.96] 14,941 41.52 [37.64,45.51] 29,877 50.58 [46.92,54.23]
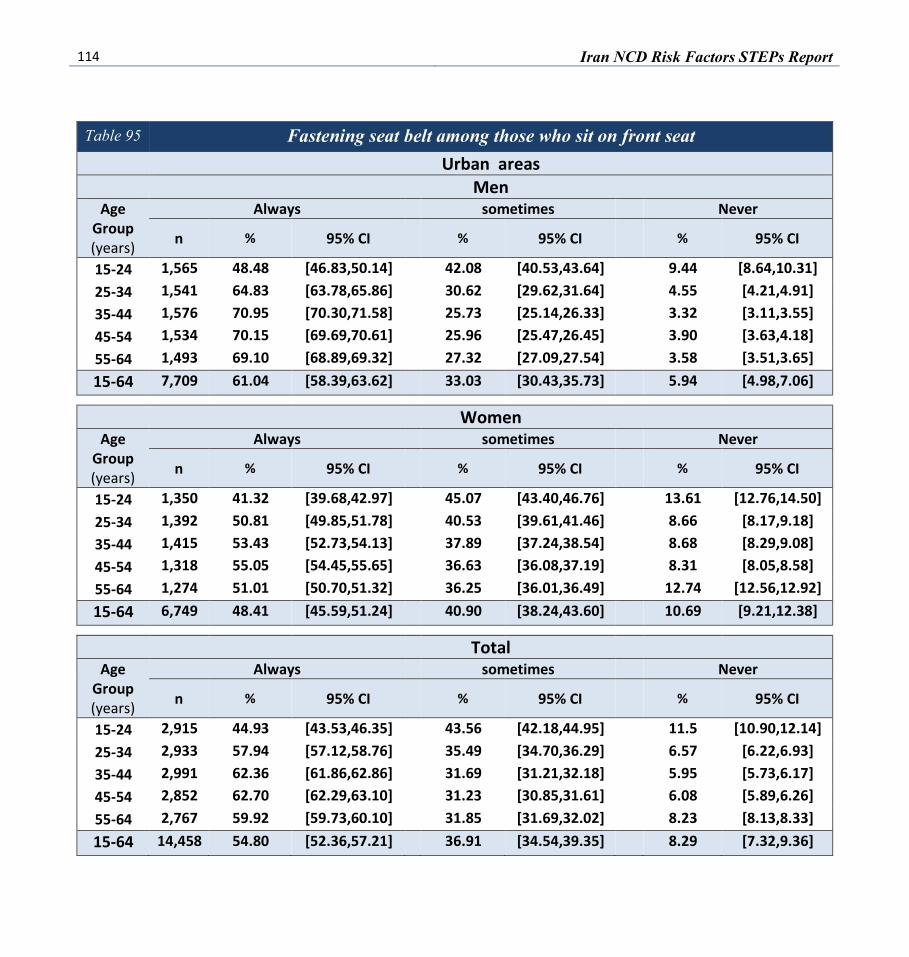
114 Iran NCD Risk Factors STEPs Report
Table 95 Fastening seat belt among those who sit on front seat Urban areas Men
Age Group (years)
Always sometimes Never
n % 95% CI % 95% CI % 95% CI
15-24 1,565 48.48 [46.83,50.14] 42.08 [40.53,43.64] 9.44 [8.64,10.31] 25-34 1,541 64.83 [63.78,65.86] 30.62 [29.62,31.64] 4.55 [4.21,4.91] 35-44 1,576 70.95 [70.30,71.58] 25.73 [25.14,26.33] 3.32 [3.11,3.55] 45-54 1,534 70.15 [69.69,70.61] 25.96 [25.47,26.45] 3.90 [3.63,4.18] 55-64 1,493 69.10 [68.89,69.32] 27.32 [27.09,27.54] 3.58 [3.51,3.65] 15-64 7,709 61.04 [58.39,63.62] 33.03 [30.43,35.73] 5.94 [4.98,7.06]
Women Age
Group (years)
Always sometimes Never
n % 95% CI % 95% CI % 95% CI
15-24 1,350 41.32 [39.68,42.97] 45.07 [43.40,46.76] 13.61 [12.76,14.50] 25-34 1,392 50.81 [49.85,51.78] 40.53 [39.61,41.46] 8.66 [8.17,9.18] 35-44 1,415 53.43 [52.73,54.13] 37.89 [37.24,38.54] 8.68 [8.29,9.08] 45-54 1,318 55.05 [54.45,55.65] 36.63 [36.08,37.19] 8.31 [8.05,8.58] 55-64 1,274 51.01 [50.70,51.32] 36.25 [36.01,36.49] 12.74 [12.56,12.92] 15-64 6,749 48.41 [45.59,51.24] 40.90 [38.24,43.60] 10.69 [9.21,12.38]
Total Age
Group (years)
Always sometimes Never
n % 95% CI % 95% CI % 95% CI
15-24 2,915 44.93 [43.53,46.35] 43.56 [42.18,44.95] 11.5 [10.90,12.14] 25-34 2,933 57.94 [57.12,58.76] 35.49 [34.70,36.29] 6.57 [6.22,6.93] 35-44 2,991 62.36 [61.86,62.86] 31.69 [31.21,32.18] 5.95 [5.73,6.17] 45-54 2,852 62.70 [62.29,63.10] 31.23 [30.85,31.61] 6.08 [5.89,6.26] 55-64 2,767 59.92 [59.73,60.10] 31.85 [31.69,32.02] 8.23 [8.13,8.33] 15-64 14,458 54.80 [52.36,57.21] 36.91 [34.54,39.35] 8.29 [7.32,9.36]
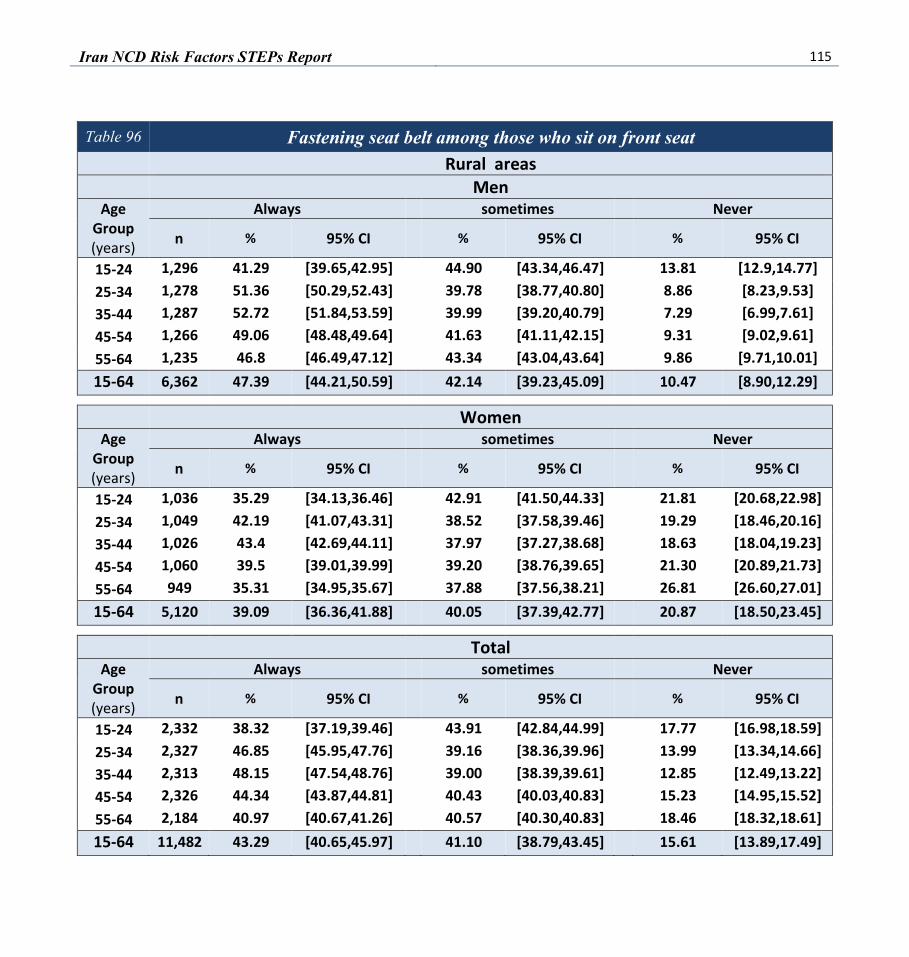
Iran NCD Risk Factors STEPs Report 115
Table 96 Fastening seat belt among those who sit on front seat Rural areas Men
Age Group (years)
Always sometimes Never
n % 95% CI % 95% CI % 95% CI
15-24 1,296 41.29 [39.65,42.95] 44.90 [43.34,46.47] 13.81 [12.9,14.77] 25-34 1,278 51.36 [50.29,52.43] 39.78 [38.77,40.80] 8.86 [8.23,9.53] 35-44 1,287 52.72 [51.84,53.59] 39.99 [39.20,40.79] 7.29 [6.99,7.61] 45-54 1,266 49.06 [48.48,49.64] 41.63 [41.11,42.15] 9.31 [9.02,9.61] 55-64 1,235 46.8 [46.49,47.12] 43.34 [43.04,43.64] 9.86 [9.71,10.01] 15-64 6,362 47.39 [44.21,50.59] 42.14 [39.23,45.09] 10.47 [8.90,12.29]
Women Age
Group (years)
Always sometimes Never
n % 95% CI % 95% CI % 95% CI
15-24 1,036 35.29 [34.13,36.46] 42.91 [41.50,44.33] 21.81 [20.68,22.98] 25-34 1,049 42.19 [41.07,43.31] 38.52 [37.58,39.46] 19.29 [18.46,20.16] 35-44 1,026 43.4 [42.69,44.11] 37.97 [37.27,38.68] 18.63 [18.04,19.23] 45-54 1,060 39.5 [39.01,39.99] 39.20 [38.76,39.65] 21.30 [20.89,21.73] 55-64 949 35.31 [34.95,35.67] 37.88 [37.56,38.21] 26.81 [26.60,27.01] 15-64 5,120 39.09 [36.36,41.88] 40.05 [37.39,42.77] 20.87 [18.50,23.45]
Total Age
Group (years)
Always sometimes Never
n % 95% CI % 95% CI % 95% CI
15-24 2,332 38.32 [37.19,39.46] 43.91 [42.84,44.99] 17.77 [16.98,18.59] 25-34 2,327 46.85 [45.95,47.76] 39.16 [38.36,39.96] 13.99 [13.34,14.66] 35-44 2,313 48.15 [47.54,48.76] 39.00 [38.39,39.61] 12.85 [12.49,13.22] 45-54 2,326 44.34 [43.87,44.81] 40.43 [40.03,40.83] 15.23 [14.95,15.52] 55-64 2,184 40.97 [40.67,41.26] 40.57 [40.30,40.83] 18.46 [18.32,18.61] 15-64 11,482 43.29 [40.65,45.97] 41.10 [38.79,43.45] 15.61 [13.89,17.49]

116 Iran NCD Risk Factors STEPs Report
Table 97 Fastening seat belt among those who sit on front seat Total areas Men
Age Group (years)
Always sometimes Never
n % 95% CI % 95% CI % 95% CI
15-24 2,861 45.88 [44.63,47.12] 43.10 [41.98,44.23] 11.02 [10.41,11.67] 25-34 2,819 60.15 [59.36,60.93] 33.80 [33.06,34.55] 6.05 [5.76,6.34] 35-44 2,863 64.81 [64.24,65.37] 30.53 [30.01,31.06] 4.66 [4.49,4.83] 45-54 2,800 62.88 [62.53,63.24] 31.35 [30.98,31.73] 5.76 [5.58,5.95] 55-64 2,728 61.61 [61.41,61.82] 32.70 [32.5,32.90] 5.69 [5.61,5.76] 15-64 14,071 56.32 [54.05,58.56] 36.16 [34.01,38.36] 7.52 [6.78,8.34]
Women Age
Group (years)
Always sometimes Never
n % 95% CI % 95% CI % 95% CI
15-24 2,386 39.21 [38.06,40.37] 44.32 [43.10,45.54] 16.47 [15.8,17.17] 25-34 2,441 47.96 [47.24,48.67] 39.86 [39.21,40.52] 12.18 [11.73,12.65] 35-44 2,441 50.16 [49.62,50.70] 37.92 [37.39,38.45] 11.92 [11.58,12.27] 45-54 2,378 49.77 [49.36,50.19] 37.51 [37.15,37.86] 12.72 [12.5,12.95] 55-64 2,223 45.82 [45.60,46.03] 36.79 [36.61,36.97] 17.39 [17.27,17.52] 15-64 11,869 45.28 [43.20,47.37] 40.60 [38.61,42.62] 14.12 [12.84,15.51]
Total Age
Group (years)
Always sometimes Never
n % 95% CI % 95% CI % 95% CI
15-24 5,247 42.58 [41.55,43.60] 43.70 [42.74,44.68] 13.72 [13.25,14.21] 25-34 5,260 54.16 [53.58,54.73] 36.78 [36.25,37.32] 9.06 [8.77,9.36] 35-44 5,304 57.63 [57.22,58.04] 34.15 [33.74,34.56] 8.22 [8.03,8.41] 45-54 5,178 56.41 [56.10,56.72] 34.39 [34.12,34.67] 9.20 [9.05,9.35] 55-64 4,951 53.59 [53.44,53.74] 34.78 [34.63,34.92] 11.63 [11.56,11.71] 15-64 25,940 50.86 [48.94,52.78] 38.35 [36.58,40.17] 10.78 [9.98,11.64]

Iran NCD Risk Factors STEPs Report 117
Table 98 Using helmet among those who traffic by motorcycle Urban areas Men
Age Group (years)
Always sometimes Never
n % 95% CI % 95% CI % 95% CI
15-24 977 16.43 [14.75,18.25] 22.31 [20.77,23.92] 61.26 [59.56,62.94] 25-34 912 28.43 [27.10,29.80] 23.87 [22.75,25.02] 47.70 [46.12,49.28] 35-44 798 30.76 [29.49,32.05] 25.25 [24.34,26.17] 44.00 [42.81,45.20] 45-54 685 33.59 [32.70,34.48] 21.04 [20.43,21.66] 45.38 [44.45,46.31] 55-64 560 28.81 [28.34,29.28] 20.19 [19.78,20.60] 51.00 [50.50,51.50] 15-64 3,932 25.22 [21.47,29.38] 22.96 [20.37,25.76] 51.82 [48.30,55.33]
Women Age
Group (years)
Always sometimes Never
n % 95% CI % 95% CI % 95% CI
15-24 643 7.17 [5.88,8.70] 6.49 [5.60,7.51] 86.34 [84.67,87.86] 25-34 643 6.55 [5.48,7.82] 6.77 [5.86,7.81] 86.67 [85.31,87.92] 35-44 553 7.94 [6.97,9.03] 7.61 [6.95,8.32] 84.45 [83.28,85.55] 45-54 541 8.72 [8.02,9.47] 7.93 [7.37,8.54] 83.35 [82.49,84.17] 55-64 460 6.92 [6.54,7.33] 2.65 [2.54,2.77] 90.42 [90.03,90.81] 15-64 2,840 7.33 [4.40,11.97] 6.68 [5.25,8.47] 85.99 [81.93,89.25]
Total Age
Group (years)
Always sometimes Never
n % 95% CI % 95% CI % 95% CI
15-24 1,620 11.84 [10.67,13.13] 14.48 [13.65,15.35] 73.68 [72.48,74.85] 25-34 1,555 17.68 [16.68,18.72] 15.47 [14.77,16.19] 66.85 [65.75,67.94] 35-44 1,351 19.57 [18.62,20.56] 16.60 [16.05,17.17] 63.83 [62.99,64.66] 45-54 1,226 21.31 [20.62,22.02] 14.57 [14.16,14.98] 64.12 [63.49,64.76] 55-64 1,020 17.70 [17.36,18.04] 11.28 [11.08,11.49] 71.02 [70.69,71.35] 15-64 6,772 16.38 [13.19,20.17] 14.92 [13.55,16.40] 68.70 [65.67,71.58]
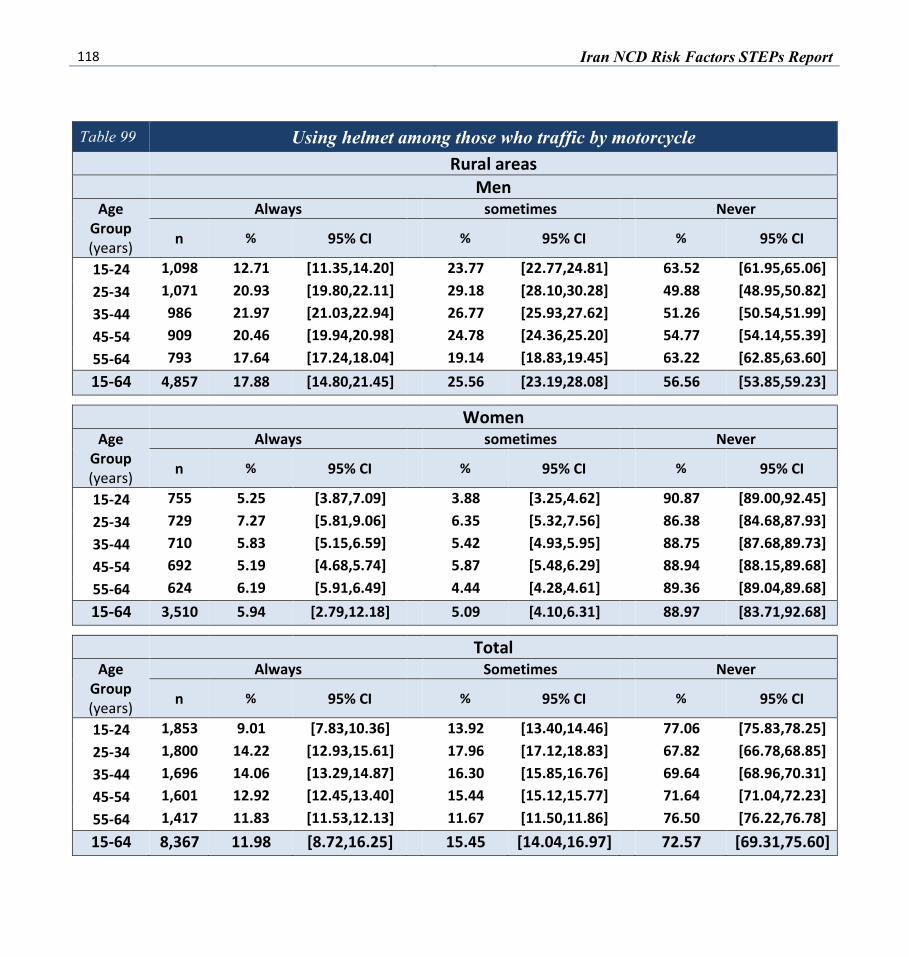
118 Iran NCD Risk Factors STEPs Report
Table 99 Using helmet among those who traffic by motorcycle Rural areas Men
Age Group (years)
Always sometimes Never
n % 95% CI % 95% CI % 95% CI
15-24 1,098 12.71 [11.35,14.20] 23.77 [22.77,24.81] 63.52 [61.95,65.06] 25-34 1,071 20.93 [19.80,22.11] 29.18 [28.10,30.28] 49.88 [48.95,50.82] 35-44 986 21.97 [21.03,22.94] 26.77 [25.93,27.62] 51.26 [50.54,51.99] 45-54 909 20.46 [19.94,20.98] 24.78 [24.36,25.20] 54.77 [54.14,55.39] 55-64 793 17.64 [17.24,18.04] 19.14 [18.83,19.45] 63.22 [62.85,63.60] 15-64 4,857 17.88 [14.80,21.45] 25.56 [23.19,28.08] 56.56 [53.85,59.23]
Women Age
Group (years)
Always sometimes Never
n % 95% CI % 95% CI % 95% CI
15-24 755 5.25 [3.87,7.09] 3.88 [3.25,4.62] 90.87 [89.00,92.45] 25-34 729 7.27 [5.81,9.06] 6.35 [5.32,7.56] 86.38 [84.68,87.93] 35-44 710 5.83 [5.15,6.59] 5.42 [4.93,5.95] 88.75 [87.68,89.73] 45-54 692 5.19 [4.68,5.74] 5.87 [5.48,6.29] 88.94 [88.15,89.68] 55-64 624 6.19 [5.91,6.49] 4.44 [4.28,4.61] 89.36 [89.04,89.68] 15-64 3,510 5.94 [2.79,12.18] 5.09 [4.10,6.31] 88.97 [83.71,92.68]
Total Age
Group (years)
Always Sometimes Never
n % 95% CI % 95% CI % 95% CI
15-24 1,853 9.01 [7.83,10.36] 13.92 [13.40,14.46] 77.06 [75.83,78.25] 25-34 1,800 14.22 [12.93,15.61] 17.96 [17.12,18.83] 67.82 [66.78,68.85] 35-44 1,696 14.06 [13.29,14.87] 16.30 [15.85,16.76] 69.64 [68.96,70.31] 45-54 1,601 12.92 [12.45,13.40] 15.44 [15.12,15.77] 71.64 [71.04,72.23] 55-64 1,417 11.83 [11.53,12.13] 11.67 [11.50,11.86] 76.50 [76.22,76.78] 15-64 8,367 11.98 [8.72,16.25] 15.45 [14.04,16.97] 72.57 [69.31,75.60]

Iran NCD Risk Factors STEPs Report 119
Table 100 Using helmet among those who traffic by motorcycle Total Men
Age Group (years)
Always Sometimes Never
n % 95% CI % 95% CI % 95% CI
15-24 2,075 14.79 [13.72,15.92] 22.96 [21.91,24.03] 62.26 [61.25,63.26] 25-34 1,983 25.25 [24.38,26.13] 26.12 [25.36,26.91] 48.63 [47.58,49.67] 35-44 1,784 27.05 [26.21,27.89] 25.89 [25.26,26.53] 47.07 [46.33,47.81] 45-54 1,594 27.59 [27.04,28.14] 22.75 [22.31,23.19] 49.67 [49.07,50.27] 55-64 1,353 23.58 [23.30,23.87] 19.70 [19.46,19.94] 56.72 [56.42,57.02] 15-64 8,789 22.00 [19.73,24.46] 24.08 [22.21,26.05] 53.92 [51.86,55.96]
Women Age
Group (years)
Always Sometimes Never
n % 95% CI % 95% CI % 95% CI
15-24 1,398 6.26 [5.31,7.36] 5.25 [4.69,5.87] 88.49 [87.25,89.63] 25-34 1,372 6.88 [5.98,7.89] 6.58 [5.87,7.38] 86.54 [85.50,87.52] 35-44 1,263 6.98 [6.39,7.62] 6.61 [6.17,7.09] 86.40 [85.66,87.12] 45-54 1,233 7.07 [6.65,7.51] 6.97 [6.62,7.35] 85.96 [85.42,86.47] 55-64 1,084 6.59 [6.34,6.84] 3.48 [3.38,3.59] 89.93 [89.65,90.21] 15-64 6,350 6.67 [4.43,9.94] 5.94 [5.01,7.02] 87.39 [84.50,89.80]
Total Age
Group (years)
Always Sometimes Never
n % 95% CI % 95% CI % 95% CI
15-24 3,473 10.56 [9.75,11.44] 14.19 [13.65,14.74] 75.25 [74.52,75.96] 25-34 3,355 16.22 [15.46,17.00] 16.52 [15.98,17.08] 67.26 [66.5,68.02] 35-44 3,047 17.21 [16.61,17.82] 16.44 [16.08,16.81] 66.35 [65.85,66.85] 45-54 2,827 17.46 [17.04,17.88] 14.96 [14.66,15.26] 67.58 [67.16,68.01] 55-64 2,437 14.95 [14.74,15.16] 11.46 [11.33,11.59] 73.59 [73.36,73.81] 15-64 15,139 14.43 [12.28,16.89] 15.12 [14.03,16.28] 70.45 [68.54,72.29]

120 Iran NCD Risk Factors STEPs Report
IRAN STEPS Survey 2009 Fact Sheet 1388
Results for adults aged 15-64 years (incl. 95% CI) (adjust if necessary) Both Sexes Males Females
Step 1 Tobacco Use
Percentage who currently smoke tobacco daily 10.82 [10.24,11.43]
20.39 [19.84,20.95]
1.02 [0.87,1.19]
For those who smoke tobacco daily
Average age started smoking (years) 20.13 [19.42,20.84]
19.30 [18.96,19.65]
20.98 [19.62,22.34]
Average years of smoking 13.82 [13.26,14.38]
14.46 [14.14,14.78]
13.17 [12.11,14.23]
Percentage smoking manufactured cigarettes ---------- ---------- ----------
For smokers of manufactured cigarettes
Mean number of manufactured cigarettes smoked per day 13.10 [11.74,14.46]
13.29 [12.59,13.99]
12.91 [10.28,15.55]
Step 1 Fruit and Vegetable Consumption (in a typical week)
Mean number of servings of fruit consumed per day 1.32 [1.27,1.38] 1.27 [1.20,1.33] 1.38
[1.31,1.44]
Mean number of servings of vegetables consumed per day 1.45 [1.38,1.53] 1.37 [1.29,1.46] 1.54
[1.46,1.61]
Percentage who ate 5 or more combined servings of fruit & vegetables per day 11.8 [10.43,13.33]
9.97 [8.50,11.67]
13.67 [12.14,15.37]
Step 1 Physical Activity
Percentage with low levels of activity (defined as <600 MET-minutes/week) 38.97 [37.38,40.58]
28.28 [27.41,29.17]
49.91 [48.92,50.9]
Median time spent in work-related physical activity per day (minutes) 0 2.85 0
Median time spent in transport-related physical activity per day (minutes) 15 17.14 12.85
Median time spent in recreational physical activity per day (minutes) 0 0 0

Iran NCD Risk Factors STEPs Report 121
IRAN STEPS Survey 2009 Fact Sheet 1388
Results for adults aged 15-64 years (incl. 95% CI) (adjust if necessary) Both Sexes Males Females
Step 2 Physical Measurements
Mean body mass index - BMI (kg/m2) 24.93 [24.83,25.03]
24.22 [24.10,24.33]
25.66 [25.50,25.82]
Percentage who are overweight or obese (BMI ≥ 25 kg/m2) 43.95 [43,44.91]
39.04 [38.36,39.72]
48.99 [48.34,49.63]
Percentage who are obese (BMI ≥ 30 kg/m2) 15.22 [14.54,15.92]
10.10 [9.697,10.51]
20.46 [19.96,20.98]
Average waist circumference (cm) 84.75 [84.40,85.10]
85.57 [85.14,85.99]
83.91 [83.44,84.39]
Mean systolic blood pressure - SBP (mmHg) 118.06 [117.70,118.42]
121.60 [121.19,122.02]
114.43 [113.97,114.89]
Mean diastolic blood pressure - DBP (mmHg) 76.93 [76.65,77.21]
77.36 [77.01,77.71]
76.48 [76.16,76.81]
Percentage with raised BP (SBP ≥ 140 and/or DBP ≥ 90 mmHg) 16.09 [15.39,16.82]
16.07 [15.55,16.61]
16.12 [15.72,16.52]
Percentage with raised BP (SBP ≥ 170 and/or DBP ≥ 100 mmHg) 6.12 [5.75,6.52]
5.12 [4.87,5.39]
7.15 [6.89,7.41]
Summary of combined risk factors • current daily smokers • less than 5 servings of fruits & vegetables per day • Low level of activity (<600 MET -minutes) • overweight or obese (BMI ≥ 25 kg/m2) • raised BP (SBP ≥ 140 and/or DBP ≥ 90 mmHg)
Percentage with low risk (i.e. none of the risk factors included above) 3.27 [2.788,3.839]
3.15 [2.862,3.467]
3.39 [3.07,3.76]
Percentage with raised risk (i.e. at least three of the risk factors included above) distributed in the age groups below
Percentage with raised risk, aged 15 to 44 years old 21.64
[20.67,22.65] 20.86
[20.21,21.53] 22.44
[21.79,23.1]
Percentage with raised risk, aged 45 to 64 years old 52.87 [51.11,54.62]
49.81 [48.64,50.99]
55.94 [54.81,57.07]