Embed Size (px)
Citation preview

Issue: 32, 2018
110 http://www.jrconsumers.com/Academic_Articles/issue_32/
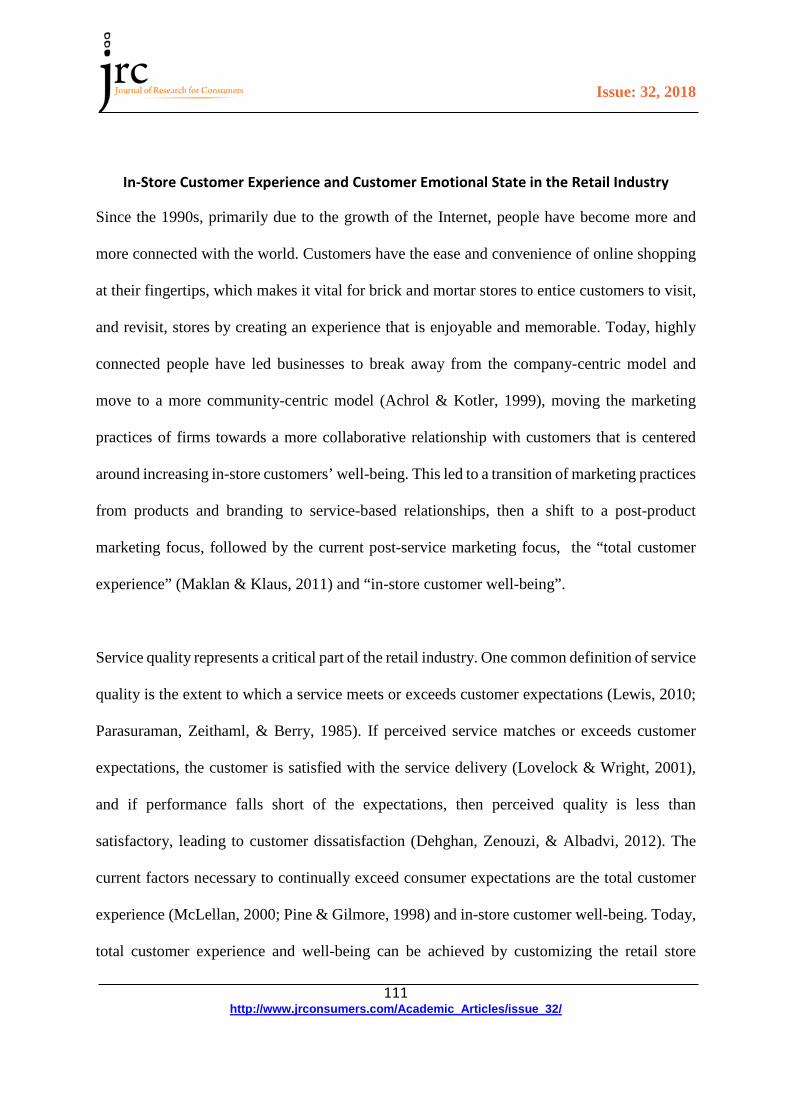
In-Store Customer Experience and Customer Emotional State in the Retail Industry
AUTHORS: Gokcen Ogruk, Ph.D.*
School of Business Administration Texas Wesleyan University Fort Worth, TX, 76105 Phone: 817-531-4840 [email protected]
Trisha D. Anderson, Ph.D., PMP School of Business Administration Texas Wesleyan University
Audrey Sophie Nacass School of Business Administration Texas Wesleyan University
ABSTRACT
This paper examines the impact of the ideal mix of atmospheric factors, including ambience factors (volume of music, type and strength of aroma, level of lighting), interaction with sales people, and store display on the in-store customer experience, used to create the in-store customer experience and emotional state in a retail market. Survey data 105 customers in an actual retail setting indicated that customers’ positive perception of interactions with sales employees is the main determinant of total customer experience. We also found that the proper blend of ambience variables triggers a customer’s positive emotional state, leading to an enjoyable, memorable store visit, more time and money spent in the store, and more products purchased.
KEYWORDS
In-store customer experience; Customer’s positive emotional state; In-store design; Partial Least Square; Path Modelling; Structural Equation Modelling
Issue: 32, 2018
111 http://www.jrconsumers.com/Academic_Articles/issue_32/
In-Store Customer Experience and Customer Emotional State in the Retail Industry
Since the 1990s, primarily due to the growth of the Internet, people have become more and
more connected with the world. Customers have the ease and convenience of online shopping
at their fingertips, which makes it vital for brick and mortar stores to entice customers to visit,
and revisit, stores by creating an experience that is enjoyable and memorable. Today, highly
connected people have led businesses to break away from the company-centric model and
move to a more community-centric model (Achrol & Kotler, 1999), moving the marketing
practices of firms towards a more collaborative relationship with customers that is centered
around increasing in-store customers’ well-being. This led to a transition of marketing practices
from products and branding to service-based relationships, then a shift to a post-product
marketing focus, followed by the current post-service marketing focus, the “total customer
experience” (Maklan & Klaus, 2011) and “in-store customer well-being”.
Service quality represents a critical part of the retail industry. One common definition of service
quality is the extent to which a service meets or exceeds customer expectations (Lewis, 2010;
Parasuraman, Zeithaml, & Berry, 1985). If perceived service matches or exceeds customer
expectations, the customer is satisfied with the service delivery (Lovelock & Wright, 2001),
and if performance falls short of the expectations, then perceived quality is less than
satisfactory, leading to customer dissatisfaction (Dehghan, Zenouzi, & Albadvi, 2012). The
current factors necessary to continually exceed consumer expectations are the total customer
experience (McLellan, 2000; Pine & Gilmore, 1998) and in-store customer well-being. Today,
total customer experience and well-being can be achieved by customizing the retail store

Issue: 32, 2018
112 http://www.jrconsumers.com/Academic_Articles/issue_32/
environment to exceed customers’ needs by providing a pleasant and exciting experience
through the design of the store. Our research has been motivated by one question: How to
design the ‘WOW’ shopping trip; a shopping trip that creates an in-store environment that
exceeds customer needs and expectations and improves the customer’s mood? To answer this
question, this paper focuses on the elements of total customer experience and customer well-
being measured by customer mood improvements in the store.
From an extensive review of existing literature, we identified three key in-store atmospheric
factors that could potentially drive the in-store customer experience and customer positive
emotional state (see Figure 1): ambiance, appearance of the store, and customer interaction
with salespeople. Ambiance factors are the background conditions in a given environment,
which may include temperature, scent, noise, music, or lighting, whereas store display factors
engage various functional and aesthetic elements such as layout, floor space, product display
(assortment), or decoration. Customer interaction, our last key factor, represents everything
that may shape customers’ perception of the level of service in a retail store. This factor may
include the number of employees in the store, their appearance, and their level of interaction
with customers.
Issue: 32, 2018
113 http://www.jrconsumers.com/Academic_Articles/issue_32/
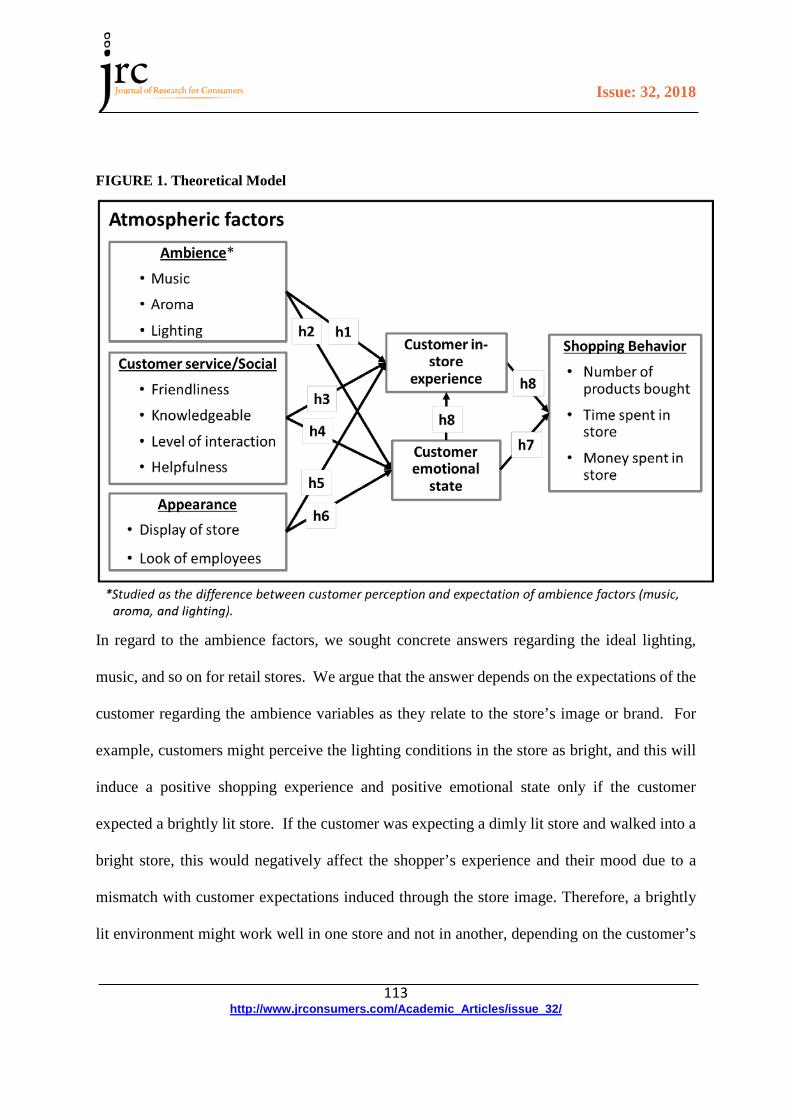
FIGURE 1. Theoretical Model
In regard to the ambience factors, we sought concrete answers regarding the ideal lighting,
music, and so on for retail stores. We argue that the answer depends on the expectations of the
customer regarding the ambience variables as they relate to the store’s image or brand. For
example, customers might perceive the lighting conditions in the store as bright, and this will
induce a positive shopping experience and positive emotional state only if the customer
expected a brightly lit store. If the customer was expecting a dimly lit store and walked into a
bright store, this would negatively affect the shopper’s experience and their mood due to a
mismatch with customer expectations induced through the store image. Therefore, a brightly
lit environment might work well in one store and not in another, depending on the customer’s
Issue: 32, 2018
114 http://www.jrconsumers.com/Academic_Articles/issue_32/
expectations, making customer expectations a necessary component for understanding the
customer’s in-store experience and well-being.
The current research not only studied the connection between the mood, or positive emotional
state, of the shopper with the atmospheric settings in the store, but also examined the influence
of customer mood on the in-store customer experience and shopping behavior (see Figure1).
We examined whether customers whose mood is improved due to an ideal mix of atmospheric
factors have a more enjoyable trip, spend more time and money in the store, and purchase more
products.
This paper contributes to the literature in two ways. First, this study is the first attempt to
examine the effect of the right combination of ambience variables that are aligned with
customer’s expectations and perceptions with the store image on customers’ in-store
experience. Second, we explored the mediating role of positive emotional state of customers
on the relationship between atmospheric factors and total customer experience and shopping
behavior. To test our hypotheses, we collected data from the customers of a specific retail store
that sells fine cheese, gourmet food products, and wine from Europe.
In the next two sections, we review the literature and develop a hypothesis to study the elements
of total customer experience and the mediating effect of a positive emotional state on the
customer in-store experience and shopping behavior. We then discuss the research design for
our empirical study, a description of our measures and the results compromising responses of

Issue: 32, 2018
115 http://www.jrconsumers.com/Academic_Articles/issue_32/
105 customers of an Italian cheese retail store, allowing us to test our hypothesized effects. We
conclude with a discussion of the in-store experience design and its impact on sales, address
the limitations of the study, and suggest directions for further research.
Literature Review
We identified three key variables that have the power to influence customer reactions and build
an emotional connection with shoppers. These three primary sets of cues are ambience, display,
and customer interaction (social), known in retail environment research as atmospherics (Baker
& Cameron, 1996). Ambience variables may include aroma (strength, type), music (tempo,
type), and lighting (dimness), whereas display variables engage various functional and
aesthetic elements such as layout and product display or decoration. Social variables include
everything that can shape a customer’s perception of the service level within a retail store.
Ambience Variables: Background and Conceptualization
Milliman (1986) states that ambiance relates to the customer’s perceptions and experiences of
the background conditions in the environment. Based on his description, ambiance factors may
include lighting, sound, aroma, temperature, use of color, merchandise, and tidiness/cleanness
of the environment. In the literature, many studies have shown the relation between ambiance
variables and customer perceptions. Music is the most widely studied ambiance variable in the
literature on customer perceptions (Baker, Levy, & Grewal, 1992; Chebat, Gelinas-Chebat, &
Filiatrault, 1993; Dubé, Chebat, & Morin, 1995; Hul, Dube, & Chebat, 1997; Milliman, 1986;
Yalch & Spangenberg, 1990). Music can have a variety of effects on customer behaviour,
Issue: 32, 2018
116 http://www.jrconsumers.com/Academic_Articles/issue_32/
ranging from a longer time spent in the store, higher in-store traffic, and increased interaction
with salespeople, to positive perception and recognition of store image and amplification of
purchase decisions (Morrison, 2001; Morrison, Gan, Dubelaar, & Oppewal, 2011; Puccinelli
et al., 2009; Turley & Milliman, 2000).
Aroma and lighting are the second most studied ambience variables in regard to shopping
behavior and customer perceptions. Scents can influence a consumer’s desire to make a
purchase (Hirsch, 1995; Mitchell, Kahn, & Knasko, 1995; Spangenberg, Crowley, &
Henderson, 1996; Turley & Milliman, 2000). Morrison et al. (2011) tested the presence and
absence of vanilla aroma on young shoppers in an actual retail environment and found that
arousal produced by aroma increased shoppers’ pleasure, positively influencing their behavior.
Previous literature has studied the single and joint effect of lighting with other ambience factors
on customers’ emotional states and shopping behavior and concluded that the level of light
perceived by customers in a given retail environment could influence customers’ mood either
positively or negatively (Areni & Kim, 1994; Baker & Cameron, 1996; Baker et al., 1992;
Butler & Biner, 1987; Puccinelli et al., 2009; Spence & Piqueras-Fiszman, 2012).
The ambience factors are not limited to music, aroma, and lighting. They also include
temperature, noise, and all factors that stimulate the senses of the customer. We considered one
particular retail store; therefore we limited the ambience factors and chose the ones that reflect
the retail store’s unique identity: a store offering fresh cheese, gourmet food and high-quality
European wine.

Issue: 32, 2018
117 http://www.jrconsumers.com/Academic_Articles/issue_32/
Customer Interaction (Social Variables) and Appearance Factors: Background and
Conceptualization
Social variables include factors that might shape a customers’ perception of the service level
within a retail store. These variables are measured by the number of employees in the store, the
employees’ appearance, (i.e., if they are wearing uniforms), and their level of interaction with
the customer. Previous studies have found that friendliness, knowledge, interaction, and
suitable assistance by employees significantly influenced customers’ emotional states (Baker
& Lamb, 1994; Baker & Lamb, 1992; Pine & Gilmore, 1998; Turley & Milliman, 2000). In
their study, Pine and Gilmore (1998) pointed out the importance of a strong relationship
between retailers and their customers for customers’ experience and demonstrated that the best
relationships between customers and retailers were the ones that were emotional in nature. In
our study, the customers’ perception of employee friendliness, helpfulness, level of knowledge,
and their level of interaction with customers, were considered as social variables in our model
(see Figure 1).
There are several studies that have examined the effects of product display and found that this
attribute has a significant impact on consumer behavior (Curhan, 1974; Gagnon & Osterhaus,
1985; Simonson & Winer, 1992). Kotler (1973) underlined the significance of physical design,
theorizing atmosphere as “the conscious design of space to create certain effect in buyers”
(Kotler, 1973, p. 1). Following his reasoning, design could be valued as an attention-creating
channel by which the physical design can appeal to the shoppers’ attention. Since appearance
is broadly defined in the literature, it may not be an easy task to implement all appearance
Issue: 32, 2018
118 http://www.jrconsumers.com/Academic_Articles/issue_32/
factors in a single study. Similar to our discussion earlier of ambience factors, we selected the
appearance factors that are relevant to the store identity used in our study.
A Model of Total Customer Experience and Positive Emotional State
We developed a model of total customer experience and customer positive emotional state.
Then, we examined the mediating role of positive emotions in the relationship between
atmospheric key factors, total customer experience and shopping behavior. Within this context,
we derived a set of hypotheses on the influences of atmospheric key factors on total customer
experience and customer positive emotional state.
Atmospheric Key Factors, Total Customer Experience, and Positive Emotional State
The first set of atmospheric factors are ambience cues. Based on the literature on ambience,
most studies that have conducted an in-store experience design and customer experience
measured perceived ambience factors. In our research, instead of perceived music, aroma and
lighting, we measured the existing gap between customers’ perceived and expected levels for
each ambience cue and tested the impact of this gap on total customer experience and emotional
states. For instance, to measure the gap between perceived and expected music volume, we
asked survey participants to answer the following questions:
- “How would you describe the level of music volume in the store today?”
- “Which level of music volume would you like to encounter in the store?”
The survey participants answered these questions on a Likert scale ranging from 0 (absent) to
5 (too loud). We created a new gap variable measuring the gap between perceived and expected
Issue: 32, 2018
119 http://www.jrconsumers.com/Academic_Articles/issue_32/
volume by assigning binary numerical values of 0 or 1. We assigned 0 to the gap variable if
both the customer’s chosen expected sensory item and perceived sensory item in the store were
the same, and 1 otherwise. Our survey measured the four binary gap variables: volume of
music, type and strength of aroma, and brightness of lighting.
We argue that the right combination of in-store ambience variables aligned with customer
expectations ensures a “match” between the store image and positioning in the eyes of
customers. If there is a match, this balance will result in an enjoyable and positively memorable
shopping time and total customer experience, leading to improvements in the mood of the
customers. Overall, this leads to the following hypotheses:
Hypothesis 1: The match between expected and actual ambience factors is positively
related to the customer’s total experience in the store, resulting in a more enjoyable and
memorable shopping time.
Hypothesis 2: The match between expected and actual ambience factors is positively
related to the customer’s emotional state, resulting in improving the customer’s mood.
The second primary cue for atmospheric factors is social influences. We proposed that when
customers perceive salespeople as friendly, knowledgeable, and interactive, they have an
enjoyable shopping trip. In addition, the positive customer perception of salespeople’s service
successfully evokes positive emotional states in customers. Accordingly, we tested the
following hypotheses:
Issue: 32, 2018
120 http://www.jrconsumers.com/Academic_Articles/issue_32/
Hypothesis 3: Customers’ positive perceptions of social variables are positively related
to their total experience in the store.
Hypothesis 4: Customers’ positive perceptions of social variables are positively related
to the positive emotional state of customers in the store.
Design variables represent the last atmospheric factor in our study. Consistent with our goal of
analyzing customer experience creation within a specific retail store, our study focused on
product display. We claimed that a positive perception of store displays would improve the
mood of customers and result in an enjoyable shopping experience for the customer. Based on
our argument, we studied the following hypotheses:
Hypothesis 5: Customers’ positive perceptions of design variables are positively related
to their total experience in the store.
Hypothesis 6: Customers’ positive perceptions of design variables are positively related
to the positive emotional state of customers in the store.
While Hypotheses 1- 6 studied the impact of the ambience factors on total customer experience
and the emotional state of the customer, we will now discuss the examination of the mediating
role of positive emotions in the relationship between atmospheric key factors and total
customer experience and shopping behavior.
Positive Emotions, Shopping Behavior and Mediating Effect of Positive Emotions between
Atmospheric Variables and Total Customer Experience
Issue: 32, 2018
121 http://www.jrconsumers.com/Academic_Articles/issue_32/
Customer memories are triggered by two main groups of emotions: positive and negative. To
create a memorable experience for the shopper, the emotions of the shopper must be triggered
in a positive way, which includes the relationship between what the customer expects (related
to the brand or store image) and what the customer perceives during the in-store experience.
We claimed that the right mix of atmospheric variables would affect customers’ positive or
negative states, and that a positive emotional state would improve their mood, whereas a
negative emotional state would deteriorate the mood of the customer. Thus, we anticipated that
customers, whose mood is improved due to the ideal mix of atmospheric factors, would spend
more time and money in the store and purchase more products, leading to the following
hypothesis:
Hypothesis 7: Customers’ positive emotional state, measured by improvement in
customer’s mood after shopping, is positively associated with shopping behavior (longer
time spent in the store, higher sales, and more money spent in the store).
We expected that the proper mix of ambience variables, combined with customer’s positive
perception of social and design variables, would produce an enjoyable and positively
memorable shopping time represented as the in-store customer experience, and thus lead to
positive shopping behavior, as stated in the following hypothesis:

Issue: 32, 2018
122 http://www.jrconsumers.com/Academic_Articles/issue_32/
Hypothesis 8: The positive emotional state of the customer mediates the relationship
between in-store atmospheric factors and total customer experience and is positively
associated with shopping behavior.
Research Methodology
Procedure and Participants
This study was conducted in a cheese and wine retail store for 11 weeks from April 2015 to
February 2016 on Saturdays and Sundays with customers ages 18 years and older. Respondents
were approached with courtesy by an administrator who set up a stand at the store exit.
Customers who had already taken the survey were not allowed to retake the survey. French
candies were offered to the shoppers as an incentive for their participation. A total of 105
customers agreed to participate in the study, and a short description of the study was provided
to the participants prior to the survey. Participants were also informed about the research
purpose, design, and confidentiality through the written instructions on the surveys.
Completing the questionnaire was voluntary, and participants were informed that answers
would remain anonymous and confidential.
Measures
Measurement items were adapted from past studies in the literature. The questionnaire included
six constructs: ambience gap, customer interaction (social), physical display, positive
emotional state, total customer experience, and shopping behavior.
Issue: 32, 2018
123 http://www.jrconsumers.com/Academic_Articles/issue_32/
The in-store ambience gap variable was calculated based on the gap between customers’
expected and perceived ambience cues and included four items: level of music, type of aroma,
strength of aroma and level of lighting. For each of these sensory variables, respondents were
first asked to describe its level, type, and strength. Adapted from Pullman and Gross (2004),
all responses for level of music, lighting and strength of aroma were scored using a 6-point
Likert scale anchored by 0 (absent) and 5 (too loud, too bright, and too strong, respectively).
The item soliciting type of aroma was sourced from Morrison et al. (2011) and offered options
including “Subtle and Sugary (Baked Apple)”, “Delicate and Authentic (Cheese)” “Fresh and
Savory (Bread),” Salty (Olive Oil and Olives)”, and “Stuffy and Oppressive (Lavender)”. “No
Aroma” was added as a response to this item. Second, to measure the gap between actual and
expected ambience factors, we asked survey participants their expectations for each of the
sensory variables. We created a new variable measuring the gap between expected and
perceived ambience cues, and this variable was assigned a numerical value of 0 or 1.
Social variables were measured by four items, following the findings of Verhoef et al. (2009),
and adopted from previous earlier studies with relevant modifications where deemed necessary.
These items measured friendliness, knowledge, interaction, and suitable assistance from
employees, and were answered on a 7-point Likert scale, ranging from 1 (Strongly Disagree),
to 7 (Strongly Agree). Design variables were measured by three items, also using a 7-point
Likert scale (1 = ‘Very Untrue of What I Believe’ to 7 = Very True of What I Believe’).
Turley and Milliman (2000) noted the importance of product displays, and Verhoef et al. (2009)
and Babin and Attaway (2000) discussed the effect of the appearance of the employees on
Issue: 32, 2018
124 http://www.jrconsumers.com/Academic_Articles/issue_32/
shopping behavior. Following their argument, we included these two items: “During my
shopping trip in the store, products were nicely displayed on shelves and tables” and “To what
extent do you agree with the following statement: I tend to buy more when products are nicely
displayed on shelves and tables”. Another item, “I believe that the look of the employees in the
store has to reflect the style of the store (Italian vibes) to make my shopping trip more
enjoyable”, was adopted from Verhoef et al. (2009) and Babin and Attaway (2000).
The overall positive emotional state of the customer was measured by a single item based on
earlier studies in this field (Babin & Attaway, 2000; Pullman & Gross, 2004; Yoo, Park, &
MacInnis, 1998) using a 7-point Likert scale (1 = “Strongly Disagree”; 7 = “Strongly Agree”).
In the literature, single-item measures of psychological constructs such as the positive
emotional state of customers are considered psychometrically inferior to multiple-item scales
(Diamantopoulos, Sarstedt, Fuchs, Wilczynski, & Kaiser, 2012); however, the reliability of
single-item measures may suffice if a construct’s scope is precise, unidimensional, and obvious
to the respondents (Sackett & Larson, 1990). In line with these arguments, the positive
emotional state of customers was measured by a single item which asked participants: “To
what extent do you agree with the following statement: Today, after having shopped in the
store, I feel that my mood improved”. “Not applicable” (N/A) was added as a possible response
to this item capturing the customer’s emotional state.
Total customer experience is the sum of all variables analyzed in the study and is assessed by
a single item “How would you define your shopping experience in the store today?” Following
Westbrook and Oliver (1981) and adapting from Mattila and Wirtz (2001), overall satisfaction

Issue: 32, 2018
125 http://www.jrconsumers.com/Academic_Articles/issue_32/
with the shopping experience was measured based on the total customer experience pyramid
(1 = “disappointment” to 4 = “memorable experience”). Finally, shopping behavior was
measured by money as well as time spent and number of products purchased in the store. One
extreme spending value was deemed to be an outlier and deleted from the analysis.
Model Estimation and Results
After researching the best data analysis method for our study (Hair, Hult, Ringle, & Sarstedt,
2016; Wong, 2013), we find that the appropriate method is the PLS-SEM approach. Structural
equation models (SEM) can be estimated by the use of covariance-based methods or the
variance-based partial least square structural equation modelling (PLS-SEM) approach (Hair
et al., 2016). PLS is a soft modelling approach to SEM with no assumptions about the
distribution of the data (Vinzi, Trinchera, & Amato, 2010). PLS-SEM is not sensitive to small
sample sizes and is applicable to medium and complex model structures, such as those in this
study.
SmartPLS 3.0 (Ringle, Wende, & Becker, 2015) was used to compute the path model and
parameter estimations. This algorithm is run in two stages, the first being a measurement
model, followed by the structural model. A nonparametric bootstrap procedure is used to
estimate the statistical significance of factor loadings and path coefficients of the structural
model (Hair et al., 2016). Bootstrapping allows PLS to accommodate smaller sample sizes. We
followed the guidelines for PLS-SEM given by Hair et al. (2016) in assessing and reporting
findings of the measurement model prior to the structural model.
Measurement Model
Issue: 32, 2018
126 http://www.jrconsumers.com/Academic_Articles/issue_32/
The initial measurement model was first evaluated using the full sample (105 participants),
with all items and dimensions. The Smart-PLS results were then used to eliminate problematic
items. To assess the significance and the explanatory power of the measurement model,
reliability (the construct measures’ indicator reliability and internal consistency reliability) and
validity (convergent validity and discriminant validity) needed to be evaluated.
Table 1 outlines the outer factor loadings, composite reliability and average variance extracted
values. All factor loadings of reflective measures except three were above the recommended
0.7 (Hair et al., 2016). Money spent, time spent and employee appearance exhibited lower
loadings of 0.655, 0.626, and 0.665, respectively. Hence, all indicators in reflective
measurement models exceeded the satisfactory composite reliability level of 0.7, and all
average variance extracted (AVE) values were above the critical threshold value of 0.5 (Hair
et al., 2016).

Issue: 32, 2018
127 http://www.jrconsumers.com/Academic_Articles/issue_32/
TABLE 1. Overview of the Quality Criteria of all Reflective Constructs Variables Loadings Composite
Reliability Average Variance Extracted (AVE)
Ambience Expected and Perceived Strength of
Aroma 0.719
0.799 0.572 Expected and Perceived Type of Aroma 0.704 Expected and Perceived Level of
Lighting 0.839
Customer Service/ Social
Salespeople were friendly and smiling 0.830
0.914 0.727 Sale people were knowledgeable 0.861 Salespeople were truly interacting and
conversing 0.880
Salespeople were helpful and gave advice 0.839
Appearance Products were displayed nicely 0.783
0.762 0.517 Look of employees reflects the style of
the store 0.665
Tend to buy more when products are nicely displayed 0.783
Shopping Behavior
Number of products bought 0.838 0.752 0.507 Time spent in the store 0.626
Money spent in the store 0.655 Positive Emotional State
After shopping my mood is improved 1.000 1.000 1.000 Total Customer Experience
Define your shopping experience 1.000 1.000 1.000
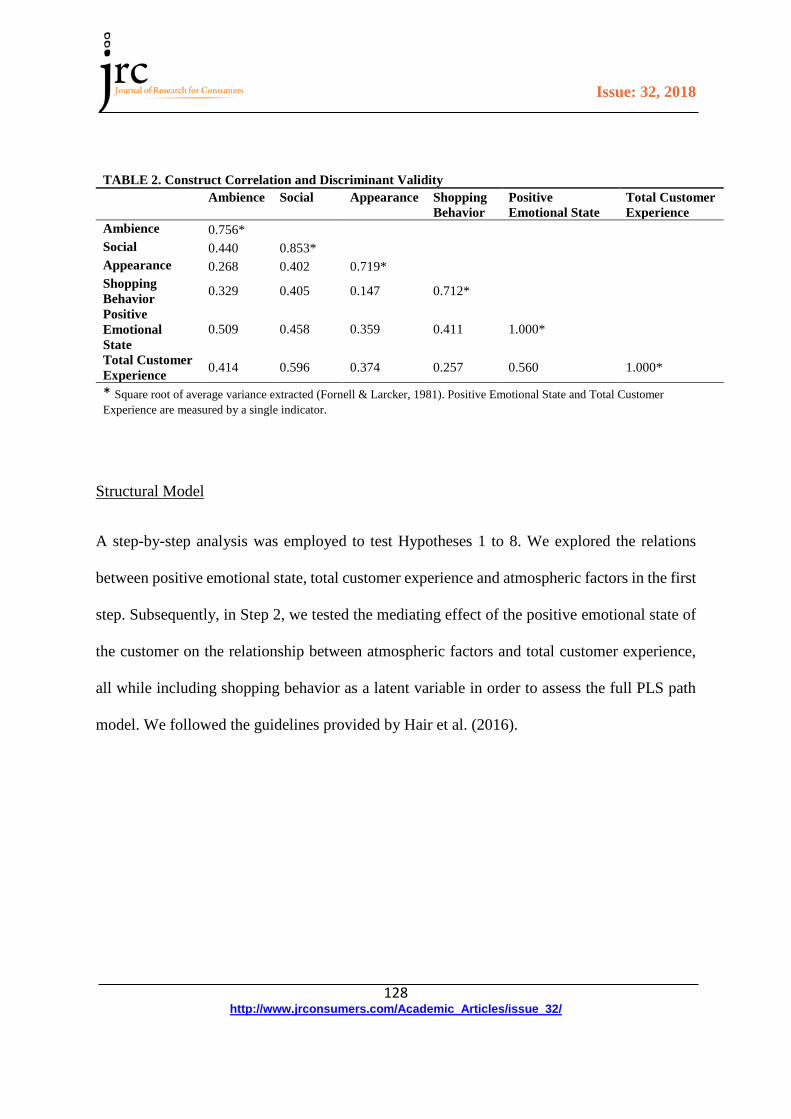
Discriminant validity is shown in Table 2 based on the methodology proposed by Fornell and
Larcker (1981). The square root of the average variance extracted should be greater than the
absolute value of the standardized correlations with other constructs. This analysis clearly
indicated that all constructs exhibited discriminant validity.
Issue: 32, 2018
128 http://www.jrconsumers.com/Academic_Articles/issue_32/
TABLE 2. Construct Correlation and Discriminant Validity Ambience Social Appearance Shopping
Behavior Positive Emotional State
Total Customer Experience
Ambience 0.756* Social 0.440 0.853* Appearance 0.268 0.402 0.719* Shopping Behavior 0.329 0.405 0.147 0.712*
Positive Emotional State
0.509 0.458 0.359 0.411 1.000*
Total Customer Experience 0.414 0.596 0.374 0.257 0.560 1.000*
* Square root of average variance extracted (Fornell & Larcker, 1981). Positive Emotional State and Total Customer Experience are measured by a single indicator.
Structural Model
A step-by-step analysis was employed to test Hypotheses 1 to 8. We explored the relations
between positive emotional state, total customer experience and atmospheric factors in the first
step. Subsequently, in Step 2, we tested the mediating effect of the positive emotional state of
the customer on the relationship between atmospheric factors and total customer experience,
all while including shopping behavior as a latent variable in order to assess the full PLS path
model. We followed the guidelines provided by Hair et al. (2016).
Issue: 32, 2018
129 http://www.jrconsumers.com/Academic_Articles/issue_32/
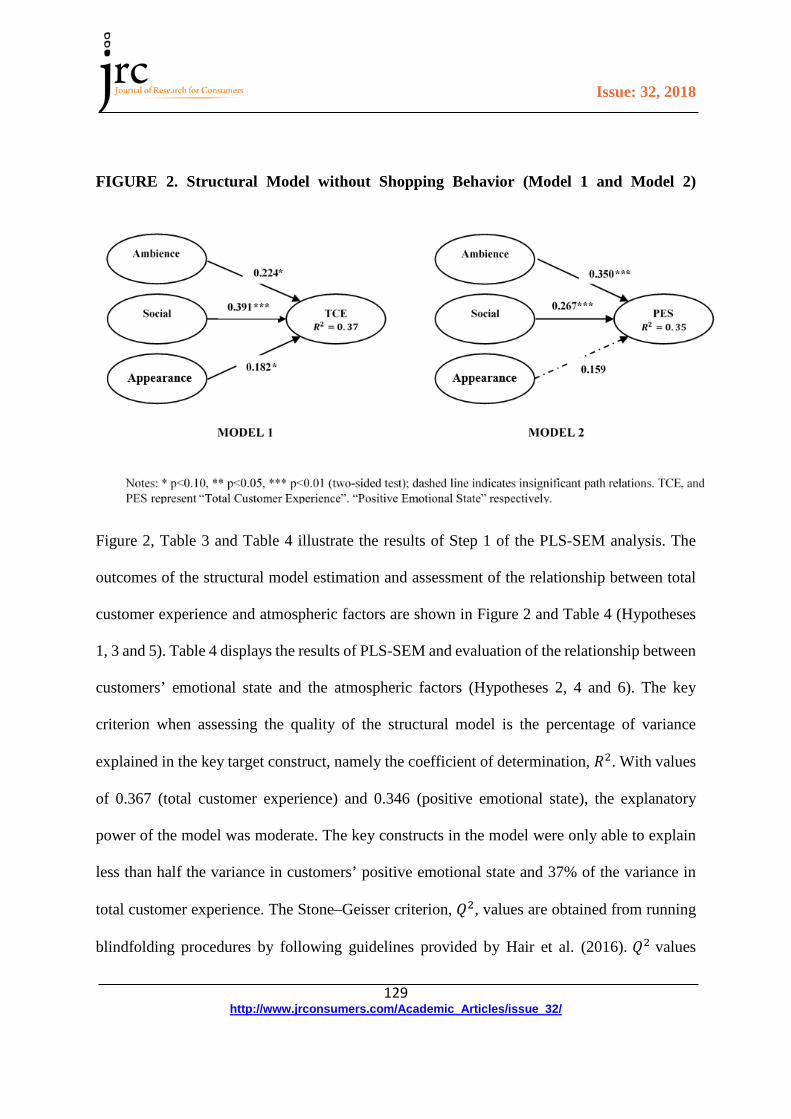
FIGURE 2. Structural Model without Shopping Behavior (Model 1 and Model 2)
Figure 2, Table 3 and Table 4 illustrate the results of Step 1 of the PLS-SEM analysis. The
outcomes of the structural model estimation and assessment of the relationship between total
customer experience and atmospheric factors are shown in Figure 2 and Table 4 (Hypotheses
1, 3 and 5). Table 4 displays the results of PLS-SEM and evaluation of the relationship between
customers’ emotional state and the atmospheric factors (Hypotheses 2, 4 and 6). The key
criterion when assessing the quality of the structural model is the percentage of variance
explained in the key target construct, namely the coefficient of determination, 𝑅𝑅2. With values
of 0.367 (total customer experience) and 0.346 (positive emotional state), the explanatory
power of the model was moderate. The key constructs in the model were only able to explain
less than half the variance in customers’ positive emotional state and 37% of the variance in
total customer experience. The Stone–Geisser criterion, 𝑄𝑄2, values are obtained from running
blindfolding procedures by following guidelines provided by Hair et al. (2016). 𝑄𝑄2 values
Issue: 32, 2018
130 http://www.jrconsumers.com/Academic_Articles/issue_32/
scores were above the threshold level of zero (0.313 and 0.284 for total customer experience
and positive emotional state, respectively) indicating the predictive relevance of the PLS path
model.
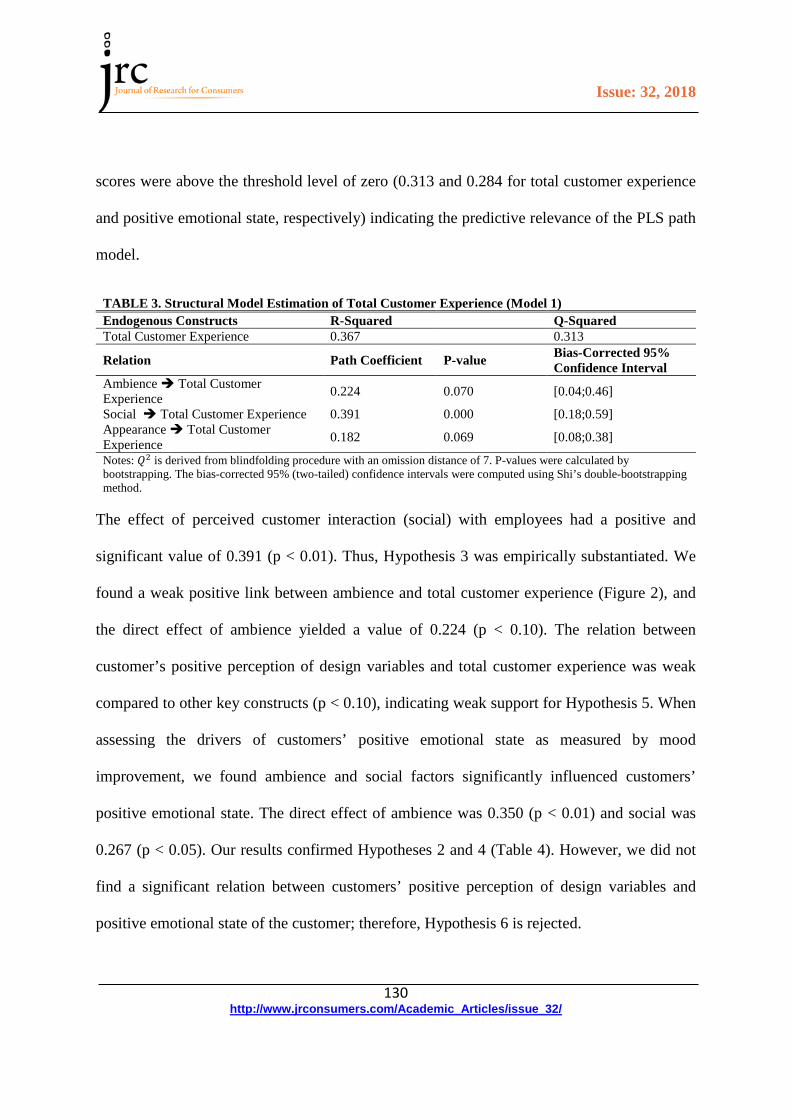
TABLE 3. Structural Model Estimation of Total Customer Experience (Model 1) Endogenous Constructs R-Squared Q-Squared Total Customer Experience 0.367 0.313
Relation Path Coefficient P-value Bias-Corrected 95% Confidence Interval
Ambience Total Customer Experience 0.224 0.070 [0.04;0.46]
Social Total Customer Experience 0.391 0.000 [0.18;0.59] Appearance Total Customer Experience 0.182 0.069 [0.08;0.38]
Notes: 𝑄𝑄2 is derived from blindfolding procedure with an omission distance of 7. P-values were calculated by bootstrapping. The bias-corrected 95% (two-tailed) confidence intervals were computed using Shi’s double-bootstrapping method.
The effect of perceived customer interaction (social) with employees had a positive and
significant value of 0.391 (p < 0.01). Thus, Hypothesis 3 was empirically substantiated. We
found a weak positive link between ambience and total customer experience (Figure 2), and
the direct effect of ambience yielded a value of 0.224 (p < 0.10). The relation between
customer’s positive perception of design variables and total customer experience was weak
compared to other key constructs (p < 0.10), indicating weak support for Hypothesis 5. When
assessing the drivers of customers’ positive emotional state as measured by mood
improvement, we found ambience and social factors significantly influenced customers’
positive emotional state. The direct effect of ambience was 0.350 (p < 0.01) and social was
0.267 (p < 0.05). Our results confirmed Hypotheses 2 and 4 (Table 4). However, we did not
find a significant relation between customers’ positive perception of design variables and
positive emotional state of the customer; therefore, Hypothesis 6 is rejected.
Issue: 32, 2018
131 http://www.jrconsumers.com/Academic_Articles/issue_32/
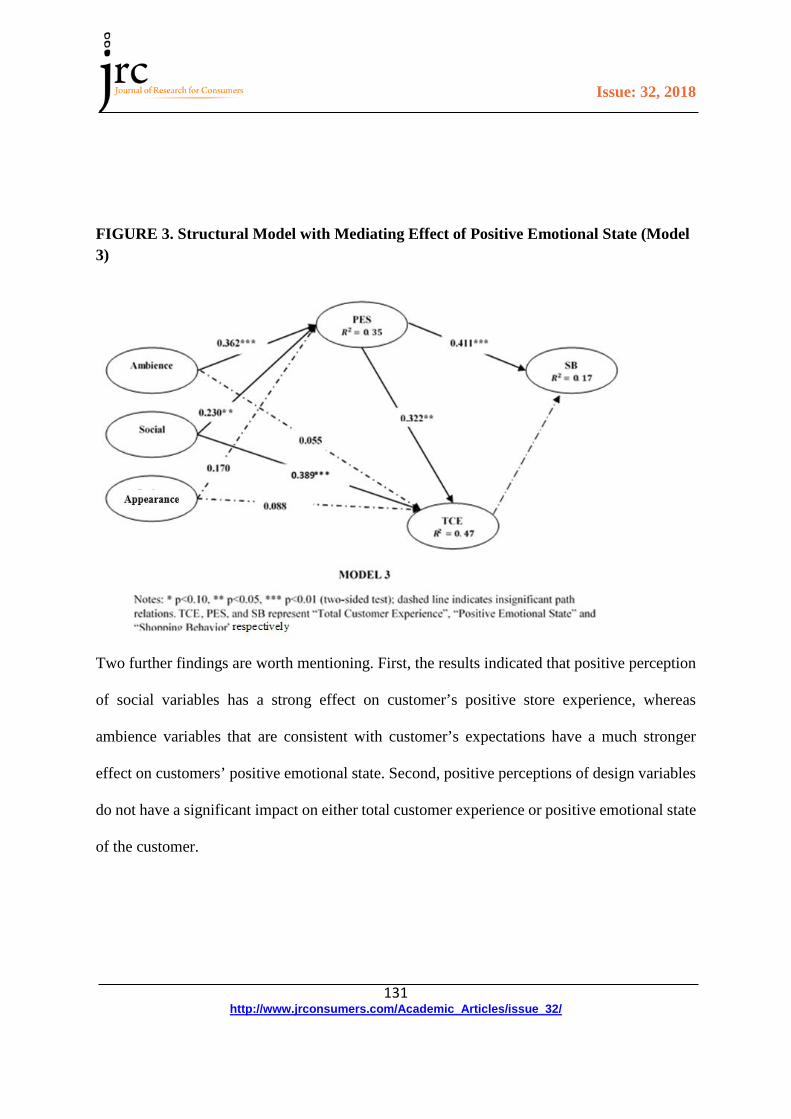
FIGURE 3. Structural Model with Mediating Effect of Positive Emotional State (Model 3)
Two further findings are worth mentioning. First, the results indicated that positive perception
of social variables has a strong effect on customer’s positive store experience, whereas
ambience variables that are consistent with customer’s expectations have a much stronger
effect on customers’ positive emotional state. Second, positive perceptions of design variables
do not have a significant impact on either total customer experience or positive emotional state
of the customer.
Issue: 32, 2018
132 http://www.jrconsumers.com/Academic_Articles/issue_32/
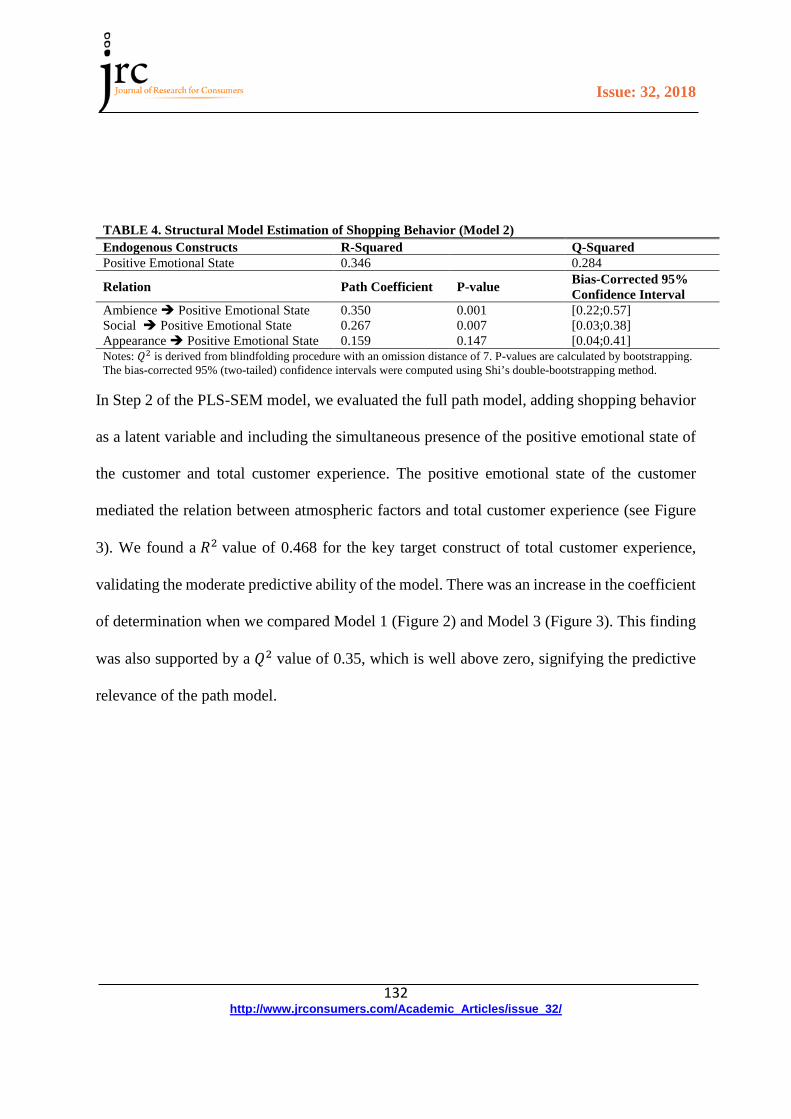
TABLE 4. Structural Model Estimation of Shopping Behavior (Model 2) Endogenous Constructs R-Squared Q-Squared Positive Emotional State 0.346 0.284
Relation Path Coefficient P-value Bias-Corrected 95% Confidence Interval
Ambience Positive Emotional State 0.350 0.001 [0.22;0.57] Social Positive Emotional State 0.267 0.007 [0.03;0.38] Appearance Positive Emotional State 0.159 0.147 [0.04;0.41] Notes: 𝑄𝑄2 is derived from blindfolding procedure with an omission distance of 7. P-values are calculated by bootstrapping. The bias-corrected 95% (two-tailed) confidence intervals were computed using Shi’s double-bootstrapping method.
In Step 2 of the PLS-SEM model, we evaluated the full path model, adding shopping behavior
as a latent variable and including the simultaneous presence of the positive emotional state of
the customer and total customer experience. The positive emotional state of the customer
mediated the relation between atmospheric factors and total customer experience (see Figure
3). We found a 𝑅𝑅2 value of 0.468 for the key target construct of total customer experience,
validating the moderate predictive ability of the model. There was an increase in the coefficient
of determination when we compared Model 1 (Figure 2) and Model 3 (Figure 3). This finding
was also supported by a 𝑄𝑄2 value of 0.35, which is well above zero, signifying the predictive
relevance of the path model.

Issue: 32, 2018
133 http://www.jrconsumers.com/Academic_Articles/issue_32/
TABLE 5. Structural Model Estimation of Total Customer Experience and Shopping Behavior: Mediating Effect of Positive Emotional States (Model 3) Endogenous Constructs R-Squared Q-Squared Positive Emotions 0.351 0.263 Total Customer Experience 0.468 0.346 Shopping Behavior 0.169 0.065 Relation Path
Coefficient P-value Bias-Corrected 95%
Confidence Interval Ambience Positive emotions 0.362 0.002 [0.16;0.60] Social Positive Emotions 0.230 0.043 [-0.03;0.40] Appearance Positive Emotions 0.170 0.183 [-0.06;0.39] Ambience Total Customer Experience 0.055 0.728 [-0.41;0.36] Social Total Customer Experience 0.389 0.007 [0.09;0.66] Appearance Total Customer Experience 0.088 0.452 [-0.12;0.27] Positive Emotions Total Customer Experience
0.322 0.027 [0.06;0.72]
Positive EmotionsShopping Behavior 0.411 0.000 [0.31;0.64] Notes: 𝑄𝑄2 is derived from blindfolding procedure with an omission distance of 7. P-values are calculated by bootstrapping. The bias-corrected 95% (two-tailed) confidence intervals were computed using Shi’s double-bootstrapping method.
To test Hypothesis 7, we added customer shopping behavior to the model as a latent variable.
We found the positive emotional state of the customer had a significant positive impact on
customers’ shopping behaviour as measured by time and money spent and number of products
bought. The value for the direct effect of the customer’s positive emotional state was 0.411 (p
< 0.01). At the same time, there was a positive significant relationship between the positive
emotional state of customers and their store experience (path coefficient of 0.322, p < 0.05).
This result supports Hypothesis 7.
TABLE 6. Mediating Effect of Positive Emotional State Positive Emotional State Direct
Effect Confidence Interval
Indirect Effect
Confidence Interval
Total Effect
Confidence Interval
Ambience Total Customer Experience
0.055 [-0.41;0.36] 0.117 [0.03;0.42] 0.172 [-0.17;0.47]
Social Total Customer Experience
0.389*** [0.09;0.66] 0.074 [0.01;022] 0.463*** [0.18;0.70]

Issue: 32, 2018
134 http://www.jrconsumers.com/Academic_Articles/issue_32/
Appearance Total Customer Experience
0.088 [-0.12;0.27] 0.055 [-0.00;019] 0.142 [0.01;0.40]
Notes: Indirect effect is the mediating effect, whereas total effect is the sum of direct and indirect effect. P-values are calculated by bootstrapping. The bias-corrected 95% (two-tailed) confidence intervals were computed using Shi’s double-bootstrapping method.
Regarding Hypothesis 8, we checked the significance of indirect effects first before assessing
the mediating effect of positive emotional state between atmospheric factors and total customer
experience. None of the indirect effects were significant, thus we could not substantiate the
mediating effect of the positive emotional state of the customer on the relationships between
atmospheric factors and total customer experience, and we rejected Hypothesis 81.
Discussion and Managerial Implications
Our results indicate that customers’ positive perception of in-store service is the main
determinant of the in-store customer experience, more so than ambience cues and store display.
When customers perceive that sales personnel are friendly, knowledgeable, conversing,
interacting and providing suitable assistance, that is, when sales team performance exceeds
expectations, this leads to the creation of a positive and memorable shopping experience. Stores
aiming to create a unique shopping experience for their customers might focus on establishing
a friendly, communicative, and helpful customer service.
1 In a sensitivity test, we also tested the mediating effect of the emotional state of the customer on shopping behavior and the effects of total customer experience on shopping behavior. However, we did not find any significant effects regarding total customer experience and the mediating effect of the emotional state of the customer on shopping behavior.
Issue: 32, 2018
135 http://www.jrconsumers.com/Academic_Articles/issue_32/
Turning to the relation between atmospheric factors and the emotional states of customers, our
results indicate the most significant determinant of the positive emotional state of customers
was the ideal mix of ambience variables. This outcome suggests that the closer the match
between existing ambience cues and customers’ expectations of these cues, the more customers
develop a positive emotional state, leading to greater in-store customer well-being. Retail store
managers who are hoping to improve in-store customers’ well-being might frequently gather
data on customer expectations of in-store ambience factors.
Research has shown that if memories are very emotional, then they are more likely to be
retained. If the customer experiences a change in their emotional state, especially a significant
change, then there is a greater chance that the customer will create a lasting memory of their
experience. Our results indicate a strong and statistically significant relation between
customer’s positive emotional state and overall customer experience. When atmospheric
variables exceed customer satisfaction by going beyond customer needs, they create value,
which in turn creates perceptions of worth. This perception of worth triggers a customer’s
positive emotional state. When positive emotions arise, they induce desirable and enjoyable
memories in customers’ minds, resulting in successfully producing a positive total customer
experience.
We also find that the positive emotional state of the customer has a strong positive link with
the customer’s shopping behavior. This outcome is vital to retailers who want to gain a
competitive advantage and achieve long-term profitability. Our findings indicate that
Issue: 32, 2018
136 http://www.jrconsumers.com/Academic_Articles/issue_32/
customers whose moods are improved due to a proper blend of atmospheric factors spend more
time and money in the store and purchase more products.
Future Research Implications
While our study provides important insights into research on total customer experience and
positive emotional states of customers, it also offers ideas for further research. First, it is
important to understand which factors affect emotional states of both repeat and new customers
and the dynamics behind in-store experience design for these groups of customers. Ambience
factors might influence repeat customers’ store experiences differently than new customers.
New customers might be more interested in the physical display of the store, while sales
personnel interaction might be the most important factor in creating repeat customers’ store
experience and well-being. Future research may further explore our model by considering the
differences between new and repeat customers.
Second, in-store sampling within the retail environment is a relatively under-researched area
in the academic field. In-store tasting might enhance customer’s emotional state with the help
of knowledgeable, friendly, and engaging employees. For future research, it might be
interesting to explore the mediating role of in-store sample-tasting between customer
interaction variables and customer’s positive emotional state. Lastly, it would be particularly
promising to study the design of the in-store customer experience and well-being with different
types of retail stores. However, the researcher should be careful when creating a model, since
the model should reflect the retail store’s unique identity and understand the importance of
including customer perceptions and expectations of the in-store design.

Issue: 32, 2018
137 http://www.jrconsumers.com/Academic_Articles/issue_32/
Conclusion
With the increase in community-centric marketing models, the creation of in-store customer
experience and customer well-being is becoming more and more important. This paper
investigates how key atmospheric factors affect the in-store customer experience, positive
emotional state, and shopping behavior of customers in a retail setting. In the literature, studies
have highlighted the positive relation between key individual atmospheric variables and the
customer experience, yet there is limited research investigating the impact of the right
combination of atmospheric variables on the customer in-store experience and positive
emotional state. To fill this gap, we tested the impact of the customer’s positive perception of
in-store customer service and store design, along with ambience factors (studied as the match
between actual and expected strength and type of aroma and level of lighting) and their effect
on the in-store customer experience and positive emotional state. Using path analysis, we found
that customers’ positive perceptions of salespeople’s service results in a positive in-store
customer experience.
Additionally, we tested the impact of the match between actual and expected strength and type
of aroma and level of lighting and the effect of customers’ positive perception on the mood of
the customer, studying how the mood of the customer affects the in-store experience and
shopping behavior, as measured by time and money spent and number of products bought.
Interestingly, having the ideal blend of ambience factors (volume of music, type, strength of
aroma and level of lighting), combined with a positive perception of salespeople’s interaction
during the shopping trip, results in the enhanced mood of the customer. Improvements in

Issue: 32, 2018
138 http://www.jrconsumers.com/Academic_Articles/issue_32/
customer mood leads to customers remaining longer in the store, buying more products,
spending more money, and having an enjoyable and memorable shopping trip experience.

Issue: 32, 2018
139 http://www.jrconsumers.com/Academic_Articles/issue_32/
References
Achrol, R. S., & Kotler, P. (1999). Marketing in the network economy. The Journal of Marketing, 146-163.
Areni, C. S., & Kim, D. (1994). The influence of in-store lighting on consumers' examination of merchandise in a wine store. International Journal of Research in Marketing, 11(2), 117-125.
Babin, B. J., & Attaway, J. S. (2000). Atmospheric affect as a tool for creating value and gaining share of customer. Journal of Business Research, 49(2), 91-99.
Baker, J., & Cameron, M. (1996). The effects of the service environment on affect and consumer perception of waiting time: An integrative review and research propositions. Journal of the Academy of Marketing Science, 24(4), 338-349.
Baker, J., & Lamb, J., & Charles, W. (1994). Measuring architectural design service quality. Journal of Professional Services Marketing, 10(1), 89-106.
Baker, J., & Lamb, C. W., Jr. (1992). Physical environment as a hospital marketing tool. Journal of Hospital Marketing, 6(2), 25-35.
Baker, J., Levy, M., & Grewal, D. (1992). An experimental approach to making retail store environmental decisions. Journal of Retailing, 68(4), 445.
Butler, D. L., & Biner, P. M. (1987). Preferred lighting levels variability among settings, behaviors, and individuals. Environment and Behavior, 19(6), 695-721.
Chebat, J.-C., Gelinas-Chebat, C., & Filiatrault, P. (1993). Interactive effects of musical and visual cues on time perception: An application to waiting lines in banks. Perceptual and Motor skills, 77(3), 995-1020.
Curhan, R. C. (1974). The effects of merchandising and temporary promotional activities on the sales of fresh fruits and vegetables in supermarkets. Journal of Marketing Research, 286-294.
Dehghan, A., Zenouzi, B., & Albadvi, A. (2012). An investigation on the relationship between service quality and customer satisfaction: In the case of CCG CO. International Business Research, 5(1), 3.
Diamantopoulos, A., Sarstedt, M., Fuchs, C., Wilczynski, P., & Kaiser, S. (2012). Guidelines for choosing between multi-item and single-item scales for construct measurement: A predictive validity perspective. Journal of the Academy of Marketing Science, 40(3), 434-449.
Dubé, L., Chebat, J. C., & Morin, S. (1995). The effects of background music on consumers' desire to affiliate in buyer-seller interactions. Psychology & Marketing, 12(4), 305-319.
Fornell, C., & Larcker, D. F. (1981). Structural equation models with unobservable variables and measurement error: Algebra and statistics. Journal of Marketing Research, 382-388.
Gagnon, J. P., & Osterhaus, J. T. (1985). Effectiveness of floor displays on the sales of retail products. Journal of Retailing, 61, 104–116.
Hair, J. F., Jr., Hult, G. T. M., Ringle, C., & Sarstedt, M. (2016). A primer on partial least squares structural equation modeling (PLS-SEM): Sage Publications.
Hirsch, A. R. (1995). Effects of ambient odors on slot-machine usage in a Las Vegas casino. Psychology & Marketing, 12(7), 585-594.
Hul, M. K., Dube, L., & Chebat, J.-C. (1997). The impact of music on consumers' reactions to waiting for services. Journal of retailing, 73(1), 87-104.
Kotler, P. (1973). Atmospherics as a marketing tool. Journal of Retailing, 49(4), 48-64. Lewis, A. (2010). Service quality model evaluation. Journal of Transport logistics, 34, 235-254. Lovelock, C., & Wright, L. (2001). Principles of service marketing and management. Prentice Hall.

Issue: 32, 2018
140 http://www.jrconsumers.com/Academic_Articles/issue_32/
Maklan, S., & Klaus, P. (2011). Customer experience: Are we measuring the right things? International Journal of Market Research, 53(6), 771-792.
Mattila, A. S., & Wirtz, J. (2001). Congruency of scent and music as a driver of in-store evaluations and behavior. Journal of Retailing, 77(2), 273-289.
Milliman, R. E. (1986). The influence of background music on the behavior of restaurant patrons. Journal of Consumer Research, 13(2), 286-289.
Mitchell, D. J., Kahn, B. E., & Knasko, S. C. (1995). There's something in the air: Effects of congruent or incongruent ambient odor on consumer decision making. Journal of Consumer Research, 22(2), 229-238.
Morrison, M. (2001). The power of music and its influence on international retail brands and shopper behaviour: A multi case study approach. Paper presented at the Australia and New Zealand Marketing Academy Conference.
Morrison, M., Gan, S., Dubelaar, C., & Oppewal, H. (2011). In-store music and aroma influences on shopper behavior and satisfaction. Journal of Business Research, 64(6), 558-564.
Parasuraman, A., Zeithaml, V. A., & Berry, L. L. (1985). A conceptual model of service quality and its implications for future research. The Journal of Marketing, 41-50.
Pine, B. J., & Gilmore, J. H. (1998). Welcome to the experience economy. Harvard Business Review, 76, 97-105.
Puccinelli, N. M., Goodstein, R. C., Grewal, D., Price, R., Raghubir, P., & Stewart, D. (2009). Customer experience management in retailing: Understanding the buying process. Journal of Retailing, 85(1), 15-30.
Pullman, M. E., & Gross, M. A. (2004). Ability of experience design elements to elicit emotions and loyalty behaviors. Decision Sciences, 35(3), 551-578.
Ringle, C., Wende, S., & Becker, J.-M. (Producer). (2015). SmartPLS 3. Sackett, P. R., & Larson Jr, J. R. (1990). Research strategies and tactics in industrial and organizational
psychology. Simonson, I., & Winer, R. S. (1992). The influence of purchase quantity and display format on
consumer preference for variety. Journal of Consumer Research, 19(1), 133-138. Spangenberg, E. R., Crowley, A. E., & Henderson, P. W. (1996). Improving the store environment: Do
olfactory cues affect evaluations and behaviors? The Journal of Marketing, 67-80. Spence, C., & Piqueras-Fiszman, B. (2012). Dining in the dark: Why, exactly, is the experience so
popular. The Psychologist, 25, 888-891. Turley, L. W., & Milliman, R. E. (2000). Atmospheric effects on shopping behavior: A review of the
experimental evidence. Journal of Business Research, 49(2), 193-211. Verhoef, P. C., Lemon, K. N., Parasuraman, A., Roggeveen, A., Tsiros, M., & Schlesinger, L. A. (2009).
Customer experience creation: Determinants, dynamics and management strategies. Journal of Retailing, 85(1), 31-41.
Vinzi, V. E., Trinchera, L., & Amato, S. (2010). PLS path modeling: From foundations to recent developments and open issues for model assessment and improvement. In Handbook of partial least squares (pp. 47-82): Springer.
Westbrook, R. A., & Oliver, R. L. (1981). Developing better measures of consumer satisfaction: Some preliminary results. NA-Advances in Consumer Research Volume 08.
Wong, K. K.-K. (2013). Partial least squares structural equation modeling (PLS-SEM) techniques using SmartPLS. Marketing Bulletin, 24(1), 1-32.
Issue: 32, 2018
141 http://www.jrconsumers.com/Academic_Articles/issue_32/
Yalch, R., & Spangenberg, E. (1990). Effects of store music on shopping behavior. Journal of Consumer Marketing, 7(2), 55-63.
Yoo, C., Park, J., & MacInnis, D. J. (1998). Effects of store characteristics and in-store emotional experiences on store attitude. Journal of Business Research, 42(3), 253-263.