Embed Size (px)
Citation preview
in situ surface-enhanced Raman spectroscopy to
investigate polyyne formation during pulsed
laser ablation in liquid
P. Marabotti, S. Peggiani, A. Facibeni, P. Serafini, A. Milani, V. Russo, A. Li Bassi, C. S. Casari*
Department of Energy, Micro and Nanostructured Materials Laboratory - NanoLab, Energy, Politecnico di Milano,
Via Ponzio 34/3, Milano 20133, Italy
Abstract The synthesis of polyynes during their formation by pulsed laser ablation in liquid (i.e., acetonitrile) has been
analyzed by in situ surface-enhanced Raman spectroscopy (SERS). A polyethylene pellet, functionalized with
silver nanoparticles and placed into the ablation medium, served as SERS active surface. This innovative
approach granted the possibility to investigate the dynamics of formation and degradation of polyynes with a
time-resolution of a few seconds, starting from the early stages of ablation when the concentration is low. The
processes occurring during the synthesis have been studied comparing the in situ SERS signal of polyynes
and byproducts in the solution. The different kinetics of short and long polyynes have been investigated by
their in situ SERS signal, exploring the final distribution of chain lengths. Ex situ UV-Vis and high-
performance liquid chromatography confirmed the observations gained from in situ SERS data and validated
this innovative in situ and in operando analysis.
1. Introduction Polyynes are one-dimensional systems composed by the alternation of single and triple bonds of sp hybridized
carbon atoms [1,2], approaching, as the length increases, the ideal novel allotrope carbyne [3]. During the last
decades, their appealing predicted optical, mechanical, and electronic properties, depending on the length and
the chemical termination, have attracted the interest of material scientists and chemists [1,2,4]. Polyynes have
been observed in interstellar media and natural compounds [5–8], and they can be synthesized in the laboratory
by both chemical and physical methods [9–21], including the recently reported cyclo[18]carbon [22]. Among
the physical methods, pulsed laser ablation in liquid (PLAL) has been widely employed in this field, thanks
to the high efficiency, versatility, and simplicity of the technique [1,14,15,23–26]. PLAL consists of the
irradiation of a carbon target immersed in a solvent by short laser pulses, usually in the ns range. The proper
choice of the solvent and the laser wavelength granted the synthesis of the longest polyyne ever produced by
physical methods (up to 30 carbon atoms) and with a variety of terminating groups [15,26–28]. Nevertheless,
the mechanisms behind the synthesis of polyynes by PLAL have not been fully understood. The growth of
carbon chains is characterized by the competition between two phenomena: polymerization reactions, which
tend to extend the chain length, versus hydrogenation reactions, that instead terminate the chain (usually with
* Corresponding author. Tel: +39 02 2399 6331. E-mail: [email protected]
hydrogen atoms) [23]. The synthesis has a radical nature since polymerization reactions are thought to happen
by the addition of carbon dimers C2 and/or ethynyl radicals [23,25]. The physics of PLAL suggests that the
formation of polyynes occurs at the interface between the ablation plasma plume and the solvent, where strong
out-of-equilibrium conditions take place and radicals are formed. However, there are no direct proofs of the
processes taking place during the ablation since the short time scales involved (from ps to tens of ns range
[29,30]) and the complex environment make it difficult to employ suitable diagnostic techniques. Indeed, in
situ experiments could help to deepen the knowledge of what is happening during the formation of polyynes
in solution.
The optical and vibrational properties of polyynes have been studied by different techniques [1,31]. UV-Vis
absorption spectroscopy is widely employed since polyynes possess characteristic vibronic patterns in the UV
region that depends on both length and termination, allowing immediate detection of sp-carbon chains and the
calculation of their concentration in solution [14,15,32]. Absorption spectroscopy can be used as a detection
technique in high-performance liquid chromatography (HPLC) which allows a more sensitive detection,
quantification, and selective separation of polyynes by their structure [10,15,26,27]. Moreover, the vibrational
properties of polyynes have been extensively investigated by Raman and IR spectroscopy [1,31,33–36]. In
particular, sp-carbon chains feature a distinctive Raman active collective CC stretching mode, called ECC
mode from the “effective conjugation coordinate” model, located in the 1800-2200 cm-1 spectral region where
there are no other features from all the other carbon-based solids and nanostructures [31,37,38].
The elusive nature of carbyne is related to the poor stability usually suffered by sp-carbon chains since they
tend to reorganize into more stable carbon allotropes, i.e. sp2 or amorphous carbon species, via crosslinking
reactions [1,15,21,31,39]. Termination with bulky endgroups and encapsulation in carbon nanotubes or in
polymeric matrices allowed to improve their stability [1,3,16,40–42]. Another stabilization strategy is the
addition of metal nanoparticles [40,42–44]. Moreover, the interaction with metal nanoparticles (usually gold
or silver) boosts the Raman response of polyynes up to six orders of magnitude, the so-called surface-enhanced
Raman scattering (SERS), if the Raman laser matches the surface plasmon frequency of the metal
nanoparticles [31,45]. In this way, it is possible to study very low concentrated samples, that otherwise cannot
be probed due to the weak or negligible Raman signal when the amount of probed material is scarce. SERS
has been reported as a reliable method to detect polyynes in solution and in solid-state, and it appears a viable
route for in situ monitoring of the formation process, thanks to its enhanced sensitivity [43,45,46]. However,
the use of SERS to investigate vibrational properties of polyyne implies two main drawbacks: first, the sharp
Raman ECC peak broadens into a large band given by the contribution of every possible geometric
configuration of the complex polyyne-nanoparticle and by the usual wide size-distribution of chemically
synthesized colloidal nanoparticles; second, the interaction between sp-carbon chains and metal nanoparticles
introduces new vibrational modes that generate an intense additional feature, indicated as low-frequency
(1800-2000 cm-1) band, which may overlap with the characteristic vibrational peaks of polyynes
[33,43,45,47,48]. In this respect, the application of SERS to investigate polyyne formation during the ablation
process raises further non-trivial issues. First, metal nanoparticles suspended in the solution may absorb the
laser pulse preventing its arrival at the target, thus reducing the ablation efficiency, and may subsequently be
fragmented in smaller nanoparticles with different surface plasmon frequency, possibly reducing the SERS
effect [30,49]. Second, metal nanoparticles in the solution may modify the formation process of polyynes,
catalyzing chemical reactions, undergoing aggregation, and interacting with the growing sp-carbon chains,
leading to pseudocarbynes [42,45,46,50,51].
Here, to overcome the above-mentioned limitations, we employed an innovative in situ SERS approach to
analyze the processes occurring during the synthesis of polyynes by PLAL in acetonitrile. We selected
acetonitrile because it proved to be an efficient liquid environment for the synthesis of polyynes and their
stability [15,28,52]. Indeed, it was demonstrated that a high concentration of polyynes can be obtained in low
polar solvents, as acetonitrile [15,53]. Moreover, polyynes are more stable in a liquid environment
characterized by low polarity and a low quantity of dissolved oxygen [15]. Finally, acetonitrile is compatible
with ex situ HPLC analyses that will be compared to the in situ SERS data. The novel SERS apparatus is
composed of a silver nanoparticle-functionalized polyethylene (PE) pellet attached to the sides of the glass
vial used for the ablation. In this way, no metal nanoparticles are suspended in the solution while ensuring
high effective surface for SERS analysis. The SERS enhancement enables the detection of very low
concentrations of polyynes, down to 10-8 M, allowing to follow the synthesis from the early formation stages.
In summary, our approach provides a time-resolved investigation of the SERS signal of both polyynes and sp2
carbon during the ablation process, granting the examination of the efficiency of the ablation and the possible
degradation mechanisms of polyynes in solution. The broad observed polyyne band is deconvoluted with an
ad hoc algorithm to track the different progression of short and long polyynes. The interpretation of in situ
SERS data is supported by ex situ HPLC and UV-Vis measurements of liquid samples after specific ablation
times, as well as DFT calculations of Raman activities of polyynes.
2. Material and methods Pulsed laser ablation was carried out using the second harmonics (λ = 532 nm) of an Nd:YAG pulsed laser
(Quantel Q-Smart 850), with a pulse duration of 6 ns and a repetition rate of 10 Hz. The laser beam was
focused using a plano-convex lens (200 mm focal length, Thorlabs). A graphite disc (8 mm diameter, 2 mm
thick, Testbourne Ltd, purity 99.99%) was employed as an ablation target in a glass vial filled with 2 mL of
acetonitrile (here denoted by ACN, Sigma-Aldrich, purity ≥ 99.9%). The fluence on the graphite target was
set to 0.37 J/cm2, calculated using the method reported in Eq. 3 in the SI. This method allowed us to account
for the presence of the liquid meniscus in the calculation of the spot radius of the laser beam.
A polyethylene (PE) pellet functionalized with silver nanoparticles (AgNPs) was employed as a SERS
substrate. The PE pellets were fabricated following the method described elsewhere [54]. The pellet is
anchored to the sides of the vial through a polyvinyl alcohol layer as reported in Fig. 1a, dried in an oven at
90 °C. The target-pellet distance was chosen in the range 10 ± 2 mm. SERS spectra were continuously
collected during all the ablation process employing a Renishaw inVia Raman microscope with a diode-
pumped solid-state laser (λ = 532 nm). The laser power was set to 0.7 mW to avoid degradation of the pellet.
The remote Raman probe is equipped with a 20x objective that focuses the laser beam down to a spot size of
12 μm. Each measure consists of 10 acquisitions of 1 s of exposure time. The selected grating of 1800 l/mm
allows us to achieve a resolution of 9 cm-1 and a spectral range of approximately 1650 cm-1 in static acquisition
mode. The remote Raman head is mounted on a tripod equipped with a micrometric translation stage. The
Raman laser beam was focused onto the pellet from the outside of the glass vial. We employed the same laser
wavelength for both PLAL and SERS and we verified that the edge filter of the Raman spectrometer can
prevent the diffused pulsed laser beam of PLAL from entering the spectrometer and blinding the CCD. The
surface of the PE pellet before and after the ablation was analyzed by scanning electron microscope (SEM,
Zeiss Supra 40) equipped with a detector of secondary electrons, using an accelerating voltage of 3 kV.
The concentration of polyynes and the purity of the mixtures were analyzed by ex situ UV-Vis absorption
spectroscopy (Shimadzu UV-1800 UV/visible Scanning Spectrophotometer, 190-1100 nm spectral range). All
the solutions were diluted with pure ACN to avoid saturation of the most concentrated chains, with a
proportion of 1/37 v/v. Quartz cuvettes with an optical path of 1 cm were employed and pure ACN was used
as a reference in all the measurements.
The exact concentration of hydrogen-capped polyynes contained in the solutions was evaluated using
reversed-phase high-performance liquid chromatography (RP-HPLC). A C18 column was used (Phenomenex
Luna 3 μm C18(2) 100 Å, LC Column 150 x 4.6 mm), mounted on a Shimadzu Prominence UFLC, equipped
with a photodiode array (DAD) UV-Vis spectrometer and a fraction collector module. SERS measurements
of size-selected H-capped polyynes separated by HPLC were done in liquid employing the same PE pellets as
probes. The separation was performed employing a gradient mode, whose mobile phase gradually varies in
time by changing the amount of ACN (%B), and an overall flux of 0.8 mL/min. Before the HPLC analysis,
the solutions were filtered through Phenomenex Phenex RC-membrane syringe filters (450 nm of pore size)
to remove any possible macroscopic impurity that could damage the HPLC column.
Theoretical calculations based on state-of-the-art Density Functional Theory (DFT) simulations were
performed at the PBE0/cc-pVTZ level of theory on single linear chains using Gaussian09[55] to support
experimental results. Frequency analysis has been performed for H-capped polyynes with different lengths
(HC2nH, n=3-10). All the optimized molecules resulted to be linear. Then, prediction of the Raman spectra
has been carried out for the optimized molecules and, in particular, Raman activities were collected.
Theoretical simulations made at this level of theory demonstrated from previous works to provide a very good
agreement with experiments[1,31].
3. Results and discussion
3.1. A novel approach for in situ SERS during laser ablation in acetonitrile To continuously perform in situ SERS measurements during the ablation, we employed the experimental setup
reported in Figure 1a. SERS effect, thanks to the enhancement of the Raman signal, allows us to examine the
formation of polyynes with time-resolution of a few seconds from the early stages of ablation, when the
concentration of polyynes is very low, or in the case of long chains that are always too low concentrated for
conventional Raman. We employed a solid-state fixed SERS active surface to avoid the use of colloidal
nanoparticles in liquid which may modify the liquid environment and the formation process of polyynes. Thus,
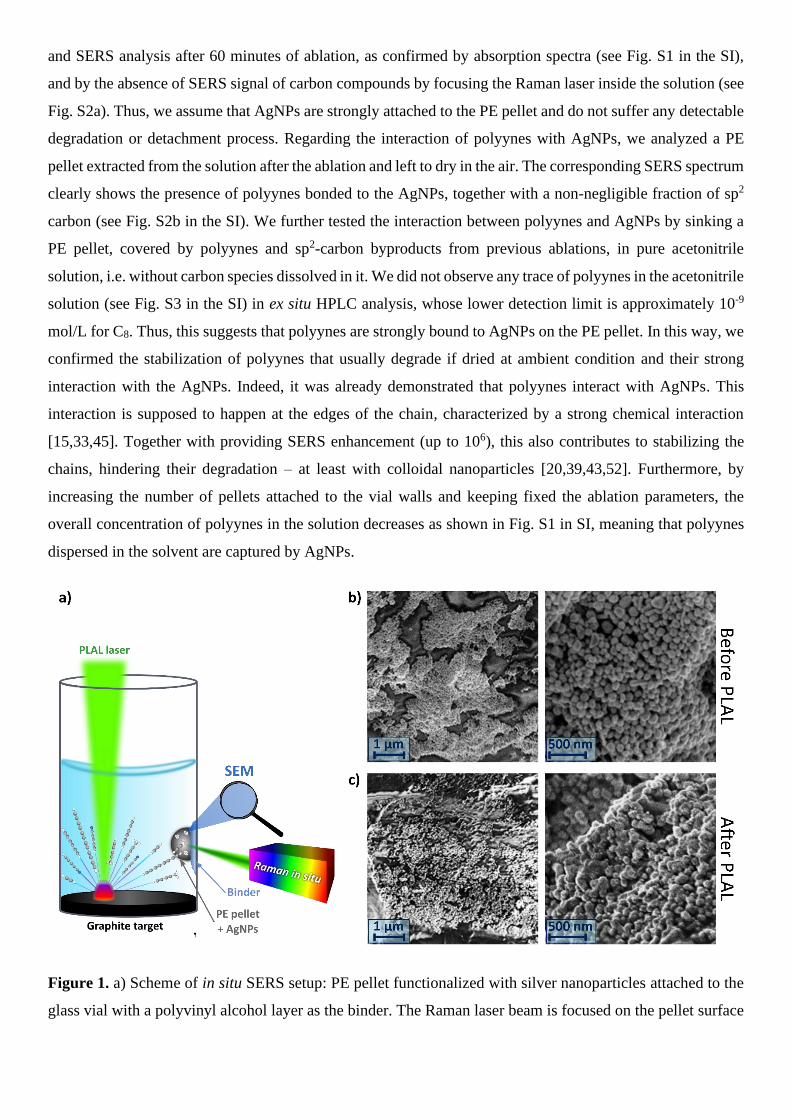
the core of our in situ SERS approach is a PE pellet functionalized with silver nanoparticles, realized following
a patented method [54]. The morphology of the SERS active pellet was investigated by SEM before and after
the ablation (Fig. 1b and 1c) to inspect AgNPs distribution and mean size. We estimated the average
nanoparticle size of about 90 nm, from their plasmonic resonance, peaked at about 475 nm [56]. The
interaction of polyynes with silver nanoparticles generates an additional surface plasmon absorption at a
higher wavelength, as observed in other works [45,57]. Indeed, the pellet shows optimal SERS response by
exploiting a Raman laser beam at 532 nm, i.e. the same laser wavelength used for PLAL synthesis. SEM
images (see Fig1.b) show that the distribution of AgNPs is uniform compared to the spot size of the Raman
laser (12 µm). Furthermore, the dimension of the Raman laser is sufficient to cover a large number of silver
nanoparticles, ensuring a SERS response that does not depend on the specific point where the Raman laser
beam is focused.
To explore the phenomena taking place during polyynes synthesis by PLAL, we employ this novel SERS
probe. The selected target-pellet distance (10 ± 2 mm) ensures no interactions between the plasma plume
generated by the ablation and the PE pellet. Indeed, it was reported in the literature that the maximum
dimension of the plume and the subsequent bulkier cavitation bubble in PLAL experiments are limited below
ca. 3 mm [58–62]. In these cases, the fluence (tens of J/cm2) is much larger compared to that employed in this
work (0.37 J/cm2). So, we expect that the plasma plume and the cavitation bubble generated in our setup are
further confined and do not interact with the PE pellet. After the laser pulse, we can distinguish between a fast
transient and a slow relaxation phase. The fast transient corresponds to the shockwave lifetime (≤ 1 ms
[29,30]), generated by the collapse of the cavitation bubble, during which the carbon species produced, i.e.
polyynes and byproducts (mainly consisting of sp2 carbon), spread out in the whole liquid volume and interact
with the PE pellet. We assumed the initial speed of the carbon species equal to that of the shockwaves, i.e.
approximately 1500 m/s [58,62,63]. For this reason, the in situ SERS measurements are unaffected by the
position of the PE pellet if it is far enough from the plasma plume and within the volume reached by the
shockwave before the subsequent laser pulse (after 100 ms in our setup, repetition rate of 10 Hz). After the
shockwave, carbon species move in the solution in a Brownian-like motion [64,65] and can interact with the
PE pellet and with each other, until the next laser pulse after 100 ms.
Once polyynes have reached the PE pellet, we assume that they stick to the AgNPs adsorbed on its surface
and remain attached. To support this mechanism, we tested the adhesion of AgNPs to the pellet and the
interaction between polyynes and AgNPs. Regarding the stability of AgNPs on the pellet, from SEM analysis
after the ablation (see Fig. 1c), we noticed that the distribution of AgNPs remains unchanged, as well as the
average size of the nanoparticles. Moreover, no silver nanoparticles were detected in the solution by UV-Vis
and SERS analysis after 60 minutes of ablation, as confirmed by absorption spectra (see Fig. S1 in the SI),
and by the absence of SERS signal of carbon compounds by focusing the Raman laser inside the solution (see
Fig. S2a). Thus, we assume that AgNPs are strongly attached to the PE pellet and do not suffer any detectable
degradation or detachment process. Regarding the interaction of polyynes with AgNPs, we analyzed a PE
pellet extracted from the solution after the ablation and left to dry in the air. The corresponding SERS spectrum
clearly shows the presence of polyynes bonded to the AgNPs, together with a non-negligible fraction of sp2
carbon (see Fig. S2b in the SI). We further tested the interaction between polyynes and AgNPs by sinking a
PE pellet, covered by polyynes and sp2-carbon byproducts from previous ablations, in pure acetonitrile
solution, i.e. without carbon species dissolved in it. We did not observe any trace of polyynes in the acetonitrile
solution (see Fig. S3 in the SI) in ex situ HPLC analysis, whose lower detection limit is approximately 10-9
mol/L for C8. Thus, this suggests that polyynes are strongly bound to AgNPs on the PE pellet. In this way, we
confirmed the stabilization of polyynes that usually degrade if dried at ambient condition and their strong
interaction with the AgNPs. Indeed, it was already demonstrated that polyynes interact with AgNPs. This
interaction is supposed to happen at the edges of the chain, characterized by a strong chemical interaction
[15,33,45]. Together with providing SERS enhancement (up to 106), this also contributes to stabilizing the
chains, hindering their degradation – at least with colloidal nanoparticles [20,39,43,52]. Furthermore, by
increasing the number of pellets attached to the vial walls and keeping fixed the ablation parameters, the
overall concentration of polyynes in the solution decreases as shown in Fig. S1 in SI, meaning that polyynes
dispersed in the solvent are captured by AgNPs.
Figure 1. a) Scheme of in situ SERS setup: PE pellet functionalized with silver nanoparticles attached to the
glass vial with a polyvinyl alcohol layer as the binder. The Raman laser beam is focused on the pellet surface
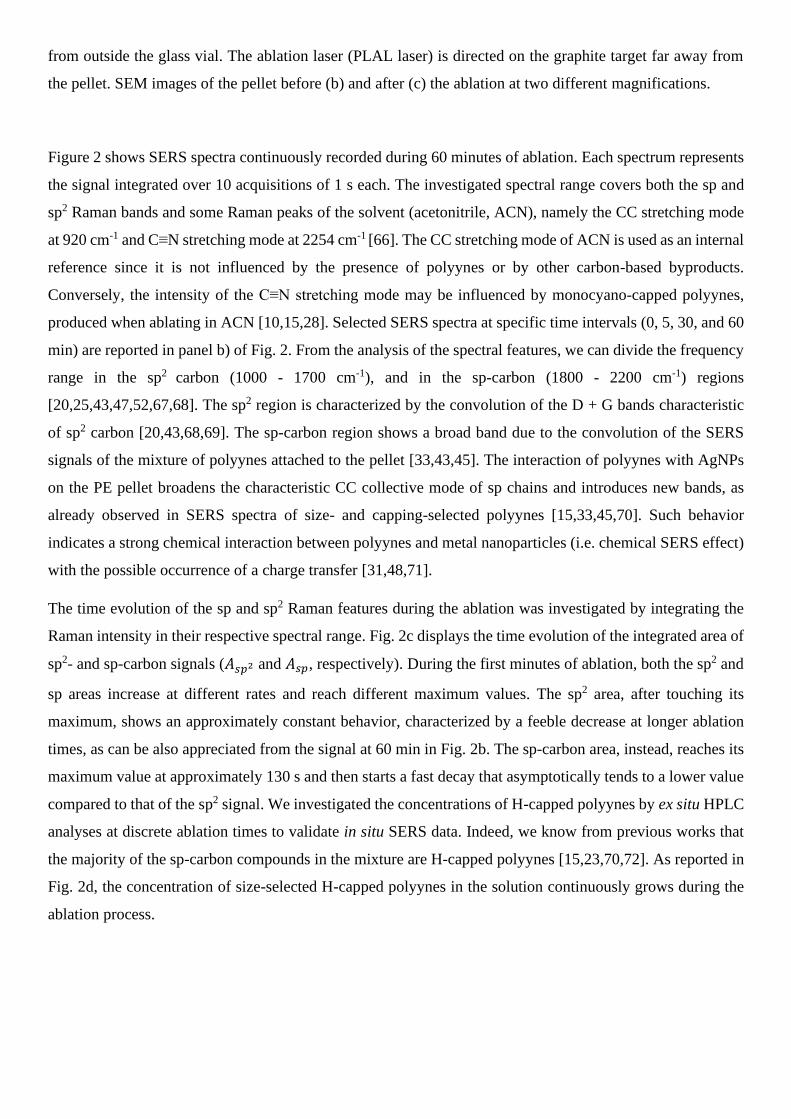
from outside the glass vial. The ablation laser (PLAL laser) is directed on the graphite target far away from
the pellet. SEM images of the pellet before (b) and after (c) the ablation at two different magnifications.
Figure 2 shows SERS spectra continuously recorded during 60 minutes of ablation. Each spectrum represents
the signal integrated over 10 acquisitions of 1 s each. The investigated spectral range covers both the sp and
sp2 Raman bands and some Raman peaks of the solvent (acetonitrile, ACN), namely the CC stretching mode
at 920 cm-1 and C≡N stretching mode at 2254 cm-1 [66]. The CC stretching mode of ACN is used as an internal
reference since it is not influenced by the presence of polyynes or by other carbon-based byproducts.
Conversely, the intensity of the C≡N stretching mode may be influenced by monocyano-capped polyynes,
produced when ablating in ACN [10,15,28]. Selected SERS spectra at specific time intervals (0, 5, 30, and 60
min) are reported in panel b) of Fig. 2. From the analysis of the spectral features, we can divide the frequency
range in the sp2 carbon (1000 - 1700 cm-1), and in the sp-carbon (1800 - 2200 cm-1) regions
[20,25,43,47,52,67,68]. The sp2 region is characterized by the convolution of the D + G bands characteristic
of sp2 carbon [20,43,68,69]. The sp-carbon region shows a broad band due to the convolution of the SERS
signals of the mixture of polyynes attached to the pellet [33,43,45]. The interaction of polyynes with AgNPs
on the PE pellet broadens the characteristic CC collective mode of sp chains and introduces new bands, as
already observed in SERS spectra of size- and capping-selected polyynes [15,33,45,70]. Such behavior
indicates a strong chemical interaction between polyynes and metal nanoparticles (i.e. chemical SERS effect)
with the possible occurrence of a charge transfer [31,48,71].
The time evolution of the sp and sp2 Raman features during the ablation was investigated by integrating the
Raman intensity in their respective spectral range. Fig. 2c displays the time evolution of the integrated area of
sp2- and sp-carbon signals (𝐴𝑠𝑝2 and 𝐴𝑠𝑝, respectively). During the first minutes of ablation, both the sp2 and
sp areas increase at different rates and reach different maximum values. The sp2 area, after touching its
maximum, shows an approximately constant behavior, characterized by a feeble decrease at longer ablation
times, as can be also appreciated from the signal at 60 min in Fig. 2b. The sp-carbon area, instead, reaches its
maximum value at approximately 130 s and then starts a fast decay that asymptotically tends to a lower value
compared to that of the sp2 signal. We investigated the concentrations of H-capped polyynes by ex situ HPLC
analyses at discrete ablation times to validate in situ SERS data. Indeed, we know from previous works that
the majority of the sp-carbon compounds in the mixture are H-capped polyynes [15,23,70,72]. As reported in
Fig. 2d, the concentration of size-selected H-capped polyynes in the solution continuously grows during the
ablation process.
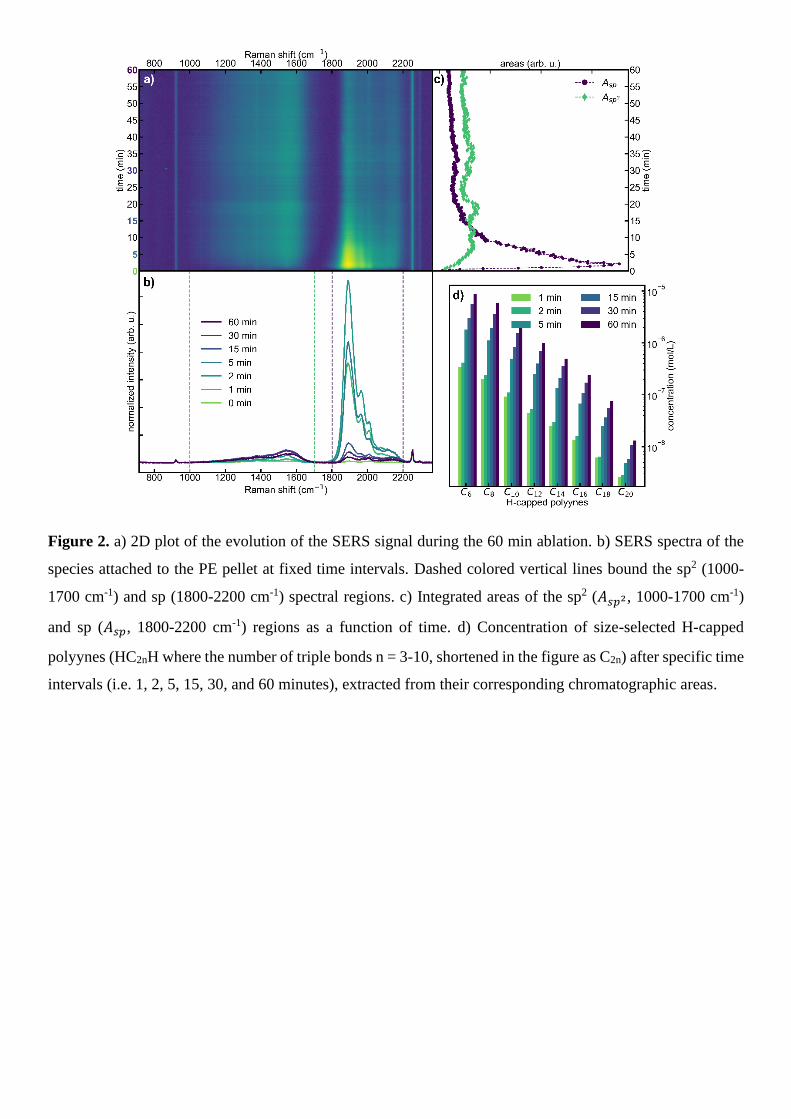
Figure 2. a) 2D plot of the evolution of the SERS signal during the 60 min ablation. b) SERS spectra of the
species attached to the PE pellet at fixed time intervals. Dashed colored vertical lines bound the sp2 (1000-
1700 cm-1) and sp (1800-2200 cm-1) spectral regions. c) Integrated areas of the sp2 (𝐴𝑠𝑝2, 1000-1700 cm-1)
and sp (𝐴𝑠𝑝, 1800-2200 cm-1) regions as a function of time. d) Concentration of size-selected H-capped
polyynes (HC2nH where the number of triple bonds n = 3-10, shortened in the figure as C2n) after specific time
intervals (i.e. 1, 2, 5, 15, 30, and 60 minutes), extracted from their corresponding chromatographic areas.
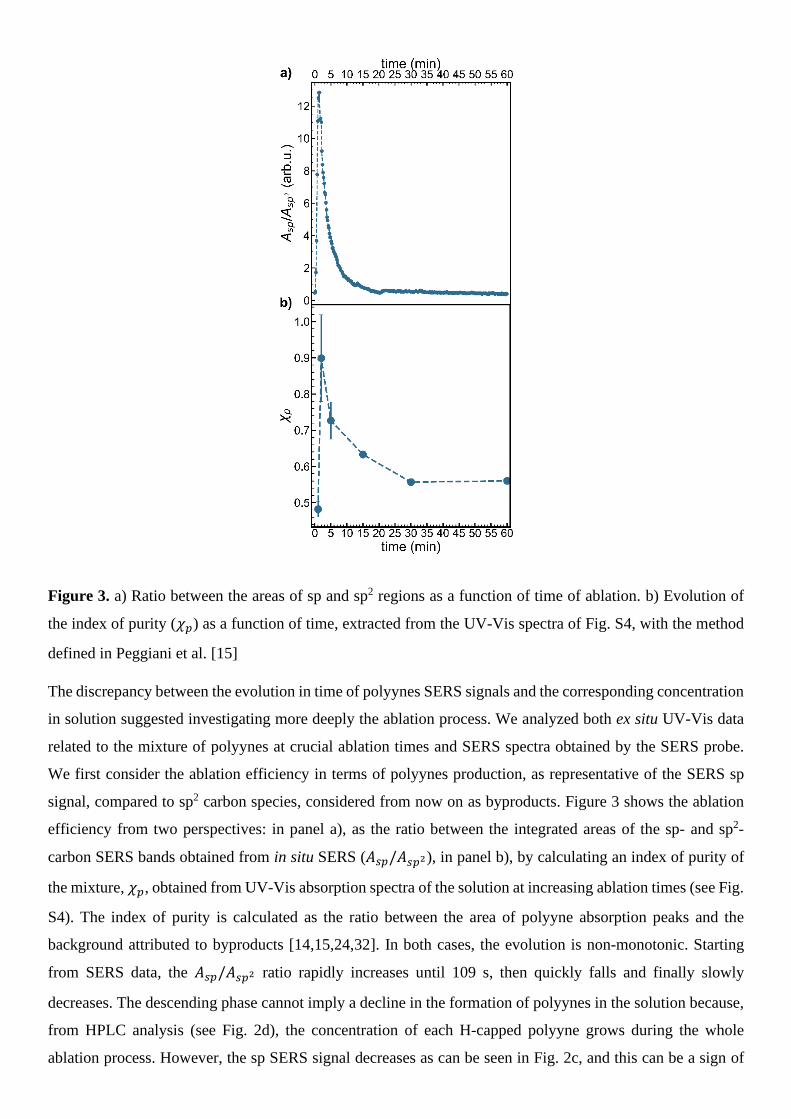
Figure 3. a) Ratio between the areas of sp and sp2 regions as a function of time of ablation. b) Evolution of
the index of purity (𝜒𝑝) as a function of time, extracted from the UV-Vis spectra of Fig. S4, with the method
defined in Peggiani et al. [15]
The discrepancy between the evolution in time of polyynes SERS signals and the corresponding concentration
in solution suggested investigating more deeply the ablation process. We analyzed both ex situ UV-Vis data
related to the mixture of polyynes at crucial ablation times and SERS spectra obtained by the SERS probe.
We first consider the ablation efficiency in terms of polyynes production, as representative of the SERS sp
signal, compared to sp2 carbon species, considered from now on as byproducts. Figure 3 shows the ablation
efficiency from two perspectives: in panel a), as the ratio between the integrated areas of the sp- and sp2-
carbon SERS bands obtained from in situ SERS (𝐴𝑠𝑝/𝐴𝑠𝑝2), in panel b), by calculating an index of purity of
the mixture, 𝜒𝑝, obtained from UV-Vis absorption spectra of the solution at increasing ablation times (see Fig.
S4). The index of purity is calculated as the ratio between the area of polyyne absorption peaks and the
background attributed to byproducts [14,15,24,32]. In both cases, the evolution is non-monotonic. Starting
from SERS data, the 𝐴𝑠𝑝/𝐴𝑠𝑝2 ratio rapidly increases until 109 s, then quickly falls and finally slowly
decreases. The descending phase cannot imply a decline in the formation of polyynes in the solution because,
from HPLC analysis (see Fig. 2d), the concentration of each H-capped polyyne grows during the whole
ablation process. However, the sp SERS signal decreases as can be seen in Fig. 2c, and this can be a sign of
the degradation of polyynes on AgNPs. Conversely, we did not record a proportionate increase of the sp2
SERS signal that only slightly increases during the first 5 minutes after which it remains quite unchanged for
the rest of the ablation (see Fig. 2c). Thus, the evolution of the 𝐴𝑠𝑝/𝐴𝑠𝑝2 ratio must imply the existence of a
mechanism of degradation of polyynes on the pellet that contrasts the stabilization governed by the interaction
with AgNPs. The evolution in time of the 𝐴𝑠𝑝/𝐴𝑠𝑝2 ratio led us to believe that this degradation process starts
in the first stages of the ablation, at least locally on the pellet.
In this framework, we modeled the time evolution of the 𝐴𝑠𝑝/𝐴𝑠𝑝2 ratio of Fig. 3. The onset of a degradation
mechanism observed during the first steps of ablation can be approximated with a sigmoid function
𝑎
1+𝑒−(𝑡+𝑡0)/𝜏1, where 𝜏1 represents the characteristic time of this process and 𝑡0 the midpoint of the sigmoid
[73–75]. The fast decrease can be rationalized with a decaying exponential as 𝑒−(𝑡+𝑡0′ )/𝜏2 + 𝑐, where the decay
time is equal to 𝜏2, c is the asymptotic value and 𝑡0′ is a rigid time-shift introduced in the fitting model [21,76].
Employing this method, the calculated time constant of the rising part of Fig. 3a turns out to be 𝜏1 = 9.2 ± 0.25
s, while the descending phase has a decay time 𝜏2𝑒𝑥𝑝
= 173 ± 1.66 s. The calculated 𝜏1 is comparable or even
lower than the temporal resolution of our SERS measurement (i.e. 10 s), so the degradation starts almost
synchronously with the ablation process and may be associated with crosslinking reactions with other
polyynes or sp2 species, even if polyynes are stabilized by AgNPs on the pellet. Indeed, crosslinking is one of
the main channels of degradation of polyynes, especially in presence of a high density of carbon species, i.e.
sp2 byproducts or other reactive polyynes – i.e. without bulky endgroups – as may be the case of the surface
of the pellet[15,52,76]. If the degradation products remain on the PE pellet, we should observe the rise of the
sp2 signal and the decrease of the sp one, while if they detach, both signals should lower. From the observations
about the 𝐴𝑠𝑝2 area (see Fig. 2c), we can conclude that both the mechanisms occur at the same time, producing
a sort of dynamical equilibrium. Similarly, in the solution, a single polyyne is surrounded by other polyynes
and byproducts expelled from the ablation site with high speed that slow down and start moving in Brownian-
like motion. Such systems may chemically interact with the polyynes causing their degradation. In this sense,
the situation, probed by SERS, of a polyyne fixed on the PE pellet gives back the kinetics of degradation of
polyynes in solution.
We analyzed the index of purity (𝜒𝑝) in the solution, extracted from ex situ UV-Vis measurements at different
ablation times (see Fig. S4), to validate the conclusions coming from our in situ SERS approach. The index
of purity provides conceptually the same information of the SERS 𝐴𝑠𝑝/𝐴𝑠𝑝2 ratio, but from the perspective of
the entire solution and without the interaction with silver nanoparticles. Indeed, during the first minutes of
ablation, 𝜒𝑝 increases following the same time evolution of the in situ SERS probe which therefore provides
the picture of what is happening in the solution.
The decrease of the SERS 𝐴𝑠𝑝/𝐴𝑠𝑝2 ratio and the index of purity 𝜒𝑝 is approximated with exponential decay
in the fit model. Regarding the SERS ratio, we calculated a characteristic time 𝜏2𝑒𝑥𝑝
= 173 ± 1.66 s. Similarly,
we estimated the decay time 𝜏2
𝜒𝑝 of the descending part of the index of purity from Fig. 3b. The calculated
value, i.e. 𝜏2
𝜒𝑝 = 527 ± 243 s, despite the large fit error deriving from the small dataset available (6 points for
6 fit variables), is comparable with 𝜏2𝑒𝑥𝑝
extracted from SERS data. These fast decays can be rationalized
considering that polyynes undergo degradation not only on the PE pellet but also in the solution.
It is reasonable to assume that the fast degradation rate in the case of in situ SERS can be related to the
continuous generation of polyynes and byproducts that speed up the degradation of polyynes. Indeed, if we
stop the ablation after 109 s (see Fig. S5), i.e. at the maximum of the SERS 𝐴𝑠𝑝/𝐴𝑠𝑝2 ratio extracted from Fig.
3a, we should expect a slower degradation of polyynes because the synthesis is stopped, but polyynes can still
crosslink throughout the solution and on the pellet too. Applying the same fit model, the decay time when the
ablation is stopped after 109 s (𝜏2109 𝑠 = 3387 ± 554.66 s) is larger than in the case of continuous ablation (𝜏2
𝑒𝑥𝑝
= 173 ± 1.66 s), while the time constant 𝜏1 of the activation of the degradation mechanism of polyynes remains
rather unchanged (6 ± 1.05 s) (see Fig. S6). We compared our data with the work of Lucotti et al.[43] in which
they recorded the evolution in time of the SERS signal by adding a colloidal solution of AgNPs to a mixture
of polyynes previously produced by arc discharge in methanol. We extracted the exponential decay time (𝜏2𝑙𝑖𝑡=
382 ± 41.6 s) by calculating the SERS 𝐴𝑠𝑝/𝐴𝑠𝑝2 ratio from Fig. 4b of ref. [43]. In that case, the degradation
of polyynes was due to the increased probability of crosslinking reactions induced by the aggregating effect
of the Ag colloids. Despite the differences between the two setups, the similarity of the decay times confirms
crosslinking as the main channel of degradation of polyynes, even if they are stabilized by AgNPs. The reason
that explains the larger decay time of Lucotti et al. (𝜏2𝑙𝑖𝑡) compared to the case of continuous ablation (𝜏2
𝑒𝑥𝑝)
is the same as discussed in the case of 109 s of ablation (𝜏2109 𝑠), i.e. there is no further generation of reactive
polyyne.
We further investigated this phenomenon with a dedicated experiment in which we transferred a PE pellet,
covered by polyynes and byproducts produced during 60 min of ablation, in pure acetonitrile solution, and we
track its status via in situ SERS. In this case, 𝐴𝑠𝑝 and 𝐴𝑠𝑝2 decrease with a comparable slope (see Fig. S7).
The decrease of 𝐴𝑠𝑝2 is related to the desorption of byproducts from the PE pellet, confirmed by ex situ UV-
Vis spectrum in which we detected a signal similar to the absorption background of byproducts in Fig. S1 and
S4. We concluded that the detachment of byproducts is favored by improved mobility gained from the local
heating of AgNPs that absorb the Raman laser during SERS measurements. The decrease of 𝐴𝑠𝑝 cannot be
connected to crosslinking since there are not enough reactive carbon species in the solution. Indeed, as already
demonstrated, polyynes do not desorb from the PE pellet and thus the decrease of 𝐴𝑠𝑝 is caused by a local
thermal degradation of polyynes on the pellet due to the Raman-induced heating of AgNPs. The comparison
of the SERS 𝐴𝑠𝑝/𝐴𝑠𝑝2 ratio in the three cases (see Fig. S6), 60 min or 109 s of ablation time and without
ablation, showed that the rate of degradation increases as the probability of crosslinking reactions increases,
once we assumed that the local thermal degradation induced by the Raman laser does not change since the
measurement parameters remain fixed in all the three experiments.
We here showed that our approach can provide in situ time-resolved information about the processes occurring
during the synthesis of polyynes by PLAL without affecting the chemical and physical environment of the
formation of polyynes (e.g. by adding colloidal nanoparticles). Indeed, we experimentally demonstrated that
the formation and the degradation (i.e. crosslinking) of polyynes occur simultaneously during PLAL and not
only after their synthesis, as already reported in the literature [4,15,21,43,76]. Moreover, this method allows
the evaluation of the time evolution of the efficiency of polyynes production compared to byproducts, without
the delay or the perturbation of ex situ analyses.
3.2 Formation and degradation mechanisms of long and short polyynes
Here we focus on monitoring the role of the length of polyynes on their formation and dynamics during the
ablation. The SERS spectrum already in the first minutes of ablation (Fig. 2b) exhibits a clear asymmetrical
distribution of features in the polyyne region with a larger intensity at the low-frequency edge of the sp-carbon
spectral region (1800-2200 cm-1). This suggests that long polyynes may have a primary role in the response
of the in situ SERS probe. Indeed, it is well known that the ECC mode of H-capped polyynes redshifts and its
Raman activity grows (see Fig. S8 in SI) as the chain length increases [1,31,33,45,77]. Even though the
interaction of polyynes with silver nanoparticles introduces low-frequency bands and prevents an easy
interpretation of the SERS spectra [33,43,45,70], we analyzed the spectra to extract information on the
behavior of polyynes of different lengths. We developed a custom algorithm to deconvolve the overall polyyne
band at each time instant of the in situ SERS measurement. The fit model was built as a linear combination of
experimental SERS spectra of size-selected H-capped polyynes, reported in Fig. 4a, corrected by a weighting
factor that represents the fraction of every single chain at a specific time. After applying the fitting algorithm,
the weighted SERS signal of each H-capped polyyne has been divided by its corresponding ECC Raman mode
activity computed with DFT calculations (see Fig. S8 in the SI). In such a way, we corrected our estimations
from the nonlinear growth of the ECC Raman mode activity of polyynes with increasing chain length. Since
the ECC intensity always prevails over the other collective modes of polyynes in the spectral region selected
(1800-2200 cm-1), as a first approximation, we have assumed its Raman activity alone as the corrective factor
[31,77].
The SERS spectra of size-selected H-terminated polyynes with increasing length, from 6 to 20 carbon atoms
were collected employing PE pellets sunk in an acetonitrile/water mixture of size-selected polyynes collected
by HPLC. We grouped polyynes in long and short chains, depending on the intensity of their SERS signal
below or above 2000 cm-1. Indeed, the hallmarks in the spectrum of long polyynes are the merging of the high-
and low-frequency bands and a negligible signal above 2000 cm-1 [33]. Thus, as can be deduced from Fig. 4,
short polyynes include chains from HC6H till HC12H, and long polyynes range from HC14H to HC20H. Figure
4b shows some results of the fitting procedure at specific times of ablation. The contribution of the SERS
signal of each H-capped polyyne is displayed as well to highlight the different magnitudes both in frequency
and time. The model suffers from some overfitting since all the SERS spectra employed in the fit possess one
or more bands below 2000 cm-1. Moreover, the fit slightly overestimates the intensity of the peak at 1950 cm-
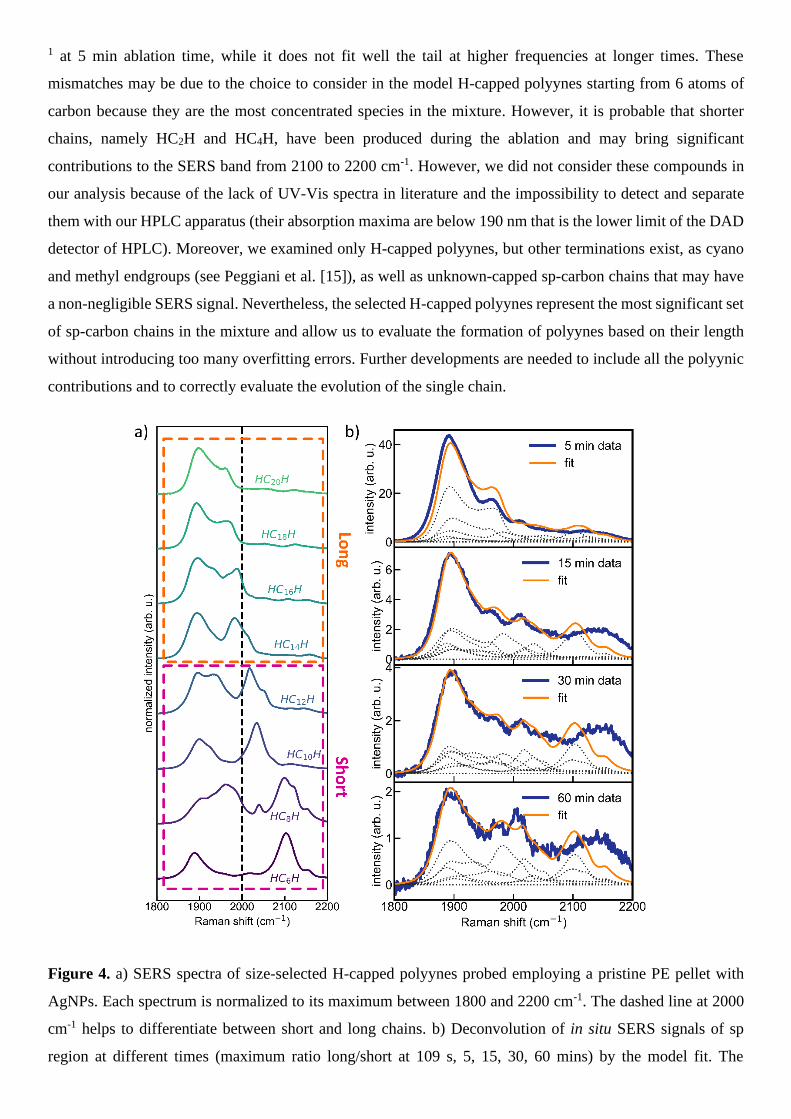
1 at 5 min ablation time, while it does not fit well the tail at higher frequencies at longer times. These
mismatches may be due to the choice to consider in the model H-capped polyynes starting from 6 atoms of
carbon because they are the most concentrated species in the mixture. However, it is probable that shorter
chains, namely HC2H and HC4H, have been produced during the ablation and may bring significant
contributions to the SERS band from 2100 to 2200 cm-1. However, we did not consider these compounds in
our analysis because of the lack of UV-Vis spectra in literature and the impossibility to detect and separate
them with our HPLC apparatus (their absorption maxima are below 190 nm that is the lower limit of the DAD
detector of HPLC). Moreover, we examined only H-capped polyynes, but other terminations exist, as cyano
and methyl endgroups (see Peggiani et al. [15]), as well as unknown-capped sp-carbon chains that may have
a non-negligible SERS signal. Nevertheless, the selected H-capped polyynes represent the most significant set
of sp-carbon chains in the mixture and allow us to evaluate the formation of polyynes based on their length
without introducing too many overfitting errors. Further developments are needed to include all the polyynic
contributions and to correctly evaluate the evolution of the single chain.
Figure 4. a) SERS spectra of size-selected H-capped polyynes probed employing a pristine PE pellet with
AgNPs. Each spectrum is normalized to its maximum between 1800 and 2200 cm-1. The dashed line at 2000
cm-1 helps to differentiate between short and long chains. b) Deconvolution of in situ SERS signals of sp
region at different times (maximum ratio long/short at 109 s, 5, 15, 30, 60 mins) by the model fit. The
experimental data (solid blue line) is compared to the calculated fit function (solid orange line). The different
contributes of single polyynes are reported for each time with a dotted gray line.
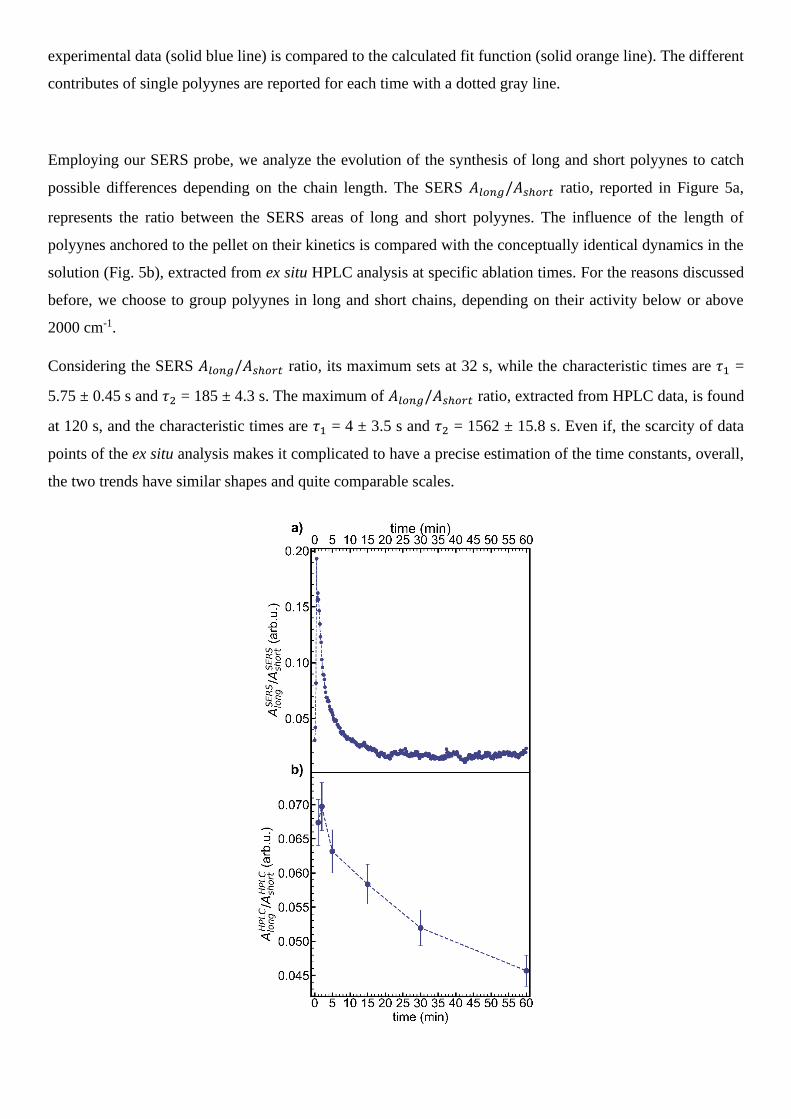
Employing our SERS probe, we analyze the evolution of the synthesis of long and short polyynes to catch
possible differences depending on the chain length. The SERS 𝐴𝑙𝑜𝑛𝑔/𝐴𝑠ℎ𝑜𝑟𝑡 ratio, reported in Figure 5a,
represents the ratio between the SERS areas of long and short polyynes. The influence of the length of
polyynes anchored to the pellet on their kinetics is compared with the conceptually identical dynamics in the
solution (Fig. 5b), extracted from ex situ HPLC analysis at specific ablation times. For the reasons discussed
before, we choose to group polyynes in long and short chains, depending on their activity below or above
2000 cm-1.
Considering the SERS 𝐴𝑙𝑜𝑛𝑔/𝐴𝑠ℎ𝑜𝑟𝑡 ratio, its maximum sets at 32 s, while the characteristic times are 𝜏1 =
5.75 ± 0.45 s and 𝜏2 = 185 ± 4.3 s. The maximum of 𝐴𝑙𝑜𝑛𝑔/𝐴𝑠ℎ𝑜𝑟𝑡 ratio, extracted from HPLC data, is found
at 120 s, and the characteristic times are 𝜏1 = 4 ± 3.5 s and 𝜏2 = 1562 ± 15.8 s. Even if, the scarcity of data
points of the ex situ analysis makes it complicated to have a precise estimation of the time constants, overall,
the two trends have similar shapes and quite comparable scales.
Figure 5. a) Evolution in time of the ratio of SERS areas of long versus short polyynes. b) Evolution in time
of the ratio of the chromatographic areas of long over short polyynes, detected by HPLC measurements at
specific ablation times (1, 2, 5, 15, 30, and 60 minutes).
The evolution in time of the 𝐴𝑙𝑜𝑛𝑔/𝐴𝑠ℎ𝑜𝑟𝑡 ratio extracted from in situ SERS suggests that the growth of long
polyynes is favored at short times while at longer times short polyynes are predominant. To interpret these
data, some points need to be considered. As already known for π conjugated materials, the reactivity of
polyynes scales up with their length, therefore a different degradation rate should be considered [1,31,78].
However, the PLAL technique has already been demonstrated to be a proficient ambient for the formation of
long polyynes up to HC30H in non-polar solvents [26]. Based on these considerations, we can assume that at
least in the first instants of ablation the synthesis rate of longer polyynes exceeds that of shorter ones. This is
indeed supported by our results, showing that the 𝐴𝑙𝑜𝑛𝑔/𝐴𝑠ℎ𝑜𝑟𝑡 ratio of chromatographic areas reported in Fig.
5b increases from 1 to 2 minutes of ablation. The subsequent decrease of the 𝐴𝑙𝑜𝑛𝑔/𝐴𝑠ℎ𝑜𝑟𝑡 ratio both in
solution (i.e. from ex situ HPLC) and on the PE pellet (i.e. from in situ SERS) could be explained only if long
polyynes degrade faster than shorter ones. Indeed, we exclude that the synthesis process of long and short
polyynes changes during the ablation. Such variation could be ascribed to laser-induced photodegradation
processes or a variation of the liquid environment around the plasma plume (e.g. thermal degradation).
Considering the laser-induced photodegradation processes, polyynes and sp2 carbon byproducts dissolved in
the solution can have different interactions with the ablation laser. Nevertheless, even the longest polyyne
produced by PLAL in acetonitrile cannot absorb the ablation laser (maximum absorption wavelength for
HC22H is at 362 nm) and undergo photo-induced degradation. Byproducts generated during PLAL, instead,
feature a non-negligible absorption in the visible light, as it has been demonstrated by the long tail in the UV-
Vis absorption spectra of the mixture of polyynes obtained by PLAL (see also Fig. S1 and S4 in the SI)
[14,15,32]. Those byproducts suspended in the solution can be fragmented into C2 radicals and contribute to
the growth of polyynes, similarly to the role of graphite particles or C60 dispersed in solution discussed in the
works of Tsuji et al. [23,72]. Nevertheless, the concentration of byproducts produced by PLAL is much lower
than the amount of graphite particles (4.2 ∙ 10−2 mol/L [72]) or C60 (3.8 ∙ 10−3 mol/L [23]) employed in
previous experiments as the main source of carbon atoms for polyyne synthesis. This value is slightly larger
than the concentration of polyynes from the calculation of 𝜒𝑝 in Fig. 3b or by looking at the Raman spectrum
in the solvent of Fig. S2a where the sp2-related Raman signal is negligible. So, we consider that the
contribution of byproducts does not boost the synthesis of polyynes in a relevant way. Regarding the chemical
environment around the plasma plume, it may be perturbed by partial substitution of solvent molecules by sp-
carbon chains or byproducts that can act as secondary carbon sources and may induce alterations in the size
distribution of synthesized polyynes. Indeed, if carbon species remain in the proximity of the laser plume,
they can degrade due to the high-temperature gradients experienced at the plasma-liquid boundary. However,
if we assume that the majority of polyynes and byproducts are pushed away from the ablation site due to
shockwaves generated by the collapse of the cavitation bubble produced by the quenching of the plasma
plume, we expect that the thermal degradation process can be neglected [58,62,63]. Once we have excluded
the photoinduced and thermal degradations, crosslinking reactions candidate as the main channel of
degradation of polyynes during the ablation and justify the faster decrease of longer polyynes because of their
higher reactivity. Indeed, the SERS 𝐴𝑙𝑜𝑛𝑔/𝐴𝑠ℎ𝑜𝑟𝑡 ratio in the case of 109 s of ablation features a much slower
decrease than that of continuous ablation (see Fig. S9) due to a lower concentration of diluted carbon species
in the solution that depresses crosslinking reactions and raises the lifetime of long polyynes both on the PE
pellet and within the solution.
Thus, in situ SERS data allows us also to keep track of the evolution of the distribution of polyyne length
during the ablation and understand the reasons behind the final distribution of lengths, which is biased towards
shorter chains. From our observations, we can exclude that the different degradation rates between short and
long polyynes are imputed to photoinduced degradation caused by the ablation laser or thermal degradation
provoked by the extreme conditions in the plasma plume. Conversely, the crosslinking probability increases
according to the chain length, i.e. longer polyynes possess more radical-like sites, a well-known property of
π-conjugated molecules. Therefore, longer chains lose their linearity and reorganize into sp2 species faster
than shorter wires, inducing the observed size distribution of a mixture of polyynes synthesized by laser
ablation.
Conclusions We employed a novel in situ SERS approach to investigate the formation of polyynes by pulsed laser ablation
in liquid acetonitrile. The sensitivity given by the SERS effect granted us to study polyynes formation with an
unprecedented time-resolution of only a few seconds. It is also possible to acquire information even when the
concentration of polyynes is too small for conventional Raman (≤10-8 mol/L), i.e. in the early stages of ablation
and for longer chains. Another advantage of the SERS approach based on a solid PE pellet functionalized with
AgNPs is that the chemical and physical environment of the ablation is not affected by SERS-active
nanostructures dispersed in the solvent. Thus, this SERS probe can provide reliable information to in situ and
in operando observe the formation process of sp-carbon chains avoiding the delay and perturbation of
polyynes due to ex situ characterization measurements.
This methodology allowed us to analyze the dynamics of the synthesis of polyynes: we show that the
degradation processes (crosslinking reactions) start almost synchronously with the formation of sp-carbon
chains and we verified that they depend on the concentration of both polyynes and byproducts in the mixture.
Moreover, we have analyzed by in situ SERS how the dynamics of short and long sp-carbon chains evolve
during the ablation time. By looking at the pellet, we observed a majority of shorter chains during the ablation
process. Indeed, thanks to their smaller surface area, carbon species adsorbed on the pellet can interact less
often with sp-carbon chains and byproducts dissolved in the solution. Thus, the degradation affects
preferentially longer polyynes and the probability of crosslinking grows as the chain length increases. Thus,
the final distribution in the solution at the end of the ablation is unbalanced towards shorter chains. Ex situ
UV-Vis and HPLC measurements confirmed the information gained through in situ SERS data, confirming
that the dynamics on the pellet simulate what is happening in the solution.
Even though we only investigated synthesis in acetonitrile, in situ SERS methodology can be applied to any
liquid or gaseous environment. We assume that the conclusions we have obtained about the synthesis of
polyynes maintain their generality also with other solvents. However, the thermodynamical (e.g. viscosity and
diffusivity) and the physicochemical (e.g. C/H ratio, radical production, and absorption of the laser beam)
properties of the solvent may influence the efficiency of the synthesis. Moreover, we expect that the dynamics
of crosslinking reactions, represented by the characteristic time constants, should change and indicate the most
efficient environment for the synthesis of polyynes. Our SERS approach can contribute to shed light on the
formation mechanisms of sp-carbon chains and of carbon nanostructures during laser ablation in liquid and
give information to improve the synthesis efficiency toward the exploitation of carbon atomic wires in
technological applications.
Acknowledgements The authors thank A. Vidale for his assistance during the development and the measurements with in situ
SERS, and fruitful discussions about the data. The authors acknowledge funding from the European Research
Council (ERC) under the European Union’s Horizon 2020 research and innovation program ERC-
Consolidator Grant (ERC CoG 2016 EspLORE grant agreement no. 724610, website: www.esplore.polimi.it).
Bibliography [1] Casari CS, Tommasini M, Tykwinski RR, Milani A. Carbon-atom wires: 1-D systems with tunable properties.
Nanoscale 2016;8:4414–35. https://doi.org/10.1039/C5NR06175J.
[2] Bryce MR. A review of functional linear carbon chains (oligoynes, polyynes, cumulenes) and their applications
as molecular wires in molecular electronics and optoelectronics. J Mater Chem C 2021:10.1039.D1TC01406D.
https://doi.org/10.1039/D1TC01406D.
[3] Shi L, Rohringer P, Suenaga K, Niimi Y, Kotakoski J, Meyer JC, et al. Confined linear carbon chains as a route
to bulk carbyne. Nature Mater 2016;15:634–9. https://doi.org/10.1038/nmat4617.
[4] Casari CS, Milani A. Carbyne: from the elusive allotrope to stable carbon atom wires. MRC 2018;8:207–19.
https://doi.org/10.1557/mrc.2018.48.
[5] Duley WW, Hu A. POLYYNES AND INTERSTELLAR CARBON NANOPARTICLES. ApJ 2009;698:808–
11. https://doi.org/10.1088/0004-637X/698/1/808.
[6] Shi Shun ALK, Tykwinski RR. Synthesis of Naturally Occurring Polyynes. Angew Chem Int Ed 2006;45:1034–
57. https://doi.org/10.1002/anie.200502071.
[7] Minto RE, Blacklock BJ. Biosynthesis and function of polyacetylenes and allied natural products. Progress in
Lipid Research 2008;47:233–306. https://doi.org/10.1016/j.plipres.2008.02.002.
[8] Konovalov DA. Polyacetylene Compounds of Plants of the Asteraceae Family (Review). Pharm Chem J
2014;48:613–31. https://doi.org/10.1007/s11094-014-1159-7.
[9] Eastmond R, Johnson TR, Walton DRM. Silylation as a protective method for terminal alkynes in oxidative
couplings. Tetrahedron 1972;28:4601–16. https://doi.org/10.1016/0040-4020(72)80041-3.
[10] Cataldo F. Polyynes and Cyanopolyynes: Their Synthesis with the Carbon Arc Gives the Same Abundances
Occurring in Carbon-Rich Stars. Orig Life Evol Biosph 2007;36:467–75. https://doi.org/10.1007/s11084-006-
9051-4.
[11] Cataldo F, editor. Polyynes: synthesis, properties, and applications. Boca Raton: Taylor & Francis; 2005.
[12] Cataldo F. Submerged electric arc between graphite electrodes: a one-pot tool for the synthesis of long-chain
polyynes in solution. Tetrahedron Letters 2004;45:141–4. https://doi.org/10.1016/j.tetlet.2003.10.100.
[13] Cataldo F. Synthesis of polyynes in a submerged electric arc in organic solvents. Carbon 2004;42:129–42.
https://doi.org/10.1016/j.carbon.2003.10.016.
[14] Taguchi Y, Endo H, Kodama T, Achiba Y, Shiromaru H, Wakabayashi T, et al. Polyyne formation by ns and fs
laser induced breakdown in hydrocarbon gas flow. Carbon 2017;115:169–74.
https://doi.org/10.1016/j.carbon.2017.01.003.
[15] Peggiani S, Marabotti P, Lotti RA, Facibeni A, Serafini P, Milani A, et al. Solvent-dependent termination, size
and stability in polyynes synthesized via laser ablation in liquids. Phys Chem Chem Phys 2020;22:26312–21.
https://doi.org/10.1039/D0CP04132G.
[16] Chalifoux WA, Tykwinski RR. Synthesis of extended polyynes: Toward carbyne. Comptes Rendus Chimie
2009;12:341–58. https://doi.org/10.1016/j.crci.2008.10.004.
[17] Szafert S, Gladysz JA. Carbon in One Dimension: Structural Analysis of the Higher Conjugated Polyynes. Chem
Rev 2003;103:4175–206. https://doi.org/10.1021/cr030041o.
[18] Gulia N, Pigulski B, Szafert S. Palladium End-Capped Polyynes via Oxidative Addition of 1-Haloalkynes to
Pd(PPh 3 ) 4. Organometallics 2015;34:673–82. https://doi.org/10.1021/om501105w.
[19] Pigulski B, Męcik P, Cichos J, Szafert S. Use of Stable Amine-Capped Polyynes in the Regioselective Synthesis
of Push–Pull Thiophenes. J Org Chem 2017;82:1487–98. https://doi.org/10.1021/acs.joc.6b02685.
[20] Casari CS, Giannuzzi CS, Russo V. Carbon-atom wires produced by nanosecond pulsed laser deposition in a
background gas. Carbon 2016;104:190–5. https://doi.org/10.1016/j.carbon.2016.03.056.
[21] Casari CS, Li Bassi A, Ravagnan L, Siviero F, Lenardi C, Piseri P, et al. Chemical and thermal stability of
carbyne-like structures in cluster-assembled carbon films. Phys Rev B 2004;69:075422.
https://doi.org/10.1103/PhysRevB.69.075422.
[22] Kaiser K, Scriven LM, Schulz F, Gawel P, Gross L, Anderson HL. An sp-hybridized molecular carbon allotrope,
cyclo[18]carbon. Science 2019;365:1299–301. https://doi.org/10.1126/science.aay1914.
[23] Tsuji M, Kuboyama S, Matsuzaki T, Tsuji T. Formation of hydrogen-capped polyynes by laser ablation of C60
particles suspended in solution. Carbon 2003;41:2141–8. https://doi.org/10.1016/S0008-6223(03)00241-0.
[24] Takizawa N, Kodama T, Shiromaru H, Wakabayashi T, Al-Tuairqi S, Wang Q, et al. Efficient polyyne
formation by ns and fs laser-induced breakdown in ethylene and acetylene gas flow. Carbon 2019;152:372–5.
https://doi.org/10.1016/j.carbon.2019.06.013.
[25] Compagnini G, Mita V, Cataliotti RS, D’Urso L, Puglisi O. Short polyyne chains produced by pulsed laser
ablation of graphite in water. Carbon 2007;45:2456–8. https://doi.org/10.1016/j.carbon.2007.07.002.
[26] Matsutani R, Inoue K, Sanada T, Wada N, Kojima K. Preparation of long-chain polyynes of C28H2 and C30H2
by liquid-phase laser ablation. Journal of Photochemistry and Photobiology A: Chemistry 2012;240:1–4.
https://doi.org/10.1016/j.jphotochem.2012.05.004.
[27] Ramadhan A, Wesolowski M, Wakabayashi T, Shiromaru H, Fujino T, Kodama T, et al. Synthesis of hydrogen-
and methyl-capped long-chain polyynes by intense ultrashort laser pulse irradiation of toluene. Carbon
2017;118:680–5. https://doi.org/10.1016/j.carbon.2017.03.096.
[28] Wakabayashi T, Saikawa M, Wada Y, Minematsu T. Isotope scrambling in the formation of cyanopolyynes by
laser ablation of carbon particles in liquid acetonitrile. Carbon 2012;50:47–56.
https://doi.org/10.1016/j.carbon.2011.07.053.
[29] Kanitz A, Kalus M-R, Gurevich EL, Ostendorf A, Barcikowski S, Amans D. Review on experimental and
theoretical investigations of the early stage, femtoseconds to microseconds processes during laser ablation in
liquid-phase for the synthesis of colloidal nanoparticles. Plasma Sources Sci Technol 2019;28:103001.
https://doi.org/10.1088/1361-6595/ab3dbe.
[30] Amendola V, Meneghetti M. What controls the composition and the structure of nanomaterials generated by
laser ablation in liquid solution? Phys Chem Chem Phys 2013;15:3027–46.
https://doi.org/10.1039/C2CP42895D.
[31] Milani A, Tommasini M, Russo V, Li Bassi A, Lucotti A, Cataldo F, et al. Raman spectroscopy as a tool to
investigate the structure and electronic properties of carbon-atom wires. Beilstein J Nanotechnol 2015;6:480–91.
https://doi.org/10.3762/bjnano.6.49.
[32] Taguchi Y, Endo H, Abe Y, Matsumoto J, Wakabayashi T, Kodama T, et al. Polyyne formation by graphite laser
ablation in argon and propane mixed gases. Carbon 2015;94:124–8.
https://doi.org/10.1016/j.carbon.2015.06.058.
[33] Tabata H, Fujii M, Hayashi S, Doi T, Wakabayashi T. Raman and surface-enhanced Raman scattering of a series
of size-separated polyynes. Carbon 2006;44:3168–76. https://doi.org/10.1016/j.carbon.2006.07.004.
[34] Agarwal NR, Lucotti A, Fazzi D, Tommasini M, Castiglioni C, Chalifoux WA, et al. Structure and chain
polarization of long polyynes investigated with infrared and Raman spectroscopy: Investigation of long polyynes
with infrared and Raman spectroscopy. J Raman Spectrosc 2013;44:1398–410. https://doi.org/10.1002/jrs.4300.
[35] Wakabayashi T, Tabata H, Doi T, Nagayama H, Okuda K, Umeda R, et al. Resonance Raman spectra of polyyne
molecules C10H2 and C12H2 in solution. Chemical Physics Letters 2007;433:296–300.
https://doi.org/10.1016/j.cplett.2006.11.077.
[36] Lucotti A, Tommasini M, Fazzi D, Del Zoppo M, Chalifoux WA, Tykwinski RR, et al. Absolute Raman
intensity measurements and determination of the vibrational second hyperpolarizability of adamantyl endcapped
polyynes: Vibrational second hyperpolarizability of polyynes. J Raman Spectrosc 2012;43:1293–8.
https://doi.org/10.1002/jrs.3166.
[37] Heimann RB, Evsyukov SE, Kavan L. Carbyne and Carbynoid Structures. Dordrecht: Springer Netherlands;
1999.
[38] Kūrti J, Magyar C, Balázs A, Rajczy P. Vibrational analysis for short carbon chains with alternating and
cumulenic structure. Synthetic Metals 1995;71:1865–6. https://doi.org/10.1016/0379-6779(94)03082-H.
[39] Casari CS, Russo V, Li Bassi A, Bottani CE, Cataldo F, Lucotti A, et al. Stabilization of linear carbon structures
in a solid Ag nanoparticle assembly. Appl Phys Lett 2007;90:013111. https://doi.org/10.1063/1.2430676.
[40] Okada S, Fujii M, Hayashi S. Immobilization of polyynes adsorbed on Ag nanoparticle aggregates into
poly(vinyl alcohol) films. Carbon 2011;49:4704–9. https://doi.org/10.1016/j.carbon.2011.06.074.
[41] An K, Wei G, Qi G, Sheng L, Yu L, Ren W, et al. Stability improvement of C8H2 and C10H2 embedded in
poly(vinyl alcohol) films with adsorption on gold nanoparticles. Chemical Physics Letters 2015;637:71–6.
https://doi.org/10.1016/j.cplett.2015.07.051.
[42] Peggiani S, Facibeni A, Milani A, Castiglioni C, Russo V, Li Bassi A, et al. In situ synthesis of polyynes in a
polymer matrix via pulsed laser ablation in a liquid. Mater Adv 2020:10.1039.D0MA00545B.
https://doi.org/10.1039/D0MA00545B.
[43] Lucotti A, Casari CS, Tommasini M, Li Bassi A, Fazzi D, Russo V, et al. sp Carbon chain interaction with silver
nanoparticles probed by Surface Enhanced Raman Scattering. Chemical Physics Letters 2009;478:45–50.
https://doi.org/10.1016/j.cplett.2009.06.030.
[44] Fazio E, Patanè S, D’Urso L, Compagnini G, Neri F. Enhanced nonlinear optical response of linear carbon chain
colloid mixed with silver nanoparticles. Optics Communications 2012;285:2942–6.
https://doi.org/10.1016/j.optcom.2012.02.039.
[45] Lucotti A, Tommasini M, Zoppo MD, Castiglioni C, Zerbi G, Cataldo F, et al. Raman and SERS investigation of
isolated sp carbon chains. Chemical Physics Letters 2006;417:78–82.
https://doi.org/10.1016/j.cplett.2005.10.016.
[46] D’Urso L, Grasso G, Messina E, Bongiorno C, Scuderi V, Scalese S, et al. Role of Linear Carbon Chains in the
Aggregation of Copper, Silver, and Gold Nanoparticles. J Phys Chem C 2010;114:907–15.
https://doi.org/10.1021/jp9096309.
[47] Compagnini G, Patanè G, D’Urso L, Puglisi O, Cataliotti RS, Pignataro B. On the Interaction of Carbon
Nanowires with Noble Metals through a Study of Their Surface-Enhanced Raman Spectra. J Phys Chem C
2008;112:20301–6. https://doi.org/10.1021/jp807969c.
[48] Milani A, Lucotti A, Russo V, Tommasini M, Cataldo F, Li Bassi A, et al. Charge Transfer and Vibrational
Structure of sp-Hybridized Carbon Atomic Wires Probed by Surface Enhanced Raman Spectroscopy. J Phys
Chem C 2011;115:12836–43. https://doi.org/10.1021/jp203682c.
[49] Amendola V, Meneghetti M. Laser ablation synthesis in solution and size manipulation of noble metal
nanoparticles. Phys Chem Chem Phys 2009;11:3805. https://doi.org/10.1039/b900654k.
[50] Condorelli M, D’Urso L, Compagnini G, Fazio E, Neri F, Litvinenko VA, et al. The catalytic role of platinum
nanoparticles in laser generated nanocarbons. Applied Surface Science 2021;558:149890.
https://doi.org/10.1016/j.apsusc.2021.149890.
[51] Kim H, Tarakeshwar P, Fujikado NM, Evraets K, Jones AK, Meneghetti M, et al. Pseudocarbynes: Linear
Carbon Chains Stabilized by Metal Clusters. J Phys Chem C 2020;124:19355–61.
https://doi.org/10.1021/acs.jpcc.0c05014.
[52] Compagnini G, Mita V, D’Urso L, Cataliotti RS, Puglisi O. Spectroscopic study of polyynes obtained by laser
ablation in liquids. J Raman Spectrosc 2008;39:177–81. https://doi.org/10.1002/jrs.1837.
[53] Matsutani R, Kakimoto T, Tanaka H, Kojima K. Preparation of polyynes by liquid-phase laser ablation using
different irradiation target materials and solvents. Carbon 2011;49:77–81.
https://doi.org/10.1016/j.carbon.2010.08.044.
[54] Facibeni A, Bottani CE, Dellasega D, Di Fonzo F, Bogana MP. Method of manufacturing natural or synthetic
fibers containing silver nano-particles. EP2274470B1, n.d.
[55] M. J. Frisch, G. W. Trucks, H. B. Schlegel, G. E. Scuseria, M. A. Robb, J. R. Cheeseman, G. Scalmani, V.
Barone, B. Mennucci, G. A. Petersson, H. Nakatsuji, M. Caricato, X. Li, H. P. Hratchian, A. F. Izmaylov, J.
Bloino, G. Zheng, J. L. Sonnenberg, M. Hada, M. Ehara, K. Toyota, R. Fukuda, J. Hasegawa, M. Ishida, T.
Nakajima, Y. Honda, O. Kitao, H. Nakai, T. Vreven, J. A. Montgomery, Jr., J. E. Peralta, F. Ogliaro, M.
Bearpark, J. J. Heyd, E. Brothers, K. N. Kudin, V. N. Staroverov, R. Kobayashi, J. Normand, K. Raghavachari,
A. Rendell, J. C. Burant, S. S. Iyengar, J. Tomasi, M. Cossi, N. Rega, J. M. Millam, M. Klene, J. E. Knox, J. B.
Cross, V. Bakken, C. Adamo, J. Jaramillo, R. Gomperts, R. E. Stratmann, O. Yazyev, A. J. Austin, R. Cammi,
C. Pomelli, J. W. Ochterski, R. L. Martin, K. Morokuma, V. G. Zakrzewski, G. A. Voth, P. Salvador, J. J.
Dannenberg, S. Dapprich, A. D. Daniels, Ö. Farkas, J. B. Foresman, J. V. Ortiz, J. Cioslowski, D. J. Fox.
Gaussian 09. Gaussian, Inc.; 2009.
[56] Paramelle D, Sadovoy A, Gorelik S, Free P, Hobley J, Fernig DG. A rapid method to estimate the concentration
of citrate capped silver nanoparticles from UV-visible light spectra. Analyst 2014;139:4855.
https://doi.org/10.1039/C4AN00978A.
[57] Hanamura K, Fujii M, Wakabayashi T, Hayashi S. Surface-enhanced Raman scattering of size-selected polyynes
(C8H2) adsorbed on silver colloidal nanoparticles. Chemical Physics Letters 2011;503:118–23.
https://doi.org/10.1016/j.cplett.2010.12.078.
[58] Tsuji T, Okazaki Y, Tsuboi Y, Tsuji M. Nanosecond Time-Resolved Observations of Laser Ablation of Silver in
Water. Jpn J Appl Phys 2007;46:1533–5. https://doi.org/10.1143/JJAP.46.1533.
[59] Tsuji T, Thang D-H, Okazaki Y, Nakanishi M, Tsuboi Y, Tsuji M. Preparation of silver nanoparticles by laser
ablation in polyvinylpyrrolidone solutions. Applied Surface Science 2008;254:5224–30.
https://doi.org/10.1016/j.apsusc.2008.02.048.
[60] Amans D, Diouf M, Lam J, Ledoux G, Dujardin C. Origin of the nano-carbon allotropes in pulsed laser ablation
in liquids synthesis. Journal of Colloid and Interface Science 2017;489:114–25.
https://doi.org/10.1016/j.jcis.2016.08.017.
[61] Sakka T, Masai S, Fukami K, Ogata YH. Spectral profile of atomic emission lines and effects of pulse duration
on laser ablation in liquid. Spectrochimica Acta Part B: Atomic Spectroscopy 2009;64:981–5.
https://doi.org/10.1016/j.sab.2009.07.018.
[62] Lam J, Lombard J, Dujardin C, Ledoux G, Merabia S, Amans D. Dynamical study of bubble expansion
following laser ablation in liquids. Appl Phys Lett 2016;108:074104. https://doi.org/10.1063/1.4942389.
[63] Chen X, Xu R-Q, Chen J-P, Shen Z-H, Jian L, Ni X-W. Shock-wave propagation and cavitation bubble
oscillation by Nd:YAG laser ablation of a metal in water. Appl Opt 2004;43:3251.
https://doi.org/10.1364/AO.43.003251.
[64] Gökce B, van’t Zand DD, Menéndez-Manjón A, Barcikowski S. Ripening kinetics of laser-generated plasmonic
nanoparticles in different solvents. Chemical Physics Letters 2015;626:96–101.
https://doi.org/10.1016/j.cplett.2015.03.010.
[65] Sajti CL, Sattari R, Chichkov BN, Barcikowski S. Gram Scale Synthesis of Pure Ceramic Nanoparticles by
Laser Ablation in Liquid. J Phys Chem C 2010;114:2421–7. https://doi.org/10.1021/jp906960g.
[66] Neelakantan P. Raman spectrum of acetonitrile. Proc Indian Acad Sci 1964;60:422–4.
https://doi.org/10.1007/BF03047422.
[67] Li H, Wu Y, Zhang Y, Zhu T, Maruyama T, Liu Y, et al. Submerged carbon arc in deionized water: A green
route for scalable preparation of gas containing polyynes. Chemical Physics 2020;535:110804.
https://doi.org/10.1016/j.chemphys.2020.110804.
[68] D’Urso L, Compagnini G, Puglisi O. sp/sp2 bonding ratio in sp rich amorphous carbon thin films. Carbon
2006;44:2093–6. https://doi.org/10.1016/j.carbon.2006.04.016.
[69] Castiglioni C, Mapelli C, Negri F, Zerbi G. Origin of the D line in the Raman spectrum of graphite: A study
based on Raman frequencies and intensities of polycyclic aromatic hydrocarbon molecules. J Chem Phys
2001;114:963. https://doi.org/10.1063/1.1329670.
[70] Peggiani S, Senis A, Facibeni A, Milani A, Serafini P, Cerrato G, et al. Size-selected polyynes synthesised by
submerged arc discharge in water. Chemical Physics Letters 2020;740:137054.
https://doi.org/10.1016/j.cplett.2019.137054.
[71] Milani A, Barbieri V, Facibeni A, Russo V, Li Bassi A, Lucotti A, et al. Structure modulated charge transfer in
carbon atomic wires. Sci Rep 2019;9:1648. https://doi.org/10.1038/s41598-018-38367-9.
[72] Tsuji M, Tsuji T, Kuboyama S, Yoon S-H, Korai Y, Tsujimoto T, et al. Formation of hydrogen-capped polyynes
by laser ablation of graphite particles suspended in solution. Chemical Physics Letters 2002;355:101–8.
https://doi.org/10.1016/S0009-2614(02)00192-6.
[73] Ariffin H, Nishida H, Shirai Y, Hassan MA. Determination of multiple thermal degradation mechanisms of
poly(3-hydroxybutyrate). Polymer Degradation and Stability 2008;93:1433–9.
https://doi.org/10.1016/j.polymdegradstab.2008.05.020.
[74] Vavilin VA, Fernandez B, Palatsi J, Flotats X. Hydrolysis kinetics in anaerobic degradation of particulate
organic material: An overview. Waste Management 2008;28:939–51.
https://doi.org/10.1016/j.wasman.2007.03.028.
[75] Yin X, Zelenay P. (Invited) <i/> Kinetic Models for the Degradation Mechanisms of PGM-Free ORR Catalysts.
ECS Trans 2018;85:1239–50. https://doi.org/10.1149/08513.1239ecst.
[76] Cataldo F. Storage Stability of Polyynes and Cyanopolyynes in Solution and the Effect of Ammonia or
Hydrochloric Acid. Fullerenes, Nanotubes and Carbon Nanostructures 2007;15:155–66.
https://doi.org/10.1080/15363830601179814.
[77] Milani A, Tommasini M, Zerbi G. Connection among Raman wavenumbers, bond length alternation and energy
gap in polyynes. J Raman Spectrosc 2009;40:1931–4. https://doi.org/10.1002/jrs.2342.

[78] Pigulski B, Gulia N, Szafert S. Reactivity of Polyynes: Complex Molecules from Simple Carbon Rods:
Reactivity of Polyynes: Complex Molecules from Simple Carbon Rods. Eur J Org Chem 2019;2019:1420–45.
https://doi.org/10.1002/ejoc.201801350.
Supporting Information (SI)
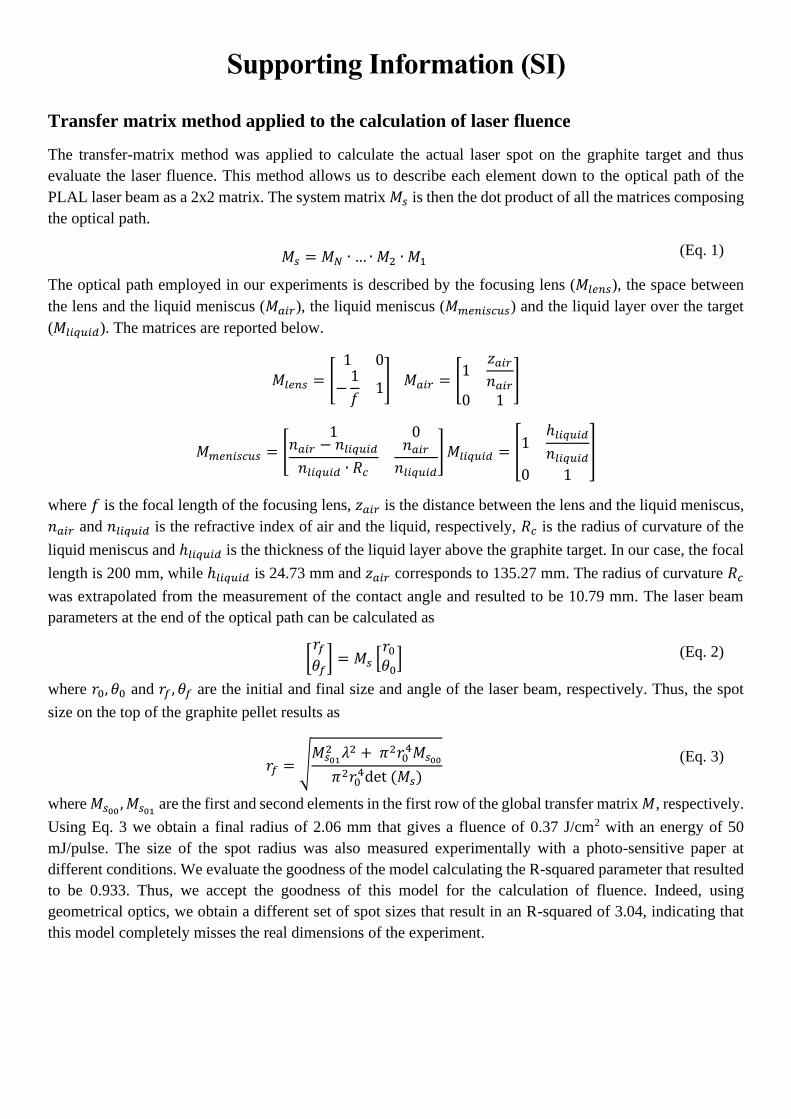
Transfer matrix method applied to the calculation of laser fluence
The transfer-matrix method was applied to calculate the actual laser spot on the graphite target and thus
evaluate the laser fluence. This method allows us to describe each element down to the optical path of the
PLAL laser beam as a 2x2 matrix. The system matrix 𝑀𝑠 is then the dot product of all the matrices composing
the optical path.
𝑀𝑠 = 𝑀𝑁 ∙ … ∙ 𝑀2 ∙ 𝑀1 (Eq. 1)
The optical path employed in our experiments is described by the focusing lens (𝑀𝑙𝑒𝑛𝑠), the space between
the lens and the liquid meniscus (𝑀𝑎𝑖𝑟), the liquid meniscus (𝑀𝑚𝑒𝑛𝑖𝑠𝑐𝑢𝑠) and the liquid layer over the target
(𝑀𝑙𝑖𝑞𝑢𝑖𝑑). The matrices are reported below.
𝑀𝑙𝑒𝑛𝑠 = [
1 0
−1
𝑓1] 𝑀𝑎𝑖𝑟 = [
1𝑧𝑎𝑖𝑟
𝑛𝑎𝑖𝑟
0 1
]
𝑀𝑚𝑒𝑛𝑖𝑠𝑐𝑢𝑠 = [1 0
𝑛𝑎𝑖𝑟 − 𝑛𝑙𝑖𝑞𝑢𝑖𝑑
𝑛𝑙𝑖𝑞𝑢𝑖𝑑 ∙ 𝑅𝑐
𝑛𝑎𝑖𝑟
𝑛𝑙𝑖𝑞𝑢𝑖𝑑
] 𝑀𝑙𝑖𝑞𝑢𝑖𝑑 = [1
ℎ𝑙𝑖𝑞𝑢𝑖𝑑
𝑛𝑙𝑖𝑞𝑢𝑖𝑑
0 1
]
where 𝑓 is the focal length of the focusing lens, 𝑧𝑎𝑖𝑟 is the distance between the lens and the liquid meniscus,
𝑛𝑎𝑖𝑟 and 𝑛𝑙𝑖𝑞𝑢𝑖𝑑 is the refractive index of air and the liquid, respectively, 𝑅𝑐 is the radius of curvature of the
liquid meniscus and ℎ𝑙𝑖𝑞𝑢𝑖𝑑 is the thickness of the liquid layer above the graphite target. In our case, the focal
length is 200 mm, while ℎ𝑙𝑖𝑞𝑢𝑖𝑑 is 24.73 mm and 𝑧𝑎𝑖𝑟 corresponds to 135.27 mm. The radius of curvature 𝑅𝑐
was extrapolated from the measurement of the contact angle and resulted to be 10.79 mm. The laser beam
parameters at the end of the optical path can be calculated as
[𝑟𝑓
𝜃𝑓] = 𝑀𝑠 [
𝑟0
𝜃0] (Eq. 2)
where 𝑟0, 𝜃0 and 𝑟𝑓 , 𝜃𝑓 are the initial and final size and angle of the laser beam, respectively. Thus, the spot
size on the top of the graphite pellet results as
𝑟𝑓 = √𝑀𝑠01
2 𝜆2 + 𝜋2𝑟04𝑀𝑠00
𝜋2𝑟04det (𝑀𝑠)
(Eq. 3)
where 𝑀𝑠00, 𝑀𝑠01
are the first and second elements in the first row of the global transfer matrix 𝑀, respectively.
Using Eq. 3 we obtain a final radius of 2.06 mm that gives a fluence of 0.37 J/cm2 with an energy of 50
mJ/pulse. The size of the spot radius was also measured experimentally with a photo-sensitive paper at
different conditions. We evaluate the goodness of the model calculating the R-squared parameter that resulted
to be 0.933. Thus, we accept the goodness of this model for the calculation of fluence. Indeed, using
geometrical optics, we obtain a different set of spot sizes that result in an R-squared of 3.04, indicating that
this model completely misses the real dimensions of the experiment.
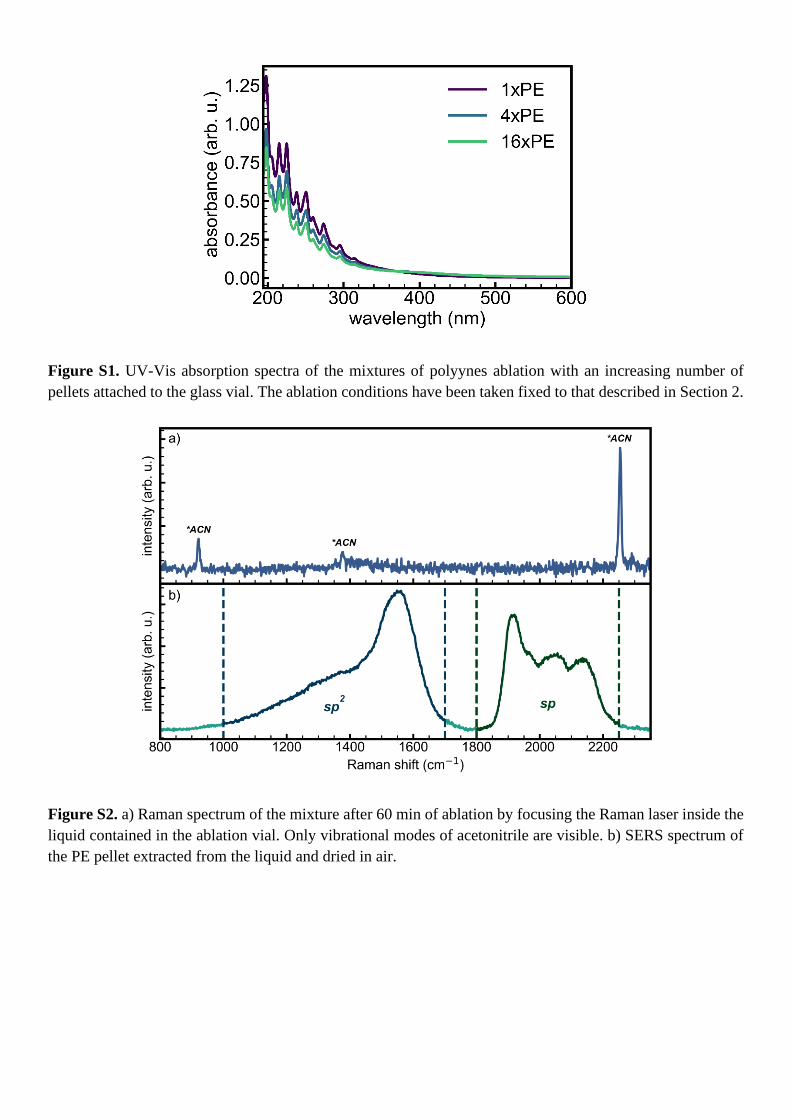
Figure S1. UV-Vis absorption spectra of the mixtures of polyynes ablation with an increasing number of
pellets attached to the glass vial. The ablation conditions have been taken fixed to that described in Section 2.
Figure S2. a) Raman spectrum of the mixture after 60 min of ablation by focusing the Raman laser inside the
liquid contained in the ablation vial. Only vibrational modes of acetonitrile are visible. b) SERS spectrum of
the PE pellet extracted from the liquid and dried in air.
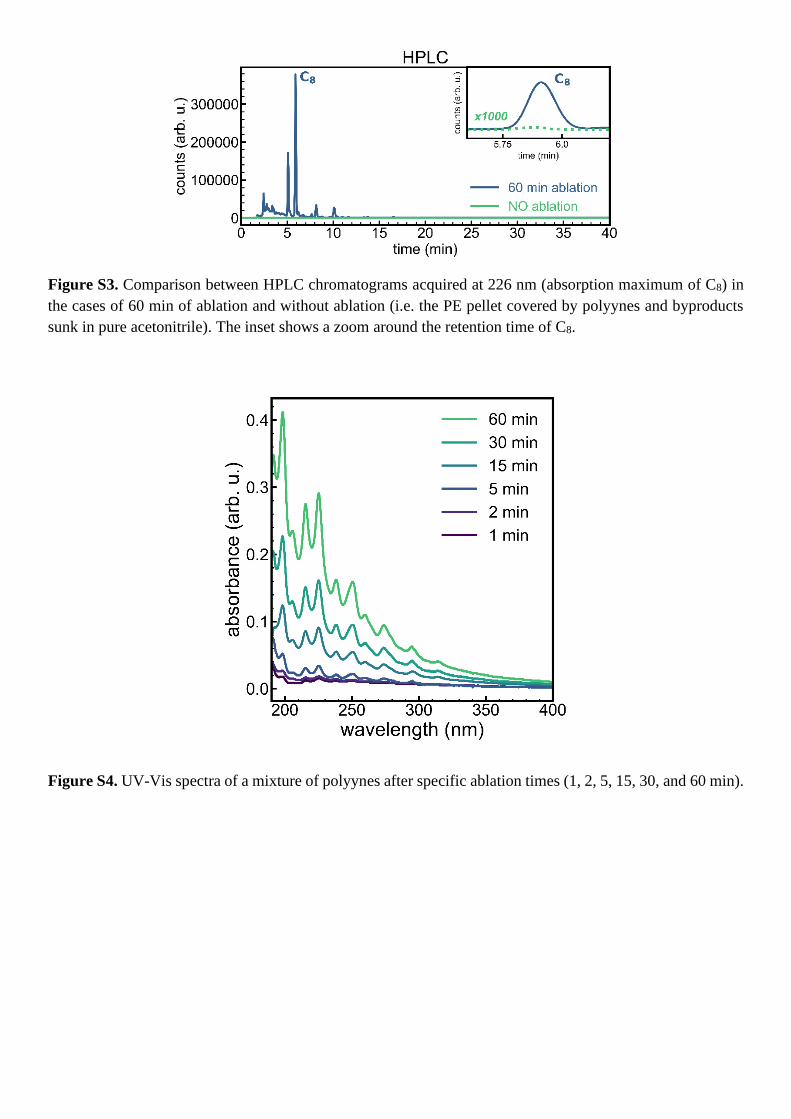
Figure S3. Comparison between HPLC chromatograms acquired at 226 nm (absorption maximum of C8) in
the cases of 60 min of ablation and without ablation (i.e. the PE pellet covered by polyynes and byproducts
sunk in pure acetonitrile). The inset shows a zoom around the retention time of C8.
Figure S4. UV-Vis spectra of a mixture of polyynes after specific ablation times (1, 2, 5, 15, 30, and 60 min).
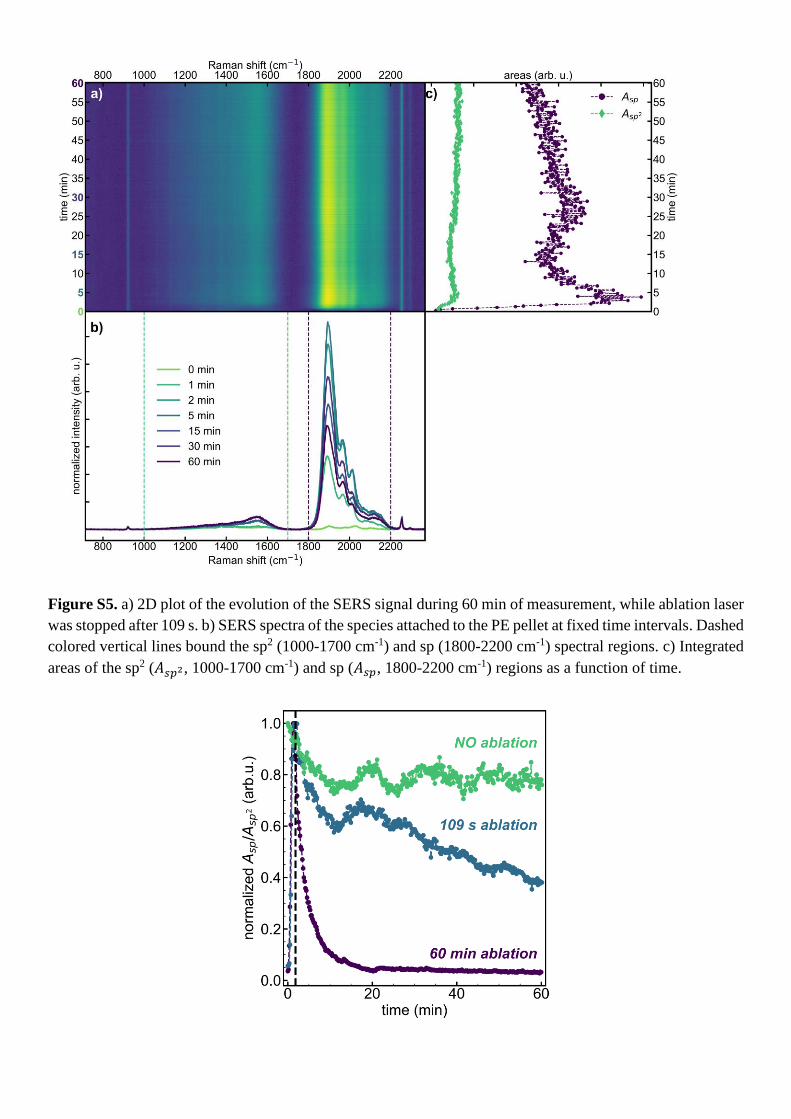
Figure S5. a) 2D plot of the evolution of the SERS signal during 60 min of measurement, while ablation laser
was stopped after 109 s. b) SERS spectra of the species attached to the PE pellet at fixed time intervals. Dashed
colored vertical lines bound the sp2 (1000-1700 cm-1) and sp (1800-2200 cm-1) spectral regions. c) Integrated
areas of the sp2 (𝐴𝑠𝑝2, 1000-1700 cm-1) and sp (𝐴𝑠𝑝, 1800-2200 cm-1) regions as a function of time.
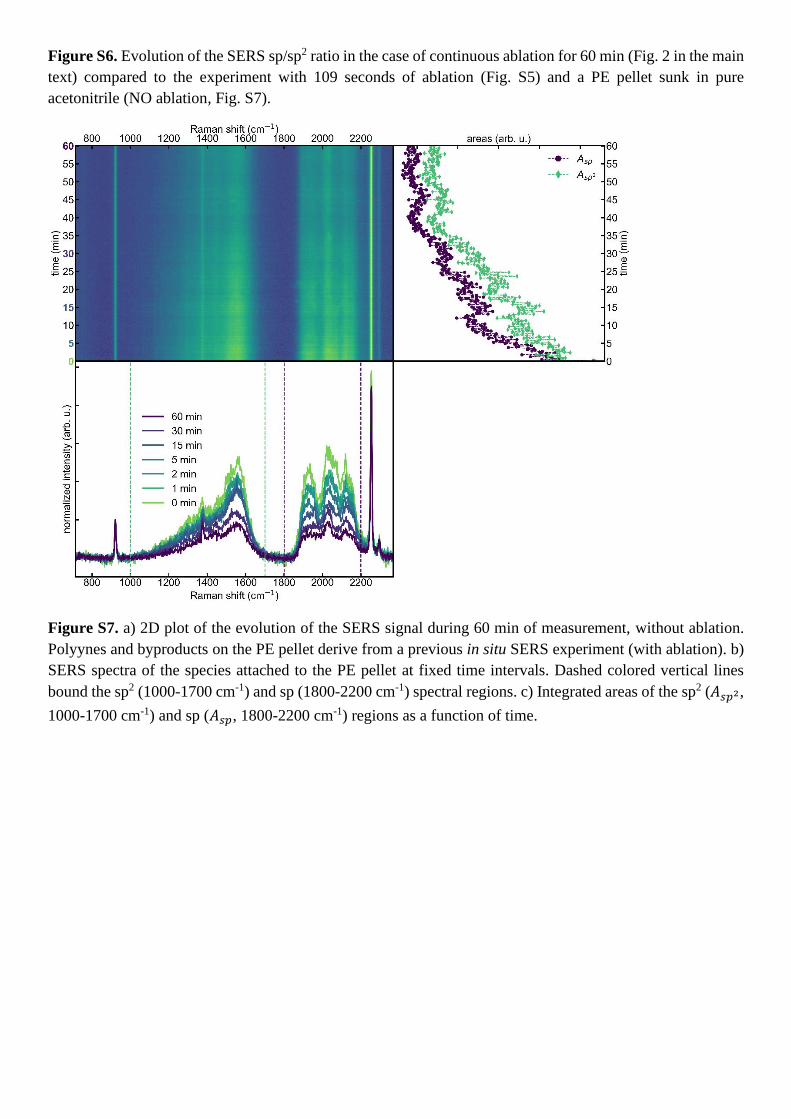
Figure S6. Evolution of the SERS sp/sp2 ratio in the case of continuous ablation for 60 min (Fig. 2 in the main
text) compared to the experiment with 109 seconds of ablation (Fig. S5) and a PE pellet sunk in pure
acetonitrile (NO ablation, Fig. S7).
Figure S7. a) 2D plot of the evolution of the SERS signal during 60 min of measurement, without ablation.
Polyynes and byproducts on the PE pellet derive from a previous in situ SERS experiment (with ablation). b)
SERS spectra of the species attached to the PE pellet at fixed time intervals. Dashed colored vertical lines
bound the sp2 (1000-1700 cm-1) and sp (1800-2200 cm-1) spectral regions. c) Integrated areas of the sp2 (𝐴𝑠𝑝2,
1000-1700 cm-1) and sp (𝐴𝑠𝑝, 1800-2200 cm-1) regions as a function of time.
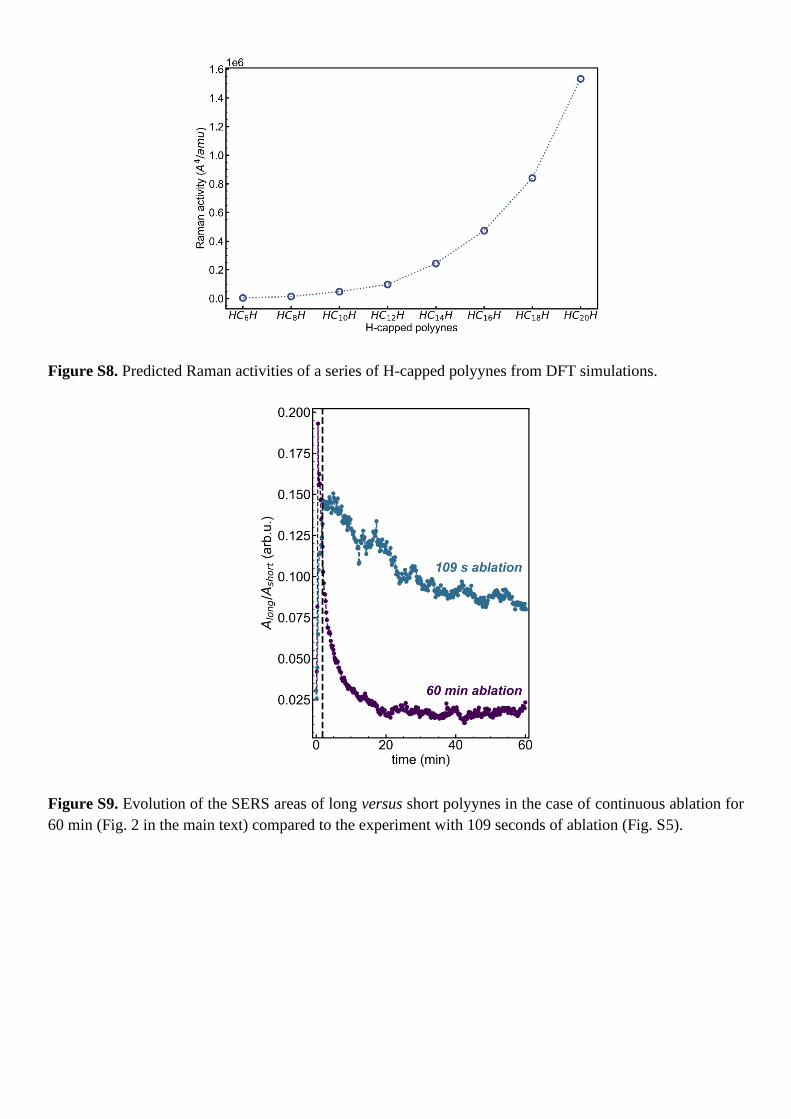
Figure S8. Predicted Raman activities of a series of H-capped polyynes from DFT simulations.
Figure S9. Evolution of the SERS areas of long versus short polyynes in the case of continuous ablation for
60 min (Fig. 2 in the main text) compared to the experiment with 109 seconds of ablation (Fig. S5).