Embed Size (px)
Citation preview
NANO EXPRESS Open Access
In Situ High-Pressure X-ray Diffraction andRaman Spectroscopy Study of Ti3C2TxMXeneLuxi Zhang1, Weitao Su1*, Yanwei Huang1,2*, He Li2, Li Fu1, Kaixin Song3, Xiwei Huang3, Jinhong Yu4
and Cheng-Te Lin4
Abstract
The lattice stability and phonon response of Ti3C2Tx MXene at high pressure are important for understanding itsmechanical and thermal properties fully. Here, we use in situ high hydrostatic pressure X-ray diffraction (XRD) andRaman spectroscopy to study the lattice deformation and phonon behavior of Ti3C2Tx MXene. XRD spectra indicatethat no phase transformation occurs up to the pressure of 26.7 GPa. The elastic constant along a lattice parameterwas calculated to be 378 GPa. In the Raman spectra obtained at high-pressure, the out-of-plane phonon modes(A1g at ~ 210, ~ 504, and ~ 711 cm−1) exhibit monotonic blueshifts with increasing pressure. The Grüneisenparameters of these three modes were calculated to be 1.08, 1.16, and 0.29, respectively. These results enrich thebasic property data of Ti3C2Tx MXene and would benefit the further understanding of this novel material.
Keywords: Ti3C2Tx MXene, High-pressure XRD, High-pressure Raman, Grüneisen parameter
BackgroundAfter the intensive studies of graphene [1] and transi-tion metal dichalcogenides(TMDs) [2–5] for a decade,two-dimensional (2D) metal carbides (MXenes) havebeen drawing much attention recently owing to theirextraordinary electrical properties [6, 7]. The Ti3C2
MXene is a layered material with Van der Waals stackedstructure, in which each layer contains two carbon atomplanes sandwiched among three Ti atom planes. In the en-ergy band structure of Ti3C2 MXene, the conduction bandtouches the valence band at the Γ point, which indicatesthat Ti3C2 MXene is a half-metallic material [8]. Moreinterestingly, the band structure of Ti3C2 Mxene can beopened up slightly by the surface functional groups (whichare annotated as “T” in the formula) [8], such as –F, –O,and –OH [9]. These functional groups are generated inthe solution etching of MnAlCn + 1 phase [9], which thenforms a Ti3C2Tx MXene with tunable electrical properties.The electrical conductivity of Ti3C2Tx MXene was mea-sured to be 4.2 × 10⁻⁴S/m [10], which is superior to most
TMDs. To date, Ti3C2Tx MXenes have shown potentialapplications in advanced supercapacitors [11], Li-batteries[12], electromagnetic shielding [10], antibacterial [13], andlight emission [14].In addition to high electrical conductivity, the elastic
property of Ti3C2Tx MXene also attracts much attention.Theoretical calculations predicted that this ultrathincarbide has a Young’s modulus of as high as ~ 500 GPa[15–17]. Lipatov et al. recently used nanoindentation todetermine that the Young’s modulus of monolayerTi3C2Tx MXene was 330 Gpa [18]. These values are muchhigher than those of MoS2 [18] and are comparable tothose of monolayer graphene [19]. Recently, Ghidiu et al.measured the high-pressure X-ray diffraction (XRD) spec-tra of Ti3C2Tx MXene up to 3 GPa and observed no phasetransformation [20]. However, as the pressure loaded inref. [20] was too low, the phase stability and lattice de-formation of Ti3C2Tx at higher pressure are still unknown.Raman spectroscopy acts as a useful non-destructive
tool to investigate the crystal structure and phononvibration of 2D materials such as graphene [21] andTMDs [2]. The composition of Ti2CTx [22] and phasestability of Ti3C2Tx Mxene at different annealing con-ditions [10] can be probed by using confocal Raman
* Correspondence: [email protected]; [email protected] of Materials and Environmental Engineering, Hangzhou DianziUniversity, Hangzhou 310018, ChinaFull list of author information is available at the end of the article
© The Author(s). 2018 Open Access This article is distributed under the terms of the Creative Commons Attribution 4.0International License (http://creativecommons.org/licenses/by/4.0/), which permits unrestricted use, distribution, andreproduction in any medium, provided you give appropriate credit to the original author(s) and the source, provide a link tothe Creative Commons license, and indicate if changes were made.
Zhang et al. Nanoscale Research Letters (2018) 13:343 https://doi.org/10.1186/s11671-018-2746-4
measurements. Recently, the phonon dispersion ofTi3C2Tx MXene was theoretically calculated by Hu etal. [23, 24], thus enabling a further understanding ofthe Raman spectra of this material. However, thehigh-pressure Raman spectroscopy of Ti3C2Tx is stilllacking. Moreover, the phonon response of Ti3C2Tx asa function of pressure is unknown.In this paper, we prepared Ti3C2Tx thin flakes and
measured their pressure-dependent XRD and Ramanspectra up to 26.7 GPa. The elastic constants ofTi3C2Tx were calculated from XRD diffraction peakshifts by the Murnaghan equation. The positive Grüneisenparameters of out-of-plane phonons were obtained fromtheir pressure-dependent Raman shift and lattice param-eter deformation ratio. The obtained results would benefitthe further understanding of the mechanical and phonon-vibrational behavior of Ti3C2Tx MXene.
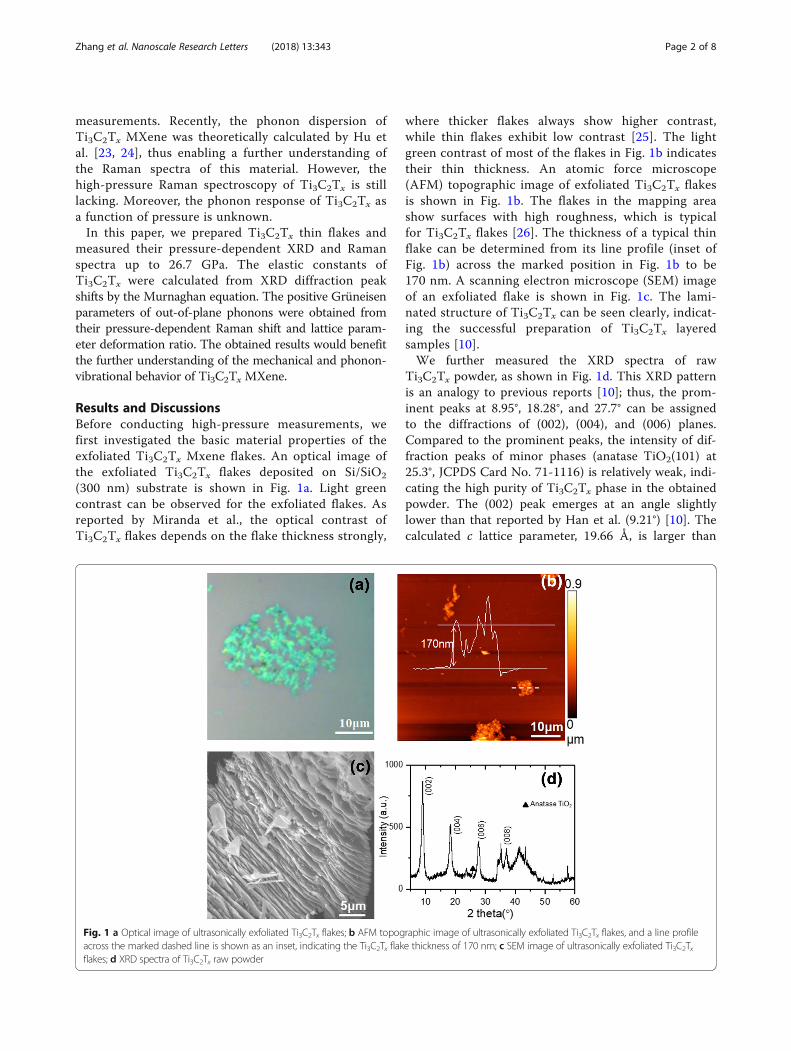
Results and DiscussionsBefore conducting high-pressure measurements, wefirst investigated the basic material properties of theexfoliated Ti3C2Tx Mxene flakes. An optical image ofthe exfoliated Ti3C2Tx flakes deposited on Si/SiO2
(300 nm) substrate is shown in Fig. 1a. Light greencontrast can be observed for the exfoliated flakes. Asreported by Miranda et al., the optical contrast ofTi3C2Tx flakes depends on the flake thickness strongly,
where thicker flakes always show higher contrast,while thin flakes exhibit low contrast [25]. The lightgreen contrast of most of the flakes in Fig. 1b indicatestheir thin thickness. An atomic force microscope(AFM) topographic image of exfoliated Ti3C2Tx flakesis shown in Fig. 1b. The flakes in the mapping areashow surfaces with high roughness, which is typicalfor Ti3C2Tx flakes [26]. The thickness of a typical thinflake can be determined from its line profile (inset ofFig. 1b) across the marked position in Fig. 1b to be170 nm. A scanning electron microscope (SEM) imageof an exfoliated flake is shown in Fig. 1c. The lami-nated structure of Ti3C2Tx can be seen clearly, indicat-ing the successful preparation of Ti3C2Tx layeredsamples [10].We further measured the XRD spectra of raw
Ti3C2Tx powder, as shown in Fig. 1d. This XRD patternis an analogy to previous reports [10]; thus, the prom-inent peaks at 8.95°, 18.28°, and 27.7° can be assignedto the diffractions of (002), (004), and (006) planes.Compared to the prominent peaks, the intensity of dif-fraction peaks of minor phases (anatase TiO2(101) at25.3°, JCPDS Card No. 71-1116) is relatively weak, indi-cating the high purity of Ti3C2Tx phase in the obtainedpowder. The (002) peak emerges at an angle slightlylower than that reported by Han et al. (9.21°) [10]. Thecalculated c lattice parameter, 19.66 Å, is larger than
Fig. 1 a Optical image of ultrasonically exfoliated Ti3C2Tx flakes; b AFM topographic image of ultrasonically exfoliated Ti3C2Tx flakes, and a line profileacross the marked dashed line is shown as an inset, indicating the Ti3C2Tx flake thickness of 170 nm; c SEM image of ultrasonically exfoliated Ti3C2Txflakes; d XRD spectra of Ti3C2Tx raw powder
Zhang et al. Nanoscale Research Letters (2018) 13:343 Page 2 of 8
the reported value (19.2 Å) [10]. It should be noted thatsince the interlayer space may be tuned by different dens-ities of chemical groups and ions, such as –F, –OH, andLi+, the c lattice parameter varies substantially from19.2 Å to 58.8 Å in different studies [10, 20, 26, 27]. The clattice parameter for our sample is very close to the lowvalue that was measured for Ti3C2Tx powder simply usingHF as etchant [10].The XRD spectra of Ti3C2Tx flakes measured at differ-
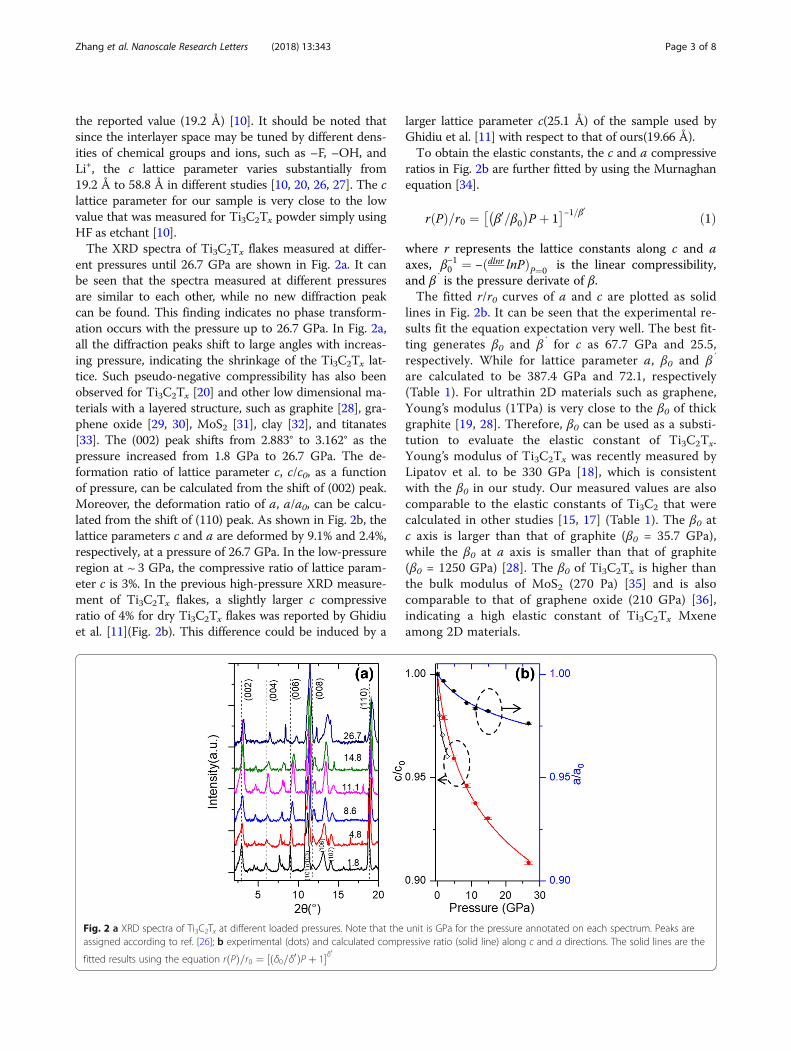
ent pressures until 26.7 GPa are shown in Fig. 2a. It canbe seen that the spectra measured at different pressuresare similar to each other, while no new diffraction peakcan be found. This finding indicates no phase transform-ation occurs with the pressure up to 26.7 GPa. In Fig. 2a,all the diffraction peaks shift to large angles with increas-ing pressure, indicating the shrinkage of the Ti3C2Tx lat-tice. Such pseudo-negative compressibility has also beenobserved for Ti3C2Tx [20] and other low dimensional ma-terials with a layered structure, such as graphite [28], gra-phene oxide [29, 30], MoS2 [31], clay [32], and titanates[33]. The (002) peak shifts from 2.883° to 3.162° as thepressure increased from 1.8 GPa to 26.7 GPa. The de-formation ratio of lattice parameter c, c/c0, as a functionof pressure, can be calculated from the shift of (002) peak.Moreover, the deformation ratio of a, a/a0, can be calcu-lated from the shift of (110) peak. As shown in Fig. 2b, thelattice parameters c and a are deformed by 9.1% and 2.4%,respectively, at a pressure of 26.7 GPa. In the low-pressureregion at ~ 3 GPa, the compressive ratio of lattice param-eter c is 3%. In the previous high-pressure XRD measure-ment of Ti3C2Tx flakes, a slightly larger c compressiveratio of 4% for dry Ti3C2Tx flakes was reported by Ghidiuet al. [11](Fig. 2b). This difference could be induced by a
larger lattice parameter c(25.1 Å) of the sample used byGhidiu et al. [11] with respect to that of ours(19.66 Å).To obtain the elastic constants, the c and a compressive
ratios in Fig. 2b are further fitted by using the Murnaghanequation [34].
r Pð Þ=r0 ¼ β0=β0� �
P þ 1� �−1=β0 ð1Þ
where r represents the lattice constants along c and aaxes, β−10 ¼ −ðdlnr lnPÞP¼0 is the linear compressibility,and β′ is the pressure derivate of β.The fitted r/r0 curves of a and c are plotted as solid
lines in Fig. 2b. It can be seen that the experimental re-sults fit the equation expectation very well. The best fit-ting generates β0 and β′ for c as 67.7 GPa and 25.5,respectively. While for lattice parameter a, β0 and β′
are calculated to be 387.4 GPa and 72.1, respectively(Table 1). For ultrathin 2D materials such as graphene,Young’s modulus (1TPa) is very close to the β0 of thickgraphite [19, 28]. Therefore, β0 can be used as a substi-tution to evaluate the elastic constant of Ti3C2Tx.Young’s modulus of Ti3C2Tx was recently measured byLipatov et al. to be 330 GPa [18], which is consistentwith the β0 in our study. Our measured values are alsocomparable to the elastic constants of Ti3C2 that werecalculated in other studies [15, 17] (Table 1). The β0 atc axis is larger than that of graphite (β0 = 35.7 GPa),while the β0 at a axis is smaller than that of graphite(β0 = 1250 GPa) [28]. The β0 of Ti3C2Tx is higher thanthe bulk modulus of MoS2 (270 Pa) [35] and is alsocomparable to that of graphene oxide (210 GPa) [36],indicating a high elastic constant of Ti3C2Tx Mxeneamong 2D materials.
Fig. 2 a XRD spectra of Ti3C2Tx at different loaded pressures. Note that the unit is GPa for the pressure annotated on each spectrum. Peaks areassigned according to ref. [26]; b experimental (dots) and calculated compressive ratio (solid line) along c and a directions. The solid lines are the
fitted results using the equation rðPÞ=r0 ¼ ½ðδ0=δ0ÞP þ 1�δ0
Zhang et al. Nanoscale Research Letters (2018) 13:343 Page 3 of 8
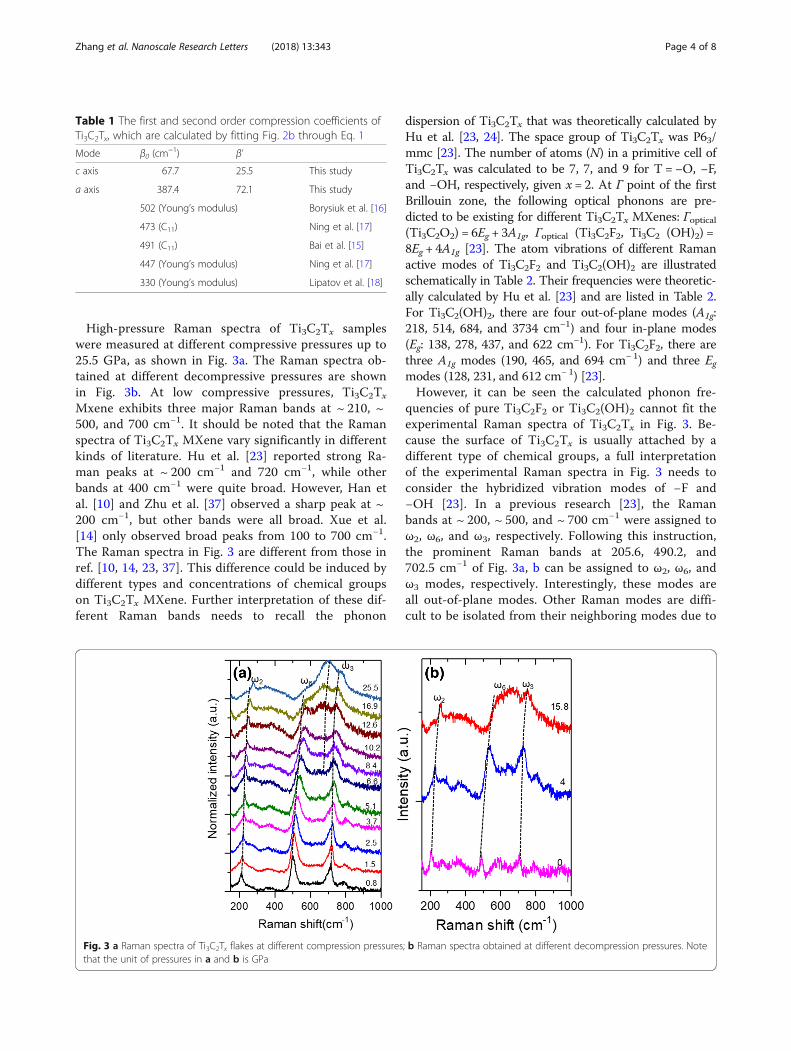
High-pressure Raman spectra of Ti3C2Tx sampleswere measured at different compressive pressures up to25.5 GPa, as shown in Fig. 3a. The Raman spectra ob-tained at different decompressive pressures are shownin Fig. 3b. At low compressive pressures, Ti3C2Tx
Mxene exhibits three major Raman bands at ~ 210, ~500, and 700 cm−1. It should be noted that the Ramanspectra of Ti3C2Tx MXene vary significantly in differentkinds of literature. Hu et al. [23] reported strong Ra-man peaks at ~ 200 cm−1 and 720 cm−1, while otherbands at 400 cm−1 were quite broad. However, Han etal. [10] and Zhu et al. [37] observed a sharp peak at ~200 cm−1, but other bands were all broad. Xue et al.[14] only observed broad peaks from 100 to 700 cm−1.The Raman spectra in Fig. 3 are different from those inref. [10, 14, 23, 37]. This difference could be induced bydifferent types and concentrations of chemical groupson Ti3C2Tx MXene. Further interpretation of these dif-ferent Raman bands needs to recall the phonon
dispersion of Ti3C2Tx that was theoretically calculated byHu et al. [23, 24]. The space group of Ti3C2Tx was P63/mmc [23]. The number of atoms (N) in a primitive cell ofTi3C2Tx was calculated to be 7, 7, and 9 for T = −O, −F,and −OH, respectively, given x = 2. At Γ point of the firstBrillouin zone, the following optical phonons are pre-dicted to be existing for different Ti3C2Tx MXenes: Γoptical(Ti3C2O2) = 6Eg + 3A1g, Γoptical (Ti3C2F2, Ti3C2 (OH)2) =8Eg + 4A1g [23]. The atom vibrations of different Ramanactive modes of Ti3C2F2 and Ti3C2(OH)2 are illustratedschematically in Table 2. Their frequencies were theoretic-ally calculated by Hu et al. [23] and are listed in Table 2.For Ti3C2(OH)2, there are four out-of-plane modes (A1g:218, 514, 684, and 3734 cm−1) and four in-plane modes(Eg: 138, 278, 437, and 622 cm−1). For Ti3C2F2, there arethree A1g modes (190, 465, and 694 cm− 1) and three Egmodes (128, 231, and 612 cm− 1) [23].However, it can be seen the calculated phonon fre-
quencies of pure Ti3C2F2 or Ti3C2(OH)2 cannot fit theexperimental Raman spectra of Ti3C2Tx in Fig. 3. Be-cause the surface of Ti3C2Tx is usually attached by adifferent type of chemical groups, a full interpretationof the experimental Raman spectra in Fig. 3 needs toconsider the hybridized vibration modes of −F and−OH [23]. In a previous research [23], the Ramanbands at ~ 200, ~ 500, and ~ 700 cm−1 were assigned toω2, ω6, and ω3, respectively. Following this instruction,the prominent Raman bands at 205.6, 490.2, and702.5 cm−1 of Fig. 3a, b can be assigned to ω2, ω6, andω3 modes, respectively. Interestingly, these modes areall out-of-plane modes. Other Raman modes are diffi-cult to be isolated from their neighboring modes due to
Table 1 The first and second order compression coefficients ofTi3C2Tx, which are calculated by fitting Fig. 2b through Eq. 1
Mode β0 (cm−1) β’
c axis 67.7 25.5 This study
a axis 387.4 72.1 This study
502 (Young’s modulus) Borysiuk et al. [16]
473 (C11) Ning et al. [17]
491 (C11) Bai et al. [15]
447 (Young’s modulus) Ning et al. [17]
330 (Young’s modulus) Lipatov et al. [18]
Fig. 3 a Raman spectra of Ti3C2Tx flakes at different compression pressures; b Raman spectra obtained at different decompression pressures. Notethat the unit of pressures in a and b is GPa
Zhang et al. Nanoscale Research Letters (2018) 13:343 Page 4 of 8
their low intensities. To obtain robust data by eliminat-ing the uncertainties, only these three modes areconsidered in the following calculations and analyses.In Fig. 3a, b, it can also be seen that the relative inten-
sities of these in-plane modes increase with the increasingcompressive pressures (Fig. 3a). When the compressivepressure is ≥ 12.6 GPa, a new peak at ~ 600 cm−1 (ω4)emerges and becomes the prominent peak. In the decom-pression process, the intensities of this ω4 mode decreasesignificantly. The Raman spectra obtained at 0 GPa of de-compression pressure contain almost all the in-plane andout-of-plane phonon modes. Such emergence of in-plane
modes at high compressive pressure might be related withflake fracture or orientation rotation-induced polarization.Research about this effect is still ongoing and will be re-ported in the future.With increasing pressure from 0.8 GPa to 25.6 GPa, ω2,
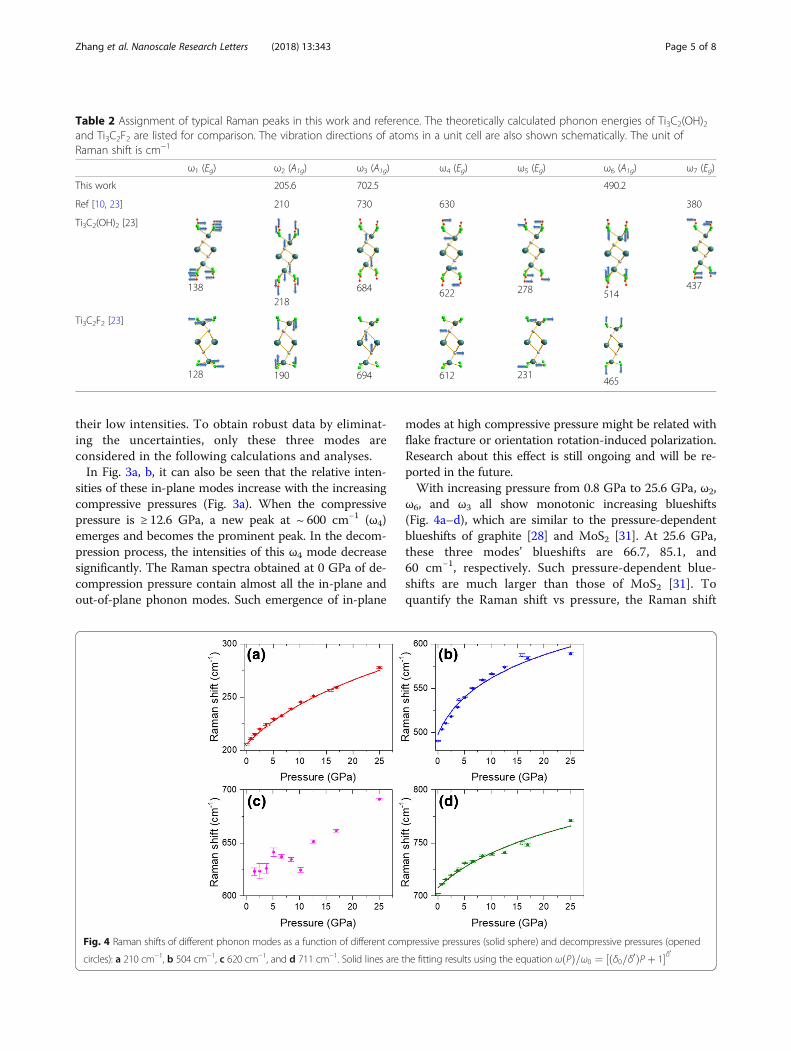
ω6, and ω3 all show monotonic increasing blueshifts(Fig. 4a–d), which are similar to the pressure-dependentblueshifts of graphite [28] and MoS2 [31]. At 25.6 GPa,these three modes’ blueshifts are 66.7, 85.1, and60 cm−1, respectively. Such pressure-dependent blue-shifts are much larger than those of MoS2 [31]. Toquantify the Raman shift vs pressure, the Raman shift
Table 2 Assignment of typical Raman peaks in this work and reference. The theoretically calculated phonon energies of Ti3C2(OH)2and Ti3C2F2 are listed for comparison. The vibration directions of atoms in a unit cell are also shown schematically. The unit ofRaman shift is cm−1
ω1 (Eg) ω2 (A1g) ω3 (A1g) ω4 (Eg) ω5 (Eg) ω6 (A1g) ω7 (Eg)
This work 205.6 702.5 490.2
Ref [10, 23] 210 730 630 380
Ti3C2(OH)2 [23]
138218
684 622 278 514437
Ti3C2F2 [23]
128 190 694 612 231465
Fig. 4 Raman shifts of different phonon modes as a function of different compressive pressures (solid sphere) and decompressive pressures (opened
circles): a 210 cm−1, b 504 cm−1, c 620 cm−1, and d 711 cm−1. Solid lines are the fitting results using the equation ωðPÞ=ω0 ¼ ½ðδ0=δ0ÞP þ 1�δ0
Zhang et al. Nanoscale Research Letters (2018) 13:343 Page 5 of 8
plots in Fig. 4a, b, d were fitted using the followingequation [28]:
ω Pð Þ=ω0 ¼ δ0=δ0ð ÞP þ 1½ �δ0 ð2Þ
where δ0 and δ′ are the logarithmic pressure derivati-ve(dlnω/dP)P = 0 and the pressure derivative of dlnω/dP,respectively. The fitted results are plotted as solid linesin Fig. 4a, b, d. Due to the high uncertainties at thelow-pressure region, the Raman mode at 620 cm−1 wasnot fitted. It can be seen in Fig. 4a, b, d that the fittedcurves are consistent with the experimental results, indi-cating the high accuracy of the fitting process. Theobtained parameters of δ0 and δ′ are listed in Table 3.For anisotropic 2D materials with an atomic thickness,
such as MXene and graphene, two independent compo-nents of the Grüneisen tensors are usually associated withthe strains that are parallel and perpendicular to the c axis.For simplicity, we adopted the scaling relationship pro-posed by Zallen et al. [38], which has been used to fit thepressure-dependent Raman shift of graphite by Hanflandet al. [28]
ω Pð Þ=ω0 ¼ r Pð Þ=r0½ �3γ ð3Þwhere r refers to the in-plane and out-of-plane latticeconstants for intralayer and interlayer modes, respect-ively. γ is equivalent to the Grüneisen parameter thatwas defined in other studies [39, 40].As only the out-of-plane modes are observed in the
compression process, c lattice parameter as a functionof hydrostatic pressure is adequate for calculation. Weadopted the (002) plane’s space distance data of 0 to26.7 GPa in Fig. 2b for the calculation of Grüneisenparameter γ. The averaged γ up to 26.7 GPa for ω2,ω6, and ω3 were calculated to be 1.08, 1.16, and 0.29,respectively (Table 2). Similar to the graphite, thesmaller γ of ω3 compared with the other two modesindicates a smaller change in force constants is in-volved in the rigid-layer motion [28]. To the best ofour knowledge, the Grüneisen parameters of Ti3C2Tx
have not been reported yet. However, we can stillcompare our data with other 2D materials. Zha et al.reported Grüneisen parameters as 4–5 for acousticphonon modes of Ti2CO2 [41]. Because the Grüneisen
parameters of high-frequency optical modes are usu-ally one or two orders lower than those of thelow-frequency modes [28], the Grüneisen parametersfor optical phonons of Ti2CO2 can be estimated to be0.05–0.5, which are similar to those of our values forTi3C2Tx. Recently, Peng et al. [42] reported the Grü-neisen parameters at room temperature as 1.22, 1.20,and 1.15 for MoS2, MoSe2, and WS2, respectively,which are larger than our results. Our results are alsosmaller than those of graphene (1.99 for E2g mode)[40] and graphite (1.06 for E2g mode) [28]. This find-ing indicates that Ti3C2Tx MXene has the weakestbonding anharmonicity among these ultrathin 2Dmaterials [42].
ConclusionsIn conclusion, we measured lattice deformation andphonon response of Ti3C2Tx thin flakes at differenthydrostatic pressures up to 26.7 GPa. No phase trans-formation has been observed below a pressure of26.7 GPa. All the phonon modes show a positive fre-quency shift with increasing pressures. The positiveGrüneisen parameters of three out-of-plane phononsare calculated to be 1.08, 1.16, and 0.29. Our results in-crease understanding of the mechanical and thermalproperties of Ti3C2Tx at high pressures.
MethodsTi3C2Tx powder was prepared by a method reportedby reference [43]. Briefly, Ti3AlC2 powder (Forsman,10 g) was etched by HF solution (160 ml) at roomtemperature for 5 h. The obtained Ti3C2Tx powderwas dispersed into DI water and ultrasonically exfoli-ated at a power of 700 W. The resulted solution wasseparated after being stored by 24 h. The obtainedupper layer solution was used for further Raman,atomic force microscope (AFM), and scanning elec-tron microscope (SEM) analyses. X-ray diffraction(XRD) spectra at ambient pressure were measuredusing an X-ray diffractometer (Rigaku, MiniFlex600).SEM images were obtained using a scanning electronmicroscope (Hitachi, Su1510). In situ high-pressureXRD measurements were performed at the ShanghaiSynchrotron Radiation Facility by a gasket high-pressurediamond anvil cell (DAC) at room temperature. To pro-duce a hydrostatic environment around the sample, weused methanol/ethanol/water (16:3:1) as a pressuretransmitting medium. The pressure was determinedby the pressure-dependent spectral shift of the sharpruby fluorescence R1 line. The sample was placed in astainless steel gasket hole (100 μm in diameter) with adiamond culet (400 μm in diameter). High-pressureRaman scattering measurements were performedusing a Renishaw inVia Raman spectrometer with an
Table 3 Calculated pressure-dependent parameters of Ti3C2Tx. γrefers to the averaged Grüneisen parameters that werecalculated using equation γ = − dlnω/(3dlnr)Mode ω0 (cm
−1) δ0 (GPa−1) δ’ γ
ω2 210 0.025 0.21 1.08
ω6 504 0.028 0.079 1.16
ω3 711 0.0069 0.056 0.29
Zhang et al. Nanoscale Research Letters (2018) 13:343 Page 6 of 8
excitation wavelength of 532 nm. The topographicalmeasurements were conducted on an AFM instrument(Bruker, Innova).The fitting of diffraction peak positions and Raman
peak shifts was conducted on OriginPro package. Auser-defined function, y = (A1 × x + 1)A2, was used bysetting A1 and A2 as the fitting parameters. Properfitting can be obtained easily by a simplex method.
Abbreviations2D: Two dimensional; AFM: Atomic force microscope; DAC: Diamond anvilcell; SEM: Scanning electron microscope; TMDs: Transition metal dichalcogenides;XRD: X-ray diffraction
FundingThis work is financially supported by the Natural Science Foundation of ZhejiangProvince (Grant No. LY18F040006) and the National Natural Science Foundation ofChina (Grant Nos. 61504034, 61306115, 61775201, and 11404309).
Availability of Data and MaterialsWe declare that the materials used in this manuscript, including all relevantraw data, will be freely available to any scientist wishing to use for non-commercial purposes, without breaching participant confidentiality.
Authors’ ContributionsThis work is carried out by the collaboration between all the authors. LZ, WS,and LF synthesized the Ti3C2Tx ultrathin flakes and conducted the samplecharacterization and the data analysis. YH conducted the high-pressureRaman and XRD measurements. KS and XH conducted the XRD data analysis.JY and CL prepared the raw Ti3C2Tx samples. All authors read and approvedthe final manuscript.
Competing InterestsThe authors declare that they have no competing interests.
Publisher’s NoteSpringer Nature remains neutral with regard to jurisdictional claims in publishedmaps and institutional affiliations.
Author details1College of Materials and Environmental Engineering, Hangzhou DianziUniversity, Hangzhou 310018, China. 2Center for High Pressure Science andTechnology Advanced Research, Shanghai 201203, China. 3College ofelectronics and information, Hangzhou Dianzi University, Hangzhou 310018,China. 4Key Laboratory of Marine Materials and Related Technologies,Zhejiang Key Laboratory of Marine Materials and Protective Technologies,Ningbo Institute of Materials Technology and Engineering, Chinese Academyof Sciences, Ningbo 315201, China.
Received: 5 June 2018 Accepted: 10 October 2018
References1. Novoselov KS, Geim AK, Morozov SV, Jiang D, Zhang Y, Dubonos SV,
Grigorieva IV, Firsov AA (2004) Electric field effect in atomically thin carbonfilms. Science 306(5696):666–669
2. Kin Fai M, Changgu L, Hone J, Jie S, Heinz TF (2010) Atomically thin MoS2: anew direct-gap semiconductor. Phys Rev Lett 105(13):136805
3. Splendiani A, Sun L, Zhang Y, Li T, Kim J, Chim C-Y, Galli G, Wang F (2010)Emerging photoluminescence in monolayer MoS2. Nano Lett 10(4):1271–1275
4. Su W, Li Y, Chen L, Huo D, Song K, Huang X, Shu H (2018)Nonstoichiometry induced broadband tunable photoluminescence ofmonolayer WSe2. Chem Commun 54(7):743–746
5. Su W, Kumar N, Mignuzzi S, Crain J, Roy D (2016) Nanoscale mapping ofexcitonic processes in single-layer MoS2 using tip-enhancedphotoluminescence microscopy. Nanoscale 8(20):10564–10569
6. Naguib M, Come J, Dyatkin B, Presser V, Taberna P-L, Simon P, BarsoumMW, Gogotsi Y (2012) MXene: a promising transition metal carbide anodefor lithium-ion batteries. Electrochem Commun 16(1):61–64
7. Come J, Naguib M, Rozier P, Barsoum MW, Gogotsi Y, Taberna PL, MorcretteM, Simon P (2012) A non-aqueous asymmetric cell with a Ti2C-based two-dimensional negative electrode. J Electrochem Soc 159(8):A1368–A1373
8. Tang Q, Zhou Z, Shen P (2012) Are MXenes promising anode materials forLi ion batteries? Computational studies on electronic properties and Listorage capability of Ti3C2 and Ti3C2X2 (X = F, OH) monolayer. J Am ChemSoc 134(40):16909–16916
9. Naguib M, Mashtalir O, Carle J, Presser V, Lu J, Hultman L, Gogotsi Y,Barsoum MW (2012) Two-dimensional transition metal carbides. ACS Nano6(2):1322–1331
10. Han M, Yin X, Wu H, Hou Z, Song C, Li X, Zhang L, Cheng L (2016) Ti3C2 MXeneswith modified surface for high-performance electromagnetic absorption andshielding in the X-band. ACS Appl Mater Inter 8(32):21011–21019
11. Ghidiu M, Lukatskaya MR, Zhao M-Q, Gogotsi Y, Barsoum MW (2014)Conductive two-dimensional titanium carbide ‘clay’ with high volumetriccapacitance. Nature 516(7529):78–U171
12. Mashtalir O, Naguib M, Mochalin VN, Dall'Agnese Y, Heon M, Barsoum MW,Gogotsi Y (2013) Intercalation and delamination of layered carbides andcarbonitrides. Nat Commun 4:1716
13. Rasool K, Helal M, Ali A, Ren CE, Gogotsi Y, Mahmoud KA (2016)Antibacterial activity of Ti3C2Tx MXene. ACS Nano 10(3):3674–3684
14. Xue Q, Zhang H, Zhu M, Pei Z, Li H, Wang Z, Huang Y, Huang Y, Deng Q,Zhou J, Du S, Huang Q, Zhi C (2017) Photoluminescent Ti3C2 MXenequantum dots for multicolor cellular imaging. Adv Mater 29(15):1604847
15. Bai Y, Zhou K, Srikanth N, Pang JHL, He X, Wang R (2016) Dependence ofelastic and optical properties on surface terminated groups in two-dimensional MXene monolayers: a first-principles study. RSC Adv 6(42):35731–35739
16. Borysiuk VN, Mochalin VN, Gogotsi Y (2015) Molecular dynamic study of themechanical properties of two-dimensional titanium carbides Tin+1Cn(MXenes). Nanotechnology 26(26):265705
17. Ning Z, Yu H, Sanaz Y, Mohsen Asle Z (2018) Superior structural, elastic andelectronic properties of 2D titanium nitride MXenes over carbide MXenes: acomprehensive first principles study. 2D Mater 5(4):045004
18. Lipatov A, Lu H, Alhabeb M, Anasori B, Gruverman A, Gogotsi Y, Sinitskii A(2018) Elastic properties of 2D Ti3C2Tx MXene monolayers and bilayers. SciAdv 4(6):eaat0491
19. Lee C, Wei X, Kysar JW, Hone J (2008) Measurement of the elastic propertiesand intrinsic strength of monolayer graphene. Science 321:385–388
20. Ghidiu M, Kota S, Drozd V, Barsoum MW (2018) Pressure-induced shear andinterlayer expansion in Ti3C2 MXene in the presence of water. Sci Adv 4(1):eaao6850
21. Ferrari AC, Meyer JC, Scardaci V, Casiraghi C, Lazzeri M, Mauri F, Piscanec S,Jiang D, Novoselov KS, Roth S, Geim AK (2006) Raman spectrum ofgraphene and graphene layers. Phys Rev Lett 97(18):187401
22. Lai S, Jeon J, Jang SK, Xu J, Choi YJ, Park J-H, Hwang E, Lee S (2015) Surfacegroup modification and carrier transport properties of layered transitionmetal carbides (Ti2CTx, T: -OH, -F and -O). Nanoscale 7(46):19390–19396
23. Hu T, Wang J, Zhang H, Li Z, Hu M, Wang X (2015) Vibrational properties ofTi3C2 and Ti3C2T2 (T = O, F, OH) monosheets by first-principles calculations:a comparative study. Phys Chem Chem Phys 17(15):9997–10003
24. Hu T, Hu M, Li Z, Zhang H, Zhang C, Wang J, Wang X (2015) Covalency-dependent vibrational dynamics in two-dimensional titanium carbides. JPhys Chem A 119(52):12977–12984
25. Miranda A, Halim J, Lorke A, Barsoum MW (2017) Rendering Ti3C2Tx (MXene)monolayers visible. Mater Res Lett 5(5):322–328
26. Hantanasirisakul K, Zhao M-Q, Urbankowski P, Halim J, Anasori B, Kota S,Ren CE, Barsoum MW, Gogotsi Y (2016) Fabrication of Ti3C2Tx MXenetransparent thin films with tunable optoelectronic properties. AdvElectron Mater 2(6):1600050
27. Ghidiu M, Halim J, Kota S, Bish D, Gogotsi Y, Barsourm MW (2016) Ion-exchange and cation solvation reactions in Ti3C2 MXene. Chem Mater28(10):3507–3514
28. Hanfland M, Beister H, Syassen K (1989) Graphite under pressure: equationof state and first-order Raman modes. Phys Rev B 39:12598
29. Talyzin AV, Solozhenko VL, Kurakevych OO, Szabo T, Dekany I, Kurnosov A,Dmitriev V (2008) Colossal pressure-induced lattice expansion of graphiteoxide in the presence of water. Angew Chem Int Edit 47(43):8268–8271
Zhang et al. Nanoscale Research Letters (2018) 13:343 Page 7 of 8
30. Talyzin AV, Sundqvist B, Szabo T, Dekany I, Dmitriev V (2009) Pressure-induced insertion of liquid alcohols into graphite oxide structure. J AmChem Soc 131(51):18445–18449
31. Chi Z-H, Zhao X-M, Zhang H, Goncharov AF, Lobanov SS, Kagayama T,Sakata M, Chen X-J (2014) Pressure-induced metallization of molybdenumdisulfide. Phys Rev Lett 113(3):036802
32. You S, Kunz D, Stoeter M, Kalo H, Putz B, Breu J, Talyzin AV (2013)Pressure-induced water insertion in synthetic clays. Angew Chem IntEdit 52(14):3891–3895
33. Nakano S, Sasaki T, Takemura K, Watanabe M (1998) Pressure-inducedintercalation of alcohol molecules into a layered titanate. Chem Mater10(8):2044–2046
34. Murnaghan FD (1944) The compressibility of media under extremepressures. Proc Natl Acad Sci 30(9):244
35. Bertolazzi S, Brivio J, Kis A (2011) Stretching and breaking of ultrathin MoS2.ACS Nano 5(12):9703–9709
36. Suk JW, Piner RD, An J, Ruoff RS (2010) Mechanical properties of mono layergraphene oxide. ACS Nano 4(11):6557–6564
37. Zhu J, Tang Y, Yang C, Wang F, Cao M (2016) Composites of TiO2
nanoparticles deposited on Ti3C2 MXene nanosheets with enhancedelectrochemical performance. J Electrochem Soc 163(5):A785–A791
38. Zallen R (1974) Pressure-Raman effects and vibrational scaling laws inmolecular crystals: S8 and As2S3. Phys Rev B 9:4485
39. Mohiuddin TMG, Lombardo A, Nair RR, Bonetti A, Savini G, Jalil R, Bonini N,Basko DM, Galiotis C, Marzari N, Novoselov KS, Geim AK, Ferrari AC (2009)Uniaxial strain in graphene by Raman spectroscopy: G peak splitting,Gruneisen parameters, and sample orientation. Phys Rev B 79(20):205433
40. Proctor JE, Gregoryanz E, Novoselov KS, Lotya M, Coleman JN, Halsall MP (2009)High-pressure Raman spectroscopy of graphene. Phys Rev B 80(7):073408
41. Zha X-H, Huang Q, He J, He H, Zhai J, Francisco JS, Du S (2016) The thermaland electrical properties of the promising semiconductor MXene Hf2CO2.Sci Rep 6:27971
42. Peng B, Zhang H, Shao H, Xu Y, Zhang X, Zhu H (2016) Thermalconductivity of monolayer MoS2, MoSe2, and WS2: interplay of mass effect,interatomic bonding and anharmonicity. RSC Adv 6(7):5767–5773
43. Naguib M, Kurtoglu M, Presser V, Lu J, Niu J, Heon M, Hultman L, Gogotsi Y,Barsoum MW (2011) Two-dimensional nanocrystals produced by exfoliationof Ti3AlC2. Adv Mater 23(37):4248–4253
Zhang et al. Nanoscale Research Letters (2018) 13:343 Page 8 of 8


![In-Situ Temperature Dependent Raman Spectra of Coal · research of coal structure, such as X-ray diffraction analysis, Infrared spectrum analysis, and so on. Raman spectroscopy[3]](https://img.pdfslide.us/doc/110x75/60da3226e9e1dc75883d70e0/in-situ-temperature-dependent-raman-spectra-of-coal-research-of-coal-structure.jpg)