Embed Size (px)
Citation preview
Ž .Journal of Power Sources 81–82 1999 212–216www.elsevier.comrlocaterjpowsour
In situ investigation of the interaction between graphite and electrolytesolutions
Petr Novak ), Felix Joho, Roman Imhof 1, Jan-Christoph Panitz, Otto Haas´Paul Scherrer Institute, Electrochemistry Section, CH-5232 Villigen PSI, Switzerland
Abstract
Ž .The formation of a solid electrolyte interphase SEI before and during lithium intercalation was studied on graphite electrodes inethylene carbonate based electrolytes. We demonstrated by using in situ mass spectrometry that during the first charge of the graphiteelectrode ethylene gas is evolved in a potential window that corresponds to the formation of a SEI. Moreover, development of hydrogengas was detected even in dry electrolytes containing -10 ppm H O. No CO is developed however, as confirmed by two in situ2 2
methods, mass spectrometry and infrared spectroscopy. We conclude that the formation of the SEI is a complex process which dependsamong other things on the amount of trace water present in the cell. In addition, in situ Raman mapping experiments revealed that lithiumintercalation into graphite does not proceed homogeneously. q 1999 Elsevier Science S.A. All rights reserved.
Keywords: Lithium-ion cell; Graphite electrode; SEI-film; Electrolyte decomposition; In situ mass spectrometry; In situ infrared spectroscopy; In situRaman mapping
1. Introduction
Carbon-based negative electrodes are widely used incombination with lithium-containing positive electrodes ascomponents in lithium-ion batteries having high energy
w xdensity and good cycleability 1 . However, understandingthe irreversible charge loss occurring during the firstcharging of carbon electrodes is still a challenge. It isgenerally accepted that this charge loss is mainly due tothe reductive decomposition of the electrolyte on the nega-tive electrode. As a result of this decomposition a protec-
Ž .tive film called the solid electrolyte interphase SEI isformed that allows Liq-ion transfer but prevents electrontransfer. The SEI formation mechanism is complex and is
Žnot yet completely understood for recent reviews seew x.Refs. 2,3 . In this work the SEI formation before and
during lithium intercalation is studied on graphite elec-trodes in ethylene carbonate based electrolytes using sev-eral in situ methods.
) Corresponding author. Tel.: q41-56-310 2457; Fax: q41-56-3104415; E-mail: [email protected]
1 Present address: Renata AG, CH-4452 Itingen, Switzerland.
2. Experimental
The experiments were performed at room temperatureŽ . Ž .using a 1 M solution of LiClO Merck in a 1:1 vrv4
Ž .mixture of ethylene carbonate EC, Merck and dimethylŽ .carbonate DMC, Merck . The water content of this stan-
dard electrolyte was determined to be about 8 ppm byKarl–Fischer titration. Lithium metal was used as thecounter and reference electrodes. All potentials throughoutthe paper are reported with reference to the LirLiq cou-ple.
Galvanostatic chargerdischarge experiments were per-w xformed in laboratory cells described elsewhere 4 . Work-
ing electrodes were prepared from the synthetic graphitesw Ž .TIMREX SFG 44 and SFG 6 TIMCAL, Switzerland ,
respectively. A slurry of graphite suspended in a solutionŽ . Ž .of poly vinylidene fluoride PVDF in 1-methyl-2-pyr-
rolidone was sprayed on a thick stainless steel currentcollector and then dried under vacuum at 1208C overnight.The electrodes contained ca. 8 mg cmy2 of graphite and 5wt.% of PVDF binder. They were galvanostatically cycledat a rate of 10 mA mgy1 of graphite between 1500 and 5mV vs. LirLiq. At 5 mV the specific current was loweredpotentiostatically to F5 mA mgy1.
0378-7753r99r$ - see front matter q 1999 Elsevier Science S.A. All rights reserved.Ž .PII: S0378-7753 99 00119-6
( )P. NoÕak et al.rJournal of Power Sources 81–82 1999 212–216´ 213
Fig. 1. Galvanostatic chargerdischarge curve of a graphite SFG 44electrode.
Ž .Differential electrochemical mass spectrometry DEMSwas used for the identification of gaseous and volatileproducts evolved at the graphite electrode during cycling,
w xas described in Refs. 5,6 . SFG 6 was the active materialof the working electrode containing 5 wt.% of PVDF asbinder. The electrode was mechanically supported by aporous GORE-TEXw ePTFE pV 9008 membrane. Themeasurements were carried out potentiodynamically with a
y1 Ž .scan rate of 0.4 mV s . The current CV together withŽ .the mass signals MSCV were recorded simultaneously as
a function of potential.In situ infrared experiments were performed in the
ŽSNIFTIRS mode subtractively normalized interfacial. w xfourier transform infrared spectroscopy 7 . The setup is
w xdescribed in Refs. 8,9 . The potential-dependent changesat the electroderelectrolyte interface andror in the thinelectrolyte layer between the electrode and the optical
Ž .window CaF are visualized by plotting RrR , where R2 0
is the reflectance single beam spectrum taken at the work-ing electrode potential and R the background single beam0
spectrum taken at the open circuit potential. The workingŽ .electrode was a mechanically polished glassy carbon GC
disc. It was covered by spraying with a thick layer ofgraphite SFG 6 with 10 wt.% of PVDF as binder. Thesurface of the graphite was gently smoothed out with asheet of paper. The spectra R were measured at a resolu-tion of 4 cmy1 by accumulating 128 scans during apotential scan at 0.4 mV sy1. The measuring time of eachspectrum R was about 5 min with a DTGS detector.
In situ Raman spectroscopy was performed with aŽconfocal Raman microscope LabRam, DILORrInstru-
. qments using the 530.901 nm line of an external Kr ionlaser in a specially constructed spectro-electrochemical cellw x10 . By using a microscope with an ultralong working
Ž .distance objective Olympus with a 50= magnification itis possible to obtain Raman spectra from a depth of up to 4mm below the sapphire optical window. With the pinholediameter adjusted to 200 mm the lateral resolution is 4 mmaccording to the manufacturer’s specification. The laserpower was adjusted to 3–4 mW in order to avoid damageto the electrode surface. The working electrode consisted
of the graphite SFG 44 with 5 wt.% PVDF as binder.During the collection of the Raman spectra the electrodewas galvanostatically cycled at a rate of ca. 100 mA mgy1
of graphite in a potential window from 1500 to 5 mV vs.LirLiq. For the mapping routine the current was inter-rupted and the mapping was performed at a constantpotential.
3. Results and discussion
3.1. GalÕanostatic chargerdischarge experiments
Fig. 1 shows the first galvanostatic chargerdischargecurve of the graphite SFG 44. The charge consumed due to
Žside reactions in the first cycle in technical literature.frequently called the ‘charge loss’ is clearly visible. The
charge loss is generally ascribed to electrolyte decomposi-tion and corrosion-like reactions of Li C which both formx 6
w xthe SEI 2,3 . The SEI film is composed of alkyl carbon-Žates, Li CO , and salt reduction products e.g., LiCl from2 3
. w x w xLiClO 11 . According to Aurbach et al. 12 , 1.5 V vs.4
LirLiq may be considered as the onset potential for thesalt reduction. However, only little faradaic current flowsin the whole potential region positive to about 800 mV.Thus, SEI is mainly formed in the potential region nega-tive to about 800 mV vs. LirLiq as indicated by the
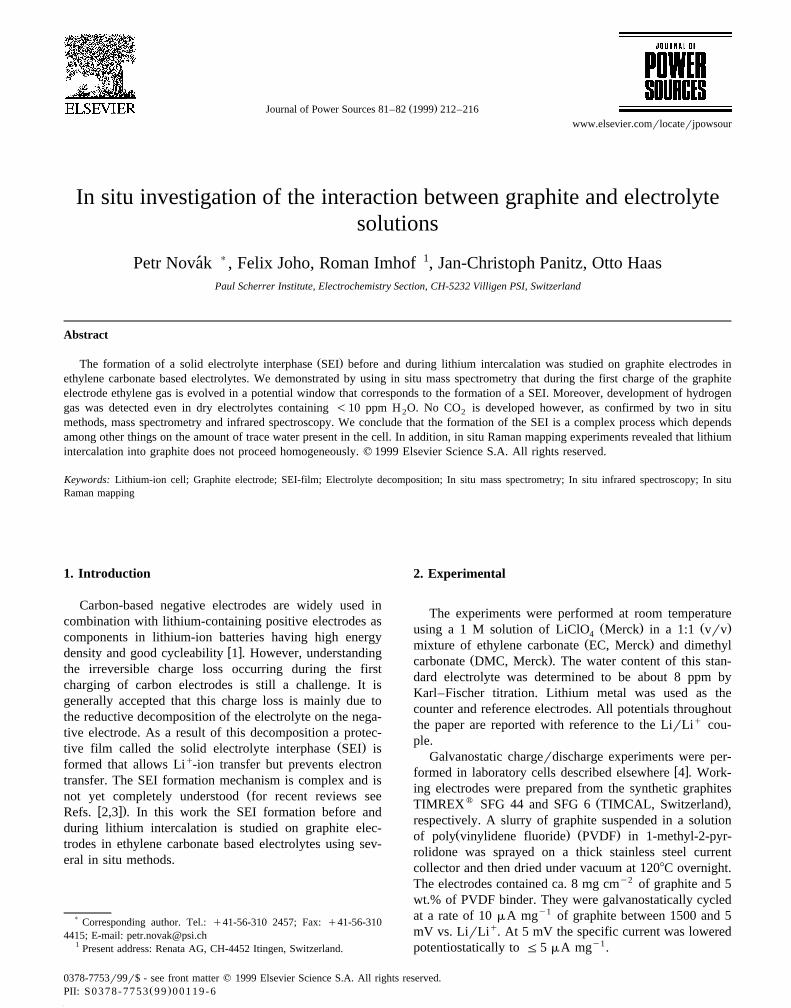
Ž . Ž .Fig. 2. CV above and two MSCV’s middle and below of a graphiteŽ .SFG 6 electrode first cycle . The MSCV’s show mr zs2 and mr zs
Ž27, representing hydrogen and ethylene, respectively. Consider that themeasurements were performed at a relatively high scan rate of 0.4 mVrs.Thus, the coulombic efficiency of lithium insertionrextraction is rather
.low in comparison to experiments discussed in literature.
( )P. NoÕak et al.rJournal of Power Sources 81–82 1999 212–216´214
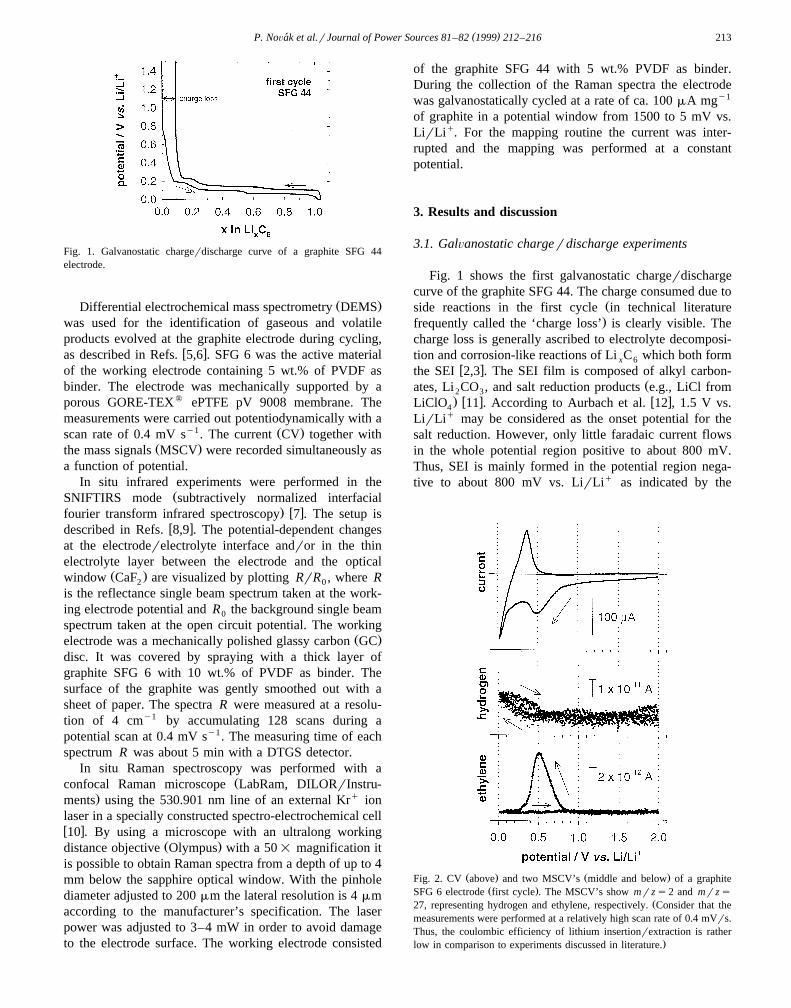
Fig. 3. SNIFTIR spectra measured from 400 mV to 272 mV vs. LirLiq
Ž . Ž .at a graphite electrode SFG 6 and a polished glassy carbon GCelectrode.
distinct sloping potential plateau in Fig. 1. Our experi-ments revealed that the electrochemical properties of bothgraphite types used in this study are similar except for thecharge loss in the first cycle which is ;10% for SFG 44and ;20% for SFG 6. This difference can be explainedwith the different BET specific surface area of the samplesŽ 2 y1 2 y1.SFG 6: 15.2 m g ; SFG 44: 4.3 m g as discussed
w xelsewhere 13 .
3.2. In situ mass spectrometry
In situ mass spectrometric experiments on graphiteelectrodes revealed that both ethylene and hydrogen gas
w xare formed in EC containing electrolytes 5,6 . No othervolatile products were detected. The ethylene evolution is
Ž . Ž .restricted i to the first charging half-cycle and ii to apotential window from ;800 to ;200 mV vs. LirLiq.The mass signals of the ethylene fragments correlate wellwith a negative current peak in the cyclic voltammogram
Ž .which corresponds to the formation of the SEI Fig. 2 .Our results seem to contradict other studies on completecells where besides ethylene mainly CO but also otherspecies such as methane, ethane, and CO have been2
w xcollected and identified 14–16 . This difference might berelated to the fact that only gases which are evolved at theworking electrode are analyzed in our DEMS experiments.
For supplementary measurements water was added tothe standard electrolyte. Then, a series of DEMS experi-ments was performed for water contents from 10 to 4000
w xppm H O. As already shown in Ref. 5 and further2w xelaborated in a related paper in this volume 17 , the more
trace water the electrolyte contains, the less ethylene isevolved. In wet electrolytes hydrogen gas from waterreduction can be detected at potentials negative to ;1300mV vs. LirLiq. Hydrogen evolution was also detected in
Ž .the dry electrolyte -10 ppm H O but only at potentials2q Ž .negative to ;600 mV vs. LirLi Fig. 2 . In contrary to
ethylene, this hydrogen mass signal appears with about thesame intensity also in the second cycle. The hydrogen
Žsource has not been identified yet. Be aware that the.reduction of both water and organic material is possible.
3.3. In situ infrared spectroscopy
To confirm the absence of CO by an independent2
method in situ infrared spectroscopic experiments wereperformed. Two representative spectra are shown in Fig. 3.The interpretation of the spectral bands below 2000 cmy1
is difficult because the spectra of the reaction productscoincide with the spectra of the bulk electrolyte. Neverthe-less, the absence of a CO absorption band expected at2
y1 Ž2342 cm and detected with the same setup in anotherw x.electrolyte system 18 clearly proves that no CO is2
generated during the SEI formation in the ECqDMCelectrolyte. Furthermore, despite the different lithium inter-calation behavior of GC and graphite in non-aqueouselectrolytes, the similarity of the two infrared spectraindicates that a GC electrode can be used as a modelsurface for the infrared spectroscopic investigation of theSEI formation on carbon. A detailed examination of in situinfrared spectra acquired at GC electrodes in ECqDMCelectrolyte solutions containing LiClO , LiPF , and4 6
Ž . w xLiN SO CF , respectively 5 , revealed that the concen-2 3 2
tration of the electrolyte salt anions near the electrodesurface decreases in the potential range where the SEI isformed.
All the mentioned observations allow us to concludethat the formation of the SEI is a complex process whichdepends among other things on the amount of trace waterpresent in the cell. The absence of species like C H and2 6
CO makes some of the SEI formation mechanisms sug-2w xgested in the recent literature 19,20 less probable. Scheme
1 summarizes the reactions which are compatible with ourexperiments.
Scheme 1. Possible reactions occurring on the graphite electrode duringthe first charging half-cycle.
( )P. NoÕak et al.rJournal of Power Sources 81–82 1999 212–216´ 215
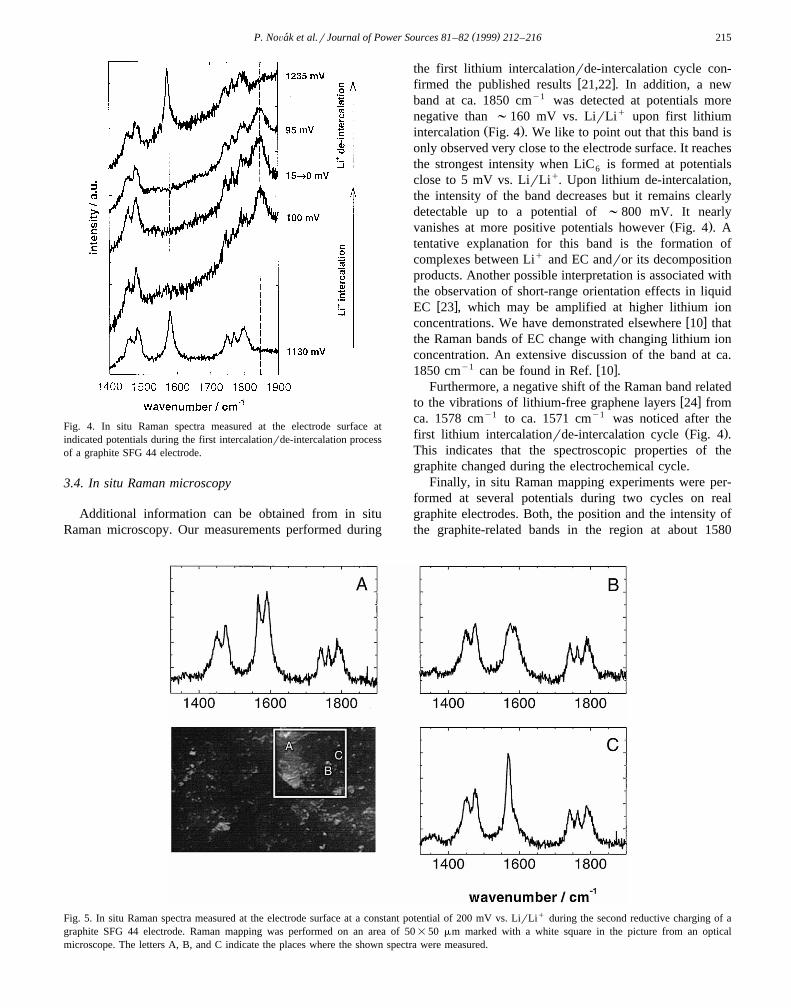
Fig. 4. In situ Raman spectra measured at the electrode surface atindicated potentials during the first intercalationrde-intercalation processof a graphite SFG 44 electrode.
3.4. In situ Raman microscopy
Additional information can be obtained from in situRaman microscopy. Our measurements performed during
the first lithium intercalationrde-intercalation cycle con-w xfirmed the published results 21,22 . In addition, a new
band at ca. 1850 cmy1 was detected at potentials morenegative than ;160 mV vs. LirLiq upon first lithium
Ž .intercalation Fig. 4 . We like to point out that this band isonly observed very close to the electrode surface. It reachesthe strongest intensity when LiC is formed at potentials6
close to 5 mV vs. LirLiq. Upon lithium de-intercalation,the intensity of the band decreases but it remains clearlydetectable up to a potential of ;800 mV. It nearly
Ž .vanishes at more positive potentials however Fig. 4 . Atentative explanation for this band is the formation ofcomplexes between Liq and EC andror its decompositionproducts. Another possible interpretation is associated withthe observation of short-range orientation effects in liquid
w xEC 23 , which may be amplified at higher lithium ionw xconcentrations. We have demonstrated elsewhere 10 that
the Raman bands of EC change with changing lithium ionconcentration. An extensive discussion of the band at ca.
y1 w x1850 cm can be found in Ref. 10 .Furthermore, a negative shift of the Raman band related
w xto the vibrations of lithium-free graphene layers 24 fromca. 1578 cmy1 to ca. 1571 cmy1 was noticed after the
Ž .first lithium intercalationrde-intercalation cycle Fig. 4 .This indicates that the spectroscopic properties of thegraphite changed during the electrochemical cycle.
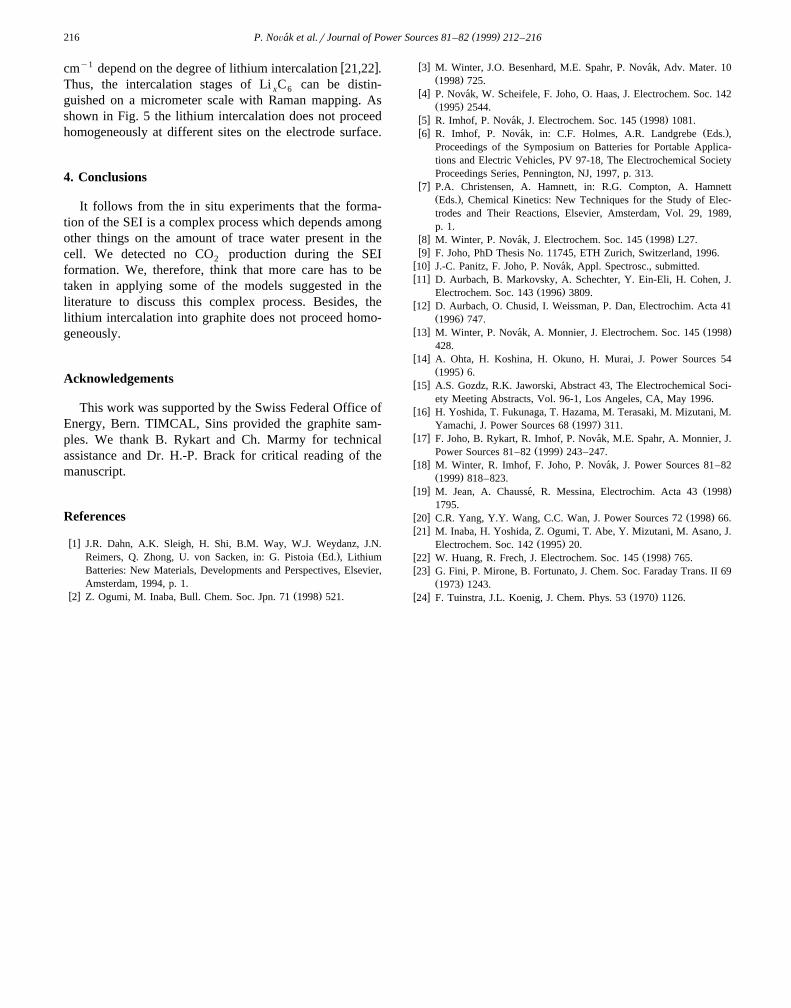
Finally, in situ Raman mapping experiments were per-formed at several potentials during two cycles on realgraphite electrodes. Both, the position and the intensity ofthe graphite-related bands in the region at about 1580
Fig. 5. In situ Raman spectra measured at the electrode surface at a constant potential of 200 mV vs. LirLiq during the second reductive charging of agraphite SFG 44 electrode. Raman mapping was performed on an area of 50=50 mm marked with a white square in the picture from an opticalmicroscope. The letters A, B, and C indicate the places where the shown spectra were measured.
( )P. NoÕak et al.rJournal of Power Sources 81–82 1999 212–216´216
y1 w xcm depend on the degree of lithium intercalation 21,22 .Thus, the intercalation stages of Li C can be distin-x 6
guished on a micrometer scale with Raman mapping. Asshown in Fig. 5 the lithium intercalation does not proceedhomogeneously at different sites on the electrode surface.
4. Conclusions
It follows from the in situ experiments that the forma-tion of the SEI is a complex process which depends amongother things on the amount of trace water present in thecell. We detected no CO production during the SEI2
formation. We, therefore, think that more care has to betaken in applying some of the models suggested in theliterature to discuss this complex process. Besides, thelithium intercalation into graphite does not proceed homo-geneously.
Acknowledgements
This work was supported by the Swiss Federal Office ofEnergy, Bern. TIMCAL, Sins provided the graphite sam-ples. We thank B. Rykart and Ch. Marmy for technicalassistance and Dr. H.-P. Brack for critical reading of themanuscript.
References
w x1 J.R. Dahn, A.K. Sleigh, H. Shi, B.M. Way, W.J. Weydanz, J.N.Ž .Reimers, Q. Zhong, U. von Sacken, in: G. Pistoia Ed. , Lithium
Batteries: New Materials, Developments and Perspectives, Elsevier,Amsterdam, 1994, p. 1.
w x Ž .2 Z. Ogumi, M. Inaba, Bull. Chem. Soc. Jpn. 71 1998 521.
w x3 M. Winter, J.O. Besenhard, M.E. Spahr, P. Novak, Adv. Mater. 10´Ž .1998 725.
w x4 P. Novak, W. Scheifele, F. Joho, O. Haas, J. Electrochem. Soc. 142´Ž .1995 2544.
w x Ž .5 R. Imhof, P. Novak, J. Electrochem. Soc. 145 1998 1081.´w x Ž .6 R. Imhof, P. Novak, in: C.F. Holmes, A.R. Landgrebe Eds. ,´
Proceedings of the Symposium on Batteries for Portable Applica-tions and Electric Vehicles, PV 97-18, The Electrochemical SocietyProceedings Series, Pennington, NJ, 1997, p. 313.
w x7 P.A. Christensen, A. Hamnett, in: R.G. Compton, A. HamnettŽ .Eds. , Chemical Kinetics: New Techniques for the Study of Elec-trodes and Their Reactions, Elsevier, Amsterdam, Vol. 29, 1989,p. 1.
w x Ž .8 M. Winter, P. Novak, J. Electrochem. Soc. 145 1998 L27.´w x9 F. Joho, PhD Thesis No. 11745, ETH Zurich, Switzerland, 1996.
w x10 J.-C. Panitz, F. Joho, P. Novak, Appl. Spectrosc., submitted.´w x11 D. Aurbach, B. Markovsky, A. Schechter, Y. Ein-Eli, H. Cohen, J.
Ž .Electrochem. Soc. 143 1996 3809.w x12 D. Aurbach, O. Chusid, I. Weissman, P. Dan, Electrochim. Acta 41
Ž .1996 747.w x Ž .13 M. Winter, P. Novak, A. Monnier, J. Electrochem. Soc. 145 1998´
428.w x14 A. Ohta, H. Koshina, H. Okuno, H. Murai, J. Power Sources 54
Ž .1995 6.w x15 A.S. Gozdz, R.K. Jaworski, Abstract 43, The Electrochemical Soci-
ety Meeting Abstracts, Vol. 96-1, Los Angeles, CA, May 1996.w x16 H. Yoshida, T. Fukunaga, T. Hazama, M. Terasaki, M. Mizutani, M.
Ž .Yamachi, J. Power Sources 68 1997 311.w x17 F. Joho, B. Rykart, R. Imhof, P. Novak, M.E. Spahr, A. Monnier, J.´
Ž .Power Sources 81–82 1999 243–247.w x18 M. Winter, R. Imhof, F. Joho, P. Novak, J. Power Sources 81–82´
Ž .1999 818–823.w x Ž .19 M. Jean, A. Chausse, R. Messina, Electrochim. Acta 43 1998´
1795.w x Ž .20 C.R. Yang, Y.Y. Wang, C.C. Wan, J. Power Sources 72 1998 66.w x21 M. Inaba, H. Yoshida, Z. Ogumi, T. Abe, Y. Mizutani, M. Asano, J.
Ž .Electrochem. Soc. 142 1995 20.w x Ž .22 W. Huang, R. Frech, J. Electrochem. Soc. 145 1998 765.w x23 G. Fini, P. Mirone, B. Fortunato, J. Chem. Soc. Faraday Trans. II 69
Ž .1973 1243.w x Ž .24 F. Tuinstra, J.L. Koenig, J. Chem. Phys. 53 1970 1126.


![Journal of Nuclear Materials - INL Advanced Reactor ... Situ...the properties of nuclear graphite [5–10]. Under irradiation, polycrystalline graphite undergoes complex dimensional](https://img.pdfslide.us/doc/110x75/60f85869ae21df3ef94aa65a/journal-of-nuclear-materials-inl-advanced-reactor-situ-the-properties-of.jpg)

![Correlation Between Microstructure and Na Storage Behavior ... · intercalated into graphite when appropriate electrolyte, such as ether-based electrolyte, [xxx] is used. Therefore,](https://img.pdfslide.us/doc/110x75/606a8e6699c5de6d195dc4b8/correlation-between-microstructure-and-na-storage-behavior-intercalated-into.jpg)