Embed Size (px)
Citation preview
In-situ assessment of density and material properties in timber structures by non- destructive and semi-destructive testing
THOMAS KRUGLOWA Department of Civil and Environmental Engineering Division of Structural Engineering Steel and Timber Structures CHALMERS UNIVERSITY OF TECHNOLOGY Gothenburg, Sweden 2012

THESIS FOR THE DEGREE OF LICENTIATE OF ENGINEERING
In-situ assessment of density and material properties in timber structures by non-destructive
and semi-destructive testing
THOMAS KRUGLOWA
Department of Civil and Environmental Engineering Division of Structural Engineering
Steel and Timber Structures CHALMERS UNIVERSITY OF TECHNOLOGY
Gothenburg, Sweden 2012

In-situ assessment of density and material properties in timber structures by non-destructive and semi-destructive testing
THOMAS KRUGLOWA THOMAS KRUGLOWA ISBN 978-91-7385-552-5
© THOMAS KRUGLOWA, 2012
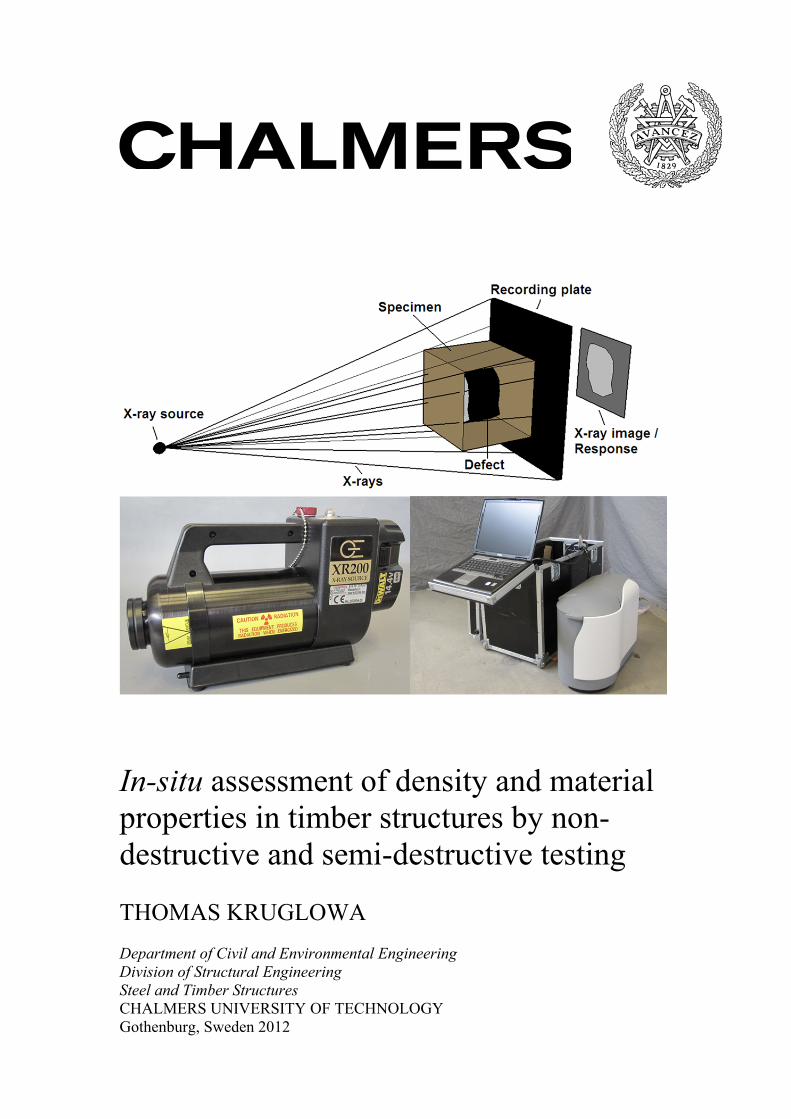
ISSN no. 1652-9146 Lic 2012:03 Department of Civil and Environmental Engineering Division of Structural Engineering Steel and Timber Structures Chalmers University of Technology SE-412 96 Gothenburg Sweden Telephone: + 46 (0)31-772 1000 Cover: The cover picture shows an example of an X-ray system and recording process. Chalmers Repro Service / Department of Civil and Environmental Engineering Gothenburg, Sweden, 2012

I
In-situ assessment of density and material properties in timber structures
THOMAS KRUGLOWA
Department of Civil and Environmental Engineering Division of Structural Engineering Steel and Timber Structures Chalmers University of Technology
ABSTRACT In the assessment of timber structures, diagnostic investigations of the structural members and connections are generally necessary. The assessment often requires appropriate non-destructive testing (NDT) and semi-destructive testing (SDT) techniques. Improved, new methods based on scientific knowledge and guidelines are needed for their application, so the principal goal of the project is to develop guidelines and recommendations on how to perform assessment of existing timber structures with reference to their condition and structural capability, as well as assessment strategies.
In the first part of the thesis, the research focused on the development of an X-ray image calibration procedure, which enables the determination of density properties for the in-situ assessment of timber structures. This non-destructive method is useful for evaluating the internal condition, since wood density has a strong relationship with several mechanical properties. An X-ray procedure to calibrate for the influence of significant density differences in wood specimens, thickness and moisture was applied, which the images were analysed and evaluated. Finally, a calibration wedge was set up to verify the procedure on timber beam specimens, resulting in good agreement and an average accuracy of ~97%. The values obtained from the image calibration resulted in very good linear correlation between the measured density and the greyscale from X-ray images. The main advantage compared with conventional techniques is the detection and quantification of the internal condition of timber that may reduce the mechanical properties of the structure. This study shows good potential when it comes to the development of a viable tool for in-situ assessments of timber structures and could be used indirectly in analyses of structural behaviour.
In the second part, the research focused on a systematic in-situ assessment strategy of the Vasa warship, including the prediction of the density, the stiffness properties and the influence of PEG (Poly Ethylene Glycol). This was made possible by combining non-destructive in-situ testing techniques, particularly X-ray, with mechanical and chemical tests. A global non-destructive assessment of the mechanical properties is needed to predict both the strength and stiffness of the Vasa oak. The proposed procedure can be used in situ with satisfactory results for the evaluation of timber properties. A conversion of a three-dimensional ship model from the Vasa warship to model the real structural behaviour might create difficulties due to the complexity of the material properties that are needed for input. The PEG content clearly has a negative influence on the strength and stiffness properties. Satisfactory agreement between the density and stiffness properties was reached through cross-correlation to PEG content.
Keywords: In-situ assessment, non-destructive testing (NDT), semi-destructive testing (SDT), density determination, X-ray, calibration procedure, Vasa warship.

III
Contents
ABSTRACT I
CONTENTS III
PREFACE V
LIST OF PUBLICATIONS VII
1 INTRODUCTION 1
1.1 Background 1
1.2 Aim and scientific approach 1
1.3 Method and objectives 2
1.4 Limitations 2
1.5 Outline of the thesis 3
2 METHODOLOGY FOR ASSESSMENT OF TIMBER STRUCTURES 4
3 WOOD STRUCTURE AND ITS MECHANICAL PROPERTIES 6
3.1 Factors influencing the mechanical and physical properties 6
3.2 Mechanical properties of waterlogged wood and the influence of conservation treatment with PEG 7
4 NON-DESTRUCTIVE AND SEMI-DESTRUCTIVE TESTING TECHNIQUES TO EVALUATE TIMBER STRUCTURES 9
4.1 Determination of material properties by NDT methods 9
4.1.1 Visual inspection 9
4.1.2 Vibrational resonance testing methods 10
4.1.3 Stress wave propagation techniques 13
4.2 NDT investigations using digital radiography (X-ray) 15
4.2.1 Theory of X-rays 16
4.2.2 Radiographic equipment 17
4.2.3 Types of X-ray investigations 17
4.2.4 Digital image processing and X-ray analysis 17
4.2.5 Applications of X-ray investigations 20
4.3 Static test of locally loaded part of a restrained member 22

IV
4.4 Determination of material properties by SDT methods 23
4.4.1 Hardness test 23
4.4.2 Core drilling 26
4.4.3 Pilodyn® test (Pin driving) 27
4.4.4 Resistance drilling 27
4.5 Screw-withdrawal resistance 28
4.6 Additional assessment techniques 29
4.7 On the choice of NDT/SDT methods 30
5 ASSESSMENT OF IN-SITU DENSITY IN TIMBER USING X-RAY EQUIPMENT [PAPER I] 31
5.1 Calibration procedure 31
5.1.1 Experimental procedure 32
5.2 Results 32
5.2.1 In-situ density 32
5.2.2 Influence of thickness 33
5.2.3 Effect of moisture content 34
5.3 Summary 35
6 DENSITY PROPERTY PREDICTION AND THE COMPLEXITY OF THE IN-SITU EVALUATION OF THE VASA WARSHIP FOR FUTURE STRUCTURAL ASSESSMENT [PAPER II] 36
6.1 Experimental procedure 37
6.2 Evaluation of the relationship between density and the stiffness – testing on clear wood specimens 38
6.2.1 Results from the density determination using X-ray 39
6.2.2 Results for relative stiffness properties 41
6.3 Summary 42
7 CONCLUSIONS 43
8 REFERENCES 46
APPENDED PAPERS
PAPER I I-0
PAPER II II-0

V
Preface In this study, the determination of the in-situ material properties was carried out using non-destructive testing equipment, especially X-ray. Furthermore, evaluations of non-destructive and semi-destructive testing techniques were made, together with the potential of X-ray investigations as part of the diagnosis of existing structures. The thesis was written from July 2009 to March 2012 at the Division of Structural Engineering, Steel and Timber Structures, Chalmers University of Technology, Sweden. The project is part of a research project involving the in-situ assessment of timber structures. This research project has been financed by a research grant from The Swedish Research Council for Environment, Agricultural Sciences and Spatial Planning (FORMAS, No. 243-2008-1246). I would also like to acknowledge the Nils and Dorthi Troëdsson research fund for providing Chalmers University of Technology with the portable X-ray equipment.
The project was carried out with Professor Robert Kliger as examiner and main supervisor and I would like to thank him for all his good advice on technical matters, planning, writing my papers and performing the tests, as well as his support on personal issues. My co-supervisor, Ylva Sandin, PhD, is warmly thanked for her help with planning and her extensive knowledge came in very handy when writing my papers and performing the tests. Further, I also appreciate the co-operation with Ingela Bjurhager, PhD and the Vasa Unit, especially Magnus Olofsson, Anders Ahlgren and Malin Sahlstedt. I would also like to thank my colleagues for their co-operation and involvement, both privately and at work.
It should be noted that the tests could never have been conducted without the sense of high quality and professionalism of the laboratory staff. Special thanks are given to Lars Wahlström.
Finally, I would like to thank my friends and my three wonderful children who distracted me from work-related thoughts.
Gothenburg, 2012
Thomas Kruglowa

VII
LIST OF PUBLICATIONS
This thesis is based on the work contained in the following papers:
Paper I
Kruglowa T., Sandin Y. and Kliger I. R. (2012): Assessment of Density in Timber Using X-ray Equipment. Accepted for publication in International Journal of Architectural Heritage: Conservation, Analysis and Restoration.
Paper II
Kruglowa T., Bjurhager I., Segués E. and Kliger I. R. (2012): Density Property Prediction and the Complexity of the In-Situ Evaluation of the Vasa Warship for Future Structural Assessment. Submitted for publication to International Journal of Architectural Heritage: Conservation, Analysis and Restoration.

VIII
AUTHOR’S CONTRIBUTIONS TO JOINTLY PUBLISHED PAPERS
The contribution of the author of this doctoral thesis to the appended papers is described here.
I. Responsible for the writing and for the major part of the planning of the paper. Planned the major part and was responsible for the execution of the experiments.
II. Responsible for the writing and for the major part of the planning of the paper. Planned the major part and was partly responsible for the execution of the experiments.

IX
ADDITIONAL PUBLICATIONS BY THE AUTHOR
Conference Papers
Kruglowa T., Sandin Y. and Kliger I. R. (2010): Density Calibration Using X-ray Equipment for In-Situ Assessment of Timber Structures. Proceedings of the 11th World Conference on Timber Engineering, Riva Del Garda, Italy, 20-24 June 2010.
Kruglowa T., Kliger I. R. and Sandin Y. (2011): On-Site X-ray Assessment of Density in Timber Structures. Proceedings of the International Conference on Structural Health Assessment of Timber Structures 2011, Lisbon, Portugal, 16-17 June 2011.
Guideline(s)
Kruglowa T. (2012): In-Situ Determination of Density in Timber structures using X-ray: A Guideline. ISSN 1652-9162, Chalmers Report No. 2012:03.
Master’s Thesis
Jónsson G.P. and Kruglowa T. (2009): Determination of Design Values for Stress-Laminated Timber Decks: Non-Destructive Experimental and Analytical Evaluation. Master’s Thesis, Department of Civil and Environmental Engineering, Chalmers University of Technology, Gothenburg, Sweden, pp.108.

CHALMERS, Civil and Environmental Engineering
1
1 Introduction 1.1 Background Timber as a renewable and environmentally friendly material has been increasingly used in old as well as new structural applications. Timber structures in general are more complicated when it comes to condition assessment compared to steel and concrete structures, since more number of material and environmental parameters are involved for timber structures. This is particularly true for structures and buildings of historical value when aging can be suspected having diminishing effects on its strength and stiffness or abnormal structural behaviour has been discovered. The same applies to newer buildings and wooden bridges if they are damaged due to lack of maintenance, poor design, poor workmanship or events such as fire, floods or earthquakes.
Historic structures represent a part of the cultural heritage of every nation and societies pay considerable attention to their preservation and maintenance. Recently, cultural heritage has been considered to be an asset rather than a cost. In historic structures, it is important to preserve the original structure to the greatest extent possible. Much of the damage observed in historic structures can be attributed to biodegradation. The deterioration of structural members results in changes in geometry and load-bearing capacity. Replacement of deteriorated members may not be an acceptable option for structures of historic significance and redesign may be necessary to sustain functionality of the structure. The preservation of historic structures represents, however, many challenges ranging from social and economic issues to technical methods and solutions for condition assessment and verification.
It is therefore of great importance to adopt structural health monitoring techniques to assess the remaining load carrying capacity for timber structures. Through reliable and appropriate assessment and monitoring of timber structures, it is possible to detect any weaknesses at an early stage and appropriate actions to extend the structures service life can be taken. This project will focus on technical challenges associated with the in-situ evaluation of timber in structures in general.
1.2 Aim and scientific approach In the assessment of timber structures, diagnostic investigations of the structural members and connections are generally necessary. The assessment requires often appropriate non-destructive testing (NDT) as well as semi-destructive testing (SDT) techniques. Improved and new methods based on scientific knowledge and guidelines are needed for their application. The principal goal of the project is to develop guidelines and recommendations on how to perform assessment of existing timber structures with reference to their condition and structural capability. Within this overall vision of the project, there are a number of specific sub-objectives that relate to different stages of the research project and are investigated in that work:
Providing the means of screening the existing timber structures for potential problem areas and to imply proper assessment methodology and strategies.
Providing images of internal condition of timber members and connections using NDT/SDT methods such as advanced radiography combined with other existing testing and to be able to interpret the results in a satisfactory way.

CHALMERS, Civil and Environmental Engineering
2
Proposing procedures to determine the in-situ – physical and mechanical properties of timber structural members and mechanical connections using NDT/SDT in order to apply the output as an input to model the assumed behaviour of various existing structures and to be able to re-calculate the actual remaining capacity of e.g. connections and timber members.
Some material and mechanical parameters are highly related to the density of timber, e.g. the modulus of elasticity (MOE), the embedment strength in connections, as well as the compression strength both parallel and perpendicular to the grain (Kollmann et al., 1968, Dinwoodie, 2000, Feio, 2005). Therefore, in the evaluation of the NDT/SDT-techniques, the focus is directed to the evaluation of the density, stiffness and strength parameters.
1.3 Method and objectives In order to achieve the goals of the project, several aspects needed to be investigated. These aspects are:
A literature study was carried out on relevant different NDT/SDT techniques to investigate physical and mechanical properties of timber structures on-site.
A decision was made to explore the usage of X-ray equipment in the investigations of density properties that are highly correlated to stiffness and strength properties of timber. For that purpose, clear wood specimens with varying density were used to establish a calibration procedure for in-situ assessment (Paper I).
Paper II is based on the application of the proposed method in the investigation of density and stiffness properties on the Vasa warship in order to be able to determine input values for numerical models. Test specimens that were used in this investigation were fresh oak (Quercus robur) that served as reference specimens and Vasa oak (archaeological wood) from the warship (ID65742 and ID65743).
A final verification can be achieved through a case study where the proposed procedure/model is put into its contents and is evaluated.
Strategies for structural assessment: Literature study regarding an appropriate assessment procedure was carried out based on existing standards and recommendations.
1.4 Limitations The limitations from Paper I and Paper II are summarized.
Paper I was of laboratory testing character and resulted in an in-situ density determination procedure for practical use using portable X-ray equipment. The procedure was limited by calibration of the images that was based on a subjective viewpoint and had to be performed each time an image was made. Furthermore, the characteristics of the X-rays, which originated from the cone-beam effect of the generator, influenced the background noise of the image and were excluded through an image analysis procedure. However, the image plate size also restricted the global evaluation.
Regarding the Paper II, there was a restriction in the sample size of the specimens from the Vasa ship due to the limited availability of elaborative specimens. A further

CHALMERS, Civil and Environmental Engineering
3
limitation was the range of density that limited the evaluation of the stiffness properties of the Vasa-oak. The relative stiffness parameters were only determined in the elastic range of the material and the PEG content was only determined for 8 samples which did not result in a statistical significance.
1.5 Outline of the thesis Here the structure of the thesis is presented. The thesis consists of 2 papers and an introductory part which gives a background to the subjects treated in the papers.
From the list below the reader should get an overview of the thesis. The chapters are organized chronologically according to the process in the project.
1. Introduction: The thesis is presented with background information; the aim of the thesis is presented along with information on how to achieve the aim. The objectives and method contains the practical information connected to the aims to be fulfilled.
2. Methodology for the assessment timber structures: This chapter shortly treats
general existing guidelines, recommendations and standards regarding the methodology and assessment strategies of existing timber structures.
3. Wood structure: This chapter gives a general overview and basic knowledge on the structural composition of wood and aspects that influence the physical and mechanical properties.
4. NDT/SDT techniques to evaluate timber structures: This chapter includes the literature study conducted, different possibilities to solving the tasks are investigated and a choice of method and testing is made. The theory behind the chosen method is explained and the assumptions that are made are listed.
5. In-situ determination of density using X-ray investigations: This chapter
refers mainly to Paper I in the thesis and discusses the procedure and test results.
6. In-situ evaluation of the Vasa warship: This chapter refers mainly to Paper II in the thesis and discusses the assessment strategy and test results of density and stiffness properties as well as the complexity of in-situ evaluation.
7. Conclusions: In this chapter the outcome of the project is compared to the aim of the thesis and conclusions are made. A comparison with other relevant information is made and comments are made on the correlation of the results and further investigations will be suggested.
8. References: An alphabetical summary of the literature used is listed. References are also included in the appended papers.
9. Appendices: This part includes the papers that are the foundation for this thesis.

CHALMERS, Civil and Environmental Engineering
4
2 Methodology for assessment of timber structures In-situ assessment of timber elements is essential in the continuous maintenance and preservation of historical timber structures such as warships, bridges, churches and so on. This is especially valid for occasions where causes for abnormal structural behaviour of the anticipated structural performance have been observed and the survival of the historical timber structures for a long-term period should be guaranteed.
Abnormal structural behaviour can be suspected when the strength, stiffness and deterioration of the structures have diminishing effect due to conservation works, changes in climate, the natural characteristics of old timber (Mohager, 1987, Rug et al., 1991), but also the compatibility of material in connections that might affect the properties and results in changes of the load-carrying capacity.
Therefore, strategies and recommendations for the analysis of objectives of highly significant cultural value have to be established and applied.
Here a general methodology for the assessment of historical timber structures is outlined. There are already existing standardisation activities and agreements on-going, e.g. ISO13822, ICOMOS, UNI 11119 and UNI 11138 (Italian standardization body). These existing standards and recommendations are designed to serve as a basis for the assessment procedures for existing structures and to preserve the value of the heritage (ICOMOS, 2005, Macchioni et al., 2006), see Figure 2.1. The focus in this study is set to the investigation part in the assessment branch.
Figure 2.1 Recommendation chart for the assessment of timber structures according to ISO13822 standard.
Within these procedures, several aspects are treated that have a major impact on the structural behaviour, which also serves as a basis for decisions and judgement for intervention work and inspection strategies. These aspects are in the line of a holistic approach, with the aim of facilitating the in-situ assessment of timber structures (Kruglowa et al., 2012). This requires knowledge of the forces and deformation in order to analyse the mechanics of the structure. The calculated forces and deformation depend on the assumptions made regarding geometry, joints and conditions at the supports, materials and loads. In order for the evaluation to represent the true behaviour of the real structure, these parameters must all be appropriately explored

CHALMERS, Civil and Environmental Engineering
5
and described in the process before decisions on the continuous maintenance and restoration work are made.
In summary, the assessment methodology can be divided into four principle stages; anamnesis, diagnosis, therapy and prognosis (ICOMOS, 2005). In the anamnesis, all available information should be gathered about the history and the alterations of the investigated object during the past. The diagnosis then involves the actual measurements and all complementing information of the structure such as the material characteristics, an on-site survey, a static analysis and the assessment of the stability of the load bearing structure. This information makes it possible to retrieve the causes of the observed alterations and damage, which leads to final decisions for an intervention plan of the investigated object. As a final step and after the intervention work, prognosis to value the life span of the structure regarding durability and service life aspects, which is a difficult problem, needs to be done (ICOMOS, 2005, Magnus, 2008). It also needs to be pointed out that all investigations and actions should always be properly documented to facilitate future investigations and decisions. This methodology should apply for all kind of timber structures.
Since one of the main purposes with this study is the investigation of material properties in-situ, non-destructive testing methods are discussed to what extent they are useful for obtaining actual wood characteristics. As wood is an anisotropic material, the characteristics vary between the different directions, but due to its natural characteristics that cannot be controlled by the production process, the material characteristics depend mainly on the wood species, moisture content, natural growth defects and the wood type of structure. Therefore, an overall survey of the material has to be aimed for taking into account each single piece of wood of the load carrying structure to assure the accuracy of the assessment.
The variation of the material and mechanical characteristics are expected to be large. As a result, an investigation plan to establish the material characteristics needs to be done. Since important material, strength and stiffness properties are mutually related to each other, these correlations can be taken advantage of in an overall survey of historical structures using non-destructive testing methods for evaluation of the on-site material properties of the warship. To decide on the appropriate investigation method, one should start with visual inspections, probing and sounding to locate and observe critical sections which are the simplest way to assess the condition of a structure, before deciding on whether further investigation is needed or not and on the selection of the appropriate testing method for the detailed global survey. This investigation requires skilled expertise to be able to observe critical sections, damage, deterioration and alterations in the structure and possible causes.

CHALMERS, Civil and Environmental Engineering
6
3 Wood structure and its mechanical properties 3.1 Factors influencing the mechanical and physical
properties When entering the construction site for inspection and assessment purposes, basic knowledge and skills are required to identify the condition of the structure and structural elements. This section gives a summary of the aspects and factors influencing the wood structure, especially the influence on the strength, stiffness and physical properties of the timber. For more detailed information and illustrations, references in literature see Kollman (1968), Dinwoodie (2000), FPL’s wood handbook (2010). All the aspects in the list below influence the behaviour from a structural viewpoint and have to be taken into account in the evaluation of timber structures. Most of them cause in one way or another degradation, deterioration or damage in any kind.
The main factors influencing the properties are the following:
Species & type of wood: The species are mainly divided in two categories; hardwood or softwood, which is based on their microscopic structure. The mechanical properties of wood are mainly governed by the middle layer (S2) of the cell wall. In hardwood, the variation of mechanical properties depends on the configuration and the amount of vessels.
The structural composition and variability of porosity, growth rings, earlywood, latewood, sapwood, heartwood, juvenile wood, mature wood, reactionwood and therefore density variations both along its radial and longitudinal position has large effects on the mechanical properties.
The chemical and mechanical properties vary from given species and individual trees and are affected by parameters such as geographic location, climate and soil conditions.
Anisotropic behaviour: Wood has highly anisotropic behaviour, but through production and strength grading processes for structural purposes this behaviour can be simplified to orthotropic behaviour, where the mechanical behaviour can be described by twelve constants depending on their loading direction, either longitudinal (L), radial (R) or tangential (T)
The load direction (L, R, T) plays a major role for the strength and stiffness properties, but also for the type of failure of the structure. Failure due to tension is commonly known as brittle failure, whereas compressive failure is of ductile character.
Density has large influence on the mechanical properties of wood in general and is therefore an important measurement for the wood material to withstand load. Further it is highly correlated to the stiffness properties and the compressive strength and surface hardness properties of wood.
The load duration and the stress levels over time are further parameters that influence the material properties drastically and can result in a loss of strength over time of about 60% in comparison to the short time strength.
Moisture content (MC) needs to be investigated during mechanical testing since the impact of in-/decreasing MC on the mechanical properties of wood is tremendous and affects both the strength and stiffness.
Similar effect as MC on the mechanical properties has the influence of temperature. A superlative of this effect is reached in combination of both

CHALMERS, Civil and Environmental Engineering
7
increasing MC and temperature; therefore control of the climatic conditions is very important.
The grain angle or also called micro-fibril angle also has considerable impact on the strength and stiffness properties, especially in tension.
Natural defects, e.g. knots show also significant influence in the strength of wood.
3.2 Mechanical properties of waterlogged wood and the influence of conservation treatment with PEG
Since the mechanical properties of waterlogged and PEG (Poly Ethylene Glycol) impregnated wood were of interest in Paper II, a short summarizing section is dedicated here.
Waterlogged archaeological wood undergoes physical as well as chemical modifications from the erosion bacteria in anaerobic conditions, causing separation of the secondary cell wall layers (Björdal et al., 1999, Almkvist et al., 2008, Capretti et al., 2008). Since in the structure of the cell wall is a main parameter governing the strength characteristics in wood, cell wall decomposition and cell wall distortion severely decreases the mechanical properties and has a highly negative impact on the strength (Schniewind, 1990, Ljungdahl et al., 2006).
The chemical analysis of the residual components, such as residual density and the water content in the waterlogged wood, estimate the degree of decay. These degradation processes have diminishing effects on the strength and stiffness of the warship structure, such as decreasing bearing capacity, loss of cross sectional area and global deformations which has been stated by different authors (Mühlethaler, 1973, Schniewind, 1990). Those parameters become essential in the assessment of the state of preservation and the planning of the further conservation of the archaeological wood (Capretti et al., 2008). Conservation treatment, e.g. PEG prevent waterlogged wooden structures from serious shrinkage and distortion that would have caused collapse of the cell walls.
The strength and stiffness loss in archaeological wood is in general not directly proportional to the loss of mass and depends in many cases also on the degradation and the quality of the remaining substance in the wood (Mühlethaler, 1973).
This loss of wood substance causes higher porosity and permeability which results in lower density and makes the wood to bulk water (Hedges, 1990). A decrease in strength of at least 40% must therefore be expected (Mühlethaler, 1973, Schniewind, 1990). Since a major part of the Vasa warship is constructed from durable and biologically resistant heartwood, one could anticipate the biological degradation to be small.
This has been shown for other archaeological ships made from oak, such as the Bremen cog. Here, the heartwood displayed only small changes in the chemical decomposition, whereas the sapwood, less resistant compared to heartwood, experienced large degradation and changes in the cell wall structure. In this case, a large difference in mechanical properties as well as shrinkage and bulking properties between heartwood and sapwood was reported (Mühlethaler, 1973). The stiffness properties between modulus of elasticity in bending and the modulus of elasticity in compression of heartwood oak, tested on the Bremen cog showed a difference more

CHALMERS, Civil and Environmental Engineering
8
than 50% and lie still between the range of 35 to 60% for the bending properties compared to fresh oak samples that were water-saturated (Mühlethaler, 1973). In case of the Bremen cog, differences in mechanical behavior between the two types of wood could be as large as 1 to 30 and the maximum moisture content four times higher in sapwood than in heartwood. Most interestingly, however, the dried density of heartwood was found to be 30% higher compared to fresh oak, while a decrease in compression strength of 20% was experienced (Mühlethaler, 1973). This is somewhat paradoxical, since a high density (apart from reaction wood) in fresh wood usually implies to high mechanical properties. In general, the loss of strength and stiffness in archaeological wood is generally not proportional to the loss of mass, but depends also in many cases also on the degradation and the quality of the remaining substance in the wood (Mühlethaler, 1973).
The prediction of the mechanical properties of waterlogged wood and its influence of conservation treatment lead to larger expected variations and higher uncertainties in the evaluation process.

CHALMERS, Civil and Environmental Engineering
9
4 Non-destructive and semi-destructive testing techniques to evaluate timber structures
The presented non-destructive testing (NDT) and semi-destructive testing (SDT) techniques are based on the information obtained from the literature. Furthermore, it gives just an overview and some extracts from different literature and what have been stated in order to provide a comparison of the statements and its correctness, i.e. it is not evaluated in that stage but should give indices for evaluation purposes.
The focus is mainly on the opportunity to conduct the in-situ determination of physical and mechanical properties using NDT techniques.
Among timber investigation techniques, there are several methods that are commonly used for the assessment of both qualitative and quantitative parameters of timber structures (Ross et al., 2000, Kasal et al., 2004, Anthony et al., 2007). A short overview of these different techniques and relevance towards possible applicability for a global survey, as well as, local assessment and characteristics for the evaluation of mechanical and material properties as an input for numerical analysis.
The testing methods might be distinguished to whether being of global or local character as well as non-destructive or semi-destructive. For structures of significant cultural value, the aim is to limit the destruction of the object to a minimum. Since historic structures often have limited access to material for (semi-)destructive testing, NDT methods are preferred to assess the condition and the material characteristics of the structure.
4.1 Determination of material properties by NDT methods
4.1.1 Visual inspection
The simplest method for evaluation of a structure is visual inspection, where major factors such as growth rate, knots, grain angle, moisture content and deterioration govern the strength of the timber (Ravenshorst et al., 2004). By visual inspections, critical areas and surface deterioration can be discovered in early stages and appropriate measurements as moisture content can be evaluated as well as the natural defects relative position can be located. For example, the knot ratio’s position has great influence and is highly correlated on the strength properties. This is both valid for soft- and hardwoods (Ravenshorst et al., 2004). Hardwoods are more prone to greater variations of the mechanical properties, since they are mainly governed by the arrangement of the vessels in the microstructure (Kollmann et al., 1968, FPL, 2010). The amount of degradation in the critical sections has to be determined using additional tools. In the case of the Vasa warship, one can assume that the warship has undergone intensive visual inspections throughout the past decades, but the mapping on surface degradation still continues due to the influence of chemical treatment (PEG) and sulfuric acids. The PEG penetration is varying in depth (Björdal et al., 1999, Bjurhager et al., 2010) in different parts and causes great variation in the surface degradation, which reduces the effective cross-section tremendously. These variations cause difficulties in the assessment.
As a helping tool for global survey of the structure, sounding is the most common inspection method, where experts interpret the sounds from a striking hammer for indication of the internal condition of the wood. Although this method is simple to

CHALMERS, Civil and Environmental Engineering
10
use, the interpretation of the sound quality can be influenced by different factors and cannot detect degradation in early stages and must therefore be supported and verified by additional methods such as resistance drilling.
4.1.2 Vibrational resonance testing methods
Equipment that is used more often nowadays is non-destructive testing methods using computer programmes that collocates the vibration data in terms of frequency and the speed of sound of stress waves. In general, this kind of testing is called dynamic testing or vibrational resonance testing which is based on the propagation of sound waves through the wood. Mainly, two primary types of methods exist; stress wave methods and ultrasound methods. The main difference between these methods is that stress wave methods generally are waves in the audible range (low frequency) and ultrasound above the audible range. Both methods are influenced by moisture content, wood species and growth ring orientation, but are useful for the determination of the relative condition in wood structures, i.e. that the propagation time is an indicator whether the wood is deteriorated, have lower stiffness or density. Due to the influence of the mentioned aspects, there might be a considerable variation in the correlation of the strength properties and the E-modulus (Kasal et al., 2004).
Hereby, axial, torsional but also transversal vibrations/stress waves are induced by a hammer and the natural frequencies are captured by a strain gauge type load cell transducer (Ross et al., 1991). These transformations are achieved by complex software. The development of these testing devices and the software had already started in the 1980’s. Figure 4.1 shows the test set-up for the mentioned testing equipment. The access and the capacity of computer technology today have provided the development of various less and more expensive, but powerful software components for the determination of material properties.
These dynamic methods are used for the prediction of an average value for the stiffness. Deterioration that is caused by any organism decreases the strength and stiffness properties of material and affects the dynamic behaviour. Therefore, vibration techniques could help evaluating structural system components. Here, some of the appropriate dynamic in-situ tests are discussed.
4.1.2.1 Longitudinal vibration for free edge support
Here, the vibration is induced by excitation of one end with the hammer and capture the electric signal via the microphone through the FFT-analyser (Fast Fourier Transform) that transforms the signal into frequency, see Figure 4.1. For standard specimens the resonance occurs between 5 to 9 kHz. The dynamic E-modulus from this test can easily be calculated relating the density, the frequency and the length of the bar or beam (Haines et al., 1996). The E-modulus (MOE) from this test can be obtained from Eq. (4.1) (Haines et al., 1996). The dynamic E-modulus and the static one are highly correlated (R2=0.99) (Ross et al., 1991).

CHALMERS, Civil and Environmental Engineering
11
Eq. (4.1)
where is the density, the natural frequency of longitudinal vibration and the beam span.
Figure 4.1 The test set-up in principal of the available testing equipment for dynamic testing at Chalmers. Similar testing devices were developed by the Forest Products Laboratory (FPL) (Ross et al., 1991, Haines et al., 1996). The test equipment measures material properties by dynamic non-destructive vibration testing.
4.1.2.2 Flexural vibration for free edge support
Here, the microphone is located at one of the ends above in order to capture the electric signal. The vibration is introduced by striking with the hammer from above in the centre of the specimen in order to capture the frequency of flexural vibration, see Figure 4.2. For standard specimens the resonance occurs between 700 to 900 Hz. The dynamic E-modulus for this case can in a similar way as the previous one simply be obtained, but involves a further parameter, see Eq. (4.2) (Haines et al., 1996).
Eq. (4.2)
where is the density, the natural frequency for flexural vibration, the beam span and the vertical thickness of the beam.
Figure 4.2 Resonance flexure test (Haines et al., 1996).
Results of the tests showed less than 3% difference compared to the static flexure test, the longitudinal vibration test less than 6%. Therefore, the flexural vibration test gives an accurate tool for the determination of the E-modulus (Haines et al., 1996).

CHALMERS, Civil and Environmental Engineering
12
4.1.2.3 Transversal vibration for simply supported beam
The general expression, Eq. (4.3), for transverse vibrations on simply supports can be used to determine the MOE (Ross et al., 2002).
Eq. (4.3)
where … mass, … damping dashpot, … spring stiffness and … forcing vibration function.
When solving for the spring stiffness one can back out the expression for the E-modulus (MOE), see Eq. (4.4).
Eq. (4.4)
where is the weight of the beam, the natural frequency for transverse vibration, the moment of inertia, the beam span and the gravity acceleration.
The response of the vibrations on a beam can be measured at the bottom by using a LVDT (Linear Variable Differential Transducer) that is connected to an oscilloscope to store the output data, see Figure 4.3. The MOE can be verified by static testing, see Eq. (4.5).
Eq. (4.5)
where is the applied force, the beam span, the moment of inertia, and the deflection at the center.
Figure 4.3 The test set-up in principal for an in-situ dynamic modal testing for a simply supported beam on the left hand side. The right hand side provides the theoretical model of the beam (Ross et al., 2002).
The testing of deteriorated floor systems showed that frequency and stiffness are highly correlated (R2=0.97) and that the model holds promise as an inspection tool, but further research should be carried out on various levels of deterioration (Ross et al., 2002).
Another powerful method of testing is by analysing natural frequencies and mode shapes through dynamic modal testing according to Timoshenko’s and St.-Venant’s beam theory. Here, the natural frequencies of a beam are achieved by modal analysis of the beam specimens through excitation by a hammer. The accelerations are determined for a free edge support condition, see Figure 4.4. The needed testing equipment is similar to the equipment shown in Figure 4.5(a). For the essential modes in either direction, a transfer function is obtained from each excitation (Ohlsson et al., 1992). The elastic properties that are determined by this testing method are the axial

CHALMERS, Civil and Environmental Engineering
13
vibration E-modulus, the E-modulus for both the flatwise and edgewise bending as well as the torsional stiffness (shear modulus). This method is very useful for construction size timber, but has to be adapted to on-site members and should be looked into more deeply. (Ohlsson et al., 1992).
As a result, it was proved possible to achieve accurate estimates of natural frequencies in bending, torsion and axial excitation modes according to Timoshenko’s and St.-Venant’s beam theory for nodal distances as short as 2.5 times the beam depth. Furthermore, the shear modulus did not indicate differences in the shear stress distributions over the cross-section which would affect the bending stiffness and the torsional rigidity differently, but differences in the damping ratios between shear rigidity influenced vibration modes and purely governed modes for MOE were obtained (Ohlsson et al., 1992).
Figure 4.4 The figure shows the principal test set-up for a dynamic modal testing for a free edge support condition and the force excitation and acceleration measuring points (Ohlsson et al., 1992). These excitation and acceleration points provide all the elastic properties of the material.
4.1.3 Stress wave propagation techniques
4.1.3.1 Ultrasonic method
Another way of testing the longitudinal E-modulus of existing structures on-site is by using a technique that measures the impact induced stress wave propagation with an oscilloscope. This test is better known as the Sylva®-test (ultrasonic test) (Larsson et al., 1994, Ross et al., 1996). Here, two piezoelectric probes are used receiving the longitudinal ultrasound wave. That tool is very useful carrying out in-situ tests in order to achieve the remaining capacity of a singular beam specimen in a structure. The measuring is time efficient and reliable results are obtained. The disadvantage is that the beam’s density has to be known to back out the modulus of elasticity, which has to be determined before the installation of the specimen in the structural system or in combination with any other non-destructive test determining the density of the structural member. Another limitation of that test is that it requires access from both sides, which in case of one-sided access would prefer the use of the pulse-echo technique (Zombori, 2001). Other aspects that limit the uncertainty of the use of the method are the sensitivity to moisture and the deviation from the grain direction, which in its turn leads to that certain defects, e.g. cracks, splits, worm holes, etc., cannot be detected. Indications can be gained through sounding and comparison of stress wave propagation speed at other parts of the specimens.

CHALMERS, Civil and Environmental Engineering
14
Branco et al. (Branco et al., 2008) found quite a low coefficient of determination (R2=0.15) when applying the Sylva®-test on the king-post trusses in order to obtain the MOE. With this test also the transverse cross-section transmission can be tested, but more for the use of finding local deterioration of internal defects/damage.
Figure 4.5 The figure shows (a) the schematic model of the stress wave method and (b) the application of the Sylva®-test/microsecond timer on a stress-laminated deck (Ross et al., 1996).
A quite complicated model could be established if variable physical properties, such as early and late wood, orthotropy and defects, climatic effects like the MC and temperature would be taken into account. The one dimensional stress wave theory is adequate in the wave propagation in wood, where the transmission time and the density are related to the longitudinal stiffness, see Eq. (4.6). This was verified and compared to the static four-point test and good correlation was achieved (Zombori, 2001).
Eq. (4.6)
where is the density and the transmission time of the stress wave.
This testing method makes it possible to achieve results in a fast and simple way for individual specimens and does not require special preparation before usage (Zombori, 2001). More advanced testing for beam systems require more expensive software and the support conditions have to be changed to make it possible to investigate the structure on-site.
Here, Görlacher achieved a good result by making the longitudinal stress wave propagations independent of the support conditions and made it possible to check different parts of one in-situ component in order to determine the modulus of elasticity (Görlacher, 1991), see Figure 4.6. These small planks are used to induce the stress wave into the beams longitudinal fibre direction and the transmission times of the stress wave are adapted. Good agreement with high correlation factors (R2=0.8) was obtained compared with the static testing.
Furthermore, measuring of the transmission velocity can also be used in the evaluation of degradation of timber. It is reported that an increase of the velocity sound by 30% resulted in a loss of strength by about 50% (Ross et al., 2000). Strong correlation regarding those properties was already reported in the late 1980’s. The transverse velocity transmission is the most efficient way to detect decay.

CHALMERS, Civil and Environmental Engineering
15
Figure 4.6 A setup for in-situ stress wave measurements according to Görlacher which gave good agreement to the static in-situ testing (Görlacher, 1991).
4.1.3.2 Acoustic Ultrasonic (AU) method
The experience that wood emits noises can be discovered by piezoelectric transducers as used for the ultrasonic testing. The AU method is therefore a fusion of ultrasonic testing and acoustic emission and is used for the quantification of internal defects in wood (Zombori, 2001).
4.1.3.3 Pulse echo method
For the pulse echo method, access must just be guaranteed from one side of the component. The emitter and receiver are located next to each other and measure the speed reflection of the ultrasonic wave. The speed of the wave in order to reach the receiver is dependent on the grain direction the waves is propagated and the interface where the wave is reflected, i.e. due to defects in the wood, the opposite surface, knots etc. Defects smaller than about 15 mm cannot be detected, depending on the frequency of the ultrasonic wave. The main use of this method is the detection of internal defects in the material (Hasenstab et al., 2004).
The two latter methods give just examples of other types of ultrasonic test, but were not focused on at all at this stage since the aim was to investigate physical and mechanical properties.
4.2 NDT investigations using digital radiography (X-ray) Until recently, radiographic investigations has only been for qualitative assessment of timber structures in order to detect corroded areas, damaged connections, dowel’s/connection’s behaviour and areas with less density due to biodegradation. Since the application of digital imaging processing and increasing resolution quantitative assessment, such as internal deformations of fasteners, dimensions of hidden elements and strains, of components could be carried out (Kasal et al., 2008).

CHALMERS, Civil and Environmental Engineering
16
4.2.1 Theory of X-rays
X- and Gamma-rays are short wavelength electromagnetic radiations travelling at the speed of light. These rays are not affected by electromagnetic fields and can be diffracted but not deflected. The penetration of the rays is dependent on the density, type of material, the thickness and the radiation energy. X-rays are produced by electrons that impact the matter at high speed, where just a small fraction of energy is converted into short wavelength radiation. The rest turns into heat that must be removed from the system. The X-ray spectrum consist of a line spectra and continuous one, latter is in radiography produced by a fast deceleration of the electrons on impact. The energy can be calculated by Eq. (4.7).
Eq. (4.7)
where represents the energy, the Planck’s constant, the speed of light and the wavelength of the radiation.
An X-ray tube contains an anode and a cathode which emit electrons when heated to incandescence. Due to the tension between the anode, cathode and the matter, the electrons are accelerated whereby they generate X-rays. X-rays exit through a light element window (e.g. beryllium) that has low absorbancy. Penetration capabilities and intensity of the radiation are controlled by the electric potential (kV), the current (intensity, mA) of the X-ray tube and the exposure time. Emitted X-rays lose intensity which appears as lighter/darker in terms of greyscale values (RGB) in the imager. The intensity obeys an inverse square law, i.e. as the distance from the X-ray source is doubled, the intensity is reduced by a factor four (N.C.P.T.T., 2005). This intensity loss (attenuation) is described by the following natural logarithm equation
Eq. (4.8)
where represents the emergent intensity, the initial intensity, the material thickness and the linear absorption coefficient per mm thickness which is affected by the density.
In digital form, the image can be expressed as a matrix. Matlab® contains an image processing toolbox supporting this feature and can be used to quantify the investigated phenomena by simply counting pixels of different intensities and comparing their relative position.
There are several factors that influence the X-ray penetration through a material. Those are specified by the characteristics of the X-rays and their attenuation when coming in contact with the object.
The penetration is the intensity projection on the image plate and is governed by:
The type of material and the material characteristics The material composition The density of the material The porosity of the material and its moisture inclusion The attenuation factor (µ) The penetration thickness of the X-rayed object.

CHALMERS, Civil and Environmental Engineering
17
4.2.2 Radiographic equipment
The battery-powered portable X-ray source, Inspector XR200® from Golden Engineering Inc., was used for this study. However, other X-ray equipment can be used in situ. The generator produces pulsed short duration X-rays up to an energy level of 150 kV across the X-ray vacuum tube. The pulses (exposure dosage) can be set from 1-99. Both the distance to the object and the intensity level controlled by the pulses need to be adapted to obtain the right exposure level. The X-rays leave the tube at a 40-degree exit angle, which is decisive for the minimum distance to the specific object for maximum utilisation of the image plate.
The digital image plate system, DIMAP® from Logos Imaging Inc., was used to scan the photographic X-ray images. The laser scanner releases the accumulated energy from the image plate and stores the image at a selectable resolution on the laptop imaging software, where every single image can be post-processed for particular details.
Figure 4.7 Example of X-ray system and recording process.
4.2.3 Types of X-ray investigations
Radiographic investigations can be made through usage of X-ray densitometry, diffraction analysis, computer tomography (CT) and micro-tomography and are mainly used for the quantitative assessment of wood properties of different species, detection of deterioration and getting knowledge whether the element is sapwood or heartwood by means of researching the density profile. These differences can be detected through the attenuation of X-rays. (Tomazello et al., 2008) (Rinn et al., 1996).
4.2.4 Digital image processing and X-ray analysis
Depending on the material properties of the inspected object, energy absorption, chemical properties, density and thickness are reflected by the photographical image

CHALMERS, Civil and Environmental Engineering
18
(Anthony, 2003). Anthony also investigated termite activity by means of infrared thermography and acoustic non-destructive methods, but without satisfying success to quantify the loss of material (Anthony, 2003). Through comparison of the measured intensities on a radiograph the extent of deterioration in wood members could be quantified using imaging processing techniques (Anthony, 2003, N.C.P.T.T., 2005).
Kasal et al. discusses the recent advances in non-destructive techniques in order to determine the mechanical properties of the material (Kasal et al., 2004). The most useful feature is the ability to post-process the X-ray image by zooming in and changing contrast, brightness or position. The primary benefit in the usage of X-rays is the possibility to determine the condition of structures on-site without disturbance. Another advantage is the ability of gaining precise dimensions by measuring the distances between the X-ray source, the imager and the object of interest. Further advantages are the ability to identify the physical condition of wood, checking the structural examination of the building pattern, identify the types of connection such as nails, bolts etc. and to identify the construction details for historical dating (N.C.P.T.T., 2005). Among all those advantages some difficulties appear, especially in the crack identification that requires an adequate size of at least 2% of the member thickness and must be oriented parallel to the radiation to be detected (Lear, 2005). Member arrangement can also cause problems for positioning of the source of imaging plates as well as for the interpretation of the images. Limitation on the intensity or energy level can also limit the investigation (Lear, 2005).
Real-time radiography (radioscopy) allows the study of component behaviour under moderate loading, particularly suitable for timber structures due to the density differences. Disadvantage of image processing is that the 3D-object is reproduced as a 2D-image. These differences in density cause a differential attenuation of the emitted photons. It also has to be considered that the density data produced by the image represents the average density of the member through the thickness, which makes the evaluation of radiographic elements difficult (Lear, 2005). The development of algorithms gave engineers the opportunity to achieve the required information in real time (Kasal et al., 2008) and also creates an opportunity to derive the correlation between greyscale and material density.
It is of importance to minimize the distance between the object and the imager as it approaches its actual size and increases the sharpness of the image. Contrast production is another important point depending on the exposure of the object as well as on the optimum number of pulses (6 to 24) of the described radiographic equipment, depending on the thickness of the element (N.C.P.T.T., 2005).
Several different imaging scanners are described in (N.C.P.T.T., 2005), as well as some short descriptive techniques for interpretation of deteriorated wood and some manipulation techniques by the means of digital image enhancement with commercial image software, e.g. Adobe® Photoshop®. This image enhancement was then used to quantify the degree of deterioration using the histogram function in Adobe® that identifies the range of grey tones in a radiograph by graphing the number of pixels at each grey colour intensity. The advantage of this function is that it displays the histogram of the entire radiograph. There was an excellent correlation between the mean value from the grey tones of the histogram function and the percentage of the remaining cross section at each pulse level. Another result of using this function was that the number of pulses did not affect the loss of the section in a timber as long as the ratios are used rather than raw values (N.C.P.T.T., 2005).

CHALMERS, Civil and Environmental Engineering
19
Another X-ray technique that has been tested but which has not succeeded yet is the 3D-analysis of photogrammetric images (stereo-optics, 3D-Radioscopy), whereby varying density can be distinguished through both stereo-optics and algorithmic modelling. Using two radiographs 2 images are produced. Those images can in a further step be used to identify dimensions and distances of the internal components in the structure using operations from vector algebra (N.C.P.T.T., 2005). Derivation procedures for the determination of dimensions and distances can be found in N.C.P.T.T. (N.C.P.T.T., 2005). The 3D-analysis of radiograph images has not yet reached a breakthrough, but researchers state that the mathematics for it is known for the development of computer algorithms to convert those images into coordinate models. Before, a research of the potential benefits for the development of such a software has to be analysed (2005).
4.2.4.1 X-ray image evaluation procedure used in Paper I & II
Due to the cone beam effect of the portable X-ray equipment, where the dosages of the image were not evenly spread in the raw X-ray image, image corrections using imaging software, e.g. ImageJ®, are of great advantage in digital images, where the relevant attenuation ratio I/I0 are measured, where I is the intensity of the X-ray beam after penetration of the sample and I0 the initial intensity. The ration can then be calculated as an average value over the complete energy spectrum according to Eq. (4.9), (Badel et al., 2002).
Eq. (4.9)
where λ is the wavelength, µm(λ) the absorption coefficient, ρ the density and x the sample thickness.
In order to correct the defaults/noise level of the raw image (IR) several small steps must be applied to evaluate the noise level and subtract it from the complementary background image (IB) without illumination. A further image with X-ray illumination (IF) accounting for the non-uniformity of the cone beam effect to reach the final pixel grey value according to Eq. (4.10), (Badel et al., 2002).
Eq. (4.10)
where (i,j) are the coordinates and the attenuation ratios ranges from 0 to 1 (full to no attenuation).
From a micro-level point of view, extreme values can be deleted through median filters in the image evaluation software, but was not of relevancy in this project.
This image correction procedure is illustrated in Figure 4.8.

CHALMERS, Civil and Environmental Engineering
20
Figure 4.8 The principal procedure for image background correction due to the cone beam effect, (a) according to Badel et al. 2002 on micro-level and (b) an example from the correction procedure from Paper I & II.
4.2.5 Applications of X-ray investigations
An overview on possible applications using X-ray equipment for the evaluation of timber structures is presented in this chapter. X-ray equipment has already, to some extent, been used for investigation purposes and some results have been published in scientific contexts. The opportunities for X-ray investigation has until recently been used for qualitative assessment of timber structures, but the opportunities to carry out quantitative evaluation are of great importance. There are a number of applications revised in this work for using X-ray equipment on site that can be useful for the evaluation of structural behaviour.
The opportunities to achieve dimensions of non-visible fasteners or cross section reductions as well as connection of joints that are decisive for the judgement of boundary conditions give great opportunities for further interpretation in the structural analysis (N.C.P.T.T., 2005).
Detection of corroded area
Since corrosion in metal fasteners might cause severe failure, radiographic equipment as a tool can be used to detect corrosion inside the structure which through appropriate action can prevent collapse of the structure (Anthony, 2003). Using commercial image editing programs, distances can be measured quite accurately towards some reference unit and the actual capacity of the fastener can be recalculated. Figure 4.9 shows a corroded nail as a result of a shrinkage crack in timber.
Figure 4.9 Deterioration of the metal fastener due to corrosion in the shrinkage crack of the beam.

CHALMERS, Civil and Environmental Engineering
21
Reduction of cross-section
Old timber might have lost its full capacity due to deterioration either by insect attacks or due to shrinking cracks (Brozovsky et al., 2008). When accessibility with X-ray camera along fibre direction is guaranteed, a prediction of the maximum allowable stresses at a specific point might be defined with a reduced cross section before any strengthening or remedial work is carried out.
‘Timber-to-timber’ hidden geometry
While it is obvious that hidden metal details in a timber structure can be assessed with the use of X-ray, it does not necessarily mean that hidden timber parts can be visualized with satisfactory accuracy. As part of the current investigation, a preliminary study has been carried out showing promising results in this field, cf. Figure 4.10.
Figure 4.10 A hidden dowel with approximately the same density as the surrounding wood can be detected with the use of X-ray. Original X-ray image (top left corner) vs. edited image. The numbers correspond to the mean density through the thickness of the beam at different positions.
Density distribution in components
Through development of the equipment and the methods of digital image analysis it has been possible to determine variations of apparent density values and distribution in timber and wood composites. These differences can be detected through the attenuation of X-rays passing through the material (Tomazello et al., 2008, Chen et al., 2009).
Determination of material properties through image calibration
X-rays are already in use today by means to determine material properties and to strength grade timber. The currently used methods are not suitable for in-situ assessment and are out of the scope for this article.
Nevertheless, in-situ methods to determine material properties most likely exist for materials with great homogeneity such as steel (Bateni et al., 2008). As timber is a material of great variation these methods cannot be applied without further reflection.
There exists an accepted relation between density and strength and stiffness properties in timber (Dinwoodie, 2000). As shown in this thesis, the X-ray images of beams and at joints can be calibrated in a further step towards its density by a calibration procedure.

CHALMERS, Civil and Environmental Engineering
22
Mapping damage and deterioration
Since the most of the portable X-ray equipment deliver images in a two-dimensional perspective, additional help by a Resistograph® might be needed for a volumetric mapping of deterioration by insect attacks. In many cases, a two dimensional picture is satisfying for determining the severeness and progress of the invisible damage (Rinn et al., 1996, Lear, 2005), as decay due to rot and high moisture content can be seen in Figure 3 and be determined by measuring the area of the void (dark area).
Figure 4.11 shows a simulated termite attack that makes the determination of a cross section loss possible through image enhancement, whereas on the other hand decay does not leave an abrupt change in wood and makes the detection of gradual transition for cross section loss problematic.
Figure 4.11 Simulated deterioration that caused loss of cross section results in an deviation of the greyscale on the X-ray image (N.C.P.T.T., 2005).
Failure modes in metal fasteners
In-situ X-ray imaging also provides the opportunity to determine the actual behaviour of dowels in joints, see Figure 4.12 (Anthony, 2003). Moreover, the exact position of the plastic hinges can be determined.
Figure 4.12 The X-ray images show the behaviour of a nailed joint (left) and a bolted connection (right) (N.C.P.T.T., 2005).
4.3 Static test of locally loaded part of a restrained member In order to carry out a reliable research on old timber structures from a safety viewpoint, the actual capacity of the members have to be tested. That can be done either by dynamic testing methods, e.g. ultrasonic testing or static testing. Here a method is presented that Görlacher (Görlacher, 1991) has developed in order to be able to assess the bearing capacity in terms of the E-modulus on site. Relatively high correlation coefficients can be expected (0.7-0.8) (Görlacher, 1991). The following

CHALMERS, Civil and Environmental Engineering
23
principal in-situ test set up is presented in Figure 4.13. Since the simply-supported condition in-situ is not guaranteed, the relative deformation of the component has to be determined to compensate for the deformations due to support conditions. Hereby, the load has to be applied in the central part of the distance, which is the distance of the relative deformation. Furthermore, a deflectometer has to be placed below the centre of the load to measure the actual deflection due to loading. The theoretical expression plus a correction factor for the non-conformity to the measuring needs to be taken into account to obtain the flexural stiffness parameter, see Eq. (4.11).
Eq. (4.11)
where is the relative deformation, the load force, the ratio between the MOE and shear modulus for the wood species in question, the beam span, the distances from the supports to the load force, the measured distance for the relative deformation, the height of the beam and the shape factor.
Figure 4.13 The setup in principal for the static testing of an in-situ component and its theoretical background (assumption).
4.4 Determination of material properties by SDT methods
4.4.1 Hardness test
Hardness refers to various properties of solid materials that give them high surface resistance to various kinds of shape change when force is applied. There exists 3 principal operational definitions of hardness (Riggio et al., 2008):
Indentation hardness, which is the resistance to plastic deformation due to constant load
Rebound hardness, which is the height of the bounce of an object that is dropped onto the material and which is related to elasticity
Scratch hardness that is characterized to the resistance to fracture or plastic deformation due to friction from a sharp object.
The mechanical properties have so far been characterized using the technique of indentation hardness due to its simplicity and speed of carrying out the test. It is also this method that is used for further introduction. The properties describe the deformation of the volume beneath the indenter. The deformation modes are described by MOE, relaxation modulus, hardness creep and fracture toughness (Riggio et al., 2008).
The result of the hardness tests differ regarding the shape and size of the indenter and according to the measured parameter. So, there are different parameters that describe

CHALMERS, Civil and Environmental Engineering
24
the hardness with the indentation test by mean what has been measured, e.g. Brinell-hardness, Meyer-hardness, Monnin-hardness, Janka-hardness, end-hardness, side-hardness, Piazza-Turrini-hardness etc., but can also be based on dynamic indentation which is primary used for the detection of decay. A decreasingly difference in hardness has been found between the cross- and side-sections with increasing density by Mörath (in 1932) (Riggio et al., 2008).
The Janka-hardness test is certified in the American Standards, ASTM D-143, see Figure 4.14. An empirical relation of the hardness of 280 wood species was found, see Eq. (4.12). Their validity is based on clear wood and certain moisture content (Riggio et al., 2008).
[kp/cm2] Eq. (4.12)
where is the hardness according to Janka and the crushing strength.
This empirical hardness relation was in a further step related to the ultimate compressive strength (UCS) of wood and the modulus of rupture (MOR), see Eq. (4.13) and Eq. (4.14) respectively. The accuracy of the MOR is very indefinite and therefore useless in its application of grading structural timber (Riggio et al., 2008).
[lb/in2] Eq. (4.13)
[lb/in2] Eq. (4.14)
Janka also provided a relation of describing the hardness by the means of density ( ) and different constants (A,n) depending whether it is softwood or hardwood with a certain MC, see Eq. (4.15) (Riggio et al., 2008).
[kp/cm2] Eq. (4.15)
Figure 4.14 Historical equipment of the Janka-hardness test according to ASTM D-143 (Riggio et al., 2008).
The Brinell-hardness (HB) is related to the maximum load (P), the diameter of the steel ball (D) and the diameter of impression (d), see Eq. (4.16). This relation can also be expressed in terms of oven-dry density ( ), Eq. (4.17) with specific constants (a,b) depending on the end- or side hardness (Riggio et al., 2008).

CHALMERS, Civil and Environmental Engineering
25
[kp/cm2] Eq. (4.16)
[kp/cm2] Eq. (4.17)
The Monnin-hardness (HM) is derived from the relation of the penetration depth (t) of a 30 mm steel cylinder and the width of the impression of the cylinder on a radial section (l) with a maximum load of 2 kN that is reached over a period of 5 seconds, see Eq. (4.18) and Figure 4.15 (Riggio et al., 2008). It is used for high density timbers since the Janka tool induces splitting the more brittle the material gets. The accuracy of these measurements exceeds a greater error than Janka’s hardness test.
[1/mm], Eq. (4.18)
Figure 4.15 Monnin-hardness test (Riggio et al., 2008).
The Piazza-Turrini hardness test is intended for on-site assessment of structural timber. Their hardness test is based on the mechanical characterization of tensile and bending timber components (Riggio et al., 2008), which can be of great importance when setting the properties into a global perspective. This test is a modified Janka test that measures the load force (P) required to embed a 10 mm hemispherical steel bit to 5 mm, see Figure 4.16. The load force must be achieved by averaging the test results made on the longitudinal faces of the element. Each test consists of 5 measurements taken in a limited portion of the element. The result is the three median values of the 5 measurements of the longitudinal faces. The test surface is not permitted to have any visible defects. The Piazza-Turrini test related the MOE to the hardness, see Eq. (4.19) (Riggio et al., 2008) and gave interesting correlation of 0.62 in the mechanical evaluation of the MOE on two king-post trusses (Branco et al., 2008).
. [MPa], Eq. (4.19)
where is the load force, the reduction factor according to the size of measured and visible defects, the constant depending on the wood species and the adjustment factor for the actual MC related to MC15%.

CHALMERS, Civil and Environmental Engineering
26
Figure 4.16 Piazza-Turrini-hardness test setup (Riggio et al., 2008).
In conclusion, hardness test involves compression and shear strength as well as fracture toughness. The results are influenced by friction and cleavage. The correlated properties should be dependent on the hardness test itself and the way wood failure is induced. Common problems that occur are the measurement of the impression. Changes in the hardness for MC-values between 6-20% may be estimated according to some formula published by the FPL (Forest Products Laboratories), see (Riggio et al., 2008).
4.4.2 Core drilling
This technique has been used to establish some physical properties of the wood such as compressive strength and modulus of elasticity (MOE). The correlation for the core in compression varies between 0.77-0.96 depending on the species. The E-modulus can be derived from the load deformation curve. The slope of the load-deformation curve of the compressed specimen according to the ASTM gives a correlation coefficient of 0.76 when related to the E-modulus.
The equipment is set up of manual drill or battery powered electrical drill for the extraction of core samples, as well as testing device according to Figure 4.17. The inner diameter of the circular hollow drills should be less than 5 mm to avoid impact on the cross section capacity.
Other uses are the determination of density and age of the tree (Kasal et al., 2004), but it is also possible to achieve density profiles and to detect degradation. Voids from drilling should be plugged in order to avoid moisture and insects from penetrating the wood (Lear, 2005). Large numbers of samples may be required in order to achieve a certain degree of reliability.
A modified drill equipment (not shown here) allows the testing of core samples of glue laminated timber. This device is used in the evaluation of the shear capacity in the glue line (Gaspar et al., 2008) and has its application in glulam structures such as bridges and trusses.

CHALMERS, Civil and Environmental Engineering
27
Figure 4.17 Schematic testing device and mechanical equipment for core drilling samples (Kasal, 2003, Lear, 2005).
4.4.3 Pilodyn® test (Pin driving)
Wood density is of great importance when evaluating timber quality. The density shows high correlation to the strength and stiffness of timber, especially the compression strength (Görlacher, 1987, Dinwoodie, 2000).
The Pilodyn® method uses a steel pin of a fixed diameter (normally 2.5 mm) driven into the material by a dynamic force, see Figure 4.18. The density is then related by a regression function related to the penetration depth. The penetration depth varies up to about 40 mm. The correlation between the penetration depth and the density varied between 0.74-0.92, depending on the species and the number of measurements (Görlacher, 1987). The measurement should be adjusted to wood moisture content (MC) of 12% (Görlacher, 1987, Kasal et al., 2004, Drdácký et al., 2007). Görlacher (Görlacher et al., 1990) states that the penetration resistance gives reliable results for the surface area.
Figure 4.18 Pilodyn® dynamic indentor (Brozovsky et al., 2008).
4.4.4 Resistance drilling
This method is for the detection and quantification of internal decomposition in timber structures. The local detection of the internal defects due to fungi can be found by sounding (Görlacher et al., 1990), but the use of ultrasound procedures is more appropriate for detection of internal defects.
The use of that small diameter needle-like drill, known as the Resistograph® cf. Figure 4.19, was introduced by Rinn (Kasal et al., 2004). The drilling resistance is proportional to the relative variations in density, i.e. that decreasing drilling resistance is followed by decreased torque of the drill. Therefore, areas that need less torque are associated with reduced density, e.g. deteriorated parts in timber, cracks, etc. (Lear, 2005). A Resistance Measure (RM) parameter was implemented that allowed the comparison between the density of the drilling resistance and mechanical and physical

CHALMERS, Civil and Environmental Engineering
28
properties of the timber. The RM parameter is though defined as the integral of the area of the drilling diagram divided by the length of the drilled perforation (Lourenço et al., 2007).
Figure 4.19 Resistograph®.
This method is used to a great extent in the quantification of deteriorated timber. Relatively high correlation between the drilling resistance and the density has been found by some researchers (e.g. Görlacher (Görlacher et al., 1990)), though the variation differed. Ceraldi et al. reported good correlation between the transversal axial compressive strength and the density measured by the Resistograph® (Ceraldi et al., 2001). Lourenço and Feio et al. reported also medium up to higher correlations between strength parameters and the RM (Feio et al., 2005, Lourenço et al., 2007), but it should be considered that the resistance drilling technique has not yet given adequate correlation for structures tested in-situ (Kasal et al., 2004). Several factors such as moisture content and tree species together with its very local measurement character might influence the results. Therefore, the results should be somewhat questionable.
Another great advantage of this method is the possibility of the assessment of the internal condition of hidden parts and it is very useful in the assessment of the condition of mechanical connections.
4.5 Screw-withdrawal resistance The screw withdrawal resistance test is a useful test for the detection of surface damage, but gives also a high correlation to the density of timber. Furthermore, there exists also good agreement with the shear modulus of timber since this test is of pure shear type (Magnus, 2008). Hereby, a screw with a given length and diameter is driven into the tested object before pulled out, see Figure 4.20. The maximum applied force hereby is recorded.

CHALMERS, Civil and Environmental Engineering
29
Figure 4.20 Screw withdrawal resistance test (Divós et al., 2001).
4.6 Additional assessment techniques Among those different testing techniques, there exist further techniques for the condition assessment of structures. Those are not treated and not to be found relevant in this study to evaluate quantitative material properties in-situ.
Those listed assessment techniques are as following:
Thermography Videoscopy Optical scanning Acoustic emission (AE) Ultrasonic pulse-echo

CHALMERS, Civil and Environmental Engineering
30
4.7 On the choice of NDT/SDT methods In the case for structures with large restrictions in the access of material to test many specimens makes the predictions of material parameters more difficult. The available methods might raise differences in the test results, depending on the specific test method that has been used. Therefore, a combination of both semi-destructive and non-destructive methods might gain higher accuracy in the prediction of mechanical and physical parameters.
However, the uses of NDT/SDT methods are highly valuable support tools for the diagnosis and the control of intervention work in the on-site assessment of structures.
It is important to conclude that due to the size and complexity of the material structure, an efficient global strategy for the in-situ assessment of the material properties should be established, i.e. a fast and as easy procedure to scan the global parameters and to analyze the critical sections. The first scan shall then be documented accurately to decide for further investigations of the critical sections.
The most appropriate methods to determine the in-situ density of the material proposed is the density calibration procedure using X-ray equipment which showed good agreement between the greyscale and the density of the evaluated timber specimens. Complementary measurements might be carried out with the Resistograph® (drilling resistance) in order to verify the accuracy.
In combination with the determination of the density, ultrasonic measurements are of great interest to determine and to map the E-modulus of the load-bearing capacity of the structure. The stress-wave techniques for the determination of the E-modulus are mainly governed by the speed of the wave propagation which is though dependent on the density of the material, the internal condition of the timber, but also the moisture content. Herefore, tables for the transmission time exist for different wood species (Ross et al., 2000), but for special cases like the Vasa ship structure with special material characteristics expected values have to be tested before on-site. Furthermore, the speed of propagation has large influence on the strength properties, especially when the speed of sound decreases. The achieved values for the E-modulus should therefore be verified with additional static tests. The stress wave techniques are also appropriate in the determination of internal condition of the timber.
Hardness tests also have good correlations with the density, but also with compressive strength and E-modulus. The fact that the results are based on the surface hardness, this test might not be appropriate in the assessment of structures with damaged, degraded or softened surfaces due to chemical treatments.
All additional NDT/SDT are expected to be less efficient for the global survey of the material, strength and stiffness properties and should therefore be treated as complementary tests to locally determine and verify properties where unclear problems were obtained.

CHALMERS, Civil and Environmental Engineering
31
5 Assessment of in-situ density in timber using X-ray equipment [Paper I]
In order to evaluate and analyse historical wooden structures from a structural viewpoint, knowledge of the “real” strength and stiffness of the timber is needed. Assessment based on the visual grading of timber in situ often provides unrealistic values for mechanical properties. This includes the visual inspection of each member, the identification of the species and the quantitative determination of material properties using very local “non-destructive” testing, such as core or resistance drilling.
As a result, material parameters using non-destructive testing are studied in this paper as the first step in the holistic evaluation process. Wood density has a strong relationship with a number of mechanical properties and can therefore be used in the evaluation of timber structures (Dinwoodie, 2000). Mechanical parameter such as the modulus of elasticity (MOE) has a good correlation with density and bending strength (MOR). Furthermore, local density is the key parameter when it comes to determining the embedment strength of mechanical timber connections (CEN, 2004).
An appropriate, completely non-destructive method for evaluating the in-situ density in timber structures is the use of X-ray. The evaluation of structures using X-ray measurements should be accompanied by other global non-destructive techniques, such as ultrasonic measurements and stress wave techniques. A portable X-ray tool is able both to identify damage, defects, cracks and deterioration in members and to produce a better prediction of mean density.
The aim of Paper I was to determine the relationship between the measured density of the wooden test specimens and the greyscale obtained from radiographic images since variations in density appear as differences in grey nuances. Furthermore, the opportunity for generating absolute in-situ density values from X-ray images were explored as well as the influence of thickness and moisture content on X-ray images.
Therefore, a procedure for determining the in-situ density in timber structures of all kinds is proposed, where the local variation in density in timber components can be reflected using photographic imaging.
5.1 Calibration procedure The in-situ procedure was developed and divided into four phases which are described in Paper I, Section 3 (Kruglowa et al., 2012).
1) Relationship between greyscale and density
2) Influence of material thickness on the greyscale of the image
3) Influence of moisture content on the greyscale of the image
4) Calculation of a corrected value for greyscale

CHALMERS, Civil and Environmental Engineering
32
5.1.1 Experimental procedure
In the first phase of this study, a relationship between greyscale [RGB] and density (ρ) was established. To verify density using X-ray equipment, 14 wood specimens with dimensions b x h x t = 64 x 94 x 30 [in mm] were prepared, weighed and X-ray scanned. Since the imager does not recognise the material, it is only the density of the material that is of importance. To predict stiffness and strength properties, a calibration of the wood specimens to air-dried density conditions (MC 12%) was therefore performed. Different image configurations were used to explore how the output of the X-ray image was affected by the position due to the cone beam effect that causes non-uniform background noise. To provide a large variation in density, various wood species with significant differences in density, ranging from about 390 to 800 kg/m3, were used; see Paper I, Table 1.
The second phase of the procedure was the correlation between the pixel intensity and the thickness of the member. This relationship was examined using 6 built-up plastic blocks with decreasing thickness and with significant differences in density, ranging from 300 to 800 kg/m3 see Paper I, Figure 6. The solid plastic blocks were chosen to avoid the sensitivity of density variations that exist in timber. A correction factor (ΔRGB) for the thickness-calibrated images was established for different density ranges, due to influence of the attenuation of the intensity of radiation energy through the thickness of the member according to Beer’s law.
The third phase involved correlating the moisture content in the specimens to the greyscale of the X-ray images. This was achieved by re-using the 14 test specimens and storing them in separate conditioned climate boxes at five different relative humidity (RH) levels. The moisture levels of the specimens were related to the greyscale of the image as a correction factor for the mean greyscale (μmean) due to the scatter of the greyscale between different moisture levels. The correction factor for moisture (ΔμMC) refers to the moisture content defined as air-dried density (MC 12%), i.e. an RH of ~66%.
As a final step, following the procedure above, the corrected mean greyscale value (μmean_corr) could be calculated according to Eq. (5.1) and inserted in the trend-line equation from the evaluated X-ray image of the calibration wedge. The trend-line coefficient of determination (R2) should achieve a value of at least 0.90 to obtain very good agreement.
μmean_corr = μmean + (ΔμMC) + ΔRGB Eq. (5.1)
The images were evaluated using digital image processing software and the results were plotted in graphs representing the actual density, moisture content and thickness of the specimens on their axes.
5.2 Results
5.2.1 In-situ density
X-ray images of the different evaluated image configurations and their associated graphic results are presented in Figure 5.1. The results of calibrating/predicting the density using X-ray radiation showed strong relationships between the densities of the test specimens and the greyscale of the recorded X-ray image. The relationship

CHALMERS, Civil and Environmental Engineering
33
provided excellent linear correlation that is valid up to a level of 1000-1200 kg/m3. The correlation values (R2) varied between 0.90-0.98.
Figure 5.1 Examples of results from the experimental procedure show the relationship between density and the mean greyscale of the marked area. The numbers in in the images represent the types of wood specimen, see Paper I, Table 1.
5.2.2 Influence of thickness
The procedure was also calibrated for the thickness variation of the in-situ specimen and the distance of the wedge in relation to the image plate. This might be insignificant for small differences in thickness between the calibration specimen and the X-rayed object, but it has a considerable effect on components with large depths. This relationship between greyscale and different thicknesses had to be calibrated for in field investigations.
The correction factor (ΔRGB) for the thickness-calibrated images was defined as the difference between the greyscale of a certain thickness and a reference thickness, which, in this study, was referred to 30 millimetres, i.e. the same thickness as the calibration wedge. The coefficients of determination (R2) between the greyscale values and the thickness of the built-up specimens were in the range of 0.93 and 0.99, which was regarded as a satisfactory result for the correction due to the influence of thickness, Figure 5.2(a). These correlation curves were used to establish the correction factor (ΔRGB) for different density ranges, see Figure 5.2(b).

CHALMERS, Civil and Environmental Engineering
34
Figure 5.2 (a) Example of result from thickness calibration presented as coefficient of determination (R²) and (b) correction factor (∆RGB) for different ranges of density referred to a reference thickness of 30 mm.
5.2.3 Effect of moisture content
The influence of the moisture content and the surrounding climate is illustrated in Figure 5.3. A clear tendency could be seen from the analysis between the mean greyscale and different equilibrium conditions of the specimens expressed in relative humidity (RH) within the species.
Figure 5.3 Examples of results from the differences in greyscale due to the influence of different moisture conditions.
Even though the influence of the moisture on the X-ray images was slight, it could not be ignored, especially when the moisture content was above 16% and/or below 10%. Defining a scatter to determine whether or not to increase/correct the measured mean greyscale value was problematic. The spread between the minimum and maximum values for greyscale (ΔμMC) within one species lay between 14 and 35 [RGB]. The calculated mean difference (Δmean_μMC) was ~20, which related to a reference

CHALMERS, Civil and Environmental Engineering
35
equilibrium RH condition (~12% MC). This means that, depending on the RH/MC in the X-rayed object, the captured mean greyscale value should be corrected according to Table 5.1.
Table 5.1 Change in ∆µMC [RGB] on the image due to the influence of different moisture conditions in timber.
The standard deviation of the method could reach a range of ±5 [RGB], which means that, for an MC range of ±4% from the reference value, the influence of moisture can be neglected.
5.3 Summary The in-situ density measurement assessment was applied and verified on two timber specimens of different thickness. An average accuracy of ~97% could be established from this study and this has to be regarded as very satisfactory and successful for the use in in-situ assessments.

CHALMERS, Civil and Environmental Engineering
36
6 Density property prediction and the complexity of the in-situ evaluation of the Vasa warship for future structural assessment [Paper II]
The Vasa warship is one of the most important national treasures of Sweden. After launching the Stockholm harbour in 1628, the warship experienced difficulties in its stability and manoeuvrability and sank on her maiden voyage. In 1956, the beauty of the Swedish navy was located on the seabed, before the ship was raised in 1961. It was at that point that the resurrection of the warship began. Since 1990, the warship is exhibited for public visits in the Vasa Museum.
In order to maintain the integrity of the Vasa warship, conservation treatment was carried out during a period of 17 years after salvage (Håfors, 1989, Håfors, 2010). Conservation was performed using PEG (Poly Ethylene Glycol) treatment, which prevented the warship from serious shrinkage and distortion that would have caused collapse of the cell walls. However, a certain level of physical and chemical modifications and degradation occurred (Capretti et al., 2008, Bjurhager, 2011).
The degradation processes have diminishing effects on the strength and stiffness of the ship structure, such as decreasing bearing capacity, loss of cross sectional area and global deformations which has been stated by several different authors (Schniewind, 1990, Ljungdahl et al., 2006, Bjurhager et al., 2010).
During the last 10 years, the focus was on the mechanical properties of Vasa oak and the influence of PEG penetration in oak, especially the compression strength in radial direction, the tensile strength and the stiffness of PEG impregnated oak samples in longitudinal direction (Ljungdahl et al., 2006, Bjurhager et al., 2010), but no final decisions were made on whether to strengthen or how to support the structure. For detailed information on the problem areas of general nature for the Vasa warship see Paper II, Section 3.
Since density has a significant relationship with the mechanical properties of timber and the non-destructive parameters often relate to density, the main aim of the paper was to focus on the in-situ assessment methodology of the mechanical properties and to compare the applicability of property prediction through non-destructive and semi-destructive testing. Portable X-ray equipment was used in this study to explore the opportunities of identifying structural details due to the thickness of the structural members and the high density of the Vasa oak. The aim was to achieve accurate density measurements on-site that are valuable for model updating purposes, to obtain the relative stiffness parameters and to study the influence of PEG treatment on the mechanical and physical properties through cross correlations to the density.
Furthermore, the paper includes sub-aims that emphasises the problem areas in the warship from a structural viewpoint which is of importance for future decisions and to keep the holistic approach in mind. The sub-aims mainly include a literature review of the mechanical properties that have been documented so far with respect to the Vasa oak, a methodology for in-situ assessment of the Vasa warship and a suggestion of an appropriate hydraulic support system regarding the distribution of the loads from the hull structure to the ship cradle and the keel.
This chapter only gives an overview of the testing results and on the background. The sub-aims are referred to Paper II and are not treated in this chapter. The methodology of in-situ assessment has already been introduced in Chapter 2 as well as the

CHALMERS, Civil and Environmental Engineering
37
mechanical properties of waterlogged wood and the influence of conservation treatment in Chapter 3. Furthermore, the evaluation of different NDT and SDT techniques was treated separately in Chapter 4.
6.1 Experimental procedure In this study, the opportunity to explore the average density/mass properties of on-site of the Vasa warship was investigated using an X-ray density calibration procedure according to Kruglowa (Kruglowa et al., 2012). Furthermore, laboratory tests were carried out on a limited amount of samples from the Vasa warship. One sample comes from a planking board at starboard side (ID 65742) and the other one from port side (ID 65743). Those samples were cut into 16 (ID 65742) and 12 (ID 65743) cubes respectively with a size 26x26x26 mm3, see Figure 6.1.
Figure 6.1 Preparation of testing samples from the Vasa warship, 16 pieces from the planking board at starboard side on the left (ID 65742) and 12 pieces from the port side on the right (ID 65743) were included in this study.
10 reference specimens of fresh oak with the same size were also included in this study to study the trend and tendency of the density and material properties. The density of the Vasa oak samples ranged between 800 and 1000 kg/m3 and for the reference specimens between 650 and 690 kg/m3. The cubes were tested in the elastic range of the material in compression in all directions, longitudinal (L), radial (R) and tangential (T) using an Instron® measurement device to log the load-deformation. The outcome of load-deformation-curve was presented as relative stiffness in each direction, due to limitations in the evaluation possibilities at the time for the experiments. Since the strain, due to imperfections and the important role the testing equipment had played, the stiffness, which is calculated as the slope of the linear part of the stress-strain curve, is underestimated The relative stiffness is a function mainly depending on the size of the sample, the volume effect, the applied load and its deformation and describes only the relation of the differences from the results between the reference specimens and the Vasa specimens. The samples were also X-rayed using the calibration procedure (Kruglowa et al., 2012) to perceive a relation between the measured relative stiffness and the X-rayed density properties.
Furthermore, a PEG extraction using quantitative one-dimensional NMR-spectroscopy (nuclear magnetic resonance) from 8 samples, 4 from each block ID65742 and ID65743 respectively, was carried out at the Swedish University of

CHALMERS, Civil and Environmental Engineering
38
Agricultural Sciences. The PEG content was then related to the stiffness and density properties of the Vasa oak, see Paper II.
6.2 Evaluation of the relationship between density and the stiffness – testing on clear wood specimens
The evaluation of density properties with the portable low energy X-ray generator (XR200®) was more sensitive to clear wood specimens than in the final evaluation of the on-site assessment of structural beams that were of large size. This might be also due to the distribution of PEG content which in clear wood specimens are more concentrated than in the structural beams. The tendency of overestimation of the density properties and the variation of the results were mainly referred to the PEG content as an unknown parameter which influences the attenuation of the X-rays.
Furthermore, X-ray images give output of mean intensity levels through the thickness, which minimizes the influence of PEG in the evaluation of the structural elements. Since the PEG content is concentrated more to the surface of the wood in Vasa, erroneous influence of PEG on the measurements is expected to be lower in the evaluation of the structural elements, since these mainly consists of a kernel with lower PEG content. Another aspect regarding the PEG is that the critical parts were more exposed to degradation of any kind and were more heavily PEG-treated than other structural components, which also contributes to a large variation of the results. Large variability of the properties might be expected due to the complexity of the structure.
To relate the relative stiffness parameters to the measured absolute density properties was not successful. A tendency could be seen that the increase in density was followed by a decrease and loss of stiffness, but the correlation was weak. On the other hand, the increase in density comes from the chemical treatment for stabilization purposes of the ship structure. Due to the PEG concentrations, the material hardness is softened, which reduces the load carrying capacity. Moreover, it decreases the compressive strength (Ljungdahl et al., 2007) in all directions tremendously, but in principal in the radial and tangential direction. The relative stiffness is a function mainly depending on the size of the sample, the volume effect, the applied load and its deformation and describes only the relationship and differences in the results between the reference specimens and the Vasa specimens.
In order to relate the density to the stiffness, the PEG content might be taken into account as a third parameter which could be shown in that study, where the PEG content increased the cross-correlations between density and the stiffness. Normally, there exist a very good positive correlation between the density and the stiffness of clear wood specimens of any type (Kollmann et al., 1968, Dinwoodie, 2000), i.e. the regression line for the stiffness inclines with increasing density. In the case of the Vasa warship, the opposite happens, that the increasing density result in reduction of the relative stiffness. This can be referred to the PEG content and the loss of wood substance during the centuries in the waterlogged condition, which can actually be treated as decrease in density and a chemical decomposition of the wood structure. A further reason for the low correlation can be denoted to the small range in density differences from the Vasa oak.
Therefore, a good method to predict the stiffness of the structural components of the Vasa warship would be to use the non-destructive measurements for the density

CHALMERS, Civil and Environmental Engineering
39
properties using X-ray in combination with ultrasonic measurements. This combination, but also in combination with the resistance drill and the surface hardness, might be a powerful method to assess the structure in a global survey.
6.2.1 Results from the density determination using X-ray
The correlation between the measured and the X-rayed density of the tested specimens, both Vasa oak and reference specimens, were established. The correlation of the density was 0.85. The results show a slight overestimation of the density properties of both the Vasa oak and the reference specimens see Paper II, Section 4. The mean value of the ratio between the X-rayed density and the measured density for the Vasa specimens was 1.073 (0.073), using the two methods. The X-ray equipment is well-suited for estimation of the density, but the results in this study were not statistically significant. As compared to the density results measured by the conventional method, the X-ray technique seems to give a slight overestimation for both the Vasa oak and the reference specimens. This might be due to the PEG content, but also to a small extent to the uncertainty of the sensitivity of the portable low energy level X-ray equipment. In case of the density from the reference specimens, the mean differences of 4% were in the range of the uncertainty of the method which was proposed by Kruglowa (Kruglowa et al., 2012).
Regarding the influence of PEG concentrations on the density properties, there exists a clear increasing correlation (0.64) with increasing PEG content which makes it possible to reach good agreement in the approximation of the density of Vasa oak in ranges from 30% to 50% in PEG content, see Figure 6.2. To reach a statistically significant result a larger number of different samples with higher differences in the PEG concentration need to be tested.
Figure 6.2 Relationship between the PEG content and the density of Vasa oak.

CHALMERS, Civil and Environmental Engineering
40
On-site verification of the density
To predict the timber density on the Vasa warship, the in-situ density measurement using a calibrated wedge was tested and verified on a well-known Vasa oak specimen, see Figure 6.3. The application and determination of the density is well described by Kruglowa (Kruglowa et al., 2012).
Figure 6.3 Example of on-site verification of the greyscale density calibration procedure on an oak-specimen (ID 65542) from the Vasa warship. The bottom part shows the correlation between the density and the greyscale for the calibration wedge. Due to the differences in thickness between the X-rayed specimen and the calibration wedge, the greyscale value needed to be corrected.
The coefficient of determination (R2) for the evaluation of the density properties ranged between 0.77 and 0.98, i.e. that the density properties were highly correlated to the greyscale values and therefore had to be judged as satisfying results in the determination of the in-situ density properties of the Vasa oak. The summary of the results on the density from the on-site investigation on different locations are presented in Table 6.1. The results show variations in the density measurements, which can be referred mainly to the chemical treatment (PEG), but also to the natural variability and the unknown origin of the timber. It is also assumed that the PEG had less erroneous X-ray impact in the density evaluation of structural components than it had on the clear wood specimens.

CHALMERS, Civil and Environmental Engineering
41
Table 6.1 Results from the on-site investigation of the X-rayed density properties from the Vasa oak.
6.2.2 Results for relative stiffness properties
The relationship between the density of the test specimens and the relative stiffness was investigated. The relative stiffness parameter describes only the relation of the differences from the results between the reference specimens and the Vasa specimens.
In all directions (R,T,L) a tendency of decreasing relative stiffness with increasing density was achieved with the reference specimens included. These results can only be used to illustrate that there exists a clear diminishing effect of the stiffness properties. In the longitudinal direction, the approximate loss of stiffness might expected to be 20% to 35%, whereas the stiffness loss in the tangential and the radial direction showed larger variations and might obtain losses from 30% to about 55%. The low values for the coefficients of determination, see Paper II, Section 4, when the reference specimens were excluded, can be interpreted as there was no correlation between the stiffness parameters and the material density. The reason for those low correlations was that the PEG content had large influence on the density properties that were measured since PEG might be bulked in the areas of decomposed wood substance, therefore the knowledge on the PEG content is of great importance in the future evaluation of the stiffness and strength properties of the Vasa oak.
When PEG was possible to be included in the evaluation, the correlation between the relative stiffness parameter and the PEG content ranges from 0.42 to 0.59 and shows a clear linear inverse relationship, i.e. that there is a clear tendency of a decreasing stiffness with the increase of PEG content for ranges from 30% to 50 % in PEG content, see Figure 6.4. These cross-correlations can in a further step be applied to determine the mechanical properties of Vasa’s ship structure in a global survey using NDT testing. Therefore, a multivariate statistical analysis between the stiffness, the density and the PEG content should be carried out for further assessment for those mentioned parameters. However, a larger amount and range of specimens with measured PEG content than available for this study are needed.
The regression equation can be expected to become decreasingly exponential for the whole range from 0% to 50% in PEG content (Bjurhager, 2011) with a correlation of

CHALMERS, Civil and Environmental Engineering
42
up to 70%, i.e. that the stiffness decreases tremendously with about 40% to 50% by increasing the PEG content from 0% to 10%, see Paper II, Section 4.
Figure 6.4 Relationship between the PEG content and the relative stiffness parameters of Vasa oak in longitudinal, radial and tangential direction.
6.3 Summary It was possible to obtain accurate estimates and a strong correlation with the density of Vasa oak’s structural components using X-rays in combination with digital image processing. The proposed procedure can be used in-situ with satisfactory results for the evaluation of timber properties. The negative influence of the PEG content resulted in slight overestimation of the density which is on the safe side for the evaluation of the load-carrying capacity. The correlation between the relative stiffness and the density properties was weak, but good agreement of the density properties was reached through cross correlation between PEG and the density properties and PEG and the relative stiffness parameters.

CHALMERS, Civil and Environmental Engineering
43
7 Conclusions The main research objectives of this entire project were to develop strategies and tools to perform assessment of existing timber structures with reference to their condition and structural capability. The thesis was divided in two main parts. The first part contained a development of a calibration procedure for the in-situ assessment of the density properties as well as an investigation of the possibilities to apply X-ray equipment in the evaluation of the performance and the condition of timber structures. The second part of this work enclosed a final verification and evaluation of the proposed procedure through a case study. Furthermore, the assessment strategy, the use of NDT/SDT methods and the difficulties of in the evaluation process were enlightened.
Assessment of in-situ density in timber using X-ray equipment [Paper I]
Based on the results from the experiments in Paper I, the following conclusions were drawn:
It was possible to obtain very accurate estimates of the timber density and a strong correlation between the density of timber structural components and X-rays in combination with digital image processing. The proposed procedure can be used in situ.
The correlation is linear for a range from 250 kg/m3 to 1000 kg/m3. As common wood species for structural use range from 300 kg/m3 to about 800 kg/m3, the linear correlation produces a better approximation.
The thickness of the investigated component is of major importance and needs to be adapted for in the analysis by a correction factor (ΔRGB), whereas the moisture was of minor importance for the range between 8%-16% MC.
As a general conclusion, digital radioscopy provides good opportunities for the development of a successful future tool for the in-situ assessment of timber structures and it is as easy or difficult to use as any other non-destructive method. It also contributes to the detection of failures and deterioration in the material in the early stages, which in turn increases the service life and durability of the structure.
As commonly stated for timber engineering purposes, the density governs the stiffness and to some extent also the strength properties. The procedure can therefore be used in the analysis of structural behaviour. The density properties of timber components are also relevant for the examination and evaluation of mechanical connections.
Density property prediction and the complexity of the in-situ evaluation of the Vasa warship for future structural assessment [Paper II]
Based on the results summarised in Paper II, the following conclusions were drawn:
The general complexity of the Vasa warship was mainly referred to large variations of the Vasa oak, not only due to the natural variability of the wood, but mainly due to surface degradation, chemical treatment and the disintegration of the cell wall structure originating of the centuries of waterlogged condition. These were the main reasons that caused difficulties in

CHALMERS, Civil and Environmental Engineering
44
the assessment and evaluation of the mechanical and physical properties on a structural level.
It was possible to obtain accurate estimates and a strong correlation between the densities of Vasa oak’s structural components using X-rays in combination with digital image processing. The proposed procedure (Kruglowa et al., 2012) can be used in-situ with satisfactory results for the evaluation of timber properties. The thickness of the investigated components was of major importance for the on-site verification and needed to be adapted in the analysis by a correction factor (ΔRGB).
The X-ray equipment is well-suited for estimation of the density of structural components, but the results obtained on small clear wood specimens were not statistically significant. As compared to the density results measured by the conventional method, the X-ray technique seems to give a slight overestimation for both the Vasa oak and the reference specimens. This might be due to the PEG content that influenced the attenuation, but also a small extent to the uncertainty of the sensitivity of the portable low energy level X-ray equipment. The tendency of overestimation of the density properties and the variation of the results were mainly referred to the PEG content as an unknown parameter.
In case of the density from the reference specimens, the correlation between the X-ray density and the measured density estimations was 0.85. The mean ratio of 4% were in the range of the uncertainty of the method which was proposed by Kruglowa (Kruglowa et al., 2012). The mean value (standard deviation) of the ratio between the X-rayed density and the measured density for the Vasa specimens was 1.073 (0.073), using the two methods.
The correlation between the relative stiffness in either direction (R,T,L) and the density properties was weak. There exists a clear diminishing effect of the stiffness properties compared to the reference specimens. In the longitudinal direction, the approximate loss of stiffness might expected to be 20% to 35%, whereas the stiffness loss in the tangential and the radial direction showed larger variations and might obtain losses from 30% to about 55%. This could be referred to the large influence of PEG as well as to the unknown variation of the PEG content, but also to the small range of the density differences in the tested Vasa oak. In terms of mechanical properties the results produce values on the safe side for the evaluation of the load-capacity.
The correlations between the relative stiffness parameter and the PEG content ranged from 0.42 to 0.59 and showed a clear inverse relationship, i.e. that there is a clear tendency of a decreasing stiffness with the increase of PEG content for ranges from 30% to 50% in PEG content. There exist good correlation (0.64) regarding the increase in PEG and the density for the same ranges. These cross-correlations can then be applied to determine the mechanical properties of Vasa’s ship structure in a global survey using NDT testing and are relevant for the examination and evaluation of mechanical connections used in the Vasa warship.
In addition to X-ray investigation, a combination of visual inspection, ultrasonic measurements and other global non-destructive methods together with X-ray investigation, is of great importance in the evaluation of the

CHALMERS, Civil and Environmental Engineering
45
mechanical and physical properties of the Vasa warship, since more accurate estimates can be obtained in the condition assessment of the structure.
Future outlook
Assessment of timber structures has a very broad and wide field of application, but the main goal of this project in the future is the evaluation and inspection of the structural performance of existing timber structures. This includes the use of NDT/SDT methods and the determination of on-site actual stress levels of loaded structures to fulfil the overall vision of the project to develop recommendations and guidelines for condition assessment of timber structures. Pilot studies are on-going regarding the application of vibrational and modal testing of structures for evaluation of the condition and stress states of existing structures.

CHALMERS, Civil and Environmental Engineering
46
8 References Almkvist G. and Persson I. (2008): Degradation of polyethylene glycol and
hemicellulose in the Vasa. Holzforschung, Vol. 62 (1), pp. 64-70.
Anthony R. (2003): Examination of Connections and Deterioration in Timber Structures Using Digital Radioscopy. American Society of Civil Engineers, Vol., pp. 320-328.
Anthony R. and Meade E. (2007): Assessment of a Mechanical Failure in a Historic Wood Truss Using Digital Radioscopy. From Material to Structure - Mechanical Behaviour and Failures of the Timber Structures, Vol.
Badel É. and Perré P. (2002): Predicting oak wood properties using X-ray inspection: representation, homogenisation and localisation. Part I: Digital X-ray imaging and representation by finite elements. Ann. For. Sci., Vol. 59 (7), pp. 767-776.
Bateni A., Ahmadi M. and Parvin N. (2008): Prediction of density in porous materials by x-ray techniques. 17th World Conference on Nondestructive Testing. Shanghai, China.
Bjurhager I. (2011): Effects of Cell Wall Structure on Tensile Properties of Hardwood. Doctoral thesis, Polymer Technology, Royal Institute of Technology (KTH), ISBN 978-91-7415-914-1.
Bjurhager I., et al. (2010): Towards improved understanding of PEG-impregnated waterlogged archaeological wood: A model study on recent oak. Holzforschung, Vol. 64 (2), pp. 243-250.
Björdal C. G., Nilsson T. and Daniel G. (1999): Microbial decay of waterlogged archaeological wood found in Sweden Applicable to archaeology and conservation. International Biodeterioration & Biodegradation, Vol. 43 (1-2), pp. 63-73.
Branco J., Piazza M. and Cruz P. (2008): Geometric Assessment and Non-Destructive Evaluation of Two Timber King-Post Trusses. RILEM Symposium on On Site Assessment of Concrete, Masonry and Timber Structures - SACoMaTiS 2008. Varenna - Lake Como, Italy.
Brozovsky J., Brozovsky J., Jr. and Zach J. (2008): An Assessment of the Condition of Timber Structures. 9th International Conference on NDT of Art, Vol.
Capretti C., et al. (2008): The characterization of waterlogged archeaological wood: the three Roman ships found in Naples Archaeometry, Vol. 50 (5), pp. 855-876.
Cen. (2004): Eurocode 5: Design of timber structures - Part 1-1: General - Common rules and rules for buildings. Brussels: European Committee for Standardization (CEN).
Ceraldi C., Mormone V. and Russo Ermolli E. (2001): Resistographic inspection of ancient timber structures for the evaluation of mechanical characteristics. Materials and Structures, Vol. 34 (1), pp. 59-64.
Chen S., et al. (2009): Digital X-ray analysis of density distribution characteristics of wood-based panels. Wood Science and Technology, Vol.
Dinwoodie J. (2000): Timber: Its nature and behaviour. London, Taylor & Francis.

CHALMERS, Civil and Environmental Engineering
47
Divós F., Németh L. and Bejó L. (2001): Evaluation of the wooden structure of a Baroque palace in Papa. International Nondestructive Testing and Evaluation of Wood Symposium Sopron: University of Sopron (NDT Laboratory).
Drdácký M., Kloiber M. and Kotlinova M. (2007): Low invasive diagnostic of historic timber. In: In-situ evalauation & non-destructive testing of historic wood and masonry structures. Prague, Czech Republic.
Feio A. O. (2005): Inspection and diagnosis of historical timber structures: NDT correlations and structural behaviour. Ph.D. Doctoral thesis, Dept of Civil and Environmental Engineering, University of Minho, Portugal.
Feio A. O., Machado J. S. and Lourenco P. B. (Year): Parallel to the Grain Behavior and NDT Correlations for Chestnut Wood (Castanea Sativa Mill). In: Conservation of Historic Wooden Structures, Florence Italy, 2005, 294-303.
Fpl. (2010): Wood handbook—Wood as an engineering material. Forest Products Laboratory, General Technical Report FPL-GTR-190, USDA Forest Service, pp. 508.
Gaspar F., Cruz H. and Gomes A. (2008): Evaluation of glued laminated timber structures–core extraction and shear testing. 10th World Conference on Timber Engineering 2008, 2-5 June 2008. Miyazaki, Japan.
Görlacher R. (1987): Zerstörungsfreie Prüfung von Holz: Ein „in situ”-Verfahren zur Bestimmung der Rohdichte. Holz als Roh-und Werkstoff, Vol. 45 (7), pp. 273-278.
Görlacher R. (1991): Untersuchung von altem Konstruktionsholz: Bestimmung des Elastizitätsmodul. Bauen mit Holz, Karlsruhe, Vol. 8, pp. 582-587.
Görlacher R. and Hättrich R. (1990): Die Bohrwiderstandsmessung. Bauen mit Holz, Karlsruhe, Vol. 6, pp. 455-459.
Haines D. W., Leban J.-M. and Herbé C. (1996): Determination of Young's modulus for spruce, fir and isotropic materials by the resonance flexure method with comparisons to static flexure and other dynamic methods. Wood Science and Technology, Vol. 30 (4), pp. 253-263.
Hasenstab A., et al. (2004): Materialuntersuchung an Holz mit niederfrequenter Ultraschall-Echotechnik. 2009 (07-10).
Hedges J. I. (1990): The chemistry of archaeological wood. The Archaeological Wood: Properties, Chemistry, and Preservation. Washington, DC, EE. UU: American Chemical Society, Vol.
Håfors B. (1989): The Role of the <italic>Wasa</italic> in the Development of the Polyethylene Glycol Preservation Method. Archaeological Wood, American Chemical Society.
Håfors B. (2010): Conservation of the wood of the Swedish warship Vasa of A.D. 1628. Evaluation of polyethylene glycol conservation programmes. Department of Conservation, Gothenburg University.
Icomos. (2005): Recommendations for the analysis, conservation and structural restoration of architectural heritage. ICOMOS International Committee for Analysis and Restoration of Structures of Architectural Heritage.

CHALMERS, Civil and Environmental Engineering
48
Kasal B. (2003): Semi-destructive method for in-situ evaluation of compressive strength of wood structural members. Forest Products Journal, Vol. 53 (11/12), pp. 55-58.
Kasal B., Adams A. and Drdacky M. (2008): Application of Digital Radiography in evaluation of Components of Existing Structures. RILEM Symposium on On Site Assessment of Concrete, Masonry and Timber Structures - SACoMaTiS 2008. Varenna - Lake Como, Italy.
Kasal B. and Anthony R. (2004): Advances in in-situ evaluation of timber structures. Progress in Structural Engineering and Materials, Vol. 6 (2), pp. 94-103.
Kollmann F. F. P. and Cote Jr W. A. (1968): Principles of wood science and technology. I. Solid wood. Principles of wood science and technology. I. Solid wood., Vol.
Kruglowa T., Sandin Y. and Kliger I. R. (2012): Assessment of Density in Timber Using X-ray Equipment. International Journal of Architectural Heritage: Conservation, Analysis and Restoration, Vol.
Larsson D. and Perstorper M. (1994): 1st European Symposium on Non-Destructive Evaluation of wood - en Reserapport.
Lear G. C. (2005): Improving the Assessment of In Situ Timber Members with the Use of Nondestructive and Semi-Destructive Testing Techniques. Master of Science Master's Thesis, Civil Engineering, North Carolina State University.
Ljungdahl J. and Berglund L. A. (2007): Transverse mechanical behaviour and moisture absorption of waterlogged archaeological wood from the Vasa ship. Holzforschung, Vol. 61 (3), pp. 279-284.
Ljungdahl J., Berglund L. A. and Burman M. (2006): Transverse anisotropy of compressive failure in European oak – a digital speckle photography study. Holzforschung, Vol. 60 (2), pp. 190-195.
Lourenço P. B., Feio A. O. and Machado J. S. (2007): Chestnut wood in compression perpendicular to the grain: Non-destructive correlations for test results in new and old wood. Construction and Building Materials, Vol. 21 (8), pp. 1617-1627.
Macchioni N. and Piazza M. (2006): Italian standardisation activity in the field of diagnosis and restoration of Ancient timber structures'. Structural Analysis of Historical Constructions, Macmillan India Ltd., New Delhi, Vol.
Magnus L. (2008): Historic Timber Roof Structures - Construction Technology and Structural Behaviour. Civil Engineer-Architect Master's Thesis, Faculty of Engineering, Dept. of Civil Engineering, Catholic University of Leuven.
Mohager S. (1987): Studier av krypning hos trä: med särskild hänsyn till inverkan av konstanta och cyklist varierande fukttillstånd. Stockholm, KTH - Institutionen för Byggnadsmateriallära.
Mühlethaler B. (1973): Conservation of waterlogged wood and wet leather. Paris.
N.C.P.T.T. (2005): Advances in Digital Radioscopy for Use in Historic Preservation. National Center for Preservation Technology and Training, pp. 125.

CHALMERS, Civil and Environmental Engineering
49
Ohlsson S. and Perstorper M. (1992): Elastic wood properties from dynamic tests and computer modeling. Journal of Structural Engineering New York, N.Y., Vol. 118 (10), pp. 2677-2690.
Ravenshorst G., et al. (2004): An economic method to determine the strength class of wood species. Heron, Vol. 49 (4), pp. 297-326.
Riggio M. and Piazza M. (2008): Hardness Tests. RILEM Symposium on On Site Assessment of Concrete, Masonry and Timber Structures - SACoMaTiS 2008. Trento, Italy: Department of Mechanical and Structural Engineering, Trento University (DIMS).
Rinn F., Schweingruber F. and Schär E. (1996): Resistograph and X-ray density charts of wood comparative evaluation of drill resistance profiles and X-ray density charts of different wood species. Holzforschung, Vol. 50 (4), pp. 303-311.
Ross R., et al. (1991): Transverse vibration nondestructive testing using a personal computer. United States Department of Agriculture, Forest Service, Forest Products Laboratory, FPL-RP-502, pp.
Ross R., Ritter M. and Schad K. (1996): Determining In-Place Modulus of Elasticity of Stress-Laminated Timber Decks Using NDE. United States Department of Agriculture, Forest Service, Forest Products Laboratory, FPL-Documents, pp.
Ross R., et al. (2002): Transverse vibration technique to identify deteriorated wood floor systems. Experimental Techniques, Vol. 26 (4), pp. 28-30.
Ross R. J. and Hunt M. O. (2000): Stress wave timing nondestructive evaluation tools for inspecting historic structures: a guide for use and interpretation. General Technical Report Forest Products Laboratory, FPL-GTR-119, USDA Forest Service, pp.
Rug W. and Seemann A. (1991): Test cores from 50-400 year old timber indicates strength of old timbers corresponds to that of new. Building Research and Information, Vol. 19 (1), pp. 31-37.
Schniewind A. P. (1990): Physical and mechanical properties of archaeological wood. The Archaeological Wood: Properties, Chemistry and Preservation. Washington, DC, EE. UU.: American Chemical Society, Vol., pp. 87-109.
Tomazello M., et al. (2008): Application of X-ray Technique in Nondestructive Evaluation of Eucalypt Wood. Maderas. Ciencia y tecnología, Vol. 10 (2), pp. 139-149.
Zombori B. (2001): In-situ nondestructive testing of built in wooden members. NDT. net, Vol. 6 (03).