Embed Size (px)
Citation preview
NASA Technical Paper 1635 \.,- 1
. . , . . . - J
- -. _ . _ _ _ _ - -.--- .L I' . . A
- . . . - ..a -1 ) _. - I..--_ " . , ,..:; ;;;;.. =-.d:.: .3
. - , . : : ..:-. . . - 2.. 'L . -. .- - -
L _.
Effects of Magnification and Visual
Accommodation on Aimpoint Estimation in Simulated Landings With Real and Virtual Image Displays
OCTOBER 1980
https://ntrs.nasa.gov/search.jsp?R=19800025591 2018-06-06T04:14:19+00:00Z


NASA Technical Paper 1635
Effects of Magnification and Visual Accommodation on Aimpoint Estimation in Simulated Landings With Real and Virtual Image Displays
Robert J. Randle Ames Research Ceuter Mofe t t Field, Califor~ria
Stanley N. Roscoe N e w Mexico State University Las Cruces, N e w Mexico
John C. Petitt Utziversity of California Srtrz Diego, California
National Aeronautics and Space Administration
Scientific and Technical Information Branch

TABLE O F CONTENTS
Page
SUMMARY . . . . . . . . . . . . . . . . . . . . . . . . . . . . . . . . . . . . . . . . . . . . . . . . . . . . . . . . . . . . . . . . . 1
INTRODUCTION . . . . . . . . . . . . . . . . . . . . . . . . . . . . . . . . . . . . . . . . . . . . . . . . . . . . . . . . . . . . 2
METHOD . . . . . . . . . . . . . . . . . . . . . . . . . . . . . . . . . . . . . . . . . . . . . . . . . . . . . . . . . . . . . . . . . . . 4 Subjects . . . . . . . . . . . . . . . . . . . . . . . . . . . . . . . . . . . . . . . . . . . . . . . . . . . . . . . . . . . . . . . . 4 SimulatedLandingScene . . . . . . . . . . . . . . . . . . . . . . . . . . . . . . . . . . . . . . . . . . . . . . . . . . . 5
. . . . . . . . . . . . . . . . . . . . . . . . . . . . . . . . . . . . . . . . . . . . . . . . . . . . Experimental Variables 6 Viewingcondition . . . . . . . . . . . . . . . . . . . . . . . . . . . . . . . . . . . . . . . . . . . . . . . . . . . . 6
. . . . . . . . . . . . . . . . . . . . . . . . . . . . . . . . . . . . . . . . . . . . . . . Stinlulus dioptric power 6 Magnification . . . . . . . . . . . . . . . . . . . . . . . . . . . . . . . . . . . . . . . . . . . . . . . . . . . . . . . . 8 Descentangle . . . . . . . . . . . . . . . . . . . . . . . . . . . . . . . . . . . . . . . . . . . . . . . . . . . . . . . . 8
. . . . . . . . . . . . . . . . . . . . . . . . . . . . . . . . . . . . . . . . . . . . . . . . . . . . . . . EXPERIMENTAL PLAN 8 . . . . . . . . . . . . . . . . . . . . . . . . . . . . . . . . . . . . . . . . . . . . . . . Accommodation Measurement 10
TheSubjects'Task . . . . . . . . . . . . . . . . . . . . . . . . . . . . . . . . . . . . . . . . . . . . . . . . . . . . . . . . 10
RESULTS . . . . . . . . . . . . . . . . . . . . . . . . . . . . . . . . . . . . . . . . . . . . . . . . . . . . . . . . . . . . . . . . . . 1 1 . . . . . . . . . . . . . . . . . . . . . . . . . . . . . . . . . . . . . . . . . . . . . . . . . . Measured Accommodation 1 1
Rangeeffects . . . . . . . . . . . . . . . . . . . . . . . . . . . . . . . . . . . . . . . . . . . . . . . . . . . . . . . . 12 . . . . . . . . . . . . . . . . . . . . . . . . . . . . . . . . . . . . . . . . . . . . . . . . . . . . Differential effects 13
. . . . . . . . . . . . . . . . . . . . . . . . . . . . . . . . . . . . . . . . . . . . Analysis of Accommodation Data 14 . . . . . . . . . . . . . . . . . . . . . . . . . . . . . . . . . . . . . . . . . . . . . . . . . Aimpoint Estimation Error 16
. . . . . . . . . . . . . . . . . . . . . . . . . . . . . . . . . . . . Analysis of Judgments and Accommodation 19
DISCUSSION . . . . . . . . . . . . . . . . . . . . . . . . . . . . . . . . . . . . . . . . . . . . . . . . . . . . . . . . . . . . . . . . 20 . . . . . . . . . . . . . . . . . . . . . . . . . . . . . . . . . . . . . . . . . . . . . . . . . . . . . . . Image Magnification 20
. . . . . . . . . . . . . . . . . . . . . . . . . . . . . . . . . . . . . . . . . . . . . . . . . . . . Visual Accon~modation 21
. . . . . . . . . . . . . . . . . . . . . . . . . . . . . . . . . . . . . . . . . . . . . . . . . . . . Real and Virtual Images 21 . . . . . . . . . . . . . . . . . . . . . . . . . . . . . . . . . . . . . . . . . . . . . . Accommodation as a Response 22
REFERENCES . . . . . . . . . . . . . . . . . . . . . . . . . . . . . . . . . . . . . . . . . . . . . . . . . . . . . . . . . . . . . . . 23


EFFECTS OF MAGNIFICATION AND VISUAL ACCOMMODATION ON
AIMPOINT ESTIMATION IN SIMULATED LANDINGS WITH
REAL AND VIRTUAL IMAGE DISPLAYS
Robert J. Randle, Stanley N. Roscoe," and John C. Petitt?
Ames Research Center
SUMMARY
Previous studies have suggested that there may be a need to provide some magnification in cockpit displays for ground-referenced control of aircraft. The explanatory hypothesis advanced is that the near-visual response, particularly lens accommodation, results in a minified retinal image leading to a more distant-appearing runway and a perception of undershooting. This experiment was designed to evaluate that hypothesis. Twenty emmetropic professional pilots made aimpoint judgments in a computer-generated landing simulator while magnification, approach slope angle, and visual focus demand were each systematically varied over five carefully chosen values. Two display conditions (real and virtual images) and two judgment points (20 sec and 10 sec before touchdown) were employed. Visual accommodation was continuously measured using an auto- matic infrared optometer.
The major results of the study were the following:
1. Measured accommodation was reliably less than the focus demand across all experimental conditions and was also reliably less for the virtual than for the real images. Several factors inherent in the experimental configuration were hypothesized to have contributed to both the depressed range and differential effects.
2. There were reliably more overshoot estimates at the first judgment point (20 sec from touchdown) than at the second judgment point (10 sec from touchdown) where 'the bias shifted reliably to a perceived undershoot. This phenomenon suggested an increase in simulator fidelity and/or a decrease in task difficulty as range decreased.
3. Both magnification and approach slope angle biased the responses in appropriate direc- tions, but only the second judgments were veridical within the tested ranges of these two variables.
4. Due to the dichotomous responses for first and second judgments, minification of the scene was required early in the run to produce unbiased judgments, while magnification was required later. Using the multiple regression equations based on the data, predicted values of magnification for unbiased performance were:
*New Mexico State University, Las Cruces, New Mexico 88001 ?University of California, San Diego, Calif. 92037

Judgment Image 1 2 -- Real 0.78X 1.17X Virtual 0.92X 1.27X
5. Biases were not in evidence as a function of the visual focus demand for the virtual-image case. With the real images, however, both measured accommodation and the pilots' aimpoint judgments interacted with focus demand in keeping with a near-visual-response micropsia hypo- thesis. However, a correlational analysis did not demonstrate a relationship between measured accornmodation and proportion of perceived undershoots. Although not measured, visual con- vergence, which is innervated in the near response, may have produced a micropsia and the associated undershoot bias with real images.
INTRODUCTION
The widespread use of computer-generated imagery (CGI) in flight simulation calls for a detailed analysis of the visual realism of such simulators. One primary goal of past efforts in simula- tion technology has been the development of an optically sound visual scene analogous to the pilot's contact view of the outside world. A tacit assumption of this approach is that perceptual responses t o optically faithful pictorial representations of the world are essentially the same as the responses t o the real world itself. Numerous perceptual studies have called this assumption into question.
Roscoe (ref. l ) , using a rear-projection-screen periscope with variable magnification, found that a magnification of 1.29 yielded subjective equality of distance judgments when compared with a direct view of a large elm tree seen 183 m (600 ft) across an open field. In flight, Roscoe, Dougherty, and Hasler (ref. 2) had pilots make landings by reference t o the periscope installed through an aluminum windscreen. They found that pilots systematically overshot the runway aimpoint when the image was minified by a factor of 0.86 and undershot the aimpoint when the magnification was 2.0. A magnification of 1.20 produced no tendency'to either overshoot or undershoot.
Campbell, McEachern, and Marg (ref. 3) used a binocular periscope to investigate the ability of pilots to make landings with an optically projected image of the runway scene. They had pilots view the scene directly through lenses, unlike the previous investigators who had used rear- projection screens. Campbell et al. noted that the unity magnification condition produced an image that appeared smaller than the real-world objects, but no actual measurements were made. They concluded that an apparent minification of objects to about 0.8 actual size definitely occurs at unity magnification. Thus, a magnification of approximately 1.25 would be required t o normalize the apparent distances of objects.
For an explanation of this phenomenon, Campbell et al. referred t o the fact that magnification in telescopes is not linear for all object distances (ref. 4). Telescopes are designed such that their magnifying power is defined for the image of an object at infinity. For objects nearer than this distance, magnification is greater. In the airborne application, most viewing that is related t o the
landing task is of relatively distant objects whose images would appear relatively smaller than those of closer objects and might require magnification to produce equality of size and distance judgments.
In using computer-generated graphic displays at Ames Research Center for the simulation of landing approaches, it is a fairly common observation that pilots tend to overshoot, round out high, and touch down hard (e.g., see ref. 5). These displays are normally presented at unity magnifica- tion. Although these phenomena may be related to the results cited above, the lack of texture and the limited visual-cue redundancy in these line-drawing depictions may be the more important contributors.
The experiments just described have suggested that magnification of visual contact analog displays may be required to obtain veridical perceptions and that the magnification required for any specific system can be determined by a simple psychophysical experiment. Such experiments, however, can neither explain the apparent minification effect nor identify and quantify the vari- ables contributing to this effect. A full explanation would produce general principles of visual perception that could then guide the design both of visual flight simulators and of other visual systems.
Another phenomenon of optically generated images that may have some as-yet-undefined relationship to biased performance at unity magnification is that of instrument myopia. This well-known effect is the tendency of the visual accommodation system to be biased toward near focus (myopia) when viewing in microscopes (refs. 6 and 7) and telescopes (ref. 8, pp. 12 and 15). For this effect to influence size and, consequently, distance judgments, one might suspect that the increase in lens power of the eye results in a relatively minified retinal image. However, calcula- tions made using the Gullstrand schematic eye and data by Davson (ref. 9) do not bear this out. For a change in accommodation from 0.0 to 8.6 diopters, the calculated change in retinal image size was an increase of about 3%. (See also ref. 10.)
Still, real human eyes may not always have the normative dimensions assumed for the model eye. Under conditions of marked accommodation and convergence, the phenomenon of accom- modative micropsia may occur. With regard to changes in retinal image size due to retinal distor- tion, Biersdorf and Baird (ref. 1 1) and Blank and Enoch (ref. 12) have reported apparently relevant findings. However, although some retinal distortion is associated with accommodation, Heinemann, Tulving, and Nachmias (ref. 13) showed that accommodation is not necessary to the diminution in perceived size. They found that micropsia occurs when convergence is brought into play regardless of whether accommodation is also allowed to occur or is prevented by cycloplegia or presbyopia.
Alexander (ref. 14) casts further doubt on the role of accommodation in so-called accom- modative micropsia. His study compared normal binocular viewing with a condition in which the same binocular target was fixated but accommodation was increased through the use of negative ophthalmic lenses and with a third condition in which monocular viewing was used with accom- modation induced in the same way. This third condition allowed convergence to operate in the occluded eye. There was a small reduction in perceived size from the first to second condition where convergence was constant. This was attributed to the minification produced by the minus lenses. There was a large reduction in image size in the monocular (third) condition which was attributed to the influence of accommodative convergence.
However, the results of two experiments by Roscoe and his associates cited above (refs. 1 and 2) are sufficiently puzzling as to invite further inquiry, In both instances, the view of the distant scene was imaged on a screen in front of the subjects and viewed from a distance of 38.1 cm (1 5 in.), thereby requiring both accommodation and convergence. This means that a distant scene normally associated with an absence of accommodation was kept in clear focus only by exerting 2.6 diopters of accommodation and a corresponding convergence - a clear instance of visual cue conflict within the dioptric range for micropsia to occur.
The major purpose of the present study was to evaluate the effect of induced accommodation on spatial estimation in a practical and complex visual task - that of judging touchdown aimpoint in a simulated aircraft descent to landing. Accommodation was measured dynamically and con- tinuously during the trials so that a relationship between perception and accommodation could be determined. No experiment has yet been done in which accommodation was manipulated and dynamically measured during the performance of a complex perceptual task, and few experiments to date have involved the measurement of accommodation while subjects were making psycho- physical judgments (refs. 1 1 and 15).
The three specific goals of this study were:
To determine the relationship between image magnification and the estimation of touch- down aimpoint in simulated approaches in landing using a dynamic computer-generated contact analog visual display.
8 To determine the relationship between visual accommodation and the same dependent variable; this was to provide a side-by-side comparison of two independent variables hypo- thesized to have a similar effect with respect to a common and relevant dependent variable.
8 To determine if there are differences between perceptual and accommodative responses to real (uncollimated) and virtual (collimated) images.
To investigate these issues, pilots were asked to observe a series of simulated autopilot- controlled approaches to a computer-generated airport scene and to judge whether the simulated airplane would undershoot or overshoot the landing aimpoint. The actual approach slope angle was varied systematically through five values centered on the correct (3') approach angle. The visual accommodation of the left eye was measured and recorded automatically while monocular judgments were being made at two specified points along the simulated landing approach path.
METHOD
Subjects
The subjects were experienced commercial and military pilots between 25 and 35 years of age. The median age of the 20 subjects was 29 years. The use of skilled subjects was deemed neces- sary to prevent gross misinterpretation of the required judgments, to help reduce subject variability, and to provide a more valid extrapolation to the population of interest. The subjects were evidently highly motivated, and their overt identification with the goals of the study was easy to obtain.
Prior to the day of the experimental session, which was completed in one visit, potential subjects were screened to assure that they had 20120 visual acuity, a reasonable accommodative range (3 diopters), normal depth perception, normal refractive error, and a mean pupil size suf- ficiently large for the use of the automatic infrared optometer. All pilots were paid for their participation in the study.
Simulated Landing Scene
A computer-generated calligraphic, dynamic night landing scene was presented for the pilots' judgments. The scene was generated digitally and presented on a 53.3-cm (21-in.) cathode-ray tube (CRT). This monochromatic display consisted of a geometric (line-drawn) depiction of a generalized airport runway scene with surrounding city lights. Except for three antenna towers and a few simulated city streets, the lights were placed by a random selection process outside a rect- angular boundary around the airport perimeter.
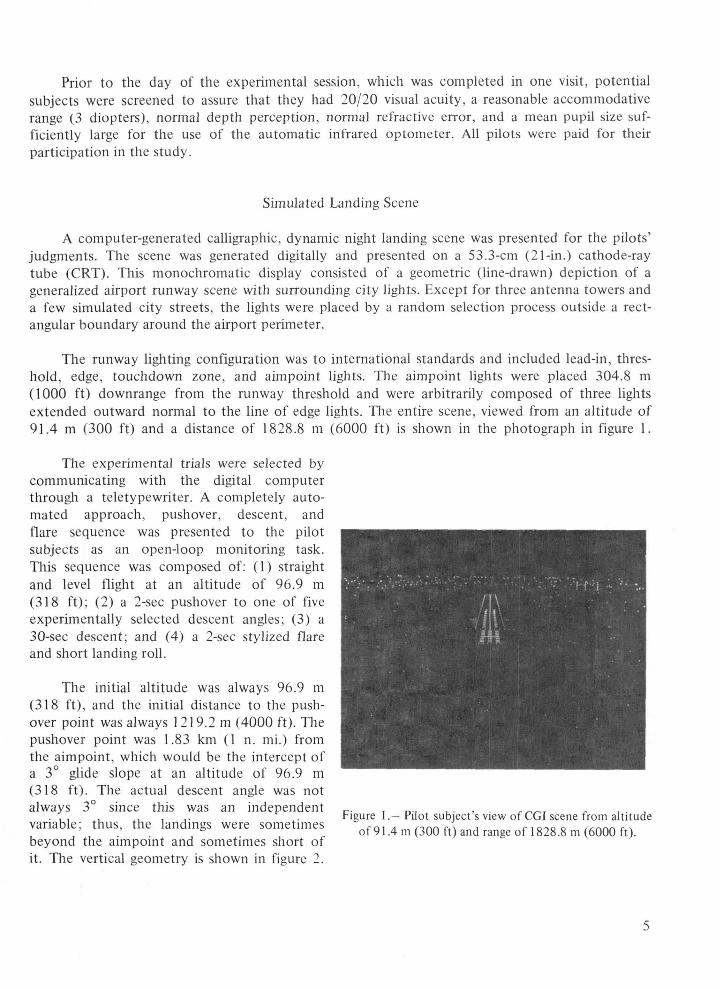
The runway lighting configuration was to international standards and included lead-in, thres- hold, edge, touchdown zone, and aimpoint lights. The aimpoint lights were placed 304.8 m (1000 ft) downrange from the runway threshold and were arbitrarily composed of three lights extended outward normal to the line of edge lights. The entire scene, viewed from an altitude of 91.4 m (300 ft) and a distance of 1828.8 m (6000 ft) is shown in the photograph in figure 1.
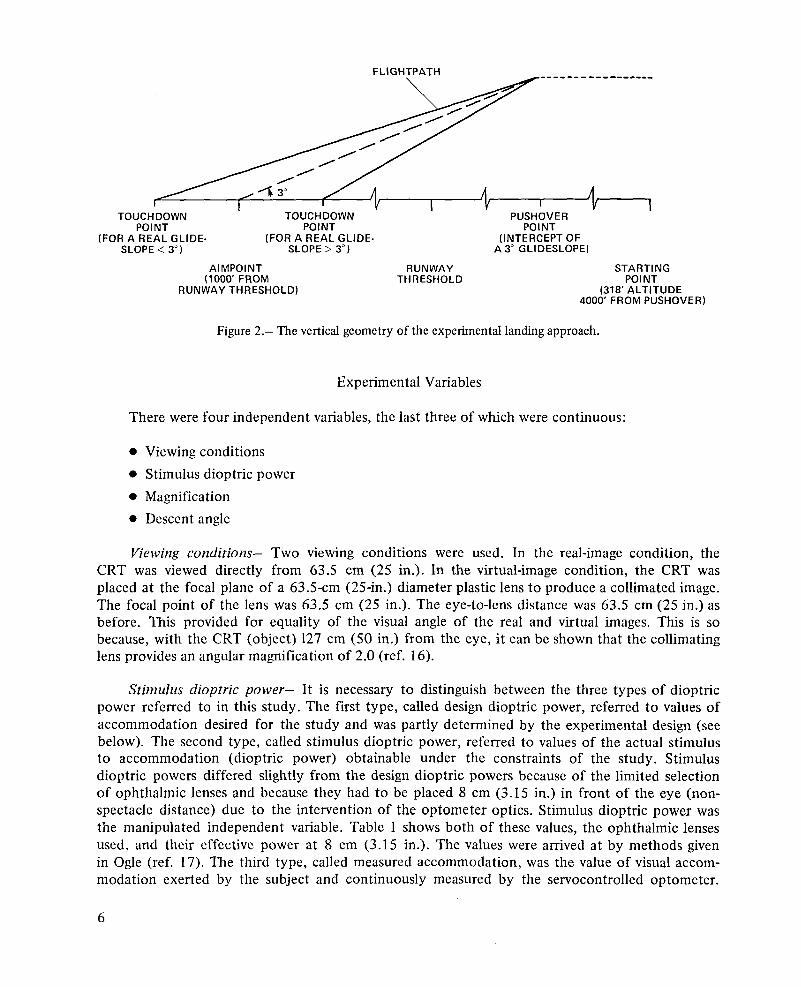
The experimental trials were selected by communicating with the digital computer through a teletypewriter. A completely auto- mated approach, pushover, descent, and flare sequence was presented t o the pilot subjects as an open-loop monitoring task. This sequence was composed of: (1) straight and level flight at an altitude of 96.9 m (318 ft); (2) a 2-sec pushover to one of five experimentally selected descent angles; (3) a 30-sec descent; and (4) a 2-sec stylized flare and short landing roll.
The initial altitude was always 96.9 m (31 8 ft), and the initial distance to the push- over point was always 12 19.2 m (4000 ft). The pushover point was 1.83 km (1 n. mi.) from the aimpoint, which would be the intercept of a 3" glide slope at an altitude of 96.9 m (3 18 ft). The actual descent angle was not always 3" since this was an independent Figure 1 .- Pilot subject's view of CGI scene from altitude
thus* the landings were of 91.4 m (300 ft) and range of 1828.8 (6000 ft). beyond the aimpoint and sometimes short of it. The vertical geometry is shown in figure 2.
POINT POINT POINT (FOR A REAL GLIDE- (FOR A REAL GLIDE- (INTERCEPT OF
SLOPE < 3") SLOPE > 3") A 3" GLIDESLOPE)
AIMPOINT (1000' FROM
RUNWAY THRESHOLD)
R U N W A Y STARTING THRESHOLD POINT
(318' ALTITUDE 4000' FROM PUSHOVER)
Figure 2.- The vertical geometry of the experimental landing approach.
Experimental Variables
There were four independent variables, the last three of which were continuous:
Viewing conditions
Stimulus dioptric power
Magnification
Descent angle
Viewing conditions- Two viewing conditions were used. In the real-image condition, the CRT was viewed directly from 63.5 cm (25 in.). In the virtual-image condition, the CRT was placed at the focal plane of a 63.5-cm (25-in.) diameter plastic lens to produce a collimated image. The focal point of the lens was 63.5 cm (25 in.). The eye-to-lens distance was 63.5 cm (25 in.) as before. This provided for equality of the visual angle of the real and virtual images. This is so because, with the CRT (object) 127 cm (50 in.) from the eye, it can be shown that the collimating lens provides an angular magnification of 2.0 (ref. 16).
Stimulus dioptric power- It is necessary to distinguish between the three types of dioptric power referred to in this study. The first type, called design dioptric power, referred to values of accommodation desired for the study and was partly determined by the experimental design (see below). The second type, called stimulus dioptric power, referred to values of the actual stimulus to accommodation (dioptric power) obtainable under the constraints of the study. Stimulus dioptric powers differed slightly from the design dioptric powers because of the limited selection of ophthalmic lenses and because they had to be placed 8 cm (3.15 in.) in front of the eye (non- spectacle distance) due to the intervention of the optometer optics. Stimulus dioptric power was the manipulated independent variable. Table 1 shows both of these values, the ophthalmic lenses used, and their effective power at 8 cm (3.15 in.). The values were arrived at by methods given in Ogle (ref. 17). The third type, called measured accommodation, was the value of visual accom- modation exerted by the subject and continuously measured by the servocontrolled optometer.
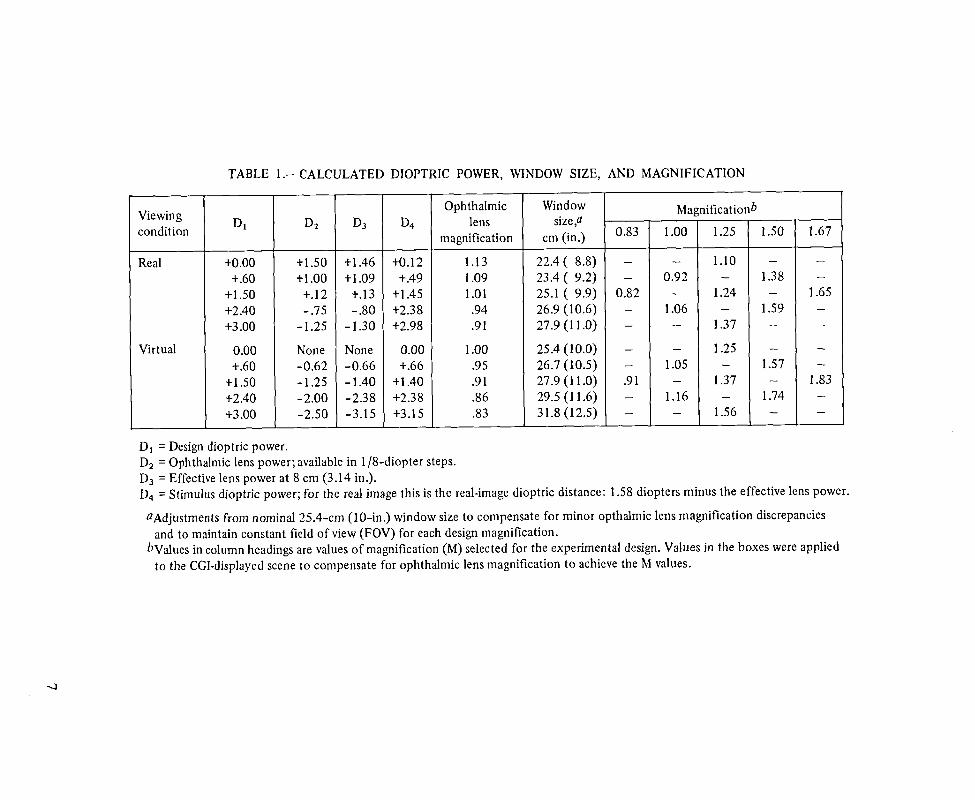
TABLE 1 .- CALCULATED DIOPTRIC POWER, WINDOW SIZE, AND MAGNIFICATION
D, = Design dioptric power. D, = Ophthalmic lens power; available in 118-diopter steps. D3 = Effective lens power at 8 cm (3.14 in.). D, = Stimulus dioptric power; for the real image this is the real-image dioptric distance: 1.58 diopters minus the effective lens power.
QAdjustments from nominal 25.4-cm (10-in.) window size to compensate for minor opthalmic lens magnification discrepancies and to maintain constant field of view (FOV) for each design magnification.
b ~ a l u e s in column headings are values of magnification (M) selected for the experimental design. Values in the boxes were applied to the CGI-displayed scene to compensate for ophthalmic lens magnification to achieve the M values.
Window size$
cm (in.)
22.4 ( 8.8) 23.4 ( 9.2) 25.1 ( 9.9) 26.9 (10.6) 27.9 (1 1.0)
25.4 (10.0) 26.7 (10.5) 27.9(11.0) 29.5(11.6) 31.8 (12.5)
~ a ~ n i f i c a t i o n b D4
t0.12 t.49
t1.45 t2.38 t2.98
0.00 t.66
t1.40 +2.38 t3.15
Viewing condition
Real
Virtual
Ophthalmic lens
magnification
1.13 1.09 1.01 .94 .9 1
1 .OO .9 5 .9 1 .86 .83
Dz
t1.50 t 1 .OO t.12 -.75
-1.25
None -0.62 -1.25 -2.00 -2.50
D 1
tO.00 t.60
t 1 .50 t2.40 t 3 .OO
0.00 t.60
+1 .SO t2.40 t3.00
1.50
- 1.38 -
1.59 -
-
1.57 -
1.74 -
1.25
1.10 -
1.24 -
1.37
1.25 -
1.37 -
1.56
0.83
- -
0.82 - -
- - .91 - -
D3
t1.46 t1.09
t.13 -.80
-1.30
None -0.66 -1.40 -2.38 -3.15
1.67
- -
1.65 - -
- -
1.83 - -
1 .OO
- 0.92 -
1.06 -
- 1.05 -
1.16 -
Magnification- Magnification was manipulated by command to the computer-graphics system and was variable in XO.O1 steps. Five levels of magnification were selected, using a central value of X 1.25 and outlying values conforming to the strategy of the central composite experimental design (see below). Since the ophthalmic lenses introduced some magnification, the computer-graphics system was also used t o compensate for this. Table 1 shows the magnification produced by the ophthalmic lenses and the computer-graphics magnification used to produce the design magnifica- tion shown at the top of each column.
One of the controlled variables in this study was the viewing window. A window size of 25.4 X 25.4 cm (10 X 10 in.) was selected because this completely masked the 27.9 X 27.9 cm (1 1 X 11 in.) picture size on the CRT. For the real-image case the window was placed against the CRT screen; for the virtual-image case it was placed against the lens. However, the ophthalmic lenses, again, influenced the angular size of the windows, and it was necessary to adjust the window sizes to compensate for the changes in the field of view (FOV) introduced by the slight scaling variations applied to the CRT images.
This adjustment was accomplished by varying the size of the window for each ophthalmic lens used. These sizes are shown in table 1. The window plates were easily slid into and out of a slotted frame in front of a 50.8-cm (20-in.) square window cut in a large upright baffle that com- pletely occluded the pilot's view of everything in the forward direction except the CRT scene. Compensating in this way for changes in the scene and in the window visual angles caused by the ophthalmic lenses kept the field of view constant.
Descent angle- The descent angle was also determined solely by an input to the digital com- puter. Five descent angles were used: 2.85', 2.91°, 3.00°, 3.1 0°, and 3.17'. The real-world descent angles corresponding to the ?1 and +a coded values called for by the central composite design (see Experimental Plan, below) were those that would result in symmetrical overshoot and under- shoot distances relative to the runway aimpoint. This accounts for the slightly asymmetrical ?1 and &a real-world values of descent angles.
With the given, fixed pushover point and altitude, the 3' descent angle resulted in a flare exactly at the predetermined aimpoint 304.8 m (1 000 ft) downrange from the threshold. This was considered to correspond to a typical instrument landing system (ILS) approach to touchdown. Steeper descent angles would tend to produce perceived undershoots with respect to the aimpoint; shallower descent angles would tend to produce perceived overshoots. The subjects' overt responses were forced-choice judgments of whether they were overshooting or undershooting the aimpoint. These judgments were called for at each of two designated points along the descent path after pushover.
EXPERIMENTAL PLAN
A central composite, within-subject mixed experimental design was used as described by Clark and Williges (ref. 18). In the words of the second author (ref. 18), "The methodology provides experimental techniques for efficiently and economically collecting data on several quantitative variables at once in order to develop a multiple regression prediction equation that describes the
functional relationship between human performance and the experimental variables." In the present study, it was desired to evaluate five levels of each of three variables under two viewing conditions. The factorial combination of 5 X 5 X 5 X 2 would result in 250 conditions. Twenty pilots each tested only once under each condition would have resulted in 5,000 experimental trials.
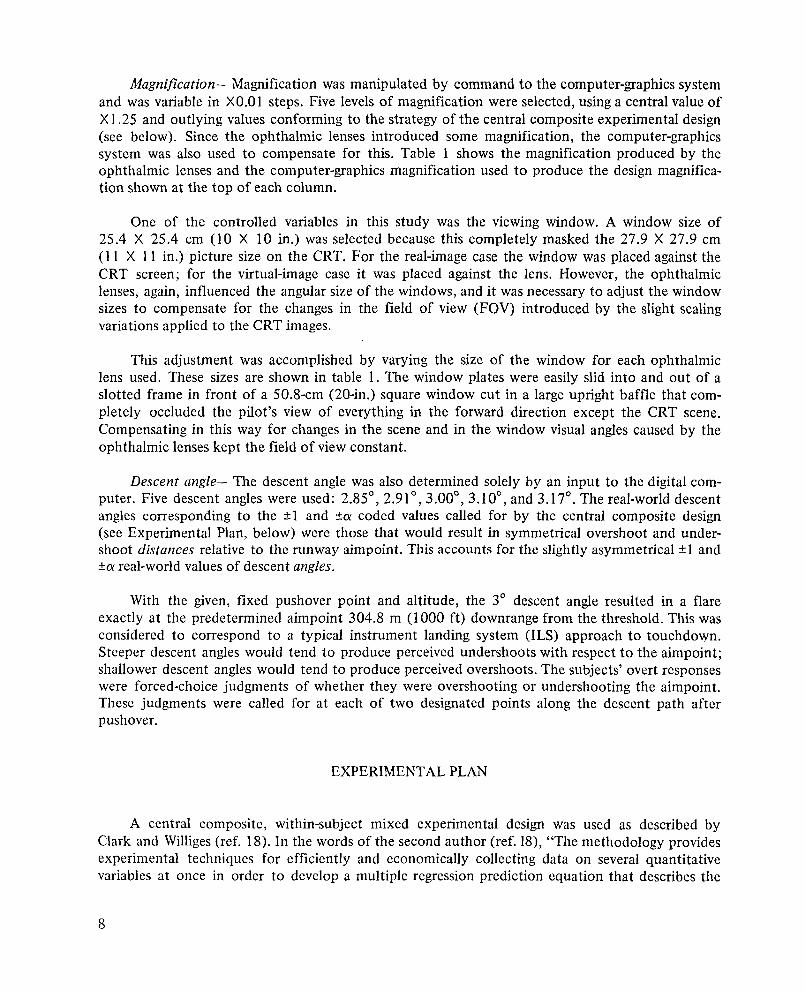
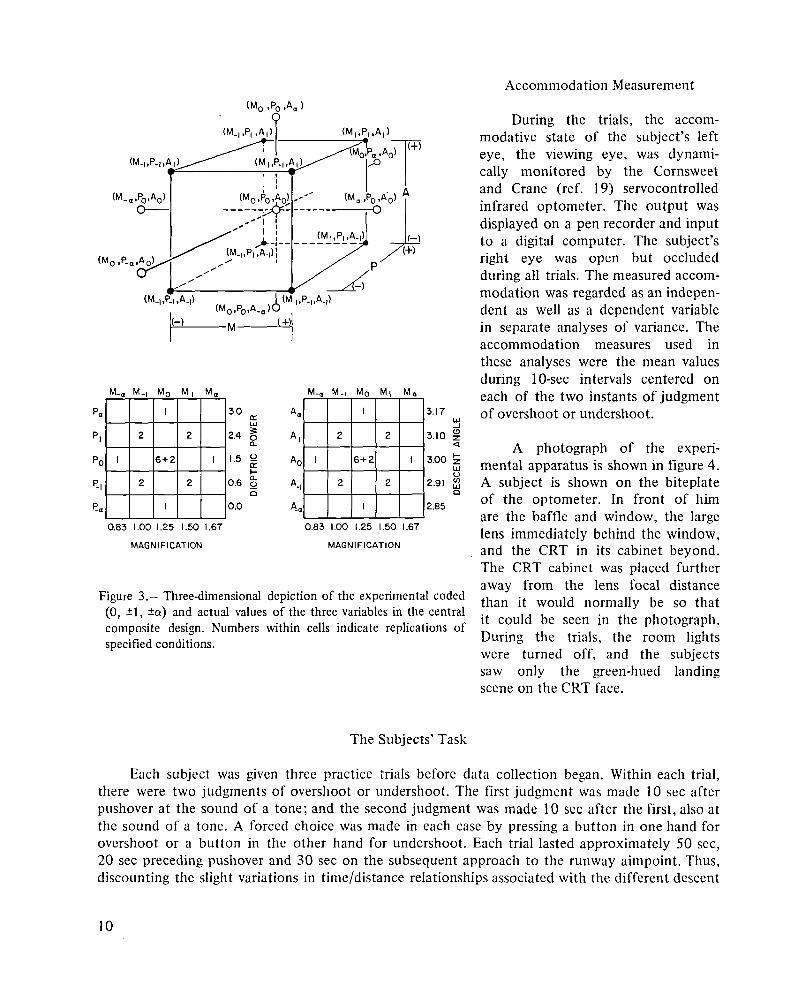
The response surface methodology (RSM) central composite design permitted the reduction of conditions to the 20 shown in table 2. Twenty pilots under each of the two viewing conditions required a total of only 800 trials. The values of the variables shown were selected in accordance with the constraints of the coded values of this particular design (fig. 3). Six conditions for each of the three variables are identical. These comprise the centerpoints for these variables in this design.
TABLE 2.- TRIAL CONDITIONS
Every other subject observed the virtual images first; alternate subjects viewed the real images first. Across the 20 subjects, the 20 trial conditions shown in table 2 appeared an equal number of times (20) in each of the 20 serial positions for each viewing condition (real or virtual). Further- more, the six trial conditions calling for centerpoint values of the three continuous variables were interspersed among the other trial conditions (no two of which were identical) so that no subject was presented the same combination of values twice in succession. Each subject started his trials at a different point in the resulting serial sequence.
T r 1
a I
1 2 3 4 5 6 7 8 9
10 11 12 13 14 15 16 17 18
! 1 9 20
Dioptric power (P)
Magnification (MI
- Descent angle
(A)
Code
1 - 1
1 - 1
1 - 1
- 1 0 0 0 0 a
-a 0 0 0 0 0 0
Code
1 1
-1 -1
1 1
-1 -1 0 0 a
-a 0 0 0 0 0 0 0 0
Code
1 1 1 1
-1 - 1 -1 - 1 a
-a 0 0 0 0 0 0 0 0 0 0
value
2.40 .60
2.40 .60
2.40 .60
1 2 . 4 0 .60
1.50 1.50 1.50 1.50
.OO 3.00 1.50 1.50 1 .SO 1.50 1.50 1.50
Actual value
1.50 1.50 1.00 1.00 1.50 1.50 1.00 1.00 1.25 1.25 1.67 .83
1.25 1.25 1.25 1.25 1.25 1.25 1.25 1.25
Actual value
3.10 3.10 3.10 3.10 2.91 2.91 2.91 2.91 3.17 2.85 3.00 3.00 3.00 3.00 3.00 3.00 3.00 3.00 3.00 3.00
Accommodation Measurement
During the trials, the accom- modative state of the subject's left eye, the viewing eye, was dynami- cally monitored by the Cornsweet and Crane (ref. 19) servocontrolled
(M-,,PO*AO) 0-- infrared optometer. The output was
displayed on a pen recorder and input to a digital computer. The subject's right eye was open but occluded
, , during all trials. The measured accom- modation was regarded as an indepen- dent as well as a dependent variable in separate analyses of variance. The accommodation measures used in these analyses were the mean values during 10-sec intervals centered on
MAGNIFICATION MAGNIFICATION
Figure 3.- Three-dimensional depiction of the experimental coded (0, 51, *a) and actual values of the three variables in the central composite design. Numbers within cells indicate replications of specified conditions.
u
each of the two instants of judgment of overshoot or undershoot.
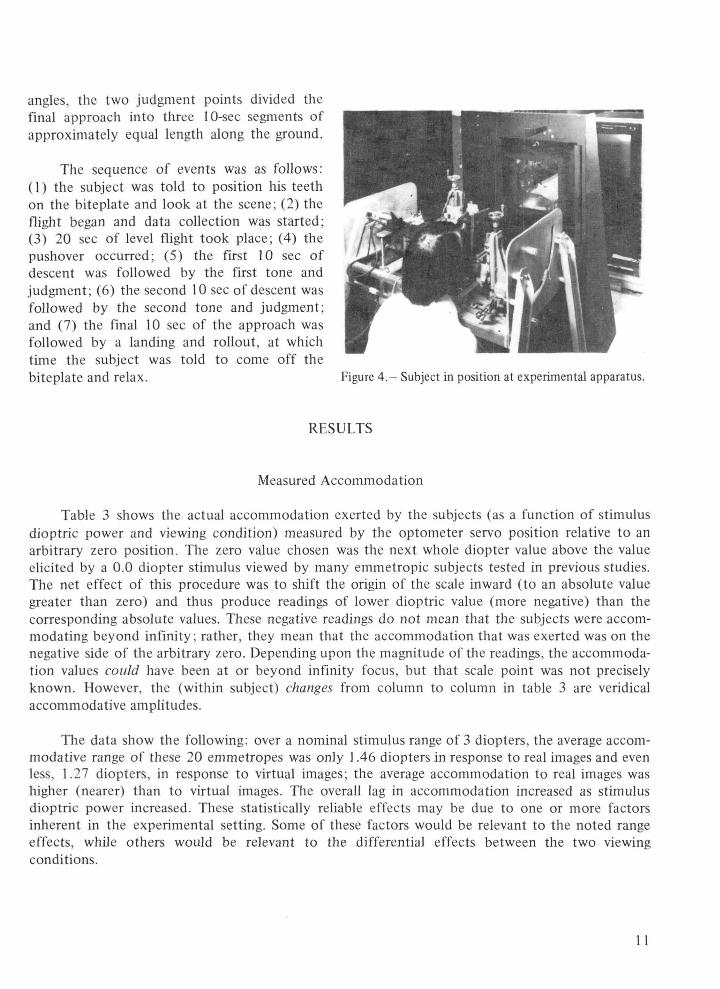
A photograph of the experi- mental apparatus is shown in figure 4. A subject is shown on the biteplate of the optometer. In front of him are the baffle and window, the large lens immediately behind the window, and the CRT in its cabinet beyond. The CRT cabinet was placed further away from the lens focal distance than it would normally be so that it could be seen in the photograph. During the trials, the room lights were turned off, and the subjects saw only the green-hued landing scene on the CRT face.
The Subjects' Task
Each subject was given three practice trials before data collection began. Within each trial, there were two judgments of overshoot or undershoot. The first judgment was made 10 sec after pushover at the sound of a tone; and the second judgment was made 10 sec after the first, also at the sound of a tone. A forced choice was made in each case by pressing a button in one hand for overshoot or a button in the other hand for undershoot. Each trial lasted approximately 50 sec, 20 sec preceding pushover and 30 sec on the subsequent approach to the runway aimpoint. Thus, discounting the slight variations in timeldistance relationships associated with the different descent
angles, the two judgment points divided the - . ~ -
final approach into three 10-sec segments of approximately equal length along the ground.
The sequence of events was as follows: (1) the subject was told to position his teeth on the biteplate and look at the scene; (2) the flight began and data collection was started; (3) 20 sec of level flight took place; (4) the pushover occurred; (5) the first 10 sec of descent was followed by the first tone and judgment; (6) the second 10 sec of descent was followed by the second tone and judgment; and (7) the final 10 sec of the approach was followed by a landing and rollout, at which time the subject was told to come off the biteplate and relax. Figure 4.- Subject in position at experimental apparatus.
RESULTS
Measured Accommodation
Table 3 shows the actual accommodation exerted by the subjects (as a function of stimulus dioptric power and viewing condition) measured by the optometer servo position relative t o an arbitrary zero position. The zero value chosen was the next whole diopter value above the value elicited by a 0.0 diopter stimulus viewed by many emmetropic subjects tested in previous studies. The net effect of this procedure was to shift the origin of the scale inward (to an absolute value greater than zero) and thus produce readings of lower dioptric value (more negative) than the corresponding absolute values. These negative readings do not mean that the subjects were accom- modating beyond infinity; rather, they mean that the accommodation that was exerted was on the negative side of the arbitrary zero. Depending upon the magnitude of the readings, the accommoda- tion values could have been at or beyond infinity focus, but that scale point was not precisely known. However, the (within subject) changes from column to column in table 3 are veridical accommodative amplitudes.
The data show the following: over a nominal stimulus range of 3 diopters, the average accom- modative range of these 20 emmetropes was only 1.46 diopters in response to real images and even less, 1.27 diopters, in response to virtual images; the average accommodation to real images was higher (nearer) than to virtual images. The overall lag in accommodation increased as stimulus dioptric power increased. These statistically reliable effects may be due to one or more factors inherent in the experimental setting. Some of these factors would be relevant to the noted range effects, while others would be relevant to the differential effects between the two viewing conditions.
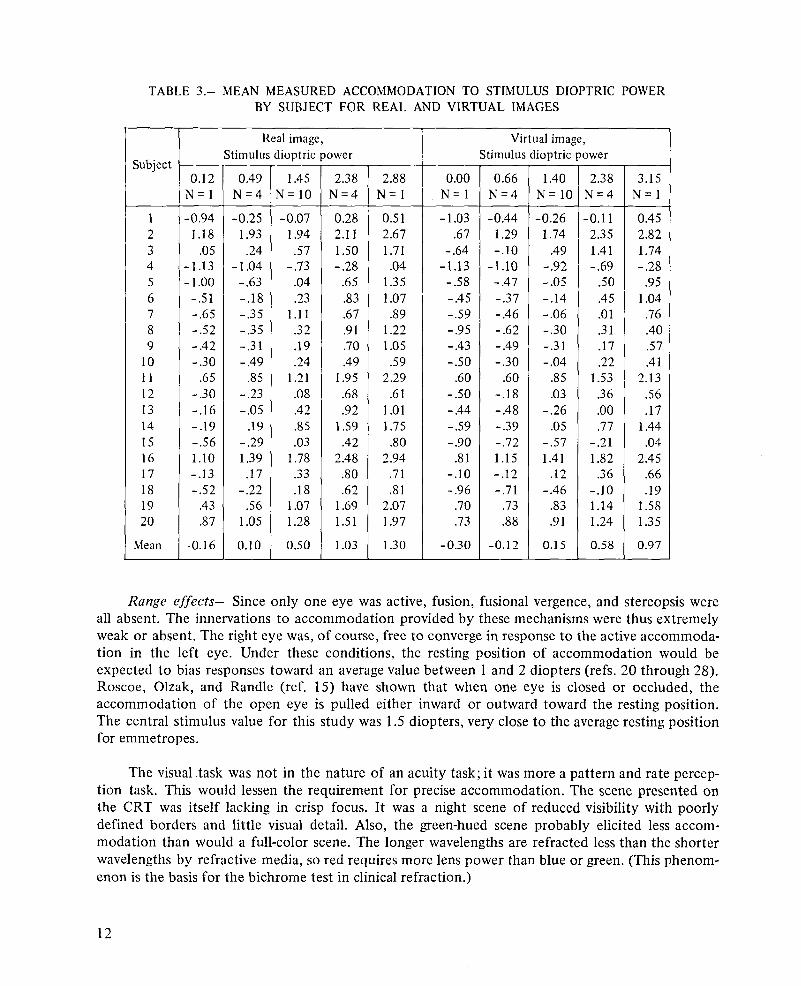
TABLE 3.- MEAN MEASURED ACCOMMODATION TO STIMULUS DIOPTRIC POWER BY SUBJECT FOR REAL AND VIRTUAL IMAGES
Range effects- Since only one eye was active, fusion, fusional vergence, and stereopsis were all absent. The innervations to accommodation provided by these mechanisms were thus extremely weak or absent. The right eye was, of course, free to converge in response to the active accommoda- tion in the left eye. Under these conditions, the resting position of accommodation would be expected to bias responses toward an average value between 1 and 2 diopters (refs. 20 through 28). Roscoe, Olzak, and Randle (ref. 15) have shown that when one eye is closed or occluded, the accommodation of the open eye is pulled either inward or outward toward the resting position. The central stimulus value for this study was 1.5 diopters, very close to the average resting position for emmetropes.
Subject
1 2 3 4 5 6 7 8 9
10 11 12 13 14 15 16 17 18 19 20
Mean
The visual task was not in the nature of an acuity task; it was more a pattern and rate percep- tion task. This would lessen the requirement for precise accommodation. The scene presented on the CRT was itself lacking in crisp focus. It was a night scene of reduced visibility with poorly defined borders and little visual detail. Also, the green-hued scene probably elicited less accom- modation than would a full-color scene. The longer wavelengths are refracted less than the shorter wavelengths by refractive media, so red requires more lens power than blue or green. (This phenom- enon is the basis for the bichrome test in clinical refraction.)
Real image,
0.12 N = l
-0.94 1.18
.05 -1.13
Virtual image,
-1.00 -.51 -.65 -.52 -.42 -.30
.65 -.30 -.I6 -.I9 -.56 1.10 -.I3 -.52
.43
.87
-0.16
0.00 N = l
-1.03 .67
-.64 -1.13
2.88 N = l
0.51 2.67 1.71 .04
Stimulus
0.49 N = 4
-0.25 1.93 .24
-1.04 -.63 -.I8 -.35 -.35 -.31 -.49
.85 -.23 -.05
.19 -.29 1.39 .17
-.22 .56
1.05
0.10
Stimulus
0.66 N = 4
-0.44 1.29 -.lo
-1.10
dioptric
1.45 N=10
-0.07 1.94 .57
-.73
dioptric
1.40 N=10
-0.26 1.74
.49 -.92
power
2.38 N = 4
-0.1 1 2.35 1.41 -.69
power
2.38 N = 4
0.28 2.11 1.50 -.28
.04
.23 1.1 1 .32 .19 .24
1.21 .08 .42 .85 .03
1.78 .33 .18
1.07 1.28
0.50
3.15 N = l
0.45 2.82 1.74 -.28
1.35 1 -.58 .65 .83 .67 .91 .70 .49
1.95 .68 .92
1.59 .42
2.48 .80 .62
1.69 1.51
1.03
1.07 .89
1.22 1.05 .59
2.29 .61
1.01 1.75 .80
2.94 .71 .81
2.07 1.97
1.30
-.47 -.37 -.46 -.62 -.49 -.30
.60 -.I8 -.48 -.39 -.72 1.15 -.I2 -.71
.73
.88
-0.12
-.45 -.59 -.95 -.43 -.SO
.60 -.SO -.44 -.59 -.90
.81 -.lo -.96
.70
.73
-0.30
-.05 -.I4 -.06 -.30 -.31 -.04
.85 -03
-.26 .05
-.57 1.41
.12 -.46
.83
.91
0.15
.SO
.45
.01
.31
.17
.22 1.53 .36 .OO .77
-.21 1.82 .36
-.lo 1.14 1.24
0.58
.95 1.04 .76 .40 .57 .41
2.13 .56 .17
1.44 .04
2.45 .66 .19
1.58 1.35
0.97
Accommodation is not normally measured continuously during the performance of a dynamic task requiring cognitive activity. When so measured, many nonvisual factors have recently been found to elicit previously unsuspected effects (refs. 22, 27, 29, and 30). For example, Malmstrom (ref. 30) showed that a concurrent mental task can reduce accommodative responses. The mental tasks used in Malmstrom's study were not related to the visual task, as they were in this experiment, so they might be more properly termed secondary tasks. It is not known whether a primary visual- cognitive task affects accommodation in the same way as an unrelated secondary task, but the former cannot be ruled out as a possible contributor to the truncated responses shown in table 3.
The median age of the subjects used in this study was 29 years, with the youngest being 25 and the oldest being 35. It is to be expected that this group would have a slight reduction in its accommodative range relative to that of the university undergraduate population samples typically reported.
Finally, with regard to range effects, in an interesting paper on the totality of the visual response, Skeffington (ref. 3 1) takes vision researchers to task for making unwarranted assumptions about the simplicity and regularity of the accommodation response. He makes his point by report- ing observations, using retinoscopy, in which subjects were seen to exert more accommodation when reading difficult material than when reading simpler text. The assumption made by researchers that nothing more need be done when the refractive error of experimental subjects is corrected by ophthalmic lenses (a procedure of rather frequent occurrence) is argued to be a source of serious artifact.
Differential effects- In spite of the attempt to equate all dimensions of the two viewing condi- tions, there still remained significant optical and qualitative differences. The real image distance was short enough to require convergence under normal binocular viewing. Thus, even with monocular viewing, accommodation would be higher due to the induced convergence-accommodation response. The virtual image, at infinity, required no convergence and so lacked the same kind of boost to accommodation. Any convergence would, of course, be taken up by the occluded right eye because the left was constrained to maintain fixation along the primary line of sight (ref. 32).
Another factor that may have contributed to the difference in accommodation for the two scenes was the difference in starting point, or visual set. It has been shown that a kind of biological hysteresis, or lag, in departing from or returning to a resting position is a strong component of accommodation dynamics. Malmstrom and Randle (ref. 28) found that the mean accommodation level achieved by 27 subjects after 30 sec of open-loop (pinhole) target viewing depended on the closed-loop starting level.
Between trials, the scene was not hidden from the subject's view, so all binocular cues and mechanisms were operating. In the case of the real images, this could have resulted in a nominal initial accommodation for each trial of 1.58 diopters, and for the virtual images a value of 0.0 diopters, to the extent that the subjects attended and responded to the visible scene. Qualita- tive differences between .the two viewing conditions could also be important in fostering these sets. The real image is seen as a two-dimensional, plane picture of the real world. The virtual image induces a compelling impression of both absolute and relative depth.
Finally, as an indirect consequence of these qualitative differences in displays, the proximal effect or awareness of nearness can support and enhance accommodation to obviously (by other

cues) close o r approaching targets and thereby produce higher accomnlodation levels t o the real images. Thus, accon~nlodation t o the real images was generally supported by cues normally present in the totality known as the near response but not present in the case of virtual images.
Analysis of Accommodation Data
Table 4 summarizes the analysis of variance of accommodation to real and virtual images for the values of the continuous experimental variables represented by the factorial corner points of the cubic portion of the experimental design shown in figure 3. Of the three reliable main effects, that effect due t o design dioptric power was, of course, expected. That effect due to the kind of itnage was probably explainable by one o r more of the factors just discussed. There is not , however, an obvious explanation for the difference in accommodation between first and second judgments; there was a reliable outward shift ( p < 0.025), although the mean difference was relatively small (0.05 diopters).
It is tempting to speculate that the approach t o a landing - even in a simulator - elicits a sympathetic response that drives accommodation outward by a small but measurable amount. Such an explanation depends on the validity of the generally but not universally accepted theory that oculomotor adjustments of accommodation are mediated by the dual innervation of the sympathetic and parasympathetic branches of the autonomic nervous system. According t o this theory, the sympathetic response would produce an outward shift from the resting position of dark focus, and the parasympathetic response would produce an inward shift. The dark focus reflects a relaxed balance between the two responses that varies from person to person.
A parsimonious alternative t o the sympathetic arousal explanation is that, as the airport and runway increase in apparent size and clarity, less accurate accommodation is required to resolve the scene. It should be noted that, between the times when first and second judgments were called for, not only did the angular size of the runway increase but also departures from the desired glidepath doubled in absolute magnitude and thus were more easily resolved (see fig. 2). Assuming the average dark focus (not measured) for these emmetropic professional pilots was closer t o 0.6 than to 2.4 diopters when less accurate accommodation was needed, the average response t o the two conditions woi~ld be expected to shift outward.
Of the three two-way interactions shown in table 4, the first, image by dioptric power, is of interest in that it parallels a corresponding interaction among the proportions of perceived under- shoots for these conditions (see fig. 5 and the associated discussion). Thus, at the two levels of the continuous experimental variables subjected t o the analysis of variance, the real images pro- duced a reliable increase in accommodation when design dioptric power increased from 0.6 to 2.4 whereas the virtual images did not ; this difference was accompanied by a corresponding interaction in subjective judgments of undershooting o r overshooting.
The last two two-way interactions - image by judgment and dioptric power by judgment - reflect the reduction. a t the second judgment point, of the increase in accommodation generally associated with the, real images and the higher design dioptric powers. The reliable three-way interaction - image by magnification by dioptric power - is puzzling. Why magnification would have the differential effect shown, or why it would have any effect a t all, is not known. It would
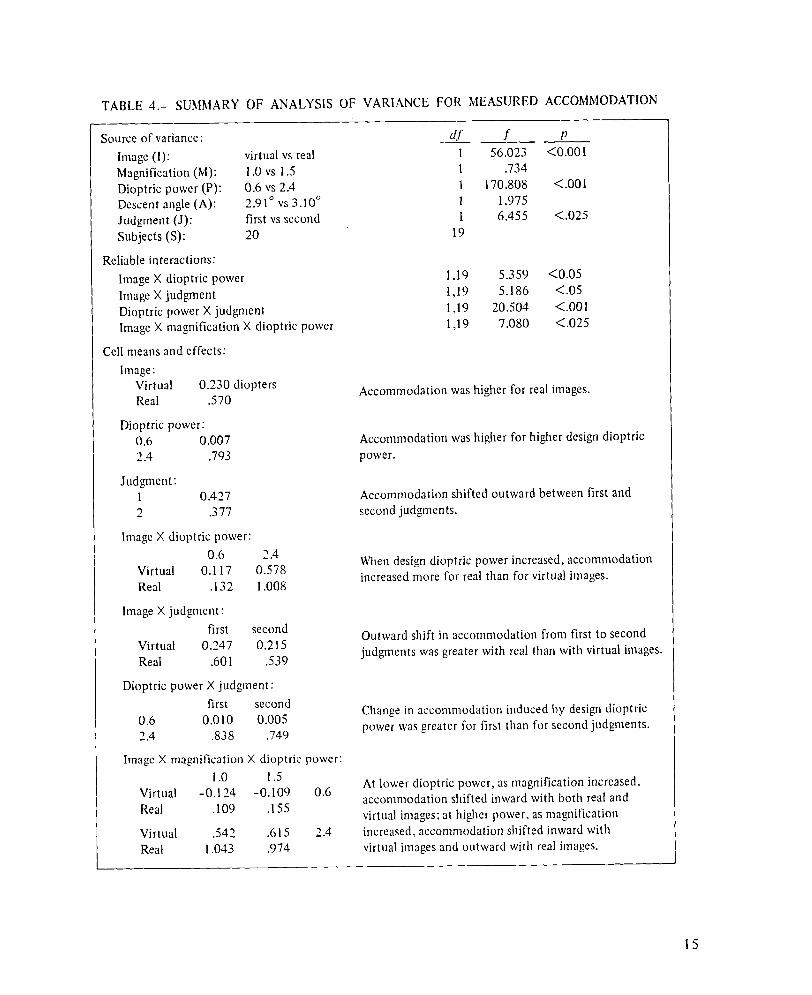
TABLE 4.- SUMMARY O F ANALYSIS O F VARIANCE FOR MEASURED ACCOMMODATION -
Source of variance: d f f - P Image (I): virtual vs real 1 56.023 <0.001
Magnification (M): 1.0 vs 1.5 1 .734
Dioptric power (P): 0.6 vs 2.4 I 170.808 <.001 Descent angle (A): 2.91' vs 3.10' 1 1.975 Judgment (J): first vs second 1 6.455 <.025
Subjects (S): 2 0 19
Reliable interactions:
Image X dioptric power lmage X judgment Dioptric power X judgment Image X magnification X dioptric power
I Cell means and effects: 1 Image:
Virtual 0.230 diopters Real .570
Accommodation was higher for real images.
Dioptric power: 0.6 0.007 Accommodation was higher for higher design dioptric 2.4 .793 power.
Judgment: 1 0.427 2 .377
Accommodation shifted outward between first and second judgments.
I lniage X dioptric power: I 0.6 1.4
Virtual 0.1 17 0.578 Real . I32 1.008
When design dioptric power increased, accommodation increased more for real than for virtual images.
I Image X judgnlent: 1 first second
Virtual 0.247 0.215 Real .60 1 .539
Outward shift in accomnlodation from first t o second judgments was greater with real than with virtual images.
I Dioptric power X judginent: I first second Change in accomnlodation induced by design dioptric
0.6 0.010 0.005 power was greater for first than for second judgnlents. 1.4 3 3 8 .749
( Image X magnification X dioptric power: I 1 .O 1.5 At lower dioptric power, as magnification increased,
Virtual 24 -''Io9 acconlnlodation shifted inward with both real and Real . I09 . I55 virtual images; at higher power. as magnification Virtual .542 .615 2.4 increased, acconimodation shifted inward with Real 1.043 .974 virtual images and outward with real images.
REAL IMAGES VIRTUAL IMAGES
MAGNIFICATION MAGNIFICATION
0 I cn
DlOPTRlC POWER DlOPTRlC POWER
z 2 8 -
2nd Judgment
W 5 -
LL '-
I r t Judgment 0 I - ' l 0 2'4 1'5 0 6 I
0 0 3 0 2 4 15 0 6 0
L
( DESCENT ANGLE I
2 n d Judgment @ 0 35
0 23 0 2 0
0 25
0 10 1st Judgment
2.85 2.91 3.00 3.10 3 17 (NzI1 (N.41 (N:101 (Nz41 lN:II
1 DESCENT ANGLE I
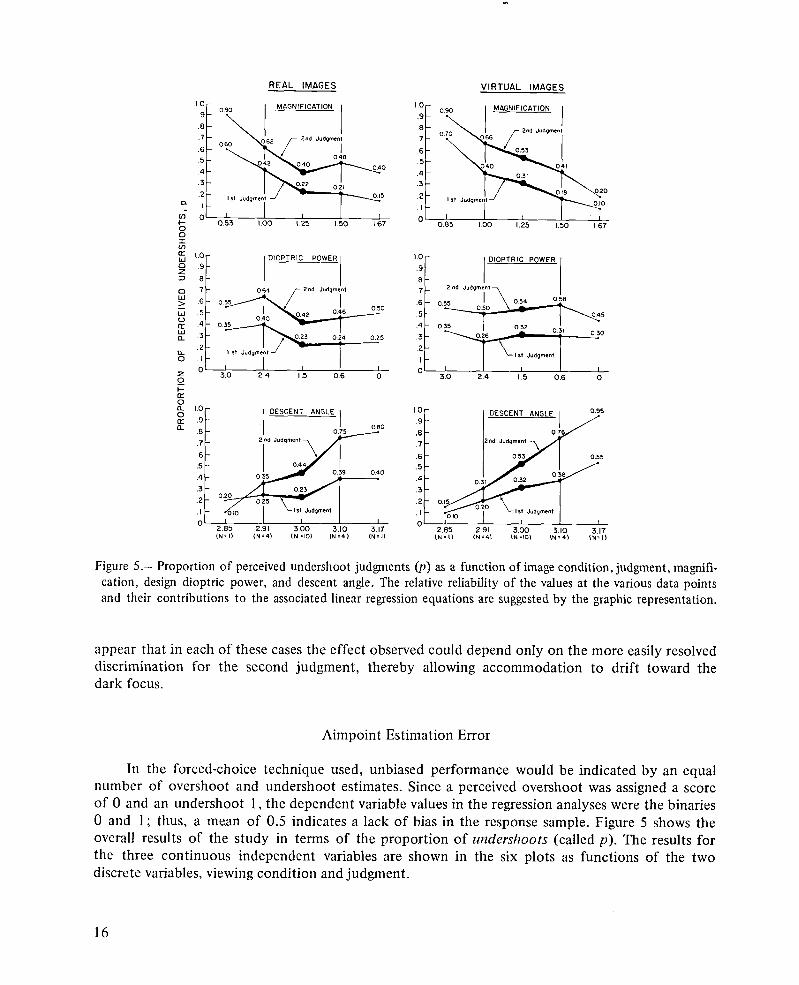
Figure 5.- Proportion of perceived undershoot judgments (p) as a function of image condition, judgment, magnifi- cation, design dioptric power, and descent angle. The relative reliability of the values at the various data points and their contributions to the associated linear regression equations are suggested by the graphic representation.
appear that in each of these cases the effect observed could depend only on the more easily resolved discrimination for the second judgment, thereby allowing accommodation to drift toward the dark focus.
Aimpoint Estimation Error
In the forced-choice technique used, unbiased performance would be indicated by an equal number of overshoot and undershoot estimates. Since a perceived overshoot was assigned a score of 0 and an undershoot 1, the dependent variable values in the regression analyses were the binaries 0 and 1 ; thus, a mean of 0.5 indicates a lack of bias in the response sample. Figure 5 shows the overall results of the study in terms of the proportion of undershoots (called p). The results for the three continuous independent variables are shown in the six plots as functions of the two discrete variables, viewing condition and judgment.
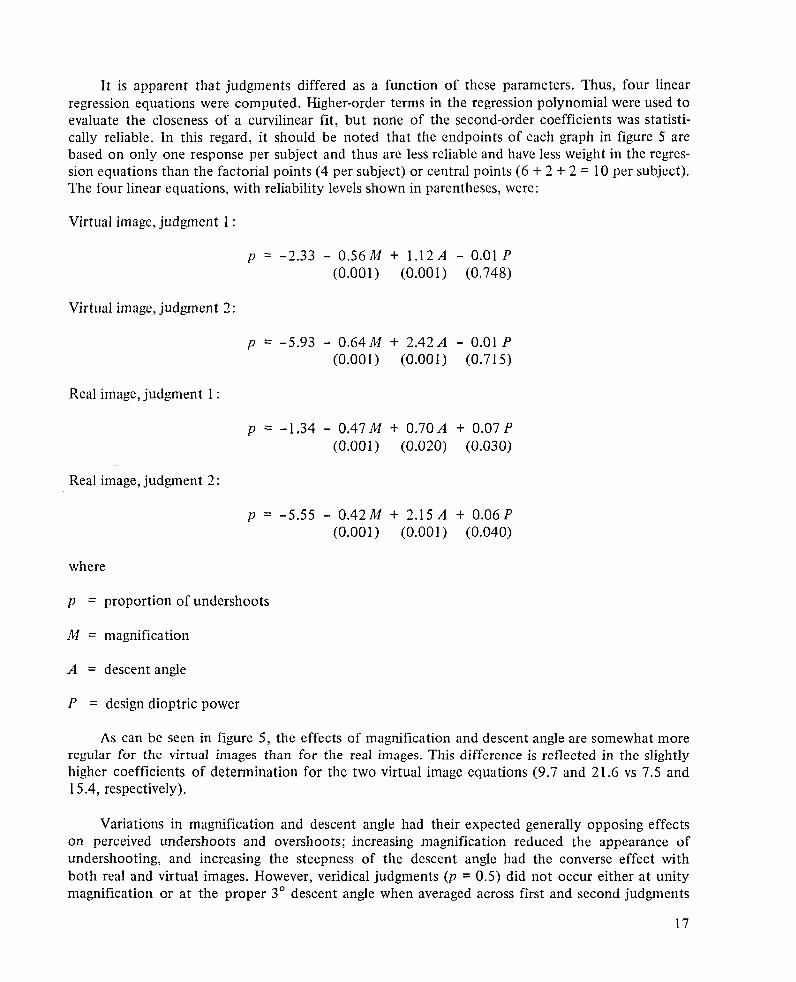
It is apparent that judgments differed as a function of these parameters. Thus, four linear regression equations were computed. Higher-order terms in the regression polynomial were used to evaluate the closeness of a curvilinear fit, but none of the second-order coefficients was statisti- cally reliable. In this regard, it should be noted that the endpoints of each graph in figure 5 are based on only one response per subject and thus are less reliable and have less weight in the regres- sion equations than the factorial points (4 per subject) or central points (6 + 2 + 2 = 10 per subject). The four linear equations, with reliability levels shown in parentheses, were:
Virtual image, judgment 1 :
Virtual image, judgment 2:
Real image, judgment 1
Real image, judgment 2:
where
p = proportion of undershoots
M = magnification
A = descent angle
P = design dioptric power
As can be seen in figure 5, the effects of magnification and descent angle are somewhat more regular for the virtual images than for the real images. This difference is reflected in the slightly higher coefficients of determination for the two virtual image equations (9.7 and 21.6 vs 7.5 and 1 5.4, respectively).
Variations in magnification and descent angle had their expected generally opposing effects on perceived undershoots and overshoots; increasing magnification reduced the appearance of undershooting, and increasing the steepness of the descent angle had the converse effect with both real and virtual images. However, veridical judgments (p = 0.5) did not occur either at unity magnification or at the proper 3 O descent angle when averaged across first and second judgments
for all experimental conditions. In fact, the differences between first and second judgments are so pronounced as to suggest that different processes determined perceptions at the two points.
The first judgment was made 10 sec after pushover, at which time the simulated range to touchdown was about 1220 m (4000 ft); the second judgment was made 10 sec later at a range of about 6 10 m (2000 ft). Despite the relatively small change in position, responses to the computer- generated images shifted sharply from a large overshooting bias to a slight undershooting bias. Veridical second judgments (i.e., p = 0.5), averaged across all conditions, occurred near the magni- fication of 1.25; at unity, second judgments were biased toward undershooting. Presumably if the pilots were flying manually, they would have made corrections causing them to land long and hard, as found by Palmer and Cronn (ref. 5).
This extreme dichotomy between first and second judgments for each image condition complicates the question of what image magnification is best for the production of unbiased judg- ments in each case. Solving the four regression equations for M, given p = 0.5, A = 3", and P = 1.5 (the central dioptric power) yields minifications of 0.78 and 0.92 for first judgments with real and virtual images, respectively, and corresponding magnifications of 1.17 and 1.27 for second judgments. Thus, based on the visual judgment data provided by this experiment, minification would be required for unbiased performance at 20 sec before flare, and magnification would be required 10 sec later. It is not known whether these requirements would apply to all synthetic visual systems or only to the unique display conditions synthesized for this experiment.
Despite the difficulty of imagining any real-world counterpart to this strange shifting-judgment phenomenon, it is not unlikely that, between 20 and 10 sec before touchdown, dramatic perceptual changes do occur on simulated night landing approaches. It is at about this range that what was a small, poorly resolved trapezoid (see fig. 1) takes on the definite configuration of an airport. On actual night landing approaches, it is also during this interval that pilots typically transition from an ILS display to external reference and make final flightpath control adjustments. Adjustments made later than 10 sec before landing have little effect on the point of touchdown unless changes in thrust are applied.
As a possible explanation for what typically happens at night, it could be that pilots habitually make low approaches to avoid overshooting and, when they are 1220 m (4000 ft) ou,t, expect the runway to appear as it does from a position below the 3" approach path. This might account for their biased overshooting judgments 1'0 sec after pushover while still very close to the correct vertical position. At 610 m (2000 ft) out, they can resolve their vertical position better and, if hand flying, would normally maintain or increase thrust to carry the airplane to a touchdown well down the runway. However, because of the lags in jet engine response, pilots often leave power on too long or add too much and overshoot the aimpoint at night. Conversely, on a rare occasion when a pilot is slow in recognizing his low position, possibly because of an unfamiliar or illusory background lighting configuration, and is late in adding power, he may land short as has happened in several night landing accidents since the advent of turbojet engines.
A further speculation on real-world events, though not tested by the present experiment, involves possible changes in visual accommodation during night landing approaches over water. At 1220 m (4000 ft) out, the dominant cues for accommodation, namely the airport lighting system and the lighted city beyond, appear as a thin horizontal band of point sources at a relatively great distance; far accommodation is required to resolve the scene. As the airplane approaches the
runway, the band deepens and comes nearer, the runway lights are Inore easily resolved. and accom- modation drifts inward from its distant trap.
In this experiment, there was an opposite response to the computer-generated displays; namely, accommodation drifted oritrvurd between first and second judgments by a small but reliable amount. However, in an experiment subsequently conducted at the University of Illinois involving distant real-world scenes viewed in the daylight from a high building, lavecchia, Iavecchia, and Roscoe (ref. 33) found a strong correlation (i' = 0.89) between the distance to which the eye accom- modates and the distance to the nearest visible texture. Simonelli and Roscoe (ref. 34) have con- firmed this finding for similar scenes viewed at night, although the correlation was somewhat weaker (r = 0.70).
Analysis of Judgments and Accommodation
A major concern of this study was the possible relationship between visual accommodation and undershoot/oversl~oot judgments. An accommodative ~nicropsia hypothesis would call for an increasing number of undershoot estimates with increasing design dioptric powers (if the retinal image is smaller, the runway should appear farther away, as it would also with convergence-induced micropsia). The four regression equations for p show reliable coefficients for P, design dioptric power, with the real image display (p = 0.03 and 0.04 for first and second judgments. respectively) but not with the virtual image display (p = 0.75 and 0.72, respectively). Thus, the manipulation of P, optically increasing the near stimulus, had the predicted effect for real images only.
As was done with the measured accommodation data, the variance of the p values was analyzed for the factorial portion of the experimental design (from fig. 3). Judgments shifted reliably with changes in image magnification and descent angle (p < 0.005 and 0.001. respectively). There was also a reliable shift from first to second judgments as shown in figure 5 ( p < 0.001). The overall differences in responses to the real and virtual images was not reliable. However. paralleling the analysis of variance of measured accommodation, there was a reliable interaction (p < 0.005) between image type and design dioptric power a t the same values of this independent variable, 0.6 and 2.4 diopters.
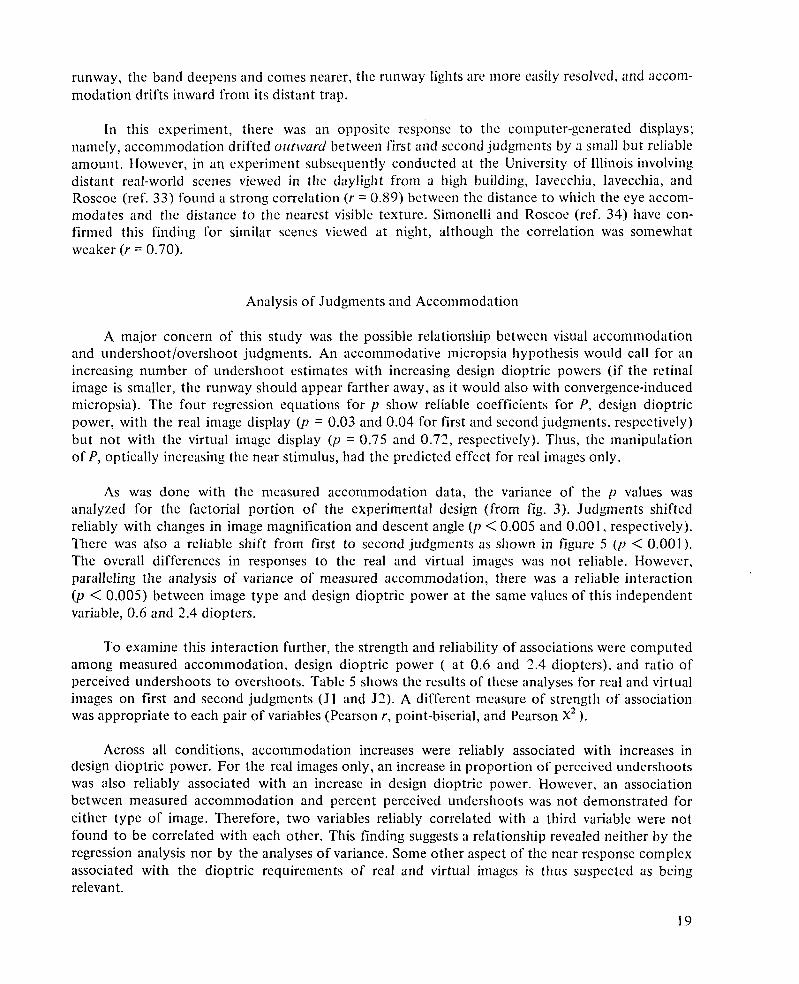
T o examine this interaction further, the strength and reliability of associations were computed among measured accommodation. design dioptric power ( at 0.6 and 3.4 diopters), and ratio of perceived undershoots t o overshoots. Table 5 shows the results of these analyses for real and virtual images on first and second judgments (J1 and 52). A different measure of strength of association was appropriate t o each pair of variables (Pearson r, point-biserial, and Pearson x2 ).
Across all conditions, accommodation increases were reliably associated with increases in design dioptric power. For the real images only, an increase in proportion of perceived undershoots was also reliably associated with an increase in design dioptric power. However, an association between measured accommodation and percent perceived underslloots was not demonstrated for either type of image. Therefore, two variables reliably correlated with a third variable were not found t o be correlated with each other. This finding suggests a relationship revealed neither by the regression analysis nor by the analyses of variance. Some other aspect of the near response complex associated with the dioptric requirements of real and virtual images is thus suspected as being relevant.
TABLE 5.- STRENGTH AND RELIABILITY OF ASSOCIATIONS AMONG THREE VARIATE PAIRS
DISCUSSION
Pearson r: measured accommodation (mean of 4 scores for each of 20 pilots) at each of two levels of design dioptic power (0.6 and 2.4 diopters) (df = 38).
Point-biserial: measured accommodation (4 scores for each of 20 pilots) at each of two levels of design dioptric power (0.6 and 2.4 diopters) and undershoot/overshoot judgments (df = 158).
Pearson xZ : strength of contingency between two levels of design dioptric power (0.6 and 2.4 diopters) and undershoot/overshoot judgments (df = 1).
Image Magnification
The first goal of this study was to determine the relationship between image magnification and the estimation of touchdown aimpoint. A major characteristic of that relationship was the bimodality of first and second judgments. Early in the landing approach, minification was required to produce unbiased estimates; as the landing aimpoint was approached, magnification was required. It is not possible, with only two judgment points, to determine whether the perceptual change occurs gradually as a function of range or abruptly. However, the mean p (proportion of under- shoots) for the first and second judgments a t X1.O magnification is 0.52 for the real images and 0.53 for the virtual images. These are very nearly veridical for a hypothetical judgment point halfway down the approach slope in this experiment (see fig. 5).
Judgment
51
52
J 1
52
51
52
On the other hand, it might be expected that a pilot's actual point of touchdown would be influenced more by the second judgment due t o the fact that the nearer scene is better resolved and, at 10 sec before touchdown, there is still time for effective control. For the second judgment at unity magnification, the mean p for real and virtual images is 0.64; a magnification of X 1.25 is required t o produce nearly unbiased performance, specifically, p = 0.47. This result is consistent with previous studies reviewed. However, for real images only, the case most closely resembling a projection periscope display, it is seen that veridical second judgments occurred at about X 1.12.
The extent to which the dramatic change in estimates as a function of range to touchdown is paralleled in real-world night landing approaches is not known. The common "duck-under" maneuver in which pilots descend below glide slope in visual approaches, particularly at night, may be reflected in these results. Also, the simulated scene, at the first judgment point in particular, created in part the "black-hole" phenomenon that occurs whenever an approach is made over darkened terrain or water. The runway and its background of city lights may appear to slope upward toward the horizon beyond (at many airports, they actually d o so). If the pilot perceives
Image type - Real
0.56 (p < 0.01)
.54 (p < 0.01)
.05 (not reliable)
.02 (not reliable)
4.14 (p < 0.05)
4.27 (p < 0.05)
Virtual
0.45 (p < 0.01)
.43 (p < 0.01)
- .09 (not reliable)
-.03 (not reliable)
.28 (not reliable)
.63 (not reliable)
that the approach path is too high and accordingly steepens his descent, a "controlled flight into terrain" can occur as much as 5 or 6 km short of the runway.
To compensate for this duck-under tendency, pilots often increase thrust late in the approach and convert to a high level-off and a subsequent long and hard landing. Note that the tendency t o round out high and land hard is a fairly consistent finding in simulator studies of visual approaches and landings at night (ref. 5). Is this a peculiarity of CGI visual simulators, or is it an amplification of real-world correlates? It may be that the judgment points in this experiment bracketed the transition from real-world overshoot estimates to the corrected, more veridical, estimates occa- sioned by the increasingly interpretable runway scene as range decreased.
The effect of descent angle on p as a function of judgment is also strongly dichotomized. For second judgments, with either type of image, the results seem to be a reasonable function of descent angle. However, for first judgments with the virtual images, unbiased performance occurred only when the descent angle was greater than 3.10°, and with the real images it did not occur even at 3.17". The interaction between proportions of perceived undershoots for judgments and descent angles shown in figure 5 was also reliable (p < 0.001 ). This suggested a change in simulator fidelity between the two judgment points.
Visual Accommodation
The second goal of the study was to determine the relationship between visual accommodation and the estimation of touchdown aimpoint. For the real-image condition, an association was demonstrated between the near response (to P = 2.4 vs 0.6) and proportion of perceived under- shoots. Measured accommodation which also increased reliably was, nevertheless, not shown to be related to the increase in undershoots. The study by Alexander (ref. 14) included one stimulus condition closely analogous to the real-image condition in this study: a stimulus at near distance; negative ophthalmic lenses placed before one eye; the other eye occluded, thus free t o converge. Under these conditions, micropsia was present whereas it had not been when both eyes fixated the target and convergence remained fixed while dioptric power increased. However, Alexander did not measure accommodation.
In the case of the virtual images, no statistically reliable relationship was demonstrated between dioptric power and proportion of perceived undershoots. Convergence was not required for the collimated images so that the net effect of adding a dioptric demand was scaled-down increase in accommodation, even less than occurred for the real images. Some accommodative convergence may have accompanied the relatively weak accommodation response, but it was probably small given that it was not supported by the collimated stimulus. These results would seem to support the continued use of virtual image visual scenes in research and training flight simulators.
Real and Virtual Images
The third goal of the study was to determine whether there were differences between percep- tual and accommodative responses to real and virtual images. Although this is largely covered in the preceding discussion, one aspect requires further comment. If a real-image display is placed at
a viewing distance of about 40 cm (16 in.), the stimulus dioptric power required for clear focus, as determined strictly by geometrical optics, would be 2.5 diopters. This value, given the results shown in figure 5, would produce an undershoot bias for close-in judgments. However, if the display is collimated, the demand for a near response is eliminated.
Accommodation as a Response
Investigators of visual accommodation occasionally fail t o specify whether accommodation, as a dependent variable, refers t o the accommodative stimulus or the actual accommodative response. This distinction is important because retinal image quality is not solely determined by accommodztion but may be considerably modulated by pupil size and other oculomotor adjust- ments. Pupil size may be decreased by artificial means t o such an extent that the accommodation loop is effectively opened and the accommodative response has no discernible effect on the quality of the retinal image. Also, the demands imposed by the visual task are a large determiner of the amount of blur that the visual system will accept.
This leads to a consideration of what are the necessary and sufficient stimulus conditions that lead to a change in accommodation. What is the error signal, and how is it processed? Answers to these questions are still unresolved, although many candidate processes have been explored - changes in chromatic and/or spherical aberration with changes in target distance; the 2 Hz oscilla- tion, thought to be a hunting or sampling mechanism; changes in target size and intensity - all with inconclusive results (ref. 35).
One algorithm proposed by Cornsweet and Crane (ref. 35) as a possible error sensing mech- anism is the following: the accommodation system maintains a constant lag by never exerting quite as much power as the visual target would require based on geometrical optics. That is, it maintains a position between the target and infinity. The amount of difference could be related to within-subject factors and so would vary among individuals. Now, when the target moves closer to the observer, the amount of blur increases; when it moves away, blur decreases. This provides a signed error signal and requires a constant lag behind the target.
Unfortunately, this notion has not been verified, and one of its obvious difficulties is the behavior of the mechanism for targets at optical infinity or beyond (negative dioptric values). To encompass all experimental findings, including far-point accommodation values of -2 diopters and more, the algorithm has been extended by R. T. Hennessy (personal communication) to represent bidirectional active processes operating outward as well as inward from the relaxed state of dark focus, which has been shown by many studies t o be nominally about + I diopter. Hennessy's model, at least theoretically, obviates the previous difficulties for zero and negative dioptric values, but i t needs empirical validation.
Ames Research Center National Aeronautics and Space Administration
Moffett Field, California 94035, January 29, 1980

1. Roscoe, S. N.: Aircraft Pilot Perforniance as a Function of the Extent and Magnification of the Visible Horizon. Unpublished Doctoral Dissertation, University of Illinois at Urbana-Champaign, 1950.
2. Roscoe, S. N.; Dougherty, D. J.: and Hasler, S. G.: Flight by Periscope: Making Takeoffs and Landings; the Influence of Image Magnification, Practice, and Various Conditions of Flight. Human Factors, vol. 8 , 1966, p ~ . 13-40.
3. Campbell, C. J.; McEachern, L. J.; and Marg, E.: Flight by Periscope. Wright-Patterson AFB, WADC TR 55-142, March 1955.
4. Imber, B. N.; Stern, D.; and Vanderplas, M.: Visual Field Restriction and Apparent Size of Distant Objects. Wright-Patterson AFB, WADC TR 54-23, Jan. 1954.
5. Palmer, E. A.; and Cronn, F. W.: Touchdown Performance With a Computer Graphics Night Visual Attachment. AIAA Paper 73-927, presented at AIAA Visual and Motion Simulation Conference, Palo Alto, Calif., Sept. 10-12, 1973.
6. Schober, H. A. W.; Dehler, H.; and Kassel, R.: Accommodation During Observations With Optical Instruments. J. Opt. Soc. Am., vol. 60, 1970, pp. 103-107.
7. Hennessy, R. T.: Instrument Myopia. J. Opt. Soc. America, vol. 65, 1975, pp. 11 14-1 120.
8. Randle, R. J.: Results of Skylab Experiment T002, Manual Navigation Sightings. NASA TN D-8141, 1976.
9. Davson, H.. ed.: The Eye. Volume IV. Visual Optics and the Optical Space Sense. Academic Press, 1962.
10. Pascal, J. I.: Effect of Acconimodation on the Retinal Image. British J. Ophthal., vol. 36, 1952, pp. 676-678.
11. Biersdorf, W. R.; and Baird, J. C.: Effects of an Artificial Pupil and Accommodation on Retinal Image Size. J. Opt. Soc. America, vol. 56, 1966, pp. 1 123-1 129.
12. Blank, K.; and Enoch, J. M.: Monocular Spatial Distortions Induced by Marked Accommodation. Science, VOI. 182, Oct. 26, 1973, pp. 393-395.
13. Heineniann, E. G.; Tulving, E.; and Nachmias, J.: The Effect of Oculomotor Adjustments on Apparent Size. American J. Psych., vol. 72, 1959, pp. 3245.
14. Alexander, K. R.: On the Nature of Accomniodative Micropsia. American J. Optom. & Physiol. Optics, vol. 52, Feb. 1975, pp. 79-84.
15. Roscoe, S. N.; Olzak, L. A.; and Randle, R. J.: Ground Referenced Visual Orientation With Imaging Displays: Monocular Versus Binocular Accommodation and Judgments of Relative Size. AGARD CP-201, Proceed- ings of the AGARD Aerospace Medical Panel Specialists Meeting, Athens, Greece, Sept. 20-24, 1976.
16. Ganzler, B. C.: Virtual Image Display for Flight Simulation. NASA TM X-2327, 1971.
17. Ogle, K. N.: Optics. Charles C. Thomas, 1961.

18. Clark, C.; and Williges, R. C.: Response Surface Methodology Central-Composite Design Modifications for Human Performance Research. Human Factors, vol. 15,1973, pp. 295-310.
19. Cornsweet, T. N.; and Crane, H. D.: Servo Controlled Infra-Red Optometer. J. Opt. Soc. America, vol. 60, 1970, pp. 548-554.
20. Morgan. M. W., Jr.: The Resting State of Accommodation. American J. Opt. and Arch. American Acad. Opt., vol. 34, 1957, pp. 347-353.
21. Schober, H.: On the Resting Position of Accommodation. Optik, vol. 11, no. 6, 1954, pp. 282-290. Translated by R. Koech and H. Leibowitz, Dept. of Psychology, Pennsylvania State University, 1968.
22. Hennessy, R. T.: Stimulus and Nonstimulus Factors Affecting Accommodation With Particular Reference to Instrument Myopia. Ph.D. Thesis, Pennsylvania State University, 1972.
23. Westheimer, G.; and Blair, S. M.: Accommodation of the Eye During Sleep and Anesthesia. Vis. Res., vol. 13, 1973, pp. 1035-1040.
24. Johnson, C. A.: Effects of Luminance and Stimulus Distance on Accommodation and Visual Resolution. J. Opt. Soc. America, vol. 66,1976, pp. 138-142.
25. Hennessy, R. T.; Iida, T.; Shina, K.; and Leibowitz, H. W.: The Effect of Pupil Size on Accommodation. Vis. Res., vol. 16, 1976, pp. 587-589.
26. Leibowitz, H. W.; and Owens, D. A.: Night Myopia and the Intermediate Dark Focus of Accommodation. J. Opt. Soc. America, vol. 65, 1975, pp. 1121-1 128.
27. Randle, R. J.: The Non-Visual in Visual Accommodation. I.E.E.E., 1975. International Conference on Cyber- netics and Society, San Francisco, Calif., Sept. 23-25, 1975.
28. Malmstrom, F. V.; and Randle, R. J.: Effects of Visual Imagery on the Accommodation Response. Perception and Psychophysics, vol. 19, 1976, pp. 450453.
29. Clark, B.; Randle, R. J.; and Stewart, J. D.: Vestibular-Ocular Accommodation Reflex in Man. Aviation, Space, and Environmental Medicine, vol. 46, 1975, pp. 1336-1339.
30. Maln~strom, F. V.: Effects of Concurrent Mental Activity on Static and Dynamic Accommodation Responses. Ph.D. Thesis, Oklahoma State University, 1978.
31. Skeffington, A. M.: The Totality of Vision. American J. Opt. and Arch. American Acad. Opt., vol. 34, 1956, pp. 241-255.
32. Alpern, M.; and Ellen, P.: A Quantitative Analysis of the Horizonal Movements of the Eyes in the Experiment of Johannes Mueller. I. Method and Results. American J. Opt., vol. 42,1956, pp. 296-303.
33. Iavecchia, J. H.; Iavecchia, H. P.; and Roscoe, S. N.: The Moon Illusion: Apparent Size and Visual Accommoda- tion Distance. Tech. Rep. Eng. Psy-784lAFOSR-78-3, Dept. of Psychology, University of Illinois at Urbana- Champaign, 1978.
34. Simonelli, N. M.; and Roscoe, S. N.: Apparent Size and Visual Accommodation Under Day and Night Condi- tions. Tech. Rep. Eng. Psy-79-31AFOSR-79-3, Dept. of Psychology, University of Illinois at Urbana- Champaign, 1979.
35. Cornsweet, T. N.; and Crane, H. D.: Experimental Study of Visual Accommodation. NASA CR-2007, 1972.

'For sale by the National Technic4 Information Service. Springfield, Virginia 22161 NASA-Langley , 1980
, 1. Report No.
NASA TP- 1 63 5 2. Government Accession No. 3. Recipient's Catalog No.
4. Title and Subtitle
EFFECTS OF MAGNIFICATION AND VISUAL ACCOM- MODATION ON AIMPOINT ESTIMATION IN SIMULATED
INGS Wm R E AT, AND VIBTUAT. IMAGE DISPLAYS 7. Author(s)
Robert J. Randle, S t a n l e y N. Roscoe, and John C . P e t i t t 9. Performing Organization Name and Address
NASA Ames Research Cente r M o f f e t t F i e l d , CA 94035
12. Sponsoring Agency Name and Address
National Aeronautics and Space Administration Washington, D. C. 20546
15. Supplementary Notes
5. Report Date
October 1980 6. Performing Organization Code
8 . Performing Organization Report No.
A-8 104 10. Work Unit No.
505-35-3 1 11. Contract or Grant No.
13. Type of Report and Period Covered
Technical Paper 14. Sponsoring Agency Code
Robert J. Randle: Ames Research Cente r . S t a n l e y N. Roscoe: New Mexico S t a t e U n i v e r s i t y , Las Cruces , NM 88001. John C. P e t i t t : U n i v e r s i t y of C a l i f o r n i a , San Diego, CA 92037.
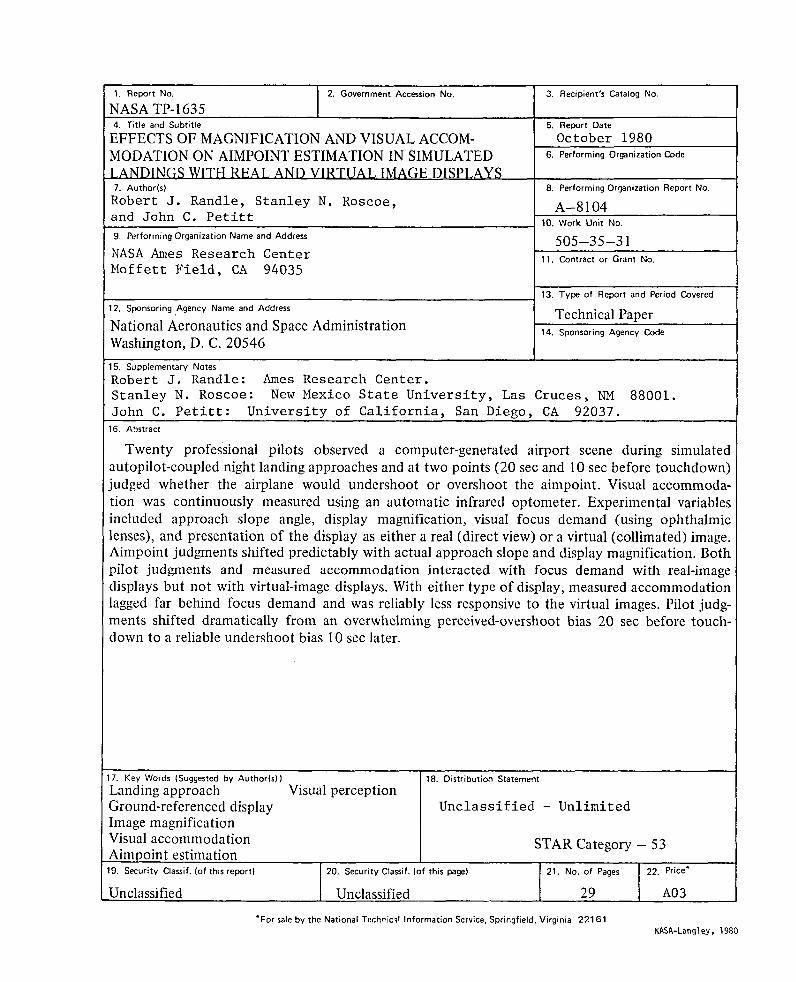
16. Abstract
Twenty profes'sional pilots observed a computer-generated airport scene during simulated autopilot-coupled night landing approaches and at two points (20 sec and 10 sec before touchdown) judged whether the airplane would undershoot or overshoot the aimpoint. Visual accommoda- tion was continuously measured using an automatic infrared optometer. Experimental variables included approach slope angle, display magnification, visual focus demand (using ophthalmic lenses), and presentation of the display as either a real (direct view) or a virtual (collimated) image. Aimpoint judgments shifted predictably with actual approach slope and display magnification. Both pilot judgments and measured accommodation interacted with focus demand with real-image displays but not with virtual-image displays. With either type of display, measured accommodation lagged far behind focus demand and was reliably less responsive to the virtual images. Pilot judg- ments shifted dramatically from an overwhelming perceived-overshoot bias 20 sec before touch- down to a reliable undershoot bias 10 sec later.
17. Key Words (Suggested by Authorls))
Landing approach Visual perception Ground-referenced display Image magnification Visual accommodation Aimpoint estimation
18. Distribution Statement
U n c l a s s i f i e d - Unlimited
STAR Category - 53
19. Security Classif. (of th~s report)
Unclassified
20. Security Classif. (of this page)
Unclassified
21. No. of Pages
2 9
22. Price'
A03

National Aeronautics and Space Administration
Washington, D.C. 20546
Official Business
Penalty for Private Use, $300
THIRD-CLASS BULK RATE Postage and Fees Paid National Aeronautics and Space Administration NASA-451
uawL Q
POSTMASTER: If Undeliverable (Section 158 Postal Manual) Do Not Return