Embed Size (px)
Citation preview

23 March 2005
In Pursuit of Growth and
Excellence
2004 Annual Results

1
Forward-Looking Statement Disclaimer
This presentation and subsequent discussions may contain forwardThis presentation and subsequent discussions may contain forward--looking looking statements that involve risks and uncertainties. These statemenstatements that involve risks and uncertainties. These statements are generally ts are generally indicated by the use of forwardindicated by the use of forward--looking terminology such as believe, expect, looking terminology such as believe, expect, anticipate, estimate, plan, project, target, may, will or may beanticipate, estimate, plan, project, target, may, will or may be expressed to be expressed to be results of actions that may or are expected to occur in the futuresults of actions that may or are expected to occur in the future. You should not re. You should not place undue reliance on these forwardplace undue reliance on these forward--looking statements, which reflect our looking statements, which reflect our belief only as of the date of this presentation. These forwardbelief only as of the date of this presentation. These forward--looking statements looking statements are based on our own information and on information from other sare based on our own information and on information from other sources we ources we believe to be reliable. Our actual results may be materially lebelieve to be reliable. Our actual results may be materially less favorable than ss favorable than those expressed or implied by these forwardthose expressed or implied by these forward--looking statements which could looking statements which could depress the market price of our Level 1 depress the market price of our Level 1 ADSsADSs and local shares.and local shares.

2
Management Team
Mr. Gary HeMr. Gary He Vice Chairman and Chief ExecutiveVice Chairman and Chief Executive
Mr. David LamMr. David Lam Deputy Chief ExecutiveDeputy Chief Executive
Mr. Raymond LeeMr. Raymond Lee Chief Financial OfficerChief Financial Officer
Mr. Mr. Yingxin GaoYingxin Gao Deputy Chief ExecutiveDeputy Chief Executive
Mr. Alex CheungMr. Alex Cheung Chief Risk OfficerChief Risk Officer
Mr. Peter LiuMr. Peter Liu Chief Information OfficerChief Information Officer
Mr. Jason Mr. Jason YeungYeung Company Secretary and Head of IRCompany Secretary and Head of IR

3
Agenda
Key Performance HighlightsKey Performance Highlights
Financial ResultsFinancial Results
New HKFRSNew HKFRS
2005 Outlook and Strategic Focus2005 Outlook and Strategic Focus

Key Performance Highlights

5
Record High Attributable Profit
Strong growth in attributable profit and dividend for 2004
Dividend per ShareDividend per ShareDividend per ShareProfit Attributable to ShareholdersProfit Attributable to ShareholdersProfit Attributable to Shareholders
HK$ mmHK$ mm HK$HK$
50.2%50.2%
11,9637,9636,787
38.8%38.8%
0.715
0.5150.398
2002 2003 2004 2002 2003 2004

6
ROE 18.58 13.62ROA 1.56 1.08NIM 1.55 1.82Non-interest income ratio 29.41 25.38Cost to income ratio 34.72 32.79NPL ratio 2.95 5.78Loan to deposit ratio 49.61 51.38Average liquidity ratio 36.03 37.76Capital adequacy ratio 16.14 15.11
Higher ROE, ROA and Asset Quality
% 200420042004 200320032003

7
Upturn of Hong Kong economyUpturn of Hong Kong economy
Improved credit environmentImproved credit environment
Highly liquid money marketHighly liquid money market
Net interest income suppressed by persistentNet interest income suppressed by persistentlow HIBORlow HIBOR
Operating Environment
Average 1M HIBOR 0.3%

8
Key Achievements
Market leadership maintained in traditional Market leadership maintained in traditional businessesbusinesses
Robust growth of highRobust growth of high--margin businessesmargin businesses
Market leadership in new areas pioneered by the Market leadership in new areas pioneered by the Group Group -- RMB bankingRMB banking
Growth momentum sustained in ChinaGrowth momentum sustained in China--related related businessbusiness
Business Performance

9
Key Achievements
Major management crisis quickly resolvedMajor management crisis quickly resolved
Enhancement of corporate governance and Enhancement of corporate governance and management structuremanagement structure
Crisis Management

10
Key Achievements
Enhanced business strategyEnhanced business strategy
Refined business modelRefined business model
Improved risk managementImproved risk management
Development of new corporate cultureDevelopment of new corporate culture
Business Development

Financial Results

12
Strong rise in net profit due to provision writeStrong rise in net profit due to provision write--back, property revaluation back, property revaluation gain & growth in nongain & growth in non--interest incomeinterest income
Profit and Loss Account (YoY)
HK$ mmHK$ mm
* Excluding tax provision write-back in 2003, revaluation surplus/deficit and asset revaluation deferred taxation.
200420042004 200320032003 % Change% Change% Change
Net interest income 11,193 12,874 - 13.06Non-interest income 4,664 4,379 + 6.51Operating income 15,857 17,253 - 8.09Operating expenses 5,505 5,658 - 2.70Operating profit before provisions 10,352 11,595 - 10.72Write-back of/(charge for) bad and doubtful debts 1,628 (1,671) NAOperating profit 11,980 9,924 + 20.72Non-operating items 2,272 (1,233) NAProfit attributable to shareholders 11,963 7,963 + 50.23- Excluding exceptional items* 10,303 8,325 + 23.76

13
Net interest income 5,684 5,509 6,290 6,584Non-interest income 2,150 2,514 2,127 2,252Operating income 7,834 8,023 8,417 8,836Operating expenses 2,838 2,667 2,961 2,697Operating profit before provisions 4,996 5,356 5,456 6,139Write-back of/(charge for) bad and doubtful debts 388 1,240 (2) (1,669)Operating profit 5,384 6,596 5,454 4,470Non-operating items 2,092 180 (8) (1,225)Profit attributable to shareholders 6,382 5,581 4,951 3,012- Excluding exceptional items* 4,722 5,581 4,839 3,486
HK$ mmHK$ mm1H20041H20041H20042H20042H20042H2004 2H20032H20032H2003 1H20031H20031H2003
Rise in 2H04 net profit due to Rise in 2H04 net profit due to stabilisedstabilised net interest income, provision net interest income, provision writewrite--back and property revaluation gainback and property revaluation gain
* Excluding tax provision write-back in 2003, revaluation surplus/deficit and asset revaluation deferred taxation
Profit and Loss Account (HoH)
14
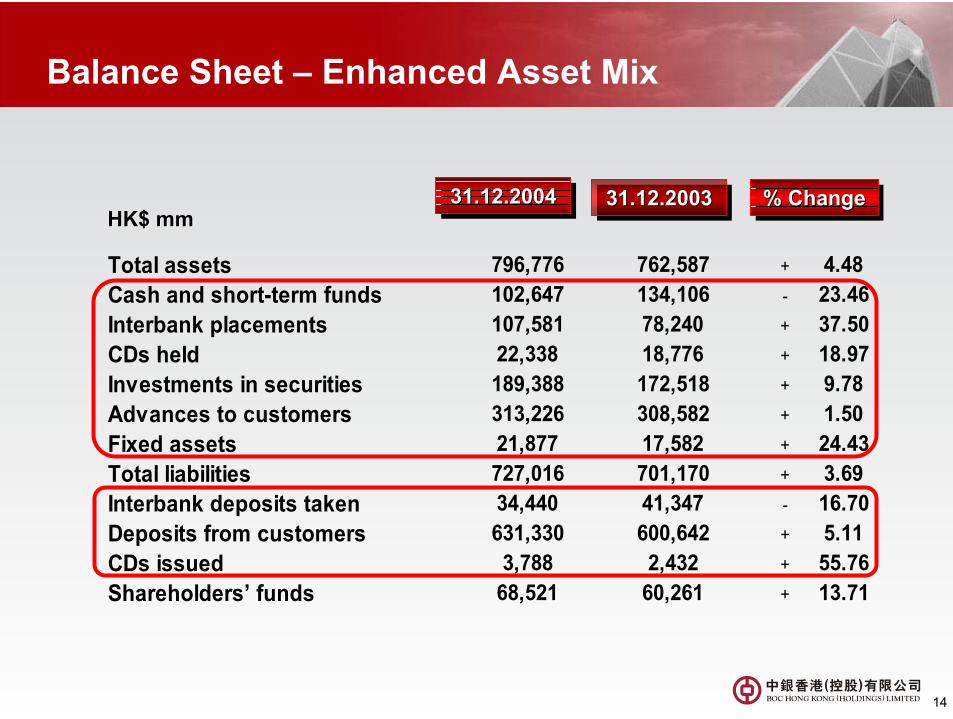
Total assets 796,776 762,587 + 4.48Cash and short-term funds 102,647 134,106 - 23.46Interbank placements 107,581 78,240 + 37.50CDs held 22,338 18,776 + 18.97Investments in securities 189,388 172,518 + 9.78Advances to customers 313,226 308,582 + 1.50Fixed assets 21,877 17,582 + 24.43Total liabilities 727,016 701,170 + 3.69Interbank deposits taken 34,440 41,347 - 16.70Deposits from customers 631,330 600,642 + 5.11CDs issued 3,788 2,432 + 55.76Shareholders’ funds 68,521 60,261 + 13.71
Balance Sheet – Enhanced Asset Mix
HK$ mmHK$ mm31.12.200431.12.200431.12.2004 % Change% Change% Change31.12.200331.12.200331.12.2003

15
Fall in average 1M HIBOR (2004: 0.30%; 2003: 0.99%)Decline in yields from interbank placements, loans and debt securitiesActively managed balance sheet Enhanced risk adjusted return through de-risking of loan portfolioWeighted average yield from residential mortgage was P-2.17% as competition intensified
Challenging environment with low interest rate, intense competition and modest loan growth
Lower Net Interest Margin
HK$ mmHK$ mmInterest income 15,678 17,759Interest expense 4,485 4,885Net interest income 11,193 12,874Net interest spread 1.46% 1.73%Net interest margin 1.55% 1.82%
200420042004 200320032003

16
Growth in Wealth Management and Treasury Income
Income from wealth management Income from wealth management Income from wealth management Other operating income Other operating income Other operating income
HK$ mmHK$ mmHK$ mmHK$ mm
6.5%6.5%6.5%27.9%27.9%27.9%
3,221
1,167483
276
2,997
899
2003 2004
Other incomeTreasury related incomeNet fees and comission income
696836
120
194211
23337
98
2003 2004
BondsAsset managementLife insuranceStockbroking

17
3,316 3,291
732 725
611 585
999 904
2003 2004OthersDepreciationPremises and Equipment (including IT expenses)Staff Costs
Operating Expenses under Control
Operating expensesOperating expensesOperating expenses
HK$ mmHK$ mm
Total Operating ExpensesCost to Income Ratio
32.79% 34.72%298304
Dec 2003 Dec 2004
Branch numberBranch numberBranch number
12,976 13,137
Dec 2003 Dec 2004
Staff number (FTE)Staff number (FTE)Staff number (FTE)
Increased operational efficiency and disciplined cost management
5,5055,658 (289)*(289)* (283)*(283)*
*Branches in Hong Kong

18
Lower classified loan formation, strong collections and recoveries reflecting continuous improvement in loan quality
Substantial Provision Write-back
Migration of classified loans for 2004Migration of classified loans for 2004Migration of classified loans for 2004HK$ HK$ bnbn
HK$ mmHK$ mm 200420042004 200320032003Specific provisions - new provisions (1,520) (3,834) - releases 1,851 768 - recoveries 1,356 438General provisions (59) 957Net credit/(charge) 1,628 (1,671)
9.218.0
+2.4
-1.0
-7.3-2.9
End-2003 Downgrade Upgrade Collection Write-off End-2004

19
NPL ratio further declined to 2.95% - lowest level since IPO
Significant Improvement in Asset Quality
NPL / Classified loan ratioNPL / Classified loan ratioNPL / Classified loan ratio Asset quality Asset quality Asset quality
5.78
7.99
2.95 2.95
5.82
7.98
2002 2003 2004
NPL ratio
Classified loan ratio
%%
HK$ mmHK$ mm 31.12.200431.12.200431.12.2004 31.12.200331.12.200331.12.2003
General Provisions 5,465 5,406 Specific Provisions 2,320 5,507 NPLs 9,239 17,832 SP/NPLs 24.56% 30.66%GP/Total Loans 1.74% 1.75%LLR/NPLs 84.26% 61.20%SP + Collateral Coverage 91.66% 90.95%

20
Strong growth in residential mortgage, card advances and overseas lending with total performing loans increased by 4.6%
Strong Growth in Retail and Overseas Lending
HK$ mmHK$ mm
* Net of specific provisions ** Total advances to customers less total NPLs
31.12.200431.12.200431.12.2004 % Change% Change% Change31.12.200331.12.200331.12.2003
Loans for use in HK - corporate 148,034 155,839 - 5.0Loans for use in HK - individuals 124,687 118,962 + 4.8 Residential mortgages 95,615 90,003 + 6.2 Credit card advances 4,256 3,756 + 13.3Trade finance 13,279 12,100 + 9.7Loans for use outside HK 27,226 21,681 + 25.6Total advances to customers (Gross) 313,226 308,582 + 1.5Total advances to customers (Net)* 310,906 303,075 + 2.6Total performing loans** 303,987 290,750 + 4.6

21
3.26%
10.35%
2003 2004
Steady Growth in the Mainland
Gross advances to customersGross advances to customersGross advances to customers
Combined profit and loss account of 14 Mainland branches and sub-branches
Combined profit and loss account of 14 Combined profit and loss account of 14 Mainland branches and subMainland branches and sub--branchesbranches
HK$ mmHK$ mm
Classified loan ratioClassified loan ratioClassified loan ratio
9,345
6,108
2003 2004
53.0%53.0%
709bps709bps
Deposits from customersDeposits from customersDeposits from customers
1,952 2,285
2003 2004
17.1%17.1%
HK$ mmHK$ mm
Operating income 264 246 + 7.3 Operating expenses 117 125 - 6.4 Operating profit before provisions 147 121 + 21.5 Profit before taxation 255 170 + 50.0
HK$ mmHK$ mm 200420042004 200320032003 % Change% Change% Change
Organic growth driven by significant increase in loans and improved asset quality

New HKFRS

23
New HKFRS – Possible Implications for 2005 (1)
• New HKFRSs – convergence with international standards
• More volatile P/L
• Reclassification of some balance sheet items
• Compliance with HKMA requirements
• Complex implementation

24
New HKFRS – Possible Implications for 2005 (2)
• Classification of financial instruments• New classification of debt securities• Change in measurement methods
• Accounting for derivatives• Measured at fair value
• Hedge accounting• Stringent requirements

25
New HKFRS – Possible Implications for 2005 (3)
• Loan impairment• Recognised on an incurred loss basis• Discounted future cash flow
• Investment property• Fair value model• Change in fair value of investment properties to
be recognised directly in P/L

2005 Outlook andStrategic Focus

27
Outlook for Hong Kong Economy and Banking Sector
Economic recovery likely to extend into 2005
Higher demand for loans, banking and financial services
Competition for local banks to remain intense
Growing importance of China-related business

28
Strategic Focus (1)
To achieve higher top line growth and better returnsCorporate Banking
• Expand SME loans and trade finance• Further de-risk corporate loan portfolio
Retail Banking• Grow wealth management and consumer lending• Strengthen development of consumer credit
products and value added services• Maintain leadership in residential mortgage market

29
Strategic Focus (2)
To achieve higher top line growth and better returns (Cont’d)
Treasury• Focus on balance sheet management• Adjust investment portfolio to maximize return on
residual fundsChina-related Business
• Leverage branch network in Hong Kong and Mainland• Closer cooperation with BOC to expand customer base
and new business• Maintain leadership in RMB business

30
Strategic Focus (3)
To further enhance corporate development• development strategy• business model• risk management• corporate culture
To further improve asset quality
To invest in the future
To explore other business expansion opportunities

23 March 2005
In Pursuit of Growth and
Excellence
2004 Annual Results


![[Income Tax Act]1)socialsciences.exeter.ac.uk/.../iceland/party/Tax_Law-_v.2003-English… · [Income Tax Act] 1) Act no. 90 of 7 May 2003 1)Act 129/2004, Article 31. Originally Act](https://img.pdfslide.us/doc/110x75/5f27c13e7eda44150a58f588/income-tax-act1-income-tax-act-1-act-no-90-of-7-may-2003-1act-1292004.jpg)
![2003 Comprehensive Annual Financial Report (CAFR) · 2003 : 2002 : 2001 : Individual and Fiduciary Income Tax [1] Corporate Income Tax [2] State Sales and Use Tax [3] Total $ 6,775,799](https://img.pdfslide.us/doc/110x75/5f6769584b3d726f60322529/2003-comprehensive-annual-financial-report-cafr-2003-2002-2001-individual.jpg)