Embed Size (px)
Citation preview

International Journal of Hydrogen Energy 38(5), 2443-2454 (2013)
In-plane Neutron Radiography for Studying the Influence of Surface Treatment and Design of Cathode Flow Fields in
Direct Methanol Fuel Cells
A. Schrödera, K. Wippermanna*, T. Arltb, T. Sandersc, T. Baumhöferc, N. Kardjilovb, J. Mergela, W. Lehnerta, D. Stoltena,d, J. Banhartb, I. Mankeb
aInstitute of Energy and Climate Research, IEK-3: Fuel Cells, Forschungszentrum Jülich
GmbH, 52425 Jülich, Germany bHelmholtz-Zentrum Berlin GmbH, Institut für Angewandte Materialforschung, Hahn-
Meitner-Platz 1,
14109 Berlin, Germany cInstitute for Power Electronics and Electrical Drives (ISEA), RWTH Aachen University,
Jägerstraße 17–19, 52066 Aachen, Germany dChair for Fuel Cells, RWTH Aachen University, Germany
The influence of surface treatment and design of cathode flow fields in direct methanol fuel cells was investigated by in-plane neutron radiography and measurements of cell performance and pressure drop along the cathode channels. A specially designed test cell and neutron radiography set-up allows for studying the water distribution in an in-plane viewing direction. A temporal resolution of down to 10 s was used while an image resolution of approximately 80 µm could be obtained. The cathode flow fields were either impregnated by a hydrophobizing or hydrophilizing agent or left untreated. It turned out that hydrophobic channel walls lead to the formation of large water droplets, which partially block the air flow in the cathode channels. Their periodical growth and discontinuous removal leads to an unstable and fluctuating operation. Hydrophilized cathode flow fields, on the other hand, ensure a stable operation due to removal of excess water by a continuous water film. Two different cell designs including untreated cathode flow fields with either dual-channel or grid design were compared. The grid flow field was superior with regard to the stability of cell performance and less prone to the formation and removal of water droplets.
1. Introduction The continuous removal of liquid water from the cathode channels of direct methanol fuel cells (DMFCs) is a critical issue. For example, large water droplets formed in the channels hinder the transport of oxygen to the active sites [1]. This may not only cause a substantial loss of performance but also an uneven current distribution and unstable operation and eventually enhance degradation [2-4]. From the literature it is known that the wetting properties of the cathode channels of polymer electrolyte fuel cells (PEFCs) largely determine the process of water removal [5-21]. A recent study of ours revealed that hydrophilic DMFC cathode flow fields are advantageous with regard to higher power densities, suppression of local current fluctuations and substantial reduction of pressure drop along the cathode channels [12].
Several methods have been reported in the literature to observe the CO2 and water distribution in situ under operating conditions of PEFCs and DMFCs. Some authors used cells with a transparent cover to observe the carbon dioxide evolution and the two phase flow behaviour

2
visually (see e.g. [5, 22-24]). Applying transparent covers is a straight-forward method, but requires substitution of flow field materials like graphite or steel by acrylic glass. Another method is magnetic resonance imaging (MRI) [25-27]. However, this method is not suited to investigate water in a large metallic containment and is also strongly distorted by the large amount of Pt used in DMFC catalysts.
A promising and widely used method is neutron radiography. [10, 28-39]. A very important advantage of this method for fuel cell research is the high sensitivity to hydrogen-containing matter. Small amounts of product water can be detected very precisely [40]. A general limitation of radiography is that it is only sensitive to the lateral density distribution and integrates over the direction parallel to the beam, which is why two different viewing directions are used: The radiation can penetrate the measuring cell either from the front (through-plane) or from the side (in-plane or cross-section) [34, 41-43]. Neutron (and also X-ray) tomography – on the other hand – provide full 3D images of the media distribution in a fuel cell, but with the disadvantage of very long data acquisition times [44-46]. In spite of restrictions with respect to availability and temporal and spatial resolution, neutron radiography has a number of advantages. As in low temperature PEFCs, the fluid distribution in DMFCs can be analyzed in nearly unmodified measuring cells during operation since the attenuation of the beam by the aluminum end plates and graphitic flow fields used in this experiment is sufficiently low. Depending on the research interest, priority can be given to a short exposure time or a high spatial resolution.
The in-plane viewing direction allows for a targeted, separate observation of the flow field channels and the individual layers of the membrane electrode assembly (MEA) [19, 31, 34, 36, 41, 47-51]. Due to the low thicknesses of the diffusion layers and the membrane in the range of one tenth of a millimeter, the requirements concerning spatial resolution is high. Recently, various groups reported on improvements and spatial resolutions around 10 µm can now be achieved [2, 41, 47, 52-56]. However, such high spatial resolutions lead to extended exposure times of up to several minutes, which can be too slow for studies of the fast water exchange processes inside the MEA.
In addition to processes within the membrane, transport processes can also be observed in the diffusion layers and channels that are driven by temperature gradients, see for example Ref. [49]. The effects of hydrophobic and hydrophilic channels are discussed in Ref. [19]. Previous studies on DMFCs were limited to the impact of the flow velocity and direction on the accumulation of carbon dioxide in the anode channels [57-59].
The goal of this study is to use in-plane neutron radiography for visualizing water removal from the channels of cathode flow fields with differently treated surfaces and various designs using a specially designed cell and radiographic set-up. Together with measurements of the overall performance and the pressure drop between air inlet and outlet, these experiments serve for identifying starting points to improve the operating stability of DMFCs.
2. Experimental 2.1. Preparation of membrane electrode assembly (MEA) As a substrate for the anodes and cathodes, AvCarb 1071 HCB carbon cloth supplied by Ballard Material Products was used. In a first step, it was impregnated with PTFE dispersion TF 5032 supplied by Dyneon and subsequently dried and sintered at 350°C. A microporous layer of carbon particles (VULCAN XC72 from Cabot) and PTFE (TF 5032 from Dyneon) was applied to the cloth. In a second coating step, the catalyst layers were applied. Both catalyst layers consisted of catalyst material from Johnson Matthey and Nafion. In case of the cathode catalyst layer, PTFE was added too. The starting materials of PTFE and Nafion are
3
the PTFE dispersion TF 5032 from Dyneon and the Nafion dispersion LQ1115 from Ion Power. As catalyst material for the cathode, Johnson Matthey HiSPEC 13100 (71 wt.% Pt/C) was used, while Johnson Matthey HiSPEC 12100 (75 wt.% PtRu/C) was used as the anode catalyst. The catalyst loadings were between 1.9 and 2.0 mg Pt/cm² in the cathodes and 2.7 mg PtRu/cm2 in the anodes. After the catalyst layer had been dried, it was manually sprayed with Nafion dispersion LQ1115 manufactured by Ion Power. Finally, the anodes and cathodes were shaped as desired (151 mm × 7 mm, A = 10.57 cm²) and pressed into finished MEAs for three minutes at a temperature of 130°C and a pressure of 500 N/cm² with a N115 Nafion membrane manufactured by DuPont.
2.2. Flow field treatment The surfaces of the graphite ‘BBP4’ [60] flow fields were treated with different substances in order to vary the contact angle of water. The resulting contact angles are given in Table 1. For treatment with HPI, droplets with a volume of 0.5 µl were completely absorbed by the surface after on average 12 s, reflecting a very low contact angle.
2.3. Cell design The cell design used for the experiments permits neutron radiography in an in-plane viewing direction. The designs of both the anode and cathode flow fields are shown in Figure 1. The height of 151 mm of the electrode with 10.57 cm2 surface area corresponds to the height of the electrodes used for the DMFC stacks developed at the Research Centre Jülich [61, 62]. All the current collectors have a width of 12 mm. For cell design #1, a dual-channel flow field design (C-CH) was used for both electrodes (Figure 1a). The two parallel channels are each 1.5 mm wide and deep. Because of the forced flow-through, water droplets in a cathode flow field with a single channel would always be removed and a complete blocking of the air flow could not happen. In case of the dual-channel design, one of the channels can be blocked by water droplets. In this respect, the dual-channel design is more comparable with the multi-channel design of a stack flow field. As an additional geometry, a grid structure (C-GR) was installed on the cathode side with cubes having an edge length of 1 mm. Together with a dual-channel anode flow field it forms cell design #2 (Figure 1b). The two-dimensionality of the grid structure renders it less sensitive to blockage by water droplets.
Figure 2 shows the assembled cell with a marking plate and mounts for securing it to a base plate. Since with neutron radiography only part of the cell is studied, a 2-mm thick acrylic glass plate with coding holes (marking plate) is secured to one of the end plates. In the neutron radiograph, the rows of holes mark the position within the cell. The end plates, with a thickness of 15 mm, are 60 mm wide between the supply connections. This both increases their bending stiffness and creates space for taking up heating cartridges and thermocouples. A heating cartridge is inserted from the top into each end plate. The mounting brackets are arranged such that the rear side of the cell can be brought close to the scintillator.
2.4. Electrochemical measurements The electrical cell performance was recorded with a measurement device capable of conducting automated test procedures including galvanostatic, potentiostatic and impedance measurements. This device, called ‘EISmeter’, was developed by ISEA (RWTH Aachen University) especially for the needs in electrochemical measurement setups [63]. All measured electrical values are recorded by a computer. Peripheral components can also be included in the control and acquisition software. A differential pressure sensor based on the

4
MPX5010DP analog pressure sensor [64] was used to measure the difference in pressure between the cathode inlet and outlet. In the pressure range between 0 mbar and 100 mbar the differential pressure can be measured with a resolution of about 0.1 mbar. The signal-to-noise ratio was found sufficient to distinguish pressure variations as low as 1 mbar from the background, making the device suitable for the detection of very low differential pressure variations.
The measuring cell is mounted on an electrically isolated steel plate. A controller uses a thermocouple to monitor the temperature of the measuring cell and heating cartridges to maintain it at a temperature of 70°C. The anode is supplied with 1.0 molar methanol solution via a peristaltic pump (Ismatech BV-GE). To supply the cathode, compressed air combined with mass flow meters (Brooks 5850S) are used. A maximum of two pumps and mass flow meters with various flow-through ranges can be integrated with the EIScell measurement system and automated simultaneously. Before entering the cell, the methanol solution is preheated to 90°C. The dissolved gases escaping during the process are separated with custom made gas separators.
The test cells were always operated in a vertical position under counter flow conditions, which means methanol flow in the anode compartment from the bottom to the top and air flow in the cathode compartment in the opposite direction. In this way, the discharge of CO2 bubbles in the anode and water droplets in the cathode are supported by gravity. However, based on our measurements, the influence of gravity on water removal cannot be quantified. In case of hydrophobic (GDL/channel) surfaces, water removal works by the interaction of gravity, mass flow and coalescence of small water droplets. It can be assumed that the mass transport plays a dominant role. In case of wetted hydrophilic surfaces, gravity is probably more important: As soon as a droplet gets in contact with a hydrophilic wall, it will be absorbed by a thin film of water and offers little surface for mass flow. Gravity drain then removes the water film.
2.5. Setup for neutron radiography The radiography station CONRAD (COld Neutron RADiography) [65, 66] at the neutron source BER II of the Helmholtz-Zentrum Berlin, Germany, was used. As shown in Figure 3, the cold neutrons pass a curved neutron guide on their way to the experiment, during which fast neutrons and γ radiation are removed since these do not follow the curvature. About 107 neutrons / s cm-2 are available for the experiment.
The spatial resolution depends on the L/D ratio, the applied magnification of the optical system and the pixel size of the CCD camera [52]. The L/D ratio was optimized with respect to the spatial resolution by moving the fuel cell as close as possible to the 50-µm thick 6LiF-ZnS scintillator. The exposure time per radiographic image was t = 10 s. The CCD chip of the Peregrine 486 camera from Fairchild Imaging with 4096 × 4096 pixels was cooled down to −50°C to enhance the image contrast [36, 67]. For last performed measurement, an Andor 436 camera was used. This camera allows for higher temporal resolution but provides a lower spatial resolution of 2048 x 2048 pixel2 The opening of the aperture was set to 30 mm. A spatial resolution of about 80 µm was achieved. To protect the CCD chip from radiation, a mirror was used to deflect the visible light by an angle of 90°. Additionally radiation protection applications were installed.
The fuel cell was fixed on a translation stage positioned on a rotating table to allow e the cell to move out of the beam in order to measure the open beam for normalization purposes. Furthermore, an exact adjustment of the cell to the neutron beam was possible. To reduce
5
image artifacts, five radiographs were averaged using a three-dimensional median filter. This procedure also improved the signal-to-noise ratio.
3. Results and discussion The specifications of the four cells investigated by neutron radiography as well as by galvanostatic measurements combined with pressure drop experiments are listed in Table 2.
Three cells (No. 1–3) were equipped with the flow fields A-CH and C-CH and one cell (No. 4) with the flow fields A-CH and C-GR. The cathode channels of cell No. 1 remained untreated. Those of cell No. 2 were hydrophobized and those of cell No. 3 were hydrophilized. The surface of the grid structure of cell No. 4 was not changed.
The three different surface properties of the channel structures bring about significant differences in water transport. Figure 5 shows, as an example, images of the entire height of cells No. 1–3 at a current density of 150 mA/cm2.
In order to improve image quality, a three-dimensional median filter was used to combine and process several radiographs. This improves the signal-to-noise ratio but lowers the temporal resolution of the radiographic series. Averaging was performed over a period of 50 seconds (Figure 4a) and 30 minutes (Figure 4b). Each radiograph is represented by a pair of beam-normalized (left side) and wet-normalized (right side) images; whereas the former are normalized to the beam characteristics, the latter are divided by a radiograph where the anode channels are flooded by methanol solution. Beam normalization allows us to better recognize the channel back walls, whereas wet-normalization provides insight into changes of the water layer thickness compared to the reference image with the flooded anode flow field. The maximum of beam intensity is located above the center of the cell, which is why image quality deteriorates particularly in the lower area. The distribution of liquid across the entire image area can therefore be evaluated only qualitatively.
Enlargements of the radiographs in Figure 4b are depicted in Figure 5. All radiographs show the two overlapping channels, i.e. the anode channels on the left and the cathode channels on the right side. The MEA is clearly visible as a thin strip in between. In the beam-normalized images, the aqueous methanol solution in the anode channels and water droplets in the cathode channels on the cathode GDL, respectively, appear black because the raw image is divided by the bright field image. In the wet-normalized images, the methanol solution mixed with carbon dioxide bubbles in the anode channels appears light and the water droplets in the cathode channels dark because the raw image is divided by the image of the same cell with completely flooded anode channels but dry cathode channels.
The temporal development and removal of water droplets is illustrated in Figure 6 (untreated surfaces) and Figure 7 (hydrophobized surfaces). At the onset of the measurements, each of the cathode channels is dry. With untreated channel surfaces, formation of droplets from the GDL occurs subsequently, see Figure 6. In the lower part, droplet formation is also observed on the back wall of the channel. The droplets grow and coalesce with adjacent droplets and with droplets on the back wall. The droplets in the lower area usually grow faster and are more frequently discharged than the droplets further above. If a droplet becomes detached all droplets located below it that come into contact with the outflowing droplet are also discharged. The period of 50 seconds presented in Fig. 4a shows an above-average water volume that substantially decreases once droplets have been discharged (see left side of Figure 4a and Figure 5). In the presentation averaged over 30 minutes, it becomes evident that the drops have a tendency to evolve at the same locations (see left side of Figure 4b).

6
For hydrophobic channels, droplets also form on the GDL (see mean values of water distribution in the middle part of Figure 4 and Figure 5 and the development and removal of water droplets in Figure 7). However, these coalesce less frequently. On the back wall of the channel less water is observed and the surface is hardly wetted. The water volume in the channels is even larger than in untreated channels. Here too, the water droplets tend to evolve at the same locations and are more frequently discharged in the lower area as shown in Figure 4, Figure 5 and Figure 7.
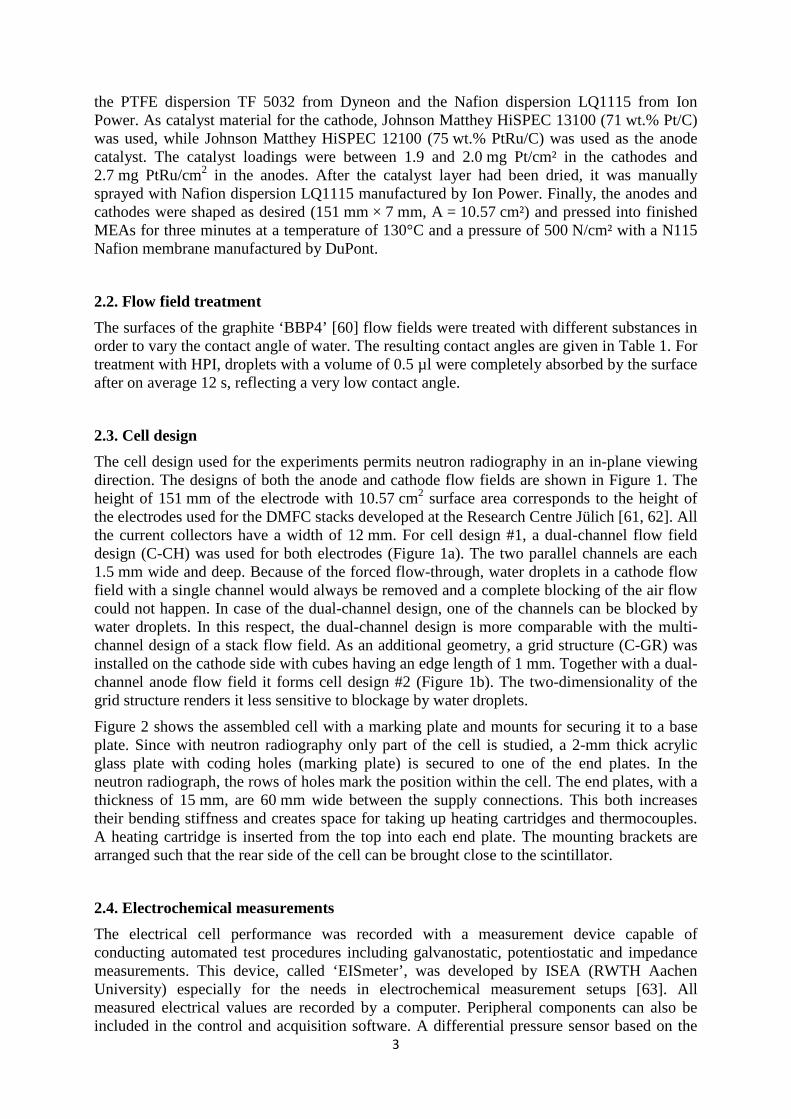
Hydrophilic channel surfaces substantially improve water transport, see mean values of water distribution on the right of Figure 4 and Figure 5 and temporally resolved radiographs in Figure 8. First, droplets without clearly defined contours develop on the GDL and the back wall. These droplets quickly coalesce and drain off rapidly. The channel surfaces are wetted and a continuous water film can be seen on the back wall of the channel, especially in the lower area, see right part of Figure 4 and Figure 8, after which only small droplets evolve that are absorbed when they touch the surfaces of the channel walls. In enlarged sections of the 30-minute recordings the ordered structure of the cathode-side GDL is seen. Especially for hydrophilic channels, it can be seen that the sites at which water droplets evolve at the GDL correlate with the dimension of the fabric fiber bundles.
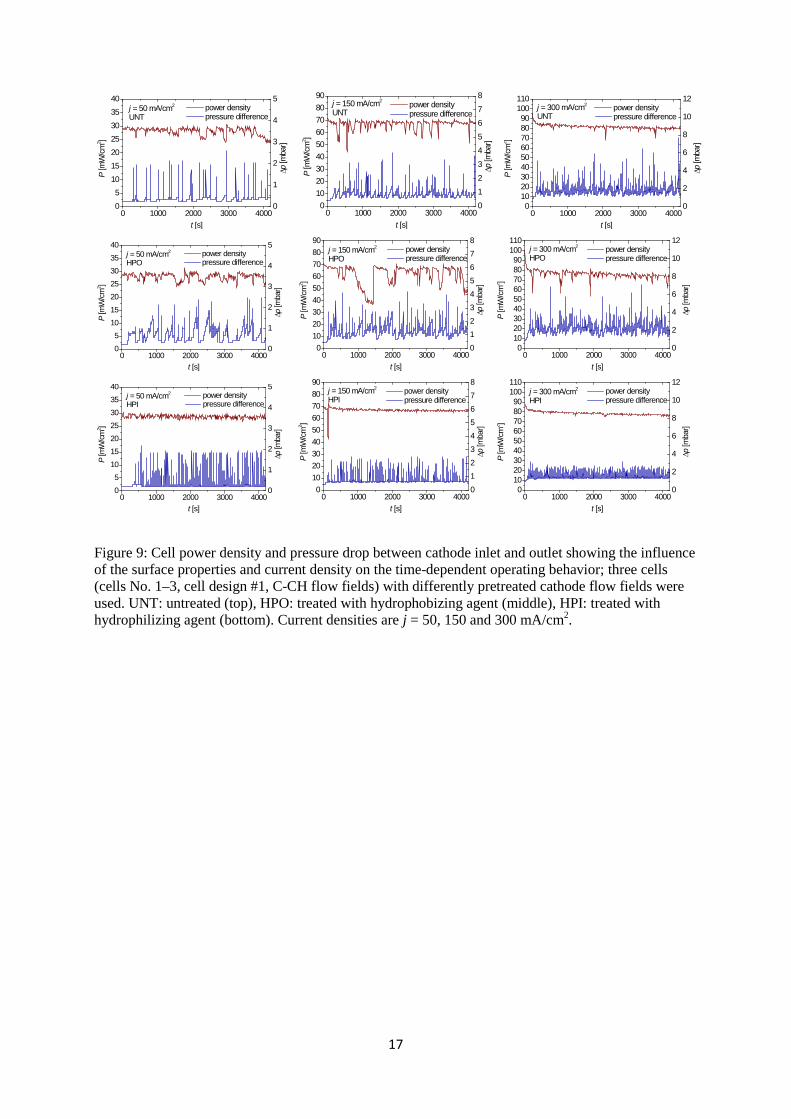
The differences in operating behavior are reflected by the power density and the pressure difference on the cathode side as a function of time as shown in Figure 9 for different average current densities of 50, 150 and 300 mA/cm2. Untreated cathode channels lead to significant fluctuations in the power density. The pressure difference curve show peaks whenever a droplet leaves the cathode flow field via the supply tube and the ensuing elevated pressure difference is recorded when this occurs. Usually, the pressure difference increases prior to the discharge of the droplet. Cathode channels with hydrophobic surfaces lead to an even more unstable operation.
The fluctuation of both performance and pressure drop is less pronounced at higher current densities. This is probably due to a more stable operation at elevated air flow rates. Hydrophilic surface properties exhibit the most stable operating behavior. With the exception of a drop at the outset of the measurements at 150 mA/cm², the fluctuations of power density can be explained by fluctuations arising from the measurement equipment. This drop in power density coincides with a brief increase in pressure difference. In general, the comparatively much more frequent pressure difference peaks indicate a steadier discharge of the water droplets. Looking at the average values of the pressure difference, hydrophobic cathode channels provide the highest average value, while hydrophilic channels provide the lowest (1.3 mbar compared to 0.7 mbar). The value of 0.8 mbar for the untreated channel surfaces lies between these two values. With increasing current density and air volume flow, the differences in the average pressure difference are reduced in relation to each other.
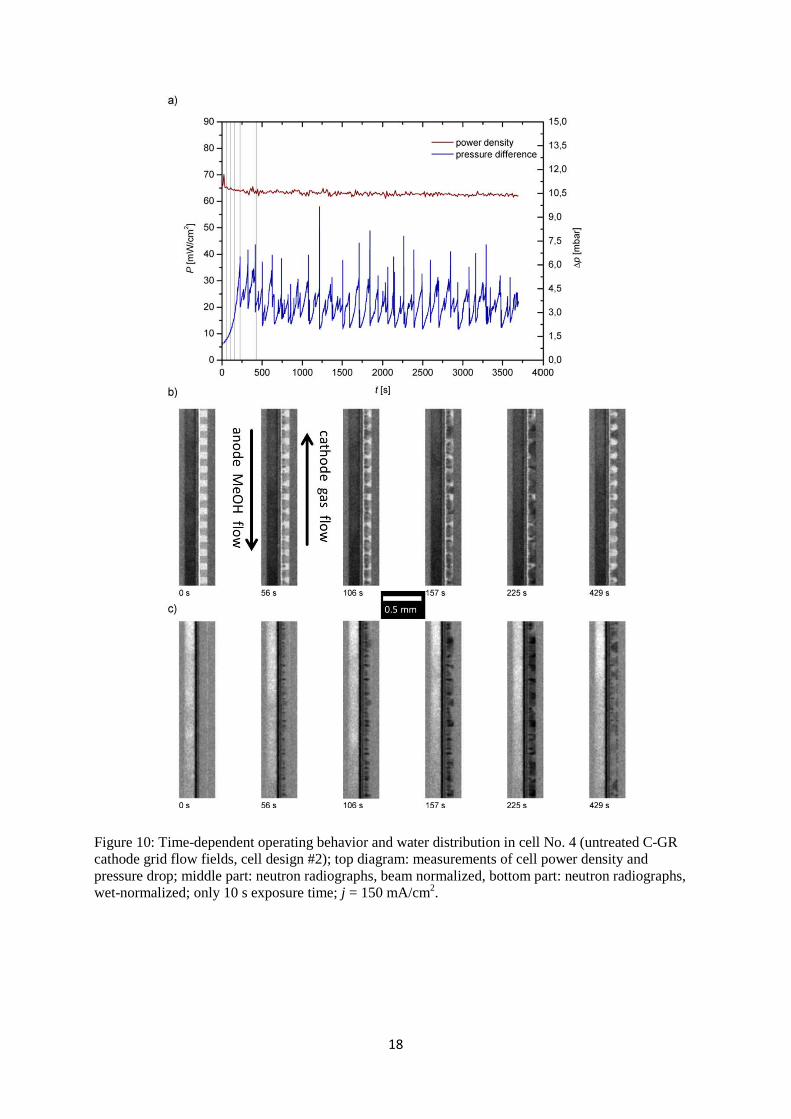
The fourth measuring cell with the cathode flow field C-GR is investigated with a different camera set-up that does not require several radiographs to be combined to increase image quality but provides less spatial resolution. The resulting higher temporal resolution makes it possible to more precisely correlate the pressure difference on the cathode side with the water volume in the cathode channels.
Figure 10 shows the evolving power density and pressure difference along with radiographs corresponding to the six times marked by vertical lines in the diagram. The radiograph sections were taken at the bottom of the cell. Beam-normalized data is at the top and wet-normalized below. Initially, the cathode flow field is dry and the pressure difference at its lowest value. Droplets preferentially evolve in the side areas of the cubes and the pressure difference continuously increases. Starting from the GDL, the droplets reach the back wall of the channels. Finally, the local water volume reaches a maximum. With the sudden discharge
7
of most of the water the pressure difference drops, after which the processes of droplet growth and water transport are repeated. Throughout these processes a part of the surface of the cubes and of the back wall remains wetted, but the maximum water volume is hardly achieved any longer.
Contrary to the untreated C-CH dual-channel flow field, the untreated C-GR grid flow field enables stable operation with just slight fluctuations of performance despite the pronounced pressure peaks, compare Figure 9 and Figure 10. The main reason is that the two-dimensional structure of the C-GR design allows air to by-pass water droplets in the cathode channels. The higher pressure drop obtained with the C-GR flow field can be explained by the lower channel cross section (1 mm × 1 mm) compared to the channel design C-CH (1.5 mm × 1.5 mm). Generally, a high pressure drop is disadvantageous with respect to the overall efficiency of DMFC systems because it requires a stronger air blower. This drawback can be encountered by using the grid flow field with cube dimensions of 1.5 mm × 1.5 mm × 1.5 mm. A study of this matter using through-plane neutron radiography is in progress.
Conclusions Specially designed test cells and set-ups for neutron radiography allow for studying the water distribution in direct methanol fuel cells (DMFC) in the in-plane viewing direction. The camera applied combines a large field of view and a high spatial resolution [67]. The link to application-oriented DMFCs is established by adapting the height of the flow fields used in this work to the height of large stack cells used in commercial DMFC systems [61, 62].
Neutron radiography visualizes the processes of water droplet formation, droplet coalescence and water removal. It turns out that the water distribution in the cathode compartment is strongly influenced by the hydrophilic or hydrophobic properties of the cathode channel walls. An untreated or even hydrophobized surface leads to big water droplets being formed at the same locations of the GDL which combine less frequently to larger droplets. Vice versa, hydrophilic channels walls are first wetted by droplets of arbitrary shape and then covered by a continuous water film which can be seen on the back wall of the channels. Galvanostatic cell performance and pressure drop measurements along the cathode channels confirm the observed differences in the operating behavior. Growth and removal of water droplets create fluctuations or even peaks of performance and pressure drop. These fluctuations decrease in the order: hydrophobized > untreated > hydrophilized cathode flow fields.
Neutron radiography with a five times higher temporal resolution (10 s instead of 50 s) enable a more precise correlation of the water volume in the cathode channels and the corresponding pressure drop. These experiments were performed with an untreated grid flow field (C-GR). In contrast to a C-CH dual-channel flow field, the untreated C-GR grid flow field ensures stable DMFC operation with negligible fluctuations of performance. This advantage is discussed in terms of the two-dimensional structure of the C-GR design, which is less sensitive to local accumulations of water droplets. However, the smaller channel cross section of the grid flow field causes a high, disadvantageous pressure drop. Future work should therefore comprise studies of the influence of cathode flow field design and surface properties on the operation of direct methanol fuel cells including the time-dependent water distribution and pressure drop in the cathode channels as well as the cell performance.
Acknowledgements We gratefully acknowledge André Hilger, Henning Markötter and Christian Tötzke for assistance in the camera setup and the radiographic measurements.

8
References
[1] C.-Y. Wang, Chemical Reviews, 104 (2004) 4727-4766.
[2] A.A. Kulikovsky, H. Scharmann, K. Wippermann, Electrochemistry Communications, 6 (2004) 729-736.
[3] A.A. Kulikovsky, Electrochemistry Communications, 8 (2006) 1225–1228.
[4] A.A. Kulikovsky, Chapter 4 - Quasi-2D model of a fuel cell, in: Analytical Modelling of Fuel Cells, Elsevier, Amsterdam, 2010, pp. 117-192.
[5] X. Liu, H. Guo, C. Ma, Journal of Power Sources, 156 (2006) 267–280.
[6] F.-B. Weng, A. Su, C.-Y. Hsu, International Journal of Hydrogen Energy, 32 (2007) 666–676.
[7] Y.-C. Park, D.-H. Peck, S.-K. Dong, S.-K. Kim, S. Lim, D.-H. Jung, J.-H. Jang, D.-Y. Lee, International Journal of Hydrogen Energy, In Press, Corrected Proof.
[8] F. Barbir, H. Gorgun, X. Wang, Journal of Power Sources, 141 (2005) 96–101.
[9] R. Anderson, L. Zhang, Y. Ding, M. Blanco, X. Bi, D.P. Wilkinson, Journal of Power Sources, 195 (2010) 4531–4553.
[10] H.A. Gasteiger, Y. Liu, D. Baker, W. Gu, Kinetics and Kinetically Limited Performance in PEMFCs and DMFCs with State-of-the-Art Catalysts, Mini-Micro Fuel Cells, in: S. Kakaç, A. Pramuanjaroenkij, L. Vasiliev (Eds.), Springer Netherlands, 2008, pp. 209-224.
[11] A. Schröder, K. Wippermann, J. Mergel, W. Lehnert, D. Stolten, T. Sanders, T. Baumhöfer, D.U. Sauer, I. Manke, N. Kardjilov, A. Hilger, J. Schloesser, J. Banhart, C. Hartnig, Electrochemistry Communications, 11 (2009) 1606-1609.
[12] A. Schröder, K. Wippermann, G. Zehl, D. Stolten, Electrochemistry Communications, 12 (2010) 1318-1321.
[13] R. Seemann, M. Brinkmann, E.J. Kramer, F.F. Lange, R. Lipowsky, Proceedings of the National Academy of Sciences of the United States of America, 102 (2005) 1848–1852.
[14] Y. Chen, L.S. Melvin, S. Rodriguez, D. Bell, M.M. Weislogel, Microelectronic Engineering, 86 (2009) 1317–1320.
[15] C.W. Extrand, Langmuir, 22 (2006) 8431–8434.
[16] E.C. Kumbur, K.V. Sharp, M.M. Mench, Journal of Power Sources, 161 (2006) 333–345.
[17] J.P. Owejan, T.A. Trabold, D.L. Jacobson, M. Arif, S.G. Kandlikar, International Journal of Hydrogen Energy, 32 (2007) 4489–4502.
[18] A. Bazylak, J. Heinrich, N. Djilali, D. Sinton, Journal of Power Sources, 185 (2008) 1147–1153.
[19] A. Turhan, S. Kim, M. Hatzell, M.M. Mench, Electrochimica Acta, 55 (2010) 2734-2745.
[20] M.K. Chaudhury, G.M. Whitesides, Science, 256 (1992) 1539–1544.
[21] A. Schröder, K. Wippermann, W. Lehnert, D. Stolten, T. Sanders, T. Baumhöfer, N. Kardjilov, A. Hilger, J. Banhart, I. Manke, Journal of Power Sources, 195 (2010) 4765-4771.
[22] P. Argyropoulos, K. Scott, W.M. Taama, Electrochimica Acta, 44 (1999) 3575-3584.
[23] C.W. Wong, T.S. Zhao, Q. Ye, J.G. Liu, Journal of The Electrochemical Society, 152 (2005) A1600-A1605.
[24] D. Spernjak, A.K. Prasad, S.G. Advani, Journal of Power Sources, 170 (2007) 334-344.
[25] K.W. Feindel, S.H. Bergens, R.E. Wasylishen, Journal of the American Chemical Society, 128 (2006) 14192-14199.
[26] K.W. Feindel, L.P.A. LaRocque, D. Starke, S.H. Bergens, R.E. Wasylishen, Journal of the American Chemical Society, 126 (2004) 11436-11437.

9
[27] Z.W. Dunbar, R.I. Masel, Journal of Power Sources, 182 (2008) 76-82.
[28] E. Lehmann, Pramana Journal of Physics, 71 (2008) 653-661.
[29] N. Kardjilov, I. Manke, A. Hilger, M. Strobl, J. Banhart, Materials Today 14 (2011) 248-256.
[30] M. Strobl, I. Manke, N. Kardjilov, A. Hilger, M. Dawson, J. Banhart, Journal of Physics D-Applied Physics, 42 (2009) 243001.
[31] E.H. Lehmann, P. Boillat, G. Scherrer, G. Frei, Nuclear Instruments and Methods in Physics Research Section A: Accelerators, Spectrometers, Detectors and Associated Equipment, 605 (2009) 123–126.
[32] J. Banhart, A. Borbely, K. Dzieciol, F. Garcia-Moreno, I. Manke, N. Kardjilov, A.R. Kaysser-Pyzalla, M. Strobl, W. Treimer, International Journal of Materials Research, 101 (2010) 1069-1079.
[33] E. Lehmann, N. Kardjilov, Advanced Tomographic Methods in Materials Research and Engineering, in: J. Banhart (Ed.), Oxford University Press, Oxford, UK, 2008.
[34] R.J. Bellows, M.Y. Lin, M. Arif, A.K. Thompson, D. Jacobson, Journal of The Electrochemical Society, 146 (1999) 1099 - 1103.
[35] I. Manke, C. Hartnig, N. Kardjilov, M. Messerschmidt, A. Hilger, M. Strobl, W. Lehnert, J. Banhart, Applied Physics Letters, 92 (2008) 244101.
[36] I. Manke, H. Markötter, C. Tötzke, N. Kardjilov, R. Grothausmann, M. Dawson, C. Hartnig, S. Haas, D. Thomas, A. Hoell, C. Genzel, J. Banhart, Adv. Eng. Mater., 13 (2011) 712-729.
[37] M.A. Hickner, N.P. Siegel, K.S. Chen, D.N. McBrayer, D.S. Hussey, D.L. Jacobson, M. Arif, Journal of The Electrochemical Society, 153 (2006) A902-A908.
[38] J.P. Owejan, T.A. Trabold, D.L. Jacobson, D.R. Baker, D.S. Hussey, M. Arif, International Journal of Heat and Mass Transfer, 49 (2006) 4721-4731.
[39] C. Hartnig, I. Manke, N. Kardjilov, A. Hilger, M. Grünerbel, J. Kaczerowski, J. Banhart, W. Lehnert, Journal of Power Sources, 176 (2008) 452-459.
[40] T.A. Trabold, J.P. Owejan, J.J. Gagliardo, D.L. Jacobson, D.S. Hussey, M. Arif, Use of neutron imaging for proton exchange membrane fluel cell (PEMFC) performance analysis and design, in: W. Vielstich, H. Yokokawa, H.A. Gasteiger (Eds.) Handbook of fuel cells: Fundamentals, Technology and Applications, vol. Band 6: Advances in Electrocatalysis, Materials, Diagnostics and Durability: Part 2, Wiley, New York, 2009, pp. 658–672.
[41] M.A. Hickner, N.P. Siegel, K.S. Chen, D.S. Hussey, D.L. Jacobson, M. Arif, Journal of The Electrochemical Society, 155 (2008) B427-B434.
[42] I. Manke, C. Hartnig, N. Kardjilov, H. Riesemeier, J. Goebbels, R. Kuhn, P. Krüger, J. Banhart, Fuel Cells, 10 (2010) 26-34.
[43] I. Manke, C. Hartnig, M. Grünerbel, W. Lehnert, N. Kardjilov, A. Haibel, A. Hilger, J. Banhart, H. Riesemeier, Applied Physics Letters, 90 (2007) 174105.
[44] R. Satija, D.L. Jacobson, M. Arif, S.A. Werner, Journal of Power Sources, 129 (2004) 238-245.
[45] I. Manke, C. Hartnig, M. Grünerbel, J. Kaczerowski, W. Lehnert, N. Kardjilov, A. Hilger, J. Banhart, W. Treimer, M. Strobl, Applied Physics Letters, 90 (2007) 184101.
[46] H. Markötter, I. Manke, P. Krüger, T. Arlt, J. Haussmann, M. Klages, H. Riesemeier, C. Hartnig, J. Scholta, J. Banhart, Electrochemistry Communications, 13 (2011) 1001-1004.
[47] P. Boillat, D. Kramer, B.C. Seyfang, G. Frei, E. Lehmann, G.G. Scherer, A. Wokaun, Y. Ichikawa, Y. Tasaki, K. Shinohara, Electrochemistry Communications, 10 (2008) 546-550.
[48] P. Boillat, G.G. Scherer, A. Wokaun, G. Frei, E.H. Lehmann, Electrochemistry Communications, 10 (2008) 1311–1314.
[49] S. Kim, M.M. Mench, Journal of The Electrochemical Society, 156 (2009) B353–B362.

10
[50] W. Maier, T. Arlt, C. Wannek, I. Manke, H. Riesemeier, P. Krüger, J. Scholta, W. Lehnert, J. Banhart, D. Stolten, Electrochemistry Communications 12 (2010) 1436-1438.
[51] C. Hartnig, I. Manke, J. Schloesser, P. Krüger, R. Kuhn, H. Riesemeier, K. Wippermann, J. Banhart, Electrochemistry Communications, 11 (2009) 1559-1562.
[52] N. Kardjilov, M. Dawson, A. Hilger, I. Manke, M. Strobl, D. Penumadu, K.H. Kim, F. Garcia-Moreno, J. Banhart Nuclear Instruments and Methods in Physics Research Section A: Accelerators, Spectrometers, Detectors and Associated Equipment, 651 (2011) 95-99.
[53] A.P. Kaestner, S. Hartmann, G. Kühne, G. Frei, C. Grünzweig, L. Josic, F. Schmid, E.H. Lehmann, Nucl Instrum Meth A, 659 (2011) 387-393.
[54] P. Boillat, G. Frei, E.H. Lehmann, G.G. Scherer, A. Wokaun, Electrochemical and Solid-State Letters, 13 (2010) B25-B27.
[55] E.H. Lehmann, G. Frei, G. Kühne, P. Boillat, Nucl Instrum Meth A, 576 (2007) 389-396.
[56] S.H. Williams, A. Hilger, N. Kardjilov, I. Manke, M. Strobl, P.A. Douissard, T. Martin, H. Riesemeier, J. Banhart, Journal of Instrumentation 7(2012) P02014.
[57] A.B. Geiger, A. Tsukada, E. Lehmann, P. Vontobel, A. Wokaun, G.G. Scherer, Fuel Cells, 2 (2003) 92–98.
[58] E.H. Lehmann, P. Vontobel, N. Kardjilov, Applied Radiation and Isotopes, 61 (2004) 503–509.
[59] D. Kramer, E. Lehmann, G. Frei, P. Vontobel, A. Wokaun, G.G. Scherer, Nuclear Instruments and Methods in Physics Research Section A: Accelerators, Spectrometers, Detectors and Associated Equipment, 542 (2005) 52-60.
[60] K.T. Cho, A. Turhan, J.H. Lee, J.S. Brenizer, A.K. Heller, L. Shi, M.M. Mench, Nuclear Instruments and Methods in Physics Research Section A: Accelerators, Spectrometers, Detectors and Associated Equipment, 605 (2009) 119-122.
[61] H. Janßen, L. Blum, N. Kimiaie, A. Maintz, J. Mergel, M. Müller, D. Stolten, Proceedings 3rd European PEFC Forum, Lucerne, Switzerland, (2005).
[62] M. Nölke, Schriften des Forschungszentrums Jülich. Reihe Energietechnik/Energy Technology 64, Forschungszentrum Jülich, 2007, ISBN: 3-89336-481-1, ISSN: 1433-5522, http://hdl.handle.net/2128/2600.
[63] T. Baumhöfer, Ortsaufgelöste Messung und Modellierung von Impedanzspektren an Brennstoffzellen, in: Institut für Stromrichtertechnik und Elektrische Antriebe, RWTH Aachen, Aachen, 2008.
[64] Freescale Semiconductor: Integrated Silicon Pressure Sensor, http://www.freescale.com/files/sensors/doc/data_sheet/MPX5010.pdf, call date: 17.11.2010, in.
[65] N. Kardjilov, A. Hilger, I. Manke, M. Strobl, M. Dawson, S. Williams, J. Banhart, Nuclear Instruments and Methods in Physics Research Section A: Accelerators, Spectrometers, Detectors and Associated Equipment, 651 (2011) 47-52.
[66] N. Kardjilov, A. Hilger, I. Manke, M. Strobl, M. Dawson, J. Banhart, Nuclear Instruments and Methods in Physics Research Section A: Accelerators, Spectrometers, Detectors and Associated Equipment, 605 (2009) 13-15.
[67] Ch. Tötzke, I. Manke, T. Arlt, H. Markötter, N. Kardjilov, A. Hilger, P. Krüger, C. Hartnig, J. Scholta, J. Banhart Journal of Power Sources, 196 (2011) 4631-4637.

11
Figure 1: Design of the flow fields for neutron radiography in the in-plane viewing direction; a) cell design #1: anode (A-CH) and cathode (C-CH) flow fields with dual-channel design, each channel has a width and depth of 1.5 mm; b) cell design #2: anode flow field with dual-channel design (A-CH, for channel dimensions see cell design #1), cathode flow field with grid structure (C-GR, edge length/distance between cubes = 1.0 mm).

12
Figure 2: Cell assembly with marking plate and mounting brackets used for neutron radiography in the in-plane viewing direction. The cell always was run at stoichiometries of λMeOH = 4, λair = 4 and a temperature of T = 70°C during the presented measurements, while the current density and the surface treatment were varied.
Figure 3: Sketch of the neutron source, neutron guide and the camera setup.

13
Figure 4: Neutron radiographs showing the influence of the surface properties on water transport; in-plane view of cells No. 1–3 with differently pretreated C-CH cathode flow fields: UNT: untreated, HPO: treated with hydrophobizing agent, HPI: treated with hydrophilizing agent; a) values averaged over 50 seconds; b) values averaged over 30 minutes; each pair of radiographs shows a beam-normalized image on the left side and a wet-normalized image on the right side; j = 150 mA/cm2.

14
Figure 5: Enlarged sections of the wet-normalized neutron radiographs averaged over 30 minutes taken from Figure 4, Δd refers to the periodicity of the woven GDL.
Figure 6: Radiographs at various times of cell design #1 with untreated surfaces (UNT). Periodic evolutions of droplets are always visible.

15
Figure 7: Radiographs at various times of cell design #1 with hydrophobized surfaces (HPO). Places of development and removal of droplets are marked by arrows.
16
Figure 8: Radiographs at various times of cell design #1 with hydrophilized surfaces (HPI). Water adhesions at the back wall of the cathode channel are visible.
17
0 1000 2000 3000 400005
10152025303540
t [s]
j = 50 mA/cm2
UNT
power densityP
[mW
/cm
2 ]
0
1
2
3
4
5
∆p [m
bar]
pressure difference
0 1000 2000 3000 40000
102030405060708090
t [s]
j = 150 mA/cm2
UNT
power density
P [m
W/c
m2 ]
012345678
∆p [m
bar]
pressure difference
0 1000 2000 3000 40000
102030405060708090
100110
t [s]
j = 300 mA/cm2
UNT
power density
P [m
W/c
m2 ]
0
2
4
6
8
10
12
∆p [m
bar]
pressure difference
0 1000 2000 3000 400005
10152025303540
t [s]
j = 50 mA/cm2
HPO
power density
P [m
W/c
m2 ]
0
1
2
3
4
5
∆p [m
bar]
pressure difference
0 1000 2000 3000 4000
0102030405060708090
t [s]
j = 150 mA/cm2
HPO
power density
P [m
W/c
m2 ]
012345678
∆ p [m
bar]
pressure difference
0 1000 2000 3000 4000
0102030405060708090
100110
t [s]
j = 300 mA/cm2
HPO
power density
P [m
W/c
m2 ]
0
2
4
6
8
10
12
∆p [m
bar]
pressure difference
0 1000 2000 3000 400005
10152025303540
t [s]
j = 50 mA/cm2
HPI
power density
P [m
W/c
m2 ]
0
1
2
3
4
5
∆p [m
bar]
pressure difference
0 1000 2000 3000 4000
0102030405060708090
t [s]
j = 150 mA/cm2
HPI
power density
P [m
W/c
m2 ]
012345678
∆p [m
bar]
pressure difference
0 1000 2000 3000 4000
0102030405060708090
100110
t [s]
j = 300 mA/cm2
HPI
power density
P [m
W/c
m2 ]
0
2
4
6
8
10
12
∆ p [m
bar]
pressure difference
Figure 9: Cell power density and pressure drop between cathode inlet and outlet showing the influence of the surface properties and current density on the time-dependent operating behavior; three cells (cells No. 1–3, cell design #1, C-CH flow fields) with differently pretreated cathode flow fields were used. UNT: untreated (top), HPO: treated with hydrophobizing agent (middle), HPI: treated with hydrophilizing agent (bottom). Current densities are j = 50, 150 and 300 mA/cm2.
18
Figure 10: Time-dependent operating behavior and water distribution in cell No. 4 (untreated C-GR cathode grid flow fields, cell design #2); top diagram: measurements of cell power density and pressure drop; middle part: neutron radiographs, beam normalized, bottom part: neutron radiographs, wet-normalized; only 10 s exposure time; j = 150 mA/cm2.

19
Table 1: Contact angles as a result of surface treatment for the materials used for flow field fabrication. UNT: untreated surface, HPO: surface hydrophobized by treatment with ‘Nano Holz&Stein’ sealant of Oberflächentechnik Preimeß GmbH, HPI: surface hydrophilized by treatment with ‘KLINGERflon-Spray’ of Klinger GmbH.
Surface treatment
UNT HPO HPI
Contact angle 115.9°± 2.3 126.8°± 2.0 26.2°± 2.7
Table 2: Specification of the cells used.
Cell No. Cell design Cathode flow field structure Pretreatment
1 #1 channel (C-CH) untreated (UNT)
2 #1 channel (C-CH) hydrophobized (HPO)
3 #1 channel (C-CH) hydrophilized (HPI)
4 #2 grid (C-GR) untreated (UNT)