Embed Size (px)
Citation preview

DOCUMENT RESUME
ED 421 933 HE 031 455
TITLE Illinois Higher Education in the 21st Century. Identifyingand Responding to the Educational Needs in Lake County: ACommittee Report.
INSTITUTION Illinois State Board of Higher Education, Springfield.PUB DATE 1998-09-01NOTE 88p.
PUB TYPE Reports - Research (143)EDRS PRICE MF01/PC04 Plus Postage.DESCRIPTORS Adult Students; Data Analysis; Education Work Relationship;
Educational Demand; Educational Improvement; *EducationalPlanning; *Environmental Scanning; Evaluation Methods;Formative Evaluation; *Higher Education; InstitutionalEnvironment; *Needs Assessment; Nontraditional Students;*Policy Formation; State Boards of Education; Surveys;*Trend Analysis
IDENTIFIERS *Illinois (Lake County)
ABSTRACTThis report presents the findings of a pilot study conducted
in Lake County (Illinois) that was designed to identify higher educationalneeds and to develop recommendations to respond to those needs. Severalmethodologies were employed: public hearings; market research; analyses ofcensus, labor, economic, and educational data; consultations with state andlocal government, community leaders, business executives, and highereducation administrators; and informal reviews of efforts in other states.Noted among the report's findings were: a strong demand for higher education,particularly among place-bound residents and working adults; a need forundergraduate degree programs in information technology and business and forgraduate programs in accounting and business; and concerns about program andfaculty quality, course accessibility, and cost of higher educationopportunities. Following a brief introduction, the report contains thefollowing sections: (1) a description of Lake County's educational resourcesand the comparative demand for higher education resources; (2) a needsanalysis; (3) a description of the proposed University Center of Lake County,highlighting its campus environment, use of existing resources, andestablishment of partnerships; (4) a request for institutional partners inthe University Center, detailing the types of programs and coursework needed;and (5) a brief description of the next steps in the program's development.Data tables and the market research report are appended. (MAB)
********************************************************************************* Reproductions supplied by EDRS are the best that can be made *
* from the original document. *
********************************************************************************

STATE OF ILLINOISBOARD OF HIGHER EDUCATION
ILLINOIS HIGHER EDUCATION IN THE 21ST CENTURY
IDENTIFYING AND RESPONDING TO THE
EDUCATIONAL NEEDS IN LAKE COUNTY:A COMMITTEE REPORT
PERMISSION TO REPRODUCE ANDDISSEMINATE THIS MATERIAL HAS
BEEN GRANTED BY
Illinois Board of
Hi her Education
TO THE EDUCATIONAL RESOURCESINFORMATION CENTER (ERIC)
September 1, 1998
Printed on Recycled Paper
2
U.S. DEPARTMENT OF EDUCATIONOffice of Educational Research and Improvement
EDUCATIONAL RESOURCES INFORMATIONCENTER (ERIC)
Fir<is document has been reproduced asreceived from the person or organizationoriginating it.
O Minor changes have been made toimprove reproduction quality.
Points of view or opinions stated in thisdocument do not necessarily representofficial OERI position or policy.

COMMITTEE MEMBERS
EDWIN H. MOORE, CHAIRTROY ARNOLDI
RAMON MARTINEZ, JR.PHILIP J ROCK
JANE T WILLIAMSON
3

EXECUTIVE SUMMARY
Purpose of Study:Begin a new master planning process with a pilot study in Lake County to develop
mechanisms to measure educational demand and need while responding in a manner
that takes full advantage of existing resourcesIdentify educational needs in Lake County and develop recommendations to respond
to these needs
Methods of Study:Public hearingsMarket research of resident, employer, and student needs by MGT of America
Analyses of census, labor, economic, and educational dataConsultations with state and local government representatives and community leaders
Consultations with CEOs and executives from corporations and non-profit
organizationsConsultations with presidents and staff of colleges and universities providing
education in Lake CountyInformal review of efforts in other states to meet the educational needs of working
adults and place-bound students
Findings:Demographic and economic indicators and market research show a strong demand for
higher education, particularly among place-bound residents and working adults.
Occupations requiring a graduate or professional degree, or bachelor's associate, or
some post-secondary education comprise almost 40 percent ofjobs in Lake County.
Baccalaureate completion programs in greatest need are in the fields of informationtechnology and business. In addition, there is a strong need for graduate programs in
accounting and business.The first concern of residents in selecting a higher education program is program and
faculty quality and course availability.For working adults, location, time, and cost are important considerations in deciding
whether to pursue higher education opportunities. Most Lake County residents wantevening courses that meet no more than twice a week, that are located within a half-
hour commute from home, and that do not cost over $500. Respondents also
expressed the need for available child care.Employers are willing to provide facilities and tuition reimbursement for employees.
Many Lake County residents are interested in taking courses via interne, while few
employers are interested in receiving this type of coursework.
Recommendations:Based on existing educational resources, the size and growth of the population and
economy, and the demand and need for higher education programs and courses, the
Committee recommends the establishment of the University Center of Lake County.
i 4

Three fundamental characteristics of the University Center will be:1. High Quality Instruction. The Center will be a learning institution with programs
offered at the baccalaureate degree completion, post-baccalaureate certificate, andmaster's level. Courses will be taught by regular faculty members of theparticipating institutions. Assessment and accountability measures will ensure thatprograms are meeting the educational needs of students, many of whom will beplace-bound residents and working adults, and that students will graduate with theskills and knowledge needed for success.
2. Leveraging of Existing Resources. The state-of-the art facilities and equipment ofthe University Center, as well as the academic and student support provided, willenable participating institutions to offer high quality programs through face-to-face instruction and distance learning. These programs will draw upon thestrengths of similar programs being offered on the campus of participatinginstitutions. Agreements will be sought with the College of Lake County andparticipating institutions to allow University Center students to use facilities suchas libraries and computer labs, etc.
3. Partnership and Local Participation. A distinguishing feature of the Center willbe the kinds of relationships and partnerships that form among educationalinstitutions, local residents, and county and state sponsors. Six of the elevenmembers of the University Center Board will be local residents, and residents willprovide ongoing advice about program and service needs. The State of Illinoisand Lake County will fund the capitals costs of the University Center.
Request for Participants:To meet the identified program needs of the University Center the Committeerecommends circulating a Request for Participants among the twelve memberinstitutions currently part of the Lake County Multi-University Center. If some ofthese institutions are not interested in becoming members of the University Center, orif collectively they are not able to provide programs that meet the county'seducational needs, the RFP should be more widely distributed, until interested andqualified providers are found.To respond to the RFP, each institution should indicate its support of the mission andgoals of the University Center, willingness to meet the expectations for participatinginstitutions, and provide information about its intentions to address the identifiedprogram needs described in this report.
Next Steps:Presentation of recommendations tAake County residents, the College of LakeCounty, and the Lake County Board.The Committee will produce a second report for the Board's December 1998 meetingthat will contain recommendations for implementing the University Center of LakeCounty.

Table of Contents
Executive Summary
Pagei
Introduction v
Chapter I: Lake County, Illinois 1
Lake County's Educational Resources 2
Comparative Demand and Need for Additional Higher Education 3
Chapter II: Needs Analysis 5
Adult Residents0 5
Employers 8
Students 10
Conclusions 11
Chapter III: The University Center of Lake CountyCreating an Environment that Promotes and Supports Student LearningBuilding Upon and Leveraging Existing ResourcesEstablishing New Forms of PartnershipMain Features
13
14
151617
Chapter IV: Request for ParticipantsTypes of Programs and Coursework Requested 19
Expectations for Participating Institutions 20
Information Requested in Response to the RFP 21
Chapter V: Next Steps 23
Resolution 25
Attachments
Appendix I: TablesTable 1: Enrollment Trends in Higher Education Institutions in Lake CountyTable 2: Institutions Approved to Offer Off-Campus Programs in Lake CountyTable 3: Population Growth 1980 to 2000 in the 20 Largest Counties in IllinoisTable 4: Projections for Population by Race and Ethnicity in Illinois' 20 Largest
Counties by the Year 2000Table 5: Population and Economic Characteristics of Major Illinois Counties, Ranking
Among All Illinois CountiesTable 6: Educational Attainment of Residents in the 20 Largest Counties in IllinoisTable 7: Comparative Analysis of Employment: the Educational Requirements of Jobs
in Major Illinois CountiesTable 8: Employment Projections by Industry, Lake County and the State of Illinois
Table 9: Projections of Occupations in Lake County Requiring Postsecondary Training
Or Higher Education
Appendix II: MGT of America, Market Research Results (Consultant Report)

Introduction
Beginning a New Master Plan
It is easy to think that higher education never changes. The caps and gowns, alma
maters, and a myriad of other customs and practices create an impression of immutability. Yet,
appearances can be deceiving. Tradition has not limited higher education's expansive role in
American society or the diversification of its institutions. Whatever the general perception, higher
education's success, as well as the quality of the instruction and services offered, ultimately has
rested on its ability to change and adapt.
A public stewardship that has recognized the importance of helping individuals to obtain
a college education has made higher education's evolution possible. While established
institutions have adapted, other types of organizations and programs have been created to address
emerging needs. Over the past forty years, the master plan has become one of the principal
means for exercising this public stewardship. Master planning represents one of the basic
responsibilities of the Board of Higher Education. There have been numerous examples of major
higher education initiatives first developed and proposed in Illinois Board of Higher Education
master plans. These include the establishment of the Illinois community college system and a
state need-based student aid program, foundation of new types of universities such as Governors
State University and the former Sangamon State University, now the University of Illinois at
Springfield, and creation of special statewide programs for enhancing inter-institutional
cooperation and expanding professional education.
How will and should Illinois higher education now prepare itself for the 21 century?
What kinds of changes and innovations are needed if Illinois colleges and universities are to help
citizens live and work in a society that is evolving in new directions with unique problems and
opportunities? To address such questions the Board of Higher Education inaugurated a master
plan process in January, 1998 and created a Committee to study the educational needs of the
north Chicago suburbs.
Beginning a master plan by undertaking a study in one region is itself a departure from
tradition. This approach represents a conscious innovation and a desire to more closely examine
the needs of those whom higher education servesstudents, communities, businesses, industries,
government, and public and private organizations. This study has produced extensive data about
Lake County. In the process, the Committee has tested new mechanisms for examining
educational needs that can be used in the next, statewide phase of the master plan.
As part of this study, the Committee contracted for a market research report on the
educational needs of Lake County. The attached report, prepared by MGT of America, presents
overall trends and data from written and oral surveys. In total, the firm conducted three surveys:
1) a telephone survey of a sample of the general adult population of Lake County age 21 and
over; 2) a written survey of the educational needs of a stratified random sample of Lake County
businesses with 10 or more employees; and 3) a written questionnaire submitted to human
resource directors of the county's 25 largest employers. MGT of America also conducted a
statistical analysis of a written survey of a sample of juniors in county high schools about their
educational plans and aspirations.
To complement the information gathered from the market research, the Committee
convened a number of different forums in which to talk with Lake County residents. Staff also
7

undertook further research to analyze demographic and economic data relevant to educationaldemand and need. On March 9th, the Committee held public hearings in Waukegan andLinolnshire at which 27 persons spoke and for which another 8 persons submitted writtentestimony only. In other meetings, Committee members met with presidents of colleges anduniversities serving Lake County, county officials and state representatives, and communityleaders. The Committee also convened three luncheon meetings to talk with CEOs and keyexecutives from the major employers in the region such as Abbott Laboratories, HewittAssociates, and Baxter Healthcare Corporation.
This study and the accompanying consultant's report show that strong demand exists andwill increase for higher education programs in Lake County. To respond to this need, theCommittee proposes the creation of a University Center of Lake County. The University Centerwill be a new kind of institutionone that offers high quality, convenient and affordableeducation by building upon the resources and programs of existing institutions. As outlined inthis report, the Center will have a central facility with courses linked by technology with othersites and with students' homes and workplaces. The Center will house computer laboratories andlibrary services, as well as provide student support services such as advising. The UniversityCenter will constitute a unique learning community, with standards and practices for ensuring thatstudents can progress in their programs and demonstrate high academic achievement. The Centerwill be governed by a board of directors, amajority of whom will be local residents,and will work in close association with theresidents, businesses, and organizations ofLake County in identifying and respondingto student needs.
This report ends with a Requestfor Participants (RFP). Having identifiedthe county's most pressing educationalneeds and formulated a structure by which those needs can best be met, the Board is now askingIllinois colleges and universities to offer programs at the University Center. As explained in theRFP, the Board wants institutions to offer quality programs in fields identified by the needsanalysis as having a high priority, as well as programs that will be offered at times and locationsconvenient to working adults and place-bound students. The twelve member institutions of thecurrent Multi-university of Lake County have been asked to respond to the RFP by Oct 15, 1998.If these institutions are not able to provide the needed programs, other provider institutions willbe sought. The Committee will issue a second report on Lake County in December 1998. Thelatter report will present detailed plans and budget recommendations for implementing theUniversity Center of Lake County, as well as ideas and proposals for statewide continuation ofthe master plan.
The Subcommittee proposes thecreation of a new type of learninginstitution: the University Center ofLake County.
8
v i

CHAPTER I
Lake County, Illinois
A Growing County with a Strong and Rising Demand for Education
Change and growth are dominating forces in Lake County, and their presence has left few
communities and individuals unaffected. A drive through the county in almost any direction,
towards its southern border with Cook County or its northern border with the state of Wisconsin,
reveal that fundamental changes are now taking place across the breadth of the county. With a
mix of rural, urban, and suburban areas, Lake County has always presented strong contrasts.
However, today, even the nature of its diversity is changing, as shown, for example, in the
proportion of land devoted to suburban as opposed to urban and rural use; the proportion of
individuals employed in white collar jobs compared with farming and manufacturing positions;
and in the racial and ethnic mix of the population.
Lake County: A Statistical Summary*Population: 1980 Census 440,372
Population: 2000 (Projected) 607,860
Per Capita Personal Income $38,841
Number of Businesses 16,137
Number of Persons Employed 296,431
Employee Earnings (in millions) $12,983
Percent Unemployed 4.0 %
Retail Sales (in millions) $6,907
* 1996 Statistics Unless Otherwise Noted
The northern and western portions of Lake County have demonstrated the greatest
growth. Only a few areas, generally older communities, have not had a strong increase in
population. Perhaps the story of Vernon Hills exemplifies the transformation that has occurred.
Vernon Hills was incorporated in 1958 as an outgrowth of a subdivision. The 1960 U.S. Census
counted the town's population at 123, but by 1980 the population had reached 9,827, and today it
is estimated at 19,500. The average median household income in the town is $48,900. The 1996
median price of a single-family house was $200,000, although multiple condominiums and
apartment buildings constitute about 40 percent of all housing.
Far from just a bedroom community, Vernon Hills is also home to many corporate, retail,
and community facilities. Vernon Hills has three corporate parks including Corporate Woods, an
attractive 340 acre, mixed-use project that now contains 45 buildings and two million square feet
of space. Four shopping centers are located here, and the town advertises that its "golden mile"
along Route 60 contains over 300 shops, restaurants, and service establishments. Residential and
recreational areas include golf and tennis courts, bike paths, an ice rink, an "Arbortheater" and a
$3.5 million community/aquatic center.
Few communities in the state outside the Chicago collar counties have experienced
Vernon Hill's story of growth and prosperity. Across the United States, however, there are other
locales with similar profiles, in areas that are sometimes referred to as "edge cities." Edge cities
represent something new in the American landscape being neither urban, suburban, or rural in
character. Often the site of small, newly formed businesses and major international corporations,
1 9

edge cities are home to many high growth, technologically-based industries often in electronics,engineering, health-care, and pharmaceutical fields. They constitute some of the mosteconomically productive regions in the country, and the people who live there tend to be moreaffluent, better educated, and employed in professional and analytical occupations. Higher
education is necessary for their employment and a precondition for their continued progress in
jobs and careers.
The explosive growth and rising demand for higher education make Lake County asalient case study as the Board explores the needs for higher education in a new century. Howshould the Board evaluate the case for providing additional educational resources in Lake County
and other regions of the state? Morecitizens throughout the state seek
What is the relative demand or need for iaccess to higher education. Thisrise in demand is seen in the
higher education in Lake County compared increasing percentage of high school
with other counties in the state? graduates interested in going on tocollege, presumably influenced bythe declining value of a high schooldiploma; the rise in the number of
working adults returning to college either to begin or complete undergraduate degrees or to enrollin graduate programs; and the increasing percentage of jobs in the economy that require collegelevel skills and training. The Board of Higher Education must respond to this rising demand. Atthe same time, it must establish priorities for the allocation of scarce resources and identify wherethe demand and need for higher education is greatest.
To determine whether one region of the state has a greater need for higher education thananother requires comparing the "supply" of higher education, that is, the number and types ofeducational institutions and programs serving an area, and its demand for higher education.Traditional indicators of demand are the size, growth, and demographic make-up of a region'spopulation and the need for higher education services among local employers. Data about thesize, nature, and vigor of the area's economy are also relevant.
Lake County's Educational Resources
In Lake County, educational resources and capacity are mainly at the lower-divisionlevel, that is, the first two years of undergraduate education. As shown in Table 1, Lake Countycontains a local community college and eight private institutions. The largest institution, theCollege of Lake County, provides pre-collegiate, continuing education, and undergraduateprograms. Private institutions such as Lake Forest College and Barat College offer liberal artseducation while other institutions such as the Lake Forest School of Management and theChicago Medical School offer specialized programs primarily at the graduate and professionallevels. In Fall 1997, total enrollment at higher education institutions in Lake County was 20,592including a graduate enrollment of 4,040. Based on testimony given to the Committee, there issome available capacity in one of the county's private, liberal arts institutions. In addition to theinstitutions located in Lake County, four public and 13 private institutions based elsewhere, aswell as two out-of-state institutions, offer 76 off-campus undergraduate and graduate programs inthe county. As shown in Table 2, these programs are in fields such as educational administration,business administration, management information systems, liberal arts, engineering, computer
science, and health.
1 02

Lake County is also the site of a Multi-University Center established in 1997 and
operated by the University of Illinois. The purpose of the Center is to complement the region's
existing institutions by offering baccalaureate-completion and graduate degree programming, as
well as continuing and professional development education. A second goal of the Center is to
better link the citizens of the region with the resources of the Center's member institutions. TheCenter now brings programs from 12 public and private colleges and universities to several sites
in the area. In the past year, the Center offered 66 courses to about 800 students. The College of
Lake Community College district is also one of three districts served by the North Suburban
Higher Education Consortium. Under the Illinois Board of Higher Education's
telecommunications initiative, the Consortium has established five video classrooms in Lake
County.
Comparative Demand and Need for Additional Higher Education
Unquestionably, the size and continued growth of Lake County's population constitute its
strongest claim for higher education. Lake County has an estimated 594,799 people, making it
the third most populated county behind Cook and DuPage counties. As shown in Table 3, eleven
of the twenty most populated counties in the state experienced population growth from 1980 to
1990. Among this group, Lake County had the second largest population increase during this
decade and for the 1980 to 2000 (projected) years. Indeed, the twenty-year increase of 167,000exceeds the population projected for 90 of Illinois' counties. The Northeastern Illinois PlanningCommission estimates that strong population growth will continue in Lake County and the otherChicago suburban counties at least through the year 2020.
Individuals who cannot relocate or devote substantial commuting time to reach an out-of-
county college or university because of financial, personal, or family circumstances are most in
need of local access to higher education. While students of all ages and types can be place-bound, many are working adults or lower-income. Demographic information and market researchindicate substantial demand for higher education among place-bound individuals in Lake County.
These data confirm the testimony of many residents at the Committee's hearings who, because ofpersonal circumstances, seek access to nearby classes.
The income distribution and racial/ethniccomposition of Lake County is surprisingly varied.The county ranked 16th in the nation in 1996 in percapita income, according to the Department ofCommerce's Bureau of Economic Analysis. Yet,this affluence masks broad differences in incomeamong Lake County communities. For example,in the northeast quadrant, the median householdincome ranges from a low of $29,063 in Park Cityto a high of $59,182 in Wadsworth. In thesoutheastern quadrant of the county, medianhousehold incomes range from $25,500 in NorthChicago to $97,324 in Lincolnshire.
In the last two decades, there has been arapid influx of minorities and foreign immigrants,particularly of Hispanic and Asian heritage. In fall 1996, 15 percent of Lake County public highschool students lived in homes where a language other than English was spoken. As shown inTable 4, Lake County has the third largest Hispanic population (59,000 projected in 2000) of any
Indicators of Demand for HigherEducation in Lake County*
Indicator RankingTotal Population 3rdPopulation Growth: 2nd1980 to 2000Number of Employees 3rdNumber of Businesses 3rd
Business Growth: 1st
1980 to 1990
* Ranking Among 102 Illinois Counties
31 1

Illinois county. Many Hispanic and Black citizens have low income and are more place-boundthan other residents. Minority populations are concentrated most heavily in Waukegan and North
Chicago, but members of Hispanic and Asian populations, in particular, are located throughout
the county.
Lake County's robust economy and the types of businesses and occupations of thoseemployed and living within the county strongly contribute to the growing demand for highereducation. Lake County's economy has shown great vitality in recent years with employmentincreasing by 13 percent since 1990, substantially above the state average growth of 5 percent.
With more than 16,000 businesses at more than 25,000 locations, employing 300,692 workers in1997, the county's economic profile differs from most other counties in the state (see Table 5).While the majority of employment is in services, the county has a higher percentage of jobs inmanufacturing and trade, and, in particular, in professional scientific equipment and chemical and
drug product manufacturing. Among its largest employers are companies such as AbbottLaboratories, Baxter Healthcare Corporation, and Motorola Corporation which see a closeconnection between product innovation, productivity, and growth and the continued development
of employee skills and knowledge.
Research has shown that one measure of a population's demand for higher education isthe amount of education already attained. Thus, a region with a high proportion of residents withsome college education will have greater demand for further higher education than a region witha lower education level. While this finding may seem surprising, it reflects the fact that
professions and businesses that require more education and training place emphasis uponcontinued development of employees' knowledge and skills. For instance, an engineering firmthat hires a new graduate with a B.S. in Engineering will likely have expectations for thatemployee to further his or her education and may even reimburse the cost. Based on informationfrom the 1990 United States Census, Table 6 shows that Lake County has higher levels ofeducational attainment, particularly at the bachelor's level where it ranks second among othercounties statewide, and at the graduate or professional degree level where it ranks third.
Another way of examining educational demand is by studying the types of jobs within aparticular region irrespective of the educational attainment of the individuals who currently hold
these positions. The Illinois Occupational Information Coordinating Committee (10ICC)collects this kind of information and results from its examination of 1992 employment areincluded in Table 7. This analysis shows that 39.8 of all positions in Lake County require some
type of post-secondary education. Among the major counties, Lake County ranks second behindSangamon County on this measure of educational demand.
124

CHAPTER II
Needs Analysis
What Kind of Programs and Courses are Needed in Lake County?
High population and economic growth and increased demand for higher education by both
businesses and residents influenced the Board of Higher Education to undertake a needs analysis
for higher education in Lake County. The following description of the results of these analysesrelies on information from market research, data analysis, two public hearings, a focus group with
latino community leaders, and three luncheon meetings with corporate executives. Most of the
market research was conducted by a private consulting firm, MGT of America. An attached reportby this firm describes the results of its written and telephone surveys of residents, employers,human resource directors, and high school juniors.
This needs analysis is intended to answer the following questions: What unmet need is
there in Lake County for college-level course-work and programs? At what level and in whatsubjects does unmet need exist? By what means, at what locations, and at what cost to studentsand employers should these needs be met? And what are employers willing to do to respond to
unmet needs for higher education in Lake County?
Adult Residents
Several key findings emerge from the needs analyses of Lake County residents. Perhapsmost importantly, many residents are very interested in taking college and university courses, andwant greater access to such instruction in the future. Second, residents want to improve their skills
in their current jobs, or prepare for new jobs in high demand fields such as computerscience/information technology, business, education, and accounting. Third, residents wantopportunities to complete baccalaureate and graduate degrees. Fourth, residents rate the quality of
courses, programs, and faculty as the most important factors affecting their selection of a highereducation course or program. Finally, many residents are place-bound and seek to balance familyand job responsibilities with further education. They want higher education programs that areconvenient with flexible class schedules and even on-site child care.
Census data indicate that more Lake County residents have completed high school, or atleast some college, than residents in similar counties or in the state as a whole. Higher educationis an integral part of their personal and professional lives. Their active participation is borne out instrong course-taking behavior, as well as plans for schooling in the near future. One-third of theadults surveyed have taken a course within the last two or three years. About one-third also saythey are likely to take a course in the next two or three years. Some adults are willing to go togreat lengths for more education. For instance, one 29 year-old woman from Lake County, a firstgeneration college student whose family thought that college was for people in higher economicand social classes, reported at the hearing on her experience after completing a two-year degree at
the College of Lake County. Wishing to continue, she said:
"I decided to go to Southern because I knew someone who was going there and I
thought I could afford it. I had worked full time for two years saving moneywhile I went to CLC. I had worked in a department store, and I'd moved up tobeing a counter manager for a small cosmetics line. But I had looked at other
5 1

people much older than I and they were doing the same job I was. I knew that Ididn't want my future to be like their present. I needed to get more education tomake something more out of myself. But there wasn't a state school close tohome that I could attend after CLC. I felt desperate. I had bought a car to get toand from work and school, and I just sold my car, my stereo, and every otherlittle thing that I owned so I could go away to school. But . . . it turned out that Ihad only enough money to get through the first year. And I thought, "What am Igoing to do?"
Also at the hearing, an associate dean at the College of Lake County reported on a recentstudy he conducted of 3,000 declared business majors of whom nearly 1,200 plan to transfer to afour-year institution to continue their education on a part-time basis. Many of these students areplace-bound because they are older and have full-time jobs. They need baccalaureate transferprograms that are local and that can accommodate their work schedules. He noted that thebusiness students coming out of Lake County ask the following questions: Where can I get furthereducation? How far is it? How much does it cost? Will my credits transfer?
Residents have a clear preference for degree programs. Even though almost half of theresidents surveyed say they are interested in taking just one course, they want that course to counttoward a higher education credential. When asked why they are interested in taking a course, one-third cite professional development objectives and the need to enhance their skills for their currentjobs, and an additional 21 percent say they want to obtain skills for entry into a new or differentjob. Thirty-five percent of adults are interested in taking courses for personal reasons.
Most adults are interested in major fields of study that have direct career implications. Thetable below shows the subject areas most frequently chosen by survey respondents.
Subject Areas of Interest of Adults Surveyed
Subject Area Top Choice Second Choice
ComputerScience/InformationTechnology
26% 5%
Business 10% 4%Teacher Education 9% 1%
Accounting 4% 1%
EducationalAdm inistration
4% 1%
Allied Health 3% 1%
Engineering 3%
Quality programs, quality faculty, and available courses are the strongest concerns of LakeCounty residents. Nine out of ten respondents rate these factors as having the greatest importancein selecting a particular course or program. Next in importance, about eight in ten respondents seekclass schedules that allow them to work, safe and secure class locations, flexibility to learn at one'sown pace, and convenience to home. Somewhat further down the list, about two-thirds ofresidents cite tuition, library services, available parking, computers, on-site faculty, and
146

convenience to work as very important. While adults seek convenience, the quality of the
education they receive is still more important to them, even more important than tuition costs.
Overall, Lake County residents seem amenable to taking courses taught through non-
traditional methods. While only 12 of 600 respondents have ever taken a course on the internet.
approximately 400 (two-thirds) say they would be comfortable taking an internet course. Sixty
percent also would be willing to take an interactive video course. Of those who are not interested
in taking computer-based or interactive video courses, the majority prefer personal contact with an
instructor. An academic administrator at the College of Lake County testified that "many
[students] have learning styles that prefer social interaction with faculty and other students. Their
schedules are as diverse as their lives. In other words, they will need day, evening, and weekend
classes. Some will prefer standard lecture courses. Others will benefit from self-paced courses."
Residents want accessible, affordable education. Since 71 percent of the respondents work
full-time, it is not surprising that only 9 percent are interested in taking courses full time. Most
respondents want evening courses that meet no more than twice a week, that are located within a
half-hour commute from home, and that do not cost over $500.
Understanding the barriers, such as the lack of child care, that adults face in pursuing their
educational goals can give us important information about how best to deliver higher education to
an older, place-bound student population. To identify such barriers, residents were asked if they
had considered taking a course within the last two or three years, and then not followed through.
About one-third said "yes." When asked why, about one-quarter offer reasons that higher
education can address. Eleven percent cite cost, seven percent cite child care requirements, five
percent lack of available courses or programs, and three percent have distance or travel constraints.
When adults were asked if there are any situations that would make it difficult for them to take a
class in the future, child care is again the top concern, followed by cost.
The difficulties involved in balancing career, family, and educational responsibilities were
vividly described at the public hearings. One academic administrator spoke about students
"struggling with coursework, childcare and a job" and added that these barriers "are more
significant for first generation students and students of color. Frequently they do not have the
financial or sociological support base in their families to understand the sacrifices that may need to
be made to reach long term educational goals." A first-generation college graduate, whose parents
worked in a factory as skilled laborers, and who eventually earned a master's degree and became a
faculty member at the College of Lake County, described the obstacles he encountered in pursuing
a baccalaureate degree in Lake County:
"My education did not come without a price. I worked three jobs
throughout my college career. I was never able to save enough to afford room
and board at a four year institution . . . I commuted for four and a half years . . .
This did not come without sacrifice. I could not participate in college activities,
as I had to race home to work my three part-time jobs. This required a three hour
daily round trip commute, a commute that ate up three hours of valuable study
time. I survived it through my own determination and youth, and the fact that I
was unattached and owned my own car I was often traveling at midnight orleaving for school at five in the morning.... Often I would sleep in the car if I had
an early class the next day.
157

Employers
Analyses of economic and occupational data show a strong demand for additional highereducation programs in Lake County, particularly at the baccalaureate level. Occupationsrequiring a graduate or professional degree or bachelor's, associate, or some post-secondaryeducation comprise almost 40 percent of all jobs in Lake County. It is projected thatapproximately 900 positions annually are available in the county that require bachelor's degreesor higher, as well as work experience. An additional 1,100 job openings are available that requirea bachelor's degree, 700 an associate degree, and almost 1,000 that require some post-secondarytraining or education.
Occupational Needs in Lake Countyin High Growth Occupations
Annual Graduates fromOccupations Openings Lake County Inst.Doctoral LevelBiological Scientists 53 7
Master's LevelAccountants/Auditors 104 0
Bachelor's LevelOr Higher
General Managers 231 199Marketing/PR 107 5
Other Administrators 95 71
Financial Managers 65 0Eng., Math & Science 53 0
ManagersOther Engineers 53 0
Bachelor's LevelComputer Scientists 141 6Elementary Teachers 123 27Sales Representatives 106 0Technical Workers 97 0Secondary Teachers 86 8
Loan Officer & Counselors 57 0
Both current industry and occupational data and projections about Lake Countydemonstrate strong demand in some fields, especially information technology and business,although demand at all levels of education and for many types of programs is evident. (see Tables8 and 9 in the Appendix). The table above summarizes the relative need for those occupationswith 50 or more job openings annually in Lake County. It compares average annual job openingswith current supply of program graduates from colleges and universities in Lake County. The199 graduates reported for general managers are MBA graduates and could also fill positions forthe other management and administrative occupations. Program graduates from off-campusprograms and the existing Multi-University Center are not included.
16

Those occupations identified as having significant number of job openings by researchdata, also have been identified as shortage areas by the multiple market research methodologies,
that is, conversations with, and surveys of, business leaders. Discussions with business
executives confirm that baccalaureate completion programs are needed, particularly in the fields
of information technology, electrical and mechanical engineering, and business. A major health
care CEO predicts a future nurse shortage, and states that there exists a current need for advanced
practice nurses, occupational and physical therapists, and ultra-sonographers. A survey of human
resource directors cites shortages of operations researchers, programmers and systems analysts,
software engineers, hardware engineers, chemists, and biologistsall professional positions thatrequire a bachelor's degree or above. The survey of employers cites serious shortages of staff in
areas of computer technology and programming, accounting, administration, engineering, and
education.
Taken together the market research indicates that employers' highest priority is forworkers trained in the fields of information technology and systems analysis. Demand is highest
for graduates with bachelor's degrees, although strong demand exists for master's graduates andcontinuing education programs for current employees. The second highest priority of employers
is for business graduates. Employers foresee shortages for various types of managers, includingmarketing managers, certified financial advisors, accountants, and auditors. To meet these needs,
employers seek master of business administration programs, and courses in basic finance, project
management, interpersonalrelations, and supervision.Several large medicalproducts manufacturerswant specialized MBAprograms for scientists.
Overall, employersin Lake County are pleasedwith the graduates they havehired from Illinois collegesand universities. Althoughemployers recruit regionally for some occupations like engineering, they also hire manybaccalaureate degree graduates from Illinois institutions and would like more such graduates
available locally. Most employers agree that colleges and universities are doing a good jobpreparing students for the work place. However, employers want more than just degrees. A largepercentage feel that short-term courses and continuing education are needed to meet their currentand future needs. They request short-term training in fields such as tool and die mold making;
heating, ventilation, and air conditioning; biotechnology; and engineering/manufacturing.Several manufacturing firms indicate a need for advanced courses and seminars in engineering.
One corporate executive told the committeethat she would "hire every informationtechnology specialist that higher educationprovides." The other executives at the meetingagreed.
Corporate leaders continually speak of re-packaging courses and content for certification
of specific technical skills. But more insistently, they want graduates who are better prepared tomeet the challenges of the work place. They seek individuals with skills in communications,problem-solving, creativity, and ethics. In a much repeated phrase, they are looking for workersthat can think "outside the box." One human resource vice-president, for instance, compares theskills needed by the customer relations person and the landscape architectboth must look at asituation and envision what is not there and what is needed to complete the task. Findings from a1995 Survey by the National Center on the Educational Quality of the Workforce confirm that amajority of employers report a change in the types of skills needed to perform today's jobs.
17

Other recent studies also have shown that the majority of office jobs now require a bachelor's
degree.
The market research producedmixed results about employer interest intechnology-based instruction.Conversations with corporate executivesproduced no clear preference for a
particular educational delivery system.Indeed, those consulted emphasize that"what is delivered is more important thanhow it is delivered." On the other hand,ninety-seven percent of employers respondthat they are not interested in courseofferings via the internet or interactive video for their company. Also, just under half of LakeCounty employers indicate that they currently sponsor college-level coursework for theiremployees, either on-site or at another location. About two-thirds of employers also sponsorcontinuing professional education. A slightly higher percentage of employers prefer on-site tooff-site instruction.
Employers stressed that today'soffice jobs require employees tocommunicate and think throughproblems more creatively and on ahigher level.
Students
As part of this study, juniors at three Lake County high schools completed surveys abouttheir educational goals and aspirations. Survey results show that these students want a traditionalundergraduate experience. Eighty-three percent plan to go to college right after high school andanother six percent within a year after graduation. Only five percent have no college plans.Students also have high aspirations with eight in 10 students intending to earn a bachelor's degreeor higher. Consistent with their college-going intentions, about a third of the students report thatthey are currently taking Advanced Placement courses.
When asked in what major they are most interested, 11 percent of the over 1,000respondents say they are undecided. Business is the choice most frequently mentioned (12percent); followed by fine arts (11 percent); social sciences, engineering; and education (8 percenteach); health (7 percent); and computer science/management information systems (6 percent).The relatively low percentage of students who express interest in computer science/managementinformation systems (58 out of 1,012 students) is important since employers have difficultyfinding qualified professionals in this field.
A large majority of these students express interest in leaving home to go away to college,and many are interested in possibly attending an out-of-state institution. Less than half expresssome interest in commuting and attending a non-residential college. Unlike the adults, students
strongly prefer face-to-face instruction. While almost all of the students have access to acomputer and the internet, only about a third are interested in taking an internet or two-wayinteractive video course.
A critical question from this survey concerned possible barriers to college enrollment.Thirteen percent of the students say there are foreseeable circumstances that could keep themfrom going to college and another 25 percent say there might be. This is the potential pool ofhigh school students who might stay home to go to college or attend college on a part-time or"stop-in/stop-out" basis. Of the 1,052 students answering this question, 26 percent cite cost as thetop barrier, followed by bad grades (10 percent), the need to work (4 percent), lack of interest (4
118

percent) and family responsibility (2 percent). Testimony of one Lake County school
superintendent corroborates these student responses as he noted that some high school graduates
are kept homebound by cost and various factors, even though they might prefer to go away to
school.
Conclusions
Looking across the data and responses from the consulted constituencies, three
conclusions emerge: 1) Lake County residents and employers seek additional baccalaureate
completion, graduate and professional training and education; 2) employers and residents are
interested in additional higher educational opportunities in a number of fields and place highest
priority on information technology and business; 3) Lake County residents seek higher education
that is high quality, affordable, and convenient, and many employers are willing to help them
meet these needs.
Many Lake County residents are now enrolled in higher education courses and intend to
pursue additional courses and programs in the future. One third of respondents found the time to
take a college-level course within the past two or three years. This willingness of residents to
pursue further education matches employers' interest in a well-trained workforce. Employers not
only desire an increased supply of local graduates but also stress the need for graduates who have
higher order communications and problem solving skills.
Priority Needs in Lake County
Master's Baccalaureate Courses and Short-term Training
PriorityHigh Accounting
Business Administration
Business and ManagementFinanceMarketingPublic RelationsScience ManagementInformation TechnologySystems AnalysisOther EngineeringSecondary Education
ManagementTeamworkComputer SkillsMathematicsLanguage SkillsInterpersonal SkillsEthicsProject ManagementTechnical Updates
Moderate Information SystemsManagement AnalysisEducational Adm.Nursing Specialties
Mechanical, Electrical, andComputer Engineering
Labor RelationsPersonnel and Training
ManagementPre-K Teacher EducationKindergarten Teacher Ed.Manufacturing Technology
Advanced EngineeringHeating, Ventilation,
and Air Conditioning
Low Speech PathologySocial WorkPsychology
Chemistry
1,9

The above table shows specific strength of demand for programs in various fields and atdifferent education levels. A "high priority" is found for those occupations with 50 or moreaverage annual job openings in the county and a limited number of graduates; a "moderatepriority" is 25-49 average annual job openings with fewer graduates than needed; and 10-24 is a"low priority," but still needed. The analysis takes into account existing programs in the county.These prioritized needs are further discussed in the Request for Participants chapter.
The results of this needs analysis reveal a match between what employers are willing toprovide and what adults need. The majority of adults prefer evening courses, with morningcourses their second choice. Most adults are also not willing to commute more than a half hour,to pay more than $500 per course, and to attend class more than twice a week. When employerswere asked how they might assist meeting these needs, three quarters indicate they are willing toprovide tuition reimbursements as an incentive for additional training. Employees, however, maynot be aware of these plans, for two thirds of all residents report that their employers have notencouraged them to take a course.
There are two main areas where the needs of adults and employers differ. Anoverwhelming three fourths of adults want their coursework to count toward a degree orcertificate. Employers, however, feel that short term courses and continuing education oftenbetter meet their training needs. While adults are motivated by short-term goals, they also wantrecognizable credentials to support long-term career interests. This suggests that highereducation and employers need to work together to explore ways to accommodate employees'needs. One possibility is to break courses into short term training sessions so that students canaccumulate credits that might eventually count as a regular college credit course.
Employer and resident responses also diverge in questions about technology-basedcoursework. While two-thirds of residents are willing to take a course on the internet, fewemployers are interested in either internet or interactive video courses for employees. Asinternet-based instruction becomes more widespread and sophisticated, employers may seeinternet delivery of instruction as a more viable option to fulfill their training and educationneeds.
2 0
1 2

CHAPTER III
The University Center of Lake County
Leveraging Resources and Forming Partnerships to Promote Student Learning
The preceding pages have shown that there is strong demand for more higher education
in Lake County. The need arises because of a large population and employment growth and, inparticular, a growth in place-bound residents, especially adults whose job and familycommitments limit their ability to access these institutions. Two questions follow from thismarket research. Should the state respond to the needs that have been identified? And, if so,how? The Committee believes that failure to act would have serious long-term consequence forthe region and state. The documented educational needs of Lake County residents are deeplyrooted and represent the natural outgrowth of a rapidly expanding population and an economythat requires workers to have higher levels of knowledge and skills.
If the need to respond is clear, how to respond requires definition. First, the Committeedoes not support establishing a four-year public university in Lake County or relying exclusively
on technology-based instruction. Building, equipping, and staffing a four-year public universityis an expensive and deliberative process which would likely result in the establishment ofprograms that are not in demand and for which adequate capacity now exists on public andprivate university campuses. Equally important, the typical university with its mixture ofinstruction, research, and public service activities is not focused on meeting the educational needsof local employees and working adults. An institution with a more narrowly defined mission,such as proposed, would better produce the accessible education that residents desire.
The market research has shown that most residents have familiarity with, and someresidents have interest in, taking courses through technology. Yet, an important finding of theresearch is that many prefer an educational experience that involves personal contact. Based onthese results and the strength of the demand in Lake County for higher education, we concludethat technology should be part of the solution, but not the state's main response, to meeting theneeds of this area. As technology matures in its ability to deliver instruction, it will play a moreactive role, but it will never entirely replace the "human touch".
In formulating these recommendations, the Committee has sought to capitalize upon thetradition, experience, and investment in quality higher education already made in Lake Countyand Illinois. The model we propose has taken into consideration the type of institutions offeringprograms in the area, the intensity and diversity of educational demand, and the tremendous rateof population and economic growth. There is no comprehensive university located in the county.Moreover, no single institution has placed priority on providing off-campus programs to theregion. However, the number and diversity of institutions offering and, interested in offering,programs in Lake County constitute a strong asset and one that the University Center will buildupon, both through traditional and technological means.
Our approach is indebted to initiatives undertaken in other areas of the state that haveshown how new structures can meet emerging educational needs and provide high qualityprograms for place-bound students. In recent decades, there have been several instances wherethe Board of Higher Education has sought to leverage existing resources by creating specialprograms and centers to meet emerging needs. The Board's actions have been based on the
"21

premise that Illinois already enjoys adequate enrollment capacity, and there is no need to buildanother public university. The centers and programs established include the Quad CitiesGraduate Center, the multi-university centers in Du Page and Lake Counties administered by theUniversity of Illinois, and the Bradley University/Illinois Central College degree completionprogram in Peoria. Also, the Board has created regional consortia throughout the state tocoordinate and expand the delivery of off-campus programs primarily through distance education.
These new centers and programs have proven quite successful. For instance, this pastyear, the Multi-University Center in Du Page County enrolled over seventeen hundred students in98 degree-oriented credit offerings. During this same period, 3,800 students took courses of theQuad Cities Graduate Study Center. The growth of the Lake County Multi-University Center hasbeen particularly dramatic. In FY 1998, the second year of its existence, the Center offered 66courses in 16 disciplines to about 800 students. About half of the Lake County courses were
delivered through interactive video, theinternet, or independent study. Becauseof the difficulty of finding additionaleducational space in Lake County, thepotential for future enrollment growth,and the need to provide greatercoordination and support to educationalprogramming, the committee proposestransforming the Lake County Multi-University Center into the UniversityCenter of Lake County.
The solution we propose is not a "onesize fits all" model but one that has beendeveloped and calibrated according tothe* resources, characteristics, and needsof Lake Countj, to serve working adultsand place-bound residents.
Creating an Environment that Promotes and Supports Student Learning
The sole purpose of the University Center will be to create an environment that stimulatesand supports student learning. Its mission will focus on instruction. It will not sponsor researchor offer intercollegiate sports. The University Center will offer coursework and programs at thebaccalaureate completion and master's level in order not to duplicate the efforts of the College ofLake County which provides lower-division, undergraduate instruction. The University Centerwill work closely with the College, sharing resources and support services, when possible, as wellas articulating programs between the two institutions. Through such cooperation, place-boundstudents completing the first two years of instruction at the College can move easily into abaccalaureate degree program at the University Center.
The University Center will have a central facility at which students can take courses, usecomputers and library materials such as electronic databases and on-line journals, and consultstaff who can assist them in essential ways such as registering for classes and planning programs.Courses also will be available at sites away from the main facility, and some courses will bedelivered in multiple formats so that a student whose schedule does not permit attendance at agiven location or time can receive the course via two-way interactive video or the internet.Ultimately, all courses will likely be available in more than one format.
The University Center will only offer programs of high quality. Courses will be taughtby regular university faculty and academic resources will be available that support high academicachievement. Teaching styles and program components will be suited to the needs of students,particularly the older working adult. Courses will be taught at times and locations that areconvenient, such as weekday evenings. Distance education courses taught at the University
1 4
22

Center will follow "best practice standards" developed for use with such technology. Faculty willhave proficiency in this technology, and the Center will have funds to help faculty develop and
upgrade their skills in the use of technology.
The University Center will place priority on designing mechanisms to measure and
demonstrate that each student enrolled in a University program is learning the theories, facts, and
skills required for success in today's world. At entry, the University Center will assess studentlearning proficiency to ensure that each student has skills appropriate to coursework at the upper-
division level. Students who have general education deficiencies will need to take appropriate
remedial work. In addition, one of the goals of the Center is for all programs to eventuallyadminister diagnostic tests that will aid students in the selection of courses in their major. As aresult of such evaluation processes, both students and employers will know that graduates of theCenter have demonstrated the skills and proficiencies needed for successful employment.
Students thinking of enrolling in University Center programs will have access toinformation that shows the kinds of occupational and educational experiences and success thatprevious program graduates have enjoyed. At least once a year, students will be asked to evaluatethe instruction and services that they are receiving. Individual universities will use thisinformation for program improvement and will be accountable for their performance to theUniversity Center Board. If a program can not demonstrate acceptable levels of learning andstudent success, it will be discontinued.
The University Center will be a learning laboratory that seeks new and effective ways ofteaching diverse and older students. To fulfill this mission, the University Center will makefunds available, on a competitive basis, to support the creation of new types of programs. In
particular, these funds will assist program development in fields that are not traditionally offeredoff-campus and in innovative formats to teach working adults or underserved constituencies.
Building Upon and Leveraging Existing Resources
The University Center will build upon and leverage existing resources. This approachwill achieve cost efficiencies and permit a rapid response to meet identified needs. By relyingupon established institutions, theUniversity Center can makeavailable, expeditiously, qualityprograms in a variety of fields.These programs will draw uponthe strengths of similar programsbeing offered on the campus ofparticipating institutions.
The University Centerwill offer programs in fields inwhich there exists demonstrableneed. University Center staff,working in close cooperationwith an advisory committee, willconduct periodic needs analysis to identify the programs in which residents, employers, andemployees are most interested. It is anticipated that some programs in popular fields such asbusiness and education will be offered continuously. In other cases, the Center will offer
The state-of-the art facilities and equipmentof the University Center, as well as theacademic and student support servicesprovided, will enable participatinginstitutions to offer high quality programsthrough face-to-face instruction anddistance learning.
'523

programs as the need arises. In those cases where demand is low, programs may still be offeredvia distance education, if sufficient demand for the program exists across the state.
The University Center will encourage and facilitate the efforts of institutions to offerprograms off-campus. By having access to state-of-the-art facilities, equipment, and academicand student support services, participating institutions can provide the same kind of instructionthey now offer on campus. Telecommunications instruction will be an essential component of theUniversity Center. Through interactive video and internet instruction, students will have directaccess to on-campus programs. Traditionally, a few disciplines such as business and educationhave offered most off-campus programs. The participation of faculty from other fields has beenlow, in part, because of traditions of practice and on-campus student demand for courses.Technology now provides the opportunity to eliminate barriers of distance and to satisfy both on-campus and off-campus needs.
Using the University Center for distance education has great promise since Illinoisinstitutions of higher education, as well as out-of-state providers, are actively expanding theirdistance education capabilities. In the past four years, the state of Illinois has invested $60million to establish a two-way video system. There are now 400 "smart classrooms" throughoutthe state that can broadcast and receive coursework over this network. The Board has fundedHECA projects to train faculty in the use of this technology and the number and types of coursesoffered has grown exponentially. Also, increasing numbers of internet courses are nowaccessible and institutional plans for expansion are moving forward. For example, the Universityof Illinois, in cooperation with other public universities, is in the process of creating a web sitethat lists internet courses offered by Illinois institutions. The university is also developing a pilotproject whereby computer and other support services will be available at satellite centers forstudents interested in taking internet courses.
The University Center will be highly adaptable and expandable. The types and numberof programs offered will be based on ongoing analyses of student needs. Therefore, whenadditional demand for a program develops, the Center will seek institutions interested in offeringprograms to meet the identified need. At the same time, the Center's will modify and expand itssupport services consistent with requirements arising from changes in program scope andintensity.
Establishing New Forms of Partnership
A distinguishing feature of the University Center will be the kinds of relationships andpartnerships that are formed. These partnerships will not only be a byproduct of the Center'sactivities, finding expression even in the learning that occurs, but will also characterize thestructure and operation of the Center itself, for instance, in its funding and governancemechanisms.
The University Center will be rooted in the relationships established among theparticipating institutions and between the participating institutions and staff. Universities willarticulate programs with the College of Lake County, and will develop programs in which somecourses can transfer among participating universities, thereby increasing the number of core andsupporting courses available to students within a program. Coordination between the staff ofparticipating institutions and University Center staff will.also enable students to register, applyfor financial aid, and receive academic advising at University Center facilities. Academicofficers will also work together to develop, implement, and review common procedures forassessing student and program progress and performance.
1624

Because of the type of student thatwill enroll in University Center programs,that is, the place-bound, working adult, thebenefits derived from the Center will accruemore to local residents than is the case withtraditional universities which have statewideand regional missions. For this reason, thefunding and governance mechanisms of theUniversity Center will provide forsubstantial local involvement. The countyand the state of Illinois will jointly fund thecapital costs of the University Center. Six of the eleven members of the Board of Directors will
be county residents. The principal charge of the Board will be to ensure that the programs taught
at the Center are of high quality and relevant to the county's educational needs and that the
facilities and services at the Center effectively support all programs.
Local residents will make up morethan one-half of the UniversityCenter Board and will provideongoing advice about program andservice needs.
The University Center will also have advisory committees whose structure and processes
will ensure that local needs and opinions are considered in planning instructional programs and
services. A standing committee composed of local residents, professionals, and employers will
advise the Board about the area's program needs. The Center will also routinely consult localemployers about the strengths and weaknesses of its graduates. There will be opportunities fordialogue between employers and faculty about the short-term and long-term knowledge and skills
required in the workplace, and how new programs might be best developed to meet employer
needs. Because of the lack of educational space in Lake County and the likelihood that some
classrooms may not be in use during the day time, the University Center, when possible, will rent
its facilities to corporate users for training purposes.
Main Features
The major features of the proposed University Center are pretented below.
MissionThe University Center will focus on instruction at the upper-division and mastef's
level. Students must apply and meet standards for admission of the participating colleges and
universities. Baccalaureate degree completion programs will be open to all students who
have completed the program of courses described in the Illinois Articulation Initiative, or its
equivalent.
GovernanceA Board composed of six local residents, including one member of the College
of Lake County Board of Trustees, and five representatives of the participating institutions
will govern the University Center. The role of the Board will be to ensure that programs and
related academic and student support services meet the educational needs of local residents.
The Center will establish advisory committees to conduct needs analysis; coordinateacademic programs and support services; and develop, review, and refine mechanisms for
measuring student and program progress and achievement. Standards for delivering distance
education will also be developed.
Facilities and EquipmentThe University Center will have a main facility located centrally
in the county. This facility will contain academic classrooms, offices, and space for computer
and library services. The University Center also will deliver instruction at other sites
throughout the county via face-to-face instruction and distance learning technology.
FundingThe State of Illinois and Lake County will fund the capital costs of the UniversityCenter. The State of Illinois and private users will fund operational costs.
ProgramsThe participating institutions of the University will offer programs in accordancewith program needs identified by the University Center Board. The University Center willprovide services necessary to help schedule, market, and deliver the programs. Funding willbe provided for the development of programs in fields that are historically delivered off-campus and/or that provide innovative formats that address the educational needs of workingadults and underserved constituencies.
FacultyCourses will be taught by regular members of the faculty of participatinginstitutions.
StaffThe University Center will employ a director and personnel to provide academic andstudent services.
TechnologyThe University Center will house state-of-the art computers and distanceeducation technology that offers internet and two-way video programs. Eventually, mostcourses at the Center will be available asynchronously on students' home computers. TheCenter will provide funds to assist faculty in developing and improving their skills in the useof technology.
Tuition and FeesTuition charges will be those of the participating institutions. Eachinstitution shall assess fees according to the non-instructional costs associated with itsUniversity Center programs. University Center fees may be lower than on-campus feecharges.
Accountability/AssessmentAll baccalaureate degree completion programs will assessstudent learning upon entry into the program. Students will take a nationally standardizedtest to measure their skills and knowledge. Should students be deficient in any of the subjectstested, they will be able to remedy the deficiency through a variety of means, such as takingcourses at the participating institutions, the College of Lake County, via the internet, or otherinstitutions. The Center and the participating colleges and universities will collect anddisseminate information so as to be able to inform potential employers of what the graduatesknow and can do. Therefore, some form of assessment will be needed for each program ofstudy.
26
18

CHAPTER IV
Request For Participants
A Process for Providing Programsfor the University Center of Lake County
The University Center will require the active involvement of participating institutions.
Members must endorse and advance the basic principles and goals of the University Center.
They also must be committed to working with local constituencies, other member institutions,
and University Center staff in planing and coordinating their programs and the operations and
activities of the Center.
The Committee recommends that the Board of Higher Education undertake a Request for
Participants (RFP) process that seeks institutional membership in the University Center. The
Committee will use the information submitted in responses to the RFP in subsequent capital,
program, and budget planning. Responses will provide critical information about the type of
instructional space, equipment, and staffneeded for the University Center. Also, responses may
help identify areas where further program development support may be needed.
The Committee recommends building upon the accomplishments of the existing Multi-
University Center in establishing the University Center. Accordingly, it recommends first
circulating the Request for Participants among the Multi-University's twelve institutional
members. If some of these institutions are not interested in becoming members of the University
Center of Lake County, or if collectively they are not able to provide programs that meet the
county's educational needs, the RFP should be more widely distributed, until interested and
qualified providers are found.
Types of Programs and Coursework Requested
Level and Focus. In its initial stages of development, the University Center of Lake
County should focus on the development and delivery of baccalaureate degree completion, post-
baccalaureate certificate, and master's programs, rather than single courses. However, in some
cases, particularly at the master's level, participating institutions may wish to consider offering
clusters of courses or certificate programs that provide skills and training to meet employer and
employee needs. Higher priority areas are identified in the needs analysis section.
Format. Programs and courses should be offered in formats and at times and locations
convenient to place-bound students and working adults, as described above in the needs analysis.
Appropriate use of technology and distance education should be made. As soon as possible,
institutions should offer programs using both face-to-face instruction and distance learning
technology so that students restricted by barriers of time or location can still receive instruction
via the internet or two-way video technology.
Fields of Study. Programs are sought in the following fields and levels of study:
High Demand. Baccalaureate Degree Completionbusiness and management, finance,
marketing, public relations, science management, engineering, information technology
(systems analysis), secondary education. Master's Level--accounting and business
adm inistration.

Moderate Demand. Baccalaureate Degree Completionmechanical, electrical, and computer
engineering, labor relations, personnel and training management, pre-K and kindergarten
education, and manufacturing engineering management. Master's Level--informationsystems, management analysis, educational administration, and advanced practice nursing.
Low Demand. Baccalaureate Degree CompletionChemists. Master's Levelspeechpathology, social work, and psychology
Expectations for Participating Institutions
Participating institutions will be expected to be active members of the University Center
committed to high academic achievement and working cooperatively. Expectations for
membership include:
Serve on the University Board and/or advisory committees.
Use regular institutional faculty to teach all courses.
Make available all essential academic and student support services (such as for admissions,registration, advising, and financial aid) at the facilities of the University Center throughpersonal and/or interactive means and coordinate these services with University Center staff.
Make available to Center students easy access to the institution's library via computertechnology and other means. Assist the Center in having available on site essential books andother instructional materials.
Work with the College of Lake County and other participating institutions to articulatebaccalaureate degree completion programs and, when possible, articulate courses acrossprograms.
Encourage faculty to take advantage of the training opportunities in the use of distancelearning technologies made available through the Center.
Agree to "teach out" all programs initiated through the University Center or arrange foranother institution to offer degree completion opportunities at a similar cost for students inthe program.
Evaluate and make available the results of student academic performance and progress in theprogram, and use this information for program review and improvement. Ask students, atleast once each year, to evaluate the instruction and services they are receiving. Collect andmake available information on the outcomes of program graduates such as the fields andtypes of jobs in which graduates are employed, the advanced educational opportunities theypursue, and the extent to which their skills and knowledge are consistent with the needs ofthose who employ them.
Develop for each program of study assessment tools that will inform students, employers, andthe Center's Board about what graduates know and can do.
Work with other members to develop and follow "standards of good practice" for distanceeducation.
2820

Seek and exchange information with participating members and constituencies about the
"best practices" for stimulating and supporting academic achievement among working adults
and other place-bound student populations.
Information Requested in Response to the RFP
Institutions belonging to the Lake County Multi-University Center that are interested in
becoming members of the University Center of Lake County should submit a statement of interest
to the Illinois Board of Higher Education by October 15, 1998. The statement should indicate
that the institution understands and will work to achieve the mission and goals of the University
Center. It should also provide information about the programs that the institution wishes to offer
at the Center.
Institutions should submit the following information about each program they intend to
offer at the University Center: degree title; educational goals; anticipated date of implementation;
expected enrollment at one- and five-year intervals; and proposed schedule of courses and
anticipated course enrollments. In order to facilitate the planning of the University Center's
capital and operating budget, the statement should also include information about the type of
classroom and office space, computer and electronic library equipment, and other program capital
and operating requirements. The Board of Higher Education recognizes that in many instances
institutions will be submitting statement(s) of interest for programs that they do not currently
have approval to offer either off-campus or in the College of Lake County district. The Board
will expedite the review of all programs submitted without such current authority.
2 92 1

CHAPTER V
Next Steps
Developing Implementation Plans
This paper is the first of two reports that the Committee will submit on this pilot project.
Once the Board authorizes the following resolution, the Committee will be able to proceed and
present its recommendations to the residents of Lake County and, in particular, the College ofLake County and the Lake County Board. The Board will receive a second report in December
1998 that will contain recommendations for implementing the University Center of Lake County,
and at a later date, the Committee will present ideas and proposals for proceeding with the next,
statewide stage of the master plan. The Committee's recommendations will address issues
concerning authorization, governance, capital requirements, staffing, operations costs andbudgetary needs, and program scope of the University Center. It will also present ideas forfacilitating the transfer from the current Lake County Multi-University Center to the newUniversity Center and for bringing together various constituencies to discuss and consider issues
that will arise as the new University Center is created.
3023

Resolution for ConsiderationBy the Board of Higher Education:
The Board of Higher Education accepts the Committee's report and endorses theproposal to create a University Center of Lake County as proposed in the Committee's report.The Board authorizes the Committee to meet with Lake County residents, the College of Lake
County, and the Lake County Board to present its recommendations, and to seek responses to the
Request for Participants presented in the report. The Board also requests the Committee to
present at the December 1998 meeting recommendations for implementing the University Center.
The Committee's December report should include information and recommendations concerningthe authorization, governance, capital requirements, staffing, operational costs, budgetary needs,
and program scope of the University Center. The report should also present ideas for facilitating
the transfer from the current Lake County Multi-University Center to the new University Center
and proposals for how to begin the process ofbringing together various constituencies to discussand consider issues that will arise as the new University Center is created.
3125

APPENDIX I
TABLES
32

TA
BL
E 1
EN
RO
LL
ME
NT
TR
EN
DS
IN H
IGH
ER
ED
UC
AT
ION
IN
STIT
UT
ION
S IN
LA
KE
CO
UN
TY
(Fal
l 199
5, 1
996,
and
199
7)
Inst
itutio
ns
Col
lege
of
Lak
e C
ount
y T
otal
s
Pre-
Col
legi
ate
Con
tinui
ng E
duca
tion
Und
ergr
adua
te
Inde
pend
ent C
olle
ges
and
Uni
vers
ities
Bar
at C
olle
geFi
nch
Uni
vers
ity o
f H
ealth
Sci
ence
s/C
hica
goM
ed. S
ch
Lak
e Fo
rest
Col
lege
Lak
e Fo
rest
Gra
duat
e Sc
hool
of
Man
agem
ent
Shim
er C
olle
geT
rini
ty I
nter
natio
nal U
nive
rsity
Uni
vers
ity o
f St
. Mar
yof
the
Lak
e
St. S
ava
Serb
ian
Ort
hodo
x Sc
hool
of T
heol
ogy
Tot
al P
riva
tes:
Tot
al A
ll In
stitu
tions
:
Und
ergr
adua
teG
radu
ate
Tot
al E
nrol
lmen
ts
1995
1996
1997
1995
1996
1997
1995
1996
1997
13,5
1013
,453
13,5
77
595
610
585
5,50
95,
366
5,43
6
7,40
67,
477
7,55
6
714
739
730
1971
473
974
9
100
101
961,
271
1,33
91,
332
1,37
11,
440
1,42
8
1,01
11,
093
1,17
112
1319
1,02
31,
106
1,19
0
701
703
730
701
703
730
117
123
112
117
123
112
788
787
844
1,60
41,
711
1,72
72,
392
2,49
82,
571
2722
181
209
213
208
231
213
1717
2217
1722
2,77
42,
882
2,97
53,
769
3,97
54,
040
6,54
36,
857
7,01
5
20,0
5320
,310
20,5
92
Sour
ces:
Illi
nois
Boa
rd o
f H
ighe
rEdu
catio
n In
vent
ory
and
Fall
Enr
ollm
ent S
urve
ys
3334

TA
BL
E 2
INST
ITU
TIO
NS
APP
RO
VE
D T
O O
FFE
R O
FF-C
AM
PUS
PRO
GR
AM
S IN
LA
KE
CO
UN
TY
Inst
itutio
ns
Publ
ic U
nive
rsiti
esN
orth
east
ern
Illin
ois
Uni
vers
ityN
orth
ern
Illin
ois
Uni
vers
itySo
uthe
rn I
llino
is U
nive
rsity
at C
arbo
ndal
eU
nive
rsity
of
Illin
ois
at C
hica
go
Inde
pend
ent C
olle
ges
and
Uni
vers
ities
Aur
ora
Uni
vers
ityC
olle
ge o
f St
. Fra
ncis
Con
cord
ia U
nive
rsity
De
Paul
Uni
vers
ity
Dom
inic
an U
nive
rsity
Illin
ois
Inst
itute
of
Tec
hnol
ogy
Lew
is U
nive
rsity
Loy
ola
Uni
vers
ity o
f C
hica
goN
atio
nal-
Lou
is U
nive
rsity
Nor
th P
ark
Col
lege
Roo
seve
lt U
nive
rsity
St. X
avie
r U
nive
rsity
Kel
ler
Gra
duat
e Sc
hool
of
Mgm
t.C
olum
bia
Col
lege
of
Mis
sour
i
Web
ster
Uni
vers
ity
Tot
al A
ppro
ved
Off
-Cam
pus
Prog
ram
s
Num
ber
of P
rogr
ams
Off
ered
in A
reas
of:
Edu
catio
nU
nder
.G
rad.
Bus
/Mgt
.U
nder
.G
rad.
Soci
al S
cien
ce
Und
er.
Gra
d.
Lib
eral
Und
er.
Art
sG
rad.
Hea
Und
er.
th Gra
d.E
ngin
eeri
ngU
nder
.G
rad.
Tec
h/C
omSc
iU
nder
.G
rad.
Tot
al
11
99
11
24
3
11
11
51
2
11
11
17
12
11
11
22
11
11
2
11
13
11
21
16
11
13
55
21
21
6
51
17
122
514
33
50
54
03
38
76
Sour
ce: I
llino
is B
oard
of
Hig
her
Edu
catio
n In
vent
ory,
Jul
y 19
98
36
35

TA
BL
E 3
POPU
LA
TIO
N G
RO
WT
H 1
980
TO
200
0 IN
TH
E 2
0 L
AR
GE
STC
OU
NT
IES
IN I
LL
INO
IS
Cou
nty
Size
Ran
king
in 1
990
Popu
latio
n19
8019
90
Pers
ons
Gai
ned/
Los
t19
80-1
990
Perc
ent
Cha
nge
1980
-199
0
Pers
ons
Proj
ectio
ns G
aine
d/L
ost
Yea
r 20
0019
90-2
000
Perc
ent
Cha
nge
1990
-200
0
Coo
k1
5,25
3,65
55,
105,
067
-148
,588
-35,
200,
563
95,4
962
Du
Page
265
8,83
578
1,66
612
2,83
119
884,
949
103,
283
13
Lak
e3
440,
372
516,
418
76,0
4617
607,
860
91,4
4218
Will
432
4,46
035
7,31
332
,853
1046
8,93
011
1,61
731
Kan
e5
278,
405
317,
471
39,0
6614
386,
997
69,5
2622
St. C
lair
626
7,53
126
2,85
2-4
,679
-228
0,09
817
,246
7
Win
neba
go7
250,
884
252,
913
2,02
91
270,
013
17,1
007
Mad
ison
824
7,69
124
9,23
81,
547
126
0,47
411
,236
5
McH
enry
914
7,89
718
3,24
135
,344
2424
2,78
459
,543
32
Peor
ia10
200,
466
182,
827
-17,
639
-918
6,43
73,
610
2
Sang
amon
1117
6,08
917
8,38
62,
297
119
2,17
713
,791
8
Cha
mpa
ign
1216
8,39
217
3,02
54,
633
317
8,59
15,
566
3
Roc
k Is
land
1316
5,96
814
8,72
3-1
7,24
5-1
015
0,12
31,
400
1
McL
ean
1411
9,14
912
9,18
010
,031
814
4,85
715
,677
12
Taz
ewel
l15
132,
078
123,
692
-8,3
86-6
129,
786
6,09
45
Mac
on16
131,
375
117,
206
-14,
169
-11
118,
091
885
1
LaS
alle
1711
2,03
310
6,91
3-5
,120
-511
0,33
43,
421
3
Kan
kake
e18
102,
926
96,2
55-6
,671
-610
7,06
510
,810
11
Ver
mill
ion
1995
,222
88,2
57-6
,965
-784
,850
-3,4
07-4
De
Kal
b20
74,6
2477
,932
3,30
84
86,4
278,
495
11
Sour
ces:
Illi
nois
Pop
ulat
ion
Tre
nds
1980
to 2
025,
Jun
e 19
87 e
ditio
n, S
tate
of I
llino
is, I
llino
is B
urea
u of
the
Bud
get.
Illin
ois
Popu
latio
n T
rend
s 19
90 to
202
0, 1
997
editi
on, S
tate
of
Illin
ois,
Illi
nois
Bur
eau
of th
e B
udge
t.
3 8

TA
BL
E 4
PRO
JEC
TIO
NS
FOR
PO
PUL
AT
ION
, BY
RA
CE
AN
D E
TH
NIC
ITY
, IN
IL
LIN
OIS
' 20
LA
RG
EST
CO
UN
TIE
S B
Y T
HE
YE
AR
200
0
Num
ber
All
Perc
ent
Perc
ent
Cou
nty
Pers
ons
2000
nit&
Non
-Whi
teN
on-W
hite
Non
-His
pani
cH
ispa
nic
His
pani
c
Coo
k5,
200,
563
3,54
6,09
41,
654,
469
31.8
%4,
269,
885
930,
678
17.9
%
Du
Page
884,
949
805,
724
79,2
259.
0%83
3,66
151
,288
5.8%
Lak
e60
7,86
054
4,52
263
,338
10.4
%54
7,95
759
,903
9.9%
Will
468,
930
411,
530
57,4
0012
.2%
436,
644
32,2
866.
9%
Kan
e38
6,99
735
4,87
232
,125
8.3%
320,
827
66,1
7017
.1%
St. C
lair
280,
098
202,
014
78,0
8427
.9%
n/a
n/a
n/a
Win
neba
go27
0,01
323
9,99
230
,021
11.1
%25
8,93
211
,081
4.1%
Mad
ison
260,
474
240,
362
20,1
127.
7%n/
an/
an/
aM
cHen
ry24
2,78
4n/
an/
an/
a23
2,47
610
,308
4.2%
Peor
ia18
6,43
715
4,85
631
,581
16.9
%n/
an/
an/
aSa
ngam
on19
2,17
717
3,03
019
,147
10.0
%n/
an/
an/
aC
ham
paig
n17
8,59
115
3,09
725
,494
14.3
%n/
an/
an/
aR
ock
Isla
nd15
0,12
313
6,74
913
,374
8.9%
139,
530
10,5
937.
1%
McL
ean
144,
857
134,
793
10,0
646.
9%n/
an/
an/
a
Taz
ewel
l12
9,78
6n/
an/
an/
an/
an/
an/
a
Mac
on11
8,09
110
1,36
116
,730
14.2
%n/
an/
an/
aL
aSal
le11
0,33
4n/
an/
an/
an/
an/
an/
aK
anka
kee
107,
065
90,0
5617
,009
15.9
%n/
an/
an/
aV
erm
illio
n85
,840
77,5
458,
295
9.7%
n/a
n/a
n/a
De
Kal
b86
,427
n/ a
n/a
n/a
n/a
n/a
n/a
All
Illin
ois
12,1
34,3
449,
880,
009
2,25
4,33
518
.6%
10,8
87,1
661,
247,
178
10.3
%
Not
e: P
opul
atio
n gr
owth
incl
udes
the
effe
ct o
f bi
rths
+ in
-mig
ratio
n m
inus
deat
hs +
out
-mig
ratio
n.
Sour
ce: I
lllin
ois
Popu
latio
n T
rend
s 19
90 to
202
0, 1
997
editi
on, B
urea
u of
the
Bud
get,
Stat
eof
Illi
nois
.
40

TA
BL
E 5
POPU
LA
TIO
N A
ND
EC
ON
OM
IC C
HA
RA
CT
ER
IST
ICS
OF
MA
JOR
IL
LIN
OIS
CO
UN
TIE
SR
AN
KIN
G A
MO
NG
AL
L I
LL
INO
IS C
OU
NT
IES
Coo
kD
u Pa
geK
ane
Lak
eM
cHen
ry M
adis
onPe
oria
St. C
lair
Sang
amon
Will
Win
neba
go
Popu
latio
n Fa
ctor
s:R
anki
ngs
Popu
latio
n1s
t2n
d5t
h3r
d9t
h8t
h11
th7t
h10
th4t
h6t
h
Eco
nom
ic F
acto
rs:R
anki
ngs
Em
ploy
men
t1s
t2n
d5t
h3r
d7t
h8t
h1
lth9t
h10
th4t
h6t
h
Une
mpl
oyed
:Tot
al N
umbe
r1s
t2n
d5t
h3r
d9t
h6t
h8t
h7t
h10
th4t
h8t
h
Une
mpl
oym
ent P
erce
nt:L
owes
t19
9647
th4t
h30
th8t
h7t
h48
th70
th56
th17
th35
th28
th
1997
45th
4th
25th
10th
9th
40th
41st
65th
26th
30th
37th
Per
Cap
ita P
erso
nal I
ncom
e3r
d2n
d5t
h1s
t4t
h23
rd10
th45
th14
thllt
h13
th
Tot
al P
erso
nal I
ncom
e1s
t2n
d5t
h3r
d6t
h8t
h11
th9t
h10
th4t
h7t
h
Ear
ning
s of
Per
sons
Em
ploy
ed in
Cou
nty
1st
2nd
4th
3rd
14th
9th
8th
10th
7th
6th
5th
Num
ber
of B
usin
esse
s1s
t2n
d4t
h3r
d7t
h8t
hllt
h9t
h10
th5t
h6t
h
Perc
ent C
hang
e in
No.
Bus
ines
ses
1980
-90
10th
2nd
5th
1st
3rd
7th
llth
9th
8th
4th
6th
Ret
ail S
ales
1st
2nd
4th
3rd
1 lth
9th
10th
8th
7th
5th
6th
Not
e: 1
996
Dat
a, e
xcep
t whe
re n
oted
.
Sour
ces:
Illi
nois
Dep
artm
ent o
f Se
curi
ty L
AU
S: A
vera
ge A
nnua
l Em
ploy
men
t Dat
a fo
r C
ount
ies;
U.S
. Dep
artm
ent o
f C
omm
erce
'sB
urea
u of
Reg
iona
l Eco
nom
ic
Ana
lysi
s B
EA
RFA
CT
S; U
.S. C
ensu
s, C
ount
y B
usin
ess
Patte
rns;
and
Illi
nois
Dep
artm
ent
of C
omm
erce
and
Com
mun
ity A
ffai
rs, S
tate
and
Cou
nty
Ret
ail S
ales
File
s
42
41

TA
BL
E
ED
UC
AT
ION
AL
AT
TA
INM
EN
T O
F R
ESI
DE
NT
S IN
TH
E 2
0L
AR
GE
ST C
OU
NT
IES
IN I
LL
INO
IS
Cou
nty
Les
s th
an 9
thG
rade
9th
- 12
thgr
ade,
no
dipl
oma
Hig
h Sc
hool
Gra
duat
e,in
clud
ing
GE
DSo
me
Col
lege
,N
o D
egre
ee
Ass
ocia
te
Deg
ree
Bac
helo
r's
Deg
ree
Gra
duat
e or
Prof
essi
onal
Deg
ree
Coo
k11
.515
.126
.319
.15.
214
.58.
3
Du
Page
4.2
7.2
23.3
22.5
6.8
24.0
12.0
Lak
e5.
99.
425
.121
.85.
820
.511
.5
Will
6.8
12.8
33.2
22.5
6.7
12.1
5.9
Kan
e9.
312
.929
.320
.86.
214
.47.
0
St. C
lair
11.6
15.8
30.6
20.8
6.5
9.3
5.4
Win
neba
go8.
015
.734
.918
.86.
011
.55.
2
Mad
ison
11.6
12.6
36.0
20.1
5.3
9.5
4.9
McH
enry
5.5
10.0
32.5
23.9
7.1
14.6
6.4
Peor
ia9.
013
.031
.420
.76.
412
.96.
6
Sang
amon
6.6
11.6
33.2
19.6
6.6
14.2
8.2
Cha
mpa
ign
4.6
7.9
26.3
19.9
7.2
16.3
17.8
Roc
k Is
land
7.7
14.9
35.3
20.7
6.3
10.5
4.5
McL
ean
6.5
8.8
32.9
17.9
4.8
20.0
9.0
Taz
ewel
l8.
812
.637
.021
.66.
59.
63.
9
Mac
on8.
215
.538
.118
.35.
19.
85.
0
LaS
alle
12.1
14.8
39.3
16.9
6.4
7.1
3.4
Kan
kake
e11
.515
.536
.119
.35.
78.
04.
0
Ver
mill
ion
11.9
15.4
38.8
16.9
6.0
7.0
4.1
De
Kal
b6.
29.
930
.820
.36.
714
.911
.2
All
Lak
e5.
99.
425
.121
.85.
820
.511
.5
All
Illin
ois
10.3
13.5
30.0
19.4
5.8
13.6
7.5
Sour
ce: 1
990
U.S
. Cen
sus
43

TA
BL
E 7
CO
MPA
RA
TIV
E A
NA
LY
SIS
OF
EM
PLO
YM
EN
T
TH
E E
DU
CA
TIO
NA
L R
EQ
UIR
EM
EN
TS
OFJ
OB
S IN
MA
JOR
IL
LIN
OIS
CO
UN
TIE
S
Occ
upat
ions
Req
uirin
g A
:T
otal
Em
ploy
men
tA
ll O
ccup
atio
ns
Em
ploy
men
tR
equi
ring
A P
osts
econ
dary
Edu
catio
n or
Mor
eP
osts
econ
dary
Bac
helo
r'sF
irst
All
Oth
er
Voc
. Edu
catio
n A
ssoc
iate
Bac
helo
r's P
lus
Exp
. Mas
ter's
Doc
tora
te P
rofe
ssio
nal T
rain
ing
Illin
ois
Em
ploy
men
t by
Edu
catio
n Le
vel
593,
045
347,
690
510,
927
467,
140
169,
458
16,5
9987
,880
3,56
2,28
35,
755,
022
2,19
2,73
9
Per
cent
of T
otal
10.3
%6.
0%8.
9%8.
1%2.
9%0.
3%1.
5%61
.90%
100.
0%18
.1%
Lac
alin
tirah
xym
pula
tioni
ank
Coo
k
Em
ploy
men
t by
Edu
catio
n Le
vel
281,
581
184,
260
250,
736
230,
773
82,3
846,
314
45,5
511,
649,
610
2,73
1,20
91,
081,
599
Per
cent
of T
otal
10.3
%6.
7%9.
2%8.
4%3.
0%0.
2%1.
7%60
.40%
100.
0%al
%D
u Pa
geE
mpl
oym
ent b
y E
duca
tion
Leve
l52
,722
26,1
0442
,012
45,8
0312
,806
969
5,98
130
8,05
549
4,45
218
6,39
7
Per
cent
of T
otal
10.7
%5.
3%8.
5%9.
3%2.
6%0.
2%1.
2%62
.30%
100.
0%
Lak
eE
mpl
oym
ent b
y E
duca
tion
Leve
l25
,945
15,6
3226
,085
21,6
767,
078
1,72
93,
438
153,
884
255,
467
101,
583
Per
cent
of T
otal
10.2
%6.
1%10
.2%
8.5%
2.8%
0.7%
1.3%
60.2
4%10
0.0%
Will Em
ploy
men
t by
Edu
catio
n Le
vel
11,6
606,
217
10,0
588,
719
3,31
931
11,
641
70,3
5811
2283
41,9
25
Per
cent
of T
otal
10.4
%5.
5%9.
0%7.
8%3.
0%0.
3%1.
5%62
.66%
100.
0%iL
rci
Kan
eE
mpl
oym
ent b
y E
duca
tion
Leve
l15
,801
9,08
512
,654
12,4
813,
680
310
2,18
596
,449
152.
645
56,1
96
Per
cent
of T
otal
10.4
%6.
0%8.
3%8.
2%2.
4%0.
2%1.
4%63
.19%
100.
0%
Win
neba
goE
mpl
oym
ent b
y E
duca
tion
Leve
l15
,666
7,80
09,
397
11,5
922,
671
385
1,68
485
,593
DA
M49
,195
Per
cent
of T
otal
11.6
%5.
8%7.
0%8.
6%2.
0%0.
3%1.
2%63
.50%
100.
0%
St.
Cla
irE
mpl
oym
ent b
y E
duca
tion
Leve
l9,
846
6,61
15,
541
6,45
12,
926
248
1,90
857
,356
90.8
8733
,531
Per
cent
of T
otal
10.8
%7.
3%6.
1%7.
1%3.
2%0.
3%.
2.1%
63.1
1%10
0.0%
Mad
ison
Em
ploy
men
t by
Edu
catio
n Le
vel
10,8
485,
215
8,13
97,
297
2,80
722
51,
560
66,0
5110
2 14
236
,091
Per
cent
of T
otal
10.6
%5.
1%8.
0%7.
1%2.
7%0.
2%1.
5%64
.67%
100.
0%
McH
enry
..
Em
ploy
men
t by
Edu
catio
n Le
vel
8,38
43,
478
5,58
05,
967
1,75
715
21,
201
50,0
4176
,560
26,5
19
Per
cent
of T
otal
11.0
%4.
5%7.
3%7.
8%2.
3%0.
2%1.
6%65
.36%
100.
0%34
.6%
San
gam
onE
mpl
oym
ent b
y E
duca
tion
Leve
l12
,584
7,96
412
,720
10,2
61'
3,28
124
91,
758
61,9
0211
0,71
948
,817
Per
cent
of T
otal
11.4
%7.
2%11
.5%
9.3%
3.0%
0.2%
1.6%
55.9
1%10
0.0%
Peo
ria
Em
ploy
men
t by
Edu
catio
n Le
vel
10,5
317,
597
8,50
67,
872
2,24
014
81,
501
60,5
0498
,899
38,3
95
Per
cent
of T
otal
10.6
%7.
7%8.
6%8.
0%2.
3%0.
1%1.
5%61
.18%
100.
0%-E
L.E
a
Roc
k Is
land
Em
ploy
men
t by
Edu
catio
n Le
vel
8,83
74,
783
7,55
96,
141
2,46
930
21,
316
51,2
9882
,705
31,4
07
Per
cent
of T
otal
10.7
%5.
8%9.
1%7.
4%3.
0%0.
4%1.
6%62
.03%
100.
0%
I-P
opul
atio
n R
ank
base
d on
U.S
. Dep
artm
ent o
f Com
mer
ce B
urea
u of
Reg
iona
l Eco
nom
ic A
naly
sis
BE
AM
:AC
TS
of 1
996
popu
latio
n
Sou
rce:
Illin
ois
Occ
upat
iona
l Inf
orm
atio
n C
oord
inat
ing
Com
mitt
ee, 1
992
Occ
upat
iona
l Em
ploy
men
t and
200
5 P
roje
ctio
ns b
yEdu
catio
n an
d/or
Tra
inin
g T
imes
4 5
4 '6

TABLE 8
EMPLOYMENT PROJECTIONS BY INDUSTRY:LAKE COUNTY AND STATE OF ILLINOIS
Employment Percent Percent of TotalBase Year
1222Projected
2005
Change1992-200
Lake County v.s
1992 2005
State1992 2115-
Statewide Total All Industries 5,393,160 6,397,705 18.63
Total All Industries Lake County 241,947 306,149 26.54 100.0% 100.0% 100.0% 100.0%
Agriculture, Forestry, and Fishing Total 3,755 5,168 37.63 1.6% 1.7% 2.9% 2.6%
Agriculture Services 3,105 4,510 45.25 1.3% 1.5% 0.5% C.6%
Agriculture Production 650 658 1.23 0.3% C.2% 2.4% 2.0%
Mining Total . 180 160 -11.12 0.1% 0.1% 0.3% 0.2%
Construction Total 10,951 14,958 36.59 4.5% 4.9% 3.6% 3.9%
General Building Contractors 2,951 4,134 40.08 1.2% 1.4% 0.8% 0.9%
General Contractors excluding Building 887 1,097 23.67 0.4% 0.4% 0.4% 0.4%
Special Trade Contractors 7,113 9,728 36.76 2.9% 3.2% 2.4% 2.6%
Manufacturing Total 50,462 56,562 12.09 20.9% 18.5% 17.1% 15.0%
Durable Goods Manufacturing 24,233 26,053 7.55 10.0% 8.5% 9.9% 8.7%
Lumber and Wood Products 791 890 12.51 0.3% 0.3% 0.2% 0.2%
Furniture and Fixtures 329 362 10.03 0.1% 0.1% 0.3% 0.3%
Stone, Clay, Glass 1,684 1,509 -10.39 0.7% 0.5% 0.4% 0.3%
Primary Metal Industries 595 894 50.27 0.2% 0.3% 0.9% 0.7%
Fabricated Metal Products 3,613 3,906 8.11 1.5% 1.3% 1.8% 1.6%
Machinery excluding Electrical 5,844 5,859 0.26 2.4% 1.9% 2.5% 2.1%
Electrical Machinery, Equip. 8c. Supplies 3,313 3,833 15.69 1.4% 1.3% 1.9% 1.816
Professional Scientific Equipment 6,364 7,084 11.31 2.6% 2.3% 0.7% 0.6%
Nondurable curds Manufacturing 26,238 30,509 16.28 10.8% 10.0% 7.1% 6.3%
Food and Kindred Products 2,035 2,160 6.14 0.8% 0.7% 1.7% 1.5%
Apparel and Textile Products 511 577 12.92 0.2% 0.2% 0.3% 0.2%
Paper and Allied Products 1,470 1,762 19.82 0.6% 0.6% 0.6% 0.5%
Printing and Publishing Industries 2,835 3,451 21.73 1.2°k 1.1% 2.0% 1.8%
Chemicals and Allied Products 15,839 18,187 14.82 6.5% 5.9% 1.2% 1.0%
Drugs 13,544 15,661 15.63 5.6% 5.1% 0.3% 0.3%
Rubber and Misc. Plastic Products 3,282 4,156 26.63 1.4% 1.4% 1.0% 1.1%
Transportation, Communications, and Utilities Tot 9,271 10,843 16.96 3.8% 3.5% 6.4% 6.2%
Trade 62,745 78,380 24.92 25.9% 25.6% 22.9% 22.6%
Wholesale Trade 16,147 18,999 17.66 6.7% 6.2% 6.4% 5.8%
Retail Trade 46,598 59,381 27.43 19.3% 19.4% 16.5°k 16.8%
Finance, Insurance, and Real Estate Total 16,037 20,107 25.38 6.6% 6.6% 6.9% 7.1%
Services Total 74,760 104,614 39.93 30.9% 34.2% 33.4% 36.7%
Hotels and Other Lodging Places 716 958 33.78 0.3°k 0.3% 0.9% 1.0%
Personal Services 2,151 3,170 47.38 0.9% 1.0% 1.0% 1.0%
Miscellaneous Business Services 11,856 20,103 69.56 4.9% 6.6% 5.0% 6.3%
Miscellaneous Repair Services 556 960 72.64 0.2% 0.3% 0.3% 0.4%
Motion Picture 655 864 31.91 0.3% 0.3% 03% 0.3%
Health Services 18,011 24,042 33.49 7.4% 7.9% 8.4% 9.1%
Legal Services 900 1,115 23.89 0.4% 0.4% 0.9% 0.9%
Educational Services 18,424 22,030 19.57 7.6% 7.2% 8.1% 7.9%
Social Services 3,214 5,432 69.01 1.3% 1.8% 1.6% 2.2%
Museums, Art Galleries, and Zoos 26 39 50.01 0.0% 0.0% 0.1% 0.1%
Membership Organizations 3,336 4,100 22.9 1.4% 1.3% 2.1% 2.1%
Private Households 2,102 1,563 -25.64 0.9% 0.5% 0.6% 0.4%
Government Total 13,786 15,358 11.4 5.7% 5.0% 6.3% 5.7%
Federal Government 3,389 3,260 -3.81 1.4% 1.1% 1.0% 0.8%
State Government 1,800 1,930 7.22 0.7% 0.6% 1.3% 1.2%
Local Government 8,597 10,168 18.27 3.6% 3.3% 4.0% 3.7%
Note: Not all subtotals included, thus subtotal numbers do not add up always to industry totals.
Source: Illinois Department of Employment Security, 1992-2005 Industry Employment Projections
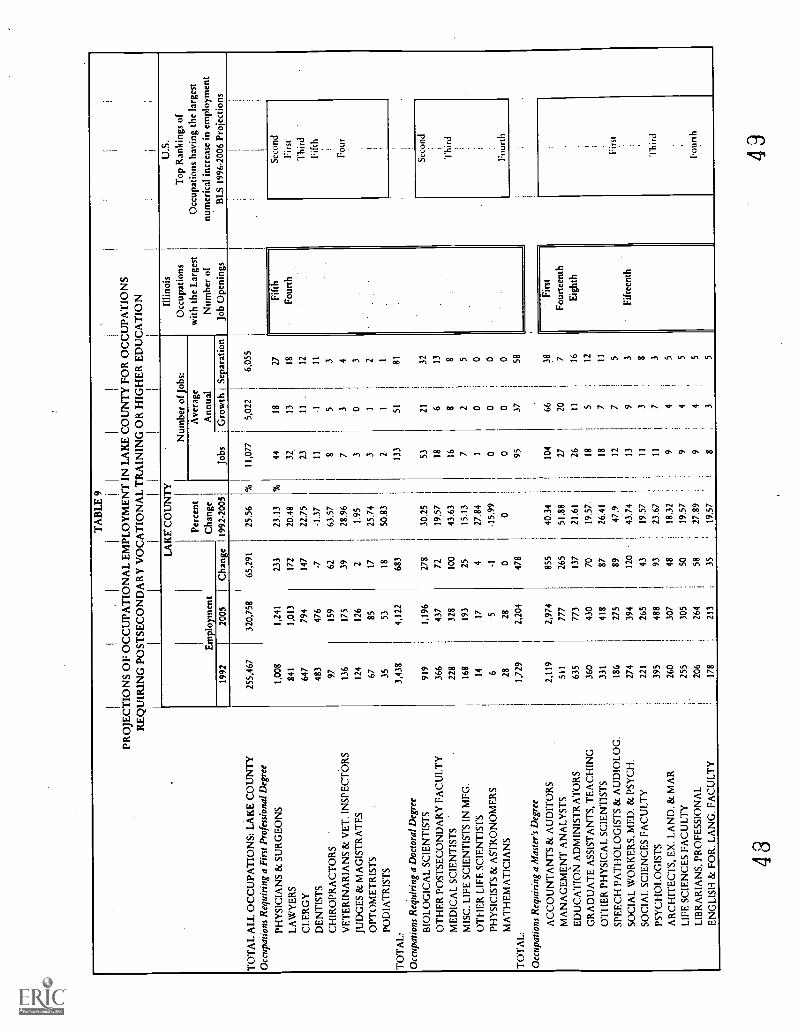
TA
BL
E 9
II
1I
II
I1
I
PRO
JEC
TIO
NS
OF
OC
CU
PAT
ION
AL
EM
PLO
YM
EN
T I
N L
AK
E C
OU
NT
Y F
OR
OC
CU
PAT
ION
SR
EQ
UIR
ING
PO
STSE
CO
ND
AR
Y V
OC
AT
ION
AL
TR
AIN
ING
OR
HIG
HE
R E
DU
CA
TIO
N
TO
TA
L A
LL
OC
CU
PAT
ION
S: L
AK
E C
OU
NT
Y
Occ
upat
ions
Req
uiri
ng a
Fir
st P
rofe
ssio
nal D
egre
ePH
YSI
CIA
NS
& S
UR
GE
ON
SL
AW
YE
RS
CL
ER
GY
DE
NT
IST
SC
HIR
OPR
AC
TO
RS
VE
TE
RIN
AR
IAN
S &
VE
T. I
NSP
EC
TO
RS
JUD
GE
S &
MA
GIS
TR
AT
ES
OPT
OM
ET
RIS
TS
POD
IAT
RIS
TS
1992
255,
467
1,00
8
841
647
483
97 136
124
67 35
TO
TA
L:
3,43
8
Occ
upat
ions
Req
uiri
ng a
Doc
tora
l Deg
ree
BIO
LO
GIC
AL
SC
IEN
TIS
TS
919
OT
HE
R P
OST
SEC
ON
DA
RY
FA
CU
LT
Y36
6
ME
DIC
AL
SC
IEN
TIS
TS
228
MIS
C. L
IFE
SC
IEN
TIS
TS
IN M
FG.
168
OT
HE
R L
IFE
SC
IEN
TIS
TS
14
PHY
SIC
IST
S &
AST
RO
NO
ME
RS
6
MA
TH
EM
AT
ICIA
NS
28
TO
TA
L:
1,72
9
Occ
upat
ions
Req
uiri
ng a
Mas
ter's
Deg
ree
AC
CO
UN
TA
NT
S &
AU
DIT
OR
S2,
119
MA
NA
GE
ME
NT
AN
AL
YST
S51
1
ED
UC
AT
ION
AD
MIN
IST
RA
TO
RS
635
GR
AD
UA
TE
ASS
IST
AN
TS,
TE
AC
HIN
G36
0
OT
HE
R P
HY
SIC
AL
SC
IEN
TIS
TS
331
SPE
EC
H P
AT
HO
LO
GIS
TS
& A
UD
IOL
OG
.18
6
SOC
IAL
WO
RK
ER
S, M
ED
. & P
SYC
H.
274
SOC
IAL
SC
IEN
CE
S FA
CU
LT
Y22
1
PSY
CH
OL
OG
IST
S39
5
AR
CH
ITE
CT
S, E
X. L
AN
D. &
MA
R26
0
LIF
E S
CIE
NC
ES
FAC
UL
TY
255
LIB
RA
RIA
NS,
PR
OFE
SSIO
NA
L20
6
EN
GL
ISH
& F
OR
. LA
NG
. FA
CU
LT
Y17
8
I 1
Em
ploy
men
t20
05
320,
758
1,24
1
1,01
3
794
476
159
175
126
85 53
4,12
2
1,19
643
7
328
193
17 5 28
2,20
4
2,97
477
7
773
430
418
275
394
265
488
307
305
264
213
II
II
i
LA
KE
CO
UN
TY
Illin
ois
U.S
.
Num
ber
of J
obs:
Occ
upat
ions
Top
Ran
king
s of
Perc
ent
with
the
Lar
gest
Occ
upat
ions
hav
ing
the
larg
est
Ave
rage
Cha
nge
Ann
ual
Num
ber
ofnu
mer
ical
incr
ease
in e
mpl
oym
ent
Cha
nge
1992
-200
5Jo
bsG
row
thSe
para
tion
Job
Ope
ning
sB
LS
1996
-200
6 Pr
ojec
tions
65,2
9125
.56
%11
,077
5,02
26,
055
233
23.1
3%
4418
27Fi
fth
Seco
nd
172
20.4
832
1318
Four
thFi
rst
147
22.7
523
11.
12T
hird
;
-7-1
.37
11-1
11Fi
fth
6263
.57
85
3
3928
.96
73
4Fo
ur
21.
953
03
1725
.74
31
2
1850
.83
21
1
683
133
5181
278
30.2
553
2132
Seco
nd
7219
.57
186
13
100
43.6
316
88
Thi
rd
2515
.13
72
5
427
.84
10
0
-1-1
5.99
00
0
00
00
0Fo
Urt
h
478
9537
58
855
40.3
410
466
38Fi
rst
265
51.8
827
207
Four
teen
th
137
21.6
126
1116
Eig
hth
7019
.57
185
12
8726
.41
187
11
8947
.912
75
Firs
t12
043
.74
139
3Fi
ftee
nth
4319
.57
113
8
9323
.67
117
3T
hird
4818
.32
94
5
5019
.57
94
5
5827
.89
94
5Fo
urt h
3519
.57
83
5
4849

Tab
le 9
lcon
t'cll
Em
ploy
men
t
LA
KE
CO
UN
TY
Perc
ent
Cha
nge
1992
-200
5
Num
ber
of J
obs:
Illin
ois
Occ
upat
ions
with
the
Lar
gest
Num
ber
of
Job
Ope
ning
s
U.S
.
Top
Ran
king
s of
Occ
upat
ions
hav
ing
the
larg
est
num
eric
al in
crea
se in
em
ploy
men
tB
LS
1996
-200
6 Pr
ojec
tions
Jobs
Ave
rage
Ann
ual
1992
2005
Cha
nge
Gro
wth
Sepa
ratio
n
CO
UN
SEL
OR
S16
721
042
25.2
17
34
Seco
nd
'O
PER
AT
ION
S &
SY
STE
MS
RE
SEA
RC
HE
RS
122
176
5444
.41
6 '
42
Fift
h
TO
TA
L:
7,07
89,
330
2,24
932
517
115
1
Occ
upat
ions
Req
uiri
ng W
ork
Erp
erie
nce
and
Bac
helo
r's D
egre
e or
Hig
her
I
GE
NE
RA
L M
AN
AG
ER
S &
TO
P E
XE
CS.
7,23
78,
581
1,34
418
.58
231
103
127
Firs
t
MA
RK
ET
ING
, AD
V.,
& P
.R. M
GR
S.1,
871
2,65
378
241
.81
107
6047
Seco
ndFo
urth
OT
HE
R M
AN
AG
ER
S &
AD
MIN
IST
RA
TO
RS
3,32
13,
811
491
14.7
895
3857
I
FIN
AN
CIA
L M
AN
AG
ER
S1,
542
2,01
747
630
.87
6537
28T
hird
Thi
rd
OT
HE
R E
NG
INE
ER
S88
81,
254
366
41.2
753
2825
I
EN
G.,
MA
TH
., &
NA
T. S
CI.
Man
ager
s1,
099
1,51
341
437
.69
5332
21.
Seve
nth
Seco
nd
EL
EC
TR
I. &
EL
EC
TR
O. E
NG
INE
ER
S78
61,
081
296
37.6
843
2320
Sixt
hI
ME
CH
AN
ICA
L E
NG
INE
ER
S67
289
822
633
.58
3717
19T
enth
I
CO
MPU
TE
R E
NG
INE
ER
S25
057
432
312
9.15
3425
9N
inth
Fift
h (B
S)
PUR
CH
ASI
NG
MA
NA
GE
RS
720
855
135
18.7
126
1016
Thi
rtee
nth
PER
S., T
R.,
& L
AB
OR
RE
LA
TIO
NS
MG
RS.
509
665
156
30.7
126
1214
Ele
vent
h
AD
MIN
. SE
RV
ICE
S M
AN
AG
ER
S60
075
415
425
.75
2312
11
CIV
IL E
NG
INE
ER
S, I
N. T
RA
FFIC
444
578
134
30.1
321
101
1'S
ixte
enth
AR
TIS
TS
& C
OM
ME
RC
IAL
AR
TIS
TS
440
561
120
27.3
319
910
Tw
elft
hFi
fth
IND
US.
EN
GIN
EE
RS,
EX
. SA
FET
Y26
634
881
30.6
313
67
I
CH
EM
ICA
L E
NG
INE
ER
S20
727
568
32.7
211
56
ME
DIC
INE
& H
EA
LT
H S
ER
V. M
GR
S.25
233
987
34.5
511
74
Seve
ntee
nth
TO
TA
L:
21,6
7627
,445
5,77
089
144
244
4
Occ
upat
ions
Req
uiri
ng a
Bac
helo
r's D
egre
eC
OM
PUT
ER
SY
STE
MS
AN
AL
YST
S1,
477
3,06
11,
585
107.
314
112
219
Seco
ndFi
rst
TE
AC
HE
RS,
EL
EM
EN
TA
RY
3,27
33,
934
661
20.2
123
5172
Firs
tI
SAL
ES
RE
P., S
CI.
PR
OD
. & S
ER
V.
3,02
83,
480
451
14.9
106
3571
Four
th
OT
HE
R P
RO
F/ P
AR
APR
OF.
,TE
CH
N. W
KR
2,13
02,
986
856
40.1
897
6631
I
TE
AC
HE
RS,
SE
CO
ND
AR
Y S
CH
OO
L2,
175
2,60
142
619
.57
8633
54T
hird
Seco
nd
LO
AN
OFF
ICE
RS
& C
OU
NSE
LO
RS
841
1,37
353
263
.257
4116
Fift
hI
OT
HE
R M
AN
AG
EM
EN
T S
UPP
OR
T W
OR
KE
RS
1,09
91,
501
401
36.5
148
3117
TE
AC
HE
RS,
PR
ESC
HO
OL
& K
IND
GT
N79
61,
217
421
52.9
439
326
Sixt
h.
PER
S., T
R.,
& L
AB
OR
RE
LA
TIO
NS
SPE
C.
645
937
292
45.2
837
2215
Seve
nth
CH
EM
IST
S58
266
886
14.7
126
719
PHA
RM
AC
IST
S68
177
190
13.2
823
716
,
CO
NST
RU
CT
ION
MA
NA
GE
RS
343
555
212
61.8
2416
7T
wel
vth
I
DE
SIG
NE
RS,
EX
. IN
TE
RIO
R D
ESI
GN
E48
063
515
532
.16
1912
8:
TE
AC
HE
RS,
SPE
CIA
L E
DU
CA
TIO
N80
396
015
719
.57
1912
7T
enth
Four
th
IND
UST
RIA
L P
RO
D. M
AN
AG
ER
S59
068
898
16.5
318
810
WH
. & R
ET
. BU
YE
RS,
EX
. FA
RM
482
549
6613
.76
155
10
WR
ITE
RS
& E
DIT
OR
S43
252
9I
9722
.35
15I
78
5051

Tab
le 9
(co
nt'd
)
LA
KE
CO
UN
TY
Illin
ois
U.S
.
Num
ber
of J
obs:
Occ
upat
ions
Top
Ran
king
s of
Perc
ent
Ave
rage
with
the
Lar
gest
Occ
upat
ions
hav
ing
the
larg
est
Em
ploy
men
tC
hang
eA
nnua
lN
umbe
r of
num
eric
al in
crea
se in
em
ploy
men
t
1992
2005
Cha
nge
1992
-200
5Jo
bs'G
row
thSe
para
tion
Job
Ope
ning
sB
LS
1996
-200
6 Pr
ojec
tions
PHY
SIC
AL
TH
ER
API
STS
152
297
144
94.6
816
115
Four
teen
th
P.R
. SPE
CIA
LIS
TS
& P
UB
. WR
ITE
RS
264
327
6424
.19
145
9
OT
HE
R F
INA
NC
IAL
SPE
CIA
LIS
TS
441
542
101
22.8
415
87
SAL
ES
EN
GIN
EE
RS
288
402
114
39.6
715
96
EM
PLO
YM
EN
T I
NT
ER
VIE
WE
RS
236
352
116
49.0
514
95
PRO
P. &
RE
AL
EST
. MG
RS.
& A
D.
229
360
131
57.4
314
104
-Ele
vent
h
MU
SIC
DIR
., SI
NG
ER
S, &
RE
L. W
313
394
8125
.93
136
7 7U
ND
ER
WR
ITE
RS
343
430
8725
.314
7
5SO
CIA
L W
OR
KE
RS,
EX
C. M
ED
. & P
412
529
117
28.3
149
9PU
RC
H. A
GT
S., E
X. W
H/R
ET
/FA
RM
499
544
459.
1112
3
Fift
eent
hC
LIN
. LA
B T
EC
HN
OL
OG
IST
S31
438
369
22.0
712
57 3
OC
CU
PAT
ION
AL
TH
ER
API
STS
9719
699
102.
0411
8
DIE
TIT
IAN
S &
NU
TR
ITIO
NIS
TS
155
215
6139
.14
85
4
MU
SIC
IAN
S, I
NST
RU
ME
NT
AL
103
163
6058
.87
53
Eig
hth
SEC
UR
ITIE
S &
FIN
. SE
RV
. SA
LE
S W
129
200
7154
.75
75
2 2R
ESI
DE
NT
IAL
CO
UN
SEL
OR
S11
619
579
67.7
98
6
2A
LL
OT
HE
R C
OM
PUT
ER
SC
IEN
TIS
TS
253
308
5521
.93
74
PRO
D.,
DIR
EC
T.,
AC
TO
RS,
& O
TH
ER
9214
856
60.8
47
42 3
EC
ON
OM
IST
S91
119
2830
.95
2
2C
LA
IMS
EX
AM
., PR
OP.
& C
AS.
IN
179
224
4525
.13
53
2D
IRE
CT
OR
S, R
EL
IG. A
CT
. & E
DU
C.
130
163
3325
.64
3
1
FIN
AN
CIA
L A
NA
LY
STS,
ST
AT
.92
127
3537
.59
43
2B
UD
GE
T A
NA
LY
STS
125
162
3730
.02
53
2IN
TE
RIO
R D
ESI
GN
ER
S16
117
716
9.87
41
2T
EC
HN
ICA
L W
RIT
ER
S75
9318
24.2
93
1
2R
EC
RE
AT
ION
AL
TH
ER
API
STS
7190
1926
.07
31
1
SUR
VE
YIN
G &
MA
P. S
CIE
NT
IST
S10
412
520
19.4
33
2
1
DA
NC
ER
S &
CH
OR
EO
GR
APH
ER
S43
6825
57.8
13
2
I
AC
TU
AR
IES
8911
627
30.2
23
2
1
CR
ED
IT A
NA
LY
STS
7685
911
.91
21
1
TA
X E
XA
M.,
CO
LL
., &
RE
V. A
GT
S86
9711
12.3
12
1
LA
ND
SCA
PE A
RC
HIT
EC
TS
4961
1224
.87
21
1 1
LA
W C
LE
RK
S47
6012
25.4
62
I
0IN
STR
UC
TIO
NA
L C
OO
RD
INA
TO
RS
7389
1622
.62
1
21
1
CL
AIM
S T
AK
ER
S, U
NE
MP.
BE
NE
F27
292
6.63
I1
0
AIR
TR
AFF
IC C
ON
TR
OL
LE
RS
3335
27.
591
01 0
AU
D1O
-VIS
UA
L S
PEC
IAL
IST
S16
193
j19
.62
10
0R
EPO
RT
ER
S &
CO
RR
ESP
ON
DE
NT
S27
314
15.7
31
0T
hirt
eent
hA
IRC
RA
FT P
ILO
TS
& F
L. E
NG
INE
ER
S9
134
48.0
51
00
TO
TA
L:
26,0
8534
,647
8,55
91,
165
656
504
5 3
5 2

Tab
le 9
(co
nt'd
)
Em
ploy
men
t
LA
KE
CO
UN
TY
Perc
ent
Cha
nge
1992
-200
5
Num
ber
of J
obs:
Illin
ois
Occ
upat
ions
with
the
Lar
gest
Num
ber
of
Job
Ope
ning
s
U.S
.
Top
Ran
king
s of
Occ
upat
ions
hav
ing
the
larg
est
num
eric
al in
crea
se in
em
ploy
men
tB
LS
1996
-200
6 Pr
ojec
tions
Jobs
Ave
rage
Ann
ual
1992
2005
Cha
nge
Gro
wth
Sepa
ratio
n1 I
Occ
upat
ions
Req
uiri
ng a
n A
ssoc
iate
Deg
ree
I
RE
GIS
TE
RE
D N
UR
SES
'3,
666
4,72
21,
056
28.8
117
981
98Fi
rst
Firs
t
FIR
ST L
INE
SU
PER
V. &
MG
R. S
U.
2,68
53,
462
777
28.9
613
460
74Se
cond
; 1
CO
MPU
TE
R P
RO
GR
AM
ME
RS
1,22
81,
510
282
23.0
5222
30
POL
ICE
PA
TR
OL
OFF
ICE
RS
983
1,13
515
215
.46
4812
36T
hird
OT
HE
R H
EA
LT
H P
RO
F. &
PA
RA
PRO
F. W
920
1,33
041
044
.642
3210
.
EL
EC
TR
I. &
EL
EC
TR
O. T
EC
HN
.68
191
323
334
.21
2818
10E
ight
h
TE
AC
HE
R A
IDE
S, P
AR
APR
OFE
SS.
781
933
153
19.5
726
1214
Fift
h
BIO
. & A
G. T
EC
H. &
TE
CH
.57
063
666
11.6
121
516
FIR
E F
IGH
TE
RS
426
503
7717
.99
226
16Se
vent
h
HU
MA
N S
ER
VIC
ES
WO
RK
ER
S17
335
217
910
3.78
1614
3Si
xth
CH
EM
. TE
CH
. & T
EC
H.,
EX
. HE
383
427
4411
.56
143
11
OT
HE
R E
NG
INE
ER
ING
TE
CH
NIC
IAN
S34
040
262
18.0
915
510
OT
HE
R S
CIE
NC
E T
EC
HN
ICIA
NS
314
388
7423
.39
156
9
DE
NT
AL
HY
GIE
NIS
TS
306
410
104
33.8
914
86
Thi
rd
PHY
S. &
CO
RR
EC
T. T
HE
RA
PY A
SST
118
239
122
103.
4812
92
ME
CH
AN
ICA
L E
NG
INE
ER
ING
TE
CH
294
324
3110
.46
24
CIV
IL E
NG
INE
ER
ING
TE
CH
NIC
1A12
616
640
31.7
17
34
:I
SHE
RIF
FS &
DE
PUT
Y S
HE
RIF
F13
115
020
15.0
55
24
ME
D. &
CL
IN. L
AB
TE
CH
NIC
IAN
178
202
2413
.42
62
4
RE
SPIR
AT
OR
Y T
HE
RA
PIST
S11
214
230
26.8
45
23
I
ME
DIC
AL
RE
CO
RD
S T
EC
HN
. & T
EC
H98
140
4242
.62
53
2Fi
fth
IND
UST
RIA
L E
NG
INE
ER
ING
TE
CH
198
221
2211
.15
42
31
RA
DIO
LO
GIC
TE
CH
NO
LO
GIS
TS
133
162
2921
.75
52
3Fo
urth
PAR
AL
EG
AL
PE
RSO
NN
EL
9514
651
54.1
95
41
Seco
nd
TO
TA
L: A
LL
ASS
OC
IAT
E D
EG
RE
E
Occ
upat
ions
Req
uiri
ng P
osts
econ
dary
Voc
atio
nal T
rain
ing
15,6
3219
,832
4,20
370
732
438
2i i
SEC
RE
TA
RIE
S6,
510
6,71
420
33.
1216
216
146
Firs
t,
AU
TO
MO
TIV
E M
EC
HA
NIC
S1,
535
1,89
736
223
.57
7728
49Se
cond
Seco
nd
CO
OK
S, R
EST
AU
RA
NT
934
1,43
049
653
.13
63-
3824
.. T
hird
GA
RD
EN
ER
S &
GR
OU
ND
SKE
EPE
RS,
E1,
457
1,92
646
932
.255
3619
Eig
hth
HA
IRD
RE
SS.,
HA
IRST
Y.,
CO
SME
1,25
41,
733
479
38.1
753
3716
Sixt
hFi
fth
FOO
D S
ER
V. &
LO
DG
ING
MA
NA
GE
RS
954
1,36
741
343
.31
5032
19Fo
urth
LIC
EN
SED
PR
AC
TIC
AL
NU
RSE
S93
51,
244
308
32.9
742
2419
.Fi
fth
Firs
t
TR
AV
EL
AG
EN
TS
408
629
221
54.1
131
1714
Ele
vent
hI
DA
TA
EN
TR
Y K
EY
ER
S, E
X. C
OM
POS
916
1,08
717
118
.67
2913
16T
wel
vth
WE
LD
ER
S &
CU
TT
ER
S53
469
015
629
.11
2712
15N
inth
;
DR
AFT
ER
S, E
XC
. PU
BL
IC U
TIL
I54
861
971
13.0
425
519
"Six
teen
th
AU
TO
. BO
DY
& R
EL
. RE
PAIR
ER
S48
562
514
028
.82
2511
14Fo
urte
enth

Tab
le 9
(co
ned)
RE
CR
EA
TIO
N W
OR
KE
RS
BU
S &
TR
UC
K M
EC
H. &
DIE
S. S
PE
MA
CH
INIS
TS
ME
DIC
AL
SE
CR
ET
AR
IES
BA
KE
RS
, BR
EA
D &
PA
ST
RY
HE
AT
., A
/C &
RE
FR
IG. M
EC
H. &
TY
PIS
TS
, IN
C. W
OR
D P
RO
CE
SS
ING
OP
TIC
IAN
S, D
ISP
EN
SIN
G &
ME
AS
UR
.
PH
AR
MA
CY
TE
CH
NIC
IAN
SLE
GA
L S
EC
RE
TA
RIE
SD
AT
A P
RO
CE
SS
. EQ
UIP
. RE
PA
IRE
RS
ALE
S A
GE
NT
S, R
EA
L E
ST
AT
EIN
DU
ST
RIA
L M
AC
HIN
ER
Y M
EC
HA
NIC
TO
OL
& D
IE M
AK
ER
SR
AD
IOLO
GIC
TE
CH
NIC
IAN
SC
OM
PU
TE
R P
RO
GR
AM
ME
R A
IDE
SE
ME
RG
EN
CY
ME
DIC
AL
TE
CH
NIC
IAN
S
TO
TA
L: A
LL P
OS
TS
EC
ON
DA
RY
VO
CA
TIO
NA
L
LAK
E C
OU
NT
Y
Em
ploy
men
t19
9220
05C
hang
e
Per
cent
Cha
nge
1992
-200
5
Num
ber
of J
obs:
Ave
rage
Ann
ual
jobs
Gro
wth
Sep
arat
ion
568
764
196
34.4
523
333
446
113
33.8
920
673
709
365.
3619
350
470
121
34.5
118
289
436
147
51.0
219
383
554
171
44.7
419
1,59
01,
448
-142
-8.9
318
208
318
109
52.6
315
507
542
356.
8914
301
385
8427
.86
14
362
438
7621
.08
14
344
435
9126
.513
448
477
306.
6612
388
394
61.
5911
197
280
8442
.59
11
186
246
6032
.53
9
191
284
9348
.75
9
25,9
4531
,074
5,12
297
0
Not
e: T
his
tabl
e is
a s
hort
ened
list
of o
ccup
atio
ns a
t the
mas
ter's
,ba
ccal
num
bers
of e
mpl
oym
ent.
The
refo
re, t
he s
um o
f the
line
s by
leve
l
-200
5 O
ccup
atio
nal E
mpl
oym
ent P
roje
ctio
ns, C
ompi
led
byth
e Ill
inoi
s
15 9 3 9 11 13 -11 8 3 6 6 7 2 0 6 5 7 393
8 11 16 9 8 6 29 7 12 8 8 6 10 10 4 5 2 572
Illin
ois
Occ
upat
ions
with
the
Larg
est
Num
ber
of
Job
Ope
ning
sT
hirt
eent
hT
enth
Fift
eent
h
Eig
htee
nth
Sev
ente
enth
Nin
etee
nth
Tw
entie
th
Sev
enth
U.S
.
Top
Ran
king
s of
Occ
upat
ions
hav
ing
the
larg
est
num
eric
al in
crea
se in
em
ploy
men
tB
LS 1
996-
2006
Pro
ject
ions
Thi
rd
Fou
rth
aure
ate
w th
exp
erie
nce,
bac
cala
urea
te, a
ssoc
iate
, and
pos
tsec
onda
ry v
oca
tona
l edu
catio
n le
vels
for
occu
pati
-ins
with
sig
nific
ant
is n
ot e
qual
to th
e to
tal f
or th
at le
vel.
Occ
upat
iona
l Inf
orm
atio
n C
oord
inat
ing
Com
mitt
ee

APPENDIX II
CONSULTANT REPORTMGT OF AMERICA
LAKE COUNTY PILOT STUDY:MARKET RESEARCH RESULTS
53

ILLINOIS HIGHER EDUCATION IN THE 21sT CENTURYLAKE COUNTY PILOT STUDY:MARKET RESEARCH RESULTS
Executive Summary
This report presents the results of the various market research components conducted as
part of the Lake County Pilot Study. The overall research methodology employed in this study
was aimed at determining the postsecondary education needs of residents and employers in Lake
County. There were four separate components to the research:
A mail survey of Lake County employers with 10 or more employees
A telephone survey of Lake County residents age 21 and older
A self-administered survey of high school juniors from three public highschools in Lake County
A mail survey of human resource directors from the top 25 largestemployers in Lake County
All research was conducted during the period April June 1998. The table below summarizesthe responses to each of these components.
.40igite 6*RO** SàñlëSize AORonlie.n* aesOoilSeltate5Employer Survey * 1,224 151 12.3%
Adult Resident Survey * 1,072 600 56.0%
High School Junior Survey 1,600 1,054 65.9%
Human Resource Director Survey 25 6 24.0%Reflects final sample size after factoring out invalid addresses and phone numbers.
The key findings from these surveys are as follows:
About one-third (32.2%) of adult resident respondents have taken acollege-level course during the past two years and approximately the sameproportion (31%) plan to take a course within the next three years.
Of the adult residents who plan to take a course within the next threeyears, three-fourths (75.7%) of these individuals intend for this course tocount toward a degree or certificate. Of these individuals,
- 28% intend to apply it toward a bachelor's degree- 27.6% intend to apply it toward a master's degree- 20.1% intend to apply it toward an associate degree
More than four out of five high school juniors responding to the survey(83.3%) intend to enroll in college right after high school graduation.While more than half (57.8%) of these juniors were "very interested" or"somewhat interested" in attending a college or university withincommuting distance of home, larger proportions of these students indicatedinterest in attending college outside of commuting distance, both in Illinois
MGT of America, Inc. 5 3Page i

Lake County Pilot Study:Results of Market Research
(68.8%) and out-of-state (75.2%). Nine out of ten (86.8%) juniors were"very interested" or "somewhat interested" in attending a public college oruniversity.
The most frequently noted course area of interest by adult residentssurveyed was Computer Science and Information Technology. Employersalso indicated strong interest in computer science and computingapplications courses for their employees, as did human resource directors.Employers also indicated interest in courses in business management and
basic skills such as reading comprehension, math and communications.
Among adult residents surveyed, the strongest level of interest was in
courses offered at a public community college or university withincommuting distance (85.4%). There was also interest in other commutingoptions as well. However, nine out of ten respondents (86.1%) indicatedthat they would be willing to commute no more than a half-hour to take acollege course.
Among employers, the strongest level of interest was in instruction thatwas offered on-site and in person at the workplace for employees (63.9%).
More than one-half of adult residents surveyed indicated that they wereinterested in courses offered via both two-way interactive video (56.9%)and the Internet (68.0%). Further, more than two-thirds of these residents(68.3%) indicated that they had access to the Internet, either at home orwork or both.
Almost 80 percent of employers surveyed currently offer either full- orpartial-tuition reimbursement to employees who take college courses andabout the same proportion would be willing to continue this practice in thefuture. Almost two-thirds (63.3%) of employers surveyed would also bewilling to give educational providers use of on-site instructional facilities inorder to meet employee education needs.
In summary, the market research revealed a number of key findings across the various groupssurveyed. Adult residents participating in the survey who have a strong interest in participatingin higher education are also very likely to want to work toward a degree or certificate as opposedto just taking courses, both at the bachelor's and master's levels. These individuals also indicateda strong interest in educational options that would fit within work and family responsibilities,including those offered via instructional technologies. Employers responding to the surveyindicated very specific or targeted higher education needs and were most interested in offeringcourses to their employees in content areas directly relevant to the workplace. High school
juniors indicated the strongest level of interest in pursuing higher education "away from home",although there were a large percentage who also indicated interest in educational options withincommuting distance.
6 0MGT of America, Inc. Page ii

ILLINOIS HIGHER EDUCATION IN THE 21ST CENTURYLAKE COUNTY PILOT STUDY:MARKET RESEARCH RESULTS
Introduction and Overview of the Report
This report presents the results of the various market research components conducted as
part of the Lake County Pilot Study. Four target populations in Lake County were included in
this study:
EmployersAdult residentsHigh school juniorsHuman Resource directors of the 25 largest employers in Lake County
Rather than report the results of the various market research components separately, this reportintegrates the findings according to the seven policy questions underlying this study:
1. What unmet need is there in Lake County for coursework leading to abachelor's degree for additional baccalaureate-level training?
2. What unmet need is there in Lake County for graduate-level courses and/or
programs?
3. What unmet need is there in Lake County for certificate programs beyond
the associate degree level?
4. What unmet need is there in Lake County for additional training andeducation of the sort typically provided by the College of Lake County, acomprehensive two-year community college?
5. How satisfied are employers with the knowledge and skills of the entry-level college graduates they hired in the last year?
6. Assuming that there are unmet needs for higher education in Lake County,by what means, at what locations, and at what cost to students andemployers should these needs be met?
7. What are employers willing to do in order to respond to unmet needs forhigher education in Lake County?
Relevant results from each of the market research components will be presented for each of thesequestions after a brief description of the research methodologies used in this study and a reviewof the overall level of interest in higher education indicated by the target populations. Questions
#3 and #4 above will be addressed together given the natural overlap of issues between these
questions.
MGT of America, Inc. 61 Page 1

Lake County Pilot Study:Results of Market Research
Description of Research Methodologies
The overall research methodology employed in this study was aimed at determining thepostsecondary education needs of residents and employers in Lake County. There were fourseparate components to the research:
A mail survey of Lake County employers
A telephone survey of Lake County residents age 21 and older
A self-administered survey of high school juniors in Lake County
A mail survey of human resource directors from the top 25 largestemployers in Lake County
All research was conducted during the period April June 1998. Each one of these is brieflydescribed in further detail below.
Employer Survey. This component involved sending a written survey by mail to astratified sample of 1,290 Lake County employers with 10 or more employees. The sample stratawere broken out by number of employees: 10 to 19 employees (350 in sample); 20 to 49employees (250 in sample); 50 to 99 employees (200 in sample); and 100+ employees (490 insample).
Both an initial and a follow-up mailing were conducted, and 66 unopened surveys werereturned due to incorrect addresses. A total of 151 completed responses were received for anadjusted response rate of 12.3 percent.' Because of a somewhat lower than expected responserate, results from this survey are reported at the aggregate level throughout this report. Adescriptive overview of survey respondents is presented in Appendix A. As indicated in theappendix, the majority of the respondents (79.4%) employed 250 employees or fewer.
Adult Resident Survey. This component involved telephone interviews with randomlyselected adult residents in Lake County age 21 or older. The initial sample included 2,000randomly selected phone numbers from households located in Lake County.
Data were collected in two stages. A pretest was conducted with 80 households betweenMay 20 to May 21 1998. This pretest was conducted to collect information in question wording,and the length of the survey. The full scale study was conducted between May 26 to June 24,1998. The average length of each interview was 11 minutes. Completed surveys were obtainedfrom 600 residents, or 56% of the final sample (1,072). The standard error for this survey was +1-4.0%. A descriptive overview of survey respondents is presented in Appendix B. As indicated inthe appendix, the survey respondents were predominantly female and white. Almost one-half ofthe respondents had completed at least a bachelor's degree and three-fourths were currentlyemployed (73.6%), either full- or part-time.
High School Junior Survey. This component involved a self-administered written surveythat was provided to 1,600 high school juniors at three public high schools in Lake County:
Adjusted response rate is computed as follows: Total completed responses received (151) divided byinitial sample (1,290) less surveys returned unopened (66).
MGT ofAmerica, Inc. Page 2
6 2

Lake Colin°, Pilot Study:Results of Market Research
Antioch High School
Wauconda High School
Stevenson High School (Lincolnshire)
These high schools were chosen based on the representativeness of their student populations
when compared to all high schools in Lake County. Completed surveys were received from
1,054 juniors, or 66% of the total number surveyed. A descriptive overview of surveyrespondents is presented in Appendix C. As indicated in the appendix, the respondents werepredominantly white. The distribution of respondents among all race-ethnic categories is not
proportionate when compared to the overall population, and thus the data are reported at the
aggregate level throughout this report.
Human Resource Directors Survey. This component involved a written survey that was
mailed to human resource directors at the top 25 largest employers in Lake County. An initial
mailing was sent out and follow-up phone calls were placed to non-respondents approximately
three weeks after the initial mailing. Completed surveys were received from six human resource
directors, or 24% of the sample. Given the small number of respondents, the results of this
survey are used in more of a "qualitative" way to help interpret some of the results from the
employer survey. This is because, although the small number preclude a valid statistical analysis
of the survey responses, the overall size of the organizations represented by these human resource
directors make it imperative that their experiences are considered in evaluating higher education
needs in Lake County.
What is the Overall Level of Interest in Higher Education among Lake County Residents?
Interest in higher education can take various forms ranging from the traditional to the non-
traditional. It can include the high school senior who intends to leave home and achieve his orher bachelor's degree in four years as well as the working adult who wants to work toward adegree part-time for the purpose of moving forward in his or her career. It can also include
employers who want to provide continuing education and training in a specific content area to
their employees.
A good measure of potential interest in future higher education offerings among the Lake
County adult population is the proportion of residents who are currently participating in higher
education, or have participated recently. Figure 1 below illustrates the proportion of adult
residents in the survey who have taken any college-level course within the past two years. As
indicated, only about one-third of adult residents in the survey population have actually taken a
course during the past two years. The most frequently cited reason for not taking a course was
that the respondent was too busy or did not have enough time. Interestingly, this is a somewhat
higher percentage than is indicated by similar measures at a national level. A 1995 surveyconducted by the U.S. Department of Education found that the percentage of adults age 25 and
older taking a work-related course from a college or university (2- or 4-year) that year ranged
from about 17 percent to 23 percent depending on the age of the respondent.2 This may, be due
to the relatively high level of education among respondents which is often a positive factor in
2 Source: U.S. Department of Education, National Center for Education Statistics, National Household
Education Survey, 1995.
MGT ofAmerica, Inc. 63 Page 3

Lake County Pilot Study:Results of Market Research
seeking additional education. Almost one-half (45.5%) of respondents reported having abachelor's degree or more. The most recent national data indicate that less than one-fourth(23.9%) of U.S. adults age 25 or more have attained a bachelor's degree or more.3
Figure 1Percent of Respondents Who Have Taken Any College Level Course in the Past Two Years:
Lake County Adults
80%
70% .
60%
50% .
40% .
30% .
20% .
10% .
0%
These proportions change somewhat when looking to future plans of residents to participate inhigher education. Figure 2 below illustrates the percentage of adult residents who plan to take acollege level course in the next three years.
Figure 2Percent of Respondents Who Plan to Take a College Level Course in the Next Three Years:
Lake County Adults
The proportion of respondents who definitely plan to take a college-level course within the nextthree years (31%) is comparable to the proportion of respondents who actually took a college-level course during the past two years (32.2%), reflecting the fact that many of those individualswho have recently taken a course will be likely to do so in the future. When the adult residents inthe survey population who indicate a definite or possible intent to participate in higher education
3 Source: U.S. Bureau of the Census, Current Population Survey, March 1997.
MGT of America, Inc. Page 4

Lake County Pilot Study:Results of Market Research
are combined, almost one-half of the adults in the survey (47.2%) seem likely to take at least a
college-level course within the next three years. Further, three-fourths (75.7%) of these
individuals intend for this course to count toward a degree or certificate of some sort. Table 1
below shows the intended degree-level of adult residents in the survey.
Table 1Intended Degree of Lake County Adults Who Plan to Pursue a Degree
keeT;4: Ve eteenVOfTo 4
Less than 2-Year Certificate 12 .1%
Associate Degree 20.1%
Bachelor's Degree 28.0%
Master's Degree 27.6%
Education Specialist 0.9%
Doctorate 2.8%
Professional Degree (e.g., JD, MD, DDS) 2.8%
Other Postsecondary Certificate 1.9%
Don't Know 3.7%
As indicated, the highest levels of interest exhibited by residents were in a Bachelor's or a
Master's degree, followed by the Associate degree.
Other relevant findings from the market research components are as follows:
More than four out of five high school juniors responding to the survey(83.3%) intend to enroll in college right after high school graduation.Further, more than half (57.8%) of these juniors were "very interested" or
"somewhat interested" in attending a college or university within
commuting distance from their home.
Just under half (42.2%) of employers responding to the survey indicated
that they currently sponsor college-level coursework for their employees,either on site or at another location. Further, two-thirds of employers
(66.7%) also sponsor continuing professional education for their
employees.
What Unmet Need is there in Lake Countyfor Coursework Leading to a Bachelor's Degree
or for Additional Baccalaureate-Level Training?
As previously indicated, more than one-quarter of those adult residents who intend to
apply future college-level coursework toward a degree (28%) are interested in a bachelor's
degree. Table 2 indicates the top five course areas of interest of those adults indicating a
preference. As indicated, the most frequently noted course area of interest was Computer
Science and Information Technology (25.8% of total). The level of interest in specific course
areas drops off significantly after that to fewer than 10 percent for the remaining areas shown.
MGT of Anterica, Inc. 65 Page 5

Lake County Pilot Study:Results of Market Research
Table 2Top Five Course Areas of Interest
Lake County Residents
diAirSe' , 2PercentofTotals1. Computer Science/Information Technology 25.8%
2. Business9.9%
3. Teacher Education 8.8%
4. Accounting, Education Administration (tie) 3.9%
5. Engineering, Allied Health (tie) 2.8%
Employers surveyed tended to indicate a preference for undergraduate-level courseworkor training that would be directly relevant to the workplace. Table 3 illustrates the proportion ofthose respondents who indicated a need for their employees to have additional undergiaduate-level coursework and training, both now and within two to three years.
Table 3Percentage of Employers Indicating Current and Future Education Need for Employees:
Undergraduate Level
troOON,04. T,11***N01:4Computer Usage/Software Applications 25.9% 29.3%
Accounting 15.0% 15.6%
Basic Skills (math, reading, writing) 12.9% 11.6%
Information Technology/Computer Science 23.8% 24.5%Speech/Presentation Skills 14.3% 15.6%
English as a Second Language 3.4% 4.1%
Business Management/Marketing 19.0% 19.9%
General Education courses 10.9% 9.5%Health-related Fields 9.5% 8.2%
Engineering 12.9% 15.0%
Education (including ed. Administration) 7.5% 7.5%
As indicated, the most frequently cited areas of both current and future need by employers at the
undergraduate level are computer usage, information technology, and businessmanagement/marketing. These needs are validated by the human resource directors: four of thesix respondents to the human resource directors survey noted that their organizationshad recentlyfaced professional staff hiring shortages for information technology specialists and software
engineers.
Four out of five of all high school juniors responding to this survey (79.5%) indicated anintent to pursue a bachelor's degree or higher after enrolling in college. When isolating thosejuniors who are "very interested" or "somewhat interested" in attending college withincommuting distance of home, this proportion remains about the same (76.8%). This suggests astrong intent among these juniors to pursue a baccalaureate degree, regardless of whether or notthey stay near home or leave to pursue their education.
MGT of America, Inc 6GPage 6

Lake County Pilot Study:Results of Market Research
What Unmet Need is there in Lake County for Graduate-Level Courses and/or Programs?
As mentioned earlier, three-fourths of those adult residents surveyed whom definitely or
possibly intend to take a course during the next three years also intend for that course to apply
toward a degree or certificate. Of that total:
27.6 percent would be toward a masters' degree
3.7 percent would be toward a doctoral or education specialist degree
2.8 percent would be toward a professional degree (i.e., law, medicine,
dentistry)
Thus, in total, one-third (34.1%) intend to work toward a graduate degree or certificate of some
type, primarily at the master's level.
Table 4 illustrates the proportion of those employers responding who indicated a need for
their employees to have additional graduate-level coursework and training, both now and within
two to three years, for selected relevant content areas.
Table 4Percentage of Employers Indicating Current and Future Education Need for Employees:
Graduate-Level
CutrentNeed -,Future-Need':.Computer Usage/Software Applications 10.2% 12.2%
Accounting 6.1% 6.8%
Information Technology/Computer Science 9.5% 12.2%
Speech/Presentation Skills 6.8% 4.1%
Business Management/Marketing 10.2% 15.0%
General Education courses 5.4% 4.1%
Health-related Fields 2.7% 2.7%
Engineering 7.5% 7.5%
Education (including ed. Administration) 9.5% 11.6%
Although generally lower than the need indicated by employers for undergraduate-levelcoursework, the strongest level of interest indicated was for the areas of BusinessManagement/Marketing, Information Technology & Computer Science, and ComputerUsage/Software Applications. There was also a relatively high level of interest in graduate-leveleducation coursework. As with the undergraduate-level, these are all areas that are related to the
workplace.
Related to this, employers were asked to indicate a their current and future level of interest
in continuing education (which includes non-credit work). While not necessarily at the graduatelevel, it is likely that some of the employees participating would already have a bachelor'sdegee, and might be interested in having this work apply toward a graduate degree. For
example, the adult resident survey results indicated thatof those individuals interested in pursuing
a degree, one-third would be interested in pursuing a degree at the graduate level. Table 5illustrates the proportion of those respondents who indicated a need for their employees to haveadditional continuing education, both now and within two to three years.
MGT ofAmerica, Inc. Page 7
6 7

Lake County Pilot Study:Results of Market Research
Table 5Percentage of Employers Indicating Current and Future Education Need for Employees:
Continuing Education
"Field '-' iii.0.0iNee4Computer Usage/Software Applications 52.4% 53.1%
Accounting 17.0% 18.4%
Basic Skills (math, reading, writing) 10.9% 16.3%
Information Technology/Computer Science 30.6% 33.3%
Speech/Presentation Skills 24.5% 27.2%
English as a Second Language 16.3% 17.0%
Business Management/Marketing 21.1% 19.0%
General Education courses4.8% 9.5%
Health-related Fields 10.2% 8.8%
Engineering 10.2% 12.2%
Education (including Ed. Administration) 10.9% 10.3%
Overall, the level of need indicated by employers for continuing education was stronger than that
indicated for undergraduate or graduate-level education. This may be reflective of the shorter-
term training horizons often needed by employers in order to meet specific needs or to respond
rapidly to changing business situations. Employers indicated a strong level of current and future
need in many areas for continuing education including computer usage/software applications,
information technology/computer science, speech/presentation skills, and business
management/marketing.
What Unmet Need is there in Lake County for Certificate Programs beyond the Associate
Degree Level? AND;
What Unmet Need is there in Lake County for Additional Training and Education of the
Sort Typically Provided by the College of Lake County, a Comprehensive Two-Year
Community College?
Community colleges provide a wide array of educational opportunities includingbaccalaureate transfer, occupational/vocational certification, remedial coursework, and continuing
education. Of the adult residents surveyed who intend to pursue a degree or certificate in the
future:
12.1 percent would be toward a certificate requiring less than two years
20.1 percent would be toward an associate degree
Thus, about one-third of these individuals indicate a strong likelihood of working toward an
associate degree or other certification provided at the community college level.
Employers were asked about current and future education and training needs of their
employees in a variety of content areas and levels that would be consistent with the kinds of
education and training provided by community colleges. Table 6 shows the needs identified by
employers at three levels (pre-college level, college level (undergraduate), and continuing
MGT ofAmerica, Inc. 6 8 Page 8

Lake County Pilot Study:Results of Market Research
education) for relevant content areas. As indicated, employers identified a number of educational
needs, which could be addressed by a community college. At the pre-college level, the greatestneeds appear to be in the basic skills, ESL, and computer usage areas. Again, the human
resource directors validate these needs. Four of the six directors responding to this survey
indicated that many new hires at the clerical/support and laborer levels lacked basic readingcomprehension and math skills necessary for their positions. At the college level, these needschange somewhat for employers to include information technology and computer science. Forcontinuing education, employers identified computer usage, information technology, and
speech/presentation skills.
Among high school juniors responding to this survey, 5.8 percent intend to pursue anassociate degree or a certificate requiring less than two years at a community college. This issignificantly less than those juniors who intend to pursue a bachelor's degree or higher afterenrolling in college. When isolating those juniors who are "very interested" or "somewhatinterested" in attending college within commuting distance of home, this proportion remainsabout the same (7.2%). This indicates that, at least at this point in their decision making process,these juniors are more likely to pursue educational opportunities above the two-year level.
Table 6Percentage of Employers Indicating Education and Training Needs for Employees:
Pre-College, College-Level, and Continuing Education
ikti'entl!liedi ViititriNeed. Fre_CoLregeLeveI
Computer Usage/Software Applications 27.9% 24.5%
Basic Skills (math, reading, writing) 24.5% 23.8%
Information Technology/Computer Science 14.3% 16.3%
Speech/Presentation Skills 15.6% 10.9%
English as a Second Language 17.0% 20.4%
General Education courses 9.5% 10.9%
-0 e; '' --k(U.4.401:#04000):.:
Computer Usage/Software Applications 25.9% 29.3%
Accounting. 15.0% 15.6%
Basic Skills (math, reading, writing) 12.9% 11.6%
Information Technology/Computer Science 23.8% 24.5%
Speech/Presentation Skills 14.3% 15.6%
English as a Second Language 3.4% 4.1%
General Education courses 10.9% 9.5%ConliiIurng Education :.
Computer Usage/Software Applications 52.4% 53.1%
Accounting 17.0% 18.4%
Basic Skills (math, reading, writing) 10.9% 16.3%
Information Technology/Computer Science 30.6% 33.3%
Speech/Presentation Skills 24.5% 27.2%
English as a Second Language 16.3% 17.0%
Business Management/Marketing 21.1% 19.0%
General Education courses 4.8% 9.5%
MGT of America, Inc.
BEST COPY HAMA
6 9
,11. LE
Page 9

Lake County Pilot Study:Results of Market Research
How Satisfied Are Employers with the Knowledge and Skills of Entry-Level CollegeGraduates Hired in the Last Year?
Employers were asked to respond to two questions regarding their overall satisfactionwith the preparation of college students for the workplace:
To what extent do you agree with the statement that our colleges anduniversities are doing a good job of preparing students for the workplace?
How satisfied are you with the overall knowledge and skills of yourrecently hired college graduates?
Figure 3 shows the distribution of responses to the first question, while Figure 4 shows thedistribution of responses to the second question.
Figure 3Employer Opinions on How Well Colleges Prepare Students for the Workplace
80% -
70%,60% .
50% .
40%.30% .
20% .
10% .
0%
Figure 4Employer Satisfaction with Overall Skills and Knowledge of
Recently Hired College Graduates
80%
70% .
60% .
50% .
40% .
30% .
20%.10% .
0%
8.7%
73.8%
Very Satisfied Satisfied
15.1%
Not too Satisfied
2.4%
Not at all Satisfied
MGT ofAmerica, Page 10

Lake County Pilot Study:Results of Market Research
As indicated in the figures above, there is a high level of satisfaction with the job that colleges are
doing overall in preparing students for the workplace. Three-fourths (75.1%) of employers
responding to the survey either "strongly agreed" or "agreed" that colleges and universities are
doing a good job preparing students for the workplace. Not surprisingly, there was also a high
level of satisfaction among these employers with the overall knowledge and skills of their
recently hired college graduates. Four out of five respondents (82.5%) were "very satisfied" or
"satisfied" with their recent hires.
By What Means, At What Locations, and At What Cost to Students and Employers Should
Unmet Needs Be Met?
Adult residents, employers, and high school juniors were asked various questions
regarding their desired means of instruction, location, and cost. Relevant responses are addressed
below.
Desired Means of Instruction. The primary means by which instruction can be delivered
is in person (either on campus, at off-campus locations, or at the workplace) or via instructional
technologies to any number of locations (e.g., home, work, and other off-campus sites). Table 7
below indicates the percent of adult residents participating in the survey who were "very
interested" or "somewhat interested" in various means of instruction. As indicated, the highest
level of interest indicated by residents was for courses offered "on campus" at a public
community college or university within commuting distance of home. The lowest level of
interest was for courses either offered in Illinois, but outside of commuting distance (13.4%) and
courses offered at an out-of-state institution (8.9%). These responses are not surprising given that
almost three-fourths (73.6%) of those adults interviewed were currently employed.
Table 7Level of Adult Resident Interest in Selected Means of Instruction
Meaiioflnsthictiônv-..
VOTerY*testi&
' som eiv- at're.4 '.." Subtotal. _
Course offered at home 39.1% 26.0% 65.1%
Course offered at work 29.1% 25.1% 54.2%
Course offered at a public community college oruniversity within commuting distance
50.4% 35.0% 85.4%
Course offered at a private community college oruniversity within commuting distance
33.0% 33.7% 66.7%
Course offered at off-campus sites withincommuting distance
44.9% 36.5% 81.4%
Course offered at an institution outside ofcommuting range
5.7% 7.7% 13.4%
Course offered at an out of state college 4.7% 4.2% 8.9%
Course offered via two-way interactive video 19.4% 37.0% 56.3%
Course offered via Internet 22.6% 33.0% 55.6%
A similar set of questions was posed to the high school juniors. Table 8 indicates the
percent of high school juniors who were "very interested" or "somewhat interested" in the various
means of instruction. The highest level of interest indicated by respondents was in taking courses
MGT of Anterica, Inc.71
Page I I

Lake County Pilot Study:Results of Market Research
"on campus" at a public college and university (86.8%). There appears to be a higher level ofinterest among the respondents in attending institutions outside of commuting distance, either in
Illinois or out of state, than in attending institutions within commuting distance.
Table 8Level of High School Junior Interest in Selected Means of Instruction
.*P0,0411*Flictic0.-NOYety.
7 qnteiiited-',.',°/0oineWhat
Intereited.:, :rtSubtfital':;:
Course offered at a college or university withincommuting distance
25.3% 32.5% 57.9%
Course offered at an off-campus site withincommuting distance
17.2% 28.8% 45.9%
Course offered at an institution outside ofcommuting range
28.5% 40.4% 68.8%
Course offered at an out of state college 46.2% 29.1% 75.2%
Course offered at a community college 11.5% 20.9% 32.4%
Course offered at a public college or university 53.9% 33.0% 86.8%
Course offered at a private college or university 22.6% 35.7% 58.3%
Course offered via two-way interactive video 9.5% 20.4% 29.9%
Course offered via Internet 12.5% 23.2% 35.7%
Employers were also asked their preferences as to mode of educational delivery for theiremployees. Table 9 shows the frequency of responses by mode of instruction. As indicated, thehighest level of interest indicated was in instruction offered to employees on-site at theworkplace. Almost two-thirds of respondents indicated a preference for this mode of instruction.The least preferred modes of instruction were courses offered on-site via interactivevideoconferencing (17.7%) and courses offered on-site via the Internet (20.4%).
Table 9Employer-Preferred Means of Instruction for Employees
.,c eankArInitinc '
el-cent:Of TRestiOndeli6i.4"t,.;
dicating,Prefeienee :=...
On-site and in person instruction 63.9%Off-site instruction at an educational institution 49.0%On-site instruction via interactive videoconferencing 17.7%
On-site instruction via the Internet 20.4%
A specific area of interest covered in the market research that is relevant to this issue wasthe level of interest in taking courses via technological means (i.e., via the Internet and interactivevideo). A key factor in this issue is the level of access to technology. Both adult residents andhigh school juniors were asked to indicate whether or not they currently had access to theInternet. The research indicates a relatively high level of access: more than two-thirds (683%)of adult residents and 933 percent of high school juniors participating in this studycurrently have access to the Internet, either at home, school, or work.
MGT ofAmerica, Inc.
7 2
Page 12

Lake County Pilot Study:Results of Market Research
Both adult residents and high school juniors were asked about their interest in taking
college courses both via the Internet and via two-way interactive video. Table 10 illustrates the
percentage of respondents who indicated that they would be interested in taking courses via this
method. As indicated, adult residents participating in the study indicated a substantially higher
level of interest overall in both means of instruction when compared to high school juniors. This
may be due to the flexibility that such courses offer to working adults. For those adults who were
not interested in courses offered via the Internet or interactive video, the primary reasons were
that the individual preferred personal contact with the instructor or that they were just not
interested. These responses are also consistent with the level of interest in such course offerings
among these groups illustrated earlier in Tables 7 and 8.
Table 10Percent of Adult Residents and High School Juniors who would be Interested in Courses
Offered via the Internet or Interactive Video
intructionaI IVIOng,Add lt-esidefils...
Iligh'Sch001"Junfor4 .
Course offered via the Internet 68.0% 33.0%
Course offered via Two-Way Interactive Video 56.9% 21.1%
As illustrated in Table 6, there was a low level of interest indicated by employers in providing
course offerings to employees via the Internet and interactive video.
Desired Locations. It is clear from the data presented in the previous section that the
primary consumers of higher education in Lake County would likely be working adults and
employers. While more than one-half ofhigh school juniors indicated that they would be "very
interested" or "somewhat interested" in taking courses at colleges or universities within
commuting distance, a much larger proportion were interested in attending institutions away from
home.
This being the case, the data in the previous section also indicate that adult residentswould be most likely to want to take courses at a public community college or university within
commuting distance of their home, or at an off-site instructional facility within commuting
distance of home. In terms of distance, almost nine out of ten (86.1%) adult residentsparticipating in the survey indicated that they would be willing to commute no more than a half-
hour from their home. Three-fourths (75.2%) of residents would be willing to attend class twice
a week or less.
Employers, on the other hand, were most interested in courses being offered to employees
at the work site. About two-thirds of those responding to the survey (62.3%) indicated a desire
for courses being offered on site. Five of the six human resource directors responding to the
survey also indicated this as the means of instruction that would most meet their company's
education and training needs. However, approximately one-half of employers responding also
indicated strong interest in courses being offered to employees at off-site locations, as did many
of the human resource directors.
Cost to Students and Employers. Cost is clearly an important issue in considering how to
deliver course offerings to students and employers. In fact, among those high school juniors who
did not plan to immediately enroll in college after high school, cost was the most frequently cited
reason for this decision (25.8% of total cited this reason). Likewise, cost of instruction was the
MGT of America, Inc.Page 13
73
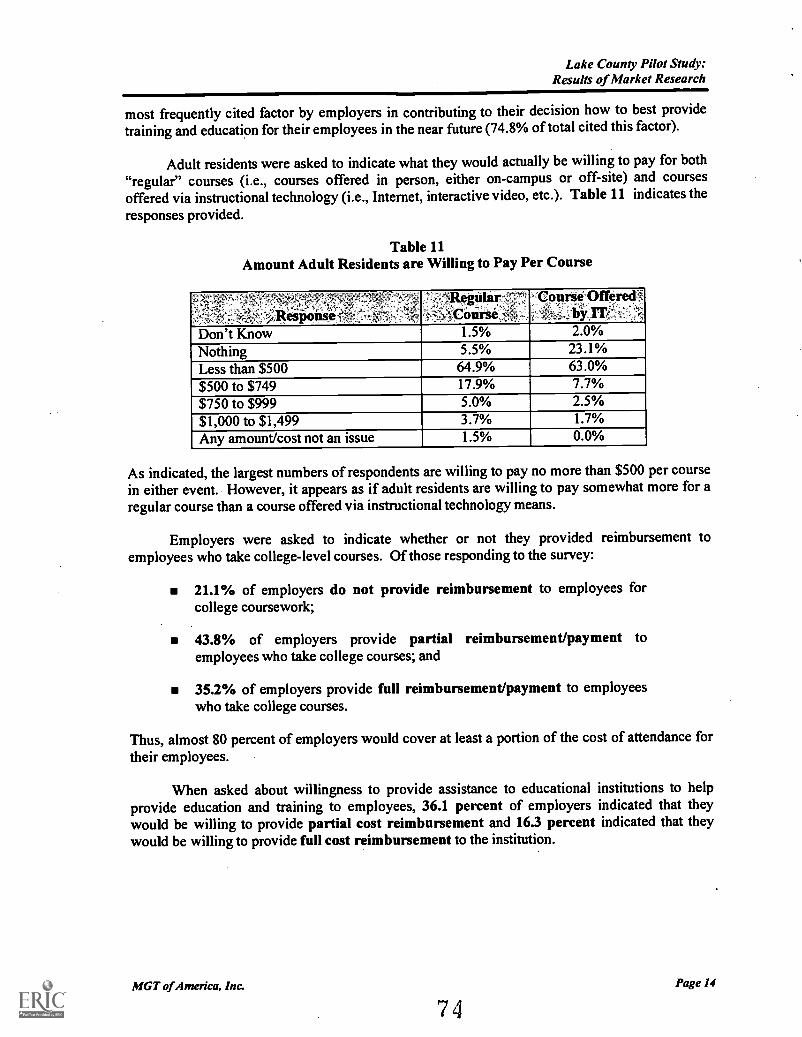
Lake County Pilot Study:Results of Market Research
most frequently cited factor by employers in contributing to their decision how to best providetraining and education for their employees in the near future (74.8% of total cited this factor).
Adult residents were asked to indicate what they would actually be willing to pay for both"regular" courses (i.e., courses offered in person, either on-campus or off-site) and coursesoffered via instructional technology (i.e., Internet, interactive video, etc.). Table 11 indicates theresponses provided.
Table 11Amount Adult Residents are Willing to Pay Per Course
esiionseRçguJarJCo
CourseofferedYrrt
Don't Know 1.5% 2.0%
Nothing 5.5% 23.1%Less than $500 64.9% 63.0%
$500 to $749 17.9% 7.7%$750 to $999 5.0% 2.5%$1,000 to $1,499 3.7% 1.7%Any amount/cost not an issue 1.5% 0.0%
As indicated, the largest numbers of respondents are willing to pay no more than $500 per coursein either event. However, it appears as if adult residents are willing to pay somewhat more for aregular course than a course offered via instructional technology means.
Employers were asked to indicate whether or not they provided reimbursement toemployees who take college-level courses. Of those responding to the survey:
21.1% of employers do not provide reimbursement to employees forcollege coursework;
43.8% of employers provide partial reimbursement/payment toemployees who take college courses; and
35.2% of employers provide full reimbursement/payment to employeeswho take college courses.
Thus, almost 80 percent of employers would cover at least a portion of the cost of attendance fortheir employees.
When asked about willingness to provide assistance to educational institutions to helpprovide education and training to employees, 36.1 percent of employers indicated that theywould be willing to provide partial cost reimbursement and 16.3 percent indicated that theywould be willing to provide full cost reimbursement to the institution.
MGT of America, Ina Page 14
7 4

Lake County Pilot Study:Results of Market Research
What are Employers Willing to do in Order to Respond to Unmet Needs for HigherEducation in Lake County?
Employers were asked two questions regarding what they would be willing to do in theway of incentives and assistance for both employees and educational providers in order to meetthe higher education needs of their employees:
What kinds of incentives will you be able to provide over the next two tothree years to your employees for additional training and education?
What kind of assistance and incentives would you be willing to providewithin the next two to three years to educational institutions in providingadditional education and training to your employees?
Of those employers responding to the survey, 79 percent either provide full or partialreimbursement to employees who take college-level courses.
Table 12 shows how employers responded regarding the types of incentives they would bewilling to provide if their employees engaged in additional education and training.
Table 12Employer Willingness to Provide Selected Incentives to Employees
t *;
g
,,, vit. incentiv e ,.,,:, ,
*1.00 'okg:1#146)*-0:'i *lit Atr4rme--
ikeefilthie":
Release Time from Work 39.5%Leaves of Absence 12.2%Tuition Reimbursements 75.5%Subsequent Promotion 42.9%Subsequent Salary Increase 51.0%Other 4.1%
Not surprisingly, the incentive most commonly noted was tuition reimbursements. A sizablenumber of employers responding were also willing to provide subsequent salary increases andpromotions to employees as well as release time from work.
Table 13 shows how employers responded regarding the types of incentives or assistancethey would be willing to provide to educational institutions providing additional education andtraining to their employees. As indicated, employers appear to be more willing to provide "inkind" assistance than direct financial support to educational institutions. Almost two-thirds ofemployers responding would be willing to provide educational institutions with the use of on-siteinstructional space. A sizable ntimber of respondents were also willing to provide the use ofcompany equipment and professional staff expertise. A lower percentage of respondents werewilling to provide partial or full cost reimbursement.
MGTof America, Inc. 7 5
BEST COPY AVAILABLE
Page 15

Lake County Pilot Study:Results of Market Research
Table 13Employer Willingness to Provide Selected Incentives and Assistance
To Educational Institutions
, 4
Incentwei
. Tereent:OfEmtiloyeriWilling ,toProyide.
4centive:- .
Use of Company Equipment 46.9%
Use of On-Site Instructional Facilities 63.3%
Professional Staff Expertise (e.g., adjunctinstructors)
45.6%
Partial Cost Reimbursement 36.1%
Full Cost Reimbursement 16.3%
Other 2.0%
Summary of the Market Research
The results from the market research conducted in Lake County indicated interest in highereducation that is predictably segmented according to various groups surveyed. Specifically, theresearch revealed the following key findings:
Adult residents in the survey who have strong interest in participating inhigher education are also very likely to want to work toward a degree orcertificate as opposed to just taking courses, both at the bachelor's and
master's levels. These individuals also indicated a strong interest ineducational options that would fit within work and family responsibilities.
Employers responding to the survey indicated very specific or targetedhigher education needs. Employers were most interested in offeringcourses to their employees in content areas relevant to the workplace:computer applications, information technology, business management, andbasic skills such as reading comprehension, math and communications. Ahigh percentage of those employers responding also currently providepartial or full tuition reimbursement to their employees and would bewilling to continue this practice in the future.
High school juniors indicated a strong level of interest in pursuing highereducation "away from home", although there were a sizable number whoalso indicated interest in educational options within commuting distance.A high percentage of these students also indicated that they would likely bepursuing a bachelor's degree.
Adult residents indicated a relatively strong level of interest in technology-based instruction.This is likely related to the flexibility offered by such instruction, which is appealing to working
adults. Employers and high school juniors participating in the study were somewhat lessinterested in technology-based instruction. For employers, this could be due to the anticipationthat such courses could be more costly to provide than traditional modes of instruction. The factthat employers were also not very willing to provide direct financial assistance to educational
MGT ofAmerica, Inc. Page 16
76

Lake County Pilot Study:Results of Market Research
institutions who provide education and training to employees indicates a concern over costs. For
high school juniors, the lower level of interest in technology-based instruction could be due to
their strong level of interest indicated in pursuing a more "traditional" college experience away
from home.
Implications of the Market Research for the Establishment of a Multi-Institutional Centerin Lake County
The results of this research have various implications for the Board of Higher Education indetermining the best way to meet the higher education needs of Lake County residents andemployers. The final section of this report assesses the implications of this research for a conceptcurrently being considered by the Board's pilot study subcommittee for meeting these needs: amulti-institutional center called the "University Center of Lake County". Specifically, thefollowing areas related to the development of this center are examined within the context of the
research:
Degree and Program OfferingsMode of InstructionLocationCourse SchedulingStudent Support Services
Overview of the Proposed Center. As currently conceived, the University Center of LakeCounty will facilitate and support the development and offering of new programs from highereducation institutions now serving the county and from other institutions who have qualityprograms that are needed in the county. It will focus, in particular, on offering convenient andaffordable education to meet the career and workforce needs of place-bound and working adults.Instruction will be offered at the baccalaureate degree completion and master's level,complementing the lower-division baccalaureate instruction currently provided to countyresidents by the College of Lake County (CLC). The Center will work in close association withcounty residents, as well as private and public organizations within the county. Facilities will beplanned and funded in cooperation with the Lake County Board.
The University Center will develop, organize and locate resources throughout the countyto meet the needs of county residents. Its facilities will contain lecture and seminar classrooms,as well as space for academic support such as computers and library materials. Courses will betaught by regular faculty from the higher education institutions serving the Center. Students willbe able to meet with academic advisers and have access to registration, financial aid, and othersupport services. Some of these services may be offered in cooperation with CLC.
A central responsibility of the University Center will be to offer coursework at locationsand in formats that are convenient to Lake County residents. When appropriate, technology will
be used to expand access to educational programming. On-site faculty will teach courses that willbe accessible via instructional technology to students at other sites in the county. Courseworkwill also be delivered directly to students at their home andplace of employment.
Implications of the Research for Degree and Program Offerings. The research indicates
support among adult residents in the county for the plan to offer baccalaureate-completion and
MGT ofAmerica, Inc.7 7
Page 17

Lake County Pilot Study:Results of Market Research
masters degree programs at the Center. These were the two most popular degree levels indicatedby those residents who were interested in pursuing a degree program.
In terms of program offerings, the primary area of interest among both residents andemployers appears to be in computer science and information technology. There is also someinterest in business- and education-related fields.
Implications of the Research for Mode of Instruction. The research indicates that countyresidents would support the multi-faceted approach to instructional delivery proposed for theCenter. Residents exhibited interest in instruction that would be delivered on-site, at home, andvia instructional technologies. Employers, on the other hand, seemed to be most interested ininstruction that was offered on-site and in person at the workplace. This suggests that it will beimportant for this Center to have a strong business outreach program.
Additionally, more than one-half (53.7%) of adults responding indicated that"flexibility"(defined in the interview as the ability for the student to learn at his or her own paceand schedule) would be of highest importance in making a decision to take a college-level course.Thus, it will be extremely important for the Center to provide a wide range of instructionaldelivery options for Lake County residents.
Implications of the Research for Location. The research indicates that it will beimportant for this Center to be centrally located within the county (both in terms of populationand geography), with good access to local transportation networks, including publictransportation. Almost nine out of ten respondents (86.1%) indicated that they would be willingto commute no more than a half-hour to take courses.
Implications of the Research for Course Scheduling. The research indicates that it willbe extremely important that there be adequate course offerings at times convenient for workingadults. More than one-half (55.8%) of respondents indicated that they would most prefer to takecourses on weekday evenings (Monday Friday, after 5:00 p.m.). The research also indicatedsome interest among adults in taking courses in the morning, with 22.6 percent indicating thatthey would most prefer to take courses on weekday mornings (Monday Friday, 8:00 a.m. tonoon). There was relatively little interest in course offerings at other times of the day or week.
Implications of the Research for Student Support Services. The adults interviewed wereasked to rate the importance of various educational and support services in making their decisionto take a college-level course from "lowest importance" to "highest importance". Table 14below illustrates the proportion of those adults responding who indicated that the followingsupport services would be of "highest importance".
As indicated, the largest percentage of respondents indicated that campus safety andsecurity were of "highest importance" in making their decision, followed by computer access.Access to advising and other student support services was indicated as "highest importance" byless than one-fifth of respondents. However, past research that we have conducted involvingadult learners indicates that once enrolled, access to such services is in fact seen as veryimportant. This is especially the case for adult learners who have been out of the collegeclassroom for several years, or who are first-time college students. Likewise, though notindicated as a high priority here, access to library services is generally seen to be important byadult learners pursuing graduate degrees.
MGT ofAmerica, Ina 78 Page 18

Lake County Pilot Study:Results of Market Research
Table 14Percent of Lake County Adult Residents Rating Selected Educational Service Areas as
"Highest Importance" in Deciding Whether to Take a College Course
..., .
tipptirtServieePerCentl.Ratftig,,, ,
:"HigliestIMpOrtance"Campus Safety and Security 61.1%
Access to Computers 41.6%
Availability of Parking 39.9%
Access to Library Services 36.4%
Access to Advising and Other Support Services 18.8%
Summary. Table 15 below summarizes the implications of the research for thedevelopment of the Center.
Table 15Implications of the Research for Developmentof the University Center of Lake County
(: ,;11110.4616000404ScaMkICir:-Uiversi :CenteifiLake'Ciiiiiti. ; . ,,
Degree and Program Offerings Need to offer baccalaureate and mastersprograms.
Highest demand is for computer science &information technology courses. Someinterest is indicated for business andeducation-related programs.
Mode of Instruction Adult residents are interested in "flexible"modei of instruction including thatdelivered on-site, at home, and viainstructional technologies.
Employers are most interested ininstruction offered on-site and in person atthe workplace.
Location The Center needs to be centrally located inthe county and near primary transportationnetworks
Course Scheduling Adult residents are most interested in
courses offered during weekday evenings(after 5:00 p.m.)
Student Support Services Adult residents placed "highestimportance" on campus safety & securityas well as computer access.
J:/1242/report/draft3.doc
MGT of America, Inc.
BEST COPY AVAILABLE7 3 Page 19

APPENDIX A
DESCRIPTIVE OVERVIEW OF LAKE COUNTYEMPLOYERS SURVEY
The following descriptive statistics are presented regarding the respondents to the survey
of Lake County Employers:
Total number of employees, company-widePercent of employees located in Lake CountyPercent distribution of respondents by industry typePercent distribution of employees among employee categories
EXHIBIT A-1NUMBER OF EMPLOYEES, COMPANY-WIDE
wei . :. kg,.
# otEmployesi." N,..N . .Numb Ot
Ittititibf41/44!'";" '3.1:fr,,4aaotall.Ah,
,
25 or Less 37 24.5%
26 to 50 19 12.6%
51 to 100 20 13.2%
101 to 250 44 29.1%
251 to 500 9 6.0%
501 to 1,000 9 6.0%
1,001 to 2,000 4 2.6%
More than 2,000 5 3.3%
No response 4 2.6%
Total 151 100.0%
EXHEBIT A-2PERCENT OF EMPLOYEES LOCATED IN LAKE COUNTY
.iircintOPEMOIOYOSw ke,cou '
:::
fetmes%4iube. eiTeMp
TagitqfLess than 20% 23 15.2%
21% to 40% 14 9.3%
41% to 60% 21 13.9%
61% to 80% S38 25.2%
81% to 100% 49 32.5%
No response 6 4.0%
Total 151 100.0%
BEST COPY AVAIIAlI LE
MGT of America, Inc. Page A-I
c60

Appendix A: Descriptive Overview ofEmployer Survey Respondents
EXHIBIT A-3DISTRIBUTION OF RESPONDENTS BY INDUSTRY TYPE
,
iiiit er-aereent:oC36tk
Agriculture & Mining - 0.0%
Construction 8 5.3%
Wholesale & Retail Sales 19 12.6%
Finance, Insurance, & Real Estate 4 2.6%
Manufacturing 37 24.5%
Transportation, Communications, & Public Utilities 3 2.0%
Services 44 29.1%
Government 24 15.9%
No response 12 7.9%
Total 151 100.0%
MGT ofAmerica, Inc. Page A-2

App
endi
x A
: Des
crip
tive
Ove
rvie
w o
fE
mpl
oyer
Sur
vey
Res
pond
ents
EX
HIB
IT A
-4PE
RC
EN
TA
GE
DIS
TR
IBU
TIO
N O
F E
MPL
OY
EE
SB
Y T
YPE
:,!)0
.00,
0:A
tip,o
ploy
fes-
4iii
i:Q
at.
(". '
)
,:::::
;:ark
inag
effi
eri.
:po
trow
now
ga-T
edtto
rean
.c, t
orio
u,,i,
'347
':'L
abbn
itEM
"4.1
;:if:
'Ilth
ia.Z
.:'A
i r.li
.4.g
etiv
,44.
'MC
At '
''k'f'
..M
It-M
VE
#e
Air
'fW
,','
ItrLe
ss th
an 2
0%12
582
.8%
8254
.3%
108
71.5
%11
475
.5%
8355
.0%
114
75.5
%
21%
to 4
0%7
4.6%
2617
.2%
149.
3%14
9.3%
117.
3%2
1.3%
41%
to 6
0%5
3.3%
149.
3%7
4.6%
138.
6%17
11.3
%4
2.6%
1.3%
;61
% to
80%
21.
3%20
13.2
%4
2.6%
32.
0%20
13.2
%2
81%
to 1
00%
10.
7%3
2.0%
42.
6%0
0.0%
64.
0%3
2.0%
No
ReS
pons
e11
7.3%
64.
0%14
9.3%
74.
6%14
9.3%
2617
.2%
Tot
al15
110
0.0%
_15
1_10
0.0%
151
100.
0%15
110
0.0%
_15
110
0.0%
_15
1_10
0.0%
,
8 P
MG
T o
f A
mer
ica,
Inc
.
BE
STC
opy
AV
AIL
AB
LE
8 3 Pa
ge A
-3
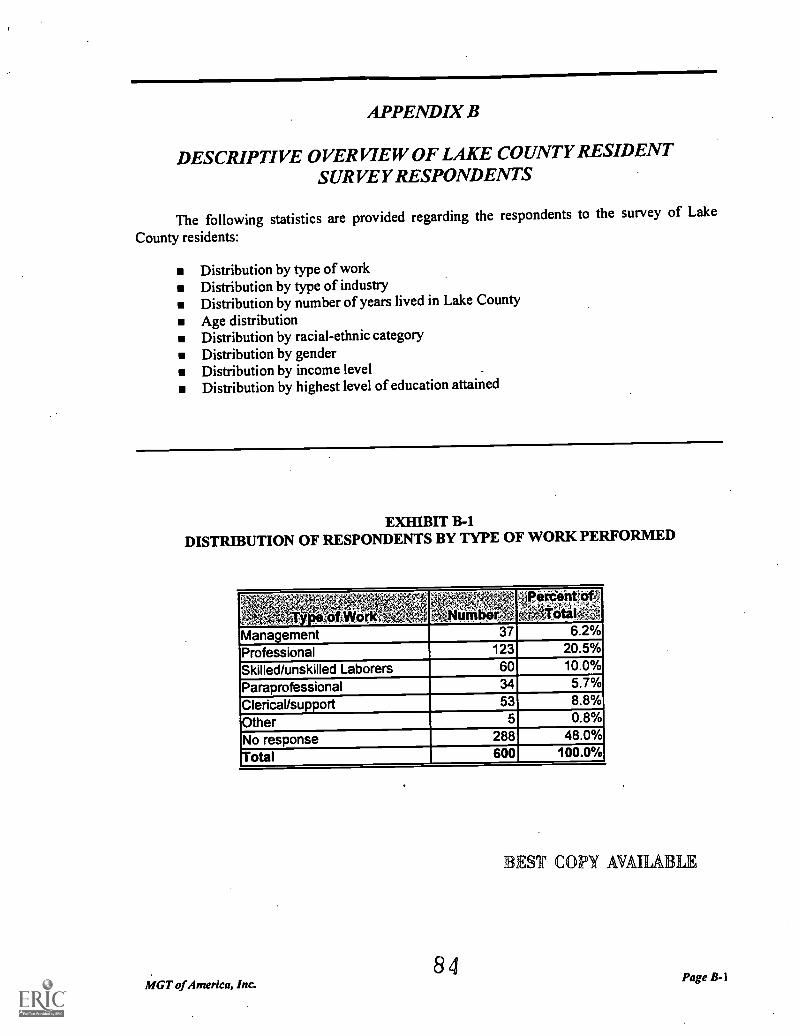
APPENDIX B
DESCRIPTIVE OVERVIEW OF LAKE COUNTY RESIDENTSURVEY RESPONDENTS
The following statistics are provided regarding the respondents to the survey of Lake
County residents:
Distribution by type of workDistribution by type of industryDistribution by number of years lived in Lake County
Age distributionDistribution by racial-ethnic categoryDistribution by genderDistribution by income levelDistribution by highest level of education attained
EXHIBIT B-1DISTRIBUTION OF RESPONDENTS BY TYPE OF WORK PERFORMED
4 °
OWcirl(.."..,
Number;',Rereelltitir.1*.w.,:::,olfo,oral
Management 37 6.2%
Professional 123 20.5%
Skilled/unskilled Laborers 60 10.0%
Paraprofessional 34 5.7%
Clerical/support 53 8.8%
Other 5 0.8%
No response 288 48.0%
Total 600 100.0%
BEST COPY AVAIIABLE
8 4AIGT ofAmerica, Inc.
Page B-1

Appendix B: Descriptive Overview ofResident Survey Respondents
EXHIBIT B-2DISTRIBUTION OF RESPONDENTS BY INDUSTRY
rifts, ,,um e ,
eicentO .
...--,,,,,,s ,..-, To
Agriculture & Mining 3 0.5%
Construction 18 3.0%
Wholesale & Retail Sales 40 6.7%
Finance, Insurance, & Real Estate 28 4.7%
Manufacturing 30 5.0%
Transportation, Communications, & Public Utilities 9 1.5%
Services 164 27.3%
Government 20 3.3%
No response 288 48.0%
Total 600 100.0%
EXHIBIT B-3DISTRIBUTION OF RESPONDENTS BY YEARS RESIDED IN LAKE COUNTY
MGT of America, Inc.
-,YeaisliiitalaCCOtin ,I.NumbOr zt!ZPerceut:o1;:l
4iiiiial5 or Less 166 27.7%
6 to 10 Years 114 19.0%
11 to 20 Years 121 20.2%
21 to 40 Years 151 25.2%
More than 40 Years 48 8.0%
Total 600 100.0%
EXHIBIT B-4DISTRIBUTION OF RESPONDENTS BY AGE
tatilistifoliiirw :aofNUMber._ Oielic
21 to 25 41 6.8%
26 to 30 63 10.5%
31 to 40 148 24.7%
41 to 50 160 26.7%
51 to 60 93 15.5%
More than 60 67 11.2%
No Response 28 4.7%
Total 600 100.0%
65Page B-2

Appendix B: Descriptive Overview ofResident Survey Respondents
EXHIBIT B-5DISTRIBUTION OF RESPONDENTS BY RACIAL-ETBNIC CATEGORY
, Atii 0 ; 1 um .
'4PettentOtfilital;c4
White 507 84.5%
African American 37 6.2%
Hispanic 17 2.8%
Asian American 15 2.5%
Native American 2 0.3%
No Response 22 3.7%
Total 600 100.0%
EXHIBIT B-6DISTRIBUTION OF RESPONDENTS BY GENDER
AiGritidet ; . NOtntierTOfall.f...L;t1o,tit
Male 200 33.3%
Female 400 66.7%Total 600 100.0%
EXHIBIT B-/DISTRIBUTION OF RESPONDENTS BY INCOME LEVEL
-199flncomeLevelui'
NovitliiiiC, 4'iPerk-C-Ittk°f4
Tiiitali,Under $15,000 28 4.7%
$15,000 to $24,999 37 6.2%
$25,000 to $34,999 54 9.0%
$35,000 to $49,999 71 11.8%
$50,000 to $74,999 99 16.5%
$75,000 to $99,999 80 13.3%
$100,000 or More 100 16.7%
No response 131 21.8%
Total 600 100.0%
MGT of America, Inc. 8
BEST COPY AVAILABLE
Page B-3

Appendix B: Descriptive Overview ofResident Survey Respondents
EXHIBIT B-8DISTRIBUTION OF RESPONDENTS BY
HIGHEST LEVEL OF EDUCATION ATTAINED
NW '1' 4
ducatIonaI AttAInment Tc, , .-,,,
, i -
titilier; PirPrtV,ttiP
49,tals.No High School Diploma 16 2.7%,High School Diploma/GED 111 18.5%-Some College, No Degree 121 20.2%Less than 2-Year Certificate 16 2.7%Associate Degree 48 8.0%Bachelors Degree 165 27.5%Masters Degree 86 14.3%Doctorate 13 2.2%Professional Degree (MD, JD, etc.) 9 1.5%No response 15 2.5%Total 600 100.0%
8 7
MGT ofAmerica, Inc. Page B-4

APPENDIX C
DESCRIPTIVE OVERVIEW OF LAKE COUNTYHIGH SCHOOL JUNIOR SURVEY RESPONDENTS
The following descriptive statistics are presented regarding respondents to the survey ofLake County high school juniors:
Distribution by racial-ethnic categoryDistribution by gender
EXHIBIT C-1DISTRIBUTION OF RESPONDENTS BY RACIAL-ETHNIC CATEGORY
4, Ce oy ,,,p,
uinberoATereeitittofe01..a,c,,"40".. -46'
togYItal:,,A',White 880 83.5%
African American 12 1.1%
Hispanic 32 3.0%
Asian American 62 5.9%
Native American 8 0.8%
Other 31 2.9%No Response 29 2.8%Total 1,054 100.0%
MGT of America, Inc.
EXHIBIT C-2DISTRIBUTION OF RESPONDENTS BY GENDER
1
40.0.41101'N.
..
N. bet4exeS:9, qt°I;
!1aiii4_Male 536 50.9%Female 499 47.3%No Response 19 1.8%
Total 1,054 100.0%
BEST COPY AVAIIA LE
8 9 Page C-I

U.S. DEPARTMENT OF EDUCATIONOffice of Educational Research and improvement (OERI)Educational Resources Information Canter (ERIC)
NOTICE
REPRODUCTION BASIS
o
ERIC
This document is covered by a signed "Reproduction Release(Blanket)" form (on file within the ERIC system), encompassing allor classes of documents from its source organization and, therefore,does not require a "Specific Document" Release form.
This document is Federally-funded, or carries its own perrnission toreproduce, or is otherwise in the public domain and, therefore, maybe reproduced by ERIC without a signed Reproduction Releaseform (either "Specific Document" or "Blanket").