Embed Size (px)
Citation preview

GAVIN NEWSOM, Governor WADE CROWFOOT, Secretary for Natural Resources
1
Blue Ribbon Committee for the Rehabilitation of Clear Lake
2019 Report to the Governor and California State Legislature
Annotated Draft Outline for Committee Revision
September 20, 2019 Section 1: Background Clear Lake is one of the top two contributors to the local Lake County economy, according to the 2016 Lake County Comprehensive Economic Development Strategy, which cites the lake as “the cornerstone of the local visitor and recreation markets,” mainly through boating and bass fishing tourism.1 It is essential to the traditional cultural resources and economies of the seven federally recognized tribes of the area; the condition of the lake affects the safety of traditional ceremonies, as well as fishing and consumption of fish in accordance with tribal customs. Clear Lake is the oldest species-rich, warm water, natural lake in North America. It supports the surrounding ecosystems of native plants and animals, as well as species introduced by the Department of Fish and Wildlife. Clear Lake and the surrounding environment are also a home to endangered and rare animal species. However, the lake also experiences environmental challenges such as harmful algal blooms and mercury contamination from legacy mining issues. In light of the environmental challenges facing Clear Lake and Lake County, Assembly Bill (AB) 707 (Aguiar-Curry, 2017) was passed by the California Legislature (Legislature) and signed by Governor Jerry Brown to create a Blue Ribbon Committee (Committee) to develop strategies to clean up Clear Lake and revitalize local economies dependent on the health of the Lake. AB 707 places the Committee under the management of the California Natural Resources Agency (Resources), with the Resource Secretary or designee serving as Committee Chair. Additionally, the Legislature appropriated $5 million in Proposition 68 funding for Clear Lake-specific capital improvement projects to improve conditions in the lake. The Committee will play a significant role in determining appropriate projects for funding. This report represents the first annual report to Governor Gavin Newsom and appropriate committees within the Legislature as required by AB 707. AB 707 specifically requires annual reports to identify barriers to improved water quality in Clear Lake, the contributing factors causing poor water quality, and the threats to wildlife. The report must include recommendations on solutions to these issues, estimates of cost,
1 https://www.lakecountyca.gov/Assets/Departments/Economic+Development/Docs/2016+CEDS+Report.pdf?method=1
GAVIN NEWSOM, Governor WADE CROWFOOT, Secretary for Natural Resources
2
and a plan for involving the local, state, and federal governments in funding for and implementation of lake restoration activities. The Committee is a multi-year process; this report outlines several introductory recommendations designed to address the challenges noted above, beginning with a robust data collection effort to ensure future environmental and socioeconomic recommendations are based on the most up-to-date analysis possible. Section 2: Committee Process and Progress to Date Committee Launch Resources launched the Committee effort in June 2018 by requesting applications from local County and tribal representatives in accordance with AB 707, including:
• A representative from the University of California (appointed by the Chancellor of the University)
• One member of the Board of Supervisors from Lake County or their designee
• Representatives from tribes impacted by Clear Lake, appointed by their respective tribal councils
• The Resources Secretary or their designee
• A represented of the Central Valley Regional Water Quality Control Board (Regional Water Board), appointed by its board
• An expert from each of the follow areas, appointed by the Lake County Board of Supervisors:
o Local economic development o Agriculture o Environment o A public water supplier drawing its water supply from Clear Lake
A full list of the current membership of the Committee is available in Appendix A. Resources contracted with the Sacramento State University College of Continuing Education Consensus and Collaboration Program (CCP) in August of 2018 to provide neutral facilitation and process management services for the Committee. CCP works closely with Resources and Committee membership to design agendas, facilitate all Committee meetings, carry out routine negotiations between members over recommendations, and ensure all outreach meets the requirements of the Bagley Keene Open Meetings Act. Resources formally convened the Committee process at a meeting on October 10, 2018. This meeting was used to provide background on AB 707, explain the charge of the Committee, and discuss parallel research processes intended to develop up-to-date environmental and social science information on Clear Lake and the surrounding area.

GAVIN NEWSOM, Governor WADE CROWFOOT, Secretary for Natural Resources
3
Finally, the UC Davis Tahoe Environmental Research Center (TERC) was selected to lead a research effort on the health of the lake, factors contributing to environmental challenges, and develop a 3-D hydrodynamic model of Clear Lake. UC Davis’s Center for Regional Change (CRC) was selected to lead the socioeconomic research effort. These efforts run in parallel to, but are separate from, the Committee effort. Research from both entities will inform the Committee’s work in the future. Additional information on both research projects is described below. TERC Information TERC is charged with researching the dominant processes in the Clear Lake watershed and in the lake itself that are negatively impacting the rehabilitation of the lake water quality and ecosystem health. The data acquisition that will be needed will form the basis of a long-term monitoring strategy to measure status and trends in the future. A set of numerical models, calibrated and validated with these data, will be developed to inform local and State decision-making. The Committee’s recommendations in Section 4 below are intended to compliment and build upon TERC’s research, and to fill in data gaps not captured in its existing scope. Final research outcomes are expected at the end of 2020; an overview of TERC’s progress to date, known data deficiencies, and next steps are summarized in Appendix B. This is a standalone work product developed outside of the Committee process. CRC Information CRC is charged with research barriers to socioeconomic improvement in Lake County. Through a series of community workshops and other outreach activities, CRC will provide recommendations for improving the Lake County economy, including broadband investments and vocational training. A summary of CRC’s progress to date and next steps is included in Appendix C. This is a standalone work product developed outside of the Committee process. Committee Process to Date Beginning with the project launch meeting, the full Committee met a total of eight times in 2018 and 2019. The table below includes the meeting schedule and a brief summary statement of topics discussed at each session. Complete summaries, as well as video and/or audio recording of each meeting are available online at www.resources.ca.gov/clear-lake.
Meeting Date Summary
October 10, 2018
December 20, 2018

GAVIN NEWSOM, Governor WADE CROWFOOT, Secretary for Natural Resources
4
February 12, 2019
March 13, 2019
June 5, 2019
August 15, 2019
September 26, 2019
December 10, 2019 Table 1: 2018/19 Committee Schedule and Outcomes
Technical Subcommittee Process to Date In February 2019, the Committee directed CCP to convene a Technical Subcommittee (Subcommittee) made up of local and regional scientific experts to provide a menu of recommendations for its consideration. The Committee determined focusing on technical, environmental recommendations was an appropriate starting point to meet the charge of AB 707 in 2019. Future subcommittees, including a socioeconomic subcommittee, will be convened to review these environmental recommendations, and ensure all recommendations have a positive impact on communities dependent on Clear Lake for economic, cultural, or public health purposes. The Subcommittee met a total of (ENTER FINAL NUMBER OF MEETINGS) in 2019. The table below includes a meeting schedule and brief summary of topics discussed during each session. Complete summaries and audio recordings of each meeting are available online at www.resources.ca.gov/clear-lake.
Meeting Date Summary
April 19, 2019
May 17, 2019
July 9, 2019
Section 3: Barriers to Improving Water Quality and Threats to Wildlife For 2019, the Committee and Technical Subcommittee opted to focus on the causes of harmful algal blooms (HABs) from cyanobacteria, as well as elevated methyl mercury levels. Combined, HABs and elevated mercury levels both pose significant threats to water quality, wildlife, and public health. Specific barriers to water quality and threats to wildlife identified by the Committee and TERC’s research to date are outlined in detail below.
Commented [SM1]: To be updated for final report
Commented [SM2]: To be updated in final report.

GAVIN NEWSOM, Governor WADE CROWFOOT, Secretary for Natural Resources
5
While lists of water quality challenges can be readily compiled, the greatest barrier to
improvement is the absence of quantitative data on the response of the system to
investments in specific restoration projects. Acquiring quantitative data requires
completing four fundamental tasks:
1) Quantifying the processes that contribute to poor water quality, i.e. data collection;
2) Accurately predicting the lake response to environmental forcings, including the
extent of the current water quality challenges, i.e. model development;
3) Quantitatively evaluating the impacts, the costs, and unintended consequences of
implementing particular projects and strategies, i.e. scenario development; and,
4) Quantitatively evaluating the consequences and costs of the “no action”
alternative, with the inclusion of the likely impacts of climate change, i.e. future
forecasting.
Past research, together with the experiences of residents and stakeholders at Clear Lake,
has made it possible to identify many of the challenges facing the lake that these four
tasks will address. These include:
• Lake water temperatures are increasing globally, and is likely the case at Clear Lake
too. Aside from the direct effect of higher temperatures on metabolic and reaction
rates, the most important consequence of this is expected to be an increase in the
duration of periods of thermal stratification. Mixing or turnover events may be less
effective and frequent. This trend cannot be prevented by local action as it is
happening on a regional scale, but all planning needs to explicitly take this into
account.
• Episodic low dissolved oxygen (DO) events in the deep water are known to occur,
producing fish kills, release of nutrients through a phenomenon known as “internal
loading”, release of heavy metals including mercury to the food web, and the formation
of noxious odors. With climate warming, there are likely to be more extended periods
of low DO, with a corresponding increase in water quality degradation. There are
engineering solutions to addressing low DO, but the extent of the problem needs to
be quantified in order to make these solutions feasible and cost-effective.
• Identifying the relative contribution of nutrient inputs (both phosphorus and nitrogen,
P and N) through both external and internal loading. External loading can be increased
by agricultural fertilizer addition, grazing, erosion due to poor land management or
wildfire, increases in impervious land cover due to population growth, destruction of
wetlands, etc. Internal loading is caused by low DO in the lake. Quantifying the
sources of nutrients, their seasonal variability, and partitioning the loading rates (both
internal and external) are key to selecting the most appropriate solutions to Clear
Lake’s eutrophication problem.
GAVIN NEWSOM, Governor WADE CROWFOOT, Secretary for Natural Resources
6
• Increasing frequency, biomass, duration and distribution of both algal blooms and
cyanobacterial blooms. Cyanobacterial blooms create risks to human and animal
health, increase the costs for water treatment, contribute to a negative perception of
the region leading to losses in tourism, property values, and business. Factors that
may favor the cyanobacterial dominance include:
o Episodic low DO events in the deep waters, leading to nutrient release and
alterations in the food web;
o Increased nutrient inputs from the watershed; and,
o Rising water temperatures.
The first two factors lend themselves to a number of restoration projects. Warming
temperatures need to be accounted for in the design of these projects.
• High mercury levels due to both the watershed inputs, the existing sediment load, and
potentially ongoing input from the Sulphur Bank mercury mine. Understanding the
mercury cycle in the lake is currently an active area of research at Clear Lake by the
USGS. There are a range of engineering options for controlling mercury release to the
water and the food web.
• Shift between a clear state with macrophyte dominance and turbid phytoplankton-
dominated state. Native macrophytes stabilize clear-water conditions by reducing
resuspension, increasing sedimentation, providing habitat for fish, and suppressing
phytoplankton growth (nutrient competition). When the nutrient concentrations in the
water are very high, the submerged and emergent native vegetation can be lost and
the turbidity of the water increases. As a result, the buffering capacity of the ecosystem
to external stressors is reduced. The current state of Clear Lake waters based on the
limnological parameters is being assessed.
The threats to wildlife are intimately linked to the water quality condition of the lake. While
some of the threats may be independent of the eutrophic status of the lake, a better
understanding of the relations between watershed and lake processes will be essential
when addressing these and other threats. Some of the threats include:
• Tule perch loss due to herbicide use;
• Episodic low dissolved oxygen, pH, and NH3-NH4, which may cause fish kills;
• Extensive periods of “fish habitat compression”, occurring when low DO deep waters
and high surface temperatures reduce the fish habitat;
• The dominance of non-native fish, which may modify nutrient cycling, cause habitat
loss and be more dominant in the food chain as compared to non-native species;
• Native fish such as Clear Lake hitch (Lavinia exilicuada) loss due to multiple stressors,
including loss of spawning habitat, water diversions, and barriers to passage; and,
• The introduction of new aquatic invasive species such as Quagga mussels. While
Quagga mussels are not currently in the lake, and all efforts are being taken to prevent

GAVIN NEWSOM, Governor WADE CROWFOOT, Secretary for Natural Resources
7
their establishment in the lake, the change in a broad suite of factors tends to
increasingly disadvantage native species while at the same time creating niches for
species that may previously not have survived in Clear Lake.
Section 4: 2019 Committee Recommendations Throughout 2019, the Committee and Technical Subcommittee developed a series of recommendations designed to provide the most up-to-date analysis of Clear Lake and its surrounding watersheds available. Beginning in 2020, the Committee will use this information to develop specific actions to address the challenges in Section 3 above. The items below represent consensus from the Committee. A complete list of recommendations developed during brainstorming sessions with the Technical Subcommittee is provided in Appendix D. The current list of recommendations garnering the most support include:2
1. LiDAR flight of entire Clear Lake watershed 2. Bathymetric survey of Clear Lake 3. Satellite imagery and analysis to review nutrient hot spots in Clear Lake and the upper
watershed 4. Stream gauges and consistent monitoring of upper watershed and urban sources 5. Upper watershed modeling 6. Analysis of existing Clear Lake data and compilation in an accessible unified database, with
database management staff 7. Public assessment of perception of Clear Lake water quality issues 8. Review of the implementation and efficacy of existing tribal, local, state, and federal programs,
BMPs, and other management requirements in the Clear Lake Basin. 9. Conduct activities to expedite portions of the Middle Creek Restoration Project
1. LiDAR flight of entire Clear Lake watershed: LiDAR uses light rays to create a very detailed
understanding of topography. A LiDAR scan was done of the Clear Lake basin in 2016 a newer, higher resolution flight would provide important information on the scale of erosion throughout the watershed, and where pollutants are most likely to enter the Lake. This is particularly important in light of major fires significantly altering upland and upper watershed areas throughout the Clear Lake watershed, leading to a potential increase of erosion.
• Cost Estimate:
• Funding Recommendation:
2. Bathymetric Survey of Clear Lake: Conducting a bathymetric survey of Clear Lake is essential for
understanding myriad lake processes and is not included in the current TERC contract. UC Davis
2 This list will be prioritized based on Committee input in advance of the December 11, 2019 Committee meeting.
Commented [SM3]: Re-order based on prioritization exercise currently under way.

GAVIN NEWSOM, Governor WADE CROWFOOT, Secretary for Natural Resources
8
staff note that monitoring for nutrients and oxygen at locations throughout the lake can be off by 10-20% absent up-to-date bathymetric data. The US Geological Survey (USGS) is commencing a study on volcanic eruption potential in the region, and US EPA is interested in bathymetric data near the Sulphur Bank mine, so there is a shared need for that data. Knowledge of what sediments are in what locations at the bottom of the lake would have significant modeling and management impacts. Like the LiDAR survey, new bathymetric data could be compared to old data to show change over time.
•
• Cost Estimate:
• Funding Recommendation:
3. Satellite Survey of Clear Lake: A full satellite study similar to the 2012 effort for Clear Lake could
outline the key stream contributors of sediment to the lake and provide important imaging information for the drivers of HABs, including nutrient sources and concentrations. UC Davis receives data from the Geostationary Operational Environmental Satellite (GOES)-17 Satellite launched in November 2018 and collects data along the entire western seaboard. The data for the Clear Lake Region is available but would need funding and resources to be processed.
• Cost Estimate:
• Funding Recommendation: 4. Stream gauges, water quality sampling, and consistent monitoring of upper watershed: Consistent
monitoring, including the installation of new stream gauges, and a robust water quality sampling regime, is important for understanding nutrient and sediment sources. Although a number of climate stations and stream gauges are used throughout the Clear Lake basin, a lack of gauges/sampling results in data gaps at stream confluences near the Lake and in the upper watershed. Additionally, more robust monitoring and sampling will help “ground truth” remote survey and sensing from LiDAR flights and satellite imagery.
• Cost Estimate:
• Funding Recommendations: SB 19 (Dodd, 2019) may be a potential funding vehicle if chaptered.
5. Upper watershed modeling: Models are a mathematical approximation of physical hydrologic and hydrodynamic processes. They are powerful software tools that integrate both measured and observed hydrologic data and provide estimates within data gap areas. These models are highly organized and synthesize multiple related activities and hydrologic processes such as rainfall, sheet flows/runoff, surface water flows, and sediment discharges. In the case of Clear Lake, an upper watershed can be developed to show where flows lead to significant sediment discharge, and how management activities can alter sediment or nutrient sources entering the lake. The 2001 TERC Lake Tahoe model is an example of testing assumptions against observed and modeled sedimentation sources and resulted in shifting management activities from forested to urban areas. This has resulted in a significant net water quality improvement and reversed a decades-long trend of worsening clarity in the lake.
• Cost Estimate:
• Funding Recommendations:

GAVIN NEWSOM, Governor WADE CROWFOOT, Secretary for Natural Resources
9
6. Analysis of existing Clear Lake data and compilation in an accessible unified database, with database management staff: There is a wealth of information about Clear Lake, but most of it has not been analyzed. There is a suggestion to create a full time staff position to collect all of that data, as well as new data, in a unified data base, and to analyze this existing data as-needed. This could be a significant resource for modeling and lake management efforts. There are many large-scale central data hubs like this that could be used as examples. TERC is grappling with a large database on Lake Tahoe and can advise on challenges they have faced.
• Cost Estimate:
• Funding Recommendations: 7. Public assessment of perception of Clear Lake water quality issues: The assessment seeks to
understand public perceptions of water quality and identify behaviors associated with negative or positive impacts. This will help the Committee and subcommittees know how to have the most positive impact to garner future support. It has never been done before and could include a second post-assessment survey five years later. Through strategic questionnaire distribution to the public, assess the public’s current perceptions and attitudes towards water quality in Lake County, including Clear Lake. Results from this effort will better inform management efforts and quantify how the public’s attitudes and perceptions may be driving behaviors that both negatively and positively impact water quality. With information gathered from this project, managers can better focus educational and outreach efforts towards the public and can better communicate how management or policy practices, like those produced by the Blue Ribbon Committee and other efforts, can be beneficial for the rehabilitation of Clear Lake.
• Cost Estimate: County of Lake Water Resources Department estimates a total budget of $40,000.
• Funding Recommendation:
8. Review of the implementation and efficacy of existing tribal, local, state, and federal programs, BMPs, and other management requirements in the Clear Lake Basin: A review of local, state, tribal, and county ordinances and of how and why they are or are not being implemented or enforced could help guide future management activities and inform modeling efforts.
• Cost Estimate:
• Funding Recommendations:
9. Expedite the Middle Creek Restoration Project: The Middle Creek Restoration Project is a large, long-term, and complex effort, but is expected to address a significant contributor of nutrient loads in Clear Lake. To expedite the Project, the Technical Subcommittee discussed:
Section 5: Proposed 2020 Workplan
Commented [SM4]: Placeholder to be updated based on 9/26 and 12/11 Committee meeting outcomes
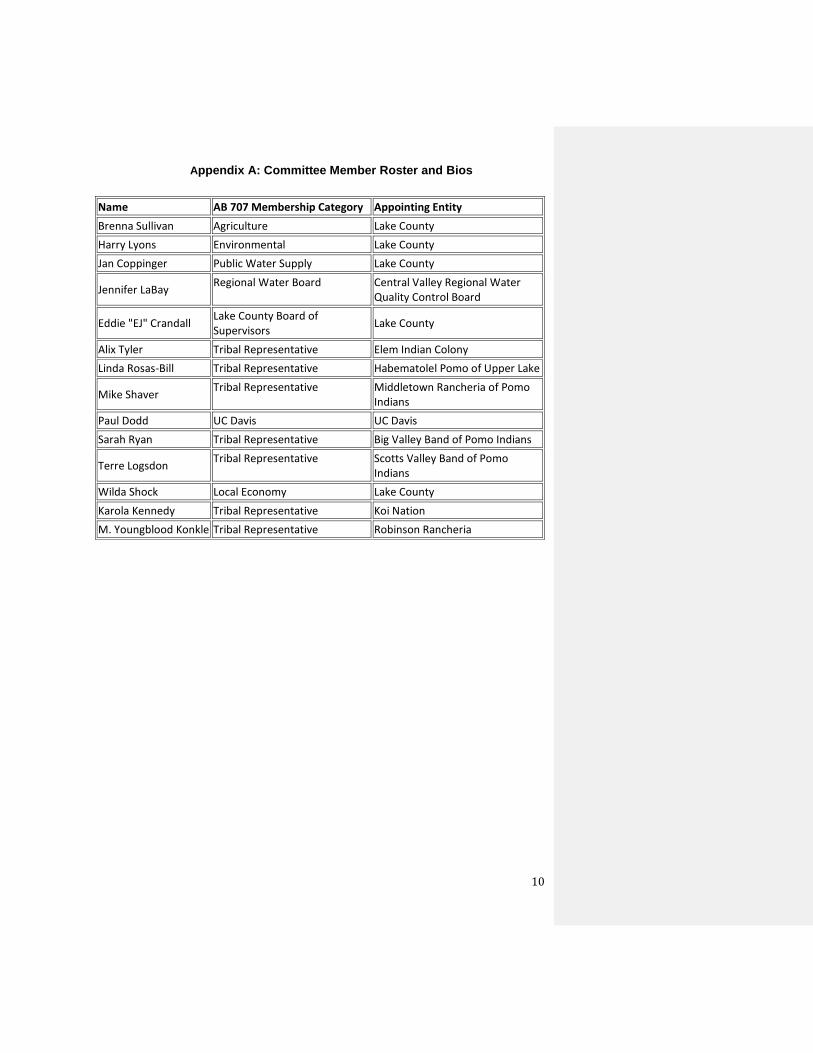
Appendix A: Committee Member Roster and Bios
10
Name AB 707 Membership Category Appointing Entity
Brenna Sullivan Agriculture Lake County
Harry Lyons Environmental Lake County
Jan Coppinger Public Water Supply Lake County
Jennifer LaBay Regional Water Board Central Valley Regional Water
Quality Control Board
Eddie "EJ" Crandall Lake County Board of Supervisors
Lake County
Alix Tyler Tribal Representative Elem Indian Colony
Linda Rosas-Bill Tribal Representative Habematolel Pomo of Upper Lake
Mike Shaver Tribal Representative Middletown Rancheria of Pomo
Indians
Paul Dodd UC Davis UC Davis
Sarah Ryan Tribal Representative Big Valley Band of Pomo Indians
Terre Logsdon Tribal Representative Scotts Valley Band of Pomo
Indians
Wilda Shock Local Economy Lake County
Karola Kennedy Tribal Representative Koi Nation
M. Youngblood Konkle Tribal Representative Robinson Rancheria

Appendix B: UC Davis Tahoe Environmental Research Center Outcomes and Next Steps
11
UC Davis (TERC) Lake Monitoring and Modeling Progress
3.1. Project Objectives – Following the fundament tasks required to improving the water quality
in Clear Lake, we aim to understand the dominant processes in the lake watershed and in the
lake itself that are negatively impacting lake water quality and ecosystem health. In addition,
we will be developing the modeling tools to allow for the evaluation of the effectiveness of
specific restoration strategies.
The data acquisition that we are conducting will form the basis of a long-term
monitoring strategy to measure status and trends in the future
(https://ucdclearlake.wixsite.com/cldashboard). A set of numerical models, calibrated and
validated with these data, will be developed to inform local and state decision-making.
3.2. Data Acquisition – We are currently measuring meteorological conditions, stream properties,
and lake physico-biogeochemical properties at Clear Lake (Fig. 1).
3.2.1. Meteorology – Seven meteorological stations have been installed around the shoreline of
Clear Lake on private docks and buildings to characterize the spatially and temporally
varying meteorology around the lake (Fig. 1). We are measuring air temperature, relative
humidity, solar radiation, rain, wind speed and direction every 15 minutes with Davis
Instruments Wireless Vantage Pro2 Plus meteorological stations. Data are accessible in real-
time. As an example, wind roses from the seven stations are shown in Fig. 1, which confirm
the across lake variability of the wind field. Meteorological data are a fundamental driver of
lake motions and warming.
3.2.2. Stream properties - Turbidity sensors and Campbell Scientific data loggers have been co-
located with Department of Water Resources (DWR) gauging stations at three locations on
inflowing creeks (Kelsey, Middle, and Scotts, Fig. 1). Data are recorded and transmitted to
the Cloud every 10 min, providing real-time stream properties. Our continuous stream
turbidity measurements captured the large sediment loads occurring during the rainy season
early in 2019 (Fig. 2).

Appendix B: UC Davis Tahoe Environmental Research Center Outcomes and Next Steps
12
Fig. 1. The different types of monitoring stations: stream turbidity sensors (green circle),
temperature and dissolved oxygen (DO) lake moorings (red circle), sediment traps (black
diamond), and meteorological stations (purple triangle). Wind roses illustrate the spatial variability
of the wind field across the lake.
Fig. 2. Hourly average time series of discharge (blue) and turbidity (orange) measured at the three monitored creeks
(Kelsey, Middle, and Scotts) during winter and spring in 2019. Black dots show the turbidity values from grab
samples collected by Lake County. Gray rectangle marks when the turbidity sensor at Scotts Creek was clogged.
Probe was
clogged
Appendix B: UC Davis Tahoe Environmental Research Center Outcomes and Next Steps
13
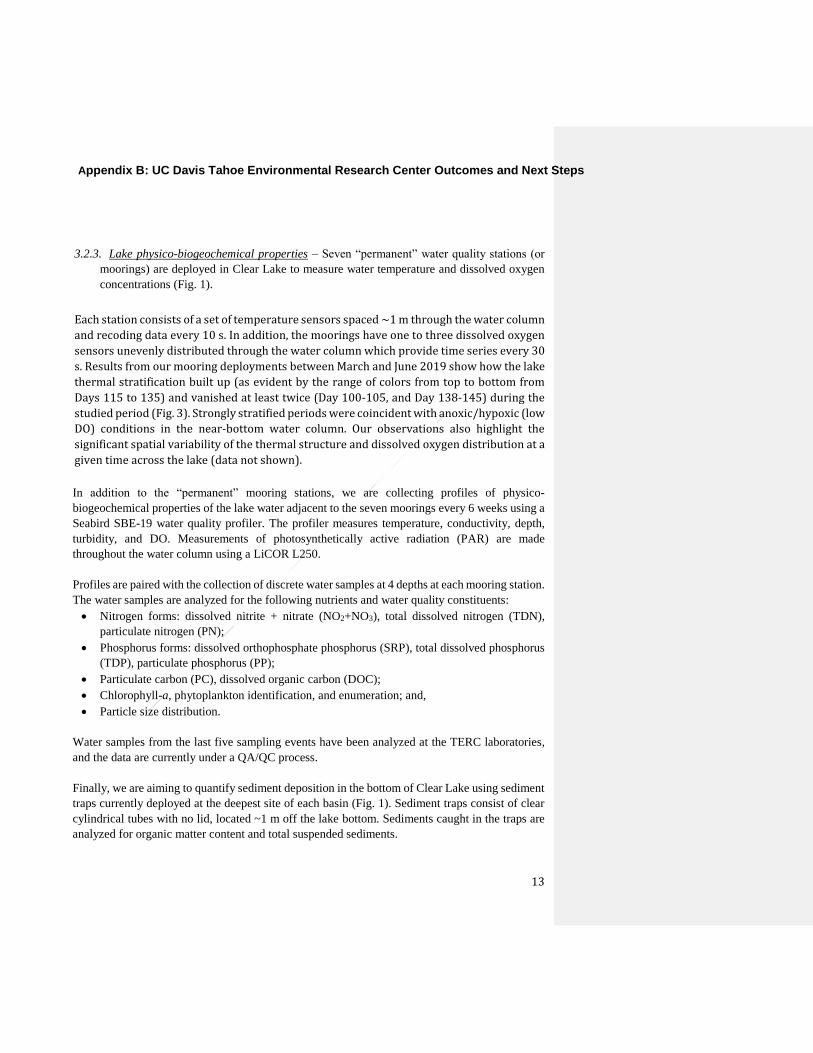
3.2.3. Lake physico-biogeochemical properties – Seven “permanent” water quality stations (or
moorings) are deployed in Clear Lake to measure water temperature and dissolved oxygen
concentrations (Fig. 1).
Each station consists of a set of temperature sensors spaced ~1 m through the water column
and recoding data every 10 s. In addition, the moorings have one to three dissolved oxygen
sensors unevenly distributed through the water column which provide time series every 30
s. Results from our mooring deployments between March and June 2019 show how the lake
thermal stratification built up (as evident by the range of colors from top to bottom from
Days 115 to 135) and vanished at least twice (Day 100-105, and Day 138-145) during the
studied period (Fig. 3). Strongly stratified periods were coincident with anoxic/hypoxic (low
DO) conditions in the near-bottom water column. Our observations also highlight the
significant spatial variability of the thermal structure and dissolved oxygen distribution at a
given time across the lake (data not shown).
In addition to the “permanent” mooring stations, we are collecting profiles of physico-
biogeochemical properties of the lake water adjacent to the seven moorings every 6 weeks using a
Seabird SBE-19 water quality profiler. The profiler measures temperature, conductivity, depth,
turbidity, and DO. Measurements of photosynthetically active radiation (PAR) are made
throughout the water column using a LiCOR L250.
Profiles are paired with the collection of discrete water samples at 4 depths at each mooring station.
The water samples are analyzed for the following nutrients and water quality constituents:
• Nitrogen forms: dissolved nitrite + nitrate (NO2+NO3), total dissolved nitrogen (TDN),
particulate nitrogen (PN);
• Phosphorus forms: dissolved orthophosphate phosphorus (SRP), total dissolved phosphorus
(TDP), particulate phosphorus (PP);
• Particulate carbon (PC), dissolved organic carbon (DOC);
• Chlorophyll-a, phytoplankton identification, and enumeration; and,
• Particle size distribution.
Water samples from the last five sampling events have been analyzed at the TERC laboratories,
and the data are currently under a QA/QC process.
Finally, we are aiming to quantify sediment deposition in the bottom of Clear Lake using sediment
traps currently deployed at the deepest site of each basin (Fig. 1). Sediment traps consist of clear
cylindrical tubes with no lid, located ~1 m off the lake bottom. Sediments caught in the traps are
analyzed for organic matter content and total suspended sediments.

Appendix B: UC Davis Tahoe Environmental Research Center Outcomes and Next Steps
14
3.3. Numerical Modeling - We are conducting simulations using a three-dimensional
hydrodynamic and water quality model (Si3D).
The model is based on the continuity equations for incompressible fluids, the Reynolds-
averaged form of the Navier-Stokes equations for momentum, the transport equation for
temperature, and an equation of state relating temperature to the fluid density. A water
quality module is coupled to the hydrodynamic model in order to simulate the evolution of
different constituents, such as dissolved oxygen, nitrogen species, phosphorus species,
phytoplankton, and suspended solids.
We are calibrating the hydrodynamic model using recently measured data from Clear lake
between March and June 2019. This entails adjusting the model parameters and forcing
(meteorology and streams) within the margins of the uncertainty to reproduce the
conditions that we measured in the lake during the spring. Our trial and error process is
already producing satisfactory results when we compare observed and model lake
temperatures (Fig. 3 top and middle panels), but further efforts are required to improve
the fit to the data. The next step, model validation, entails running the calibrated model for

Appendix B: UC Davis Tahoe Environmental Research Center Outcomes and Next Steps
15
a different period of time but without changing and assessing the quality of the fit to the
data
Fig. 3. Two-hour average observed temperature (top), model temperature (middle) and observed
dissolved oxygen concentration (bottom) time series at the deepest site of the lake (Lower Arm)
between March and June 2019. White dots on the left axis represent the depth of the loggers. Black
and gray boxes mark stratified and mixed periods
1. UC Davis (TERC) Data Deficiencies and Next Steps
1.1. Reliable in-situ measurements of external loading during storm events – The number of
grab samples taken historically during streamflow events was insufficient to adequately
Appendix B: UC Davis Tahoe Environmental Research Center Outcomes and Next Steps
16
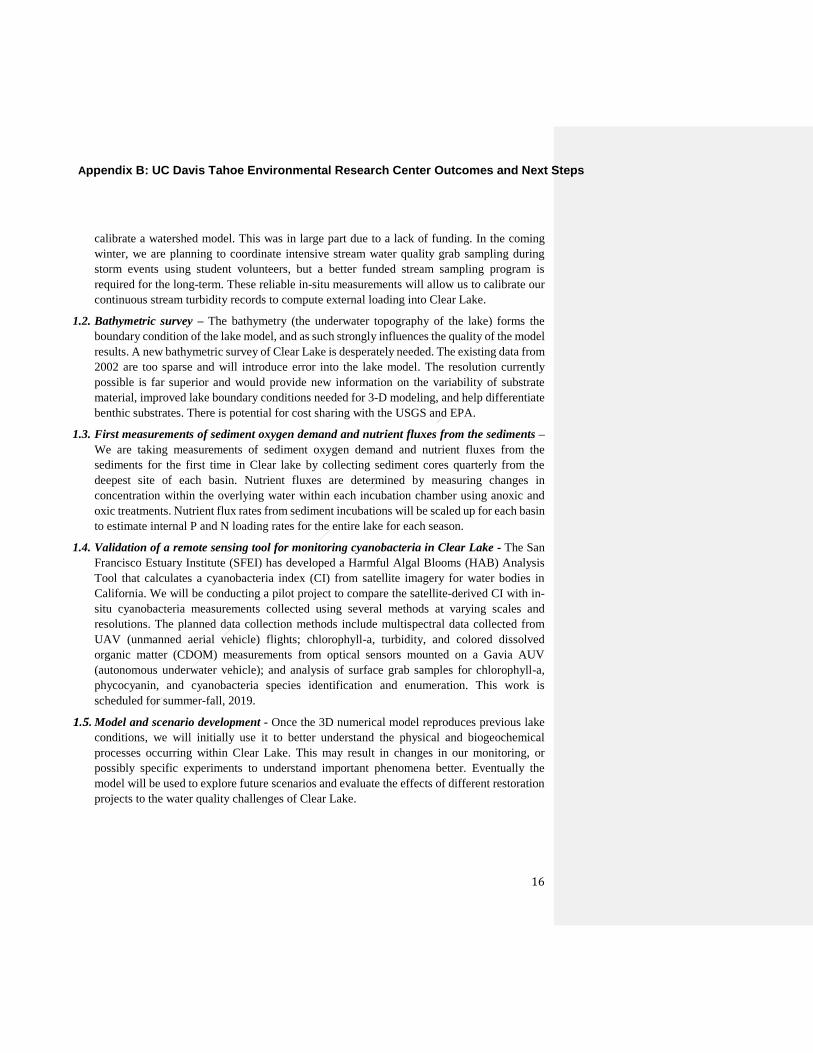
calibrate a watershed model. This was in large part due to a lack of funding. In the coming
winter, we are planning to coordinate intensive stream water quality grab sampling during
storm events using student volunteers, but a better funded stream sampling program is
required for the long-term. These reliable in-situ measurements will allow us to calibrate our
continuous stream turbidity records to compute external loading into Clear Lake.
1.2. Bathymetric survey – The bathymetry (the underwater topography of the lake) forms the
boundary condition of the lake model, and as such strongly influences the quality of the model
results. A new bathymetric survey of Clear Lake is desperately needed. The existing data from
2002 are too sparse and will introduce error into the lake model. The resolution currently
possible is far superior and would provide new information on the variability of substrate
material, improved lake boundary conditions needed for 3-D modeling, and help differentiate
benthic substrates. There is potential for cost sharing with the USGS and EPA.
1.3. First measurements of sediment oxygen demand and nutrient fluxes from the sediments –
We are taking measurements of sediment oxygen demand and nutrient fluxes from the
sediments for the first time in Clear lake by collecting sediment cores quarterly from the
deepest site of each basin. Nutrient fluxes are determined by measuring changes in
concentration within the overlying water within each incubation chamber using anoxic and
oxic treatments. Nutrient flux rates from sediment incubations will be scaled up for each basin
to estimate internal P and N loading rates for the entire lake for each season.
1.4. Validation of a remote sensing tool for monitoring cyanobacteria in Clear Lake - The San
Francisco Estuary Institute (SFEI) has developed a Harmful Algal Blooms (HAB) Analysis
Tool that calculates a cyanobacteria index (CI) from satellite imagery for water bodies in
California. We will be conducting a pilot project to compare the satellite-derived CI with in-
situ cyanobacteria measurements collected using several methods at varying scales and
resolutions. The planned data collection methods include multispectral data collected from
UAV (unmanned aerial vehicle) flights; chlorophyll-a, turbidity, and colored dissolved
organic matter (CDOM) measurements from optical sensors mounted on a Gavia AUV
(autonomous underwater vehicle); and analysis of surface grab samples for chlorophyll-a,
phycocyanin, and cyanobacteria species identification and enumeration. This work is
scheduled for summer-fall, 2019.
1.5. Model and scenario development - Once the 3D numerical model reproduces previous lake
conditions, we will initially use it to better understand the physical and biogeochemical
processes occurring within Clear Lake. This may result in changes in our monitoring, or
possibly specific experiments to understand important phenomena better. Eventually the
model will be used to explore future scenarios and evaluate the effects of different restoration
projects to the water quality challenges of Clear Lake.
Appendix C: UC Davis CRC 2019 Research Outcomes
TO: Sam Magill, Senior Facilitator
Consensus and Collaboration Program California State University, Sacramento
FROM: Jonathan London, Faculty Director
Center for Regional Change University of California, Davis
RE: Clear Lake Progress Report: August 2019 DATE: August 19, 2019
Meetings & Communication Blue Ribbon Committee Meeting participation
Several UC Davis Center for Regional Change (CRC) researchers and staff attended the Blue
Ribbon Committee Meetings held in March and June 2019. Keith Taylor presented for the CRC
at the March meeting, introducing the BRC and audience to the Strategic Doing model that he
plans to incorporate into his research on economic development in the Clear Lake region (see
his presentation here). Noli Brazil presented at the June meeting on relevant and recent
socioeconomic assessments of the region (see his presentation here). He then discussed his
plan to build upon these assessments by analyzing how the socioeconomic portrait in the
region has changed over time and comparing the socioeconomics of the Clear Lake region to
other lake communities in California.
Project Investigator Updates M. Anne Visser: Community & Tribal Engagement
We have successfully completed a scan of the publicly available data sources available related
to tribal lands. In July and August 2019, we met with tribal leader of four tribal nations and
convened a focus group with tribal leaders of the Big Valley Band of Pomo Indians of the Big
Valley Rancheria. We have undertaken outreach to tribal leaders from Robinson Rancheria,
Pomo Indians and The Koi Nation, but have been unable to set up an introductory meeting.
Appendix C: UC Davis CRC 2019 Research Outcomes
18
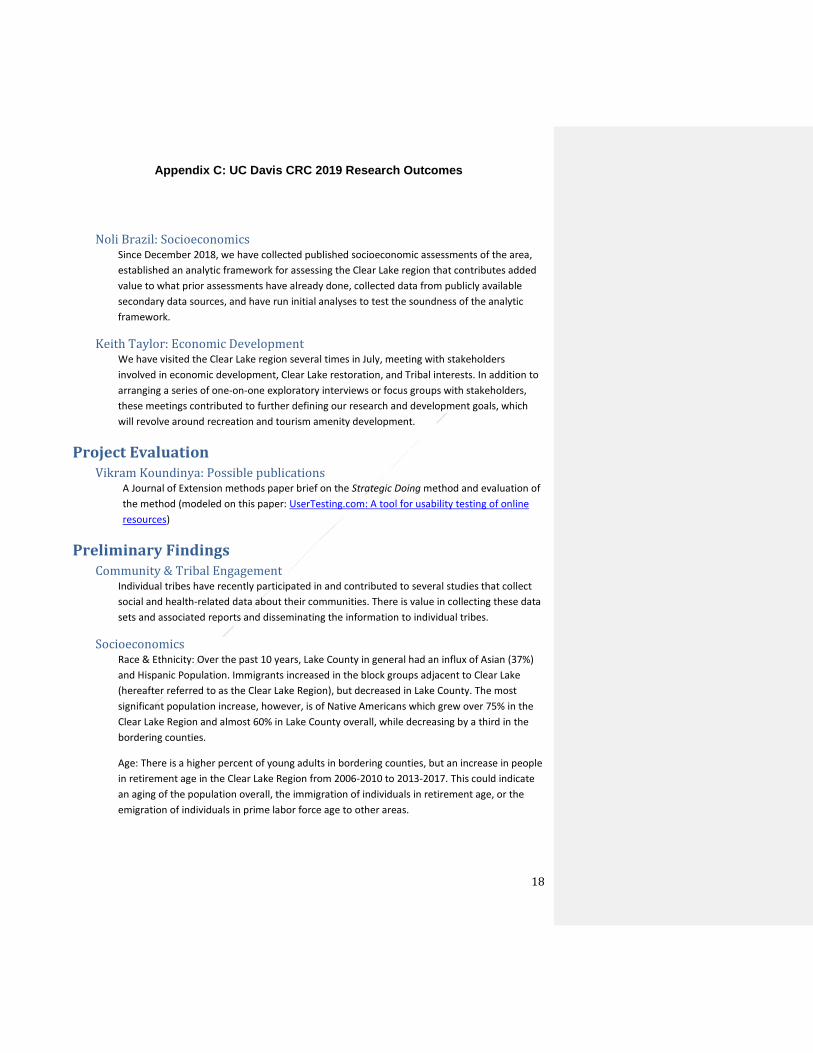
Noli Brazil: Socioeconomics Since December 2018, we have collected published socioeconomic assessments of the area,
established an analytic framework for assessing the Clear Lake region that contributes added
value to what prior assessments have already done, collected data from publicly available
secondary data sources, and have run initial analyses to test the soundness of the analytic
framework.
Keith Taylor: Economic Development We have visited the Clear Lake region several times in July, meeting with stakeholders
involved in economic development, Clear Lake restoration, and Tribal interests. In addition to
arranging a series of one-on-one exploratory interviews or focus groups with stakeholders,
these meetings contributed to further defining our research and development goals, which
will revolve around recreation and tourism amenity development.
Project Evaluation Vikram Koundinya: Possible publications
A Journal of Extension methods paper brief on the Strategic Doing method and evaluation of
the method (modeled on this paper: UserTesting.com: A tool for usability testing of online
resources)
Preliminary Findings Community & Tribal Engagement
Individual tribes have recently participated in and contributed to several studies that collect
social and health-related data about their communities. There is value in collecting these data
sets and associated reports and disseminating the information to individual tribes.
Socioeconomics Race & Ethnicity: Over the past 10 years, Lake County in general had an influx of Asian (37%)
and Hispanic Population. Immigrants increased in the block groups adjacent to Clear Lake
(hereafter referred to as the Clear Lake Region), but decreased in Lake County. The most
significant population increase, however, is of Native Americans which grew over 75% in the
Clear Lake Region and almost 60% in Lake County overall, while decreasing by a third in the
bordering counties.
Age: There is a higher percent of young adults in bordering counties, but an increase in people
in retirement age in the Clear Lake Region from 2006-2010 to 2013-2017. This could indicate
an aging of the population overall, the immigration of individuals in retirement age, or the
emigration of individuals in prime labor force age to other areas.

Appendix C: UC Davis CRC 2019 Research Outcomes
19
Economic Development Housing and broadband internet are two priority areas for economic development. Different
geographic communities have diverse economic development processes and strategies. There
is no singular strategy shared by stakeholders in the Clear Lake Region. This finding has led to
a different approach by the economic development team, which has been meeting with small
groups of stakeholders and will continue these meetings by sector, (e.g. public and private),
and by geography, (e.g. Lake County and tribal governments).
Next Steps Community & Tribal Engagement
In partnership with Dr. Clare Cannon, Dr. Visser plans to work with various tribes in the Clear
Lake area individually to explore opportunities to and coordinate ongoing efforts for
socioeconomic development with activities and interests related to the Blue Ribbon
Commission. We will hold at least 1 community meeting for all tribal communities in the
coming year.
Socioeconomics Dr. Brazil plans to refine analyses given feedback from the Blue Ribbon Committee during the
June 5th meeting, which includes collecting more data, ground-truthing information in
sparsely populated areas of the region, and conducting additional statistical analyses.
Economic Development In September and October 2019 Dr. Taylor and his research team plan to organize their first
Strategic Doing session with Clear Lake stakeholders. These sessions will include Dr. Taylor
facilitating discussions with the following prompts: (1) framing the question from an
appreciative perspective; (2) moving beyond intensive, catch all planning processes, and
toward bite-sized tasks, working in 30-90 increments; and (3) organizing ideas by asking what
we could do, what we should do, and what we will do over the next 30-90 days.
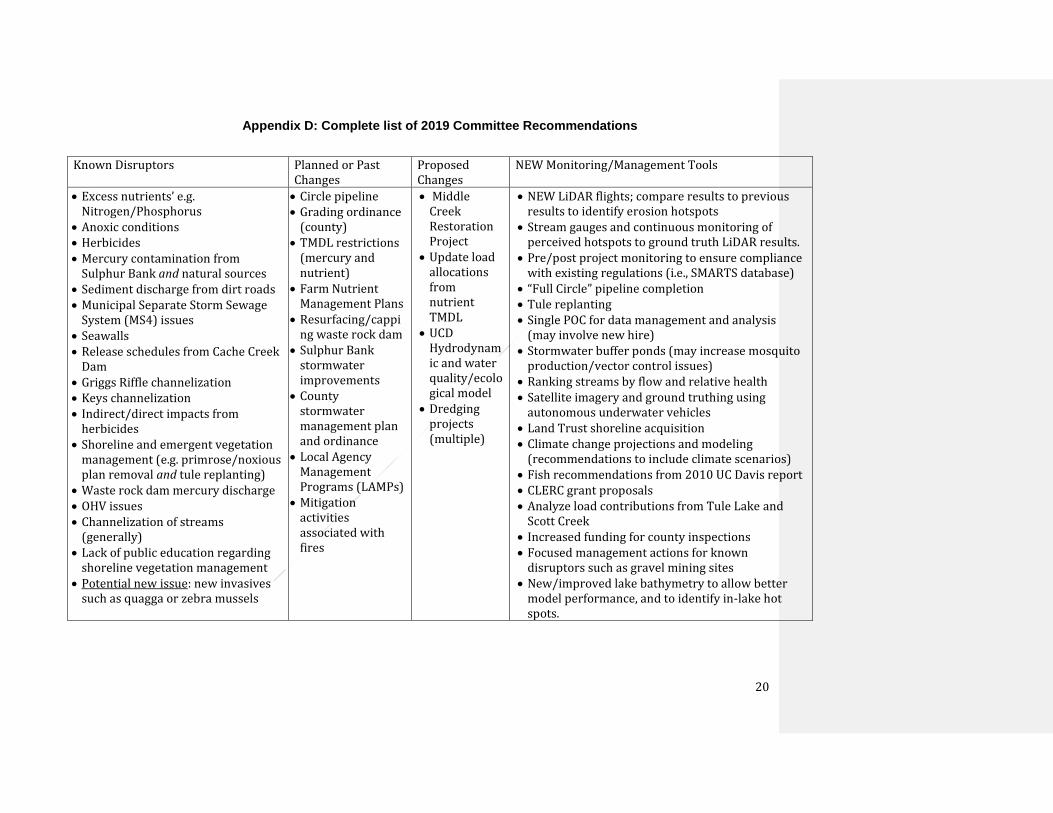
Appendix D: Complete list of 2019 Committee Recommendations
20
Known Disruptors Planned or Past Changes
Proposed Changes
NEW Monitoring/Management Tools
• Excess nutrients’ e.g. Nitrogen/Phosphorus
• Anoxic conditions • Herbicides • Mercury contamination from
Sulphur Bank and natural sources • Sediment discharge from dirt roads • Municipal Separate Storm Sewage
System (MS4) issues • Seawalls • Release schedules from Cache Creek
Dam • Griggs Riffle channelization • Keys channelization • Indirect/direct impacts from
herbicides • Shoreline and emergent vegetation
management (e.g. primrose/noxious plan removal and tule replanting)
• Waste rock dam mercury discharge • OHV issues • Channelization of streams
(generally) • Lack of public education regarding
shoreline vegetation management • Potential new issue: new invasives
such as quagga or zebra mussels
• Circle pipeline • Grading ordinance
(county) • TMDL restrictions
(mercury and nutrient)
• Farm Nutrient Management Plans
• Resurfacing/capping waste rock dam
• Sulphur Bank stormwater improvements
• County stormwater management plan and ordinance
• Local Agency Management Programs (LAMPs)
• Mitigation activities associated with fires
• Middle Creek Restoration Project
• Update load allocations from nutrient TMDL
• UCD Hydrodynamic and water quality/ecological model
• Dredging projects (multiple)
• NEW LiDAR flights; compare results to previous results to identify erosion hotspots
• Stream gauges and continuous monitoring of perceived hotspots to ground truth LiDAR results.
• Pre/post project monitoring to ensure compliance with existing regulations (i.e., SMARTS database)
• “Full Circle” pipeline completion • Tule replanting • Single POC for data management and analysis
(may involve new hire) • Stormwater buffer ponds (may increase mosquito
production/vector control issues) • Ranking streams by flow and relative health • Satellite imagery and ground truthing using
autonomous underwater vehicles • Land Trust shoreline acquisition • Climate change projections and modeling
(recommendations to include climate scenarios) • Fish recommendations from 2010 UC Davis report • CLERC grant proposals • Analyze load contributions from Tule Lake and
Scott Creek • Increased funding for county inspections • Focused management actions for known
disruptors such as gravel mining sites • New/improved lake bathymetry to allow better
model performance, and to identify in-lake hot spots.