Embed Size (px)
Citation preview
http://www.diva-portal.org
This is the published version of a paper presented at The 26th International Business InformationManagement Association Conference, 11-12 November 2015, Madrid, Spain.
Citation for the original published paper:
Osarenkhoe, A., Birungi Komunda, M., Mbiito Byarugaba, J. (2015)
Service Quality: A Mediator of Customer Complaint Behaviour and Customer Loyalty.
In: Khalid S. Soliman (ed.), The 26th International Business Information Management Association
Conference: Innovation Management and Sustainable Economic Competitive Advantage: From
Regional Development to Global Growth International Business Information Management
Association (IBIMA)
N.B. When citing this work, cite the original published paper.
Permanent link to this version:http://urn.kb.se/resolve?urn=urn:nbn:se:hig:diva-20649
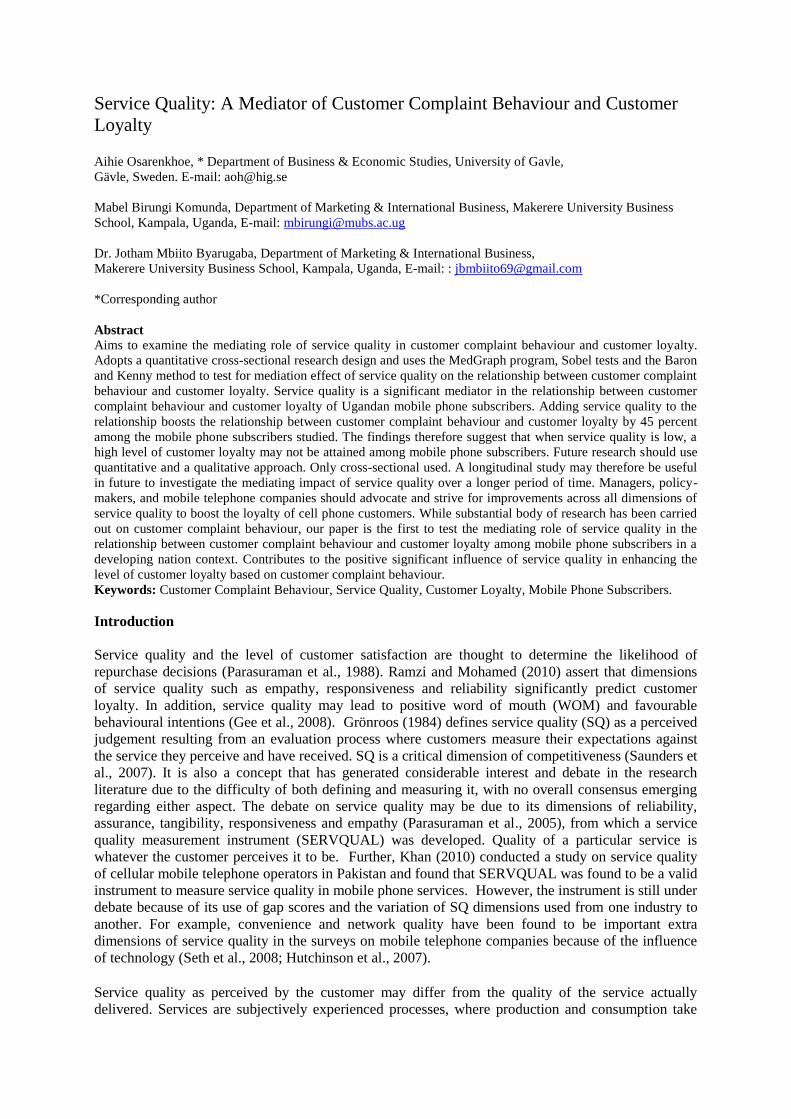
Service Quality: A Mediator of Customer Complaint Behaviour and Customer
Loyalty Aihie Osarenkhoe, * Department of Business & Economic Studies, University of Gavle,
Gävle, Sweden. E-mail: [email protected]
Mabel Birungi Komunda, Department of Marketing & International Business, Makerere University Business
School, Kampala, Uganda, E-mail: [email protected]
Dr. Jotham Mbiito Byarugaba, Department of Marketing & International Business,
Makerere University Business School, Kampala, Uganda, E-mail: : [email protected]
*Corresponding author
Abstract
Aims to examine the mediating role of service quality in customer complaint behaviour and customer loyalty.
Adopts a quantitative cross-sectional research design and uses the MedGraph program, Sobel tests and the Baron
and Kenny method to test for mediation effect of service quality on the relationship between customer complaint
behaviour and customer loyalty. Service quality is a significant mediator in the relationship between customer
complaint behaviour and customer loyalty of Ugandan mobile phone subscribers. Adding service quality to the
relationship boosts the relationship between customer complaint behaviour and customer loyalty by 45 percent
among the mobile phone subscribers studied. The findings therefore suggest that when service quality is low, a
high level of customer loyalty may not be attained among mobile phone subscribers. Future research should use
quantitative and a qualitative approach. Only cross-sectional used. A longitudinal study may therefore be useful
in future to investigate the mediating impact of service quality over a longer period of time. Managers, policy-
makers, and mobile telephone companies should advocate and strive for improvements across all dimensions of
service quality to boost the loyalty of cell phone customers. While substantial body of research has been carried
out on customer complaint behaviour, our paper is the first to test the mediating role of service quality in the
relationship between customer complaint behaviour and customer loyalty among mobile phone subscribers in a
developing nation context. Contributes to the positive significant influence of service quality in enhancing the
level of customer loyalty based on customer complaint behaviour.
Keywords: Customer Complaint Behaviour, Service Quality, Customer Loyalty, Mobile Phone Subscribers.
Introduction
Service quality and the level of customer satisfaction are thought to determine the likelihood of
repurchase decisions (Parasuraman et al., 1988). Ramzi and Mohamed (2010) assert that dimensions
of service quality such as empathy, responsiveness and reliability significantly predict customer
loyalty. In addition, service quality may lead to positive word of mouth (WOM) and favourable
behavioural intentions (Gee et al., 2008). Grönroos (1984) defines service quality (SQ) as a perceived
judgement resulting from an evaluation process where customers measure their expectations against
the service they perceive and have received. SQ is a critical dimension of competitiveness (Saunders et
al., 2007). It is also a concept that has generated considerable interest and debate in the research
literature due to the difficulty of both defining and measuring it, with no overall consensus emerging
regarding either aspect. The debate on service quality may be due to its dimensions of reliability,
assurance, tangibility, responsiveness and empathy (Parasuraman et al., 2005), from which a service
quality measurement instrument (SERVQUAL) was developed. Quality of a particular service is
whatever the customer perceives it to be. Further, Khan (2010) conducted a study on service quality
of cellular mobile telephone operators in Pakistan and found that SERVQUAL was found to be a valid
instrument to measure service quality in mobile phone services. However, the instrument is still under
debate because of its use of gap scores and the variation of SQ dimensions used from one industry to
another. For example, convenience and network quality have been found to be important extra
dimensions of service quality in the surveys on mobile telephone companies because of the influence
of technology (Seth et al., 2008; Hutchinson et al., 2007).
Service quality as perceived by the customer may differ from the quality of the service actually
delivered. Services are subjectively experienced processes, where production and consumption take
place simultaneously. Interactions occur, including a series of moments of truth between the customer
and the service provider. Such buyer-seller interactions or service encounters have a critical impact on
the perceived service. Service quality has been defined in a number of ways, but one of the most
popular definitions is: “a comparison between the expected service and the perceived service”
(Grönroos, 1984, p. 9). This definition is user-based and thus high service quality is achieved by
consistently meeting or exceeding the customer’s expectations. In addition, the issue of providing the
promised service in a timely, accurate and dependable manner requires the highest priority
(Byarugaba, 2010). Earlier studies indicate that reliability significantly affects mobile phone
customers’ perception of SQ, where the reliability of a service has been established as the driver of
mobile phone service quality (Lee et al., 2008; Negi et al., 2009). Parasuraman et al. (1988) introduced
SERVQUAL, an instrument developed to measure service quality in terms of customer expectations
and organizational performance based on five generic service quality dimensions: reliability,
assurance, tangibles, empathy and responsiveness (promptness). While SERVQUAL has remained
popular with many researchers (Lee, 2005), the fact is that it has been subject to criticism (Ladhari,
2009), largely because replications have not achieved the same results, has led others (Seth et al.,
2008) to develop alternative models and approaches, such as service performance (SERVPERF).
Parasuraman et al. (1988; 2005) have claimed that SERVQUAL provides a basic skeleton through its
expectations/perceptions format that encompasses statements for each of the five service quality
dimensions. When necessary, this skeleton can be adapted or supplemented to fit the characteristics or
specific research needs of a particular organization. In their 1988 paper, Parasuraman et al. also
claimed that the final 22-item scale and its five dimensions have sound and stable psychometric
properties. With respect to technology, however, the dimensions of network quality and service
convenience have also been proposed (Seth et al., 2008; Hutchinson et al., 2007). Furthermore, there is
general agreement that service quality is a multi-dimensional construct (Samen et al., 2012), though
debate remains on how best to conceptualize and operationalize the construct (Seth et al., 2008).
The conceptualization and measurement of service quality has been dominated by the use of the
expectancy-disconfirmation paradigm (Oliver, 1997) and the related service quality model and
SERVQUAL instrument (Parasuraman et al., 1988). According to this model, service quality is based
on a comparison of customer expectations with perceptions of the service actually received
(Parasuraman et al., 2005). In an alternative, performance-only or SERVPERF model, Cronin and
Taylor (1992) reject the expectations of quality evaluation and include only performance measures of
the service encounter. Both models are widely used in service quality research, but the performance-
only model has the advantage of efficiency in empirical data collection (Jain & Gupta, 2004).
Researchers have criticized the SERVQUAL scale for its use of gap scores (Samen et al., 2012),
measurement of expectations, positively and negatively worded items, the generalizability of its
dimensions, and the defining of a baseline standard for good quality (Hutchinson et al., 2007). Service
quality has become a major area of attention for researchers because of its strong influence on lower
costs, customer satisfaction and customer loyalty (Seth et al., 2008). When companies offer similar
services at the same price, the factor determining which company clients opt for is the quality of
service provided. Because of the nature of services, however, service quality and its requirements are
not easily articulated by consumers and companies (Lovelock & Wirtz, 2007).
Uganda has four main mobile phone operators, namely, Uganda Telecom (UTL), Mobile Telephone
Network (MTN), Orange Uganda, Airtel Uganda (Market Review, 2009). The quality of service
providers and the services they provide influence the consumer’s choice of the provider. According to
the Uganda Communications Commission (UCC; Uganda Telecommunications Sector Policy Review,
2005), the parameters on which a mobile telephone company can provide quality include network and
service accessibility, access delay, voice quality and short message service (SMS). A mobile service
provider must continuously assess whether the quality of the service they offer matches the client’s
expectations (Byarugaba, 2010). While MTN was ranked as the service provider with the largest
market share (47%) and Orange Uganda as the provider with the smallest market share, of only 4%
(BMI, 2011/2012), Orange Uganda was number one in UCC rankings for quality of services for three
years. Surveys have indicated a relationship between service quality and customer loyalty (Lee et al.,
2008), yet this has not been the case for Orange Uganda.
Mobile telephone services include telephone calls, internet services, SMS (text messaging), data
storage, and sending and receiving money. Four mobile operators (MTN, Airtel, Warid and UTL) use
mobile money services and noted this as a means for bringing about greater financial inclusion to the
“unbanked” (Uganda Budget Report, 2011/2012). The increasing competitiveness of new wireless
broadband solutions compared to landline alternatives led to heightened interest in internet
subscriptions, which increased 29% in 2011. Network operators have introduced dynamic discounts,
flat-rate plans, chat zones and mobile broadband solutions in order to bring more value-added services
to their subscribers. With greater saturation of the cell phone market (Market Review, 2009), Ugandan
MTCs need to realize that their performance can improve by focusing more on retaining customers
than constantly acting in a conquest mode.
It can be deduced that companies cannot completely eliminate the possibility of service failures (Hess
et al., 2003; Komunda & Osarenkhoe, 2012). What is important, however, is how companies recover
from service failure. Recovering effectively from service failures contributes to positive customer
evaluations of organizations. Responding effectively to consumer complaints can have a dramatic
impact on repatronage intentions and the spread of negative WOM (Halstead, 2002). Consequently,
continuous improvement of service quality has been recognized as a critical task for service managers
in mobile phone services. Further, there is a need to enhance the trustworthiness of mobile phone
operators by keeping customers’ best interests at heart, providing customized services, and exemplary
behaviour of contact personnel to make interactions with the MTC a positive memorable experience.
In addition to the original five dimensions of service quality (reliability, tangibility, empathy,
assurance and responsiveness), mobile operators should also focus on the other two SQ dimensions –
service convenience and network quality – proposed by Seth et al. (2009) and Hutchinson et al.
(2007). This is because these aspects significantly affect customers’ perception of service quality of
mobile phone service providers.
Literature Review
Customer Complaint Behaviour and Service Quality
Customer complaints are a natural consequence of any service activity (Michel et al., 2009) because
mistakes are an unavoidable feature of all human endeavours and also of service delivery (del Rio-
Lanza et al., 2009). For the consumer, this renders complaining a means of making one’s feelings
known when unfair seller practices are encountered, when disappointment with a product arises, or
when more general disapproval of business conduct occurs (Fornell & Westbrook, 1979).
Conceptualized in this way, dissatisfaction is the attitude resulting from disconfirmation of
expectancies, and complaining is a behavioural expression of this dissatisfaction. When managing
complaints, it is important that a company understands customer complaint behaviour (CCB) and why
consumers choose specific complaint behaviours, particularly behaviours that do not involve the direct
voicing of a complaint to the organization. Gruber (2011) asserts that managing complaints well and
retaining customers after service failures and complaints, should be the cornerstone of an
organization’s customer satisfaction strategy.
In light of the ongoing discussion of service quality, debate on such controversial concepts like SQ’s
multi-dimensionality and SQ gaps is still far from over and there remains an avenue for potential
contribution to the service quality literature (Byarugaba, 2010). The majority of studies have been
aimed at measuring or validating service quality from the customer’s perspectives only, with little
attention given to examining this concept from managers’ and employees’ perspectives. Companies
should go beyond customer satisfaction through providing quality services and also by handling
customer complaints in ways that will lead to loyal customers (Gee et al., 2008); in any case, customer
loyalty is the goal of mobile telephone companies in Uganda.
Service Quality and Customer Loyalty
Service quality can be measured by an instrument called SERVQUAL (Parasuraman, 1988), which
has now been employed in a broad spectrum of sectors ranging from financial services to
telecommunications but has been critiqued as confusing (Hutchinson et al., 2007). This research is
vital to establish the validity of the instrument on the generic dimensions of reliability, tangibility,
empathy, assurance and responsiveness as it relates to the use of SERVQUAL in African contexts
(Khan, 2010). SQ is a key area for researchers because of its strong impact on image creation, costs
and customer loyalty (Seth et al., 2008). Aydin and Ozer (2005) add that SQ enhances customers’
inclination to buy again, buy more, buy other services, become less price-sensitive and tell others
about their favourable experiences, concluding that there is a positive relationship between service
quality and customer loyalty.
Oliver (1997) and Gee et al. (2008) maintain that, with respect to customer loyalty, all service
encounters offer an opportunity to provide superior service quality and distinguish a firm from its
competitors. With customer loyalty being so vital for business survival, it is strange that the
relationship between service quality and customer loyalty is not equally well established (Ramzi &
Mohamed, 2010). The customer loyalty-service quality relationship has been studied but not in the
telecom industry (Holloway et al., 2009; Lee et al., 2008). And while service quality has an effect on
customer loyalty, there remains considerable debate on the nature of this effect (Ramzi & Mohamed,
2010). The assumption is that there is a strong relationship between SQ attributes and customer
behaviours such as repurchase intention (Oliver et al., 1997). Further, a study of Turkish cell phone
users suggests that service quality is necessary but insufficient to create loyalty (Aydin & Ozer, 2005).
Service quality has been found to affect both behavioural intentions and behavioural outcomes. Buyers
purchase a lot of services from suppliers with whom they have high quality relationships (Camarero,
2007).
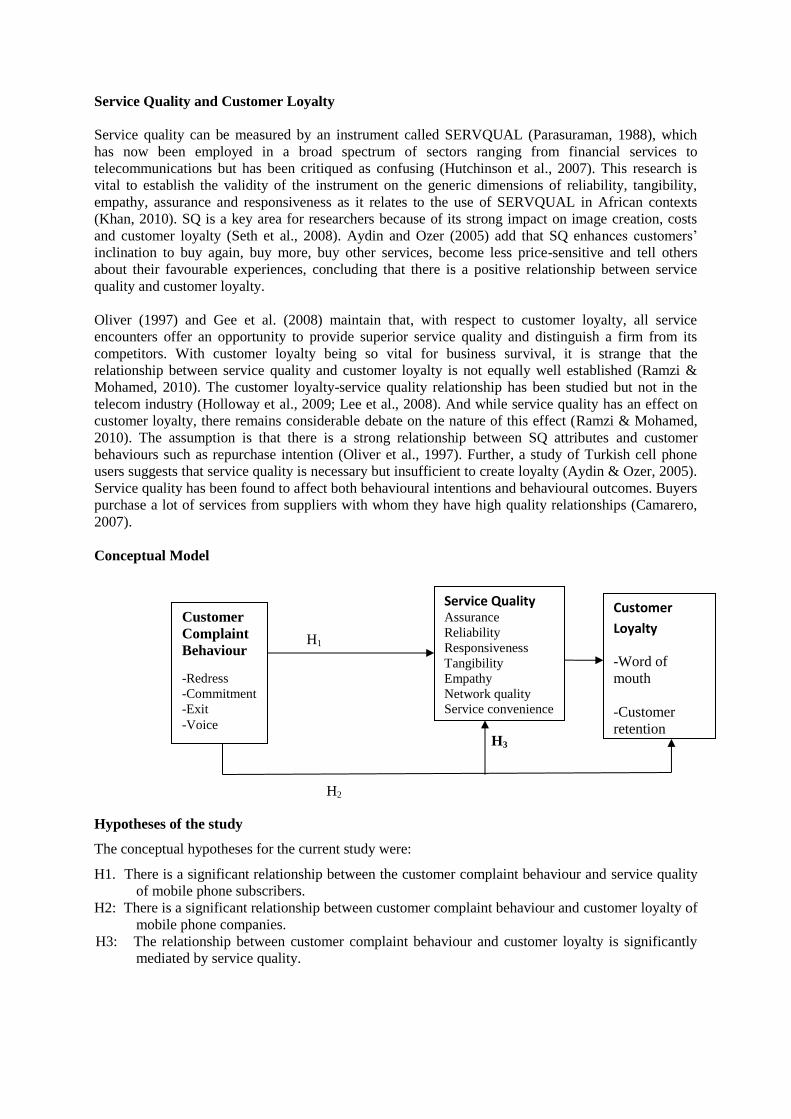
Conceptual Model
H1
H5
HH
H3
H2
Hypotheses of the study
The conceptual hypotheses for the current study were:
H1. There is a significant relationship between the customer complaint behaviour and service quality
of mobile phone subscribers.
H2: There is a significant relationship between customer complaint behaviour and customer loyalty of
mobile phone companies.
H3: The relationship between customer complaint behaviour and customer loyalty is significantly
mediated by service quality.
Customer
Complaint
Behaviour
-Redress
-Commitment
-Exit
-Voice
Service Quality Assurance
Reliability
Responsiveness
Tangibility
Empathy
Network quality
Service convenience
Customer
Loyalty
-Word of
mouth
-Customer
retention
The current study empirically investigated the relationships shown in the conceptual model and
presented in the three study hypotheses above with a view to establishing the relationship between the
study variables, as well as the mediation effect of the independent variable on the dependent variable.
Methodology
Stratified random sampling was the method used for the study. A cross-sectional survey was used,
referring to a study that involves collecting data from a population or a representative subset thereof at
one specific point in time (Saunders et al., 2007; Babbie, 2010). The population of the study
constituted subscribers to mobile phone operators, made up of students, academic staff, administrative
staff and support staff at Makerere University in Kampala, Uganda. This population was chosen
because Makerere University is one of the oldest universities in East Africa. Most people at the
university are well-educated and informed of their rights as consumers, they are multicultural, and
they are knowledgeable about how to go about complaining and are able to complain through various
channels to MTCs. The University’s staff and students are a cosmopolitan group of people from across
the country (Uganda). The mobile phone subscribers use cell phones to make telephone calls and to
access social media and mobile banking. The total population of mobile phone subscribers at
Makerere University (2011/2012 academic year) was 50,949.
The sample used was determined based on the Krijcie and Morgan (1970) table, where, for
populations greater than 10,000, the sample size is 400. The sampling technique used to select students
and staff was stratified random sampling. Uganda currently has four major mobile phone companies,
all of which offer data, text and voice services. The unit of analysis was MTC subscribers, specifically
students, academic staff, administrative staff and support staff at Makerere University in Kampala. A
list of all of the University’s students and staff was obtained from the Human Resource Office and
Registrar’s Office, from which every fifth person was selected as a respondent.
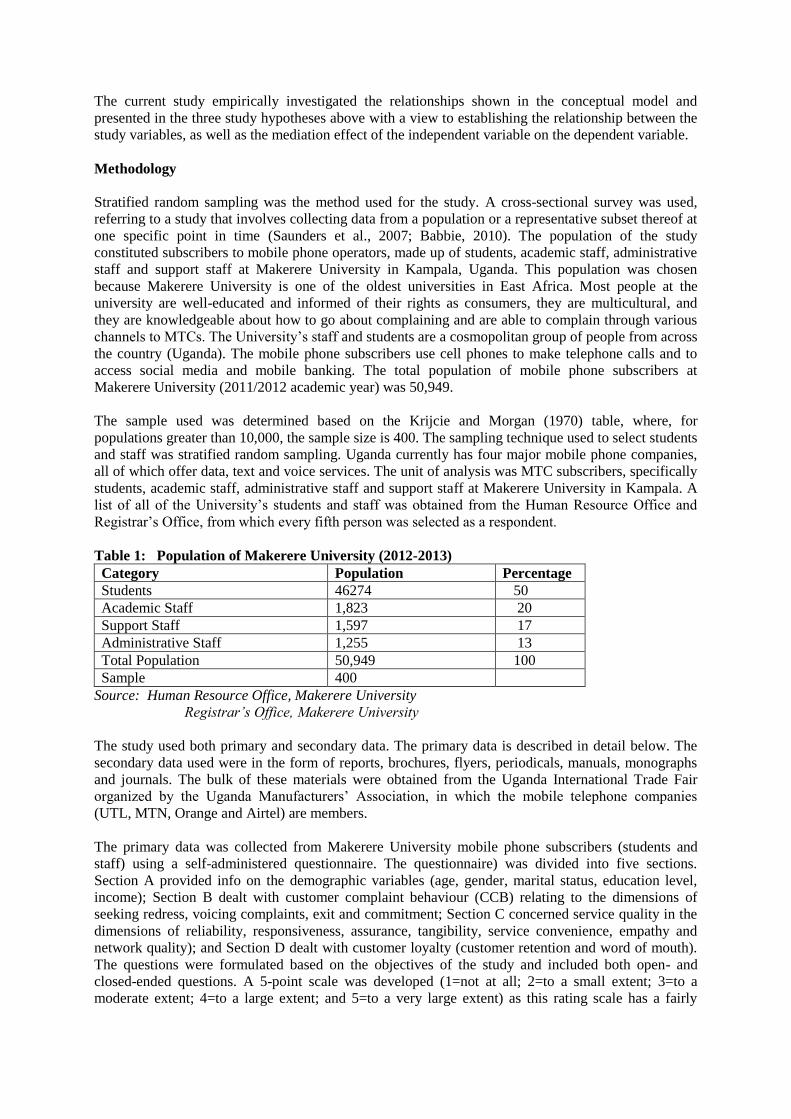
Table 1: Population of Makerere University (2012-2013)
Category Population Percentage
Students 46274 50
Academic Staff 1,823 20
Support Staff 1,597 17
Administrative Staff 1,255 13
Total Population 50,949 100
Sample 400
Source: Human Resource Office, Makerere University
Registrar’s Office, Makerere University
The study used both primary and secondary data. The primary data is described in detail below. The
secondary data used were in the form of reports, brochures, flyers, periodicals, manuals, monographs
and journals. The bulk of these materials were obtained from the Uganda International Trade Fair
organized by the Uganda Manufacturers’ Association, in which the mobile telephone companies
(UTL, MTN, Orange and Airtel) are members.
The primary data was collected from Makerere University mobile phone subscribers (students and
staff) using a self-administered questionnaire. The questionnaire) was divided into five sections.
Section A provided info on the demographic variables (age, gender, marital status, education level,
income); Section B dealt with customer complaint behaviour (CCB) relating to the dimensions of
seeking redress, voicing complaints, exit and commitment; Section C concerned service quality in the
dimensions of reliability, responsiveness, assurance, tangibility, service convenience, empathy and
network quality); and Section D dealt with customer loyalty (customer retention and word of mouth).
The questions were formulated based on the objectives of the study and included both open- and
closed-ended questions. A 5-point scale was developed (1=not at all; 2=to a small extent; 3=to a
moderate extent; 4=to a large extent; and 5=to a very large extent) as this rating scale has a fairly
robust nature. The question items were developed from the literature with appropriate modifications to
suit the context of the current study.
The questionnaire was self-administered. The researcher explained to the respondents the purpose and
objectives of the study and how to fill in the questionnaire to ensure reliable and valid information.
The researcher assured the respondents of total confidentiality regarding their responses, and kindly
requested them to fill out the questionnaire. The questionnaire method was used because it could be
administered simultaneously to many respondents.
A total of six hundred questionnaires were distributed to the respondents. For the staff of Makerere
University, the drop and pick-up later method was used to collect the questionnaires, and for the
students the questionnaire was administered by the researcher at the beginning of the semester in a
classroom setting. Cronbach’s alpha was used to ascertain the reliability of the instrument and this was
advocated for by Kothari (2005) and Nunnally (1978). A pilot study was also undertaken to establish
the reliability of the instrument using the internal consistency approach using the SPSS software
package (Version 19). Reliability tests were conducted on the pilot study of 81 individuals selected
from within the sample. The parts of CCB, service quality and customer loyalty all showed acceptable
an alpha coefficient of .70. The overall alpha coefficient was .751 and pertinent results of the
reliability of the instrument are summarized in Table 2.
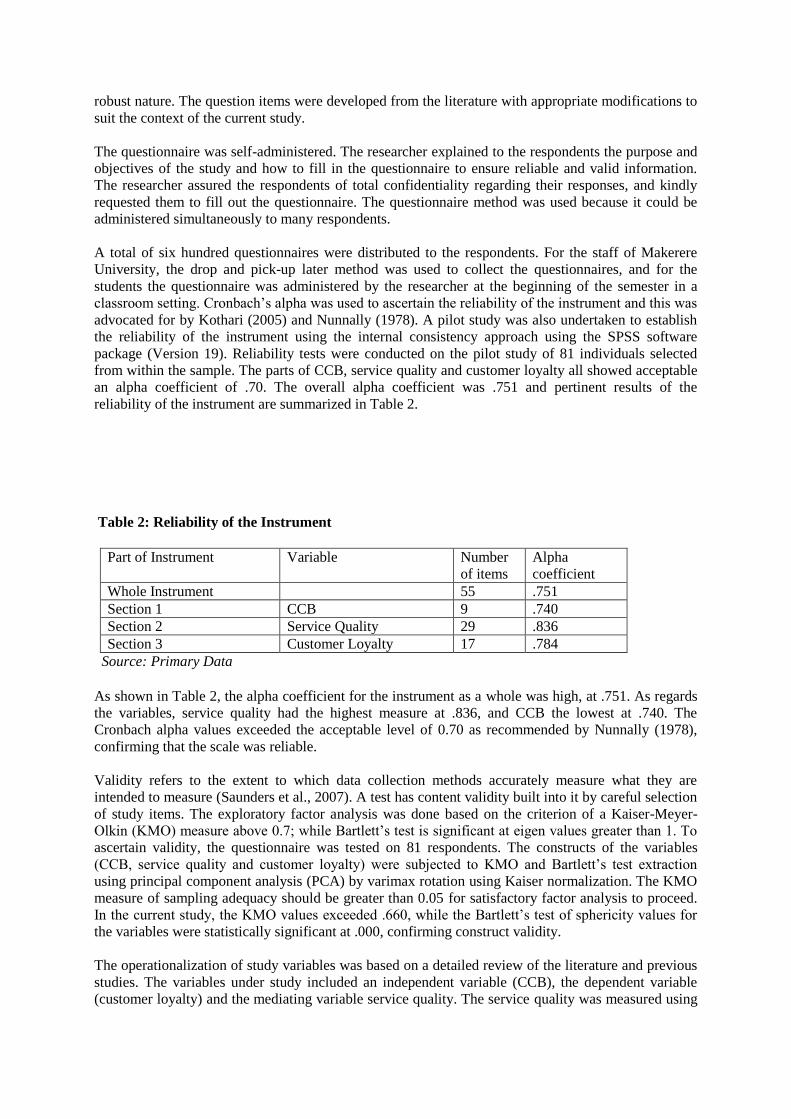
Table 2: Reliability of the Instrument
Part of Instrument Variable Number
of items
Alpha
coefficient
Whole Instrument 55 .751
Section 1 CCB 9 .740
Section 2 Service Quality 29 .836
Section 3 Customer Loyalty 17 .784
Source: Primary Data
As shown in Table 2, the alpha coefficient for the instrument as a whole was high, at .751. As regards
the variables, service quality had the highest measure at .836, and CCB the lowest at .740. The
Cronbach alpha values exceeded the acceptable level of 0.70 as recommended by Nunnally (1978),
confirming that the scale was reliable.
Validity refers to the extent to which data collection methods accurately measure what they are
intended to measure (Saunders et al., 2007). A test has content validity built into it by careful selection
of study items. The exploratory factor analysis was done based on the criterion of a Kaiser-Meyer-
Olkin (KMO) measure above 0.7; while Bartlett’s test is significant at eigen values greater than 1. To
ascertain validity, the questionnaire was tested on 81 respondents. The constructs of the variables
(CCB, service quality and customer loyalty) were subjected to KMO and Bartlett’s test extraction
using principal component analysis (PCA) by varimax rotation using Kaiser normalization. The KMO
measure of sampling adequacy should be greater than 0.05 for satisfactory factor analysis to proceed.
In the current study, the KMO values exceeded .660, while the Bartlett’s test of sphericity values for
the variables were statistically significant at .000, confirming construct validity.
The operationalization of study variables was based on a detailed review of the literature and previous
studies. The variables under study included an independent variable (CCB), the dependent variable
(customer loyalty) and the mediating variable service quality. The service quality was measured using
Parasuraman’s 1988 SERVQUAL model, which was improved based on the literature review. The
dimensions of this variable included reliability, assurance, tangibility, empathy and responsiveness, to
which service convenience and network quality were also added. A 5-point scale was adopted for all
the scales of the questionnaire.
The collected data was first cleaned, edited and coded, then the data was analysed using the Statistical
Program for Social Sciences (Version 19). The analysis of data was done using both descriptive and
inferential statistics. Assumptions of parametric tests included the normality of distribution of the data,
the linearity of the data, and the homogeneity of variance, and a test of multi-collinearity was carried
out to assess whether the assumptions of parametric data were tenable. Parametric tests were
conducted to establish whether the sample satisfied the assumption of parametric data.
Findings
Descriptive statistics using frequency, mean scores and correlations and regressions were computed
for the variables . The pertinent results of these values are summarized in Table 3 to Table 12.
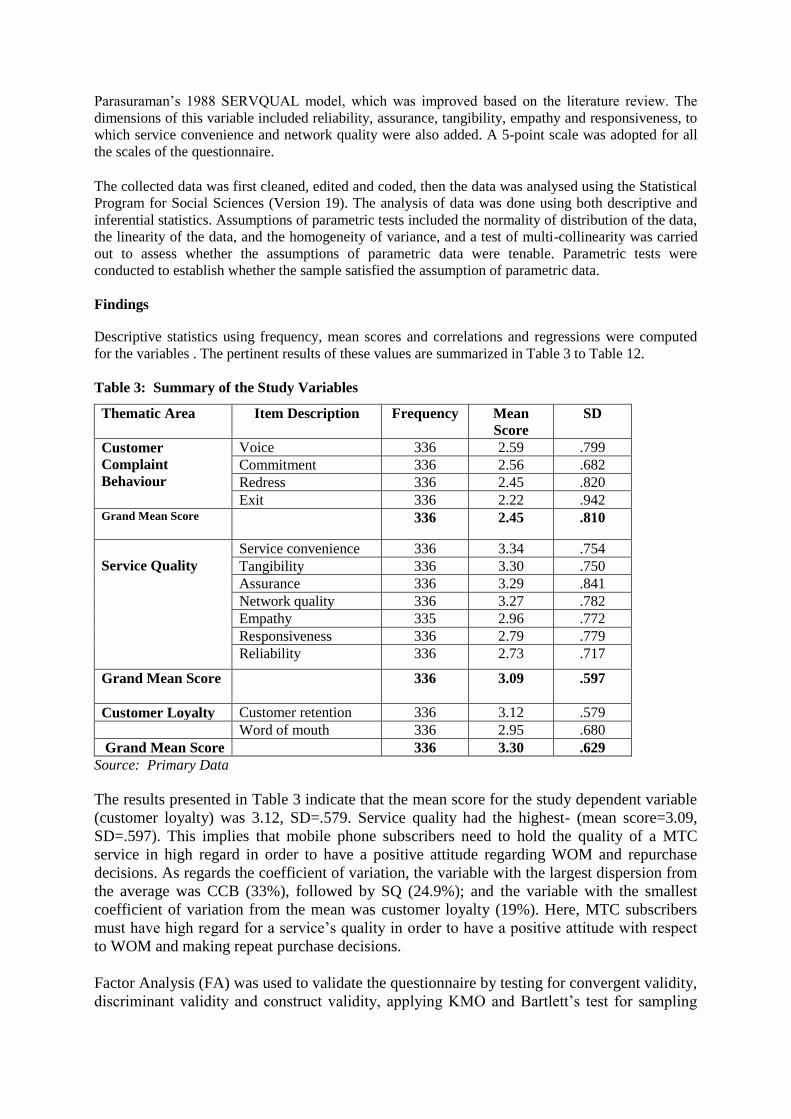
Table 3: Summary of the Study Variables
Thematic Area Item Description Frequency Mean
Score
SD
Customer
Complaint
Behaviour
Voice 336 2.59 .799
Commitment 336 2.56 .682
Redress 336 2.45 .820
Exit 336 2.22 .942 Grand Mean Score
336 2.45 .810
Service Quality
Service convenience 336 3.34 .754
Tangibility 336 3.30 .750
Assurance 336 3.29 .841
Network quality 336 3.27 .782
Empathy 335 2.96 .772
Responsiveness 336 2.79 .779
Reliability 336 2.73 .717
Grand Mean Score
336 3.09 .597
Customer Loyalty Customer retention 336 3.12 .579
Word of mouth 336 2.95 .680
Grand Mean Score 336 3.30 .629
Source: Primary Data
The results presented in Table 3 indicate that the mean score for the study dependent variable
(customer loyalty) was 3.12, SD=.579. Service quality had the highest- (mean score=3.09,
SD=.597). This implies that mobile phone subscribers need to hold the quality of a MTC
service in high regard in order to have a positive attitude regarding WOM and repurchase
decisions. As regards the coefficient of variation, the variable with the largest dispersion from
the average was CCB (33%), followed by SQ (24.9%); and the variable with the smallest
coefficient of variation from the mean was customer loyalty (19%). Here, MTC subscribers
must have high regard for a service’s quality in order to have a positive attitude with respect
to WOM and making repeat purchase decisions.
Factor Analysis (FA) was used to validate the questionnaire by testing for convergent validity,
discriminant validity and construct validity, applying KMO and Bartlett’s test for sampling
adequacy and then principal component analysis and varimax methods to extract the factors
that measured the study variables as shown in preceding sections. Principal component
analysis and varimax rotation were done using eigen values greater than or equal to 0.5.
Factors with eigen values greater than one (1) were extracted and items with factor loadings
of greater or equal to 0.5 were retained. The pertinent results are shown in Table 4.
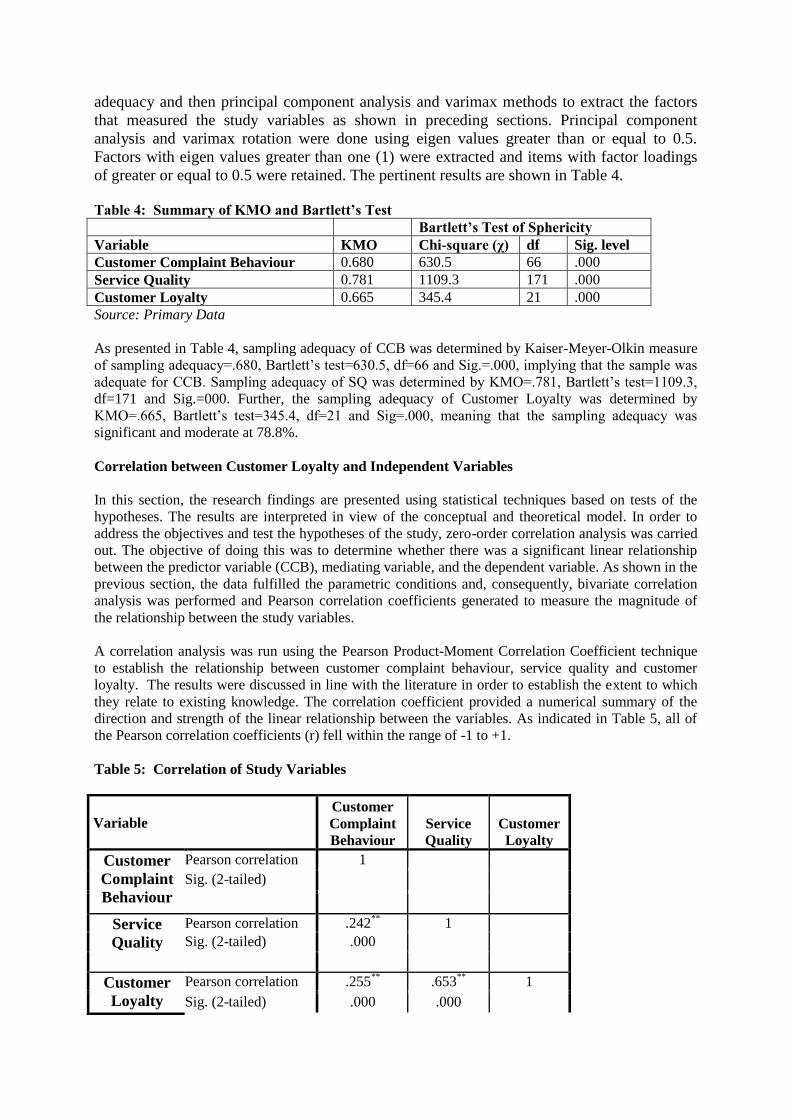
Table 4: Summary of KMO and Bartlett’s Test
Bartlett’s Test of Sphericity
Variable KMO Chi-square (χ) df Sig. level
Customer Complaint Behaviour 0.680 630.5 66 .000
Service Quality 0.781 1109.3 171 .000
Customer Loyalty 0.665 345.4 21 .000
Source: Primary Data
As presented in Table 4, sampling adequacy of CCB was determined by Kaiser-Meyer-Olkin measure
of sampling adequacy=.680, Bartlett’s test=630.5, df=66 and Sig.=.000, implying that the sample was
adequate for CCB. Sampling adequacy of SQ was determined by KMO=.781, Bartlett’s test=1109.3,
df=171 and Sig.=000. Further, the sampling adequacy of Customer Loyalty was determined by
KMO=.665, Bartlett’s test=345.4, df=21 and Sig=.000, meaning that the sampling adequacy was
significant and moderate at 78.8%.
Correlation between Customer Loyalty and Independent Variables
In this section, the research findings are presented using statistical techniques based on tests of the
hypotheses. The results are interpreted in view of the conceptual and theoretical model. In order to
address the objectives and test the hypotheses of the study, zero-order correlation analysis was carried
out. The objective of doing this was to determine whether there was a significant linear relationship
between the predictor variable (CCB), mediating variable, and the dependent variable. As shown in the
previous section, the data fulfilled the parametric conditions and, consequently, bivariate correlation
analysis was performed and Pearson correlation coefficients generated to measure the magnitude of
the relationship between the study variables.
A correlation analysis was run using the Pearson Product-Moment Correlation Coefficient technique
to establish the relationship between customer complaint behaviour, service quality and customer
loyalty. The results were discussed in line with the literature in order to establish the extent to which
they relate to existing knowledge. The correlation coefficient provided a numerical summary of the
direction and strength of the linear relationship between the variables. As indicated in Table 5, all of
the Pearson correlation coefficients (r) fell within the range of -1 to +1.
Table 5: Correlation of Study Variables
Variable Customer
Complaint
Behaviour
Service
Quality
Customer
Loyalty
Customer
Complaint
Behaviour
Pearson correlation 1
Sig. (2-tailed)
Service
Quality
Pearson correlation .242**
1
Sig. (2-tailed) .000
Customer
Loyalty
Pearson correlation .255**
.653**
1
Sig. (2-tailed) .000 .000
** Correlation is significant at the 0.01 level (2-tailed)
Source: Primary Data
The results in Table 5 indicate that the relationship between customer complaint behaviour and
customer loyalty was positive and statistically significant (r=.255**, P =.000). This finding suggests
that improved handling of complaints will lead to increased customer loyalty. It also suggests that
when customers receive quality service they remain committed and keep subscribing to their current
MTC. This implies that when the mobile operators handle customer complaints in line with the
expectations of their subscribers, the subscribers are willing to seek redress and have an understanding
for the service provider in the case of service failures.
The correlation results similarly show that there was a high positive significant relationship between
service quality and customer loyalty (r=.653**, P=.000), where service quality relates directly to
customer loyalty. The implication of this result is manifested in terms of reliability, responsiveness,
empathy, tangibility, assurance of the services by mobile telephone company staff, as they work
towards attaining positive word of mouth about the company and, consequently, retaining customers
in long-term relationships. Finally, there was a positive and significant relationship between CCB and
service quality (r=.242**, P=.000). The implication of this result is that favourable CCB (seeking
redress, voicing complaints to service operators, and using selected MTC services) will lead to an
enhancement of service quality.
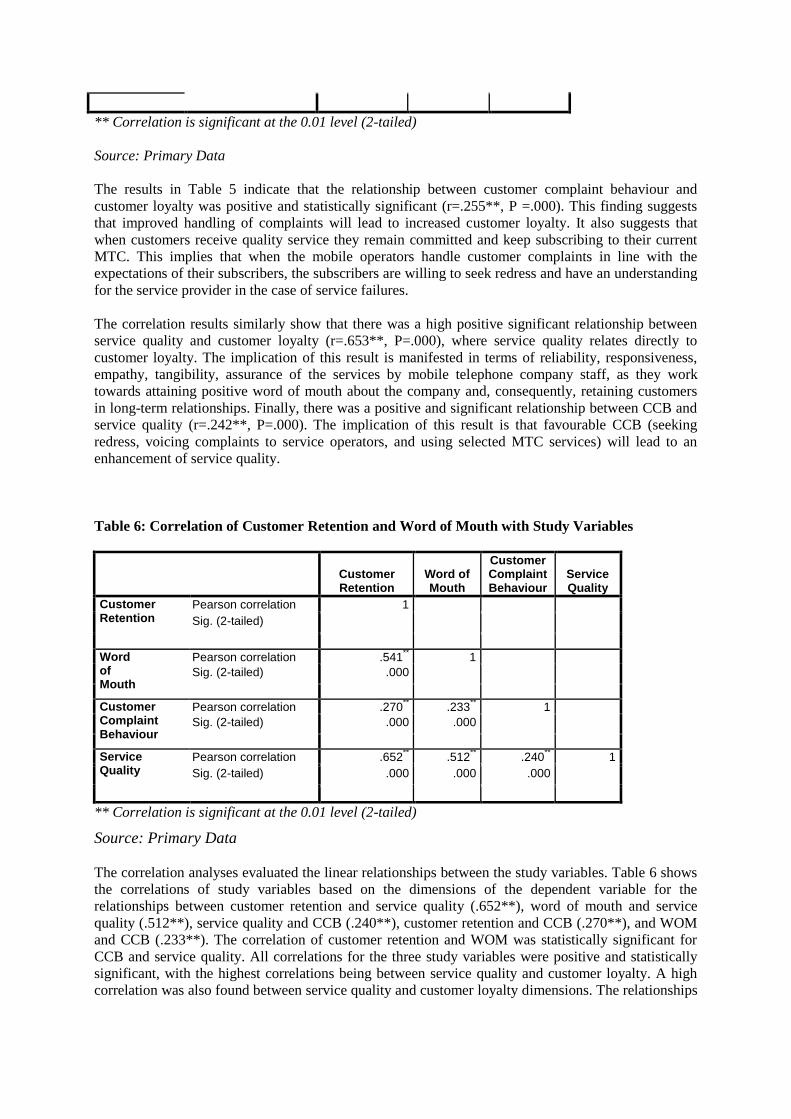
Table 6: Correlation of Customer Retention and Word of Mouth with Study Variables
Customer Retention
Word of Mouth
Customer Complaint Behaviour
Service Quality
Customer Retention
Pearson correlation 1
Sig. (2-tailed)
Word of Mouth
Pearson correlation .541** 1
Sig. (2-tailed) .000
Customer Complaint Behaviour
Pearson correlation .270** .233
** 1
Sig. (2-tailed) .000 .000
Service Quality
Pearson correlation .652** .512
** .240
** 1
Sig. (2-tailed) .000 .000 .000
** Correlation is significant at the 0.01 level (2-tailed)
Source: Primary Data
The correlation analyses evaluated the linear relationships between the study variables. Table 6 shows
the correlations of study variables based on the dimensions of the dependent variable for the
relationships between customer retention and service quality (.652**), word of mouth and service
quality (.512**), service quality and CCB (.240**), customer retention and CCB (.270**), and WOM
and CCB (.233**). The correlation of customer retention and WOM was statistically significant for
CCB and service quality. All correlations for the three study variables were positive and statistically
significant, with the highest correlations being between service quality and customer loyalty. A high
correlation was also found between service quality and customer loyalty dimensions. The relationships
between customer loyalty dimensions and CCB, as well as between CCB and service quality were
positive and statistically significant.
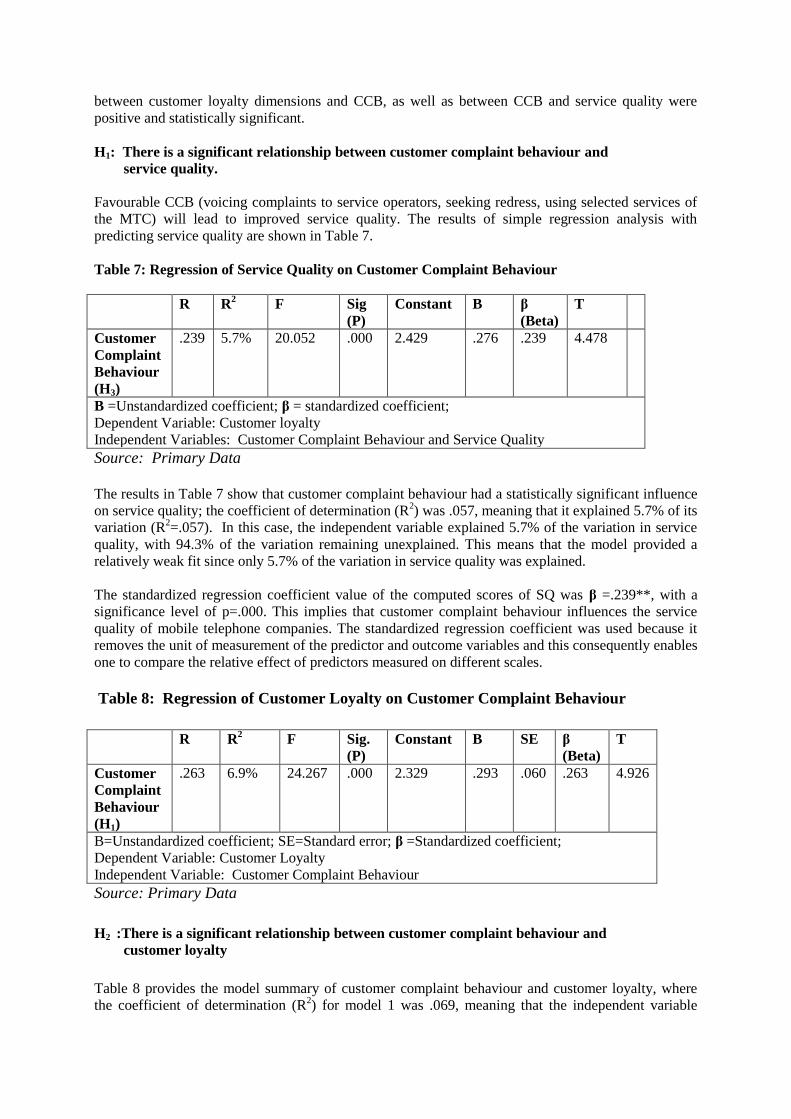
H1: There is a significant relationship between customer complaint behaviour and
service quality.
Favourable CCB (voicing complaints to service operators, seeking redress, using selected services of
the MTC) will lead to improved service quality. The results of simple regression analysis with
predicting service quality are shown in Table 7.
Table 7: Regression of Service Quality on Customer Complaint Behaviour
R R2 F Sig
(P)
Constant B β
(Beta)
T
Customer
Complaint
Behaviour
(H3)
.239 5.7% 20.052 .000 2.429 .276 .239 4.478
B =Unstandardized coefficient; β = standardized coefficient;
Dependent Variable: Customer loyalty
Independent Variables: Customer Complaint Behaviour and Service Quality
Source: Primary Data
The results in Table 7 show that customer complaint behaviour had a statistically significant influence
on service quality; the coefficient of determination (R2) was .057, meaning that it explained 5.7% of its
variation (R2=.057). In this case, the independent variable explained 5.7% of the variation in service
quality, with 94.3% of the variation remaining unexplained. This means that the model provided a
relatively weak fit since only 5.7% of the variation in service quality was explained.
The standardized regression coefficient value of the computed scores of SQ was β =.239**, with a
significance level of p=.000. This implies that customer complaint behaviour influences the service
quality of mobile telephone companies. The standardized regression coefficient was used because it
removes the unit of measurement of the predictor and outcome variables and this consequently enables
one to compare the relative effect of predictors measured on different scales.
Table 8: Regression of Customer Loyalty on Customer Complaint Behaviour
R R2 F Sig.
(P)
Constant B SE β
(Beta)
T
Customer
Complaint
Behaviour
(H1)
.263 6.9% 24.267 .000 2.329 .293 .060 .263 4.926
B=Unstandardized coefficient; SE=Standard error; β =Standardized coefficient;
Dependent Variable: Customer Loyalty
Independent Variable: Customer Complaint Behaviour
Source: Primary Data
H2 :There is a significant relationship between customer complaint behaviour and
customer loyalty
Table 8 provides the model summary of customer complaint behaviour and customer loyalty, where
the coefficient of determination (R2) for model 1 was .069, meaning that the independent variable
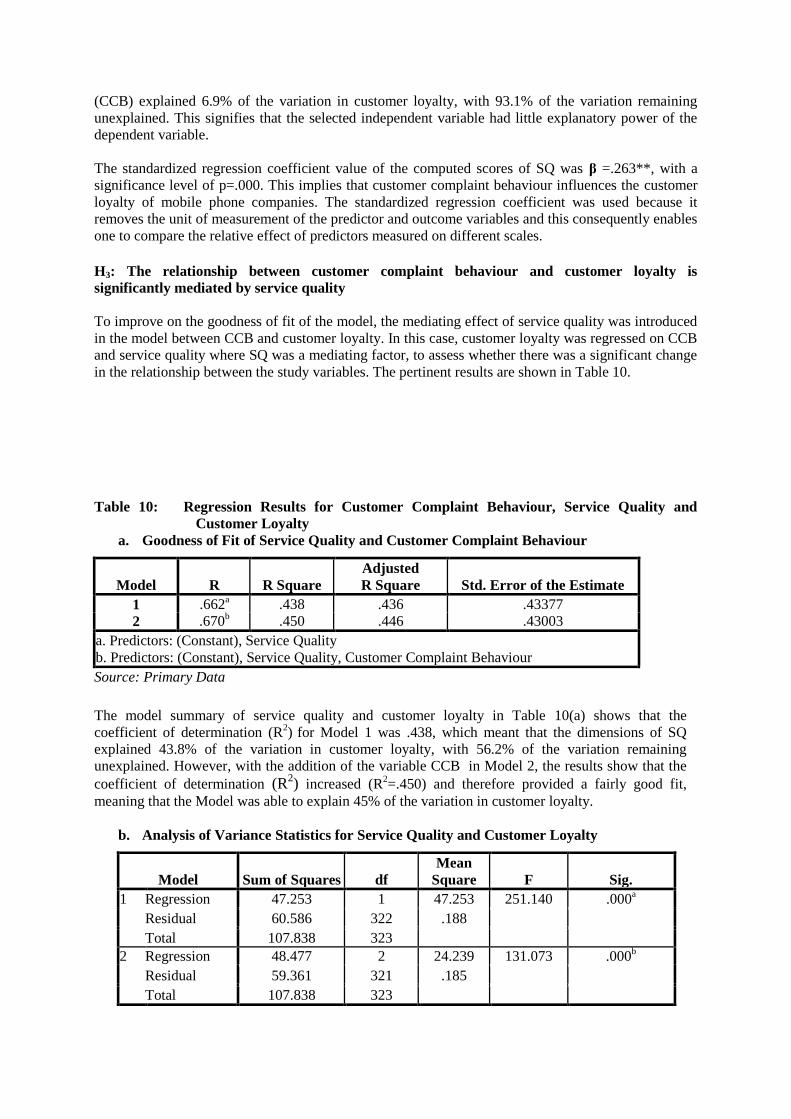
(CCB) explained 6.9% of the variation in customer loyalty, with 93.1% of the variation remaining
unexplained. This signifies that the selected independent variable had little explanatory power of the
dependent variable.
The standardized regression coefficient value of the computed scores of SQ was β =.263**, with a
significance level of p=.000. This implies that customer complaint behaviour influences the customer
loyalty of mobile phone companies. The standardized regression coefficient was used because it
removes the unit of measurement of the predictor and outcome variables and this consequently enables
one to compare the relative effect of predictors measured on different scales.
H3: The relationship between customer complaint behaviour and customer loyalty is
significantly mediated by service quality
To improve on the goodness of fit of the model, the mediating effect of service quality was introduced
in the model between CCB and customer loyalty. In this case, customer loyalty was regressed on CCB
and service quality where SQ was a mediating factor, to assess whether there was a significant change
in the relationship between the study variables. The pertinent results are shown in Table 10.
Table 10: Regression Results for Customer Complaint Behaviour, Service Quality and
Customer Loyalty
a. Goodness of Fit of Service Quality and Customer Complaint Behaviour
Model R R Square
Adjusted
R Square Std. Error of the Estimate
1 .662a .438 .436 .43377
2 .670b .450 .446 .43003
a. Predictors: (Constant), Service Quality
b. Predictors: (Constant), Service Quality, Customer Complaint Behaviour
Source: Primary Data
The model summary of service quality and customer loyalty in Table 10(a) shows that the
coefficient of determination (R2)
for Model 1 was .438, which meant that the dimensions of SQ
explained 43.8% of the variation in customer loyalty, with 56.2% of the variation remaining
unexplained. However, with the addition of the variable CCB in Model 2, the results show that the
coefficient of determination (R2) increased (R
2=.450) and therefore provided a fairly good fit,
meaning that the Model was able to explain 45% of the variation in customer loyalty.
b. Analysis of Variance Statistics for Service Quality and Customer Loyalty
Model Sum of Squares df
Mean
Square F Sig.
1 Regression 47.253 1 47.253 251.140 .000a
Residual 60.586 322 .188
Total 107.838 323
2 Regression 48.477 2 24.239 131.073 .000b
Residual 59.361 321 .185
Total 107.838 323
a. Predictors: (Constant), Service Quality
b. Predictors: (Constant), Service Quality, Customer Complaint Behaviour
Source: Primary Data
The analysis of variance (ANOVA) was used to assess the overall significance of the regression model.
In Model 1 in Table 110(b), the F-value was 251.140 and the P-value was .000. In Model 2, the F-value
was 131.073, and the P-value .000. This means that both models 1 and 2 were significant, with p-value
= .000 at α=.05 level of significance, in explaining the relationship between CCB, SQ and customer
loyalty.
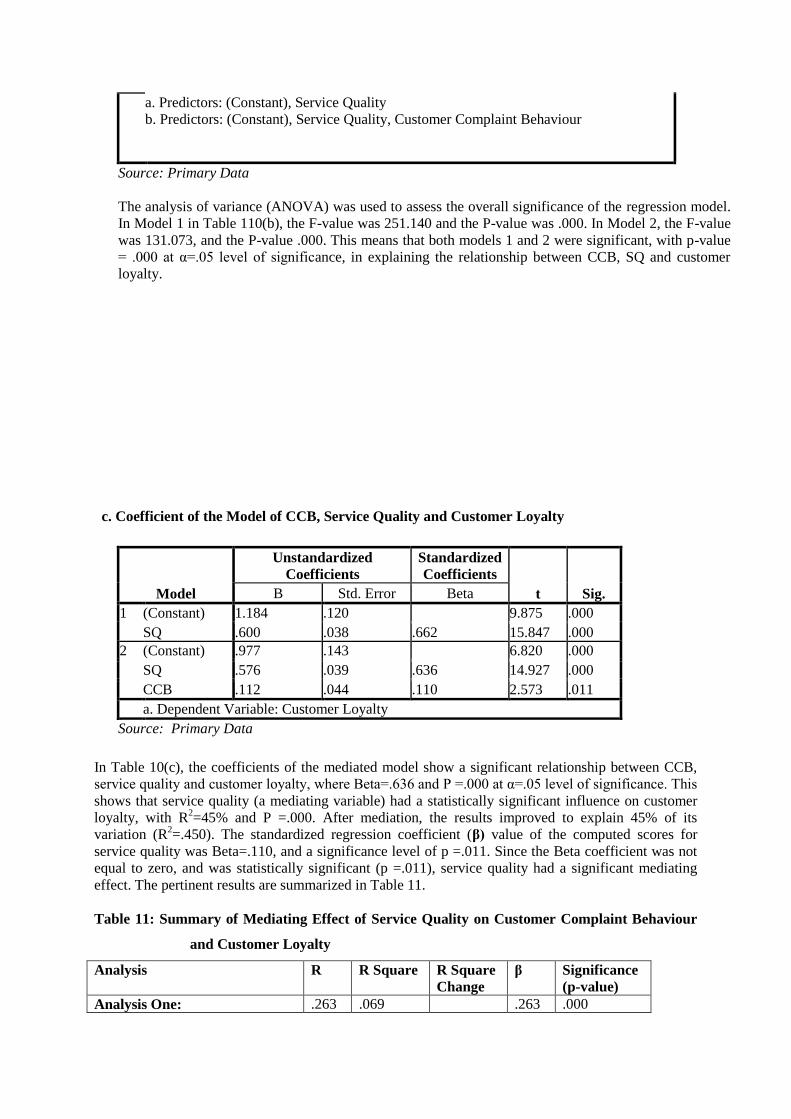
c. Coefficient of the Model of CCB, Service Quality and Customer Loyalty
Model
Unstandardized
Coefficients
Standardized
Coefficients
t Sig. B Std. Error Beta
1 (Constant) 1.184 .120 9.875 .000
SQ .600 .038 .662 15.847 .000
2 (Constant) .977 .143 6.820 .000
SQ .576 .039 .636 14.927 .000
CCB .112 .044 .110 2.573 .011
a. Dependent Variable: Customer Loyalty
Source: Primary Data
In Table 10(c), the coefficients of the mediated model show a significant relationship between CCB,
service quality and customer loyalty, where Beta=.636 and P =.000 at α=.05 level of significance. This
shows that service quality (a mediating variable) had a statistically significant influence on customer
loyalty, with R2=45% and P =.000. After mediation, the results improved to explain 45% of its
variation (R2=.450). The standardized regression coefficient (β) value of the computed scores for
service quality was Beta=.110, and a significance level of p =.011. Since the Beta coefficient was not
equal to zero, and was statistically significant (p =.011), service quality had a significant mediating
effect. The pertinent results are summarized in Table 11.
Table 11: Summary of Mediating Effect of Service Quality on Customer Complaint Behaviour
and Customer Loyalty
Analysis R R Square R Square
Change
β Significance
(p-value)
Analysis One: .263 .069 .263 .000
Customer Loyalty and Customer
Complaint Behaviour
Analysis Two:
Service Quality and CCB
.239 .057 .239 .000
Analysis Three:
Step 1: Customer Loyalty on
Service Quality
.662 .438 .662 .000
Step 2: Customer Loyalty on
Customer Complaint Behaviour
.670 .450 .011 .636 .000
Source: Primary Data
The results in Table 11 reveal that the correlation between customer complaint behaviour and
customer loyalty was moderate and statistically significant (r=.263, p =.000), while the mediating
effect of service quality on customer complaint behaviour was low and statistically significant (r=.239,
p =.000). The mediated relationship is represented in Figure 1.
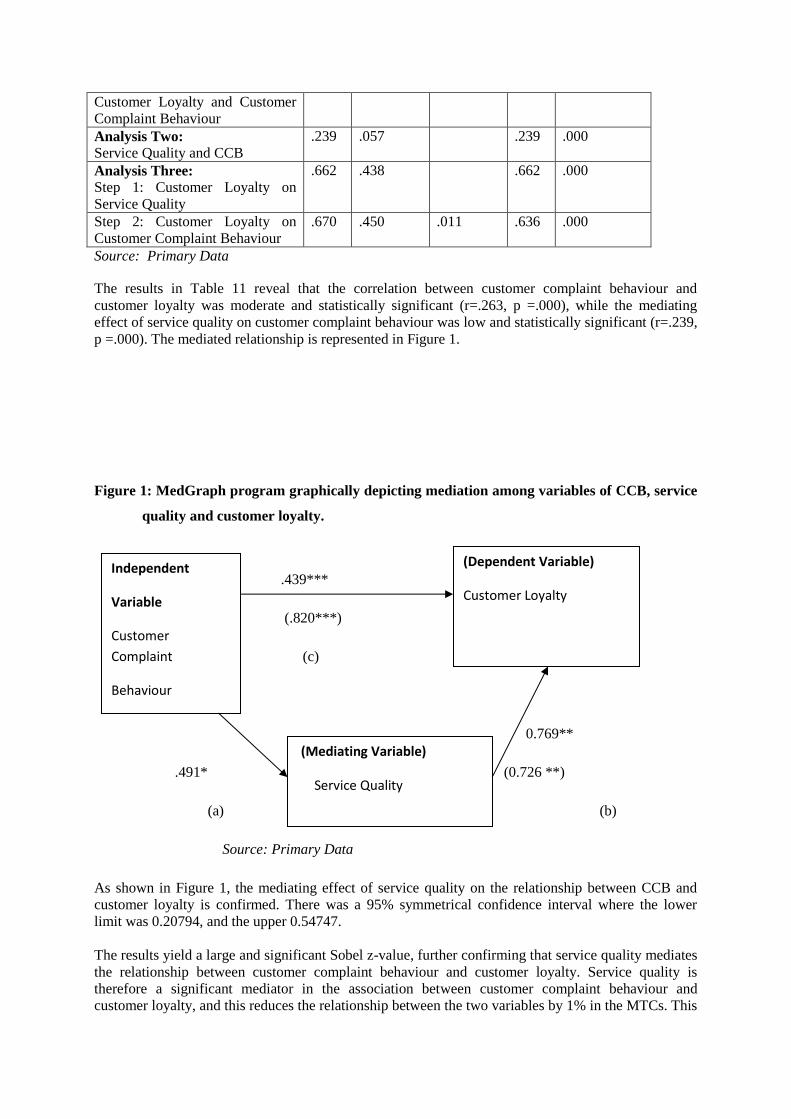
Figure 1: MedGraph program graphically depicting mediation among variables of CCB, service
quality and customer loyalty.
.439***
(.820***)
(c)
0.769**
.491* (0.726 **)
(a) (b)
Source: Primary Data
As shown in Figure 1, the mediating effect of service quality on the relationship between CCB and
customer loyalty is confirmed. There was a 95% symmetrical confidence interval where the lower
limit was 0.20794, and the upper 0.54747.
The results yield a large and significant Sobel z-value, further confirming that service quality mediates
the relationship between customer complaint behaviour and customer loyalty. Service quality is
therefore a significant mediator in the association between customer complaint behaviour and
customer loyalty, and this reduces the relationship between the two variables by 1% in the MTCs. This
(Mediating Variable)
Service Quality
(Dependent Variable)
Customer Loyalty
Independent
Variable
Customer
Complaint
Behaviour
means that the presence of service quality weakens the direct relationship between CCB and customer
loyalty. While service quality accounts for 61.7% of the indirect relationship, the direct relationship
accounts for 61.8%. The main conclusion drawn from the relationship was that service quality
partially mediates the relationship between CCB and customer loyalty in mobile telephone companies
in Uganda. Service quality slightly weakens the direct association between customer complaint
behaviour and customer loyalty.
The unstandardized indirect effect was: a*b =0.37771; SE=0.0866. The direct effect was .820, the
indirect effect was .535, and the indirect to total ratio was .811. The overall total standard
coefficient=.439. Further, service quality has a direct relationship with customer loyalty, Beta=.820.
Customer complaint behaviour and customer loyalty is significantly mediated by service quality,
where Beta=.726**, Sig=.000. There is a relationship between service quality and customer loyalty,
with a statistically significant correlation coefficient of 0.769**.
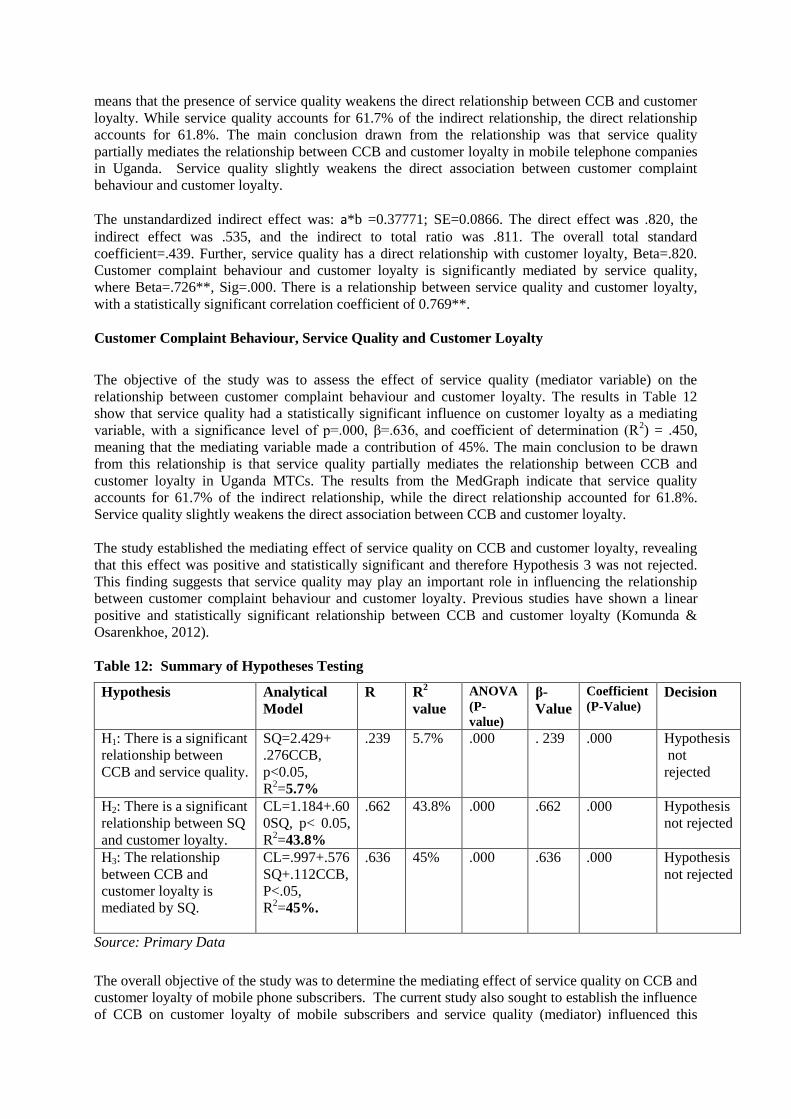
Customer Complaint Behaviour, Service Quality and Customer Loyalty
The objective of the study was to assess the effect of service quality (mediator variable) on the
relationship between customer complaint behaviour and customer loyalty. The results in Table 12
show that service quality had a statistically significant influence on customer loyalty as a mediating
variable, with a significance level of p=.000, β=.636, and coefficient of determination (R2) = .450,
meaning that the mediating variable made a contribution of 45%. The main conclusion to be drawn
from this relationship is that service quality partially mediates the relationship between CCB and
customer loyalty in Uganda MTCs. The results from the MedGraph indicate that service quality
accounts for 61.7% of the indirect relationship, while the direct relationship accounted for 61.8%.
Service quality slightly weakens the direct association between CCB and customer loyalty.
The study established the mediating effect of service quality on CCB and customer loyalty, revealing
that this effect was positive and statistically significant and therefore Hypothesis 3 was not rejected.
This finding suggests that service quality may play an important role in influencing the relationship
between customer complaint behaviour and customer loyalty. Previous studies have shown a linear
positive and statistically significant relationship between CCB and customer loyalty (Komunda &
Osarenkhoe, 2012).
Table 12: Summary of Hypotheses Testing
Hypothesis Analytical
Model
R R2
value
ANOVA
(P-
value)
β-
Value
Coefficient
(P-Value) Decision
H1: There is a significant
relationship between
CCB and service quality.
SQ=2.429+
.276CCB,
p<0.05,
R2=5.7%
.239 5.7% .000 . 239 .000 Hypothesis
not
rejected
H2: There is a significant
relationship between SQ
and customer loyalty.
CL=1.184+.60
0SQ, p< 0.05,
R2=43.8%
.662 43.8% .000 .662 .000 Hypothesis
not rejected
H3: The relationship
between CCB and
customer loyalty is
mediated by SQ.
CL=.997+.576
SQ+.112CCB,
P<.05,
R2=45%.
.636 45% .000 .636 .000 Hypothesis
not rejected
Source: Primary Data
The overall objective of the study was to determine the mediating effect of service quality on CCB and
customer loyalty of mobile phone subscribers. The current study also sought to establish the influence
of CCB on customer loyalty of mobile subscribers and service quality (mediator) influenced this
relationship. The study hypothesized the existence of a significant relationship between CCB and
customer loyalty and the three hypotheses about these relationships were tested using primary data.
This section summarizes the major findings. The results of the study revealed that the influence of
CCB on MTC customer loyalty was positive and statistically significant (β=.263, p<0.05) and was
partially mediated by service quality. The research findings contribute to the general body of
knowledge on consumer behaviour by providing a basis for mediation of the study variables. Service
quality had a positive and significant direct relationship with the other variables, namely CCB and
customer loyalty, and also as a mediating variable.
Conclusion
Service quality had positive and statistically significant direct effect on customer loyalty (p<0.05).
This suggests that any improvements to the quality of services, such as tangibility, service
convenience, network quality, assurance, empathy and responsiveness, have a direct but varying
impact on customer loyalty. The research results showed that to sustain the loyalty of telephone
subscribers the management of MTCs should place an emphasis on various dimensions of SQ when
trying to improve the loyalty of mobile phone subscribers.
Recommendations
Mobile Telephone companies should make it their policy to recruit staff who have (but are not limited
to) soft skills like empathy, reliability and promptly responding to customer complaints. The goal
should be to work towards winning and retaining their subscribers by creating a good impression
through friendly interactions. For successful complaint resolution, MTC management should design
training programs for staff in handling customer complaints. As Gruber (2011) suggests, staff should
go beyond just smiling and provide a warm, hearty response and treat subscribers nicely when
handling complaints.
MTCs should adopt a positive approach when dealing with customer complaints such as “a complaint
is gold,” to help maintain the relationship with the mobile phone subscriber and generate positive
WOM about the company for image creation and, consequently, customer retention. This implies that
management should ensure that their companies encourage dissatisfied customers to complain in order
to express their feelings and suggest how they would best like their problems to be addressed. MTCs
should provide timely, convenient channels for their subscribers to express their disappointment
regarding service failures.
In addition, management should put in place easily accessible avenues through which subscribers can
voice their complaints, in the form of customer care centres, suggestion boxes and 24-hour automated
services to address frequently asked questions, instead of leaving subscribers to complain privately in
their social circles. This can be achieved through prompt service recovery in situations when service
failures are encountered, which lead them to switch, quietly walk away or complain privately to their
social groups through social media like Facebook, WhatsApp and Twitter, or directly to friends and
family. Mobile phone operators should be proactive by anticipating negative WOM and minimizing
such messages from reaching social media or social networks.
Finally, MTC should establish a system for recording all complaints from subscribers, effectively
communicate these complaints to the staff of the company, and then work towards avoiding repeating
the same problems. The notes will be used to find solutions to problems and kept as a record to be
used in the future to avoid recurrences (stability in terms of attribution theory) that may hinder
subscribers from voicing complaints in the future.
Implications of the Study
The findings from this research present a number of issues that have implications for marketing
theory, managerial practices and policy issues. The results of mediation testing have several
managerial implications. CCB and customer loyalty was partially mediated by service quality. This
implies that the mobile telephone companies were considered to provide a quality service customers,
thus boosting customer loyalty; that is, they provided services as promised, were dependable, and were
able to handle subscriber complaints promptly to meet customer expectations. MTC management
should consider and monitor SQ dimensions, especially those of convenience, tangibility and network
quality. Mobile telephone subscribers rated as being important “to a moderate extent” in order to
monitor customer dissatisfaction and to aim to provide services that exceed customer expectations.
Mobile telephone companies need to routinely survey customer complaints to keep track of how
mobile subscribers behave when it comes to complaints, that is, whether they voice them, seek redress,
remain committed to the company or exit, as this impacts their loyalty to the mobile operator. This
enables MTC operators to handle subscriber dissatisfaction as or before it arises.
REFERENCES
Aydin, S. A. & Ozer, O. (2005). The analysis of antecedents of customer loyalty in the Turkish Mobile
Telecom market. European Journal of Marketing, 39 (7/8), 910-925.
Babbie, E. (2010). The Practice of Social Research (12th Ed.). USA: Wadsworth Publishers.
Byarugaba, J.M. (2010). Providers’ perceptions of service quality: A case of Ugandan mobile telephone
service providers. Makerere Business Journal, 10(1),76-99.
Camarero, C. (2007). Relationship orientation or service quality: What is the trigger of performance in
financial services? International journal of Bank Marketing, 25(6), 406-426.
del Rio-Lanza, A.B., Vazquez-Casielles, R. & Diaz-Martin, A.M. (2009). Satisfaction with service recovery:
Perceived justice and emotional responses. Journal of Business Research, 62(8), 775-81.
Fairchild, A.J. & MacKinnon, D.P. (2009). A General Model for Testing Mediation and Moderation Effects,
10(2), 87-99.
Fornell, C. & Westbrook, R.A. (1979). An exploratory study of assertiveness, aggressiveness, and consumer
complaining behavior. W.L. Wilkie (Ed.). Advances in Consumer Research, 6, 105-110. Ann Arbor,
MI: Association for Consumer Research.
Gee, R. Coates, G. & Nicholson M. (2008). Understanding and profitably managing customer loyalty.
Marketing Intelligence and Planning, 4, 359-74.
Grönroos, C (1984). A service quality model and its marketing implications. European Journal of Marketing,
18(4), 36-44.
Gruber, T. (2011). I want to believe they really care: How complaining customers want to be treated by
frontline employees. Journal of Service Management, 22, 1, 85-110.
Hess, R.L., Ganesan, S. & Klein, N.M. (2003). Service failure and recovery: The impact of relationship factors
on customer satisfaction. Journal of the Academy of Marketing Science, 31(2), 127-45.
Hirschman, A.O. (1970). Exit, Voice, and Loyalty: Responses to decline in firms, organizations, and states.
Cambridge, MA: Harvard University Press.
Khan, M.A. (2010). An empirical assessment of service quality of cellular mobile telephone operators in
Pakistan. Asian Social Science, 6(10), 164-177.
Komunda, M. & Osarenkhoe, A. (2012). Remedy or cure? Effects of service recovery on customer satisfaction
and loyalty. Business Process Management Journal, 18(1), 82-103.
Kothari, C.R. (2005) Research Methodology: Methods and Techniques. (p. 468). New Delhi: Wiley Eastern
Ltd.
Lai, F., Hutchinson, J., Li, D. & Bai, C. (2007). An empirical assessment and application of SERVQUAL in
mainland China’s mobile communications industry. International Journal of Quality and Reliability
Management, 24(3), 244-262.
Lee, S., Barker, S. & Kandampully, J. (2008). Technology, service quality, and customer loyalty in hotels:
Australian managerial perspectives. Managing Service Quality. 13(5), 423–432.
Lovelock, C. & Wirtz, J. (2007). Services Marketing: People, technology, strategy (6th Ed.). Upper Saddle
River, NJ: Pearson/Prentice-Hall.
MacKinnon, D.P. & Fairchild A.J. (2009). Current directions in mediation analysis. Journal of the Association
for Psychological Science, 18(1), 16-20.
Market Review (2009). Available: www.ucc.co.ug/MarketReviewMarch2009.pdf.
Michel, S., Bowen, S. & Johnston, R. (2009). Why service recovery fails: Tensions among customer,
employee and process perspectives. Journal of Service Management, 20(3), 253-73.
Mugenda, O.M. & Mugenda, A.G. (2003). Research Methods: Qualitative and quantitative approaches.
African Culture for Technology Studies, Nairobi, Kenya.
Oliver, R.L. (1997). Satisfaction: A behavioural perspective on the consumer. New York, NY: McGraw-Hill
Companies.
Parasuraman,A., Zeithaml, V. & Malhotra, A. (2005). SERVQUAL: A multiple-item scale for assessing
electronic service quality. Journal of Service Research, 7(3), 213-233.
Parasuraman, A., Zeithaml, V.A. & Berry, L.L (1988). SERVQUAL: A multiple-item scale for measuring
consumer perceptions of service quality. Journal of Retailing, 64(1), 12-40.
Ramzi, A. & Mohamed, B. (2010). Customer loyalty and the impacts of service quality: The case of five star
hotels in Jordan. International Journal of Human and Social Sciences, 5(13), 886-892.
Samen, A.A., Akroush, M.N. & Abdul-Lail, B.N. (2012). Mobile SERVQUAL: A comparative analysis of
customers’ and managers’ perceptions. International Journal of Quality and Reliability Management,
30(4), 403-425.
Saunders, M., Lewis, P. & Thornhill, A. (2007). Research Methods for Business Students (4th Ed.). Harlow:
Prentice Hall, Pearson Education Limited.

Seth, A., Momaya. K. & Gupta H.M. (2008). An exploratory investigation of customer loyalty and retention
in cellular mobile communication. Journal of Services Research: December, 173-85.
Uganda Telecommunications Sector Policy Review. Policy review report, (2005). Available at:
www.ucc.co.ug. Uganda Communications Commission (2005). Funding and implementing universal
access: Innovation and experience from Uganda, Kampala. Fountain Publishers Ltd.