Embed Size (px)
Citation preview

Contents of this document are for non-US residents only
Wealth and Investment
Management
Important Information: Please note that the contents of this document are intended for non-US residents only.
In Focus: Markets as we see them
Are European companies inferior?
“The single most important decision in evaluating a business is pricing
power. If you’ve got the power to raise prices without losing business to a
competitor, you’ve got a very good business. And if you have to have a
prayer session before raising the price by 10 percent, then you’ve got a
terrible business.” (Warren Buffett)
Failed expectations
European equities, a consensus overweight among investors for the past several
years, have consistently disappointed fund managers. Between the start of 2015 and
the end of 2016, European equities have underperformed their US counterparts by
13%. This week, we discuss some potential reasons for that underperformance, while
exploring the prospects for European corporate profitability.
Why the underperformance?
European equities have not had it easy. Falling interest rates have eroded net interest
margins within the financial sector, which make up the largest proportion of the
European equity market. Deutsche Bank insolvency fears and a bad-debt-laden Italian
banking sector also weighed on market performance last year. However, European
firms have lagged their US counterparts in terms of raw earnings as well. Eight years
after the Great Recession, European earnings are still languishing below their pre-
recession levels, a milestone passed by US earnings in 2012 (Figure 1).
Despite having to deal with lower structural growth in Europe and a full-blown
sovereign debt crisis, it appears that lower revenue growth isn’t the dominant factor
03 March 2017
For EMEA and Asia distribution only
Inside (click to jump to sections)
Failed expectations European equities,
a consensus overweight among
investors for the past several years,
have consistently disappointed fund
managers
Why the underperformance?
European earnings are still
languishing below their pre-recession
levels, a milestone passed by US
earnings in 2010
The real culprit European firms
appear to be sacrificing their profit
mark-up in order to maintain market
share and sales volumes
Pricing power European firm’s
inability to keep up with rising unit
labour costs may be evidence of a
lack of pricing power
Earnings outlook Corporate pricing
growth should be the main
determinant of European profit
margins for the time being
Investment conclusion The current
improvement in demand conditions
should lead to an improvement in
European profit-mark-ups
Market calls – summary
Selected risks to our views
Asset class summary
Latest market data
Key macroeconomic projections
The case for investing
Figure 1: US earnings growth has outpaced Europe’s Figure 2: European sales surpassed pre-recession highs
Source: Datastream, IBES, Barclays Source: Datastream, IBES, Barclays
0
20
40
60
80
100
120
140
160
180
200
2004 2006 2008 2010 2012 2014 2016
S&P 500 12m forward EPS ($)
MSCI Europe ex-UK 12m forward EPS (E)
Jan 2009 = 100
50
60
70
80
90
100
110
120
Dec-07 Dec-09 Dec-11 Dec-13 Dec-15
MSCI Europe ex-UK 12m trailing EPS (E)
MSCI Europe ex-UK 12m trailing total sales (E)
Dec 2007 = 100

In Focus 03 March 2017 2
behind the gap between European and US earnings. Indeed, European sales have recovered
past pre-recession highs (Figure 2), roughly keeping pace with US corporates (Figure 3 and
4). This suggests that weak profitability is to blame.
Having fallen in tandem during the recession, the gap in net profit margins between
European and US firms has since widened sharply (Figure 5). The poor profitability of
European firms can’t be attributed to tax rates, interest expenses or amortisation costs
either, with EBITDA (earnings before interest, tax, depreciation and amortisation) margins
also subdued relative to the US (Figure 6). European companies have been lagging their US
in terms of return on equity (ROE) too (Figure 7).
The profitability gap cannot even be explained by sector composition. Figure 8 weights each
sector equally, and shows that European corporate profitability still lags that of the US.
Furthermore, we find that the underperformance is broad based, with European firms having
a lower ROE in almost every sector (Figure 9).
The real culprit
At its simplest level, profitability is determined by the gap between the prices charged by
businesses and the marginal costs that they face – the so-called profit mark-up1. Ever since
the Great Recession, European firms have been struggling to increase
product prices at a faster rate than unit labour costs (Figure 10). To put it simply, European
firms appear to be sacrificing their profit mark-up in order to maintain market share and sales
1 How do mark-ups vary with demand? – Macallan, Parker, Bank of England Quarterly Bulletin, Q2 2008
The gap in net profit
margins between
European and US firms
has widened sharply
Figure 3: European sales have kept up with the US Figure 4: European revenue growth comparable with US
Source: Datastream, IBES, Barclays Source: Datastream, IBES, Barclays
60
70
80
90
100
110
120
130
140
2004 2009 2014
S&P 500 12m forward EPS ($)
MSCI Europe ex-UK 12m forward EPS (E)
Jan 2009 = 100
-20
-15
-10
-5
0
5
10
15
20
25
Jan-05 Jan-10 Jan-15
S&P 500 12m trailing total sales ($)
MSCI Europe ex-UK 12m trailing total sales (E)
year-on-year growth (%)
Figure 5: Net profit margin gap between Europe and US Figure 6: EBITDA margin gap between Europe and US
Source: Datastream, Barclays Source: Datastream, Barclays
0
2
4
6
8
10
12
Dec-90 Dec-95 Dec-00 Dec-05 Dec-10 Dec-15
Europe ex-UK US
Net profit margin (%)
5
10
15
20
25
Dec-90 Dec-95 Dec-00 Dec-05 Dec-10 Dec-15
Europe ex-UK US
EBITDA margin (%)

In Focus 03 March 2017 3
volumes. The inability of corporate pricing growth to keep up with unit labour costs may
have contributed to weak profitability, as evidenced by the positive relationship between the
European profit mark-up and net profit margins (Figure 11). US firms, on the other hand, did
not suffer as much as their European counterparts. In general, US companies were able to
increase prices faster than unit labour costs throughout the same period (Figure 12). As
Figure 13 shows, we can see that the US profit mark-up was, on average, higher than Europe
in the years proceeding the Great Recession.
Pricing power
European firm’s inability to keep up with rising unit labour costs may be evidence of a lack of
pricing power relative to competitors. Economic theory tells us that profit mark-up
developments depend, inter alia, on competition factors and on price adjustments relative to
marginal costs. If European firms do indeed tend to be price-takers rather than price-setters,
then the speed of price adjustment is predominantly determined by demand conditions,
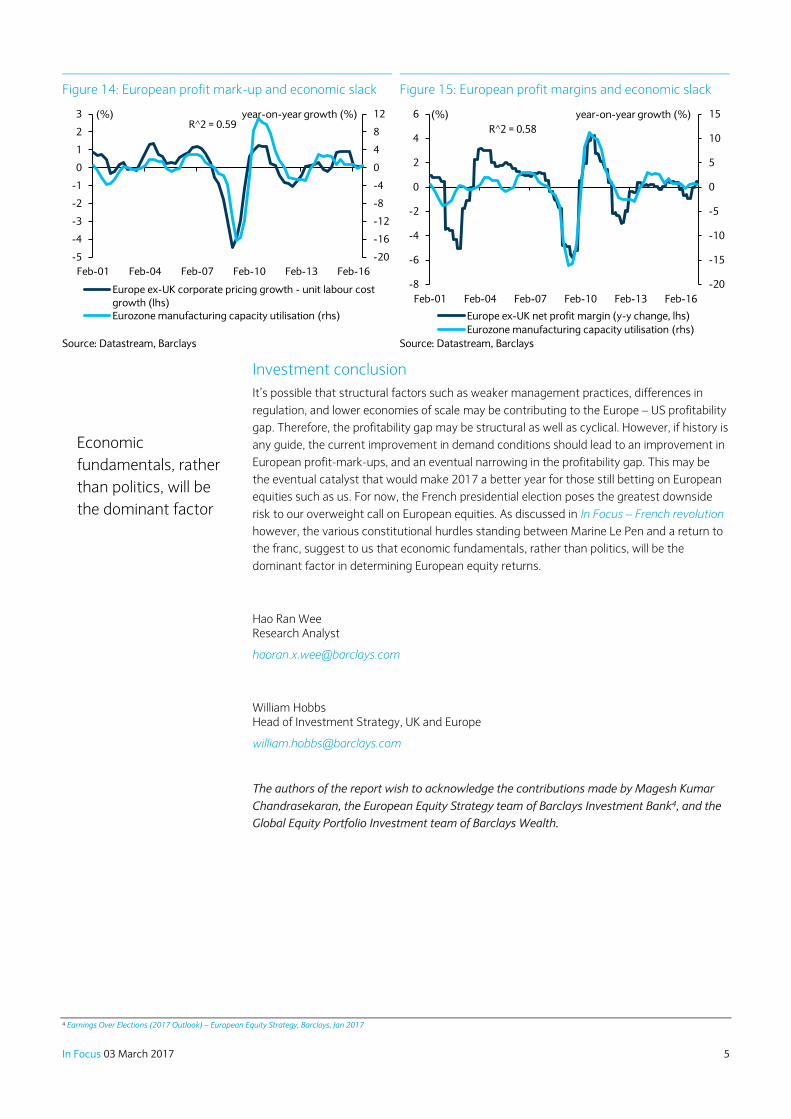
particularly economic slack. Here, the capacity utilisation rate in the manufacturing industry
is often used as a proxy for economic slack2. In fact, past experience shows that a rise in
Europe’s capacity utilisation rate is associated with an increase in the profit mark-up and vice
versa (Figure 14) 3. History tells us that European corporate profits tend to follow suit (Figure
15).
2 The capacity utilisation rate an estimate of the current level of utilisation as a percentage of total production capacity 3 Developments in profit margins – ECB Monthly Bulletin, Nov 2009
Figure 9: European firms less profitable than US counterparts in most sectors
Source: Datastream, Barclays
-12
-10
-8
-6
-4
-2
0
2
4
Tech REITs Cons goods Cons
services
Industrials Materials Utilities Financials Healthcare Telecoms Oil & gas
Average ROE gap (Europe-ex UK minus US, 2010-2017, %)
Figure 7: ROE gap between Europe and US Figure 8: ROE gap after equally-weighting sectors
Source: Datastream, Barclays Source: Datastream, Barclays
0
2
4
6
8
10
12
14
16
18
20
Dec-90 Dec-95 Dec-00 Dec-05 Dec-10 Dec-15
Europe ex-UK US
Return on equity (%)
0
5
10
15
20
25
Dec-90 Dec-95 Dec-00 Dec-05 Dec-10 Dec-15
Europe ex-UK US
Equal-weighted return on equity (%)
The US profit mark-up
was, on average,
higher than Europe

In Focus 03 March 2017 4
Earnings outlook
High unemployment in Europe hints that there remain plenty of workers on the sidelines.
Therefore, unit labour cost growth – already near historical lows – isn’t likely to pick up
anytime soon. As a result, corporate pricing growth should be the main determinant of
European profit margins for the time being. Looking forward, the ongoing economic recovery
in Europe – as shown by the latest round of business confidence surveys – should lead to
better demand conditions for European firms. Assuming that past relationships hold, this
should provide European firms with breathing space to raise their profit mark-up, thus
resulting in a tailwind for profitability and a narrowing of the profitability gap between US and
European firms.
Things are more complicated in the US, where the business cycle seems to be more
advanced relative to Europe. Already, wage growth is picking up steadily as labour market
slack wanes. Interestingly however, we find that the US profit mark-up isn’t correlated to
demand conditions. To be clear, the lack of a clear relationship does not objectively imply the
absence of one, seeing that outside factors such as data issues may be muddying the
picture. However, it may be evidence that US companies have stronger pricing power, and
are thus better able to set prices independent of demand conditions. If that were indeed the
case, it may mean that US profit margins are less vulnerable to rising labour costs, given that
firms have more flexibility to raise prices in response to higher wages.
Figure 10: European profit mark-up Figure 11: European profit mark-up and profit margins
Source: Datastream, Barclays Source: Datastream, Barclays
-2
-1
0
1
2
3
4
5
6
7
Feb-01 Feb-04 Feb-07 Feb-10 Feb-13 Feb-16
Europe ex-UK corporate pricing
Europe ex-UK unit labour costs
year-on-year growth (%)
-8
-6
-4
-2
0
2
4
6
-5
-4
-3
-2
-1
0
1
2
3
Feb-01 Feb-04 Feb-07 Feb-10 Feb-13 Feb-16
Europe ex-UK corporate pricing growth - unit labour cost
growth (lhs)Europe ex-UK net profit margin (y-y change, rhs)
(%) (%)R^2 = 0.53
Figure 12: US profit mark-up Figure 13: European profit mark-up lower than US
Source: Datastream, Barclays Source: Datastream, Barclays
-3
-2
-1
0
1
2
3
4
Feb-01 Feb-04 Feb-07 Feb-10 Feb-13 Feb-16
US corporate pricing US unit labour costs
year-on-year growth (%)
-0.5
-0.4
-0.3
-0.2
-0.1
0
0.1
0.2
0.3
0.4
Europe ex-UK US
Average corporate pricing growth - unit labour cost growth
(2008-2016, %)
Corporate pricing
growth should be the
main determinant of
European profit
margins
In Focus 03 March 2017 5
Investment conclusion
It’s possible that structural factors such as weaker management practices, differences in
regulation, and lower economies of scale may be contributing to the Europe – US profitability
gap. Therefore, the profitability gap may be structural as well as cyclical. However, if history is
any guide, the current improvement in demand conditions should lead to an improvement in
European profit-mark-ups, and an eventual narrowing in the profitability gap. This may be
the eventual catalyst that would make 2017 a better year for those still betting on European
equities such as us. For now, the French presidential election poses the greatest downside
risk to our overweight call on European equities. As discussed in In Focus – French revolution
however, the various constitutional hurdles standing between Marine Le Pen and a return to
the franc, suggest to us that economic fundamentals, rather than politics, will be the
dominant factor in determining European equity returns.
Hao Ran Wee Research Analyst
William Hobbs Head of Investment Strategy, UK and Europe
The authors of the report wish to acknowledge the contributions made by Magesh Kumar
Chandrasekaran, the European Equity Strategy team of Barclays Investment Bank4, and the
Global Equity Portfolio Investment team of Barclays Wealth.
4 Earnings Over Elections (2017 Outlook) – European Equity Strategy, Barclays, Jan 2017
Figure 14: European profit mark-up and economic slack Figure 15: European profit margins and economic slack
Source: Datastream, Barclays Source: Datastream, Barclays
-20
-16
-12
-8
-4
0
4
8
12
-5
-4
-3
-2
-1
0
1
2
3
Feb-01 Feb-04 Feb-07 Feb-10 Feb-13 Feb-16
Europe ex-UK corporate pricing growth - unit labour cost
growth (lhs)
Eurozone manufacturing capacity utilisation (rhs)
(%) year-on-year growth (%)R^2 = 0.59
-20
-15
-10
-5
0
5
10
15
-8
-6
-4
-2
0
2
4
6
Feb-01 Feb-04 Feb-07 Feb-10 Feb-13 Feb-16
Europe ex-UK net profit margin (y-y change, lhs)
Eurozone manufacturing capacity utilisation (rhs)
(%) year-on-year growth (%)
R^2 = 0.58
Economic
fundamentals, rather
than politics, will be
the dominant factor

In Focus 03 March 2017 6
Investment conclusions
1. Strategically: corporate securities preferred to
government, and stocks to bonds
There remain unfulfilled economic opportunities
to exploit for the corporate sector in our view.
Bonds look expensive, with positive real returns
likely hard to achieve even if inflationary
pressures remain benign.
2. Tactically: we remain overweight equities
Continuing economic growth and unremarkable
valuations should continue to combine to
generate attractive returns for equity investors.
Market calls – summary Macro economy summary
The prospects for the world economy are brightening, as
evidenced by the continued pickup in business confidence
surveys across the major economies. Headline inflation has
bounced, as the transitory effects of past commodity price
falls have been washed out of the data. The more visible pick
up in US nominal wages suggest that underlying inflationary
pressure is already on an upward trajectory.
Upcoming elections in core Eurozone countries remain high
on the list of worries for investors. However, investors would
do well to remember the link between corporate profits and
political risk is tenuous, and the presence of significant
political barriers against further referenda in the core
European countries should provide some comfort.
For now, China remains lower down our global list of
concerns. Fears regarding the pace of capital outflows have
resurfaced. However, further outflows or currency depreciation wouldn’t pose a huge risk to the financial system, given how
little China relies on external financing.
More broadly, we believe the world economy will continue to grow and see the cycle end as a relatively distant prospect. The
political backdrop is set to remain noisy in 2017, but investors will be best served by tuning much of this out and focusing on
the above described fundamentals in our view.
Total returns across key asset classes
2.0%
2.7%
-0.5%
8.7%
5.9%
3.3%
0.8%
-0.3%
0.1%
2.5%
4.1%
11.8%
11.2%
7.5%
10.9%
6.2%
3.9%
0.4%
Alternative Trading Strategies*
Real Estate
Commodities
Emerging Markets Equities
Developed Markets Equities
High Yield and Emerging Markets Bonds
Investment Grade Bonds
Developed Government Bonds
Cash & Short-maturity Bonds
2016 2017 (through 2 March)
*As of 1st March; Source: FactSet, Barclays. List of indices used: Cash & Short-Maturity Bonds: Barclays US T-Bills (USD); Developed Government Bonds: Barclays Global
Treasury (USD Hgd); Investment Grade Bonds: Barclays Global Aggregate - Corporates (USD Hgd); High Yield & Emerging Market Bonds: 40% Barclays Global HY (USD
Hgd), 30% Barclays EM Hard Currency Aggregate (USD Hgd), 30% Barclays EM Local Currency Government (USD); Developed Market Equities: MSCI World Net TR
(USD); Emerging Market Equities: MSCI EM Net TR (USD); Commodities: Bloomberg Commodity TR (USD); Real Estate: FTSE EPRA/NAREIT Net TR (USD); ATS: HFRX
Global Hedge Fund (USD).
Christian Theis, CFA +44 (0)20 3555 8409
In Focus 03 March 2017 7
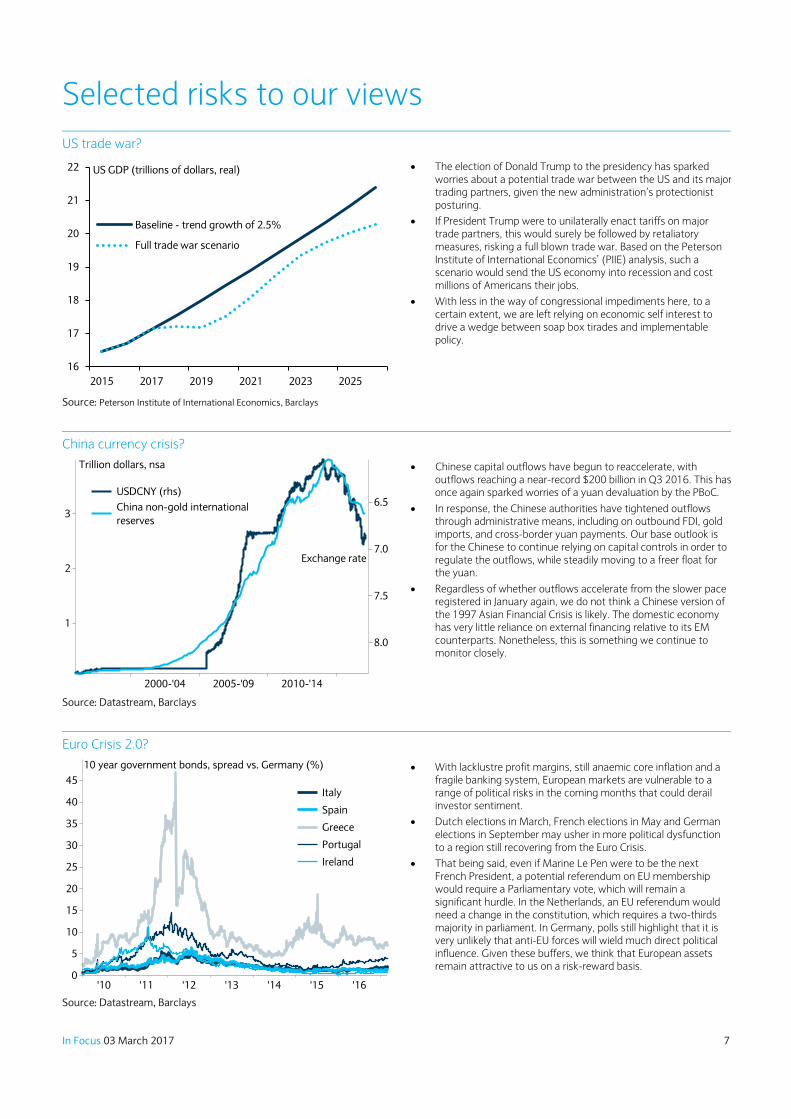
Selected risks to our views
US trade war?
The election of Donald Trump to the presidency has sparked worries about a potential trade war between the US and its major trading partners, given the new administration’s protectionist posturing.
If President Trump were to unilaterally enact tariffs on major trade partners, this would surely be followed by retaliatory measures, risking a full blown trade war. Based on the Peterson Institute of International Economics’ (PIIE) analysis, such a scenario would send the US economy into recession and cost millions of Americans their jobs.
With less in the way of congressional impediments here, to a certain extent, we are left relying on economic self interest to drive a wedge between soap box tirades and implementable policy.
Source: Peterson Institute of International Economics, Barclays
China currency crisis?
Chinese capital outflows have begun to reaccelerate, with outflows reaching a near-record $200 billion in Q3 2016. This has once again sparked worries of a yuan devaluation by the PBoC.
In response, the Chinese authorities have tightened outflows through administrative means, including on outbound FDI, gold imports, and cross-border yuan payments. Our base outlook is for the Chinese to continue relying on capital controls in order to regulate the outflows, while steadily moving to a freer float for the yuan.
Regardless of whether outflows accelerate from the slower pace registered in January again, we do not think a Chinese version of the 1997 Asian Financial Crisis is likely. The domestic economy has very little reliance on external financing relative to its EM counterparts. Nonetheless, this is something we continue to monitor closely.
Source: Datastream, Barclays
Euro Crisis 2.0?
With lacklustre profit margins, still anaemic core inflation and a fragile banking system, European markets are vulnerable to a range of political risks in the coming months that could derail investor sentiment.
Dutch elections in March, French elections in May and German elections in September may usher in more political dysfunction to a region still recovering from the Euro Crisis.
That being said, even if Marine Le Pen were to be the next French President, a potential referendum on EU membership would require a Parliamentary vote, which will remain a significant hurdle. In the Netherlands, an EU referendum would need a change in the constitution, which requires a two-thirds majority in parliament. In Germany, polls still highlight that it is very unlikely that anti-EU forces will wield much direct political influence. Given these buffers, we think that European assets remain attractive to us on a risk-reward basis.
Source: Datastream, Barclays
16
17
18
19
20
21
22
2015 2017 2019 2021 2023 2025
Baseline - trend growth of 2.5%
Full trade war scenario
US GDP (trillions of dollars, real)
2
3
1
6.5
7.0
7.5
8.0
2005-'09 2010-'142000-'04
USDCNY (rhs)
China non-gold international
reserves
Trillion dollars, nsa
Exchange rate
0
5
10
15
20
25
30
40
35
45
'13'12'11'10 '16'15'14
Italy
Spain
Greece
Portugal
Ireland
10 year government bonds, spread vs. Germany (%)
In Focus 03 March 2017 8
Asset class summary We maintain a Strategic Asset Allocation for five risk profiles, based on our outlook for each
asset class. Our Tactical Allocation Committee (TAC), made up of our senior investment
strategists and portfolio managers, regularly assesses the need for tactical adjustments to
those allocations, based on our shorter-term (three to six month) outlook. Here, we share
our latest thinking on our key tactical tilts.
Developed Market Equities: Overweight (changed 27 January 2017)
Forecasters remain locked in a debate as to how much of the new US administration’s
various, fluid and often contradictory proposals to factor in. In the meantime, leading
indicators for the world economy continue to point to brighter times ahead, independent of
those policy proposals. These firming prospects for global growth and inflation are what
matter for trends in corporate earnings and therefore prospective equity market returns.
With stock market valuations much less remarkable than the caricature, prospective returns
are likely dominated by those aforementioned global growth prospects rather than valuation
multiple expansion. The current yield available from developed world stocks (dividends plus
net buybacks), allied to a conservative assessment of prospective dividend growth suggests
mid to high single digit annualised returns are still well within reach from current levels.
The US remains our highest conviction overweight, thanks to a domestic economy that is
furthest along the recovery path and a dominant share of a technology sector enjoying both
cyclical and structural growth tailwinds. We do not see the proposed tax cuts having a
material effect on trend economic growth and so would advise viewing their effects as
similar to that inflicted by the oil price plunge of 2014/15 – a temporary phenomenon that
has no impact on already healthy trends.
The gradual reduction in domestic economic slack should lead to better pricing and higher
profit margins for continental European corporations, which would help them finally start to
make good that yawning earnings gap vs. their US peers. Catch-up potential may be higher
in Europe, but our conviction remains a little lower than for the US.
Emerging Market Equities: Overweight (increased 23 November 2016)
We moved our recommended tactical position in Emerging Market Equities up to
Overweight from Neutral in November 2017. The Emerging Market business cycle is
bottoming, as evidenced by business confidence surveys and trade data. The latter has
clearly collapsed and recovered in value terms due to commodity price swings, but the latest
round of business confidence surveys have stabilised. US consumption also looks healthy,
with wages now more visibly picking up and credit provision following suit. This suggests to
us that the fundamental macroeconomic backdrop has turned more positive for Emerging
Market corporate profitability.
Within Emerging Market Equities, Asia remains our preferred region, with Korea, Taiwan and
China (offshore) our highest conviction country bets on a strategic basis. With the regions’
earnings sensitive to the trade cycle, what President Trump decides to implement in regards
to trade policy is important. Here, we suspect that economic self-interest will ultimately
triumph over some of the President’s more populist trade threats.
Cash & Short-Maturity Bonds: Underweight (decreased 23 November 2016)
While cash continues to play a pivotal portfolio insulation role, the rising appeal from
Emerging Market Equities has led the Tactical Allocation Committee to deploy our cash
holdings into the former, bringing our position in Cash & Short-Maturity Bonds from neutral
to underweight.
Our favoured developed
equity regions remain
the US and Europe ex-
UK
The backdrop for
Emerging Market
corporate profitability
has turned more
positive...

In Focus 03 March 2017 9
Developed Government Bonds: Underweight (decreased 13 October 2016)
Nominal yields offered by large chunks of the government bond universe are still negligible,
even after the fairly dramatic sell off seen since last summer. Investors will likely have to work
hard to make real returns from these levels over the next several years. Our view remains
that such valuations underestimate the underlying inflationary pressures within the US
economy in particular, something that incoming inflation data pay some testament to. For
us, the level of (returns insensitive) central bank ownership probably suggests that the bond
market will remain more or less orderly and may lag a pick-up in inflation. Nonetheless, our
continuing small strategic and tactical allocation to the area suggests that higher real returns
lie elsewhere.
Investment Grade Bonds: Underweight
The spread of investment grade credit over government bond yields has held more or less
firm amidst the above mentioned correction; however this has still left investors nursing
some short term bruises particularly within the utilities space. Nominal yields in high quality
corporate credit remain low in absolute terms and may make the job of those trying to make
positive real returns difficult.
High Yield & Emerging Market Bonds: Overweight (increased 13 October 2016)
Last summer we moved from a tactical underweight to overweight position in High Yield and
Emerging Market Bonds by adding to Global High Yield. This was funded by moving from a
tactical overweight to neutral position in Cash & Short-Maturity Bonds. Given our more
sanguine take on the various risks to global growth and inflation, yields on junk credit look
attractive on a risk-reward basis. We neutralised our earlier underweight position in Local
Currency Emerging Market Bonds last October, again using Cash & Short Maturity bonds.
Commodities: Neutral (Increased 13 May 2016)
We closed our long-held underweight in the commodity complex last May. US monetary
normalisation will likely provide a headwind, but the stabilisation in Chinese growth looks
sufficient to offset this for the moment. Although the prospects for greater US infrastructure
spending have increased a little in the wake of the US elections, we would still take some of
the more grandiose claims with a pinch of salt, just as we would tread carefully around the
recent related spike in industrial metals prices (which is already starting to unwind).
Investors are likely best served by tilting their commodity exposure towards oil and away
from gold where possible, with the latter still particularly vulnerable to further US interest
rate rises. We see oil prices continuing to drift higher over the coming 12 – 18 months as the
market’s worst fears on China fail to materialise and a smaller than suspected surplus is
worked through.
Real Estate: Neutral
Recent volatility has served as a timely reminder of the importance of maintaining a
diversified portfolio with the ability to weather a number of market environments, and we
continue to encourage clients to ensure that they are fully allocated to Real Estate.
Alternative Trading Strategies: Underweight (decreased 13 May)
We shifted our previous tactical underweight in Commodities to Alternative Trading
Strategies (ATS). This is primarily a function of the difference in volatilities for the two asset
classes. There is less risk being underweight the lower volatility ATS in the current market
environment in our opinion. Alongside this, regulation and lower leverage leave this
diversifying asset class without much tactical appeal at the moment.
Some returning inflation
is central to our current
tactical posture
Investors are likely best
served by tilting their
exposure towards oil
and away from Gold
where possible

In Focus 03 March 2017 10
Equities
MSCI indices Yield
Total Return Performance
Global Market
Capitalisation
(%)
EPS growth (%)
P/E ratio (x)
2017 2018 LTM1
10 Year Ave.
LTM1 1 Week YTD 5Yr Ann. 2017 2018
Developed markets 2.4 0.2 5.9 9.5 89.2 12.1 10.9 17.1 15.4 18.7 15.2
US 2.0 0.8 6.8 13.3 53.9 10.4 12.3 18.6 16.6 20.1 15.9
Europe ex UK 3.2 0.6 4.1 5.8 14.3 11.7 10.6 15.4 13.9 16.9 13.7
UK 3.9 -0.6 3.7 3.0 5.8 19.6 8.2 14.7 13.6 16.8 12.7
Japan 2.0 -1.1 4.6 7.3 7.7 12.3 9.4 14.9 13.6 16.3 n/m
Asia ex Japan 2.4 -0.8 9.8 3.5 9.2 14.9 10.2 12.9 11.8 14.6 13.7
Emerging markets 2.5 -1.6 8.7 -0.4 10.8 16.6 11.2 12.4 11.1 14.1 12.5 1 LTM = Last Twelve Months, i.e. trailing. Source: FactSet, Datastream, Barclays
Developed markets – sectors
MSCI indices Yield
Total Return Performance
Global Market
Capitalisation
(%)
EPS growth (%)
P/E ratio (x)
2017 2018 LTM1
10 Year Ave.
LTM1 1 Week YTD 5Yr Ann. 2017 2018
Developed markets 2.4 0.2 5.9 9.5 89.2 12.1 10.9 17.1 15.4 18.7 15.2
Energy 3.6 0.2 -4.2 -1.6 5.9 168.9 33.1 23.4 17.6 49.7 16.1
Materials 2.1 -0.7 6.7 1.3 4.5 29.5 3.7 16.7 16.1 19.8 15.5
Industrials 2.2 0.6 6.1 10.2 10.0 9.9 10.8 17.8 16.1 19.5 15.8
Cons. Discretionary 1.9 0.2 5.4 12.5 10.9 11.0 11.4 16.9 15.1 18.5 18.3
Consumer Staples 2.6 -0.1 6.1 10.4 8.7 8.7 8.4 20.4 18.8 21.7 17.7
Health Care 2.0 1.3 8.9 14.4 11.0 5.1 9.4 16.4 15.0 17.1 15.3
Financials 2.9 0.0 5.8 11.0 16.0 10.1 10.1 13.4 12.2 14.5 13.7
IT 1.4 0.3 10.1 13.6 13.6 10.0 11.8 18.9 16.9 20.2 17.2
Telecom. Services 4.2 -0.8 0.6 8.3 2.8 0.5 8.9 15.0 13.7 15.1 14.0
Utilities 3.8 1.2 4.7 6.2 2.8 0.7 7.0 16.4 15.3 16.4 15.4 1 LTM = Last Twelve Months, i.e. trailing. Source: FactSet, Datastream, Barclays
Fixed income Total Return Performance
95
100
105
110
115
120
31-Dec 31-Mar 30-Jun 30-Sep 31-Dec
US 10 Year Government Global IG Global high yield
Key Fixed Income Indices (31-Dec-15=100, USD Hedged)
Index Yield 1 Week YTD 5Yr Ann.
Global inv. Grade 2.7 -0.3 0.8 4.2
Financials 2.5 -0.2 0.9 4.8
Industrials 2.8 -0.3 0.7 3.6
Utilities 2.8 -0.3 0.6 4.8
High yield global 5.3 0.3 3.1 7.6
US 5.5 0.5 3.2 6.9
Europe 3.8 0.3 2.3 9.2
US 10Y 2.5 -0.8 -0.3 1.7
Euro 10Y 0.3 -0.8 -0.3 5.1
UK 10Y 1.1 0.2 1.1 4.7
Performance represents local currency/USD hedged returns.
Commodities
Price Level
Total Return Performance
75
100
125
31-Dec 31-Mar 30-Jun 30-Sep 31-Dec
Overall Ener. Ind. met. Prec. met. Agri.
Key Commodity Indices (31-Dec-15=100, USD)
DJ-UBS 1 Week YTD 5Yr Ann.
Energy -2.2 -11.9 -18.4
Brent crude 53.59 $/bbl -3.1 -4.8 -19.4
Industrial metals 1.4 8.7 -7.2
Copper 5,918 $/tonne 1.2 6.9 -8.2
Precious metals -1.7 7.9 -8.5
Gold 1,241.8 $/oz -1.5 6.9 -6.9
Agriculture 0.6 4.1 -6.7
Corn 3.55 $/bushel 1.9 5.8 -11.2
Commodities -0.4 -0.5 -9.9
Source for all figures on this page: FactSet, Datastream, Barclays.
All data as of close of business (COB) 2nd March and in USD unless stated otherwise – see following page for more performance figures.

In Focus 03 March 2017 11
Performance Equities
Total Return Performance
QTD YTD 1 Year
2 Yr
Ann.
3 Yr
Ann.
5 Yr
Ann.
12m to
02.03.16
12m to
02.03.15
12m to
02.03.14
12m to
02.03.13 2016 2015 2014 2013 2012
Developed markets 5.9 5.9 18.8 4.1 5.4 9.5 -8.8 8.1 22.0 10.4 7.5 -0.9 4.9 26.7 15.8
US 6.8 6.8 22.0 7.4 10.0 13.3 -5.5 15.3 24.7 12.4 10.9 0.7 12.7 31.8 15.3
Europe ex UK 4.1 4.1 11.5 -1.7 -2.5 5.8 -13.4 -3.9 28.7 10.8 -0.6 -0.6 -6.5 27.6 21.3
UK 3.7 3.7 9.2 -4.3 -4.0 3.0 -16.1 -3.5 23.1 6.3 -0.1 -7.6 -5.4 20.7 15.3
Japan 4.6 4.6 16.2 4.2 5.6 7.3 -6.6 8.5 14.7 5.1 2.4 9.6 -4.0 27.2 8.2
Asia ex Japan 9.8 9.8 21.9 0.3 3.9 3.5 -17.6 11.6 -0.2 6.2 5.4 -9.2 4.8 3.1 22.4
Emerging markets 8.7 8.7 24.6 -0.3 1.4 -0.4 -20.3 4.8 -5.9 0.1 11.2 -14.9 -2.2 -2.6 18.2
MSCI AC World 6.2 6.2 19.4 3.6 5.0 8.4 -10.0 7.7 18.4 9.0 7.9 -2.4 4.2 22.8 16.1
Developed markets – sectors
Total Return Performance
QTD YTD 1 Year
2 Yr
Ann.
3 Yr
Ann.
5 Yr
Ann.
12m to
02.03.16
12m to
02.03.15
12m to
02.03.14
12m to
02.03.13 2016 2015 2014 2013 2012
Developed markets 5.9 5.9 18.8 4.1 5.4 9.5 -8.8 8.1 22.0 10.4 7.5 -0.9 4.9 26.7 15.8
Energy -4.2 -4.2 21.0 -2.6 -6.0 -1.6 -21.6 -12.4 13.4 -2.1 26.6 -22.8 -11.6 18.1 1.9
Materials 6.7 6.7 33.1 1.5 0.7 1.3 -22.5 -0.8 8.3 -3.7 22.5 -15.3 -5.1 3.4 11.3
Industrials 6.1 6.1 22.0 6.0 5.8 10.2 -7.8 5.2 23.8 10.9 12.9 -2.1 0.4 32.1 16.0
Cons. Discretionary 5.4 5.4 14.1 3.4 6.0 12.5 -6.3 11.4 31.1 15.5 3.1 5.5 3.9 39.2 24.3
Consumer Staples 6.1 6.1 7.5 4.6 7.4 10.4 1.7 13.3 11.6 18.5 1.6 6.4 7.3 21.3 13.4
Health Care 8.9 8.9 9.2 0.4 5.9 14.4 -7.8 17.9 35.2 22.1 -6.8 6.6 18.1 36.3 17.5
Financials 5.8 5.8 31.3 6.4 6.0 11.0 -13.7 5.3 19.6 18.2 12.5 -3.4 3.2 27.3 29.4
IT 10.1 10.1 28.2 10.5 13.6 13.6 -4.7 19.9 28.1 1.1 11.5 4.8 16.1 28.7 13.3
Telecom. Services 0.6 0.6 2.6 1.4 2.8 8.3 0.3 5.7 26.2 8.4 5.7 2.5 -1.9 31.2 6.4
Utilities 4.7 4.7 9.2 3.9 4.2 6.2 -1.2 4.7 17.1 2.0 6.0 -6.6 15.3 12.6 1.8
Fixed income & Cash
Total Return Performance
QTD YTD 1 Year
2 Yr
Ann.
3 Yr
Ann.
5 Yr
Ann.
12m to
02.03.16
12m to
02.03.15
12m to
02.03.14
12m to
02.03.13 2016 2015 2014 2013 2012
US treasury bill 3 month 0.1 0.1 0.4 0.2 0.2 0.1 0.1 0.0 0.1 0.1 0.3 0.1 0.0 0.1 0.1
Cash & short-mat. Bonds 0.1 0.1 0.4 0.3 0.2 0.2 0.1 0.1 0.1 0.1 0.4 0.1 0.1 0.1 0.1
Developed gov. Bonds -0.3 -0.3 0.6 2.0 3.7 3.3 3.4 7.2 1.6 3.7 3.9 1.4 8.1 0.1 4.5
Investment grade 0.8 0.8 6.1 2.6 3.9 4.2 -0.8 6.6 2.3 7.2 6.2 -0.2 7.6 0.1 10.9
Financials 0.9 0.9 5.3 2.7 3.8 4.8 0.3 6.0 3.2 9.6 4.5 1.4 6.7 2.0 14.4
Industrials 0.7 0.7 6.8 2.5 3.8 3.6 -1.7 6.5 1.5 5.3 7.3 -1.4 7.8 -1.4 8.2
Utilities 0.6 0.6 5.8 2.7 5.0 4.8 -0.4 9.9 1.9 6.8 7.3 -0.6 11.3 -0.8 9.2
High yield global 3.1 3.1 18.6 7.3 5.9 7.6 -3.0 3.2 7.3 13.1 15.6 -0.7 2.6 6.5 19.2
US 3.2 3.2 20.3 5.8 4.8 6.9 -6.9 2.8 8.4 11.7 17.1 -4.5 2.5 7.4 15.8
Europe 2.3 2.3 14.1 5.8 6.1 9.2 -1.9 6.5 12.0 16.5 10.6 2.0 5.8 10.5 28.8
HY&EM Bonds 3.3 3.3 13.4 4.6 3.8 4.5 -3.5 2.0 1.1 10.6 10.9 -3.1 2.0 0.2 17.6
US 10Y -0.3 -0.3 -3.3 0.3 2.8 1.7 4.1 8.0 -3.8 4.2 0.9 1.0 10.9 -7.6 4.3
Euro 10Y -0.3 -0.3 0.8 1.8 5.9 5.1 2.8 14.7 1.2 6.9 5.9 0.2 16.7 -2.6 7.6
UK 10Y 1.1 1.1 5.6 5.6 7.7 4.7 5.6 11.9 -2.9 3.9 9.3 0.8 15.6 -6.1 3.8
Performance represents local currency/USD hedged returns.
Commodities & other diversifying asset classes
Total Return Performance
QTD YTD 1 Year
2 Yr
Ann.
3 Yr
Ann.
5 Yr
Ann.
12m to
02.03.16
12m to
02.03.15
12m to
02.03.14
12m to
02.03.13 2016 2015 2014 2013 2012
Energy -11.9 -11.9 20.9 -20.2 -29.0 -18.4 -47.3 -43.8 11.7 -9.6 16.3 -38.9 -39.3 5.2 -9.4
Brent crude -4.8 -4.8 28.7 -18.8 -29.9 -19.4 -48.8 -47.8 5.2 -5.9 25.4 -45.6 -47.6 7.2 7.6
Industrial metals 8.7 8.7 25.3 0.0 -2.9 -7.2 -20.2 -8.4 -12.1 -14.6 19.9 -26.9 -6.9 -13.6 0.7
Copper 6.9 6.9 21.3 -1.5 -6.3 -8.2 -20.0 -15.2 -10.2 -11.6 15.7 -25.1 -16.6 -8.8 5.0
Precious metals 7.9 7.9 2.9 0.9 -3.8 -8.5 -0.9 -12.7 -19.0 -11.1 9.5 -11.5 -6.7 -30.8 6.3
Gold 6.9 6.9 -1.7 0.3 -2.8 -6.9 2.4 -8.8 -16.3 -8.7 7.7 -10.9 -1.7 -28.7 6.1
Agriculture 4.1 4.1 10.2 -2.8 -9.8 -6.7 -14.2 -22.4 -4.0 0.2 2.1 -15.6 -9.2 -14.3 4.0
Corn 5.8 5.8 -2.6 -10.3 -14.9 -11.2 -17.3 -23.4 -25.6 20.2 -9.8 -19.2 -13.3 -30.3 19.0
Commodities -0.5 -0.5 14.2 -7.4 -13.3 -9.9 -24.9 -23.9 -1.3 -8.0 11.8 -24.7 -17.0 -9.5 -1.1
Real Estate 2.7 2.7 7.8 0.7 5.5 7.7 -6.0 16.0 3.5 19.1 4.1 -0.8 15.0 3.7 27.7
ATS 2.0 2.0 7.4 -0.6 -0.4 1.4 -7.9 0.0 5.5 2.7 2.5 -3.6 -0.6 6.7 3.5
Source for all figures on this page: FactSet, Datastream, Barclays.
All data as of close of business (COB) 2nd March and in USD unless stated otherwise.

In Focus 03 March 2017 12
Barclays key macroeconomic projections Figure 1: Real GDP and consumer prices (% y-o-y)
Real GDP Consumer prices
2016F
2017F
2018F
2016F
2017F
2018F
Global 3.1
3.6
3.8
1.7
2.5
2.4
Advanced 1.6
1.8
2.0
0.7
2.1
2.0
Emerging 4.2
4.9
5.1
3.2
3.3
3.1
United States 1.6
2.1
2.5
1.3
2.5
2.6
Euro area 1.7
1.5
1.6
0.2
1.8
1.3
Japan 1.0
1.3
1.2
-0.3
0.7
0.8
United Kingdom 1.8 1.5 1.3 0.7
2.5
2.1
China 6.7
6.4
6.1
2.0
2.5
2.3
Brazil -3.5
0.5
2.0
8.7
4.4
5.2
India 6.9 7.9
8.0
4.9
4.9
5.3
Russia -0.5
1.1
1.9
7.1
4.7
4.1
Source: Barclays Research, Global Economics Weekly, 24 February
Note: Arrows appear next to numbers if current forecasts differ from previous week by 0.2pp or more. Weights used for real GDP are based on
IMF PPP-based GDP (5yr centred moving averages). Weights used for consumer prices are based on IMF nominal GDP (5yr centred moving
averages). Aggregates for CPI exclude Argentina and Venezuela. There can be no guarantees that these projections will be achieved.
Wealth and Investment Management equity sector recommendations
Figure 1: Global sector strategy (% relative to GICS) – a zero indicates a neutral or GICS benchmark position
Figure 2: MSCI developed markets – sector forward PE ratios
US Eu x UK UK
Energy 1.5 1.5 1.5
Materials 0 0 0
Industrials 1.5 1.5 1.5
Consumer Discretionary 0 0 0
Consumer Staples -3.0 -3.0 -3.0
Health Care -1.5 0 0
Financials 1.5 3.0 3.0
Information Technology 1.5 0 0
Real Estate 0 0 0
Telecommunication Services 0 -1.5 -1.5
Utilities -1.5 -1.5 -1.5
Source: Barclays Source: MSCI, FactSet, Barclays
Figure 3: MSCI developed markets - sector return on equity
Figure 4: MSCI developed markets - sector forward EPS growth
Source: MSCI, FactSet, Barclays Source: IBES, Datastream, Barclays
0
5
TCom UtilEner CSta Heal Fina ITMats Indu CDis
Current
10-year average
±one standard deviation
Forward PE relative to market (x)
0
2
-2
4
-4
6
-6
8
-8
-10
-12
TCom UtilEner CSta Heal Fina ITMats Indu CDis
Current
10-year average
±one standard deviation
Relative return on equity (%)
0
10
-10
20
-20
30
-30
40
50
60
80
100
120
70
90
110
TCom UtilEner CSta Heal Fina ITMats Indu CDis
Current
10-year average
±one standard deviation
Forward eps growth relative to market (%)

In Focus 03 March 2017 13
The case for investing Global real GDP
Growth is the norm, not the exception.
Most years, world output grows because of the simple interaction of new technology and the learning curve.
The inference is that you have to find good reasons for betting against that trend and not with it, as has been the prevailing wisdom in the aftermath of the great financial crisis.
Source: Datastream, Barclays
Growth of global GDP and asset classes
The future is of course unknowable. However, in addition to being able to suggest that it is more likely that the world will grow than not, we can also point to historic performance of the major asset classes relative to cash and both nominal and real GDP as an argument for both diversification and being invested in the first place.
As our colleagues in Behavioural Finance are regularly at pains to point out, it is not so much about timing the market but time in the market.
Source: Datastream, Barclays. List of indices used: Equities MSCI World (USD) until 2001, MSCI AC World (USD) from 2001 onwards; Bonds Merrill
Lynch US Treasury 7-10 years until 1980, Datastream 10 year US treasuries from 1980 onwards; Cash Federal Reserve US treasury bill 3 month
Historical frequency of equity market gains/losses
Historically, equity market returns have been positive a lot more than 50% of the time over the long term.
Although equity markets are not the only source of investor returns, it is stocks that are going to provide the bulk of the long-term returns to investment portfolios.
This ultimately means that an investor looking to grow assets above inflation will likely have to accept an investment portfolio that will be reasonably correlated to equity markets over time.
Source: Datastream, Barclays
80
100
120
160
140
180
1970-'79 1990-'991980-'89 2000-'09
Real GDP
Nominal GDP
Equities
Bonds
Cash
Index (USD, logarithm,1973=100)
53% 56%61%
78%
89%
-47% -44%-39%
-22%-11%
-60%
-40%
-20%
0%
20%
40%
60%
80%
100%
1 Day 1 Week 1 Month 1 Year 5 Years
Losses Gains
Historical frequency of MSCI World gains/losses in USD since end of 1969/1971
(start of monthly/daily data respectively)

In Focus 03 March 2017 14
The case for investing
Minimum/maximum real return of US assets
Those able to buy and hold for longer periods may have a different perspective on the risks inherent in the major asset classes anyway.
Deeper real annualised losses have come from bonds and cash when the holding period is extended to 10 years or more.
The profile of real returns and losses is significantly more attractive for stocks over 10 and 20 year holding periods.
Source: Datastream, Barclays
Median equity returns around market peaks
Avoiding bear markets is an industry obsession. Understandably so – the work of Nobel laureate Daniel Kahneman and his colleague Amos Tversky tells us that ‘losses loom larger than gains’ for the average investor.
However, the fact that most bear markets are preceded by a rush of blood that tends to outweigh the bloodletting that inevitably follows should temper how carefully we listen to the more persistent doomsayers.
Being too early to call the end of the cycle tends to be more costly than missing the bear market altogether.
Source: FactSet, Barclays
-50 -25 0 25 50
1 year
5 year
10 year
20 year
Cash
Bonds
Equities
US assets: annualised
maximum and minimum
real returns over various
periods (%)
14
-12
-2
21
-15
6
45
-1
54
-20
-10
0
10
20
30
40
50
60
Before After Net
6 months 12 months 24 months
Median S&P 500 total returns around market peaks (%, 1937-2007)

In Focus 03 March 2017 15
This document has been prepared by the wealth and investment management division of Barclays Bank plc (“Barclays”), for information
purposes only. Barclays does not guarantee the accuracy or completeness of information which is contained in this document and which is stated
to have been obtained from or is based upon trade and statistical services or other third party sources. Any data on past performance, modelling
or back-testing contained herein is no indication as to future performance. No representation is made as to the reasonableness of the
assumptions made within or the accuracy or completeness of any modelling or back-testing. All opinions and estimates are given as of the date
hereof and are subject to change. The value of any investment may fluctuate as a result of market changes. The information in this document is
not intended to predict actual results and no assurances are given with respect thereto.
The information contained herein is intended for general circulation. It does not take into account the specific investment objectives, financial
situation or particular needs of any particular person. The investments discussed in this publication may not be suitable for all investors. Advice
should be sought from a financial adviser regarding the suitability of the investment products mentioned herein, taking into account your specific
objectives, financial situation and particular needs before you make any commitment to purchase any such investment products. Barclays and its
affiliates do not provide tax advice and nothing herein should be construed as such. Accordingly, you should seek advice based on your particular
circumstances from an independent tax advisor. Neither Barclays, nor any affiliate, nor any of their respective officers, directors, partners, or
employees accepts any liability whatsoever for any direct or consequential loss arising from any use of or reliance upon this publication or its
contents, or for any omission. Past performance does not guarantee or predict future performance. The information herein is not intended to
predict actual results, which may differ substantially from those reflected.
The products mentioned in this document may not be eligible for sale in some states or countries, nor suitable for all types of investors. This
document shall not constitute an underwriting commitment, an offer of financing, an offer to sell, or the solicitation of an offer to buy any
securities described herein, which shall be subject to Barclays’ internal approvals. No transaction or services related thereto is contemplated
without Barclays’ subsequent formal agreement. Unless expressly stated, products mentioned herein are not guaranteed by Barclays Bank plc or
its affiliates or any government entity.
This document is not directed to, nor intended for distribution or use by, any person or entity in any jurisdiction or country where the publication
or availability of this document or such distribution or use would be contrary to local law or regulation, including, for the avoidance of doubt, the
United States of America. It may not be reproduced or disclosed (in whole or in part) to any other person without prior written permission. You
should not take notice of this document if you know that your access would contravene applicable local, national or international laws. The
contents of this publication have not been reviewed or approved by any regulatory authority.
Barclays Capital Inc., Member SIPC, Barclays Bank plc and / or their affiliated companies and/or the individuals associated therewith (in various
capacities) may already have or intend to: (i) seek investment banking or other business relationships for which they already receive or will
receive compensation from the companies that are the subject of this publication (“Researched Companies”), such as underwriting, advising, and
lending – as such, it is possible that Barclays Capital Inc., Barclays Bank plc or their affiliated companies may have managed or co-managed a
public offering of securities for any issuer mentioned in this document within the last three years.; (ii) have an interest in the Researched
Companies by acting making a market or dealing as principal in securities issued by Researched Companies or in options or other derivatives
based thereon, or otherwise hold personal interests in the Research Companies; (iii) appoint employees or associates as directors or officers of
the Researched Companies; (iv) act upon the contents of this publication prior to your having received it; (v) effect transactions which are not
consistent with the recommendations given herein.
Barclays offers wealth and investment management products and services to its clients through Barclays Bank PLC and its subsidiary
companies. Barclays Bank PLC is registered in England and authorised by the Prudential Regulation Authority and regulated by the Financial Conduct
Authority and the Prudential Regulation Authority. Registered No. 1026167. Registered Office: 1 Churchill Place, London E14 5HP.
Cyprus – Barclays offers banking, wealth and investment management products and services to its clients through Barclays Bank PLC and its
subsidiaries. Barclays Bank PLC is registered in England and authorised by the Prudential Regulation Authority and regulated by the Financial Conduct
Authority and the Prudential Regulation Authority. Registered No. 1026167. Registered Office: 1 Churchill Place, London E14 5HP. Barclays Bank PLC is
regulated by the Central Bank of Cyprus in the conduct of its banking and investment business in Cyprus. France – Barclays Bank PLC, Succursale en
France - Principal établissement : 32 avenue George V - 75008 Paris - RCS Paris B 381 066 281 - C.C.P. 62-07 Paris - Siège social à Londres E14 5HP,
Angleterre, 1, Churchill Place - Reg N° 1026167 - Capital autorisé 3 040 001 000 de Livres Sterling. BARCLAYS BANK PLC est un établissement de crédit,
intermédiaire en assurance (l'immatriculation auprès du FCA peut être contrôlée sur le site internet www.orias.fr ), prestataire de service d’investissement
de droit anglais agréé par the Financial Conduct Authority (FCA), autorité de tutelle britannique qui a son siège social 25 The North Colonnade, Canary
Wharf, Londres E14 5HS. (www.fca.org.uk), FCA register n° 122702 La Succursale française de Barclays Bank PLC, est autorisée par le FCA à recourir à un
Agent lié, Barclays Patrimoine SCS. Gibraltar – Barclays offers banking, wealth and investment management products and services to its clients through
Barclays Bank PLC and its subsidiaries. Barclays Bank PLC is registered in England and authorised by the Prudential Regulation Authority and regulated by
the Financial Conduct Authority and the Prudential Regulation Authority. Registered No. 1026167. Registered Office: 1 Churchill Place, London E14
5HP. Barclays Bank PLC is authorised by the Gibraltar Financial Services Commission to conduct banking and investment business in Gibraltar. Guernsey
– Barclays offers wealth and investment products and services to its clients through Barclays Bank PLC and its subsidiary companies. Barclays Bank PLC
is registered in England and authorised by the Prudential Regulation Authority and regulated by the Financial Conduct Authority and the Prudential
Regulation Authority. Registered Number: 1026167. Registered Office: 1 Churchill Place, London E14 5HP. Barclays Bank PLC, Guernsey Branch is licensed
by the Guernsey Financial Services Commission under the Banking Supervision (Bailiwick of Guernsey) Law 1994, as amended, and the Protection of
Investors (Bailiwick of Guernsey) Law 1987, as amended. Barclays Bank PLC, Guernsey Branch has its principal place of business at Le Marchant House, St
Peter Port, Guernsey, GY1 3BE. Ireland – Barclays Bank Ireland PLC is regulated by the Central Bank of Ireland. Registered in Ireland. Registered Number:
396330. Registered Office: Two Park Place, Hatch Street, Dublin 2. Calls may be recorded for security and other purposes. Barclays Bank PLC is registered
in England and authorised by the Prudential Regulation Authority and regulated by the Financial Conduct Authority and the Prudential Regulation
Authority. Registered No. 1026167. Registered Office: 1 Churchill Place, London E14 5HP. Isle of Man – Barclays offers wealth and investment products
and services to its clients through Barclays Bank PLC and its subsidiary companies. Barclays Bank PLC is registered in England and authorised by the
Prudential Regulation Authority and regulated by the Financial Conduct Authority and the Prudential Regulation Authority. Registered Number: 1026167.
Registered Office: 1 Churchill Place, London E14 5HP. Barclays Bank PLC, Isle of Man Branch is licensed by the Isle of Man Financial Services
Authority. Barclays Bank PLC, Isle of Man Branch has its principal business address in the Isle of Man at Barclays House, Victoria Street, Douglas, Isle of
Man, IM99 1AJ. Italy – Barclays offers wealth and investment management products and services to its clients through Barclays Bank PLC and its
subsidiary companies. Barclays Bank PLC is registered in England and authorised by the Prudential Regulation Authority and regulated by the Financial
Conduct Authority and the Prudential Regulation Authority. Registered No. 1026167. Registered Office: 1 Churchill Place, London E14 5HP. Barclays Bank
PLC – Via della Moscova. 18 – 20121 Milan – Italy, is a branch of Barclays Bank PLC and is registered with the Register of Banks Milan n° 4862. Company
Register Milan n° 80123490155 – R.E.A. Milan 1040254 – Fiscal Code n° 80123490155 – Registered VAT n° 04826660153. Jersey – Barclays offers

In Focus 03 March 2017 16
wealth and investment products and services to its clients through Barclays Bank PLC and its subsidiary companies. Barclays Bank PLC is registered in
England and authorised by the Prudential Regulation Authority and regulated by the Financial Conduct Authority and the Prudential Regulation Authority.
Registered Number: 1026167. Registered Office: 1 Churchill Place, London E14 5HP. Barclays Bank PLC, Jersey Branch is regulated by the Jersey Financial
Services Commission. Barclays Bank PLC, Jersey Branch is regulated by the Guernsey Financial Services Commission under the Protection of Investors
(Bailiwick of Guernsey) Law 1987 as amended. Barclays Bank PLC. Jersey Branch has its principal business address in Jersey at 13 Library Place, St Helier,
Jersey JE4 8NE, Channel Islands. Monaco – Barclays Bank PLC – Monaco is a branch of Barclays Bank PLC with its offices in the Principality of Monaco at
31 Avenue de la Costa, MC 98000 Monaco – Tel. +377 93 15 35 35. Registered with the Monaco Chamber of Commerce and Industry under No° 68 S
01191. Registered VAT No° FR 40 00002674 9. Nigeria – Barclays offers wealth and investment management products and services to its clients
through Barclays Bank PLC and its subsidiaries. Barclays Bank PLC is registered in England and authorised by the Prudential Regulation Authority and
regulated by the Financial Conduct Authority and the Prudential Regulation Authority. Registered No.1026167. Registered Office: 1 Churchill Place,
London E14 5HP. Barclays Group Representative Office (NIG) Ltd. Registered Company No: RC41757 and its mailing address is Barclays Group
Representative Office (NIG) Ltd, Courier Department, 3rd Floor, 1 Churchill Place, London, E14 5HP Portugal – Barclays offers wealth and investment
management products and services to its clients through Barclays Bank PLC and its subsidiary companies. Barclays Bank PLC is registered in England and
authorised by the Prudential Regulation Authority and regulated by the Financial Conduct Authority and the Prudential Regulation Authority. Registered
No. 1026167. Registered Office: 1 Churchill Place, London E14 5HP. Barclays Bank PLC activity in Portugal is supervised by Banco de Portugal (BoP) and
Comissão de Mercado de Valores Mobiliários (CMVM). Qatar – Barclays offers wealth and investment management products and services to its clients
through Barclays Bank PLC and its subsidiary companies. Barclays Bank PLC is registered in England and is authorised by the Prudential Regulation
Authority and regulated by the Financial Conduct Authority and the Prudential Regulation Authority. Registered No. 1026167. Registered Office: 1
Churchill Place, London E14 5HP. Barclays Bank PLC in the Qatar Financial Centre (Registered No. 00018) is authorised by the Qatar Financial Centre
Regulatory Authority. Barclays Bank PLC QFC Branch may only undertake the regulated activities that fall within the scope of its existing QFCRA
authorisation. Principal place of business in Qatar: Qatar Financial Centre, Office 1002, 10th Floor, QFC Tower, Diplomatic Area, West Bay, PO Box 15891,
Doha, Qatar. This information has been distributed by Barclays Bank PLC. Related financial products or services are only available to Business Customers
as defined by the QFCRA. Singapore and Hong Kong – Barclays offers wealth and investment management products and services to its clients
through Barclays Bank PLC and its subsidiaries. Barclays Bank PLC is registered and incorporated in England and authorised by the Prudential Regulation
Authority and regulated by the Financial Conduct Authority and the Prudential Regulation Authority. Its members have limited liability. Registered No.
1026167. Registered Office: 1 Churchill Place, London E14 5HP. Barclays Bank PLC Singapore Branch is a licensed bank in Singapore and is regulated by
the Monetary Authority of Singapore. Registered Address:10 Marina Boulevard, #24-01 Marina Bay Financial Centre Tower 2, Singapore 018983. Barclays
Bank PLC Hong Kong Branch is registered with the Hong Kong Securities and Futures Commission (CE No. AAJ160) and is authorised and regulated by the
Hong Kong Monetary Authority. Main business address in Hong Kong: 41/F Cheung Kong Center, 2 Queen’s Road Central, Hong Kong. Switzerland –
Barclays Bank (Suisse) SA is a Bank registered in Switzerland and regulated and supervised by FINMA. Registered No. CH-660.0.118.986-6. Registered
Office: Chemin de Grange-Canal 18-20, P.O. Box 3941, 1211 Geneva 3, Switzerland. Registered branch: Beethovenstrasse 19, P.O. Box, 8027 Zurich.
Registered VAT No. CHE-106.002.386. Barclays Bank (Suisse) SA is a subsidiary of Barclays Bank PLC registered in England, authorised by the Prudential
Regulation Authority and regulated by the Financial Conduct Authority and the Prudential Regulation Authority. It is registered under No. 1026167 and its
registered office is 1 Churchill Place, London E14 5HP. United Arab Emirates (Dubai) – Barclays offers wealth and investment management products
and services to its clients through Barclays Bank PLC and its subsidiary companies. Barclays Bank PLC is registered in England and authorised by the
Prudential Regulation Authority and regulated by the Financial Conduct Authority and the Prudential Regulation Authority. Registered No. 1026167.
Registered Office: 1 Churchill Place, London E14 5HP. Barclays Bank PLC (DIFC Branch) (Registered No. 0060) is regulated by the Dubai Financial Services
Authority. Barclays Bank PLC (DIFC Branch) may only undertake the financial services activities that fall within the scope of its existing DFSA licence.
Related financial products or services are only available to Professional Clients as defined by the DFSA. Principal place of business in the DIFC: Dubai
International Financial Centre, The Gate Village Building No. 10, Level 6, PO Box 506674, Dubai, U.A.E.