Embed Size (px)
Citation preview

ASIAN DEVELOPMENT BANK
AsiAn Development BAnk6 ADB Avenue, Mandaluyong City1550 Metro Manila, Philippineswww.adb.org
Public Debt Sustainability in Developing Asia: An Update
The paper updates debt sustainability analysis (DSA) for developing Asia, conducted in 2011. With the benefit of hindsight, the accuracy of the earlier debt ratio forecasts and underlying macroeconomic assumptions is assessed. In general, the standard DSA is found able to predict debt ratios fairly accurately. The fan chart analysis confirms the importance of integrating stochastic analysis to the standard DSA. Looking forward, debt ratio projections suggest benign outlook remains for the region as a whole, country heterogeneity notwithstanding. The importance of macroeconomic forecast accuracy is emphasized and the need to capture volatility by appropriate risk analysis tools is suggested.
About the Asian Development Bank
ADB’s vision is an Asia and Pacific region free of poverty. Its mission is to help its developing member countries reduce poverty and improve the quality of life of their people. Despite the region’s many successes, it remains home to the majority of the world’s poor. ADB is committed to reducing poverty through inclusive economic growth, environmentally sustainable growth, and regional integration.
Based in Manila, ADB is owned by 67 members, including 48 from the region. Its main instruments for helping its developing member countries are policy dialogue, loans, equity investments, guarantees, grants, and technical assistance.
PUBlic DeBt SUStAinABility in DeveloPing ASiA: An UPDAteBenno Ferrarini and Arief Ramayandi
adb economicsworking paper series
no. 468
december 2015
ADB Economics Working Paper Series
Public Debt Sustainability in Developing Asia: An Update Benno Ferrarini and Arief Ramayandi
No. 468 | December 2015
Benno Ferrarini ([email protected]) and Arief Ramayandi ([email protected]) are Senior Economists at the Economic Research and Regional Cooperation Department, Asian Development Bank. We would like to thank Michael Angelo Cokee, Cynthia Petalcorin, and Dennis Sorino for their excellent research assistance.
ASIAN DEVELOPMENT BANK

Asian Development Bank 6 ADB Avenue, Mandaluyong City 1550 Metro Manila, Philippines www.adb.org
© 2015 by Asian Development Bank December 2015 ISSN 2313-6537 (Print), 2313-6545 (e-ISSN) Publication Stock No. WPS157799-2
The views expressed in this paper are those of the authors and do not necessarily reflect the views and policies of the Asian Development Bank (ADB) or its Board of Governors or the governments they represent.
ADB does not guarantee the accuracy of the data included in this publication and accepts no responsibility for any consequence of their use.
By making any designation of or reference to a particular territory or geographic area, or by using the term “country” in this document, ADB does not intend to make any judgments as to the legal or other status of any territory or area.
Note: In this publication, “$” refers to US dollars.
The ADB Economics Working Paper Series is a forum for stimulating discussion and eliciting feedback on ongoing and recently completed research and policy studies undertaken by the Asian Development Bank (ADB) staff, consultants, or resource persons. The series deals with key economic and development problems, particularly those facing the Asia and Pacific region; as well as conceptual, analytical, or methodological issues relating to project/program economic analysis, and statistical data and measurement. The series aims to enhance the knowledge on Asia’s development and policy challenges; strengthen analytical rigor and quality of ADB’s country partnership strategies, and its subregional and country operations; and improve the quality and availability of statistical data and development indicators for monitoring development effectiveness.
The ADB Economics Working Paper Series is a quick-disseminating, informal publication whose titles could subsequently be revised for publication as articles in professional journals or chapters in books. The series is maintained by the Economic Research and Regional Cooperation Department.

CONTENTS FIGURES iv ABSTRACT v I. INTRODUCTION 1 II. PUBLIC DEBT SUSTAINABILITY ANALYSIS: 2016 VERSUS 2012 2 III. AN EX POST EVALUATION OF 2012–2016 DEBT RATIO PROJECTIONS 4 A. Review of Earlier Debt Sustainability Analysis Projections 4 B. A Reassessment of 2011 Fan Chart Analysis 8 IV. LOOKING FORWARD: DEBT RATIO PROJECTIONS TO 2020 10 V. FAN CHART DEBT RATIO PROJECTIONS TO 2020 12 VI. CONCLUSIONS 17 ANNEXES 19 REFERENCES 37

FIGURES FIGURES 1 Public Debt Scenarios—Asian Regions 3 2 DSA 2011 versus Actual Public Debt Ratio 9 3 Contributions to Change in Public Debt in Developing Asia 11 4 Central Asia DSA Charts 13 5 Southeast Asia DSA Charts 14 6 East Asia DSA Charts 15 7 South Asia DSA Charts 16 8 The People’s Republic of China DSA Charts 17

ABSTRACT Our previous assessment of debt sustainability in developing Asia, conducted in 2011, found that the region’s fiscal outlook was mostly benign. In this study we update the debt sustainability assessment, taking stock of the latest data and including a larger number of countries. With the benefit of hindsight, we assess the accuracy of our earlier debt ratio forecasts and the underlying macroeconomic assumptions. By and large, we find that standard debt sustainability analysis (DSA) represents a valid forecasting tool, able to predict debt ratios fairly accurately under reasonable assumptions and circumstances. Further, our fan chart analysis confirms the importance for stochastic analysis to integrate standard DSA, in order to capture heightened macroeconomic volatility, which we observe for some countries in the region. Looking forward to 2020, debt ratio projections confirm that the outlook remains benign for the region as a whole, country heterogeneity notwithstanding. On the issue of DSA methods and implementation, we emphasize the importance of macroeconomic forecast accuracy and suggest that volatility be captured by risk analysis tools that would optimally flank the standard DSA framework. Keywords: debt-to-GDP ratio, fan charts, public debt sustainability, sovereign debt JEL Classification: E62, H63, H68
I. INTRODUCTION Developing Asia's outlook has somewhat complicated but remains positive overall, 4 years since the publication of Public Debt Sustainability in Developing Asia (Ferrarini, Jha, and Ramayandi 2012). Having enacted large fiscal packages to stem the 2009 trade plunge from the global financial crisis, most countries in developing Asia reined in spending and emergency support and their fiscal stance has returned to a more prudent regional normal. Economic growth slowed in some countries, including the People’s Republic of China (PRC) and India, but the region kept expanding at more than 6% each year since 2012 despite a sluggish and testing global economic environment.1 Real interest rates stayed low and average inflation in the region fell by about one percentage point since 2012, to less than 3% in 2015. Moderate exchange rate fluctuations reflected markets’ perceptions, mainly about anticipated United States (US) interest rate hikes on the one hand and the lingering Euro crisis on the other, less so out of any particular regional or national concerns.
Although the macroeconomic outlook remains positive overall, challenges across the region
abound. Policy makers have been handling episodes of sharp capital outflows in response to monetary policy uncertainties, commodity price movements, and uneven global economic performance. This followed sizable capital inflows in the wake of unconventional monetary policies and widening growth differentials with advanced economies suffering the global financial crisis. For example, Kazakhstan and oil exporters in the region more generally have been facing low oil prices that saw revenues dwindle and fall short of high fiscal spending governments have been unwilling or unable to rein in. Authorities from the PRC had to deal with jittery stock markets amid a growth slowdown that has proven difficult to administer, signaling the frailty of the endeavored transition toward domestic consumption and services, away from massive government injections and investment overkill last seen in response to the 2009 global trade collapse. India saw its economy rebound from a severe slowdown in 2011–2012 but has yet to deliver on the deep reforms pledged by the Modi administration. Mongolia has been facing deep financing gaps due to low commodity export revenues coupled with a plunge in foreign direct investment inflows. Indonesia’s currency has been depreciating markedly over a prolonged period of time, raising the pressure on macroeconomic management, particularly of the substantial share of foreign-currency denominated private external debt.
Notwithstanding domestic challenges and a testing global economic environment, the regional
outlook remains upbeat: ADB (2015) forecasts 6.3% average regional growth in both 2015 and 2016. Sustained growth, low interest rates and prudent fiscal policy support the expectation that public debt in the region is on a sustainable track, in line with what had been our conclusion from debt sustainability analyses conducted in 2011. The purpose of this paper is to ascertain whether or not such expectations are supported by the latest Asian Development Bank (ADB) and International Monetary Fund (IMF) macroeconomic and fiscal forecasts available at this time of writing.2 Our assessment is based on both deterministic and stochastic debt sustainability analysis. With the benefit of hindsight, we also assess the extent to which our past forecast assumptions were reliable and debt ratio projections proved accurate. Underlying the analysis is the public debt database we created in 2011 and now update and expand to include the latest variables and indicators available for ADB’s developing member countries.
The next section briefly describes the standard debt sustainability assessment method
generating our updated debt ratio forecasts for 2016–2020. Section III evaluates the accuracy of our
1 ADB (2015), GDP-weighted regional average. 2 The data cutoff in this paper is 30 September 2015.

2 | ADB Economics Working Paper Series No. 468
past debt ratio projections and macroeconomic forecast assumptions. Section IV updates the projections with our latest macroeconomic and fiscal assumptions, extending baseline debt ratio projections to 2020. Section V applies the stochastic debt sustainability analysis (DSA) framework to a selection of Asian economies, to produce fan chart projections of their debt ratios. Section VI concludes.
II. PUBLIC DEBT SUSTAINABILITY ANALYSIS: 2016 VERSUS 2012 Public debt sustainability analysis (DSA)—as adopted by the IMF, the World Bank, as well as ADB and other institutions—is predicated on identifying the primary fiscal balance adjustment necessary to keep the debt ratio to GDP stable or declining. For market-access countries, this essentially entails projecting the debt ratio to GDP over a 5-year horizon, premised on the latest macroeconomic forecasts and fiscal policy assumptions available. The assumed path of fiscal policy (the baseline) is deemed sustainable if the projected debt ratio is not increasing indefinitely and thus the government's intertemporal budget constraint is satisfied, at least in theory.3 Stress or bound test projections, involving less favorable fiscal and macroeconomic assumptions compared to the baseline, assess whether any such scenario significantly alters the debt trajectory and the conclusions as regards the stability of a country’s debt ratio.4
(1)
(∆ debt ratio) (real interest rate) (growth rate) (exchange rate) (primary (other) surplus)
In terms of the DSA equation (1) a rise in the ratio of public debt to GDP with respect to the
previous year is explained by higher real interest rates , slower real growth of GDP , lower inflation , and unfavorable exchange rate movements increasing the domestic burden of the foreign-currency denominated portion of debt . The vector represents all factors with a bearing on the debt ratio other than the debt flow dynamics that the equation explicitly identifies. This includes off-budget operations, such as government stand-behind guarantees and other hidden and contingent liabilities, as well as debt relief and other stock-flow reconciliations.5 Off-budget liabilities affect the evolution of the debt ratio significantly, but their timing and entity is difficult to predict and largely eludes DSA forecasts.
Ferrarini and Ramayandi (2012) computed the DSA equation for a sample of 24 Asian countries,
reflecting data availability as of September 2011. Debt ratio projections for the period 2012–2016 were summarized and plotted for five geographical subregions: Central Asia (Armenia, Azerbaijan, Georgia, Kazakhstan, the Kyrgyz Republic, and Tajikistan); East Asia (the PRC, the Republic of Korea, and Mongolia); the Pacific (Fiji, Papua New Guinea, Solomon Islands, and Tonga); South Asia (Bangladesh, Bhutan, India, Sri Lanka, Nepal, and Pakistan); and Southeast Asia (Indonesia, Malaysia, the Philippines, Thailand, and Viet Nam). In addition, stochastic DSA for 8 countries—Georgia, the PRC, the Republic of Korea, India, Indonesia, the Philippines, Thailand, and Viet Nam—were also included.
3 See Adams and Ferrarini (2010) for a fuller discussion on the conditions for debt sustainability. 4 Similarly, external (as opposed to public) debt sustainability analysis projects the external debt ratio in function of a
country’s noninterest current account balance and the endogenous debt dynamics determined by the interest rate, growth rate, inflation, and exchange rates changes. As in Ferrarini and Ramayandi (2012), focus here is on public debt, not the external aspects of sustainability.
5 See Hemming (2012) for a discussion of these liabilities for the case of the PRC.

Public Debt Sustainability in Developing Asia: An Update | 3
Figure 1: Public Debt Scenarios—Asian Regions(% of GDP)
Central Asia East Asia
The Pacific South Asia
Southeast Asia
GDP = gross domestic product. Note: Projection years are 2012–2016 and 2016–2020. Central Asia comprises Armenia, Azerbaijan, Georgia, Kazakhstan, the Kyrgyz Republic, and Tajikistan. East Asia comprises the People's Republic of China, the Republic of Korea, and Mongolia. The Pacific comprises Fiji, Papua New Guinea, Solomon Islands, and Tonga. South Asia comprises Bangladesh, Bhutan, India, Nepal, Pakistan, and Sri Lanka. Southeast Asia comprises Indonesia, Malaysia, the Philippines, Thailand, and Viet Nam. Source: Authors' estimates using data from International Monetary Fund (IMF), Article IV Consultation; IMF, World Economic Outlook April 2015; World Bank, World Development Indicators; IMF, Fiscal Monitor April 2015; Asian Development Bank, Asian Development Outlook 2015 Update; and CEIC Data Company (all accessed 30 September 2015).
10
20
30
40
50
60
70
2000 20202011 20155
15
25
35
45
55
2000 20202011 2015
20
30
40
50
60
70
80
2000 20202011 201540
50
60
70
80
2000 20202011 2015
30
40
50
60
2000 20202011 2015
Baseline 2011 Actual/Baseline 2015 Historical scenario 2011Historical scenario 2015 Baseline 2011 revised IMF Article IV 2015

4 | ADB Economics Working Paper Series No. 468
Four years later, we here update standard and stochastic debt sustainability analyses for the same set of 24 countries, based on the latest data and macroeconomic statistics and forecasts available (see Annex 1 and 2 for the detailed source and availability of our updated database). Projections spanning from 2016 to 2020 are based on the latest ADB (for 2016) and the IMF (for 2017–2020) country forecasts of primary fiscal deficits and the rates of economic growth, interest, and inflation, as well as of exchange rates to the US dollar.6
Figure 1 plots the 2011 (old) and 2015 (new) projection lines, which are labeled with reference
to the base year for scenario computations, after which projections start. Shown are the baseline, reflecting forecast assumptions, and the historical scenario, where debt drivers are assumed to be at their 10-year average values up to the year preceding projections.7 Also shown is an alternative 2011 baseline, which computes the debt ratio ex post, based on the primary balance, interest, growth, inflation, and exchange rates as they are actually observed for the period 2012–2016. Finally, Figure 1 plots the IMF’s debt ratio baseline for 2016–2020, for comparison with our own baseline projections.
III. AN EX POST EVALUATION OF 2012–2016 DEBT RATIO PROJECTIONS Prior to discussing the updated debt ratio forecasts, we look at past projections. This will allow us to assess the reliability of the DSA framework as a forecasting tool and also shed light on the accuracy of the macroeconomic assumptions underlying our previous debt ratio projections. Specifically, we compare regional debt ratio projections up to 2016 with the actual observations that have become available since the time of analysis. Our review focuses on regional debt ratios based on the deterministic DSA framework on the one hand, and on country-specific stochastic fan chart analysis on the other.
A. Review of Earlier Debt Sustainability Analysis Projections
As a realism check on assumptions, our debt sustainability assessments conducted in 2011 included a historical scenario that projects debt ratios with macroeconomic and fiscal variables held at their historical track record.8 Figure 1 shows that historical debt ratio projections are mostly lower than the baseline, suggesting that assumptions underlying the latter would not have been deemed entirely unrealistic at that time, given the knowledge of past trends.
However, from a forward-looking perspective, actual debt ratios are seen diverging from their
projected paths, and projections made in 2011 appear somewhat optimistic: baseline scenarios projected average debt ratios to drop, but actually they are higher now than they were in 2011. This generally holds for all five of the regional country aggregates and is most evident in the East and South Asian regions, where debt ratios are seen rising substantially. 6 The forecasts are as of 30 September 2015. ADB macroeconomic forecasts are drawn from the Asian Development
Outlook 2015 Update report (ADB 2015). ADB forecasts are integrated with the IMF forecasts, as reflected in the World Economic Outlook Spring 2015 report and in various IMF country documents.
7 In Figure 1, this scenario involves variables being kept at their 10-year historical average levels (2001–2010) throughout the period of projection (2012–2016). Also included in DSA are stress tests, envisaging less favorable macroeconomic assumptions than those underlying the baseline. To avoid clutter, stress tests are not shown in Figure 1.
8 In an attempt for DSA to anticipate and correct faulty assumptions observed in relation to previous debt sustainability assessments, Ferrarini and Ramayandi (2012) go as far as to explicitly incorporate those discrepancies into debt ratio projections, with an opposite sign. Debt ratios for all regions shift up as a result, thus conveying an additional element of caution as regards the expected accuracy of DSA. However, such corrections are of limited effect because they do not affect the debt ratio’s baseline trend, which remains upward or downward regardless of any corrective shift.

Public Debt Sustainability in Developing Asia: An Update | 5
Having established that projections were not at odds with past trends, the reason for such
discrepancies may be ascribed to either inaccurate assumptions concerning the endogenous debt dynamics or to the realization of factors not accounted for in the analysis. A comparison of the 2011 baseline, based on assumptions, with its revised variant, based on actual observations, suggests that inaccurate macroeconomic and fiscal assumptions account for unrealistic debt ratio projections to a significant extent.
For the East Asia aggregate, for example, faulty assumptions explain much of the forecasting
error: the original baseline slopes downward, which is clearly at odds with the observed debt ratio, which increases in fact. Revising the baseline for it to reflect the actual rather than assumed macroeconomic environment aligns it with the actual debt ratio, especially if it is shifted upward to correct for the revision in the 2011 data since the time of the original projections were made. Put differently: the DSA framework would have predicted East Asia’s aggregate debt ratio quite accurately, had it been relying on more realistic forecast assumptions.
Inaccurate assumptions also explain much of the discrepancy for the Central Asia aggregate, as
seems to be confirmed by revised baseline closely resembling the actual debt ratio up to 2016. That seems not to be the case for the Pacific aggregate, where revising the baseline with the benefit of hindsight slightly lowers its capacity to explain the actual debt ratio. However, both the original and revised baselines are aligned with the observed trend of the debt ratio and roughly capture the forces bearing on the debt dynamics.
Not so for baseline projections concerning the South and Southeast Asian aggregates. In either
case, baseline projections made in 2011 are at odds with rising debt ratios. Moreover, revising projections to incorporate the actual macroeconomic and fiscal performance does little to improve the accounting frameworks’ capacity to explain the observed debt dynamics ex post. Factors other than the endogenous debt dynamics must have been determining the evolution of debt ratios, such as contingent or hidden liabilities adding debt that was previously unaccounted for. For example, for the case of South Asia country-level analysis would reveal that Bhutan is responsible for much of the unexplained increase in the region’s aggregate debt ratio, mainly because of large off-budget items in relation to the Bhutanese government’s debt financing of large hydropower plants investments (IMF 2011, 2014b).
Of course, regional averages hide a great deal of country heterogeneity. What applies to, say,
the East Asia aggregate not necessarily reflects the debt pattern of any particular country it represents: the PRC, the Republic of Korea, and Mongolia. Moreover, it is not uncommon for individual countries to distort certain sections of the regional pattern. Such is the case of Mongolia, discussed in the box.
A full discussion of individual countries’ standard DSA projections is beyond the scope of this
paper.9 However, glancing over the country charts in Annex 3 suggests that many countries’ baseline projections turn out to be fairly accurate (e.g., for India, Bangladesh, Sri Lanka, Solomon Islands, Armenia, Georgia, Thailand, and the Philippines) or amenable to revision in order to trace the factors underlying the actual evolution of debt ex post (e.g., Indonesia, Malaysia, Viet Nam, Pakistan, Fiji, Papua New Guinea, Tajikistan).
9 Selected countries’ stochastic DSA or fan chart analyses are presented in section IV.

6 | ADB Economics Working Paper Series No. 468
There are also instances were simple DSA projections performed rather poorly. Most often the reasons are off-budget fiscal liabilities inflating the debt stock, such as in the case of Mongolia and Bhutan. For oil-exporting countries, such as Azerbaijan and Kazakhstan, an additional challenge for DSA projections and accounting are the budgetary implications of oil funds. These are difficult to incorporate in debt sustainability analysis, lest the analytical framework is especially tailored to suit these specific circumstances.10
Mongolia Debt Sustainability Analysis Mongolia’s debt profile, shown in Box Figure 1, roughly resembles that of the East Asia aggregate as a whole. The debt ratio was projected to decline from 34.7% in 2011 to 14.5% by 2016. A near overlap of the baseline and historical scenarios suggests that macroeconomic assumptions were aligned with past performance. In Mongolia’s case, this reflected an exceptional favorable economic and policy environment that had enabled authorities to successfully tackle a debt crisis in the early 2000s and abate nearly two-thirds of the debt stock by 2010. As it turns out, such favorable conditions were not to continue and the core assumptions underlying the 2012–2016 projections would not be met. As a result, Mongolia’s debt ratio rose to exceed 60% by 2015, instead of a projected fall to just above 21%.
Box Figure 1: Public Sector DSA—Mongoliaa
Box Figure 2: Public Sector DSA 2011 Scenarios—Mongoliab
DSA = debt sustainability analysis, ER = exchange rate, GDP = gross domestic product, IMF = International Monetary Fund. a Projection years are 2012–2016 and 2016–2020. b 2011 data is an estimate. Projection years are 2012–2016. Source: Authors' estimates using data from International Monetary Fund (IMF), Article IV Consultation; IMF, World Economic Outlook April 2015; World Bank, World Development Indicators; IMF, Fiscal Monitor April 2015; Asian Development Bank, Asian Development Outlook 2015 Update; and CEIC Data Company (all accessed 30 September 2015).
continued on next page
10 Even when this is the case, such as for Kazakhstan, the oil fund budgetary implications are merely reflected in
disproportionally large DSA residuals. Computational detail is usually not disclosed in Article IV or other publicly available documents (IMF 2014c).
0
25
50
75
100
125
2000 2005 2010 2015 2020
% o
f GD
P
Baseline 2011Actual/Baseline 2015Historical scenario 2011Historical scenario 2015Baseline 2011 revisedIMF Article IV 2015Stress tests 2011
0
25
50
75
100
125
2000 2004 2008 2012 2016
Nominal interest rate shock
Real GDP growth shock
Inflation shock
Primary balance shock
Nominal ER depreciation shock
Baseline 2011
2011
% o
f GD
P
Public Debt Sustainability in Developing Asia: An Update | 7
Box continued
Box Table 1: Contributions to Debt, Mongolia(% of GDP)
Debt Stock
Identified Debt
Creating Flows
Primary Deficit
Real Interest Rate
of which: Domestic Inflation
Real GDP Growth
Nominal ER Depreciation
Year (1) (2) (1) (2) (1) (2) (1) (2) (1) (2) (1) (2) (1) (2)
2011 34.7 34.7 –8.3 –8.3 –1.3 –1.3 –4.5 –4.5 –4.9 –4.9 –3.5 –3.5 1.0 1.0
2012 33.2 38.2 –1.5 3.4 1.5 8.3 –3.1 –3.3 –3.4 –3.9 –2.3 –3.4 2.3 1.7
2013 28.0 45.0 –5.1 6.8 0.5 7.5 –2.6 0.1 –2.9 –1.0 –4.9 –3.9 1.8 3.1
2014 25.0 55.4 –3.0 10.4 0.7 8.7 –1.0 –1.0 –1.4 –2.5 –3.4 –3.1 0.7 5.8
2015 21.3 62.1 –3.7 6.7 –1.5 6.8 –0.6 –1.2 –1.0 –3.4 –2.0 –1.5 0.4 2.7
2016 14.5 64.8 –6.8 2.7 –4.0 4.4 –0.6 –1.4 –1.0 –4.0 –2.7 –2.8 0.5 2.5
Average 24.4 53.1 –4.0 6.0 –0.5 7.1 –1.6 –1.4 –2.0 –3.0 –3.1 –2.9 1.2 3.2
GDP = gross domestic product, ER = exchange rate. Notes: (1) refers to DSA 2011 projections for 2012–2016; (2) refers to DSA 2015 actual values, and estimates for 2015–2016. Average for 2012–2016 is also shown. Source: Authors' estimates using data from International Monetary Fund (IMF), Article IV Consultation; IMF, World Economic Outlook April 2015; World Bank, World Development Indicators; IMF, Fiscal Monitor April 2015; Asian Development Bank, Asian Development Outlook 2015 Update; and CEIC Data Company (all accessed 30 September 2015).
Box Table 2: Macroeconomic and Fiscal Forecast Assumptions, Mongolia
Primary Balance (% of GDP)
Ave. Nominal Interest Rate (%)
Domestic Inflation (%)
Real GDP Growth (% change)
Nominal ER (LCU/$)
Year (1) (2) (1) (2) (1) (2) (1) (2) (1) (2)
2011 1.3 1.3 1.2 1.1 13.0 15.1 10.0 17.3 1,390 1,266
2012 –1.5 –8.3 1.2 2.5 11.0 12.8 8.0 12.3 1,518 1,358
2013 –0.5 –7.5 1.4 3.2 9.7 2.6 19.3 11.6 1,643 1,524
2014 –0.7 –8.7 1.8 3.9 5.3 6.0 14.8 7.8 1,701 1,818
2015 1.5 –6.8 1.9 4.4 4.2 6.6 9.3 3.0 1,740 1,952
2016 4.0 –4.4 2.5 4.7 5.1 6.9 15.6 5.0 1,793 2,069
Average 0.5 –7.1 1.8 3.7 7.1 7.0 13.4 8.0 1,679 1,744
GDP = gross domestic product, ER = exchange rate, LCU = local currency unit. Notes: (1) refers to DSA 2011 projections for 2012–2016; (2) refers to DSA 2015 actual values, and estimates for 2015–2016. Average for 2012–2016 is also shown. Source: Authors' estimates using data from International Monetary Fund (IMF), Article IV Consultation; IMF, World Economic Outlook April 2015; World Bank, World Development Indicators; IMF, Fiscal Monitor April 2015; Asian Development Bank, Asian Development Outlook 2015 Update; and CEIC Data Company (all accessed 30 September 2015).
To see why, the Box Table 1 compares assumptions (DSA 2011) with actual (DSA revised) observations of the debt-creating flows underlying Mongolia’s debt dynamics from the base year 2011 and over the projection period 2012–2016. Persistently large primary deficits, rather than assumed narrow deficits or even surpluses, pushed up the debt ratio by more than 7 percentage points each year on average. Furthermore, a sharp depreciation of the Mongolian togrog against the United States dollar added more than 3 percentage points on average each year to the foreign exchange denominated debt burden expressed in national currency. Negative real interest rates and economic growth favored Mongolia’s debt dynamics, but less than expected at the time of projecting and not enough to stem against the upward pressures on debt overall, which averaged 6 percentage points per year.
continued on next page
8 | ADB Economics Working Paper Series No. 468
Box continued
Unrealistic forecasts of debt-creating flows partly explain why the 2011 baseline failed to predict the future trend of Mongolia’s debt ratio. In terms of Box Figure 1, this relates to the gap between the original and revised baselines. To a large extent, such inaccuracy was factored in at the time of projection through the inclusion of stress tests. These are shocks to the individual drivers of debt, such as the primary balance falling below the baseline assumptions by the amount of one standard deviation against its 10-year historical average, similar shocks to the growth, interest, and inflation rates, or a 20% permanent exchange rate depreciation (Box Figure 2). Box Figure 1 shows these shocks’ combined impact on the debt ratio. That the stress tests projection falls just short of the revised 2011 baseline means that the 2011 debt projection largely accommodates for the shocks Mongolia actually experienced, mainly in terms of unfavorable exchange rate movements and a deteriorating primary balance. The remaining gap, from the revised baseline to the actual debt ratio, can largely be ascribed to off-budgetary items that went unpredicted at the time of projecting and were known only with hindsight. For Mongolia, sovereign international bond issuance (e.g., the $1.5 billion Chinggis bond in 2012) and off-budget spending by the Development Bank of Mongolia on public investment projects financed through international bond issuance drove up domestic public debt in 2011–2013. Also foreign currency-denominated public debt—which accounted for roughly half of total public debt in 2013—experienced significant upward pressures from loans to the government from the local subsidiary of one of the main mining conglomerates to finance the government’s investment share in a mining project, as well as bond issuances in support of the wool, cashmere, and small-and-medium enterprise sectors (IMF 2012, IMF 2014a). Source: Authors.
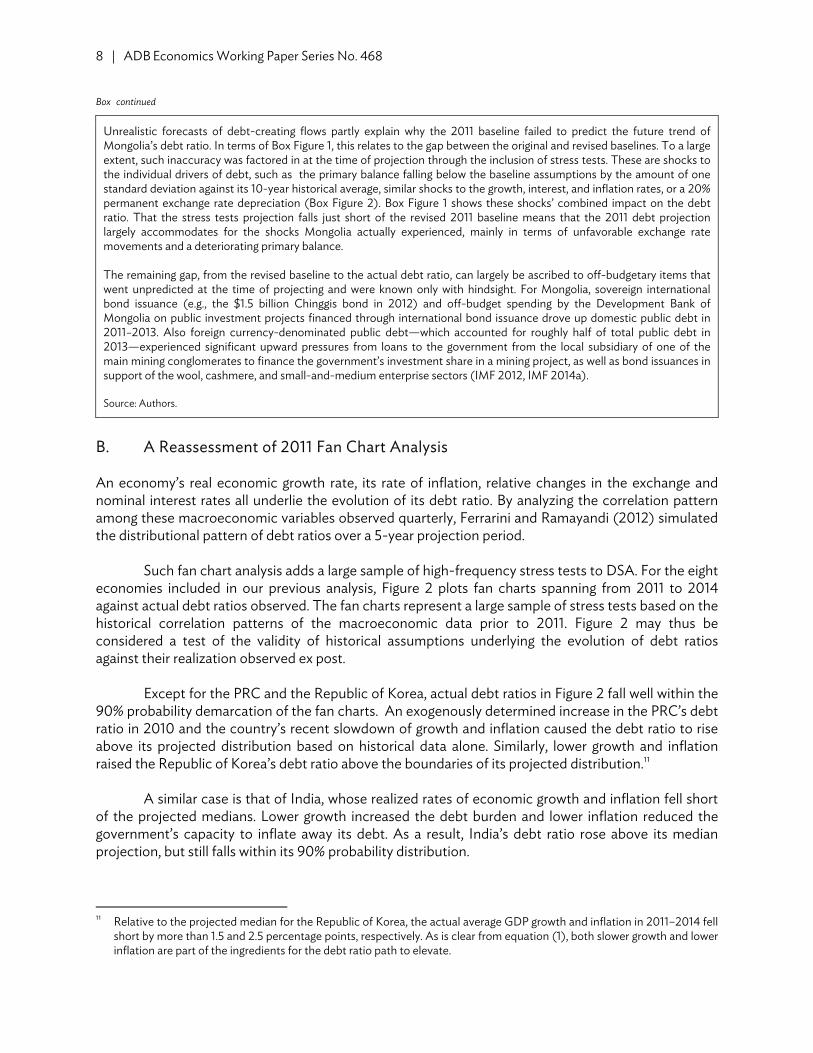
B. A Reassessment of 2011 Fan Chart Analysis
An economy’s real economic growth rate, its rate of inflation, relative changes in the exchange and nominal interest rates all underlie the evolution of its debt ratio. By analyzing the correlation pattern among these macroeconomic variables observed quarterly, Ferrarini and Ramayandi (2012) simulated the distributional pattern of debt ratios over a 5-year projection period.
Such fan chart analysis adds a large sample of high-frequency stress tests to DSA. For the eight economies included in our previous analysis, Figure 2 plots fan charts spanning from 2011 to 2014 against actual debt ratios observed. The fan charts represent a large sample of stress tests based on the historical correlation patterns of the macroeconomic data prior to 2011. Figure 2 may thus be considered a test of the validity of historical assumptions underlying the evolution of debt ratios against their realization observed ex post.
Except for the PRC and the Republic of Korea, actual debt ratios in Figure 2 fall well within the
90% probability demarcation of the fan charts. An exogenously determined increase in the PRC’s debt ratio in 2010 and the country’s recent slowdown of growth and inflation caused the debt ratio to rise above its projected distribution based on historical data alone. Similarly, lower growth and inflation raised the Republic of Korea’s debt ratio above the boundaries of its projected distribution.11
A similar case is that of India, whose realized rates of economic growth and inflation fell short of the projected medians. Lower growth increased the debt burden and lower inflation reduced the government’s capacity to inflate away its debt. As a result, India’s debt ratio rose above its median projection, but still falls within its 90% probability distribution.
11 Relative to the projected median for the Republic of Korea, the actual average GDP growth and inflation in 2011–2014 fell
short by more than 1.5 and 2.5 percentage points, respectively. As is clear from equation (1), both slower growth and lower inflation are part of the ingredients for the debt ratio path to elevate.

Public Debt Sustainability in Developing Asia: An Update | 9
In Georgia, the debt realized within the lower segment of the projected debt distribution. Driving this outcome are larger than expected primary fiscal surpluses in 2011 and 2012, whereas the macroeconomic determinants for the country are largely consistent with the medians projected.
Figure 2: DSA 2011 versus Actual Public Debt Ratio
East Asia People’s Republic of China Republic of Korea
Central Asia South Asia Georgia India
Southeast Asia Indonesia Philippines
Thailand Viet Nam
DSA = debt sustainability analysis. Sources: Ferrarini and Ramayandi 2012; International Monetary Fund (IMF), Article IV Consultation; and IMF, Fiscal Monitor April 2015 (all accessed 30 September 2015).
0
5
10
15
20
25
30
35
2008 2009 2010 2011 2012 2013 2014 2015 201605
1015
2025303540
2008 2009 2010 2011 2012 2013 2014 2015 2016
10
20
30
40
50
60
70
2008 2009 2010 2011 2012 2013 2014 2015 2016404550556065707580
2008 2009 2010 2011 2012 2013 2014 2015 2016
12
16
20
24
28
32
36
2008 2009 2010 2011 2012 2013 2014 2015 201624
28
32
36
40
44
48
2008 2009 2010 2011 2012 2013 2014 2015 2016
36
38
40
42
44
46
48
50
2008 2009 2010 2011 2012 2013 2014 2015 201640
45
50
55
60
65
70
2008 2009 2010 2011 2012 2013 2014 2015 2016
Median DSA projectionsArea between the 5th and 95th percentiles

10 | ADB Economics Working Paper Series No. 468
In the Southeast Asian economies, actual debt ratios are mostly seen moving from the lower part of the distribution to its upper part during more recent years. Lower than expected inflation, reflecting a fall in international commodity prices, is the main driver for higher actual debt ratios for Indonesia and Viet Nam in 2012–2014. Thailand also suffered weak growth since 2013 due to sluggish exports and domestic political disruptions.
The Philippines stands out as a noteworthy case about the issue of data consistency and
limitations when it comes to public debt data for emerging economies. The actual debt ratio for the Philippines is not directly comparable to the distribution shown by the fan chart. For the latter was projected on the basis of debt data included in the IMF’s Article IV, which turned out to be substantially higher and at odds with the series available from the IFS Fiscal Monitor database, the source of actual debt ratio data accessed in September 2015.
Shortcomings notwithstanding, our evaluation of previous debt sustainability analysis for
developing Asia suggests that DSA is a sufficiently valid forecasting framework, to the extent that it was premised on sufficiently accurate forecast assumptions. To a varying degree, factors other than debt dynamics have been shaping debt ratios, partly invalidating DSA forecasts. These factors are difficult to predict by their nature, which emphasizes the need for in-depth country analysis that would identify and inventory the main sources of contingent or hidden liabilities. For example, the debt analyses conducted in 2012 included three country studies, on the PRC, India, and Viet Nam, each pointing to and quantifying specific areas of vulnerability standard debt sustainability analysis tends to miss out on. Such insights are not to be gained from country-specific and regionally aggregated debt sustainability analyses performed previously and in this paper. Nevertheless, the DSA performance review testifies to the fact that valuable insights are gained even from stylized DSA, particularly about the broader trends in the region.
IV. LOOKING FORWARD: DEBT RATIO PROJECTIONS TO 2020
Looking forward, the focus now is on the right-hand side of the aggregate charts in Figure 1. With 2015 as the base year, debt ratios are projected from 2016 to 2020. Underlying these projections are forecast assumptions from ADB’s latest Asian Development Outlook report (ADB 2015) for 2016 and from the IMF’s World Economic Outlook report (IMF 2015) from 2017 onward.
Figure 1 plots baseline projections and the historical scenarios, as well as the IMF Article IV
baseline forecasts for comparison. The 2015 baseline suggests that debt ratios are expected to fall for all the regional aggregates and most pronouncedly in East, South, and Southeast Asia. Again, individual country charts in Annex 3 draw a more heterogeneous picture than regional aggregate projections would suggest. However, the outlook on debt in Asia is generally reassuring, premised on fairly sanguine macroeconomic forecasts held by ADB and the IMF in their latest flagship publications.

Public Debt Sustainability in Developing Asia: An Update | 11
Figure 3: Contributions to Change in Public Debt in Developing Asia (average %)
Central Asia East Asia
The Pacific South Asia
Southeast Asia
GDP = gross domestic product. Source: Authors' estimates using data from International Monetary Fund (IMF), Article IV Consultation; IMF, World Economic Outlook April 2015; World Bank, World Development Indicators; IMF, Fiscal Monitor April 2015; Asian Development Bank, Asian Development Outlook 2015 Update; and CEIC Data Company (all accessed 30 September 2015).
Figure 3 shows what exactly these forecast assumptions are for the five regional aggregates.
Among the identified debt-creating flows, solid economic growth is expected to push debt ratios down, by as much as 3%–4% each year in South Asia alone. Except the Pacific, all regions are expected to benefit also from negative or near zero real interest rates, helped by sustained inflation, lowering baselines even further. Crucially, primary fiscal balances are assumed to be mostly in surplus until 2019
30
32
34
36
382
1
0
−1
−2.52016 2017 2018 2019 2020
38
40
42
44
461.5
0
−1.5
−32016 2017 2018 2019 2020
36
37
381
.5
0
−.5
−1
−1.52016 2017 2018 2019 2020
45
50
55
601
0
−1
−2
−3
−42016 2017 2018 2019 2020
39
40
41
42
43
44.5
0
−.5
−1.5
−2.52016 2017 2018 2019 2020
Increase in public debt Primary deficit contribution Interest rate contribution
Growth rate contribution Exchange rate contribution Debt stock (% of GDP, right−hand side)

12 | ADB Economics Working Paper Series No. 468
and in mild deficit thereafter (again, except the Pacific). Together, these factors strongly prevail against unfavorable exchange rate forecasts, which are expected to exercise a mild upward pressure on the debt ratios across all regions. On average, debt ratios in the 5-year projection period are expected to drop by roughly five to six percentage points in Central, East, and Southeast Asia, and by more than 10 percentage points in South Asia. Even the Pacific is expected to see debt ratios decline on average, on the expectation that economic growth will be just enough to outweigh primary deficits, interest, and unfavorable exchange rate developments adding to debt stocks in that region.
Historical scenarios support the optimistic outlook enshrined in baseline assumptions. Figure 1
suggests that maintaining the macroeconomic and fiscal environment of the past 10 years would entail fiscal consolidation throughout the region at a pace even faster than envisaged by the baseline, except in South Asia where it is slower. However, extrapolation from the past is hardly a reliable forecasting assumption and merely reflects that macroeconomic and fiscal performance in the region has stayed strong, notwithstanding somewhat slower growth in recent years.
Comparing the baseline with the IMF Article IV projections for the period 2016–2019 suggests
that our baseline assumptions are generally more optimistic. This is most evident in relation to the East, South, and Southeast Asia aggregates. A closer look at Article IV projections for individual countries, in Annex 3, suggests that IMF country teams elaborating these sustainability analyses tend to adopt somewhat less sanguine fiscal policy assumptions compared to those in the Asian Development Outlook and the World Economic Outlook, which explains most of the discrepancies with our baseline assumptions. For example, our baseline for the Republic of Korea’s debt ratio reflects fiscal surpluses throughout 2016–2020 (premised on expenditure restraints and a broadening of the tax base), causing the debt ratio to decline quite rapidly. By contrast, the Article IV baseline expects primary fiscal deficits to persist and thus the debt ratio to increase to about 40% of GDP by 2019. In view of the Republic of Korea’s fiscal performance since 2011 and its impact on the debt ratio, Article IV projections seem to offer a more realistic stance. Of course, aggregate regional baseline projections not necessarily reflect how individual countries will fare. There is nothing to preclude that in some instances debt sustainability may be very well at risk.
V. FAN CHART DEBT RATIO PROJECTIONS TO 2020
We implement and discuss stochastic DSA simulations based on the same methodology applied in our 2012 study.12 We update the four-variable unrestricted vector autoregression (VAR) system on quarterly data on real growth, inflation, relative changes in the exchange rate against the US dollar, and a nominal interest rate (see data sources in Table A1.5 of Annex 1). Using the latest data available, we estimate the variance–covariance matrix needed for our forward simulations. The resulting quarterly projection of the macroeconomic variables are first annualized and then used in conjunction with the primary balance assumptions from the deterministic DSA to form the fan charts spanning from 2015 to 2020. The 90% confidence interval is displayed about the median of the projected government debt ratio, providing a range of possible outcomes compatible with a country’s estimated macroeconomic historical record and its volatility.
As more data have become available since the time of our previous analysis, we expand to a total of 13 the number of economies examined in this update, again grouped along the four subregions of ADB developing member countries. Central Asia now includes Azerbaijan, the Kyrgyz Republic, and 12 The method primarily followed what was done in Ferrucci and Penalver (2003).
Public Debt Sustainability in Developing Asia: An Update | 13
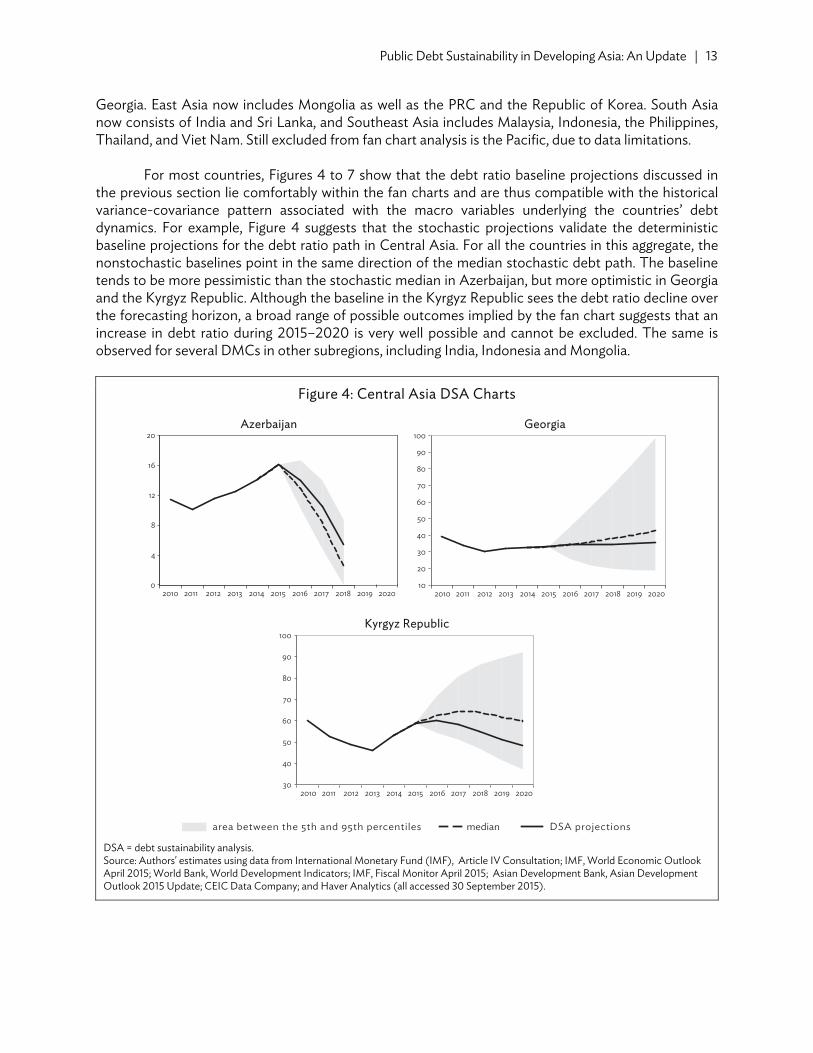
Georgia. East Asia now includes Mongolia as well as the PRC and the Republic of Korea. South Asia now consists of India and Sri Lanka, and Southeast Asia includes Malaysia, Indonesia, the Philippines, Thailand, and Viet Nam. Still excluded from fan chart analysis is the Pacific, due to data limitations.
For most countries, Figures 4 to 7 show that the debt ratio baseline projections discussed in
the previous section lie comfortably within the fan charts and are thus compatible with the historical variance-covariance pattern associated with the macro variables underlying the countries’ debt dynamics. For example, Figure 4 suggests that the stochastic projections validate the deterministic baseline projections for the debt ratio path in Central Asia. For all the countries in this aggregate, the nonstochastic baselines point in the same direction of the median stochastic debt path. The baseline tends to be more pessimistic than the stochastic median in Azerbaijan, but more optimistic in Georgia and the Kyrgyz Republic. Although the baseline in the Kyrgyz Republic sees the debt ratio decline over the forecasting horizon, a broad range of possible outcomes implied by the fan chart suggests that an increase in debt ratio during 2015–2020 is very well possible and cannot be excluded. The same is observed for several DMCs in other subregions, including India, Indonesia and Mongolia.
Figure 4: Central Asia DSA Charts Azerbaijan Georgia
Kyrgyz Republic
DSA = debt sustainability analysis. Source: Authors' estimates using data from International Monetary Fund (IMF), Article IV Consultation; IMF, World Economic Outlook April 2015; World Bank, World Development Indicators; IMF, Fiscal Monitor April 2015; Asian Development Bank, Asian Development Outlook 2015 Update; CEIC Data Company; and Haver Analytics (all accessed 30 September 2015).
0
4
8
12
16
20
2010 2011 2012 2013 2014 2015 2016 2017 2018 2019 202010
20
30
40
50
60
70
80
90
100
2010 2011 2012 2013 2014 2015 2016 2017 2018 2019 2020
30
40
50
60
70
80
90
100
2010 2011 2012 2013 2014 2015 2016 2017 2018 2019 2020
median DSA projectionsarea between the 5th and 95th percentiles

14 | ADB Economics Working Paper Series No. 468
Figure 5 indicates that for the majority of Southeast Asian economies baseline projections turn out to be more pessimistic than what their stochastic medians would suggest. In particular, medians based on historical trends indicate that inflation rates are higher than baseline assumptions for Malaysia, the Philippines, Thailand, and Viet Nam. This determines the more pessimistic path debt ratios are projected to take for these economies. While the deterministic baseline reflected inflation assumptions that took account of the weak global commodity prices implications, the median resulting from the underlying VAR analysis fails to capture this effect when simulating inflation forward. Higher inflation discounts future debt ratio more heavily and, as a result, the resulting median debt ratios fall short of the baselines.
Figure 5: Southeast Asia DSA Charts Indonesia Malaysia
Philippines Thailand
Viet Nam
DSA = debt sustainability analysis. Source: Authors' estimates using data from International Monetary Fund (IMF), Article IV Consultation; IMF, World Economic Outlook April 2015; World Bank, World Development Indicators; IMF, Fiscal Monitor April 2015; Asian Development Bank, Asian Development Outlook 2015 Update; CEIC Data Company; and Haver Analytics (all accessed 30 September 2015).
0
10
20
30
40
50
60
70
2010 2011 2012 2013 2014 2015 2016 2017 2018 2019 202032
36
40
44
48
52
56
60
2010 2011 2012 2013 2014 2015 2016 2017 2018 2019 2020
12
16
20
24
28
32
36
40
44
2010 2011 2012 2013 2014 2015 2016 2017 2018 2019 202034
36
38
40
42
44
46
48
50
2010 2011 2012 2013 2014 2015 2016 2017 2018 2019 2020
40
44
48
52
56
60
64
2010 2011 2012 2013 2014 2015 2016 2017 2018 2019 2020
Median DSA projectionsArea between the 5th and 95th percentiles

Public Debt Sustainability in Developing Asia: An Update | 15
Indonesia stands out, with a baseline debt ratio projection that is quite consistent with the
median forecast. However, a comparison of Figures 2 and 5 suggest that Indonesia’s fan chart has significantly broadened with respect to the analysis conducted in our 2011 analysis. This reflects heightened volatility of the macro variables characterizing the country’s more recent past and underlying the latest VAR estimation.
The stochastic projections in Figures 6 and 7 broadly validate the realism of the deterministic
baseline assumptions for India, the Republic of Korea, and Mongolia. While the baseline of Mongolia is more closely consistent with the median of its projected distribution, the baselines of the Republic of Korea and India are somewhat more optimistic than what their fan charts’ medians would suggest. For the Republic of Korea, the discrepancy arises out of the baseline’s higher growth and inflation assumptions. For India, it is caused by the baseline assuming a lower interest rate, which in turn causes the interest rate growth differential to exceed that of the stochastic analysis.
Figure 6: East Asia DSA Charts
People’s Republic of China Republic of Korea
Mongolia
DSA = debt sustainability analysis. Source: Authors' estimates using data from International Monetary Fund (IMF), Article IV Consultation; IMF, World Economic Outlook April 2015; World Bank, World Development Indicators; IMF, Fiscal Monitor April 2015; Asian Development Bank, Asian Development Outlook 2015 Update; CEIC Data Company; and Haver Analytics (all accessed 30 September 2015).
12
16
20
24
28
32
36
2010 2011 2012 2013 2014 2015 2016 2017 2018 2019 202020
24
28
32
36
40
2010 2011 2012 2013 2014 2015 2016 2017 2018 2019 2020
20
40
60
80
100
120
140
160
2010 2011 2012 2013 2014 2015 2016 2017 2018 2019 2020
Median DSA projectionsArea between the 5th and 95th percentiles

16 | ADB Economics Working Paper Series No. 468
Figure 7: South Asia DSA Charts
India Sri Lanka
DSA = debt sustainability analysis. Source: Authors' estimates using data from International Monetary Fund (IMF), Article IV Consultation; IMF, World Economic Outlook April 2015; World Bank, World Development Indicators; IMF, Fiscal Monitor April 2015; Asian Development Bank, Asian Development Outlook 2015 Update; CEIC Data Company; and Haver Analytics (all accessed 30 September 2015).
In contrast to the other countries, the projected debt baseline for Sri Lanka and the PRC do not
seem to get much support by the probability distributions of the fan charts. The baseline for Sri Lanka moves just about the upper boundary of the 90% distribution, and that of the PRC falls outside.13 Low inflation assumptions embodied in Sri Lanka’s baseline, about half of what would reflect its historical pattern, is the main culprit for the deviation from the simulated distribution. For the PRC, the baseline assumes slower than historical growth, thus driving a wedge between its projected debt ratio and the median debt ratio derived from the stochastic simulation.
The PRC’s deterministic baseline is taking into account the recent trend of growth slowdown
and assumes growth to range between 6% and 7% during 2016–2020. Unfortunately, this slowdown does not get captured by the trend of historically elevated economic growth in the PRC, which forms the basis for the median of stochastic projection. The 2016–2020 median growth rates are projected to hover at around 9%–10% each year in our simulated results and the gap between these two assumptions appears to be large enough to pull the deterministic debt path baseline beyond the upper bound of the 90% stochastic distribution.
To reconcile the issue, we imposed a permanent negative shock to growth in our simulation for
the PRC and recomputed the distribution of probable debt outcome given the shock. The permanent shock is calibrated so as to bring down the median projected growth to hover around 6%–7%, in order to match the baseline assumption. As a result, Figure 8 shows that the PRC baseline now appears to be fully consistent with the resulting fan chart and its median.
13 Note, however, that in terms of direction and magnitude, the median of our stochastic debt ratio projections for the two
countries are largely consistent with those of the IMF Article IV 2015, (Annex 1).
55.0
57.5
60.0
62.5
65.0
67.5
70.0
72.5
2010 2011 2012 2013 2014 2015 2016 2017 2018 2019 202048
52
56
60
64
68
72
76
80
84
2010 2011 2012 2013 2014 2015 2016 2017 2018 2019 2020
Median DSA projectionsArea between the 5th and 95th percentiles

Public Debt Sustainability in Developing Asia: An Update | 17
Figure 8: The People’s Republic of China DSA Charts
DSA = debt sustainability analysis. Source: Authors' estimates using data from International Monetary Fund (IMF), Article IV Consultation; IMF, World Economic Outlook April 2015; World Bank, World Development Indicators; IMF, Fiscal Monitor April 2015; Asian Development Bank, Asian Development Outlook 2015 Update; CEIC Data Company; and Haver Analytics (all accessed 30 September 2015).
In sum, stochastic simulation analysis supports the generally sanguine view suggested by our
baseline assumptions, concerning public debt sustainability in developing Asia. However, some caveats were marked for individual country cases—including Georgia, the Kyrgyz Republic, Indonesia, India, and Mongolia—where the probability for debt ratio to shoot up falls well within the probability distributions and cannot be excluded as a possible outcome. Noteworthy is also the case of the PRC, which highlights the issue with generating fan charts based on relationships in historical time series. The latter are unable to capture structural changes that will affect outcomes and cause discrepancies with projections. As much as for the case of standard DSA, the interpretation of the fan charts requires a dose of country-specific knowledge and qualifications that would accrue from a more detailed, country-specific analysis conducted ad hoc with those specificities in mind.
VI. CONCLUSIONS
Our updated debt projections for Asia support the positive outlook on the region’s debt sustainability over the medium-term. Our baseline projections for 2016–2020 appear to be somewhat more optimistic than those incorporated in the IMF’s Article IV country analyses, mainly as a result of the IMF’s less sanguine fiscal assumptions. While the outlook is positive for the region as a whole, we observe much county heterogeneity and there is nothing in our analysis to preclude that in some instances and for some countries debt sustainability may be very well at risk.
The updated stochastic DSA for selected countries validates our deterministic baseline
projections. For most countries, both baselines and fan chart medians project a benign evolution of the debt ratio over the medium-term. However, there are cases where stochastic analysis points to a broad
16
20
24
28
32
36
2010 2011 2012 2013 2014 2015 2016 2017 2018 2019 2020
Median DSA projections
Area between the 5th and 95th percentiles

18 | ADB Economics Working Paper Series No. 468
range of possible outcomes, driven by countries’ macroeconomic historical volatility as is captured by the variance-covariance matrix. Albeit unlikely, the most unfavorable of these outcomes cannot be excluded a priori, such as the possibility for the debt ratio to hike rapidly over the forecasting horizon.
As suggested by the evaluation of our earlier debt sustainability projections over the 5 years
from 2012 to 2016, the standard IMF-World Bank approach to debt sustainability analysis constitutes a fairly accurate tool for forecasting debt ratios, as long as it is premised on reasonable underlying macroeconomic and fiscal assumptions. In some cases, inaccurate or overly optimistic assumptions caused our earlier debt ratios to diverge from projections, far beyond what had been envisaged by standard stress and bound tests. However, much of that volatility standard DSA had missed out on was captured by our fan chart analysis. We showed that most countries had their debt ratio fall comfortably within the 90% distribution of our forecast projections that incorporate the probability distribution of the macroeconomic variables driving debt dynamics.
Stress tests and fan charts allow for inaccurate macroeconomic assumptions to an extent.
More problematic is accounting ex ante for contingent or hidden liabilities, which cause the actual debt ratio to diverge significantly from its projection. DSA does not capture the likelihood of occurrence and the entity of this broad category of fiscal risks to any sufficient extent. This requires that analysts conduct lengthy ad hoc country studies to identify and inventory off-budget risk factors, such as for example in Hemming (2012) for the PRC.
In sum, our analysis points to the importance for DSA of accurate macroeconomic forecasts
underlying debt ratio projections. There is scope for improvement as, all too often, DSA is based on somewhat dated forecast assumptions or driven by the vested interests of the forecasting body, including country authorities themselves. Although uncertainties about the macroeconomic outcome can often be adequately captured by stress tests and particularly by fan charts in the case of stochastic DSA, higher quality assumptions and in-depth country studies will increase the accuracy of the resulting debt sustainability analysis—as suggested by the PRC fan chart analysis in section V.
Further improvements to debt sustainability analysis would derive from incorporating
appropriate methods of risk analysis into the standard framework. This would shift the focus from stabilizing the debt ratio toward a fuller account of changes in risk appetite and the structure of debt. In order to do so, DSA would have to be augmented with information about the balance sheet structure of the sovereign, including the central bank, and about contingent liabilities to other sectors in the economy. It would have to allow for sovereign assets to evolve with uncertainty against sovereign liabilities and also allow for linkages between sectors of the economy and the spillover of risk and feedback effects, such as between the finance and the public sector (Gray et al. 2008). This will be the focus of future analysis.
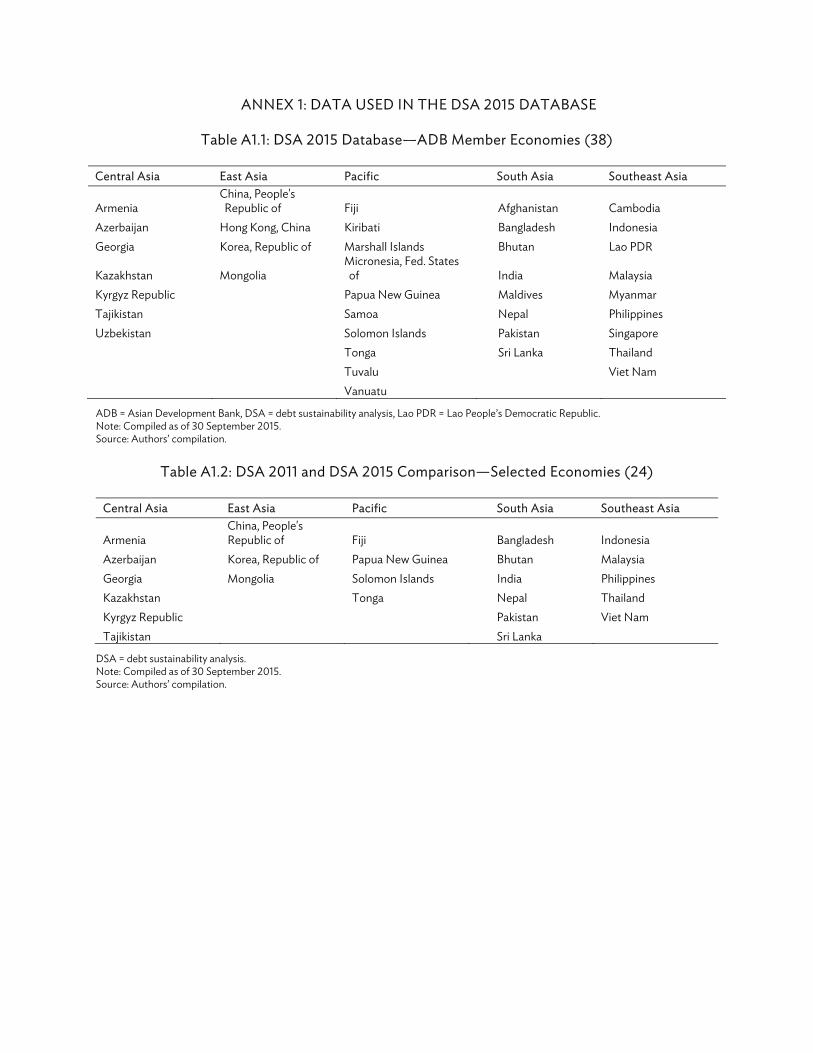
ANNEX 1: DATA USED IN THE DSA 2015 DATABASE
Table A1.1: DSA 2015 Database—ADB Member Economies (38)
Central Asia East Asia Pacific South Asia Southeast Asia
Armenia China, People's Republic of Fiji Afghanistan Cambodia
Azerbaijan Hong Kong, China Kiribati Bangladesh Indonesia Georgia Korea, Republic of Marshall Islands Bhutan Lao PDR
Kazakhstan Mongolia Micronesia, Fed. States of India Malaysia
Kyrgyz Republic Papua New Guinea Maldives Myanmar Tajikistan Samoa Nepal Philippines Uzbekistan Solomon Islands Pakistan Singapore
Tonga Sri Lanka Thailand Tuvalu Viet Nam Vanuatu
ADB = Asian Development Bank, DSA = debt sustainability analysis, Lao PDR = Lao People’s Democratic Republic. Note: Compiled as of 30 September 2015. Source: Authors’ compilation.
Table A1.2: DSA 2011 and DSA 2015 Comparison—Selected Economies (24)
Central Asia East Asia Pacific South Asia Southeast Asia
Armenia China, People's Republic of Fiji Bangladesh Indonesia
Azerbaijan Korea, Republic of Papua New Guinea Bhutan Malaysia Georgia Mongolia Solomon Islands India Philippines Kazakhstan Tonga Nepal Thailand Kyrgyz Republic Pakistan Viet Nam Tajikistan Sri Lanka
DSA = debt sustainability analysis. Note: Compiled as of 30 September 2015. Source: Authors’ compilation.

20 | Annexes
Table A1.3: Data Availability of Public Debt, 1990–2014 (% of GDP)
Economy 1990 '91 '92 '93 '94 '95 '96 '97 '98 '99 2000 '01 '02 '03 '04 '05 '06 '07 '08 '09 '10 '11 '12 '13 '14 Afghanistan … … … … … … … … … … … … … … … … … … √ √ √ √ √ √ √ Armenia … … … … … … √ √ √ √ √ √ √ √ √ √ √ √ √ √ √ √ √ √ … Azerbaijan … … … … … … … … … … √ √ √ √ √ √ √ √ √ √ √ √ √ … … Bangladesh √ √ √ √ √ √ √ √ √ √ √ √ √ √ √ √ √ √ √ √ √ √ √ √ √ Bhutan … … … √ √ √ √ √ √ √ √ √ √ √ √ √ √ √ √ √ √ √ √ √ √ Cambodia … … … … … … √ √ √ √ √ √ √ √ √ √ √ √ √ √ √ √ √ √ … China, People's Rep. of √ √ √ √ √ √ √ √ √ √ √ √ √ √ √ √ √ √ √ √ √ √ √ √ … Fiji … … √ √ √ √ √ √ √ √ √ √ √ √ √ √ √ √ √ √ √ √ √ √ √ Georgia … … … … … … √ √ √ √ √ √ √ √ √ √ √ √ √ √ √ √ √ √ √ Hong Kong, China … … … … … … … … … … … √ √ √ √ √ √ √ √ √ √ √ √ … … India √ √ √ √ √ √ √ √ √ √ √ √ √ √ √ √ √ √ √ √ √ √ √ √ … Indonesia √ √ √ √ √ √ √ √ √ √ √ √ √ √ √ √ √ √ √ √ √ √ √ √ √ Kazakhstan … … … √ √ √ √ √ √ √ √ √ √ √ √ √ √ √ √ √ √ √ √ √ … Kiribati … … … … … … … … … … … … … … … … … √ √ √ √ √ √ √ √ Korea, Rep. of √ √ √ √ √ √ √ √ √ √ √ √ √ √ √ √ √ √ √ √ √ √ √ √ … Kyrgyz Republic … … … … … … … … … … √ √ √ √ √ √ √ √ √ √ √ √ √ √ √ Lao PDR … … … … … … … … … … … √ √ √ √ √ √ √ √ √ √ √ √ √ √ Malaysia √ √ √ √ √ √ √ √ √ √ √ √ √ √ √ √ √ √ √ √ √ √ √ √ √ Maldives … … … … … … … … … … … … … √ √ √ √ √ √ √ √ √ √ √ √ Marshall Islands … … … … … … … … … … … √ √ √ √ √ √ √ √ √ √ √ √ √ … Micronesia, Fed. States of … … … … … … … … … √ √ √ √ √ √ √ √ √ √ √ √ √ √ √ √ Mongolia … … √ √ √ √ √ √ √ √ √ √ √ √ √ √ √ √ √ √ √ √ √ √ √ Myanmar … … … … … … … … … … … … … … … … … … √ √ √ √ √ √ √ Nepal √ √ √ √ √ √ √ √ √ √ √ √ √ √ √ √ √ √ √ √ √ √ √ √ √ Pakistan √ √ √ √ √ √ √ √ √ √ √ √ √ √ √ √ √ √ √ √ √ √ √ √ √ Papua New Guinea √ √ √ √ √ √ √ √ √ √ √ √ √ √ √ √ √ √ √ √ √ √ √ √ √ Philippines √ √ √ √ √ √ √ √ √ √ √ √ √ √ √ √ √ √ √ √ √ √ √ √ … Samoa … … … … … … … … … √ √ √ √ √ √ √ √ √ √ √ √ √ √ √ √ Singapore √ √ √ √ √ √ √ √ √ √ √ √ √ √ √ √ √ √ √ √ √ √ √ √ … Solomon Islands … … … … … … … … … … … … … √ √ √ √ √ √ √ √ √ √ √ … Sri Lanka √ √ √ √ √ √ √ √ √ √ √ √ √ √ √ √ √ √ √ √ √ √ √ √ … Tajikistan … … … … … … … … √ √ √ √ √ √ √ √ √ √ √ √ √ √ √ √ √ Thailand … … … … … … √ √ √ √ √ √ √ √ √ √ √ √ √ √ √ √ √ √ √ Tonga … … … √ √ √ √ √ √ √ √ √ √ √ √ √ √ √ √ √ √ √ √ √ √ Tuvalu … … … … … … … … … … … … … … … … √ √ √ √ √ √ √ √ √ Uzbekistan … … … … … … … … √ √ √ √ √ √ √ √ √ √ √ √ √ √ … … … Vanuatu … … … … √ √ √ √ √ √ √ √ √ √ √ √ √ √ √ √ √ √ √ √ √ Viet Nam … … … … √ √ √ √ √ √ √ √ √ √ √ √ √ √ √ √ √ √ √ √ … √ = data available, … = data not available, GDP = gross domestic product, Lao PDR = Lao People’s Democratic Republic. Source: Dataset compiled under ADB RDTA-8893: Exploring Risk-Based Debt Sustainability Assessment Methods.

Annexes | 21
Table A1.4: Data Sources
Database Variable Economy Coverage Description and CommentsWorld Economic Outlook, April 2015. International Monetary Fund
General government gross debt (level)
Bhutan (1993–2004), Fiji (1992–2004), Lao PDR (2001–2003), Vanuatu (1996–2004)
Central government
Cambodia (1996–2004) Central, localIndia (1990–1998) Central, statePRC (1990–1998) Central, state, localPhilippines (1990–1993), Tajikistan (1998–2007), Thailand (1996–2003)
Central, local, social security funds
Uzbekistan (1998–2002) Central, state, local, social security fundsGeneral government revenues and grants (level) Includes taxes, social contributions, grants receivable, and other revenue.
Afghanistan (2002–2013); Armenia (1994–2013); Azerbaijan (2000–2012); Bangladesh (1990–2014); Bhutan (1990–2013); Fiji (1992–2013); Hong Kong, China (1990–2014); Republic of Korea (1995–2013); Lao PDR (2000–2013); Maldives (1990–2012); Marshall Islands (1995–2013); Nepal (2000–2014); Papua New Guinea (1990–2013); Samoa (1998–2014); Singapore (1990–2014); Solomon Islands (1990–2013); Tonga (1999–2012); Tuvalu (2004–2013); Vanuatu (1991–2014)
Central government
Cambodia (1996–2013), Georgia (1994–2013), Indonesia (1990–2014), Kazakhstan (1994–2013), Kiribati (1990–2013)
Central, local
Myanmar (1998–2014) Central, nonfinancial public corporationIndia (1990–2013) Central, statePRC (1990–2014), Malaysia (1990–2013), Pakistan (1990–2014), Viet Nam (1998–2013)
Central, state, local
Kyrgyz Republic (1993–2014), Fed. States of Micronesia (1995–2013), Philippines (1990–2014), Tajikistan (1998–2013), Thailand (1995–2014)
Central, local, social security funds
Mongolia (1990–2013), Sri Lanka (1990–2014), Uzbekistan (1992–2012)
Central, state, local, social security funds
Projections 2015–2020 (ratio to GDP)
All economies except Azerbaijan, Maldives, Tonga, Uzbekistan (2013–2020); and Afghanistan, Armenia, Bhutan, Cambodia, Fiji, Georgia, India, Kazakhstan, Kiribati, Republic of Korea, Lao PDR, Malaysia, Marshall Islands, Fed. States of Micronesia, Mongolia, Papua New Guinea, Solomon Islands, Tajikistan, Tuvalu, Viet Nam (2014–2020).
Coverage same as historical data
continued on next page

22 | Annexes
Database Variable Economy Coverage Description and CommentsGeneral government expenditure (level)
Afghanistan (2002–2013); Armenia (2005–2013);Azerbaijan (2000–2012); Bangladesh (1990–2014); Bhutan (1990–2013); Fiji (1992–2013); Hong Kong, China (1990–2014); Republic of Korea (1995–2013); Lao PDR (2000–2013); Maldives (1990–2012); Marshall Islands (1995–2013); Nepal (2000–2014); Papua New Guinea (1990–2013); Samoa (1998–2014); Singapore (1990–2014); Solomon Islands (1990–2013); Tonga (1999–2012); Tuvalu (2004–2013); Vanuatu (1991–2014)
Central government
Cambodia (1996–2013), Georgia (2000–2013), Indonesia (1993–2014), Kazakhstan (2002–2013), Kiribati (1990–2013)
Central, local
Myanmar (1998–2014) Central, nonfinancial public corporationIndia (1990–2013) Central, statePRC (1990–2014), Malaysia (1990–2013), Pakistan (1993–2014), Viet Nam (1998–2013)
Central, state, local
Kyrgyz Republic (2000–2014), Fed. States of Micronesia (1995–2013), Philippines (1990–2014), Tajikistan (1998–2013), Thailand (1995–2014)
Central, local, social security funds
Mongolia (1990–2013), Sri Lanka (1990–2014), Uzbekistan (1992–2012)
Central, state, local, social security funds
Projections 2015–2020 (ratio to GDP)
All economies except Azerbaijan, Maldives, Tonga, Uzbekistan (2013–2020); and Afghanistan, Armenia, Bhutan, Cambodia, Fiji, Georgia, India, Kazakhstan, Kiribati, Republic of Korea, Lao PDR, Malaysia, Marshall Islands, Fed. States of Micronesia, Mongolia, Papua New Guinea, Solomon Islands, Tajikistan, Tuvalu, Viet Nam (2014–2020).
Coverage same as historical data
Interest payments (level)Derived as the difference between net lending and primary lending
Lao PDR (1994–2005); Papua New Guinea (2003–2013) Central governmentUzbekistan (1993–2002) Central, state, local, social security funds
Nominal GDP, calendar year All economies except Afghanistan; Bangladesh; Bhutan;Hong Kong, China; India; Lao PDR; Marshall Islands; Fed. States of Micronesia; Myanmar; Nepal; Pakistan; Papua New Guinea; Samoa; Singapore; Thailand; Tonga (fiscal year).
GDP deflator All economies
Table A1.4 continued
continued on next page

Annexes | 23
Database Variable Economy Coverage Description and CommentsProjections (2015–2020) All economies except Tonga, Tuvalu, Uzbekistan (2013–
2020); and Afghanistan, Armenia, Azerbaijan, Bangladesh, Bhutan, Cambodia, PRC, Fiji, Georgia, Kazakhstan, Kiribati, Lao PDR, Maldives, Marshall Islands, Fed. States of Micronesia, Mongolia, Papua New Guinea, Solomon Islands, Tajikistan, Vanuatu, Viet Nam (2014–2020).
Real GDP (levels) All economies Various base yearProjections (2017–2020) percent change
All economies Asian Development Outlook 2015 database used for 2010–2016 figures and projections
Nominal exchange rate Tuvalu (2000–2014) Computed: nominal GDP (LCU)/nominal GDP ($)Projections (2015–2020) All economies except the Marshall Islands and the Fed.
States of Micronesia. Computed: nominal GDP forecast (LCU)/nominal GDP forecast ($). The United States dollar was used for the Marshall Islands and the Fed. States of Micronesia
Fiscal Monitor April 2015. International Monetary Fund
Government debt, ratio or level Bangladesh (1990–1999); Hong Kong, China (2001–2012);Kazakhstan (1993–2007); Nepal (1990–1991); Philippines (1994–2011); Singapore (1990–2010)
IMF Article IV Country Report tables and statistical appendices (including debt sustainability analysis tables)
Government debt, ratio or level Afghanistan (2008–2014), Fiji (2005–2013), Lao PDR (2004–2014), Marshall Islands (2001–2013), Samoa (1999–2014), Singapore (2011–2013), Solomon Islands (2003–2013), Sri Lanka (1993–2013), Tuvalu (2006–2014), Vanuatu (1994–2015)
Central government Ratios to GDP as indicated on source or recomputed using appropriate GDP levels
Bangladesh (2000–2014), Bhutan (2005–2014), Kiribati (2007–2014), Maldives (2003–2014), Myanmar (2008–2014), Thailand (2004–2014)
Central government plus government guaranteed and/or nonfinancial public sector
Cambodia (2005–2013), Georgia (1996–2014), India (1999–2013), Kazakhstan (2008–2013), Kyrgyz Republic (2000–2015), Malaysia (1990–2014), Fed. States of Micronesia (1999–2014), Mongolia (1992–2015), Pakistan (2000–2015), Philippines (2012–2013), Tajikistan (2008–2014), Uzbekistan (2003–2011)
General government (includes two or more of the following: central, local, state, government guaranteed and nonfinancial public sector)
Armenia (1996–2013), Azerbaijan (2000–2012), PRC (1999–2013), Indonesia (1996–2014), Republic of Korea (1990–2013), Nepal (1992–2014), Papua New Guinea (1990–2014), Tonga (1993–2015), Viet Nam (1994–2013)
Public sector (mixed historical coverage)
Projections 2015–2020 (ratio to GDP)
All economies except the Kyrgyz Republic, Mongolia, Pakistan, Tonga and Vanuatu (2016–2020).
Some data for years 2013–2015 are preliminary estimates.
Table A1.4 continued
continued on next page

24 | Annexes
Database Variable Economy Coverage Description and CommentsForeign currency-denominated debt (ratio to GDP)
Afghanistan (2008–2014), Fiji (1997–2012), Lao PDR (2004–2014), Marshall Islands (2001–2013), Samoa (1999–2014), Solomon Islands (2003–2013), Sri Lanka (1993–2011), Tuvalu (2006–2014), Vanuatu (1994–2015)
Central government
Bangladesh (2000–2014), Bhutan (2005–2014), Kiribati (2007–2014), Maldives (2003–2014), Myanmar (2008–2014)
Central government plus government guaranteed and/or nonfinancial public sector
Cambodia (2004–2013), Georgia (1999–2014), India (1999–2011), Kazakhstan (2004–2011), Kyrgyz Republic (2004–2015), Malaysia (1995–2010), Fed. States of Micronesia (1999–2014), Mongolia (2002–2015), Pakistan (2000–2015), Philippines (2000–2011), Tajikistan (2008–2014), Uzbekistan (2003–2011)
General government (includes two or more of the following: central, local, state, government guaranteed and nonfinancial public sector)
Armenia (2002–2011), Azerbaijan (2002–2011), PRC (1999–2012), Indonesia (2000–2012), Republic of Korea (1993–2008), Nepal (1992–2014), Papua New Guinea (1991–2014), Tonga (1993–2015), Viet Nam (2002–2013)
Public sector (mixed coverage over time)
Revenues and grants, ratio or level Lao PDR (1994–1999), Fed. States of Micronesia (1993–1994), Nepal (1993–1999), Tonga (1990–1998)
Ratios to GDP as indicated on source or recomputed using appropriate GDP levels
Expenditures, ratio or level Armenia (1995–2004), Georgia (1995–1999), Lao PDR (1994–1999), Fed. States of Micronesia (1993–1994), Nepal (1993–1999), Tonga (1990–1998)
Ratios to GDP as indicated on source or recomputed using appropriate GDP levels
Interest payments, ratio or level Afghanistan (2012–2014), Fiji (1990–2013), Lao PDR (2012–2014), Marshall Islands (2001–2012), Solomon Islands (1990–2014), Sri Lanka (2013), Tuvalu (2008–2014), Vanuatu (1993–2014)
Central government Ratios to GDP as indicated on source or recomputed using appropriate GDP levels
Bangladesh (1993–2000, 2012–2013), Bhutan (2010–2013), Kiribati (2009–2012), Maldives (2012), Myanmar (2009–2010), Thailand (2013)
Central government plus government guaranteed and/or nonfinancial public sector
Cambodia (1996–2001, 2013), Georgia (1995–2013), India (2013), Kazakhstan (2005–2013), Kyrgyz Republic (1993–1994, 2002–2005, 2013–2014), Malaysia (2013), Fed. States of Micronesia (2009–2014), Mongolia (2013–2014), Pakistan (2001–2014), Philippines (2013), Tajikistan (1998–2011), Uzbekistan (2003–2012)
General government (includes two or more of the following: central, local, state, government guaranteed and nonfinancial public sector)
Armenia (1997–2002, 2013), Azerbaijan (2011–2013), PRC (2000–2013), Indonesia (2010–2014), Republic of Korea (2012–2013), Nepal (1993–1994, 2014), Tonga (1997–2014), Viet Nam (1995–2009, 2014)
Public sector (mixed historical coverage)
Projections (various years) All economies Projection years depend on latest available data.continued on next page
Table A1.4 continued

Annexes | 25
Database Variable Economy Coverage Description and CommentsDebt projections (ratio to GDP)
All economies where DSA data are available
Public foreign debt projections (ratio to GDP and ratio to total debt)
All economies where DSA data are available
Interest on domestic debt
All economies where DSA data are available
Interest on foreign debt
All economies where DSA data are available
Contingent liabilities
All economies where DSA data are available
ADB Asian Development Outlook database, 2015
Real GDP growth (2010–2016)Figures and projections
All economies Percent change Note: Base year varies across countries
IMF International Finance Statistics
Government debt (ratio to GDP)
Kazakhstan (1993–2007)
Nominal exchange rate Armenia; Azerbaijan; Bangladesh; Cambodia; PRC; Georgia;Hong Kong, China; India; Indonesia; Kazakhstan; Republic of Korea; Kyrgyz Republic; Lao PDR; Malaysia; Mongolia; Myanmar; Nepal; Pakistan; Philippines; Singapore; Sri Lanka; Tajikistan; Thailand; Viet Nam
Data for Uzbekistan from central bank
World Development Indicators. World Bank
Government debt (levels) Indonesia (1990–1995), Sri Lanka (1990–1992), Pakistan (1990–1993)
Interest payments (levels) Afghanistan (2006–2011); Armenia (2003–2012);Azerbaijan (1994–2010); Bangladesh (2001–2011); Bhutan (1990–2009); Cambodia (2002–2012); Georgia (1997–2011); Hong Kong, China (2002–2009); India (1990–2012); Indonesia (1991–2009); Kazakhstan (1997–2004); Republic of Korea (1990–2011); Kyrgyz Republic (1995–2001, 2006–2012); Lao PDR (2006–2011); Malaysia (1996–2012); Maldives (1990–2011); Mongolia (1992–2012); Nepal (1995–2013); Pakistan (1990–2000); Papua New Guinea (1990–2002); Philippines (1990–2012); Samoa (2010–2012); Singapore (1990–2012); Solomon Islands (1990–2014); Sri Lanka (1990–2012); Thailand (2003–2012)
Table A1.4 continued
continued on next page

26 | Annexes
Database Variable Economy Coverage Description and CommentsNominal exchange rate Afghanistan, Bhutan, Fiji, Kiribati, Maldives, Papua New
Guinea, Samoa, Solomon Islands, Tonga, Vanuatu National sources (accessed through CEIC database or government sites)
Foreign currency public debt
Philippines (1990–1999), Thailand (1996–2014)
Interest payments, ratio or level PRC (1990–1999); Hong Kong, China (2010–2012);Myanmar (1995–2008); Thailand (1990–2002); Viet Nam (2010–2013)
ADB = Asian Development Bank, GDP = gross domestic product, IMF = International Monetary Fund, Lao PDR = Lao People’s Democratic Republic, LCU = local currency unit, PRC = People’s Republic of China. Notes: Database from 1990–2014, forecast years from 2016–2020. DSA starts as public debt (% of GDP) along with other main variables are available (Table A1.3). IMF Article IV and other databases accessed and updated on 30 September 2015. Source: Authors’ compilation.
Table A1.4 continued

Annexes | 27
Table A1.5: Fan Chart Data Sources
Source: Authors’ compilation.
Database Variable Country Coverage RemarksCEIC Data Company and Haver Analytics (both accessed 30 September 2015)
Real gross domestic product
Azerbaijan (Q1 2001–Q4 2014), People’s Republic of China (Q1 1992–Q4 2014), Georgia (Q1 1997–Q4 2014), India (Q2 1996–Q4 2014), Indonesia (Q1 1990–Q4 2014), Kyrgyz Republic (Q1 2000–Q4 2014), Republic of Korea (Q1 1990–Q4 2014), Malaysia (Q1 1991–Q4 2014), Mongolia (Q1 2000 –Q4 2014), Philippines (Q1 1990–Q4 2014), Sri Lanka (Q1 2002–Q4 2014), Thailand (Q1 1993–Q4 2014), Viet Nam (Q1 1999–Q4 2014)
The Kyrgyz Republic real GDP is derived using nominal GDP and GDP deflator.
Viet Nam real GDP quarterly data is from Viet Nam resident mission’s database
GDP deflator Azerbaijan (Q1 2001–Q4 2014), People’s Republic of China (Q1 1992–Q4 2014), Georgia (Q1 1997–Q4 2014), India (Q2 1996–Q4 2014), Indonesia (Q1 1990–Q4 2014), Kyrgyz Republic (Q1 2000–Q4 2014), Republic of Korea (Q1 1990–Q4 2014), Malaysia (Q1 1991–Q4 2014), Mongolia (Q1 2000–Q4 2014), Philippines (Q1 1990–Q4 2014), Sri Lanka (Q1 2002–Q4 2014), Thailand (Q1 1993–Q4 2014), Viet Nam (Q1 1999–Q4 2014)
Azerbaijan, People’s Republic of China, Mongolia, Thailand, and Viet Nam data were estimated.
Exchange rate (period average)
Azerbaijan (Q4 1992–Q4 2014), People’s Republic of China (Q1 1990–Q4 2014), Georgia (Q4 1995–Q4 2014), India (Q1 1990–Q4 2014), Indonesia (Q1 1990–Q4 2014), Kyrgyz Republic (Q3 1993–Q4 2014), Republic of Korea (Q1 1990–Q4 2014), Malaysia (Q1 1990–Q4 2014), Mongolia (Q3 1990–Q4 2014), Philippines (Q1 1990–Q4 2014), Sri Lanka (Q1 1990–Q4 2014), Thailand (Q1 1990–Q4 2014), Viet Nam (Q1 1990–Q4 2014)
Interest rates Azerbaijan (Q1 2003–Q4 2014), People’s Republic of China (Q3 1996–Q4 2014), Georgia (Q2 1995–Q4 2014), India (Q3 1996–Q4 2014), Indonesia (Q1 1990–Q4 2014), Kyrgyz Republic (Q2 1997–Q4 2014), Republic of Korea (Q4 2000–Q4 2014), Malaysia (Q1 1990–Q4 2014), Mongolia (Q4 1990–Q4 2014), Philippines (Q1 1990–Q4 2014), Sri Lanka (Q1 1990–Q4 2014), Thailand (Q2 2001–Q4 2014), Viet Nam (Q4 2003–Q4 2014)
Interest rates proxies were used. To identify the proxy interest rate, we collect all possible interest rates
available in the country and correlate to the computed annual average interest rate.
Following are the proxy interest rates used by country: Deposit rate – Azerbaijan, Mongolia, Philippines, and Sri Lanka Money market rate – Georgia, Indonesia, and Kyrgyz Republic Treasury bill rate – India, Republic of Korea, and Thailand National interbank offered rate – People’s Republic of China Savings rate – Malaysia Discount rate – Viet Nam

28 | Annexes
ANNEX 2: PUBLIC SECTOR DEBT SUSTAINABILITY ANALYSIS DATABASE FOR ADB DMCs
The public sector DSA is patterned from the IMF Article IV DSA. Raw data are taken from the IMF World Economic Outlook Database (WEO), Fiscal Monitor, and International Financial Statistics (IFS) via Haver Analytics or CEIC Data Company; from the IMF Article IV Public Sector DSA (DSA) and Country Reports; from World Bank World Development Indicators database (WDI); from ADB Asian Development Outlook database (ADO); and from national sources via CEIC Data Company.
Nominal GDP in billion local currency units, GDP deflator, and real GDP are mainly sourced from WEO. GDP deflator may be computed by dividing the nominal and real GDP in local currency units. Real GDP growth figures and estimates for 2010 to 2016 used ADO 2015 figures and estimates.
The public sector debt data (in levels and as percent of GDP) is sourced mostly from the IMF Article IV Public Sector DSA, and also from Fiscal Monitor and WEO. Public sector debt refers to either central or general government debt (including government external debt).
Foreign currency-denominated public sector debt, total revenues and grants, total expenditure and net lending are sourced mainly from the IMF Article IV DSA Tables and Country Reports, and WEO.
Interest payment is sourced from mainly from WDI and IMF Article IV; or computed using the
average nominal interest rate and previous year’s debt stock. Foreign and domestic interest rates are taken from the IMF Article IV DSA Tables and Country
Reports. The average nominal interest rate is used for countries without data on foreign and domestic interest rates, and is computed as interest payment divided by the previous year’s debt stock multiplied by 100.
Nominal exchange rate is sourced from the IFS and data refer to period average exchange rate.
Data on contingent liabilities are derived from the IMF Article IV DSA Tables. Public Sector DSA 2015: Baseline Assumptions For the baseline assumptions, government finance data (revenue, expenditure, interest payments, foreign currency-denominated debt, contingent liabilities, foreign, domestic, and average nominal interest rates, are sourced from various IMF reports—IMF Article IV Public Sector DSA, IMF WEO, IMF Fiscal Monitor April 2015 (for selected economies); and World Bank WDI.
GDP growth rate, 2010–2016 data are sourced from ADB ADO April 2015; 2017–2020 data are sourced from WEO April 2015. Nominal exchange rate forecasts are derived from the nominal GDP forecast (LCU) divided by nominal GDP forecast ($) from WEO. Fan Chart Database Most of the quarterly real GDP, GDP deflator, and interest rate data are taken from national sources; and nominal exchange rates are sourced from the IMF-IFS database through CEIC Data Company and Haver Analytics. The Kyrgyz Republic real GDP data is computed using the nominal GDP and GDP
Annexes | 29
deflator, while Viet Nam quarterly real GDP is from the economic database of ADB Viet Nam resident mission.
All interest rates available in the country such as deposit, lending, discount, savings, Treasury bills, and other rates are collected and correlated to the computed annual average interest rate from the DSA database. Interest rate with the highest correlation with the computed annual interest rate is selected as the interest rate proxy. Guide on Data Definitions Most countries report on a calendar-year basis. Some economies record their government finance data on a fiscal year basis, such as Afghanistan; Bangladesh; Brunei Darussalam; Bhutan; Cook Islands; Hong Kong, China; India; Lao People’s Democratic Republic (Lao PDR); Marshall Islands; Fed. States of Micronesia; Myanmar; Nauru; Nepal; Pakistan; Palau; Samoa; Singapore; Taipei,China; Tonga; Thailand; and Uzbekistan. In the DSA, fiscal year nominal GDP is used for Afghanistan; Bangladesh; Bhutan; Hong Kong, China; India; Lao PDR; Marshall Islands; Fed. States of Micronesia; Myanmar; Nepal; Pakistan; Samoa; Singapore; Thailand; and Tonga.
Central government. The group of units consisting of all government units belonging to the central government and all nonmarket, nonprofit institutions controlled and mainly financed by the central government.
General government. It includes the central government (budgetary funds, extra budgetary funds, and social security funds); state and local governments; and other units consisting of all resident nonmarket, nonprofit institutions that are controlled and mainly financed by resident government units.
Total revenues and grants. It comprises tax revenue, other revenue (nontax revenue), and grants.
Total expenditure and net lending. It refers to total expense comprising current expenditure
(interest and noninterest), capital expenditure, and net lending.
Interest payment. It refers to interest expense related to government debt
Fiscal balance. Computed as total revenues and grants minus total expenditure and net lending.
Primary balance. Computed as fiscal balance, excluding interest payment.
Gross debt. It includes all liabilities that require future payment of interest and/or principal by
the debtor to the creditor. This includes debt liabilities in the form of Special Drawing Rights, currency deposits, debt securities, loans, insurance, pensions, and standardized guarantee schemes, and other accounts payable.
Net debt. It refers to gross debt minus financial assets, including those held by the broader public sector, for example, social security funds held by the relevant component of the public sector, in some cases.

30 | Annexes
General government debt. Includes domestic and external government debt. Refer to "Description and Comments" column for specific country coverage (Table A1.4).
Central government debt. Includes domestic and external government debt. Refer to
"Description and Comments" column for specific country coverage (Table A1.4).
Public sector debt. Includes domestic and external government debt. It includes broader public sector entities as identified in Article IV and the IMF DSA.
External debt (sourced from Global Development Finance, World Bank). Total external debt is debt owed to nonresidents repayable in foreign currency, goods, or services. It is the sum of public, publicly guaranteed, and private nonguaranteed long-term debt, short-term debt, and use of IMF credit.
Public and publicly guaranteed external debt (external public debt). Public and publicly guaranteed debt comprises long-term external obligations of public debtors, including the national government, political subdivisions (or an agency of either), and autonomous public bodies, and external obligations of private debtors that are guaranteed for repayment by a public entity.
Interest rate on foreign currency-denominated debt. As defined in the Article IV DSA.
Contingent liabilities. As defined in the Article IV DSA for each country.

Annexes | 31
ANNEX 3: DSA COUNTRY CHARTS
Figure A3.1: Public Debt Scenarios—Central Asia(% of GDP)
Armenia Azerbaijan
Georgia Kazakhstan
Kyrgyz Republic Tajikistan
GDP = gross domestic product. Note: Projection years are 2012–2016 and 2016–2020. Source: Authors' estimates using data from Article IV Consultation, International Monetary Fund (IMF); World Economic Outlook April 2015, IMF; World Development Indicators, World Bank; Fiscal Monitor April 2015, IMF; Asian Development Outlook 2015 Update, Asian Development Bank, and CEIC Data Company (all accessed 30 September 2015).
0
20
40
60
80
2000 20202011 20150
10
20
30
2000 20202011 2015
0
20
40
60
80
2000 20202011 20150
10
20
30
2000 20202011 2015
0
40
80
120
2000 20202011 20150
50
100
150
2000 20202011 2015
Baseline 2011 Actual/Baseline 2015 Historical scenario 2011Historical scenario 2015 Baseline 2011 revised IMF Article IV 2015

32 | Annexes
Figure A3.2: Public Debt Scenarios—East Asia(% of GDP)
People's Republic of China Republic of Korea
Mongolia
GDP = gross domestic product. Note: Projection years are 2012–2016 and 2016–2020. Source: Authors' estimates using data from Article IV Consultation, International Monetary Fund (IMF); World Economic Outlook April 2015, IMF; World Development Indicators, World Bank; Fiscal Monitor April 2015, IMF; Asian Development Outlook 2015 Update, Asian Development Bank, and CEIC Data Company (all accessed 30 September 2015).
0
10
20
30
40
2000 20202011 20150
10
20
30
40
2000 20202011 2015
0
25
50
75
100
125
2000 20202011 2015
Baseline 2011 Actual/Baseline 2015 Historical scenario 2011Historical scenario 2015 Baseline 2011 revised IMF Article IV 2015

Annexes | 33
Figure A3.3: Public Debt Scenarios—The Pacific(% of GDP)
Fiji Papua New Guinea
Solomon Islands Tonga
GDP = gross domestic product. Note: Projection years are 2012–2016 and 2016–2020. Source: Authors' estimates using data from Article IV Consultation, International Monetary Fund (IMF); World Economic Outlook April 2015, IMF; World Development Indicators, World Bank; Fiscal Monitor April 2015, IMF; Asian Development Outlook 2015 Update, Asian Development Bank, and CEIC Data Company (all accessed 30 September 2015).
30
40
50
60
70
2000 20202011 20150
20
40
60
80
100
2000 20202011 2015
0
30
60
90
120
150
2000 20202011 201520
40
60
80
2000 20202011 2015
Baseline 2011 Actual/Baseline 2015 Historical scenario 2011Historical scenario 2015 Baseline 2011 revised IMF Article IV 2015
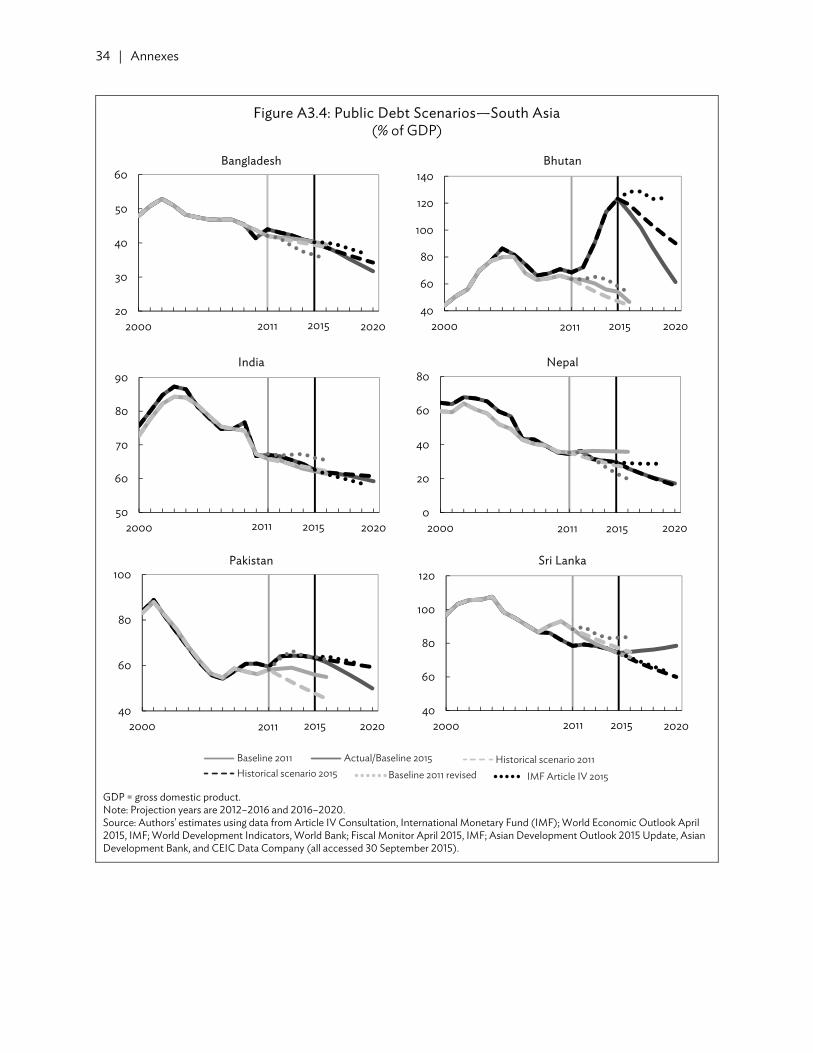
34 | Annexes
Figure A3.4: Public Debt Scenarios—South Asia(% of GDP)
Bangladesh Bhutan
India Nepal
Pakistan Sri Lanka
GDP = gross domestic product. Note: Projection years are 2012–2016 and 2016–2020. Source: Authors' estimates using data from Article IV Consultation, International Monetary Fund (IMF); World Economic Outlook April 2015, IMF; World Development Indicators, World Bank; Fiscal Monitor April 2015, IMF; Asian Development Outlook 2015 Update, Asian Development Bank, and CEIC Data Company (all accessed 30 September 2015).
20
30
40
50
60
2000 20202011 201540
60
80
100
120
140
2000 20202011 2015
50
60
70
80
90
2000 20202011 20150
20
40
60
80
2000 20202011 2015
40
60
80
100
2000 20202011 201540
60
80
100
120
2000 20202011 2015
Baseline 2011 Actual/Baseline 2015 Historical scenario 2011Historical scenario 2015 Baseline 2011 revised IMF Article IV 2015
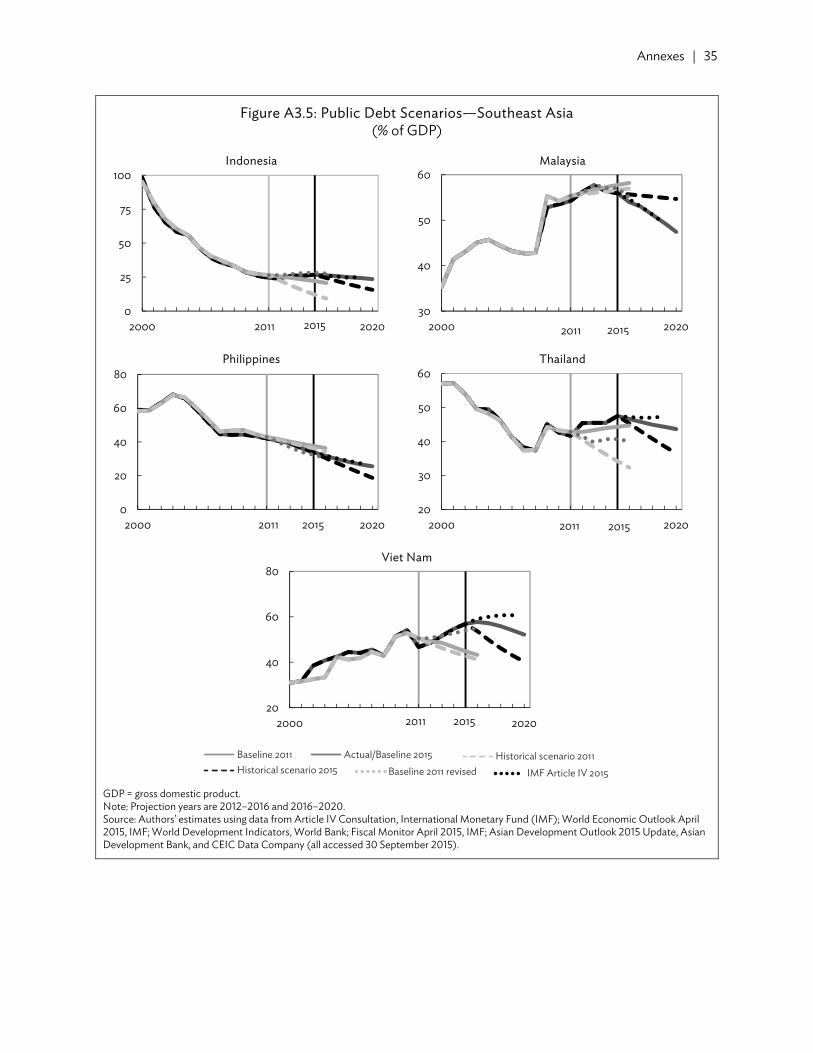
Annexes | 35
Figure A3.5: Public Debt Scenarios—Southeast Asia (% of GDP)
Indonesia Malaysia
Philippines Thailand
Viet Nam
GDP = gross domestic product. Note: Projection years are 2012–2016 and 2016–2020. Source: Authors' estimates using data from Article IV Consultation, International Monetary Fund (IMF); World Economic Outlook April 2015, IMF; World Development Indicators, World Bank; Fiscal Monitor April 2015, IMF; Asian Development Outlook 2015 Update, Asian Development Bank, and CEIC Data Company (all accessed 30 September 2015).
0
25
50
75
100
2000 20202011 201530
40
50
60
2000 20202011 2015
0
20
40
60
80
2000 20202011 201520
30
40
50
60
2000 20202011 2015
20
40
60
80
2000 20202011 2015
Baseline 2011 Actual/Baseline 2015 Historical scenario 2011Historical scenario 2015 Baseline 2011 revised IMF Article IV 2015

REFERENCES Adams, C., and Ferrarini, B. 2010. Fiscal Sustainability in Developing Asia. Background paper for the
Asian Development Outlook. Manila: Asian Development Bank. Unpublished. Asian Development Bank (ADB). 2015. Asian Development Outlook 2015. Manila. Ferrarini, B., R. Jha, and A. Ramayandi. 2012. Public Debt Sustainability in Developing Asia. Asian
Development Bank and Routledge. Ferrarini, B., and A. Ramayandi. 2012. Public Debt Sustainability Assessments for Developing Asia. In
Public Debt Sustainability in Developing Asia. pp. 47–109. Asian Development Bank and Routledge.
Ferrucci, G., and A. Penalver. 2003. Assessing Sovereign Debt under Uncertainty. Financial Stability
Review. Bank of England. pp. 151–59. Gray, D., C. H. Lim, E. Loukoianova, S. Malone. 2008. A Risk–Based Debt Sustainability Framework:
Incorporating Balance Sheets and Uncertainty. IMF Working Paper No. WP/08/40. Washington, DC: International Monetary Fund.
Hemming, R. 2012. Public Debt Sustainability and Hidden Liabilities in the People’s Republic of China.
In Public Debt Sustainability in Developing Asia. pp. 110–38. Asian Development Bank and Routledge.
International Monetary Fund (IMF). 2011. Bhutan—2011 Article IV Consultation. IMF Country Report
No.11/123. Washington, DC. ————. 2012. Mongolia—2012 Article IV Consultation. IMF Country Report No. 12/320. Washington,
DC. ————. 2014a. Mongolia—2013 Article IV Consultation. IMF Country Report No. 14/64. Washington,
DC. ————. 2014b. Bhutan—2013 Article IV Consultation. IMF Country Report No. 14/178. Washington,
DC. ————. 2014c. Republic of Kazakhstan—2014 Article IV Consultation. IMF Country Report No.
14/242. Washington, DC. ————. 2015. World Economic Outlook Database, October 2015. https://www.imf.org/external/pubs/
ft/weo/2015/02/weodata/index.aspx

ASIAN DEVELOPMENT BANK
AsiAn Development BAnk6 ADB Avenue, Mandaluyong City1550 Metro Manila, Philippineswww.adb.org
Public Debt Sustainability in Developing Asia: An Update
The paper updates debt sustainability analysis (DSA) for developing Asia, conducted in 2011. With the benefit of hindsight, the accuracy of the earlier debt ratio forecasts and underlying macroeconomic assumptions is assessed. In general, the standard DSA is found able to predict debt ratios fairly accurately. The fan chart analysis confirms the importance of integrating stochastic analysis to the standard DSA. Looking forward, debt ratio projections suggest benign outlook remains for the region as a whole, country heterogeneity notwithstanding. The importance of macroeconomic forecast accuracy is emphasized and the need to capture volatility by appropriate risk analysis tools is suggested.
About the Asian Development Bank
ADB’s vision is an Asia and Pacific region free of poverty. Its mission is to help its developing member countries reduce poverty and improve the quality of life of their people. Despite the region’s many successes, it remains home to the majority of the world’s poor. ADB is committed to reducing poverty through inclusive economic growth, environmentally sustainable growth, and regional integration.
Based in Manila, ADB is owned by 67 members, including 48 from the region. Its main instruments for helping its developing member countries are policy dialogue, loans, equity investments, guarantees, grants, and technical assistance.
PUBlic DeBt SUStAinABility in DeveloPing ASiA: An UPDAteBenno Ferrarini and Arief Ramayandi
adb economicsworking paper series
no. 468
december 2015