Embed Size (px)
Citation preview
1
IN DEPTH ANALYSIS OF BIOLOGICAL TISSUE CHARACTERISTICS OF UTERINE FIBROIDS USING NEW MRI TECHNIQUES Master Thesis Technical Medicine Medical Imaging & Interventions
Inge Slouwerhof February 2016 University of Twente Examination Committee Prof. Dr. M. IJzerman Drs. M.F. Boomsma Ir. J.A.C. van Osch Dr. Ir. B. ten Haken Drs. P.A. van Katwijk A. Grob, MSc.

2
3
Aim and outline of the thesis
Magnetic Resonance guided High Intensity Focused Ultrasound (MR-HIFU) is a promising minimal-
invasive therapy for the treatment of uterine fibroids, a frequent appearing benign gynaecological
tumor.
The first aim of this thesis is design, clinically implement and study new multi-parametric MRI
techniques for characterization of uterine fibroids and compare them with the traditional MRI
screening parameters in an exploratory study. Knowledge about MRI-based characterization
parameters contributes to an optimization of patient selection, treatment planning and treatment
outcomes of the MR-HIFU treatment for uterine fibroids. Also, identification and characterization of
the patient population in the Isala suffering from uterine fibroid-related symptoms is performed. This
outline of the patient population in the MASS I study (Myoma Screening Study) will contribute to the
preparation and implementation of the HIFU treatment in the clinical gynaecological treatment
spectrum. Finally, clinical feasibility can be grounded by means of this study.
Second part of this thesis is the design of a subsequent study treating patients with MR-HIFU. This
study (MASS II) is a continuation of the MASS I study and will study the prognostic value of the new
MRI parameters developed in the MASS I study in treatment effectiveness, planning and treatment
outcome.
In chapter 3 of this thesis a general introduction is given about the background and rationale of the
conducted study.
Chapter 4 presents the design and results of the MASS I study.
The design of the subsequent MASS II study is elaborated in chapter 5.
In chapter 6 the overall conclusions are given with future perspectives.
The thesis will end with the references and some Appendices.
4
Table of Contents
1 English Summary ............................................................................................................................................ 5
2 Nederlandse Samenvatting ............................................................................................................................ 6
3 General Introduction ...................................................................................................................................... 7
3.1 Uterine Fibroids ..................................................................................................................................... 7
3.2 MR guided High Intensity Focused Ultrasound treatment .................................................................... 8
3.3 Diagnostic imaging of uterine fibroids in current practice .................................................................. 10
3.4 Magnetic Resonance Imaging for Uterine Fibroids ............................................................................. 11
4 In depth analysis of biological tissue characteristics of uterine fibroids using new MRI techniques .............. 15
4.1 Introduction and rationale .................................................................................................................. 15
4.2 Materials & Methods ........................................................................................................................... 18
4.3 Results ................................................................................................................................................. 22
4.4 Discussion ............................................................................................................................................ 29
4.5 Conclusion ........................................................................................................................................... 31
5 Treatment of Uterine Fibroids with Magnetic Resonance guided High Intensity Focused Ultrasound: the
search for revealing Imaging Parameters ............................................................................................................. 32
5.1 Introduction ......................................................................................................................................... 32
5.2 Objectives ............................................................................................................................................ 33
5.3 Study Design ........................................................................................................................................ 33
5.4 Study population ................................................................................................................................. 35
5.5 Study Parameters ................................................................................................................................ 36
5.6 Study Procedures ................................................................................................................................. 36
5.7 Statistical Analysis ............................................................................................................................... 37
6 Overall Conclusion and Future Perspectives ................................................................................................ 39
7 Abbreviations ............................................................................................................................................... 40
8 References .................................................................................................................................................... 41
Appendix I: Funaki Classification ........................................................................................................................... 43
Appendix II: Theoretical MRI background ............................................................................................................. 44
Appendix III: METC Application MASS 1 Study
Appendix IV: METC Application MASS 2 Study
5
1 English Summary Uterine fibroids are the most common gynaecological tumors affecting a high percentage of women.
Symptoms occurring from the fibroids are abnormal bleeding, pelvic discomfort and reproductive
dysfunction. The treatment possibilities vary from drug therapy to total surgical removal of the
uterus. Recently, the minimal-invasive, Magnetic Resonance guided High Intensity Focused
Ultrasound (MR-HIFU) is added as a treatment option. This technique combines the anatomical and
functional imaging of MRI with the thermal ablation possibilities of high intensity focused ultrasound.
Patient selection, based on screening MRIs, before MR-HIFU treatment is an essential step towards
obtaining good treatment results.
Currently, the Funaki classification is used as the primary MRI classification parameter for
determining patient suitability by dividing the patient population in three groups. From literature we
have seen treatment results vary among patients. We hypothesize that visualizing fibroid
characteristics with new MRI sequences and image biomarkers contributes to a better patient
selection and therefore better treatment results. The goal of this study is to implement a novel and
extensive MRI protocol in the diagnosis of uterine fibroids in the current practice of the Isala Clinics.
The implemented MRI protocol consists of the conventional T2 and T1 weighted sequences. Also a
contrast enhanced T1 image is acquired. Besides these conventional sequences, we implemented T2
relaxometry for the measurement of the T2 relaxation time, a diffusion weighted imaging (DWI)
sequence and a DWI sequence with a long echo time. Also, a clinical questionnaire is obtained in
these patients.
We performed the MRI scans on 10 patients. For all patients, the whole MRI protocol could be
executed. Funaki classifications are determined: two 2 patients fell in Funaki classification 1, seven
patients fell in classification 2 and one patient fell in classification 3. All 10 patients completed the
symptom severity questionnaire. The mean symptom severity score was 37.1 ± 20.3. We found that
measurements of the T2 relaxometry maps and ADC maps can be performed in all patients by means
of a Matlab developed software. The different functional imaging parameters show a difference
between normal myometrium tissue and uterine fibroid tissue. Because a variety is seen in fibroid
volume, symptom severity score and the values of the different imaging parameters among patients
underline our hypothesis: we find a wide variety and heterogeneity among patients suffering from
uterine fibroids.
The initiation and first results of this study show a promising start to the implementation of the HIFU
treatment in a non-academic high-volume hospital. We developed an extensive MRI protocol,
including functional imaging sequences producing non-invasive biomarkers for the characterization
of uterine fibroid tissue. We also developed a Matlab code for the analysis of the MRI parameters.
The study will be continued until 80 patients are included allowing an enlargement if the analysis.
We established the next step in the line of research in a new research protocol (MASS 2 study). By
continuing to apply the extensive MRI protocol before and after MR-HIFU treatments, we are looking
for imaging-based predictors of treatment success.
6
2 Nederlandse Samenvatting Uterus myomen zijn de meest voorkomende goedaardige gynaecologische tumoren, voorkomend bij
een hoog percentage vrouwen. Symptomen die optreden zijn abnormale bloedingen, ongemak in de
onderbuik en voortplantingsdisfunctie. The behandelmogelijkheden variëren van medicamenteuze
therapie tot een totale operatieve baarmoeder verwijdering. Recent, de minimaal-invasieve
behandeling Magnetic Resonance guided High Intensity Focused Ultrasound (MR-HIFU) is
toegevoegd aan het behandel spectrum. Deze techniek combineert de anatomische en functionele
beeldvorming van MRI met de thermale ablatie mogelijkheid van de gefocusseerde ultrageluid met
hoge intensiteit. Patiënt selectie, gebaseerd op de screening MRI, voorafgaand aan een MR-HIFU
behandeling is een essentiële stap voorwaarts in het verkrijgen van klinisch goede
behandelresultaten.
In de huidige praktijk, de Funaki classificatie wordt gebruikt als de primaire MRI classificatie
parameter voor het bepalen van patiënt geschiktheid, waarbij patiënten in 3 groepen worden
ingedeeld. Er wordt gezien dat de behandelresultaten verschillend tussen patiënten. Wij
veronderstellen dat het in beeld brengen van myoomkarakteristieken met MRI, bijdraagt aan de
patiënt selectie en behandelresultaten. Het doel van deze studie is het implementeren van een
uitgebreid MRI protocol in de diagnose van uterus myomen in de huidige klinische praktijk van de
Isala. Mogelijkheden en onmogelijkheden worden bestudeerd.
Het geïmplementeerde MRI protocol bestaat uit de conventionele T2 en T1 gewogen sequenties. Ook
worden contrast gewogen T1 sequenties verkregen. Naast deze sequenties, implementeren we T2
relaxometrie en verschillende diffusie gewogen sequenties. Daarbij wordt een klinische vragenlijst
afgenomen.
Een MRI volgens het nieuwe protocol is gemaakt in 10 patiëntes. Bij alle patiëntes kon het gehele
protocol worden uitgevoerd. De Funaki classificaties zijn als volgt: twee patiëntes vielen in Funaki
classificatie 1, zeven patiëntes in classificatie 2 en één patiënte viel in Funaki classificatie 3. Alle 10
patiëntes hebben de symptoom vragenlijst ingevuld. De gemiddelde ‘symptom severity score’ was
37.1 ± 20.3. Metingen in the T2 relaxometrie maps en de ADC maps konden worden uitgevoerd in
alle patiënten door middel van Matlab software. De verschillende functionele beeldvormende
parameters laten een verschil zien tussen normaal myometrium weefsel en myoom weefsel. Een
variëteit wordt gezien in myoom volume, symptoom hevigheid en de waardes van verschillende MRI
parameters tussen patiëntes. Dit onderstreept onze hypothese: we vinden een hoge variëteit en
heterogeniteit in patiëntes met gediagnosticeerde uterus myomen.
De initiatie en eerste resultaten van deze studie laten een veelbelovende start zien voor de
implementatie van de MR-HIFU behandeling in een niet-academisch hoog-volume centrum. We
hebben een uitgebreid MRI ontwikkeld, met daarin functionele sequenties voor non-invasieve bio-
markers te gebruiken bij de karakterisatie. Ook hebben we een Matlab code ontwikkeld voor de
analyse van de MRI parameters. Deze studie zal worden voortgezet tot er 80 patiëntes zijn
geïncludeerd, wat zal leiden tot een vergroting van de analyse.
We maakten de volgende stap in deze onderzoekslijn door het opstellen van een nieuw
onderzoeksprotocol (MASS 2 studie). Door het blijven toepassen van het uitgebreide MRI protocol
voor en na MR-HIFU behandelingen, gaan we op zoek naar voorspellers van goede
behandelresultaten met behulp van MRI.
7
3 General Introduction
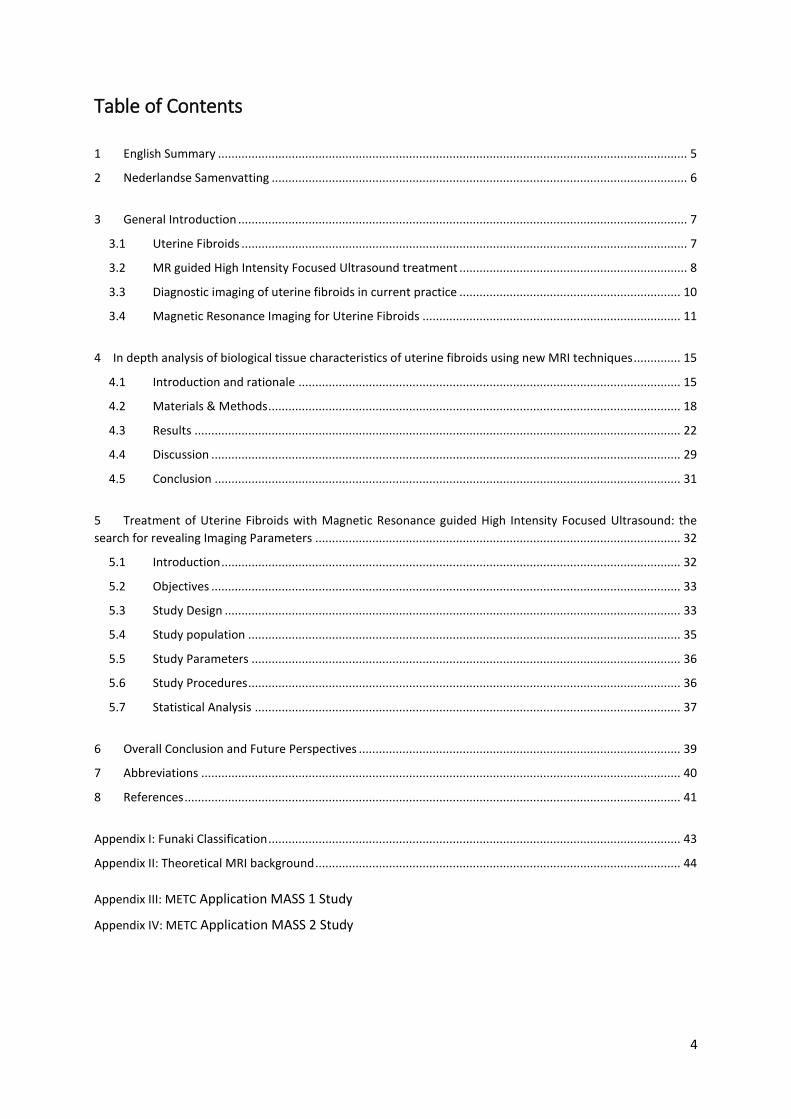
3.1 Uterine Fibroids Leiomyomata, also called uterine fibroids, are the most common benign gynaecological tumors
affecting a high percentage of women. The life-time prevalence of fibroids lies between 70 to 80%.
Uterine fibroids are benign hormone-sensitive tumors arising from smooth-muscle cells of the
uterus. The fibroids may occur in different locations in the uterus. The classification of this location is
of important interest when choosing therapy. Intramural fibroids are situated within the uterine wall,
while subserosal fibroids are developed on the outer uterine wall. Submucosal uterine fibroids often
intrude the cavum uteri. The international federation of gynaecology and obstetrics (FIGO) uses the
following sub classification system: submucosal fibroids (FIGO type 0, 1, 2), intramural fibroids (FIGO
type 3, 4), subserosal fibroids (FIGO types 5, 6, 7) and other (FIGO type 8).
The majority of women with uterine fibroids is asymptomatic. However, 20-50% of the patients show
symptoms1, such as abnormal uterine bleeding, pelvic discomfort due to the existing mass and
reproductive dysfunction. All these symptoms are leading to a significant negative effect on the
quality of life. The above described locations of uterine fibroids are an important determining factor
in the symptom occurrence. Submucosal fibroids often show uterine bleeding and reproductive
dysfunction, while subserosal fibroids tend to lead to pelvic discomfort. Treatment possibilities
include drug therapy, hysterectomy, myomectomy, uterine artery embolization and magnetic
resonance guided “High Intensity Focused Ultrasound” (MR-HIFU). The choice of treatment and rate
of success is dependent on the morphology and tissue characterization of the uterine fibroids2.
Hysterectomy generally was the choice of treatment in patients with severe symptoms. However,
this treatment has a great impact on the patient’s life. The hormonal status is changed, childbearing
is eliminated and treatment complications risks are significant. Therefore, uterus preserving
strategies are becoming more and more popular nowadays. In particular minimal invasive treatments
such as uterine artery embolization and MR-HIFU.
Figure 1: Different types of uterine fibroids and Leiomyoma Sub classification System
8
3.1.1 Histology of Uterine Fibroids Uterine fibroids are characterized by the proliferation of smooth muscle cells in the myometrium and
an exaggerated deposition of collagenous extracellular matrix3,4. From literature it is known that the
histopathology of uterine fibroids varies among patients4. Based on the histopathology, multiple
subtypes of uterine fibroids are recognized. All uterine fibroids are composed of smooth muscle fiber
bundles, surrounded by collagenous fibrous connective tissue within which are blood vessels. Also
variable numbers of mast cells are present. The density of each of these cell types is different for the
various types of uterine fibroids4. Large leiomyomata can degenerate due to an outgrow on their
blood supply. Degeneration can manifest in hyaline, myxoid, cystic and red degeneration. After
necrosis due to degeneration of the tissue, calcifications tend to develop1.
Histological and biological characterization of fibroid tissue is useful knowledge in the choice and
suitability of treatment options2,4. For example, the treatment effects of drug therapy are lower in
patients with a high proportion of collagenous tissue because of its unresponsiveness4. Also in MR-
HIFU treatment, tissue characteristics are an important predictor of success and therefore are
included in the regular inclusion guidelines.
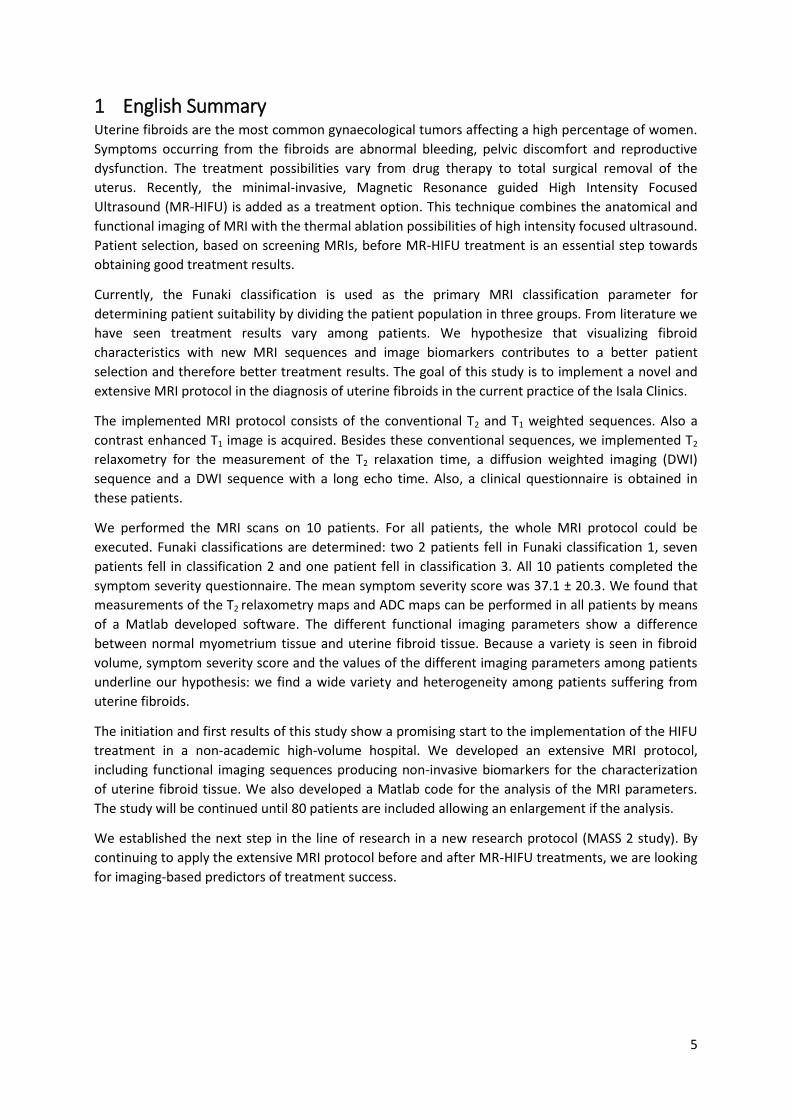
3.2 MR guided High Intensity Focused Ultrasound treatment A recently introduced minimal invasive treatment for uterine fibroids is MR guided High Intensity
Focused Ultrasound (MR-HIFU). This form of therapy makes use of the imaging capabilities of MRI
combined with high intensity focused ultrasound to treat the fibrous tissue.
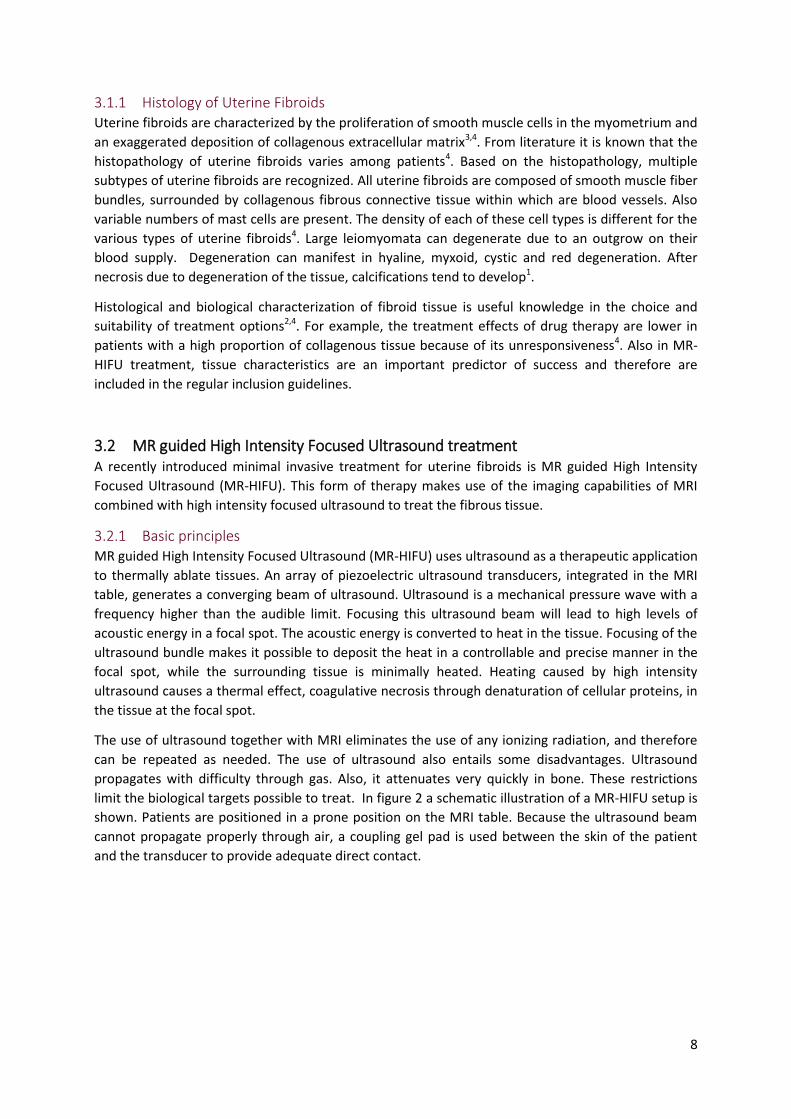
3.2.1 Basic principles MR guided High Intensity Focused Ultrasound (MR-HIFU) uses ultrasound as a therapeutic application
to thermally ablate tissues. An array of piezoelectric ultrasound transducers, integrated in the MRI
table, generates a converging beam of ultrasound. Ultrasound is a mechanical pressure wave with a
frequency higher than the audible limit. Focusing this ultrasound beam will lead to high levels of
acoustic energy in a focal spot. The acoustic energy is converted to heat in the tissue. Focusing of the
ultrasound bundle makes it possible to deposit the heat in a controllable and precise manner in the
focal spot, while the surrounding tissue is minimally heated. Heating caused by high intensity
ultrasound causes a thermal effect, coagulative necrosis through denaturation of cellular proteins, in
the tissue at the focal spot.
The use of ultrasound together with MRI eliminates the use of any ionizing radiation, and therefore
can be repeated as needed. The use of ultrasound also entails some disadvantages. Ultrasound
propagates with difficulty through gas. Also, it attenuates very quickly in bone. These restrictions
limit the biological targets possible to treat. In figure 2 a schematic illustration of a MR-HIFU setup is
shown. Patients are positioned in a prone position on the MRI table. Because the ultrasound beam
cannot propagate properly through air, a coupling gel pad is used between the skin of the patient
and the transducer to provide adequate direct contact.
9
Figure 2: Schematic illustration of a MR-HIFU system
MRI is of great importance in MR-HIFU treatments. Not only is MRI used in patient selection and
treatment planning, also real-time temperature mapping and post-treatment success conformation
are important MRI features during and after the procedure.
3.2.2 Patient selection Several clinical studies show that MR-HIFU is an effective and safe treatment for symptomatic
uterine fibroids5. However, not all patients are suitable candidates for the HIFU procedure and
distinguishing between suitable and unsuitable patients for HIFU treatment is an ongoing challenge.
The first screening round for potential candidates takes place at the gynaecologists office. By means
of anamnesis and vaginal ultrasonography, an initial screening is performed. Potential candidates for
HIFU treatment are than screened with a pelvic MRI protocol. The most important factors which are
examined are the location of the uterine fibroid, the interposition of bowel or ovaries in the
ultrasound pathway and the position of the fibroid in relation to nearby anatomical structures6.
Extensive research about the correlation between T2 signal intensity and treatment results show that
hypervascular fibroids with a high T2 signal intensity are difficult to treat and therefor are generally
excluded for MR-HIFU treatment7.
3.2.3 Treatment effects Treatment effects of a MR-HIFU treatment for uterine fibroids can be measured in different manners
and there is no uniform consent about treatment effect parameters. The non-perfused volume (NPV)
ratio and the Uterine Fibroid Symptom and Health related Quality of Life questionnaire (UFS-QoL)
score improvement are the most frequently used parameters. From literature it is known that the
area of the NPV within the treated uterine fibroid corresponds to the volume of necrotic tissue8. The
NPV ratio (ratio between the baseline fibroid volume and the NPV post-treatment) is a predictor for
fibroid volume reduction as well as symptom relief after a short follow-up9,10. Because symptoms are
the most important factor to treat uterine fibroids, symptom reduction is the second important
treatment effect parameter. The symptom score is measured with the standardized, disease specific
UFS-QoL questionnaire. The symptom scores are measured in 6 fields (concern, activities,
10
energy/mood, control, self-consciousness and sexual function) and transformed into a 0 to 100-point
scale11. A reduction of 10 points after follow-up is normally seen as a significant symptom
improvement.
Despite extensive patient selection as described in section 4.2.2, treatment results are very diverse
as shown in the systematic review by Gizzo et al. 5. The NPV ratio varies between 16.3% and 98%. A
NPV ratio of >50% was achieved in 60% of the studies. UFS-QoL improvement varies between 15 and
66 points (mean = 31). There already has been some research on predictors of success of MR-HIFU
treatment. As earlier described, the signal intensity of the fibroid on T2 weighted images is the main
parameter of characterization. However, this parameter may be too limited as a predictor of
treatment outcome. Yoon et al. show a case report of a successfully treated hyper-intense type 3
uterine fibroid6. This suggests that additional screening parameters are required to make better
defined subpopulations of patients potentially suitable for MR-HIFU treatment. Knowledge of MRI-
based predictors of success prior to treatment may contribute to an optimization of patient selection
and therefore treatment outcomes.
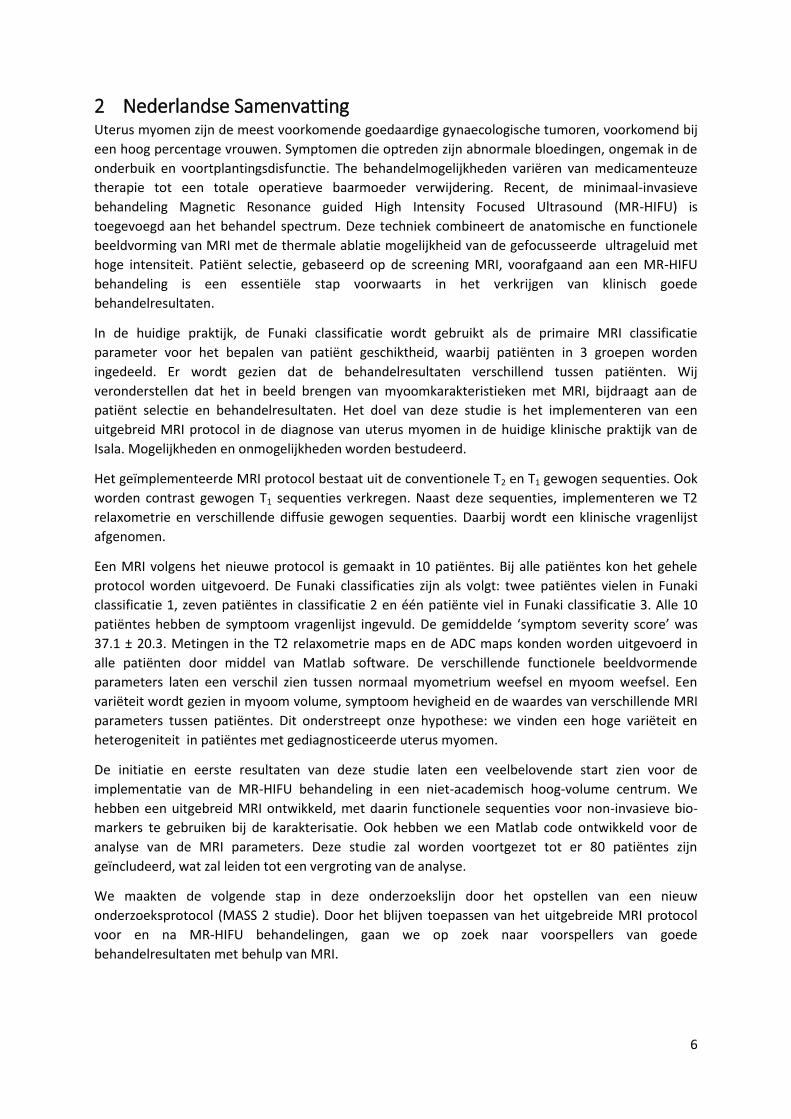
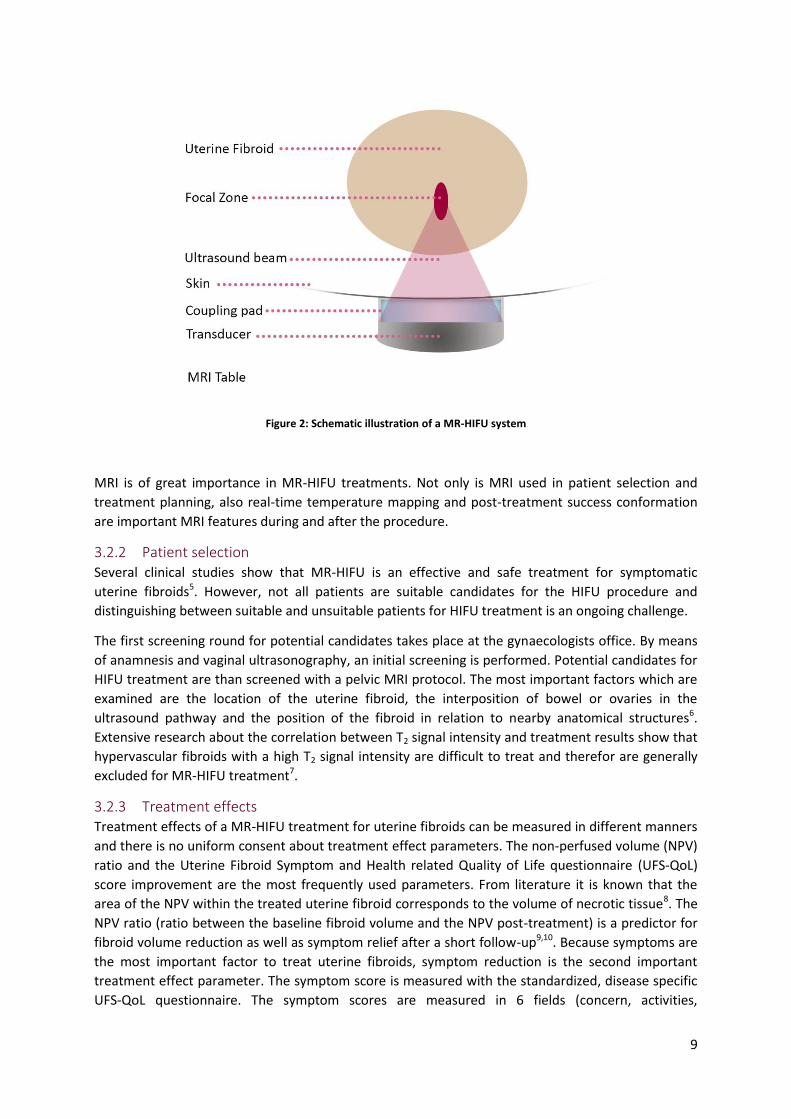
3.3 Diagnostic imaging of uterine fibroids in current practice In current practice, uterine fibroids are diagnosed based on anamnesis, physical examination and
trans-vaginal ultrasonography at the gynecologist’s office. Women complaining about abnormal
bleeding and pelvic discomfort will always be examined for uterine fibroids. In addition, uterine
fibroids can be found incidentally on computed tomography (CT) scans performed for other reasons.
The trans-vaginal ultrasound (TVA) gives rudimentary information about the size and the location of
the uterine fibroid(s). Also calcifications inside of the fibroid can be identified. However, it does not
give information about any underlying disease or all the existing fibroids. Generally, uterine fibroids
appear on the TVA as solid masses with a similar echogenicity as the surrounding myometrium,
although they can be hypo-echoic. The fibroids can cause acoustic shadowing, even if they are not
calcified. Degeneration on TVA can be identified as areas with cystic change or calcifications.
In current practice, when the origin of the pelvic mass is doubted, an additional examination using
Magnetic Resonance Imaging (MRI) should be performed.
Figure 3: Left: example of an incidentally found uterine fibroid with calcifications on CT. Right: example of an TVA showing an 1.1 cm submucosal uterine fibroid.
11
3.4 Magnetic Resonance Imaging for Uterine Fibroids Modern minimal-invasive treatments of uterine fibroids make an exact evaluation of the uterine
fibroid size, number, location and tissue characteristics a relevant issue. In current practice, with only
a transvaginal ultrasonography (TVS) as an imaging method, it is not possible to accurate characterize
these characteristics before uterine fibroid treatment. Magnetic Resonance Imaging (MRI) is more
sensitive in identifying uterine fibroids than ultrasonography12 and has a high diagnostic performance
in leiomyomata imaging. Therefore, is not only used when there is doubt about the origin of the
pelvic mass, but also as an additional uterine fibroid characterization tool.
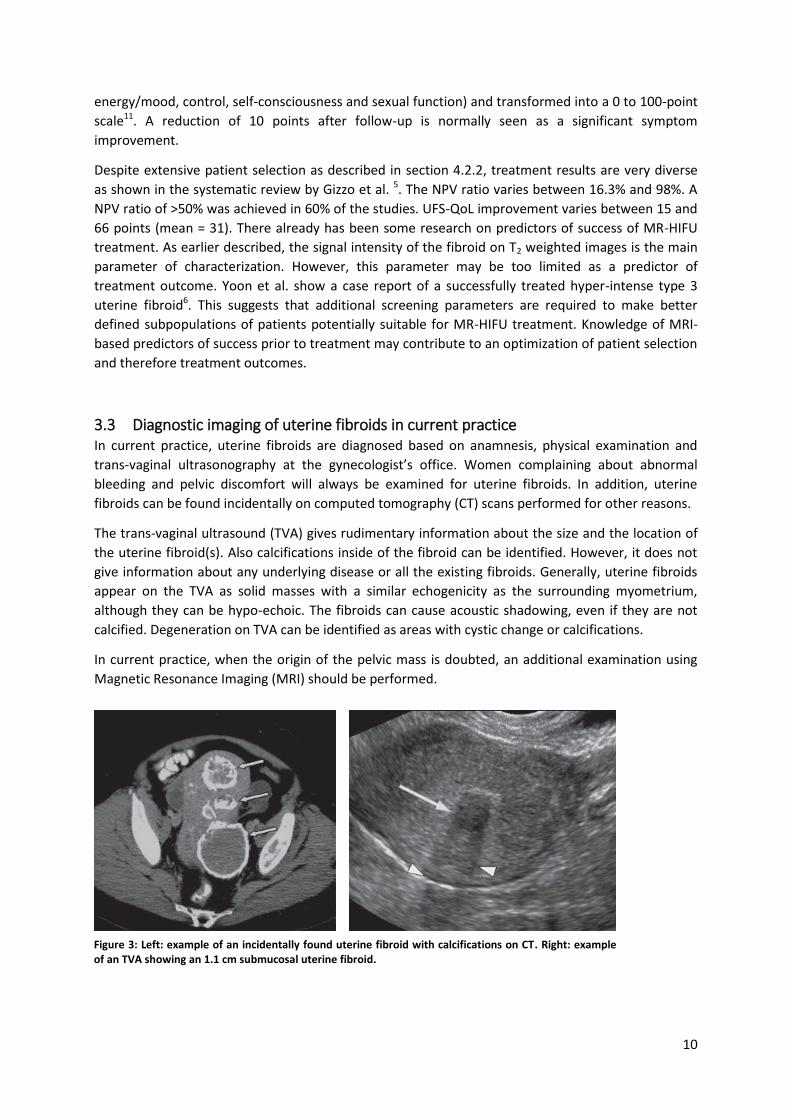
3.4.1 Current MRI classification: Funaki Classification Current imaging-based biological characterizations of uterine fibroids are limited. The signal intensity
on T2-weighted MRI images is the main parameter of characterization. This parameter is described
by the Funaki classification, defined by Funaki et al. in 20077. In the Funaki classification, patients are
stratified in 3 groups based on T2 signal intensity in selection of MR-HIFU treatment. The mean T2
signal intensity of the fibroid is compared to the signal intensity of skeletal muscle and abdominal fat.
Details of the Funaki classification are listed in appendix I. In figure 4, an example of the Funaki
classifications is shown. This subdivision of uterine fibroids is correlated with pathohistologic
structures, demonstrated by Zhao et al. in 201413. The Funaki classification is proven to be a predictor
of treatment outcome.
However, we think the Funaki classification alone is a limited parameter. The whole patient
population is divided in only three groups. Fibroids classified as Funaki classification 1 are good
candidates for HIFU treatment, as the vascularity is relatively low. A high signal intensity comparing
to skeletal muscle is seen in Funaki classification 3. This could represent a high vascularity, which is a
disadvantage for HIFU treatment, because the deposited heat is rapidly distributed and drained,
resulting in poor treatment outcomes7,1414. Most fibroids are characterized as Funaki classification 2.
However, treated fibroids in this classification demonstrate varying treatment results.
3.4.2 MR characteristics of uterine fibroids Because we think the Funaki classification is too limited for the characterization of uterine fibroids,
other MRI parameters are discovered. Recently, new multi-parametric MRI parameters are
developed by Philips Healthcare (Eindhoven) that can be used as non-invasive biomarkers to
Figure 4: Left: Funaki classification 1; Middle: Funaki classification 2; Right: Funaki classification 3. T2 signal intensity compared to skeletal muscle and subcutaneous fat is low in Funaki classification 1 and high in Funaki classification 2.
12
characterize fibroid tissue. This set of new MRI parameters can be used to visualize and gain
knowledge about the biological variation and characterization of uterine fibroids. This could be
important in the choice of the most appropriate minimal invasive therapy. The MRI parameters
potentially able to describe useful tissue characteristics are Apparent Diffusion Coefficient maps
(ADC maps) by means of diffusion weighted imaging and T2 maps. Below, the choice of the different
parameters is explained further.
3.4.2.1 Diffusion Weighted Imaging
Diffusion weighted imaging (DWI) provides information about the movement of water within a
tissue. The image contrast is resolved by micro-diffusion of water protons in intracellular and
extracellular environments. Changes in diffusion of water result in an altered signal intensity.
MR-DWI produces a quantitative MRI parameter; the apparent diffusion coefficient (ADC, which is a
quantitative measure of the water movement (diffusion) within a tissue. The ADC value gives an
average value of the flow and the distance a water molecule is moved. ADC maps are created by
acquiring diffusion weighted images with different diffusion weightings (i.e. different b-values). To
calculate the b-value (s/mm2), the following equation is used:
𝑏 = 𝛾2 × 𝐺2 × 𝛿2 × (∆ − 𝛿 3⁄ )
In which γ is the gyromagnetic ratio, G the magnitude of the gradient, δ the duration of the gradient
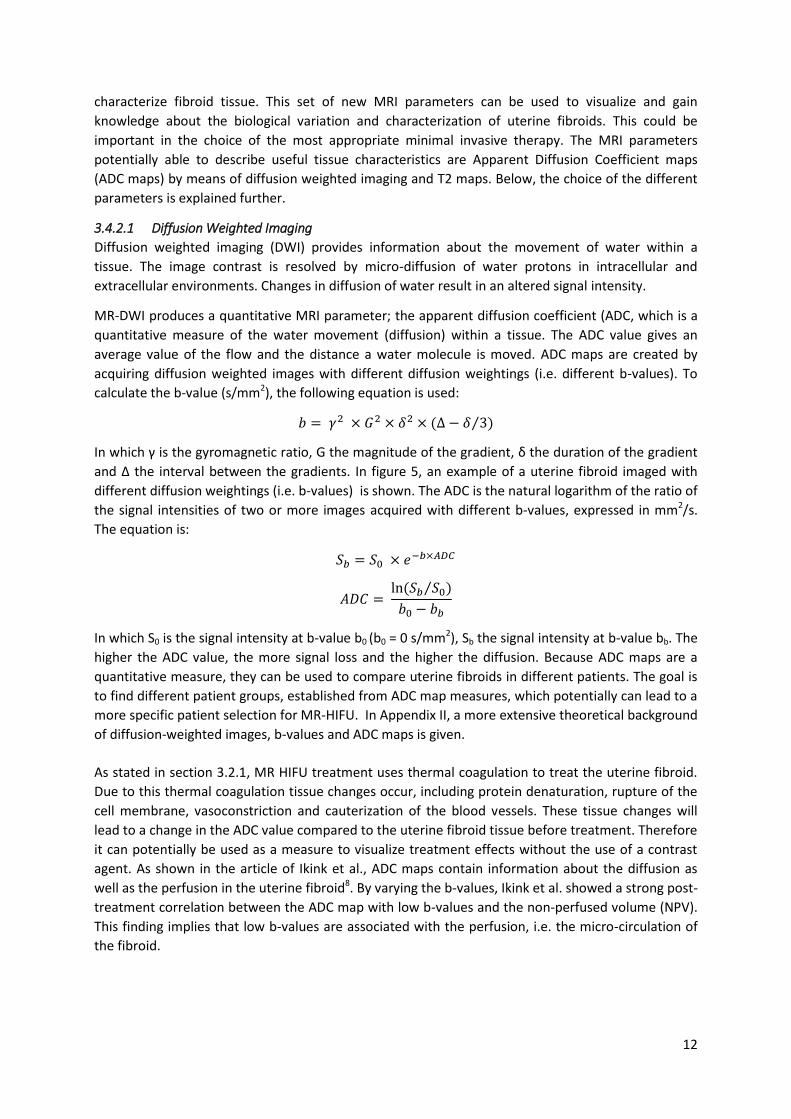
and Δ the interval between the gradients. In figure 5, an example of a uterine fibroid imaged with
different diffusion weightings (i.e. b-values) is shown. The ADC is the natural logarithm of the ratio of
the signal intensities of two or more images acquired with different b-values, expressed in mm2/s.
The equation is:
𝑆𝑏 = 𝑆0 × 𝑒−𝑏×𝐴𝐷𝐶
𝐴𝐷𝐶 = ln (𝑆𝑏 𝑆0⁄ )
𝑏0 − 𝑏𝑏
In which S0 is the signal intensity at b-value b0 (b0 = 0 s/mm2), Sb the signal intensity at b-value bb. The
higher the ADC value, the more signal loss and the higher the diffusion. Because ADC maps are a
quantitative measure, they can be used to compare uterine fibroids in different patients. The goal is
to find different patient groups, established from ADC map measures, which potentially can lead to a
more specific patient selection for MR-HIFU. In Appendix II, a more extensive theoretical background
of diffusion-weighted images, b-values and ADC maps is given.
As stated in section 3.2.1, MR HIFU treatment uses thermal coagulation to treat the uterine fibroid.
Due to this thermal coagulation tissue changes occur, including protein denaturation, rupture of the
cell membrane, vasoconstriction and cauterization of the blood vessels. These tissue changes will
lead to a change in the ADC value compared to the uterine fibroid tissue before treatment. Therefore
it can potentially be used as a measure to visualize treatment effects without the use of a contrast
agent. As shown in the article of Ikink et al., ADC maps contain information about the diffusion as
well as the perfusion in the uterine fibroid8. By varying the b-values, Ikink et al. showed a strong post-
treatment correlation between the ADC map with low b-values and the non-perfused volume (NPV).
This finding implies that low b-values are associated with the perfusion, i.e. the micro-circulation of
the fibroid.
13
Figure 5: Diffusion Weighted Images with different weightings of the diffusion. B-values are expressed in s/mm2. The
higher the b-value (i.e. the diffusion weighting), the greater the signal loss.
Normally, a short echo time (TE) is recommended to reduce the influence of the T2 relaxation time
and to keep the signal-to-noise ratio high. However, using a long TE (200 ms), it has been shown that
malignant tumours can be distinguished from benign tumours. Both malignant and benign tumours
can show a high signal intensity on DWI. A study by Tamura et al.15 shows that malignant tumours
can be differentiated from benign by using long-TE DWI. The possibility to emphasize less-restricted
water diffusion by using long-TE DWI, brings possibilities in further characterization of uterine fibroid
tissue. Therefore, two different DWI sequences with different echo times are part of this study.
3.4.2.2 T2 mapping
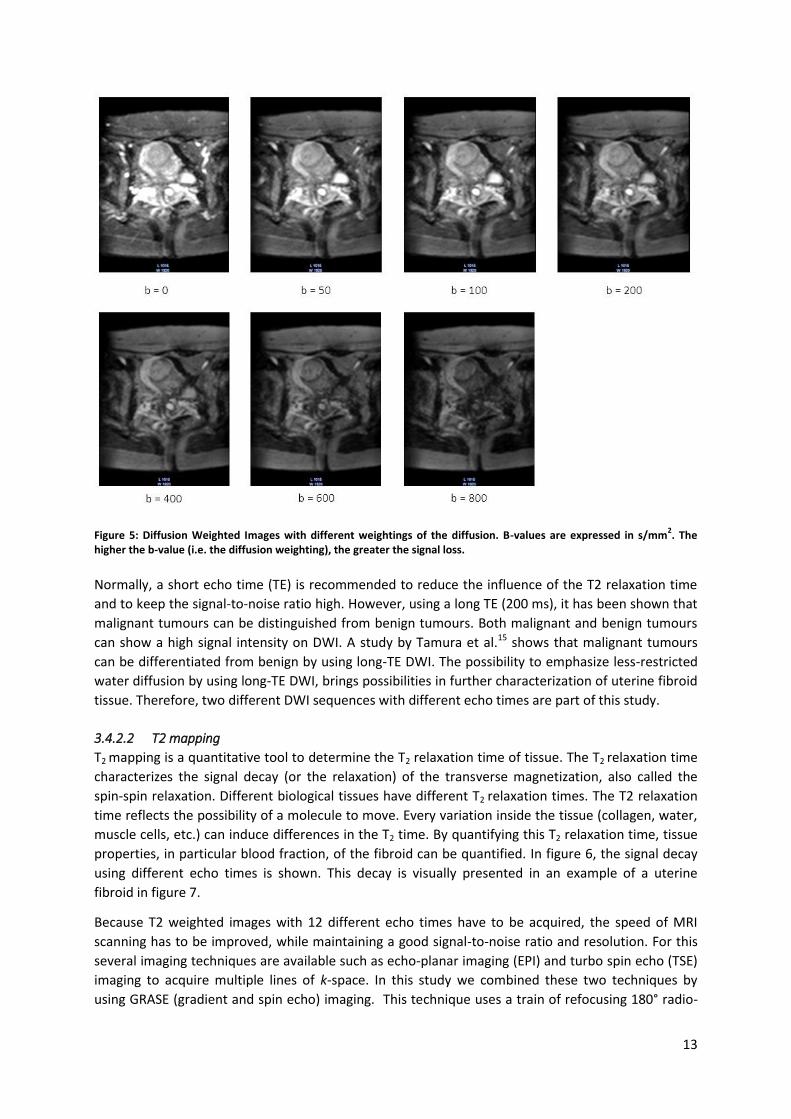
T2 mapping is a quantitative tool to determine the T2 relaxation time of tissue. The T2 relaxation time
characterizes the signal decay (or the relaxation) of the transverse magnetization, also called the
spin-spin relaxation. Different biological tissues have different T2 relaxation times. The T2 relaxation
time reflects the possibility of a molecule to move. Every variation inside the tissue (collagen, water,
muscle cells, etc.) can induce differences in the T2 time. By quantifying this T2 relaxation time, tissue
properties, in particular blood fraction, of the fibroid can be quantified. In figure 6, the signal decay
using different echo times is shown. This decay is visually presented in an example of a uterine
fibroid in figure 7.
Because T2 weighted images with 12 different echo times have to be acquired, the speed of MRI
scanning has to be improved, while maintaining a good signal-to-noise ratio and resolution. For this
several imaging techniques are available such as echo-planar imaging (EPI) and turbo spin echo (TSE)
imaging to acquire multiple lines of k-space. In this study we combined these two techniques by
using GRASE (gradient and spin echo) imaging. This technique uses a train of refocusing 180° radio-
14
frequency pulses, as TSE imaging. However, for each spin echo, additional echoes are generated,
namely gradient recalled echoes as in SE-EPI.
The gain in acquisition time as compared to conventional SE is the TSE echo train length times the EPI
factor in single slice imaging. If for example the echo train length is four, the scan time is reduced by
¼. When using GRASE imaging with an additional EPI factor of three, then the scan time is roughly
reduced to (1/4 x 1/3) or 1/12. This makes it possible to acquire T2 weighted images with 12 different
echo times.
Figure 7: Example of a uterine fibroid images with different echo times (20-240 ms). This picture shows that different tissues have different signal decays.
0
200
400
600
800
1000
0 50 100 150 200 250
Sign
al I
nte
nsi
ty
TE [ms]
1
10
100
1000
0 50 100 150 200 250
Sign
al I
nte
nsi
ty
TE [ms]
Figure 6: Example of a measured T2 relaxation time curve in uterine fibroid tissue. Left and right represent the same curve. On the right a logarithmic scale was used to emphasize the exponential behavior.
15
4 In depth analysis of biological tissue characteristics of uterine
fibroids using new MRI techniques
This chapter describes the MASS I study, conducted in the Isala Clinics, Zwolle. This is an ongoing
research project and will be continued. Therefor results presented in this chapter are not final results
but give an impression about the findings.
4.1 Introduction and rationale Uterine fibroids are the most common benign gynaecological tumors affecting a high percentage of
women. The life-time prevalence of fibroids lies between 70 to 80%. Symptoms of uterine fibroids
are abnormal uterine bleeding and pelvic discomfort due to the existing mass, leading to a significant
negative effect on the quality of life. Treatment possibilities include drug therapy, hysterectomy,
myomectomy, uterine artery embolization and magnetic resonance guided “High Intensity Focused
Ultrasound” (MR-HIFU). The choice of treatment and rate of success is dependent on the
morphology and tissue characterization of the uterine fibroids2.
From literature it is known that the histopathology of uterine fibroids varies among patients.
Biological characterization of fibroid tissue is useful knowledge in the choice and suitability of
treatment options2,16. Without biopsy it is in current practice impossible to characterize tissue
characteristics before treatment. However, we hypothesize it can be possible to make use of
advanced MRI parameters that can be used as non-invasive biomarkers. This set of new MRI
parameters can be used to visualize and gain knowledge about the biological variation and
characterization of uterine fibroids.
MR-HIFU is a minimally invasive procedure. In this procedure, a tightly focused, high intensity
ultrasound beam is send into the fibroid tissue. The acoustic energy of the ultrasound is converted
into thermal energy at the focal point which leads to thermal coagulation. The areas outside the focal
point are unaffected.
4.1.1 Current patients selection for MR-HIFU treatment Patient selection for MR-HIFU is done at the gynaecology department and based on a screening MRI.
Current imaging-based biological characterizations of uterine fibroids are limited. The signal intensity
on T2-weighted MRI images is the main parameter of characterization. This parameter is described by
the Funaki classification, defined by Funaki et al. in 20077. In the Funaki classification, patients are
stratified in 3 groups based on T2 signal intensity in selection of MR HIFU treatment. Details of the
Funaki classification are listed in appendix 1. This subdivision of uterine fibroids is correlated with
pathohistologic structures, demonstrated by Zhao et al. in 201413.
4.1.2 In depth analysis of uterine fibroid characteristics Novel MRI techniques can potentially provide additional, more specific information about the
biological characterization of uterine fibroids. These sequences have been specifically developed (by
Philips healthcare, Eindhoven) for the use in uterine fibroids.
4.1.2.1 Diffusion weighted imaging
Diffusion weighted MRI for uterine fibroids is used in multiple studies to characterize the fibroid
tissue17,18. With the use of different b-values, perfusion and diffusion of the fibroid can both be
imaged. Diffusion weighted imaging provides a quantitative parameter, called the apparent diffusion
coefficient (ADC). The ADC is an indicator of the movement of water within the tissue and depends
on the cellularity. This allows tissue characterization. This technique is also used in the minimal
16
invasive uterine artery embolization19. With respect to MR HIFU treatments, these parameters are
important in treatment outcome. Jacobs et al.20 found that DWI and ADC mapping are feasible for
identification of ablated tissue after MR-HIFU treatment. Liapi et al. found that DWI and ADC maps
provide functional information at a cellular level in uterine fibroids21. The recent work of Ikink et al.18
also shows DWI can be used to evaluate treatment results. We hypothesize DWI and ADC maps can
also be used before HIFU treatment, as they give functional information about the uterine fibroid
tissue on a cellular level.
4.1.2.2 T2 relaxometry maps
T2 mapping is a new technique for the specific use in uterine fibroids and not previously described
for this application. The Funaki classification7 is also based on T2 relaxation times. T2 mapping
quantifies this parameter, making it more reliable and more widely applicable. The T2 relaxation time
reflects the possibility of a molecule to move. Every variation inside the tissue (collagen, water,
muscle cells, etc.) can induce differences in the T2 time. By quantifying this T2 relaxation time, tissue
properties, in particular blood fraction, of the fibroid can be quantified.
We hypothesize that the above described MRI techniques give useful information about the uterine
fibroid characteristics. These characteristics are important in determining patient suitability for MR-
HIFU treatment, besides the currently used Funaki classification. The Funaki classification alone is a
limited characterization parameter based on the average value of the full fibroid. Further, it classifies
the entire patient population in only 3 groups. Recent clinical insights show that the uterine fibroid
tissue can be very heterogeneous. This heterogeneity is also seen inside the Funaki groups. This gives
grounds for the introduction of new MRI parameters for refinement of the fibroid stratification. To
refine the stratification, more information is needed on tissue level. Therefore, in this study we want
to analyze a completely new MRI protocol for the non-invasive characterization of uterine fibroid
tissue using multi-parametric MRI.
Another future benefit of using novel MRI techniques is to reduce the use of a contrast agent for
assessing treatment results after MR-HIFU treatment. Because the non-perfused-volume (the most
used treatment outcome measure in HIFU treatment) is calculated after injecting a contrast agent it
can only be determined after treatment. In order to be able to assess treatment results during the
HIFU treatment, one of the novel MRI sequences presented in this study could serve as a treatment
outcome parameter. This could be studied in a subsequent treatment study.
17
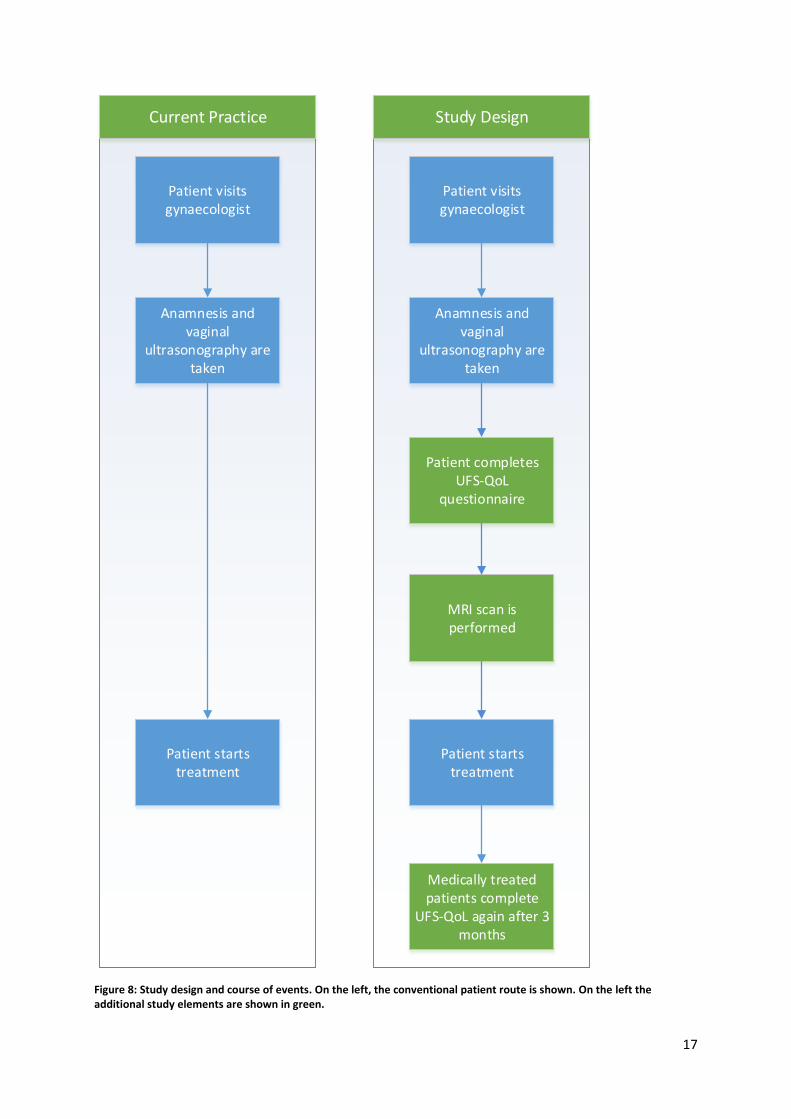
Patient visits gynaecologist
Anamnesis and vaginal
ultrasonography are taken
Patient starts treatment
Patient visits gynaecologist
Anamnesis and vaginal
ultrasonography are taken
Patient starts treatment
MRI scan is performed
Patient completes UFS-QoL
questionnaire
Current Practice Study Design
Medically treated patients complete
UFS-QoL again after 3 months
Figure 8: Study design and course of events. On the left, the conventional patient route is shown. On the left the additional study elements are shown in green.
18
4.2 Materials & Methods
4.2.1 Study Design The study is a single-center, explorative research. Data collection and experiments are performed in
the Isala Hospital Zwolle at the gynaecology and radiology department. This study was approved by
the local ethics committee.
The course of events is visually presented in figure 8. On the left, the course of events in current
practice is shown. The green fields at the right are the additional study events. All new patients
presenting with uterine fibroid related symptoms at the gynaecologist’s office are registered in the
study database. Based as on the in-/exclusion criteria as further described the following section, only
a selective patient group will undergo the screening MRI. Informed consent is obtained before MRI
screening. During the screening MRI, performed at the radiology department, biological tissue
parameters are visualized with a new MRI protocol, further elaborated in section 4.2.3. These
parameters are tested for a correlation to the existing tissue classification method (Funaki
classification) and the clinical findings. Clinical symptoms are examined by means of the uterine
fibroid symptom and health related quality of life questionnaire (UFS-QoL). The treatment of the
patients is not influenced by the additional questionnaire and MRI. The patients will undergo the MRI
scan for scientific reasons. The goal of this study is not to improve patients treatment at this stage.
The main study parameter is the distribution and variation of MRI parameters (ADC map, Ktrans map,
ve, vp and T2 map) and the correlation between the MRI parameters and the Funaki classification and
the clinical UFS-QoL score.
4.2.2 Patient population: inclusion and exclusion criteria In the Isala hospital Zwolle, annually 210 patients are presenting in the Isala with complains that are
attributed to uterine fibroids. Patients with a diagnosed uterine fibroid (based on anamnesis,
physical examination and vaginal ultrasonography) and uterine fibroid related symptoms are
included in the study. To determine whether a patient would be an eligible candidate for MR-HIFU
treatment after screening MRI, in- and exclusion criteria based on the guidelines are maintained. All
in- and exclusion criteria are listed in table 1.
Sample size is determined based on the objective of the study: the distribution and variation in
quantitative MRI parameters. From literature it is known, type 3 uterine fibroids (based on the
Funaki classification) are difficult to treat. Therefore, distribution and variation is especially of added
value in type 3 uterine fibroids. When looking at literature about the incidence of type 3 uterine
fibroids, an average incidence of 20-25% is seen. For a reliable comparison between patients with
type 3 uterine fibroids, an inclusion of 80 patients is desirable. In this case, we can include about 20
patients with type 3 uterine fibroids.
4.2.3 Study procedures: MRI protocol MR scans were performed on a clinical 1.5-T MRI system (Achieva; Philips Healthcare, Best, the
Netherlands). The patients are scanned in a supine position. The MRI protocol consists of different
sequences as shown in table 2. The first 2 sequences are part of the conventional MRI protocol for
patients undergoing pelvic MRI with a uterine fibroid indication. T2-weighted images are used to
identify anatomical structures within the pelvis in the sagittal and transversal orientations. TR was
6407ms, TE 125ms, matrix size 256x256, slice thickness 3mm and slice gap 0.3mm. In order to
visualize hemodynamic characteristics and to assess the viability of the uterine fibroid, a gadolinium-
based contrast agent was injected. T1 images were obtained in the transversal orientation before
administration of gadolinium with TR of 663ms, TE 14ms, matrix size 256x256, slice thickness 3.5mm
and a slice gap of 0.3mm. T1 contrast enhanced images were obtained in the sagittal and transversal
19
orientations. All images in the transversal plane are angulated coronal to the uterine fundus. The
additional multiparametric protocol consists of T2 mapping and diffusion-weighted MRI, all
elaborated below. All multiparametric imaging sequences were acquired in the transversal
orientations and before the administration of contrast agent.
Table 1: In- and exclusion criteria
Inclusion Criteria Exclusion Criteria
Gyn
aeco
logi
st
In-/
excl
usi
on
Diagnosed, symptomatic uterine fibroids Post-menopausal patients Aged 18-55 Pregnancy Pre-menopausal patients Calcifications in uterine fibroid Severe abdominal obesity Uterine artery embolization in medical
history MRI contra-indications
MR
I
In-/
exc
lusi
on
Funaki Type 1 and 2 uterine fibroids Funaki type 3 uterine fibroids Diameter 1-10 cm of dominant fibroid Calcified or pedunculated fibroids Close to the sciatic nerve or sacrum Interposition of bowel or ovary Diameter <1 or >10 cm in diameter Distance skin – midpoint of fibroid > 12 cm
4.2.3.1 MRI assessment and acquisition of T2 mapping
For the calculation of the T2 map, T2-weighted images with different echo times are acquired by using
the GRASE sequence, combining the TSE and EPI methods. TR was 2433ms, matrix size 128x128, slice
thickness 7.0mm without a slice gap. We used 12 different echo times ranging from 20 to 240ms. In
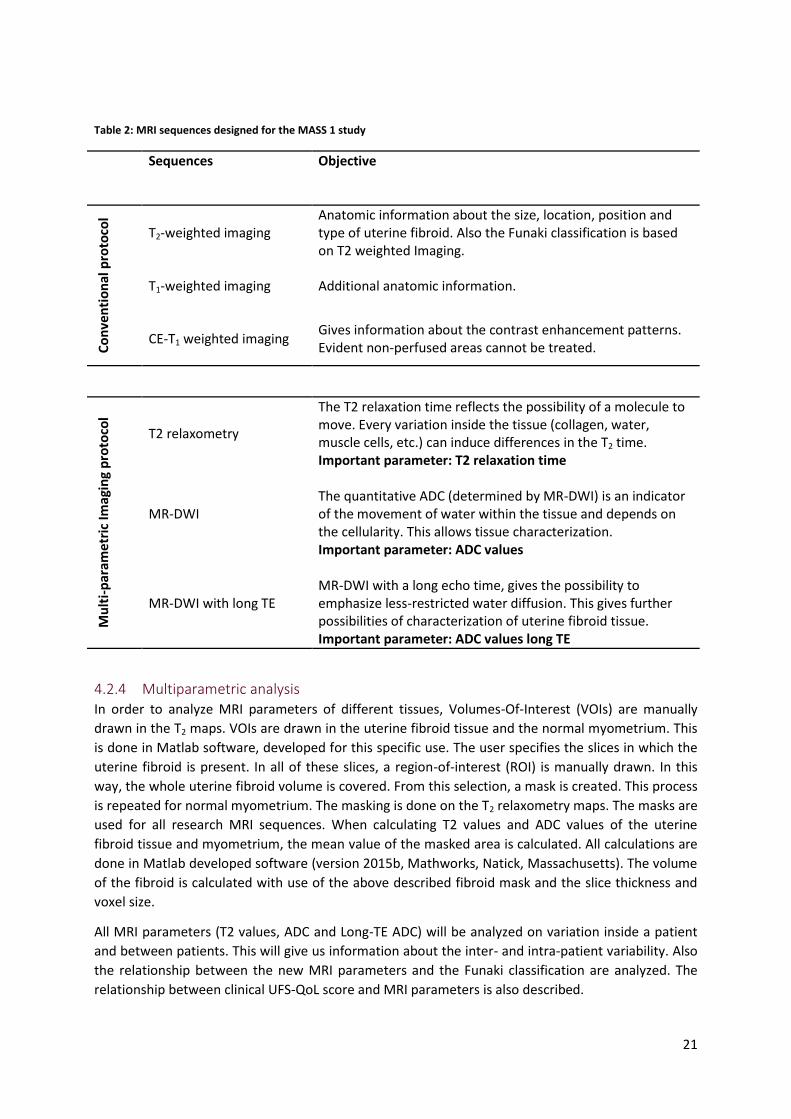
order to validate this MRI protocol for measuring true T2 relaxation times, a calibrated phantom was
used. Measurements using the calculated T2 map were compared to the calibration phantom values.
The results of this phantom test are shown in a scatterplot in figure 10. Linear regression analysis
shows a R2 of > 0.99. The Intra Class Correlation Coefficient (ICC) between the calibration phantom
and the GRASE T2 relaxometry measurements was > 0.99. This shows an excellent agreement
between both values. Therefore, we concluded the GRASE sequence can be used for measuring true
T2 values with proper accuracy.
4.2.3.2 MRI assessment and acquisition of Diffusion Weighted MRI
The diffusion weighted images (DWI) are performed in the transversal plane and angulated as
described above. A spin-echo sequence was used to acquire 7 different b-values: 0, 50, 100, 200, 400,
600 and 800 s/mm2. TR was 2673ms, TE 64ms, matrix size 128x128, slice thickness 7.0mm without a
slice gap. For the long-TE DWI, a spin-echo sequence with 4 different b-values (0, 50, 100, 200
s/mm2) were acquired. For long-TE DWI, TR was 6715ms, TE 140ms, matrix size 128x128, slice
thickness 7.0mm without a slice gap.
ADC maps are created in IntelliSpace Portal (Philips). Briefly explained, an ADC map is calculated by
plotting signal intensities of a specific pixel against the different b-values. The exponential decay
indicates the apparent diffusion coefficient (ADC). An example of such an exponential signal decay is
presented in figure 9. The ADC value is calculated by the following formula:
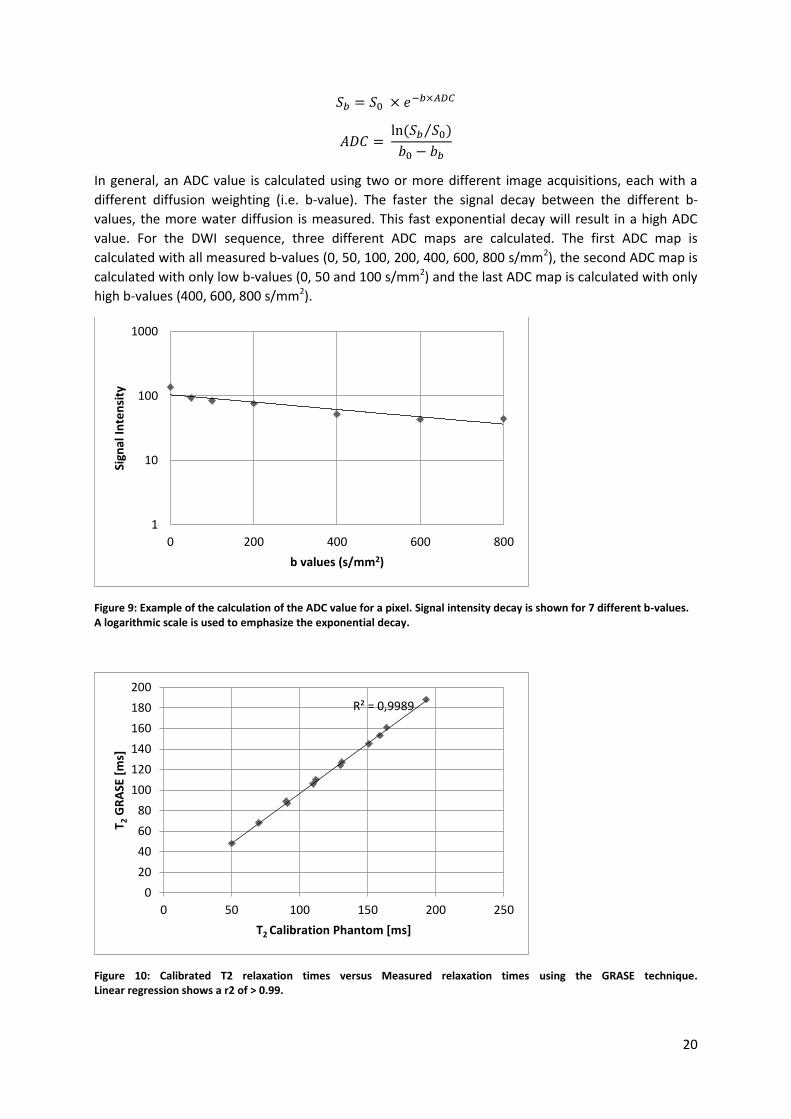
20
𝑆𝑏 = 𝑆0 × 𝑒−𝑏×𝐴𝐷𝐶
𝐴𝐷𝐶 = ln (𝑆𝑏 𝑆0⁄ )
𝑏0 − 𝑏𝑏
In general, an ADC value is calculated using two or more different image acquisitions, each with a
different diffusion weighting (i.e. b-value). The faster the signal decay between the different b-
values, the more water diffusion is measured. This fast exponential decay will result in a high ADC
value. For the DWI sequence, three different ADC maps are calculated. The first ADC map is
calculated with all measured b-values (0, 50, 100, 200, 400, 600, 800 s/mm2), the second ADC map is
calculated with only low b-values (0, 50 and 100 s/mm2) and the last ADC map is calculated with only
high b-values (400, 600, 800 s/mm2).
Figure 9: Example of the calculation of the ADC value for a pixel. Signal intensity decay is shown for 7 different b-values. A logarithmic scale is used to emphasize the exponential decay.
Figure 10: Calibrated T2 relaxation times versus Measured relaxation times using the GRASE technique. Linear regression shows a r2 of > 0.99.
1
10
100
1000
0 200 400 600 800
Sign
al I
nte
nsi
ty
b values (s/mm2)
R² = 0,9989
0
20
40
60
80
100
120
140
160
180
200
0 50 100 150 200 250
T 2 G
RA
SE [
ms]
T2 Calibration Phantom [ms]
21
Table 2: MRI sequences designed for the MASS 1 study
Sequences Objective
Co
nve
nti
on
al p
roto
col
T2-weighted imaging Anatomic information about the size, location, position and type of uterine fibroid. Also the Funaki classification is based on T2 weighted Imaging.
T1-weighted imaging Additional anatomic information.
CE-T1 weighted imaging Gives information about the contrast enhancement patterns. Evident non-perfused areas cannot be treated.
Mu
lti-
par
ame
tric
Imag
ing
pro
toco
l
T2 relaxometry
The T2 relaxation time reflects the possibility of a molecule to move. Every variation inside the tissue (collagen, water, muscle cells, etc.) can induce differences in the T2 time. Important parameter: T2 relaxation time
MR-DWI
The quantitative ADC (determined by MR-DWI) is an indicator of the movement of water within the tissue and depends on the cellularity. This allows tissue characterization. Important parameter: ADC values
MR-DWI with long TE
MR-DWI with a long echo time, gives the possibility to emphasize less-restricted water diffusion. This gives further possibilities of characterization of uterine fibroid tissue. Important parameter: ADC values long TE
4.2.4 Multiparametric analysis In order to analyze MRI parameters of different tissues, Volumes-Of-Interest (VOIs) are manually
drawn in the T2 maps. VOIs are drawn in the uterine fibroid tissue and the normal myometrium. This
is done in Matlab software, developed for this specific use. The user specifies the slices in which the
uterine fibroid is present. In all of these slices, a region-of-interest (ROI) is manually drawn. In this
way, the whole uterine fibroid volume is covered. From this selection, a mask is created. This process
is repeated for normal myometrium. The masking is done on the T2 relaxometry maps. The masks are
used for all research MRI sequences. When calculating T2 values and ADC values of the uterine
fibroid tissue and myometrium, the mean value of the masked area is calculated. All calculations are
done in Matlab developed software (version 2015b, Mathworks, Natick, Massachusetts). The volume
of the fibroid is calculated with use of the above described fibroid mask and the slice thickness and
voxel size.
All MRI parameters (T2 values, ADC and Long-TE ADC) will be analyzed on variation inside a patient
and between patients. This will give us information about the inter- and intra-patient variability. Also
the relationship between the new MRI parameters and the Funaki classification are analyzed. The
relationship between clinical UFS-QoL score and MRI parameters is also described.
22
4.2.5 Statistical analysis All MRI parameters are statistically described and tested for normality. To describe variation of the
MRI parameters, the coefficient of variation is used for all parameters. Because all MRI parameters
have different units, a standardized measure of dispersion is used to compare the variation of each
parameter.
To describe the relationship between the MRI parameters and the Funaki classification, scatterplots
and boxplots are made for each MRI parameter (ADC maps and T2 map). To statistical test the
relationship between each MRI parameter and the Funaki classification, the Spearman’s rank
correlation coefficient is used. This uni-variate analysis is performed for each MRI parameter in
relation to the Funaki classification.
To describe the relationship between the MRI parameters and the baseline UFS-QoL, scatterplots
and boxplots are made for each MRI parameter and the Funaki classification. To statistical test which
parameter is the best predictor for clinical symptoms, regression analysis on the UFS-QoL will be
performed. If the UFS-QoL variable has a normal distribution, linear regression is used for the
correlation between the UFS-QoL score and the MRI parameter. If the distribution of the variable is
skewed, a logistic transformation is performed. When the distribution is normalized after this
transformation, linear regression is used. When the variable is still skewed after the transformation,
the UFS-QoL is dichotomized, based on the median. After dichotomization, logistic regression is used
for the association between the UFS-QoL score and the MRI parameters.
4.3 Results During the study period, 12 patients were included in the study. Two patients did not undergo MRI
examination because they withdrew themselves from the study. In total, 10 patients successfully
underwent a screening MRI. Mean age of the patients was 41.8 ± 6.1 in a range of 30-49. The
characteristics of the patients and fibroids are summarized in table 3.
Table 3: Patient Characteristics
Age 41.8 ± 6.1 (30 - 49)
Weight (kg) 78.2 ± 11.2 (61 – 120)
Patient Symptoms Heavy menstrual bleeding 80%
Bowel pressure 20%
Pain during menstruation 50%
Pain during intercourse 10%
Other 60%
Symptom Severity Score 37.1 ± 20.3 (6.2 – 65.6)
All MRIs are assessed and evaluated by an experienced radiologist. Based on the screening MRI, basic
fibroid characteristics are determined. Five patients had single fibroids, four of the patients had
multiple fibroids of which 1 patients had more than 15 fibroids. The mean diameter of the uterine
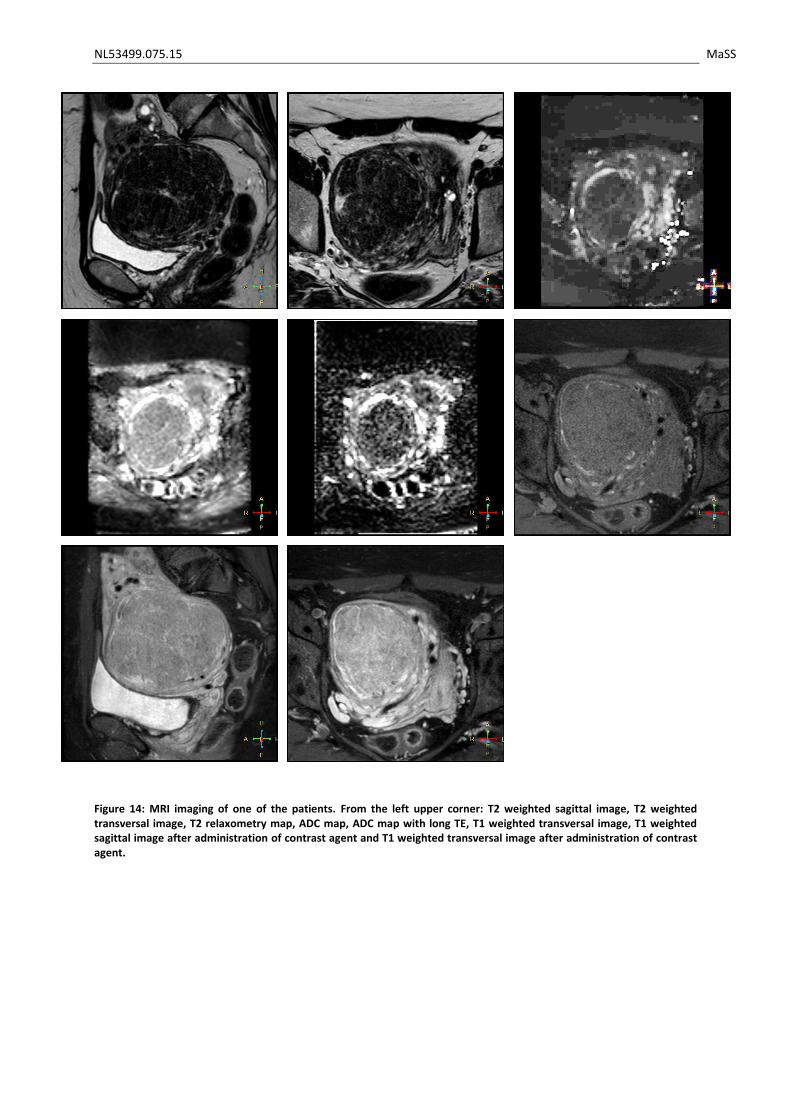
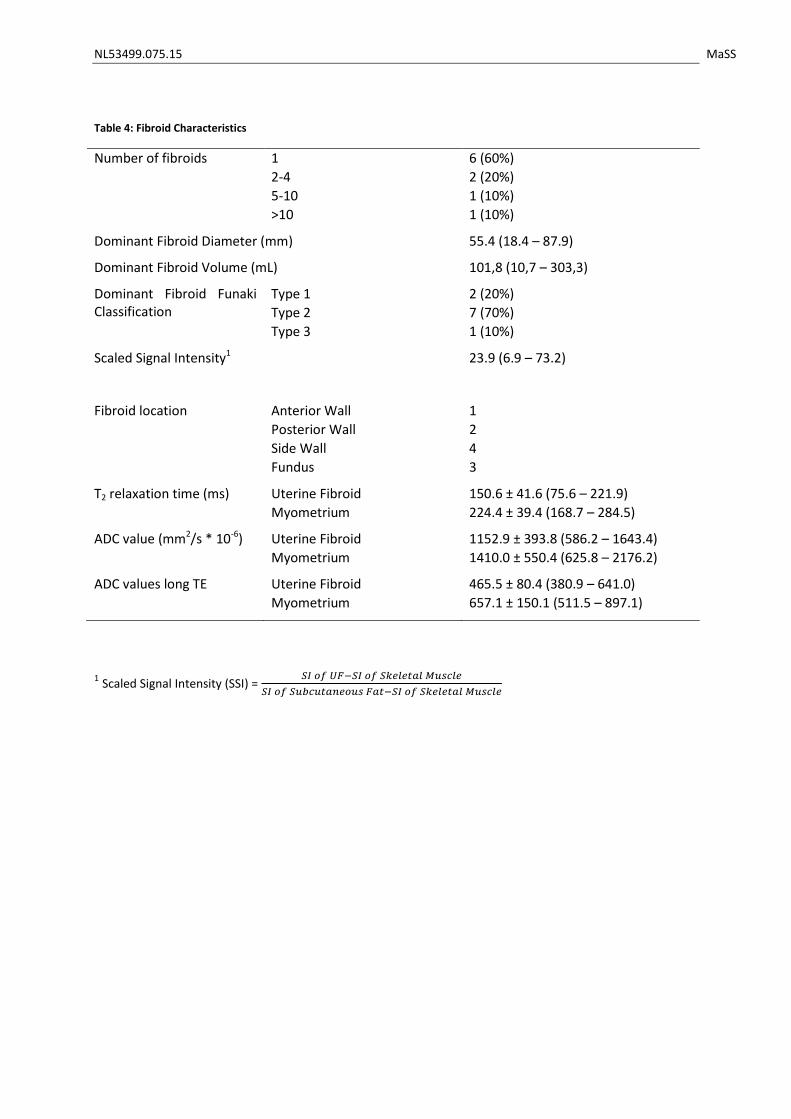
fibroids was 55.4 mm. All fibroid characteristics are summarized in table 4. All MRI sequences of one
patient are shown in figure 9.
23
All patients completed the UFS-QoL questionnaire. In this manuscript, the transformed Symptom
Severity Score (SSS) is used, for which 100 points represents maximal symptom severity. The mean
SSS ± std. sev. was 37.1 ± 20.3 (ranging from 6.2 to 65.6).
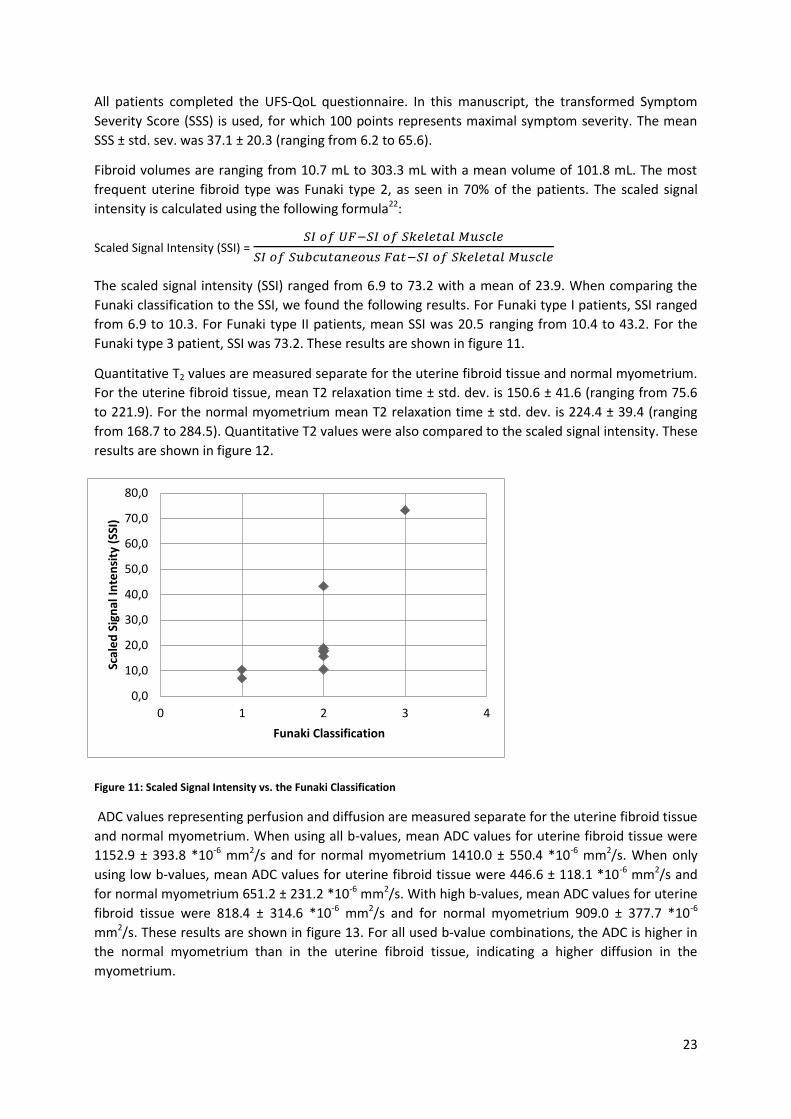
Fibroid volumes are ranging from 10.7 mL to 303.3 mL with a mean volume of 101.8 mL. The most
frequent uterine fibroid type was Funaki type 2, as seen in 70% of the patients. The scaled signal
intensity is calculated using the following formula22:
Scaled Signal Intensity (SSI) = 𝑆𝐼 𝑜𝑓 𝑈𝐹−𝑆𝐼 𝑜𝑓 𝑆𝑘𝑒𝑙𝑒𝑡𝑎𝑙 𝑀𝑢𝑠𝑐𝑙𝑒
𝑆𝐼 𝑜𝑓 𝑆𝑢𝑏𝑐𝑢𝑡𝑎𝑛𝑒𝑜𝑢𝑠 𝐹𝑎𝑡−𝑆𝐼 𝑜𝑓 𝑆𝑘𝑒𝑙𝑒𝑡𝑎𝑙 𝑀𝑢𝑠𝑐𝑙𝑒
The scaled signal intensity (SSI) ranged from 6.9 to 73.2 with a mean of 23.9. When comparing the
Funaki classification to the SSI, we found the following results. For Funaki type I patients, SSI ranged
from 6.9 to 10.3. For Funaki type II patients, mean SSI was 20.5 ranging from 10.4 to 43.2. For the
Funaki type 3 patient, SSI was 73.2. These results are shown in figure 11.
Quantitative T2 values are measured separate for the uterine fibroid tissue and normal myometrium.
For the uterine fibroid tissue, mean T2 relaxation time ± std. dev. is 150.6 ± 41.6 (ranging from 75.6
to 221.9). For the normal myometrium mean T2 relaxation time ± std. dev. is 224.4 ± 39.4 (ranging
from 168.7 to 284.5). Quantitative T2 values were also compared to the scaled signal intensity. These
results are shown in figure 12.
Figure 11: Scaled Signal Intensity vs. the Funaki Classification
ADC values representing perfusion and diffusion are measured separate for the uterine fibroid tissue
and normal myometrium. When using all b-values, mean ADC values for uterine fibroid tissue were
1152.9 ± 393.8 *10-6 mm2/s and for normal myometrium 1410.0 ± 550.4 *10-6 mm2/s. When only
using low b-values, mean ADC values for uterine fibroid tissue were 446.6 ± 118.1 *10-6 mm2/s and
for normal myometrium 651.2 ± 231.2 *10-6 mm2/s. With high b-values, mean ADC values for uterine
fibroid tissue were 818.4 ± 314.6 *10-6 mm2/s and for normal myometrium 909.0 ± 377.7 *10-6
mm2/s. These results are shown in figure 13. For all used b-value combinations, the ADC is higher in
the normal myometrium than in the uterine fibroid tissue, indicating a higher diffusion in the
myometrium.
0,0
10,0
20,0
30,0
40,0
50,0
60,0
70,0
80,0
0 1 2 3 4
Scal
ed
Sig
nal
In
ten
sity
(SS
I)
Funaki Classification
24
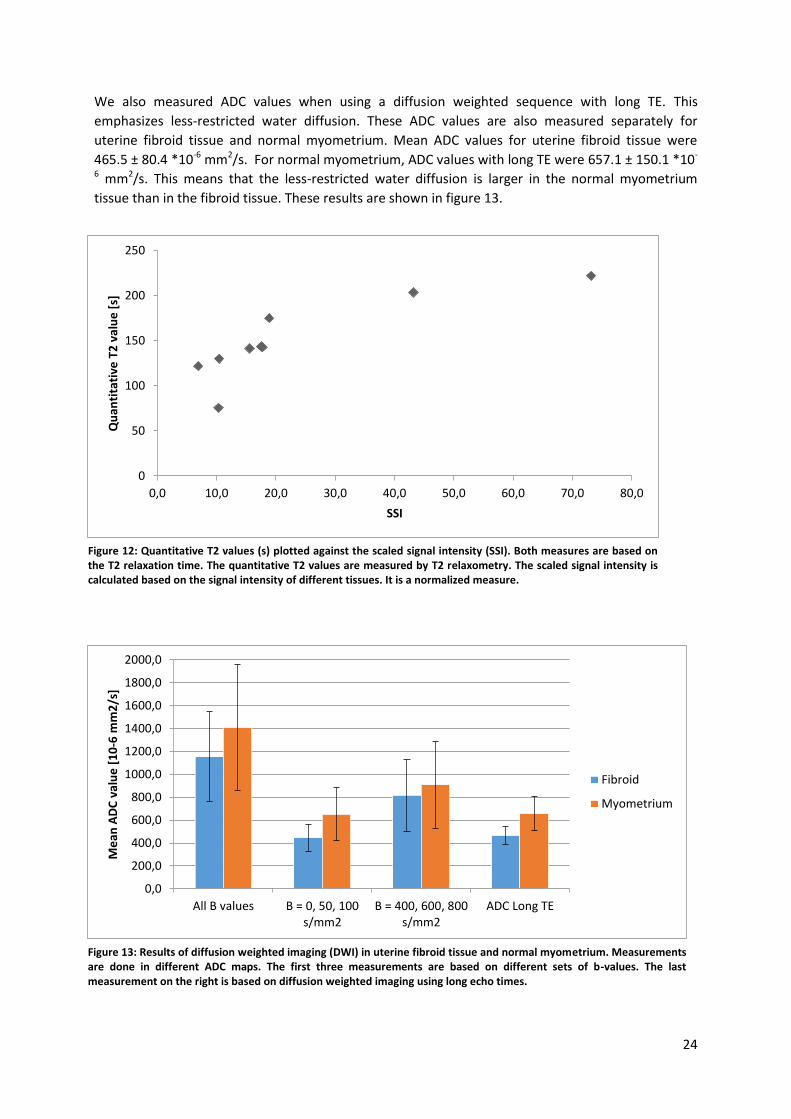
We also measured ADC values when using a diffusion weighted sequence with long TE. This
emphasizes less-restricted water diffusion. These ADC values are also measured separately for
uterine fibroid tissue and normal myometrium. Mean ADC values for uterine fibroid tissue were
465.5 ± 80.4 *10-6 mm2/s. For normal myometrium, ADC values with long TE were 657.1 ± 150.1 *10-
6 mm2/s. This means that the less-restricted water diffusion is larger in the normal myometrium
tissue than in the fibroid tissue. These results are shown in figure 13.
0,0
200,0
400,0
600,0
800,0
1000,0
1200,0
1400,0
1600,0
1800,0
2000,0
All B values B = 0, 50, 100s/mm2
B = 400, 600, 800s/mm2
ADC Long TE
Me
an A
DC
val
ue
[1
0-6
mm
2/s
]
Fibroid
Myometrium
0
50
100
150
200
250
0,0 10,0 20,0 30,0 40,0 50,0 60,0 70,0 80,0
Qu
anti
tati
ve T
2 v
alu
e [
s]
SSI
Figure 12: Quantitative T2 values (s) plotted against the scaled signal intensity (SSI). Both measures are based on the T2 relaxation time. The quantitative T2 values are measured by T2 relaxometry. The scaled signal intensity is calculated based on the signal intensity of different tissues. It is a normalized measure.
Figure 13: Results of diffusion weighted imaging (DWI) in uterine fibroid tissue and normal myometrium. Measurements are done in different ADC maps. The first three measurements are based on different sets of b-values. The last measurement on the right is based on diffusion weighted imaging using long echo times.
NL53499.075.15 MaSS
Figure 14: MRI imaging of one of the patients. From the left upper corner: T2 weighted sagittal image, T2 weighted transversal image, T2 relaxometry map, ADC map, ADC map with long TE, T1 weighted transversal image, T1 weighted sagittal image after administration of contrast agent and T1 weighted transversal image after administration of contrast agent.
NL53499.075.15 MaSS
Table 4: Fibroid Characteristics
Number of fibroids 1 6 (60%)
2-4 2 (20%)
5-10 1 (10%)
>10 1 (10%)
Dominant Fibroid Diameter (mm) 55.4 (18.4 – 87.9)
Dominant Fibroid Volume (mL) 101,8 (10,7 – 303,3)
Dominant Fibroid Funaki Classification
Type 1 2 (20%)
Type 2 7 (70%)
Type 3 1 (10%)
Scaled Signal Intensity1 23.9 (6.9 – 73.2)
Fibroid location Anterior Wall 1
Posterior Wall 2
Side Wall 4
Fundus 3
T2 relaxation time (ms) Uterine Fibroid 150.6 ± 41.6 (75.6 – 221.9)
Myometrium 224.4 ± 39.4 (168.7 – 284.5)
ADC value (mm2/s * 10-6) Uterine Fibroid 1152.9 ± 393.8 (586.2 – 1643.4)
Myometrium 1410.0 ± 550.4 (625.8 – 2176.2)
ADC values long TE Uterine Fibroid 465.5 ± 80.4 (380.9 – 641.0)
Myometrium 657.1 ± 150.1 (511.5 – 897.1)
1 Scaled Signal Intensity (SSI) =
𝑆𝐼 𝑜𝑓 𝑈𝐹−𝑆𝐼 𝑜𝑓 𝑆𝑘𝑒𝑙𝑒𝑡𝑎𝑙 𝑀𝑢𝑠𝑐𝑙𝑒
𝑆𝐼 𝑜𝑓 𝑆𝑢𝑏𝑐𝑢𝑡𝑎𝑛𝑒𝑜𝑢𝑠 𝐹𝑎𝑡−𝑆𝐼 𝑜𝑓 𝑆𝑘𝑒𝑙𝑒𝑡𝑎𝑙 𝑀𝑢𝑠𝑐𝑙𝑒
NL53499.075.15 MaSS
Figure 15: Scatterplots visualizing the relationship between the different MRI parameters and the Funaki Classification
0
200
400
600
800
1000
1200
1400
1600
1800
0 1 2 3 4
AD
C (
all b
-val
ue
s) [
mm
2 /s]
Funaki Classificatie
0
200
400
600
800
1000
1200
1400
1600
1800
0 1 2 3 4
AD
C (
b =
0, 5
0, 1
00
) [m
m2 /
s]
Funaki Classificatie
0
200
400
600
800
1000
1200
1400
1600
1800
0 1 2 3 4
AD
C (
b =
40
0, 6
00
, 80
0)
[mm
2/s
]
Funaki Classificatie
0
200
400
600
800
1000
1200
1400
1600
1800
0 1 2 3 4
AD
C L
on
g TE
[m
m2/s
]
Funaki Classificatie
0
50
100
150
200
250
0 1 2 3 4
Qu
anti
tati
ve T
2 v
alu
e [
s]
Funaki Classificatie
NL53499.075.15 MaSS
Figure 16: Scatterplots visualizing the relationship between the different MRI parameters and the UFS-QoL score
0
1
2
3
4
0 10 20 30 40
Fun
aki C
lass
ific
tio
n
UFS-QoL Baseline Score
0
200
400
600
800
1000
1200
1400
1600
1800
0 10 20 30 40
AD
C (
all b
-val
ue
s) [
mm
2 /s]
UFS-QoL Baseline Score
0
100
200
300
400
500
600
700
0 10 20 30 40
AD
C (
b =
0, 5
0, 1
00
) [m
m2/s
]
UFS-QoL Baseline Score
0
200
400
600
800
1000
1200
0 10 20 30 40
AD
C (
b =
40
0, 6
00
, 80
0)
[mm
2/s
]
UFS-QoL Baseline Score
0
100
200
300
400
500
600
700
0 10 20 30 40
AD
C L
on
g TE
[m
m2 /
s]
UFS-QoL Baseline Score
0
50
100
150
200
250
0 10 20 30 40
Qu
anti
tati
ve T
2 v
alu
e [
s]
UFS-QoL Baseline Score
NL53499.075.15 MaSS
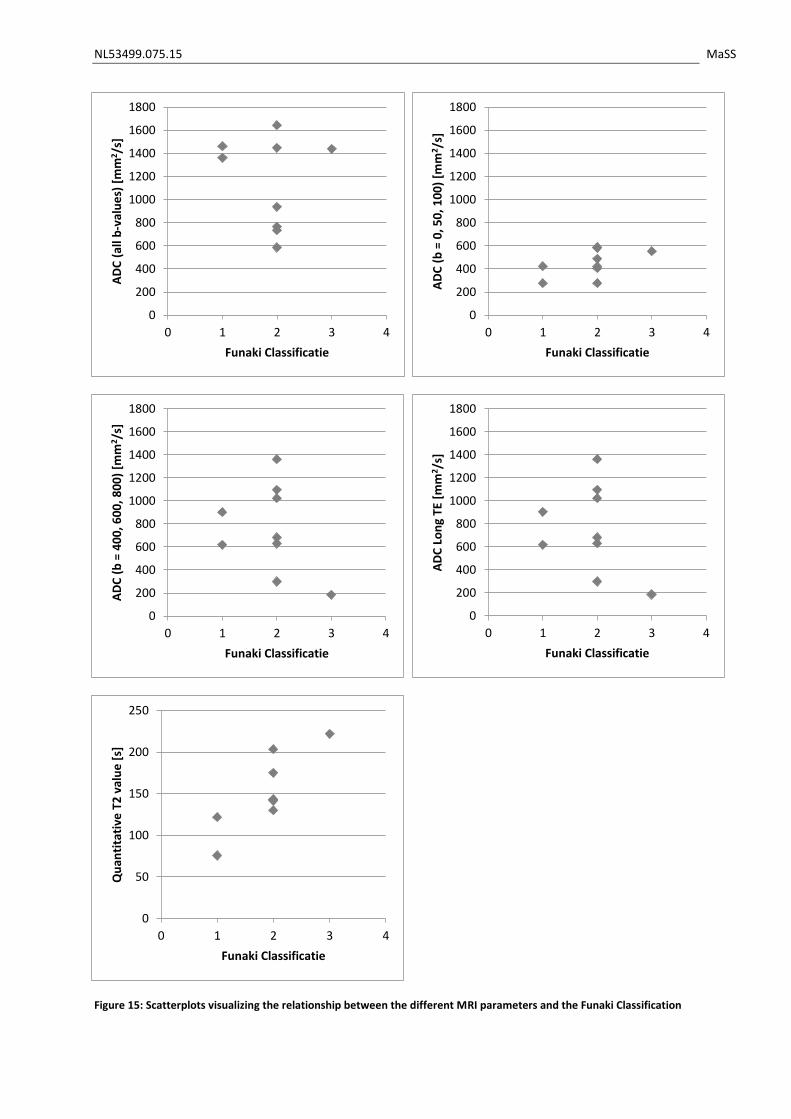
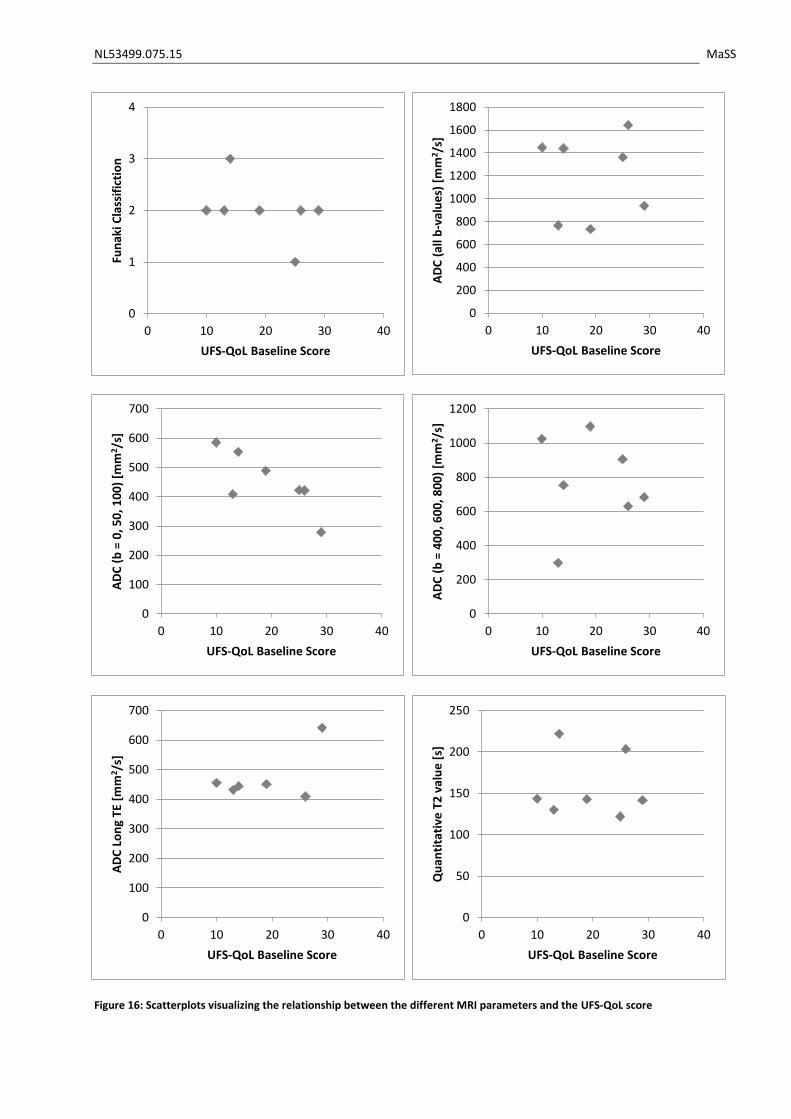
The relationship between the different MRI parameters (multiple ADC values and quantitative T2
values) and the Funaki classification, a scatterplot for each of the parameters is made. Those can be
found in figure 15. On the next page, in figure 16, scatterplots are shown visualizing the relationship
between the MRI parameters and the baseline UFS-QoL score.
To look at the variation between uterine fibroids for the different MRI parameters, the coefficient of
variation is calculated for each parameter measured in the fibroid tissue. For T2 mapping, the
coefficient of variation is 29%. The different ADC measurements gave the following coefficients: for
all b-values it was 34%, for low b-values (0, 50, 100 s/mm2) 26%, for high b-values (400, 600, 800
s/mm2) and for ADC measurements with long TE 17%. We are looking for a parameter which can
distinguish uterine fibroid tissue. Therefore, we need a parameter with a high coefficient of
variations. However, based on these results of 10 patients, we cannot yet draw conclusions out of
these results.
4.4 Discussion The results of this study demonstrate a wide variety in uterine fibroid characteristics among patients,
based on the wide range of new MRI parameters. Based on the Funaki classification7, we included
patients from all classification groups. Also, fibroid volumes and baseline symptom severity scores
were variable among patients. All these findings prove the hypothesis that uterine fibroid tissue is
variable among patients.
Funaki classification and Scaled Signal Intensity
The Funaki classification is a simple characterization tool, dividing the whole patient population in
three groups. Funaki group 1 has a low signal intensity, whereas Funaki classification 3 shows a high
T2 signal intensity caused by a high vascularity. This high vascularity is disadvantageous for MR-HIFU
treatment, because of the rapid drainage of heat. Various studies have shown a correlation between
T2 signal intensity and MRI-HIFU treatment outcome 7,10. The Funaki classification is based on T2
values of the fibroid compared to skeletal muscle and abdominal fat. Therefore, we compared the
Funaki classification to the scaled signal intensity (SSI). The SSI is also based on T2 relaxation times,
but in contrast to the Funaki classification it is a continuous variable, allowing a more precise
inclusion tool. The scatterplot comparing Funaki to SSI shows group formation: the higher the Funaki
classification, the higher the SSI. We found a mean SSI of 23.9 ± 21.3. This value cannot be compared
to the findings in literature, because we included Funaki classification 3 patients, which are generally
excluded from other studies. Park et. al. found that fibroids with a SSI value of 16.0 or less can be
expected to have optimal results22. When using this criterion in our patient population, it would
result in an inclusion of 4 people based on SSI value. When using the Funaki classification, 8 patients
would have been included. This indicates a possible over-inclusion of patients.
Quantitative T2 values
We found a mean T2 value in the uterine fibroid tissue of 150.6 ms, which is considerably lower than
the T2 value in normal myometrium (224.4 ms). This suggests uterine fibroid tissue has a lower
vascularity than normal myometrium i.e. the uterine fibroid tissue is less hydrated than normal
myometrium. Sipola et al. did a preinterventional quantitative MRI study for the embolization
treatment of uterine fibroids23. They found a mean T2 time before embolization treatment in the
fibroid of 220 ms in 48 patients. When comparing the quantitative T2 value with the Scaled Signal
Intensity, we see a linear trend between the two measurements. This is in line with our expectations,
since both measurements are based on T2 relaxation times.
NL53499.075.15 MaSS
Diffusion Weighted Imaging
The results of the ADC measurements show that there is a difference in ADC values between the
normal myometrium and the uterine fibroid tissue. In all different ADC maps, the mean ADC value of
the myometrium is higher than the ADC value of the uterine fibroid tissue. This indicates less
diffusion in the uterine fibroid tissue compared to the myometrium. This finding corresponds to the
finding of the quantitative T2 values, mentioned above.
Furthermore, when looking at the results, we see a strong influence of the choice of b-values on the
mean ADC. This finding suggests that the signal decay displays non-mono-exponential behavior. This
conclusion is also seen in the work of Ikink et al.18. Therefor it can be stated that DWI in uterine
fibroids reflects the effects of both diffusion and perfusion18. When only using low b-values, rapid
incoherent motion of water molecules is accentuated. This could be the arterial vascular
component18,24. Blood flow is an important parameter of treatment effect prediction and therefor is
importance in screening MRI. The principle of MR-HIFU is to send acoustic energy into uterine fibroid
tissue, which is converted into thermal energy. If the uterine fibroid tissue is strongly perfused with a
high blood flow, the thermal energy is rapidly drained. For this reason, fibroids with a low perfusion
give better treatment results. In addition to the treatment prediction, when treating the uterine
fibroid tissue, this parameter is useful in determining treatment effects without the use of a contrast
agent. This is also done in the study of Ikink et al18. They suggest that the destruction of vessels and
therefore change in perfusion during MR-HIFU treatment can be best emphasized with ADC maps
using only low b-values (0, 200 s/mm2). A big advantage of this technique is that it can be used during
treatment to visualize interim treatment effects. Looking at the coefficients of variation, ADC maps
using all b-values (0, 50, 100, 200, 400, 600, 800 s/mm2) gave the highest variation suggesting that
these ADC maps can distinguish uterine fibroid types best.
Multiple studies earlier demonstrated the use of diffusion MRI in treatment monitoring of MR-HIFU
treatments. Jacobs et al.25 found a decrease in ADC value after treatment. Pilatou et al. 26 also
investigated DWI after MR-HIFU treatment. They found that when using DWI for determining NPV,
an underestimation was made. Also, the change in ADC values was unpredictable, as in some
patients the value increased (19/45) and in others decreased (26/45). This could be due to the effect
that when using both low (0 – 200 s/mm2) and high b-values (400 – 800 s/mm2), two effects are
measured namely perfusion and diffusion. By creating ADC maps with only low b-values and only
high-values, the effects of these different processes can be split. A technique to achieve this, would
be IVIM (intravoxel incoherent motion) imaging. In an IVIM analysis, a bi-exponential function is used
to describe the DWI data instead of a mono-exponential fit. In this way, both diffusion and perfusion
are taken into account.
Above described studies use diffusion weighted imaging in measuring treatment effect. However, by
completing and expanding this study with MR-HIFU treatments, we want to prove that DWI
techniques can also be used in accurate patient selection. Especially ADC maps calculated from low
b-values (0 – 200 s/mm2) are interesting because they visualize the tissue perfusion.
In this research, we compare different MRI techniques in the same patient population. To our
knowledge, this is the only study comparing T1 and T2 MRI sequences with different DWI techniques
and T2 relaxometry. The aim of this study is to include 80 patients. Compared to other MRI studies
about quantitative measurements of the fibroid tissue, this is a large number. This advantage allows
us to map the whole, heterogeneous patient population suffering from uterine fibroids in a high
volume, non-academic setting. Also the developed MRI protocol and the in Matlab developed
software is tested in an extensive patient population.
NL53499.075.15 MaSS
There are some limitations to this study. At time of writing, we only included 10 patients in the study.
The preliminary results therefor are difficult to interpret, as there can be no statistical evidence
given. Technical weaknesses to this study include the possible artifacts in the MRI images because of
physiologic motion. These motions can be due to respiratory motion or bowel movement. Also, we
saw in some patients that bladder filling significantly increased during the MRI scan. For the
evaluation of the MRI scans, we only placed the volume-of-interest once. The actual volume of
interest however can change during the different sequences. Because we haven’t performed a scan-
and-resect study, we have no correlation of the non-invasive MRI-based parameters with the
histopathology.
It is important to further include patients up to the desirable sample size of 80 patients. In the small
patient population of 10 patients included in this study, we found coefficients of variation for the
different parameters. It is important that these numbers are based on a larger, and therefore more
representative patient population. We then can map the whole patient population and visualize the
difference in uterine fibroids tissues among patients. Also, we get an evidence-based assessment of
patient eligibility for MR-HIFU treatment in the Isala. More awareness will be created in the
treatment of uterine fibroids, as in which MR-HIFU treatment will take in a potential minimal-
invasive treatment choice.
The next step in this study is to treat patients with MR-HIFU and track the tissue changes during and
after treatment with the MRI protocol developed in this study. This subsequent study is currently set
up in the Isala. The research protocol can be found in chapter 5. In the ideal situation, an MRI
screening is made with the extensive protocol, the patient will be treated with MR-HIFU after which
the extensive protocol is repeated and after that the fibroid is resected to correlate with
histopathologic characteristics.
4.5 Conclusion
In conclusion, we developed and clinically implemented, by means of a METC approved research
protocol, a MRI protocol for patients suffering from uterine fibroids. This protocol uses non-invasive
biomarkers to characterize the uterine fibroid tissue. The different functional imaging parameters
show a difference between normal myometrium tissue and uterine fibroid tissue. The functional
parameters also show a difference between patients. Quantitative T2 mapping shows a visual
correlation with the currently used Funaki classification. When using the scaled signal intensity,
which can be compared to the Funaki classification, a more accurate cut-off value could be identified.
By including more patients in this study, the whole range of heterogeneous uterine fibroid tissue can
be imaged, described and analyzed.
NL53499.075.15 MaSS
5 Treatment of Uterine Fibroids with Magnetic Resonance guided
High Intensity Focused Ultrasound: the search for revealing Imaging
Parameters
Part of the graduation assignment was designing a study protocol for the subsequent study in which
patients will be treated with MR-HIFU. This study protocol is submitted at the local ethics committee.
5.1 Introduction Uterine fibroids are the most common benign gynaecological tumors affecting a high percentage of
women. Symptoms of uterine fibroids are abnormal uterine bleeding and pelvic discomfort due to
the existing mass, leading to a significant negative effect on the quality of life. Treatment possibilities
include drug therapy, hysterectomy, myomectomy, uterine artery embolization and recently
magnetic resonance guided “High Intensity Focused Ultrasound” (MR-HIFU).
Surgical approaches often go along with complications, longer hospital stays and longer recovery
times. The advantages of the minimally invasive MR-HIFU treatment are a lower morbidity, no need
for general anesthesia, no radiation exposure, low probability of bleeding and infection and short
recovery times. Patients return to work approximately 24 hours after treatment9.
Thermal ablation using MR-HIFU allows for a non-invasive treatment of uterine fibroids by selective
tissue heating. The heat generating possibilities of ultrasound are combined with the imaging
capabilities of MRI. The MRI facilitates in treatment planning, thermometry for real-time
temperature feedback during the treatment and for evaluation of treatment outcome. The energy of
the focused ultrasound causes heating of the tissue on the focal spot to locally induce coagulative
necrosis, while the surrounding tissue remains unaffected.
Result assessment of the MR-HIFU treatment is mostly done by means of two important outcome
parameters: NPV (non-perfused volume) ratio and the UFS-QoL (Uterine Fibroid Symptom and Health
related Quality of Life) improvement after a follow-up of 6-12 months. The NPV is defined as the non-
perfused areas of gadolinium-enhanced images immediately after treatment. The NPV ratio gives the
percentage of treated uterine fibroid tissue.
Many studies are published on the safety, efficacy and quality of life improvements. The systematic
review of Gizzo et al.5 gives a good summary. A NPV ratio of >50% was achieved in 60% of the studies
(16-98%), with a mean UFS-QoL improvement after 12 months of 31 points (15-66).
Among all treated patients, a large variety is seen in volume and symptom reduction, despite of clear
exclusion criteria. There already has been some research on predictors of success of the MR-HIFU
treatment. In these studies, the signal intensity of the fibroid on T2-weighted images was the main
parameter of characterization. T2 signal intensity (SI) of the uterine fibroid is compared with the SI of
skeletal muscle. In 2007, Funaki et al.27 defined a classification system based on the T2 signal intensity
: type 1, a very low-intensity uterine fibroid image comparable to skeletal muscle (hypo-intense);
type 2, an image intensity lower than that of the myometrium and higher than that of skeletal
muscle (iso-intense); and type 3, an image intensity equal or higher than that of myometrium.
Multiple studies show that type 1 and 2 fibroids are associated with a higher chance of treatment
success than type 3 fibroids 10,14,28. However, this classification parameter may be too limited as a
predictor of treatment outcome. Yoon et al. show a case report of a successfully treated hyper-
NL53499.075.15 MaSS
intense type 3 uterine fibroid. This suggests that an additional screening parameter is required to
make a subpopulation of uterine fibroid patients suitable for successful MR-HIFU treatment.
Tissue perfusion is an important parameter for the characterization of uterine fibroids prior to MR-
HIFU treatment because blood flow deprives heat from the fibroid. For this reason, quantification of
the tissue perfusion could serve as a predictor of success in the MR-HIFU treatment. Both diffusion
weighted MRI (MR-DWI) and dynamic contrast enhanced MRI (DCE MRI) can provide information
about fibroid perfusion. The addition of these MRI sequences could give a more extensive and more
complete picture of the fibroid. By introducing this more extensive MRI screening protocol, an inter-
and intra-patient spread in uterine fibroid characteristics could be identified. Knowledge of MRI-
based predictors of success prior to treatment, may contribute to an optimization of patient
selection, treatment planning and treatment outcomes.
5.2 Objectives We are looking for MRI determinants to better determine patient suitability for a successful
treatment of symptomatic uterine fibroids using MR-HIFU. A successful treatment is determined as a
symptom reduction of minimal 10 points on the UFS-QoL questionnaire.
The possible MRI determinants are that can predict treatment outcome are:
ADC value
Quantitative T2 value
Ktrans
Because we want to eliminate the use of an intravenous contrast agent, we are looking for a
functional MRI parameter that is capable of measuring the treated tissue. Therefore, the secondary
objective of this study is to determine the feasibility of ADC mapping, T2 mapping and DCE in
monitoring thermal ablation effects from MR-HIFU in the treatment of uterine fibroids.
5.3 Study Design Data collection and experiments are performed in the Isala Zwolle. Patient inclusion is the
responsibility of the gynaecology department. Imaging and treatment are performed on the
radiology department.
The flow-chart in figure 17 shows the course of events. All new patients presenting with fibroid
related symptoms on the gynaecology department are registered in the database with the aim to
chart the total patient population in the Isala. Based on the in-/exclusion criteria as further described
in section 4.2 and 4.3, only a selective patient group will undergo the screening MRI. Patients
excluded for the screening MRI can start directly with the conventional treatment path on the
gynaecology department.
Patients that meet the inclusion criteria, undergo a screening MRI. After this screening MRI, again in-
and exclusion criteria apply to further determine HIFU treatment eligibility. Patients that meet all
criteria will be informed about the MR HIFU treatment and once given informed consent will undergo
treatment. At baseline (t=0), the UFS-QoL score is measured by means of an online questionnaire.
Follow-up consists of visits at the gynaecologist’s office, and MRI and the UFS-QoL questionnaire is
repeated.
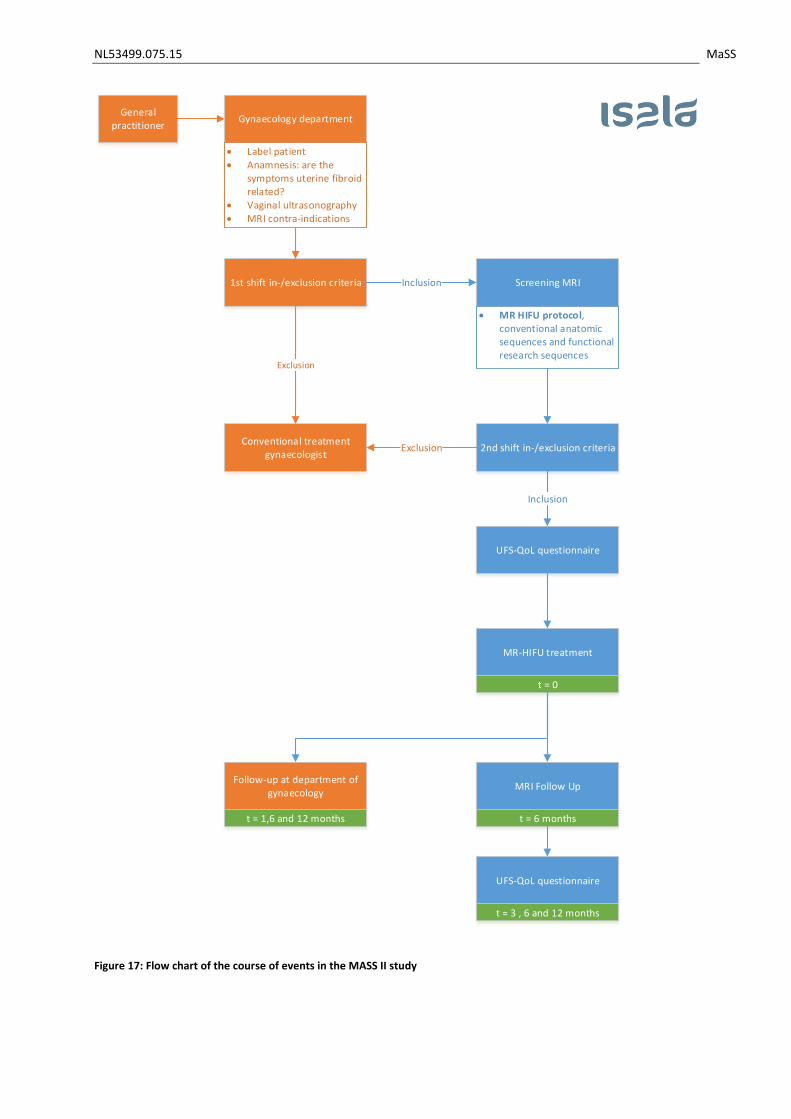
NL53499.075.15 MaSS
General practitioner
Gynaecology department
Label patient Anamnesis: are the
symptoms uterine fibroid related?
Vaginal ultrasonography MRI contra-indications
1st shift in-/exclusion criteria
Conventional treatment gynaecologist
Exclusion
Screening MRIInclusion
MR HIFU protocol, conventional anatomic sequences and functional research sequences
2nd shift in-/exclusion criteriaExclusion
UFS-QoL questionnaire
Inclusion
MR-HIFU treatment
t = 0
Follow-up at department of gynaecology
t = 1,6 and 12 months
MRI Follow Up
t = 6 months
UFS-QoL questionnaire
t = 3 , 6 and 12 months
Figure 17: Flow chart of the course of events in the MASS II study
NL53499.075.15 MaSS
Because the MR-HIFU treatment is a new introduced treatment option in the Isala Hospital, patient
satisfactory surveys are held after treatment. The survey is included in the appendix. It will be
digitally send to the treated patients by Research Manager.
Relation to the MASS I study
In the MASS I study, a screenings MRI is made of patients potentially suitable for MR-HIFU treatment.
This screening MRI is the same as the protocol that will be used in the MASS II study. Therefore,
patients can be included in the MASS I as well as the MASS II study. The MASS I study does not have
to be completed in order to start the MASS II study.
5.4 Study population All new patients presenting with uterine fibroid related symptoms on the department of gynaecology
at Isala are included in the study database. In most cases, these patients will be referred by their
general practitioner for a consult on the gynaecology department. For MRI screening in preparation
of the MR-HIFU treatment, only patients meeting the in-/exclusion criteria based on physical
examination and vaginal ultrasonography are concerned as candidates.
For MRI screening inclusion, the following criteria are applied based on anamnesis, physical
examination and vaginal ultrasonography:
18 – 59 years old
Uterine fibroid related symptoms
Pre- or perimenopausal
To determine whether the patient is eligible for the MR-HIFU treatment after the screening MRI, the
following inclusion criteria are used.
Type 1 & 2 uterine fibroids (based on Funaki classification)
Diameter of 1-10 cm of dominant fibroid
Exclusion criteria for the MRI screening, based on anamnesis, physical examination and vaginal
ultrasonography, are defined as follows:
Post-menopausal
Wish for future fertility
Pregnancy
Severe abdominal obesity or BMI > 40
Uterine artery embolization in medical history
MRI contra-indications
Calcifications in uterine fibroid
To determine whether the patient is eligible for the MR-HIFU treatment after screening MRI, the
following exclusion criteria are used.
Type 3 uterine fibroids (based on Funaki classification)
NL53499.075.15 MaSS
Calcified or pedunculated uterine fibroids
Close to sciatic nerve or sacrum
Interposition of bowel or ovary
Diameter of < 1 cm or > 10 cm
Distance skin – uterine fibroid > 12 cm
5.5 Study Parameters The main study endpoint is the symptom reduction measured with the Uterine Fibroid Symptom and
Health related Quality of Life questionnaire (UFS-QoL) to measure the clinical efficacy of the MR-HIFU
treatment. Since uterine fibroids are benign, symptom reduction is the most important outcome in
the treatment of uterine fibroids. The UFS-QoL is a standardized, worldwide accepted and used
questionnaire to measure the specific symptoms caused by uterine fibroids. Based on literature, a
symptom reduction of 10 points on the UFS-QoL is proven clinically efficient. The number of treated
patients minimally compassing this 10 point reduction are seen as clinical efficient treatments.
Second study parameter is the non-perfused volume (NPV) ratio. Just like the UFS-QoL symptom
reduction score, this parameter assesses the clinical efficacy of the MR-HIFU treatment. The NPV
represent the tissue undergoing successful ablation, measured directly after the total treatment.
5.6 Study Procedures Patients presenting with uterine fibroid related symptoms at the department of gynaecology will
undergo standard consultation, physical examination and vaginal ultrasonography. When the
inclusion criteria (section 4.4) are met, the screening MRI will be scheduled as soon as possible. After
informed consent, patients also are asked to complete the Uterine Fibroid Symptom and Health
related Quality of Life questionnaire (UFS-QoL). The UFS-QoL is a validated, disease-specific
questionnaire.
The screening MRI is performed at the radiology department in the Isala. The MRI protocol consists
of multiple sequences, schematically visualised below. This MRI protocol is currently researched in
the MaSS study (NL52739.075.15, METC number 15.0580). A small overview of the protocol is given
in table 5.
Since the multi-parametric imaging protocol is still being studied, patient’s eligibility is determined on
the conventional MR images. In-/exclusion criteria are given in section 4.2 and 4.3. In table 6, an
explanation of the different multiparametric MRI parameters is given.
Table 5: Overview of the extensive MRI protocol used in the MASS 1 and MASS 2 study.
Conventional Imaging Multi-parametric Imaging
T2-weighted Imaging T2 mapping T1-weighted Imaging MR-DWI CE-T1 weighted Imaging Long-TE MR-DWI
NL53499.075.15 MaSS
Table 6: Multiparametric MRI parameters
MRI Sequence Obtained Parameter
Unit
Diffusion Weighted Imaging
Apparent Diffusion Coefficient (ADC)
mm2/s A measure for the magnitude of diffusion of water in the fibroid tissue.
T2 mapping Quantitative T2 value
s Gives the quantitative T2 value of the fibroid tissue, which reflects the amount of moisture (and therefor blood) in the tissue.
Dynamic Contrast Enhanced Imaging
ktrans min-1 Transfer constant, characterizes the diffusive transport of the contrast agent across the endothelium.
All parameters described in table 6, are measured by drawing a volume-of-interest (VOI) in the
uterine fibroid. The mean value in the VOI is calculated and used for further analyses.
MR-HIFU treatment is performed when the patient is found eligible and after accurate informing the
patient about the treatment and possible complications. The MR-HIFU treatment will be performed
in the MRI scanner. After treatment, patients normally return home the same day of the treatment.
Follow-up is conducted 3, 6 and 12 months after treatment at the gynaecologists office. A follow-up
MRI is performed after 6 months. During this MRI, the same protocol will be used as before the
treatment. Also, the UFS-QoL questionnaire is taken after 3, 6 and 12 months to monitor symptom
relief.
5.7 Statistical Analysis The primary study parameter are the possible MRI determinants, summarized below:
Mean ADC values, measured by diffusion weighted imaging. It is a continuous parameter, measure in mm2/s/
Quantitative T2 values, measured by T2 mapping. It is a continuous parameter measured in seconds.
Mean ktrans, measured by dynamic contrast enhanced imaging. It is a continuous parameter, measured in min-1
Each study parameter described above is a continuous variable. All parameters will be tested for
normality with the Shapiro-Wilk test. If the parameter has a normal distribution, it will be described
with the mean ± standard deviation. If the distribution is skewed, the parameter will be described
with the median and the minimum/maximal values.
For each possible determinant, a regression analysis is performed. This is a logistic regression
analysis, because the endpoint (a clinical relevant successful treatment with a symptom reduction of
minimal 10 points) is dichotome. From this regression analysis, the regression coefficient, p-value
and confidence intervals are calculated. If the p-value is smaller than 0.05, a dependency between
the determinant and a clinical relevant successful treatment is confirmed. This is done for all 3
determinants.
NL53499.075.15 MaSS
If one or more of the determinants is confirmed, a multivariable regression is performed. This could
result in a useful algorithm. However, we are aware that this algorithm has to be cross validated
before use in clinical practice.
The NPV ratio and the three MRI determinants are continuous variables. All parameters will be
tested for normality with the Shapiro-Wilk test. If the parameter has a normal distribution, it will be
described with the mean ± standard deviation. If the distribution is skewed, the parameter will be
described with the median and the minimum/maximal values.
To validate of a MRI parameter can be used in order to measure the NPV, the following steps are
taken. This is done for each of the three MRI parameters.
Scatterplot, in which the MRI parameter is plotted against the golden standard (NPV)
Bland-Altman plot
The ICC is calculated
NL53499.075.15 MaSS
6 Overall Conclusion and Future Perspectives
This study focused on the characterization of uterine fibroid tissue in preparation of Magnetic
Resonance guided High Intensity Focused Ultrasound (MR-HIFU) treatment. Because of the diversity
in fibroid tissue and the varying, but promising, results of MR-HIFU treatment, we want to chart the
heterogeneity of uterine fibroid tissue in an extensive patient population.
In the MASS 1 study we explored several functional MRI parameters as well as the clinically and often
used Funaki classification. In a collaboration with Philips, we set-up an extensive MRI protocol. We
also focused on clinical symptom scores, as these are the most important reason to treat people with
uterine fibroids. The MRI protocol, now performed in 10 patients, shows great variety between
patients in size, location and tissue characteristics of the fibroid. We showed that functional MRI
parameters, such as ADC maps and quantitative T2 mapping, can be measured in uterine fibroids. All
parameters showed a difference between normal myometrium and uterine fibroid tissue. By
including more patients in the study, we can identify different uterine fibroid tissue. We found that
the inclusion of patients and the existence of MR-HIFU in the treatment possibilities is an ongoing
and time consuming process. The design for the MASS 1 study, as presented in this report, will be
continued until 80 patients are included in the study. The MASS I study gives a great stepping stone
to the treatment studies of uterine fibroids with MR-HIFU in the Isala.
In the near future, we start with the MASS 2 study, in which patients will be screened with the
extensive MRI protocol and treated with MR-HIFU. Directly after treatment, the MRI protocol is
repeated. By performing this study, our aim is to find imaging predictors of success for the MR HIFU
treatment. This contributes to a better patient selection and inclusion and as a result better
treatment effects. At long last, we are aiming for reimbursement of MR-HIFU treatment for uterine
fibroids, as this minimally invasive treatment should belong in the treatment possibilities for women
suffering from uterine fibroids.
NL53499.075.15 MaSS
7 Abbreviations
ADC Apparent Diffusion Coefficient CE Contrast Enhanced CT Computed Tomography DCE Dynamic Contrast Enhanced DWI Diffusion Weighted Imaging EPI Echo-planar Imaging FIGO Federation of Gynaecology and Obstetrics GRASE Gradient and Spin Echo ICC Intra Class Correlation Coefficient IVIM Intra Voxel Incoherent Motion MASS Myoma Screening Study MR-HIFU Magnetic Resonance guided High Intensity Focused Ultrasound MRI Magnetic Resonance Imaging NPV Non-perfused Volume SE Spin Echo TE Echo Time TR Repetition Time TSE Turbo Spin Echo TVS Transvaginal ultrasonography UFS-QoL Uterine Fibroid Symptom and Health related Quality of Life questionnaire
NL53499.075.15 MaSS
8 References
1. Wilde S, Scott-Barrett S. Radiological appearances of uterine fibroids. Indian J Radiol Imaging. 2009;19(3):222-231.
2. Murase E, Siegelman ES, Outwater EK, Perez-Jaffe LA, Tureck RW. Uterine leiomyomas: Histopathologic features, MR imaging findings, differential diagnosis, and treatment 1. Radiographics. 1999;19(5):1179-1197.
3. Flake GP, Andersen J, Dixon D. Etiology and pathogenesis of uterine leiomyomas: A review. Environ Health Perspect. 2003;111(8):1037-1054.
4. Crow J. 3 pathology of uterine fibroids. Baillière's clinical obstetrics and gynaecology. 1998;12(2):197-211.
5. Gizzo S, Saccardi C, Patrelli TS, et al. Magnetic resonance-guided focused ultrasound myomectomy: Safety, efficacy, subsequent fertility and quality-of-life improvements, a systematic review. Reprod Sci. 2014;21(4):465-476.
6. Yoon SW, Lee C, Kim KA, Kim SH. Contrast-enhanced dynamic MR imaging of uterine fibroids as a potential predictor of patient eligibility for MR guided focused ultrasound (MRgFUS) treatment for symptomatic uterine fibroids. Obstet Gynecol Int. 2010;2010:10.1155/2010/834275. Epub 2010 Aug 16.
7. Funaki K, Fukunishi H, Funaki T, Sawada K, Kaji Y, Maruo T. Magnetic resonance-guided focused ultrasound surgery for uterine fibroids: Relationship between the therapeutic effects and signal intensity of preexisting T2-weighted magnetic resonance images. Obstet Gynecol. 2007;196(2):184. e1-184. e6.
8. Tempany CM, Stewart EA, McDannold N, Quade BJ, Jolesz FA, Hynynen K. MR Imaging–guided focused ultrasound surgery of uterine leiomyomas: A feasibility study 1. Radiology. 2003;226(3):897-905.
9. Stewart EA, Gostout B, Rabinovici J, Kim HS, Regan L, Tempany CM. Sustained relief of leiomyoma symptoms by using focused ultrasound surgery. Obstet Gynecol. 2007;110(2 Pt 1):279-287.
10. Lénárd ZM, McDannold NJ, Fennessy FM, et al. Uterine leiomyomas: MR Imaging–guided focused ultrasound Surgery—Imaging predictors of success 1. Radiology. 2008;249(1):187-194.
11. Harding G, Coyne KS, Thompson CL, Spies JB. The responsiveness of the uterine fibroid symptom and health-related quality of life questionnaire (UFS-QOL). Health Qual Life Outcomes. 2008;6(1):99.
12. Dueholm M, Lundorf E, Hansen ES, Ledertoug S, Olesen F. Accuracy of magnetic resonance imaging and transvaginal ultrasonography in the diagnosis, mapping, and measurement of uterine myomas. Obstet Gynecol. 2002;186(3):409-415.
13. Zhao W, Chen J, Chen W. Effect of biological characteristics of different types of uterine fibroids, as assessed with T2-weighted magnetic resonance imaging, on ultrasound-guided high-intensity focused ultrasound ablation. Ultrasound Med Biol. 2014.
14. Funaki K, Fukunishi H, Sawada K. Clinical outcomes of magnetic resonance‐guided focused ultrasound surgery for uterine myomas: 24‐month follow‐up. Ultrasound in Obstetrics & Gynecology. 2009;34(5):584-589.
15. Tamura A, Tanaka H, Ishii C, et al. Long echo time diffusion-weighted imaging (long TE-DWI) in diagnosing female pelvic tumors. . 2009.
16. Crow J. 3 pathology of uterine fibroids. Baillière's clinical obstetrics and gynaecology. 1998;12(2):197-211.
17. Shimada K, Ohashi I, Kasahara I, et al. Differentiation between completely hyalinized uterine leiomyomas and ordinary leiomyomas: Three‐phase dynamic magnetic resonance imaging (MRI) vs. diffusion‐weighted MRI with very small b‐factors. Journal of Magnetic Resonance Imaging. 2004;20(1):97-104.
NL53499.075.15 MaSS
18. Ikink ME, Voogt MJ, van den Bosch, Maurice AAJ, et al. Diffusion-weighted magnetic resonance imaging using different b-value combinations for the evaluation of treatment results after volumetric MR-guided high-intensity focused ultrasound ablation of uterine fibroids. Eur Radiol. 2014;24(9):2118-2127.
19. Faye N, Pellerin O, Thiam R, et al. Diffusion‐weighted imaging for evaluation of uterine arterial embolization of fibroids. Magnetic resonance in medicine. 2013;70(6):1739-1747.
20. Jacobs MA, Herskovits EH, Kim HS. Uterine fibroids: Diffusion-weighted MR imaging for monitoring therapy with focused ultrasound Surgery—Preliminary study 1. Radiology. 2005;236(1):196-203.
21. Liapi E, Kamel IR, Bluemke DA, Jacobs MA, Kim HS. Assessment of response of uterine fibroids and myometrium to embolization using diffusion-weighted echoplanar MR imaging. J Comput Assist Tomogr. 2005;29(1):83-86.
22. Park H, Yoon S, Sokolov A. Scaled signal intensity of uterine fibroids based on T2-weighted MR images: A potential objective method to determine the suitability for magnetic resonance-guided focused ultrasound surgery of uterine fibroids. Eur Radiol. 2015:1-4.
23. Sipola P, Ruuskanen A, Yawu L, et al. Preinterventional quantitative magnetic resonance imaging predicts uterus and leiomyoma size reduction after uterine artery embolization. Journal of Magnetic Resonance Imaging. 2010;31(3):617-624.
24. Lemke A, Laun FB, Simon D, Stieltjes B, Schad LR. An in vivo verification of the intravoxel incoherent motion effect in diffusion‐weighted imaging of the abdomen. Magnetic resonance in medicine. 2010;64(6):1580-1585.
25. Jacobs MA, Gultekin DH, Kim HS. Comparison between diffusion-weighted imaging, T2-weighted, and postcontrast T1-weighted imaging after MR-guided, high intensity, focused ultrasound treatment of uterine leiomyomata: Preliminary results. Med Phys. 2010;37(9):4768-4776.
26. Pilatou MC, Stewart EA, Maier SE, et al. MRI‐based thermal dosimetry and diffusion‐weighted imaging of MRI‐guided focused ultrasound thermal ablation of uterine fibroids. Journal of Magnetic Resonance Imaging. 2009;29(2):404-411.
27. Funaki K, Fukunishi H, Funaki T, Kawakami C. Mid-term outcome of magnetic resonance-guided focused ultrasound surgery for uterine myomas: From six to twelve months after volume reduction. Journal of minimally invasive gynecology. 2007;14(5):616-621.
28. Machtinger R, Inbar Y, Cohen-Eylon S, Admon D, Alagem-Mizrachi A, Rabinovici J. MR-guided focus ultrasound (MRgFUS) for symptomatic uterine fibroids: Predictors of treatment success. Human Reproduction. 2012;27(12):3425-3431.
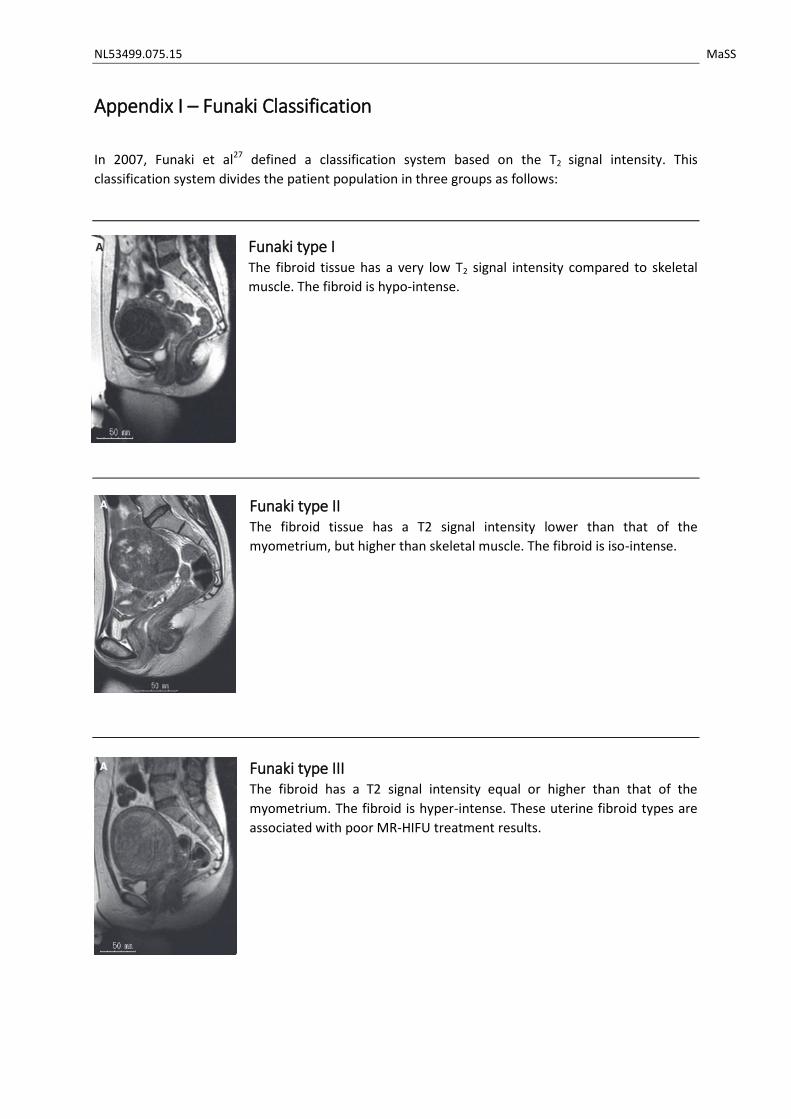
NL53499.075.15 MaSS
Appendix I – Funaki Classification
In 2007, Funaki et al27 defined a classification system based on the T2 signal intensity. This
classification system divides the patient population in three groups as follows:
Funaki type I The fibroid tissue has a very low T2 signal intensity compared to skeletal
muscle. The fibroid is hypo-intense.
Funaki type II The fibroid tissue has a T2 signal intensity lower than that of the
myometrium, but higher than skeletal muscle. The fibroid is iso-intense.
Funaki type III The fibroid has a T2 signal intensity equal or higher than that of the
myometrium. The fibroid is hyper-intense. These uterine fibroid types are
associated with poor MR-HIFU treatment results.
NL53499.075.15 MaSS
Appendix II: Theoretical MRI background
Diffusion Weighted Imaging In the magnetic field, all hydrogen atoms will precess with the Larmor frequency. The Larmor
frequency depends on the magnetic field:
𝜔 = 𝛾 × 𝐵
With ω as the Larmor frequency, γ the gyromagnetic ratio (42.6 MHz/T for hydrogen atoms) and B
the magnetic field strength. When working in a uniform magnetic field, all the atoms precess with
the same frequency. However, when applying a magnetic field gradient pulse, the Larmor frequency
will lower for the atoms in a lower magnetic field, and increase for the atoms in a higher magnetic
field. They will return to a uniform frequency when the gradient pulse is stopped, but the phase is
changed. The result of the gradient pulse is therefore a phase difference of the atoms, depending of
the position on the gradient axis. This dephasing is counteracted by applying a new gradient, but with
the opposite polarity. This will lead to refocusing of the atoms.
In case of movement of the hydrogen atoms, the refocusing will not succeed resulting in a lower
signal. So, diffusion weighted imaging is based on T2 weighted images with inserted additional
gradients to measure the stochastic molecular motion as signal attenuation. The b-value (s/mm2)
means how sensitive the images are to diffusion-based contrast. The b-value depends on the timing
and the amplitude of the diffusion gradients.
𝑏 = 𝛾2 × 𝐺2 × 𝛿2 × (∆ − 𝛿 3⁄ )
δ is the duration of each diffusion gradient, Δ is the interval between the gradients, G the amplitude
of the diffusion gradient and γ is the gyromagnetic ratio (42.6 MHz/T for hydrogen atoms). For
example: the longer the time between the two gradient pulses, the more time the molecules have to
diffuse. To calculate the diffusivity in a quantitative manner, at least two acquisitions with different
b-values are needed. Always a measurement without the influence of diffusion is needed. This is
done by using a b-value of 0 s/mm2. Thereafter, one or multiple other acquisitions with different b-
values are performed. The apparent diffusion coefficient (ADC) is calculated from the different
images:
𝑆𝑏 = 𝑆0 × 𝑒−𝑏×𝐴𝐷𝐶
𝐴𝐷𝐶 = ln (𝑆𝑏 𝑆0⁄ )
𝑏0 − 𝑏𝑏
NL53499.075.15 MaSS
Appendix III: METC Application MASS 1 Study
RESEARCH PROTOCOL
In depth analysis of biological tissue characteristics of
uterine fibroids using new MRI techniques
MaSS
May 2015

NL53499.075.15 MaSS
PROTOCOL TITLE
In depth analysis of biological tissue characteristics of uterine fibroids using new MRI techniques
Protocol ID NL53499.075.15
Short title MaSS study
Simplified, dutch title Studie naar het in beeld brengen van vleesbomen in de
baarmoeder met behulp van een MRI scan
Version 1
Date May 2015
Principal investigator(s)
M.F. Boomsma
Radiologist
038 424 7202
I. Slouwerhof
Technical Medicine intern, Radiology
038 424 4587 / 06 24 54 88 35
Other investigator(s)
J.R. Dijkstra
Gynecologist
038 424 7011
A. Blaauwbroek
Research coordinator
038 424 8258
Independent expert(s)
W. Kuchenbecker
Gynaecologist
038 424 7010

NL53499.075.15 MaSS
PROTOCOL SIGNATURE SHEET
Name Signature Date
Martijn Boomsma
Radiologist
Inge Slouwerhof
Technical Medicine Intern
NL53499.075.15 MaSS
TABLE OF CONTENTS
1. INTRODUCTION AND RATIONALE .................................................................................................. 52
2. OBJECTIVES .................................................................................................................................... 54
3. STUDY DESIGN ............................................................................................................................... 55
4. STUDY POPULATION ...................................................................................................................... 57
4.1 Population (base) .................................................................................................................. 57
4.2 Inclusion criteria .................................................................................................................... 57
4.3 Exclusion criteria ................................................................................................................... 57
4.4 Sample size calculation .......................................................................................................... 57
5. METHODS ...................................................................................................................................... 58
5.1 Study parameters/endpoints ................................................................................................ 58
5.1.1 Main study parameter/endpoint................................................................................... 58
5.1.2 Secondary study parameters/endpoints ....................................................................... 58
5.2 Randomisation, blinding and treatment allocation .............................................................. 58
5.3 Study procedures .................................................................................................................. 58
5.4 Withdrawal of individual subjects ......................................................................................... 59
5.5 Replacement of individual subjects after withdrawal ........................................................... 59
5.6 Follow-up of subjects withdrawn from treatment ................................................................ 59
6. SAFETY REPORTING ....................................................................................................................... 60
6.1 Section 10 WMO event ......................................................................................................... 60
6.2 Adverse events (AEs) and Serious adverse events (SAEs) ..................................................... 60
6.2.1 Adverse events (AEs) ..................................................................................................... 60
6.2.2 Serious adverse events (SAEs) ....................................................................................... 60
6.3 Annual safety report .............................................................................................................. 61
6.4 Follow-up of adverse events ................................................................................................. 61
7. STATISTICAL ANALYSIS ................................................................................................................... 62
7.1 Primary study parameter(s) .................................................................................................. 62
7.2 Secondary study parameter(s) .............................................................................................. 63
8. ETHICAL CONSIDERATIONS ........................................................................................................... 64
8.1 Regulation statement ............................................................................................................ 64
8.2 Recruitment and consent ...................................................................................................... 64
8.3 Benefits and risks assessment, group relatedness ................................................................ 64
8.4 Compensation for injury ........................................................................................................ 64
9. ADMINISTRATIVE ASPECTS, MONITORING AND PUBLICATION .................................................... 65

NL53499.075.15 MaSS
9.1 Handling and storage of data and documents ...................................................................... 65
9.2 Amendments ......................................................................................................................... 65
9.3 Annual progress report ......................................................................................................... 65
9.4 End of study report ................................................................................................................ 65
10. REFERENCES .............................................................................................................................. 66
11. APPENDIX 1........................................................................... Fout! Bladwijzer niet gedefinieerd.
LIST OF ABBREVIATIONS AND RELEVANT DEFINITIONS
ABR ABR form, General Assessment and Registration form, is the application form that
is required for submission to the accredited Ethics Committee (In Dutch, ABR =
Algemene Beoordeling en Registratie)
ADC Apparent Diffusion Coefficient
AE Adverse Event
CE Contrast Enhanced
CCMO Central Committee on Research Involving Human Subjects; in Dutch: Centrale
Commissie Mensgebonden Onderzoek
CV Curriculum Vitae
DCE-MRI Dynamic Contrast Enhanced Magnetic Resonance Imaging
GCP Good Clinical Practice
IC Informed Consent
METC Medical research ethics committee (MREC); in Dutch: medisch ethische toetsing
commissie (METC)
MR-DWI Magnetic Resonance, Diffusion Weighted, Imaging
MRI Magnetic Resonance Imaging
MR-HIFU Magnetic Resonance guided High Intensity Focused Ultrasound
(S)AE (Serious) Adverse Event
SI Signal Intensity
Sponsor The sponsor is the party that commissions the organisation or performance of the
research, for example a pharmaceutical
company, academic hospital, scientific organisation or investigator. A party that
provides funding for a study but does not commission it is not regarded as the
sponsor, but referred to as a subsidising party.
UFS-QoL Uterine Fibroid Symptom and Health related Quality of Life
Wbp Personal Data Protection Act (in Dutch: Wet Bescherming Persoonsgevens)
WMO Medical Research Involving Human Subjects Act (in Dutch: Wet Medisch-
wetenschappelijk Onderzoek met Mensen
SUMMARY
Rationale:
Recent clinical inside shows that uterine fibroid tissue can be very heterogeneous. To refine the
stratification of uterine fibroids, more biological information is needed on tissue level. Therefore, in
this study we want to analyze a completely new MRI protocol for the characterization of uterine
fibroid tissue using multiparametric MRI techniques.
Objective:
The primary objective is to determine new biological properties of uterine fibroid tissue using
advanced MRI image sequences and to correlate these properties with the currently used simple
Funaki classification and with clinical symptoms.
Study design:
The proposed research will concern a single-center, explorative research, performed on the
departments of gynecology and radiology.
Study population:
The study population consists of women, diagnosed with a uterine fibroid and presenting uterine
fibroid related symptoms.
Main study parameters/endpoints:
The main exploratory study parameter is the distribution and variation of MRI parameters (ADC map,
Ktrans map, ve, vp and T2 map), and the correlation between the MRI parameters and the Funaki score
and clinical UFS-QoL score.
Nature and extent of the burden and risks associated with participation, benefit and group
relatedness
Patients included in this study will undergo an MRI examination before proceeding to treatment.
During this MRI, use is made of a gadolinium-based MRI contrast agent (Dotarem). This macro-cyclic
coated , intra-venous contrast agent is routinely used in current practice and adverse effects are
scarce. Besides, patients are asked to complete the UFS-QoL questionnaire.
1. INTRODUCTION AND RATIONALE
Uterine fibroids are the most common benign gynecological tumors affecting a high percentage of
women. The life-time prevalence of fibroids lies between 70 to 80%. Symptoms of uterine fibroids
are abnormal uterine bleeding and pelvic discomfort due to the existing mass, leading to a significant
negative effect on the quality of life. Treatment possibilities include drug therapy, hysterectomy,
myomectomy, uterine artery embolization and magnetic resonance guided “High Intensity Focused
Ultrasound” (MR-HIFU). The choice of treatment and rate of success is dependent on the
morphology and tissue characterization of the uterine fibroids1.
Histopathology of uterine fibroids
From literature it is known that the histopathology of uterine fibroids varies among patients. Based
on the histopathology, multiple subtypes of uterine fibroids are recognized. Uterine fibroids are
composed of smooth muscle fiber bundles, surrounded by collagenous fibrous connective tissue
within which are blood vessels. Also variable numbers of mast cells are present. The density of each
of these cell types is different for the various types of uterine fibroids2. Biological characterization of
fibroid tissue is useful knowledge in the choice and suitability of treatment options1,2. For example,
the treatment effects of drug therapy are lower in patients with a high proportion of collagenous
tissue because of its unresponsiveness2. MRI can also provide information about the suitability for a
uterine artery embolization1.
Without biopsy it is in current practice impossible to characterize tissue characteristics before
treatment. However, recent new, multiparametric MRI parameters are developed by Philips
Healthcare (Eindhoven) that can be used as non-invasive biomarkers. This set of new MRI
parameters can be used to visualize and gain knowledge about the biological variation and
characterization of uterine fibroids. This could be important in the choice of the most appropriate
minimal invasive therapy.
Current imaging-based characterization
Current imaging-based biological characterizations of uterine fibroids are limited. The signal intensity
on T2-weighted MRI images is the main parameter of characterization. This parameter is described by
the Funaki classification, defined by Funaki et al. in 2007 3. In the Funaki classification, patients are
stratified in 3 groups based on T2 signal intensity in selection of MR HIFU treatment. Details of the
Funaki classification are listed in appendix 1. This subdivision of uterine fibroids is correlated with
pathohistologic structures, demonstrated by Zhao et al. in 2014 4.
Novel MRI techniques for imaging-based biological characterization
Three novel MRI techniques can potentially provide extra information about the biological
characterization of uterine fibroids. These sequences have been specifically developed (by Philips
healthcare, Eindhoven) for the use in uterine fibroids and will be eluded separately below.
1. Dynamic contrast enhanced MRI (DCE)
Shows the vascular distribution and perfusion within the uterine fibroid5. This vascular distribution is quantified by the transfer constant Ktrans
2. Diffusion weighted MRI (DWI) This parameter visualizes the perfusion (microcirculation of
blood in the capillaries) and diffusion of free water
molecules in the uterine fibroid. The ADC parameters are
used as quantitative values.
3. T2 mapping Quantitative T2 measurement, reflecting the blood fraction
in the fibroid. The T2 relaxation time is the quantitative
parameter of this sequence.
From literature, it is known that dynamic contrast enhanced MRI (DCE) is one of the most commonly
adopted perfusion MR techniques in the field of oncologic imaging, because it can quantitatively
measure important perfusion parameters. The use of DCE MRI in uterine fibroids is described in
some case reports5,6 and one small study consisting of 10 patients7. These studies correlate the
vascular distribution to treatment outcome of MR-HIFU treatment.
Diffusion weighted MRI (DWI) for uterine fibroids is used in multiple studies to characterize the
uterine fibroid tissue8,9. With the use of different b-values, perfusion and diffusion can both be
imaged.
T2 mapping is a, not previously described, new technique for the specific use in uterine fibroids. The
Funaki classification3 is also based on T2 relaxation times. T2 mapping quantifies this parameter,
making it more reliable and more widely applicable.
The knowledge from the literature, as described above, is gained from small patient groups and the
combination of the different techniques is not described. With this study, we want to create further
insight in these techniques, which could be of importance later in choosing the most appropriate
minimal invasive therapy for each individual patient. The new sequences could give the opportunity
for treatment selection of patients, provided that the parameters have a distinctive character.
Rationale
The Funaki classification alone is a limited characterization parameter based on the average value of
the full fibroid. Further, it classifies the entire patient population in only 3 groups. Recent clinical
insights shows that the uterine fibroid tissue can be very heterogeneous. To refine the stratification,
more information is needed on tissue level. Therefore, in this study we want to analyze a completely
new MRI protocol for the non-invasive characterization of uterine fibroid tissue using
multiparametric MRI.
In Isala Hospital, on average 210 patients present annually with physical complains that can be
attributed to uterine fibroids. This makes the Isala an ideal hospital for this research proposal.
2. OBJECTIVES
Primary Objective:
To determine new biological properties of uterine fibroid tissue using advanced MRI image
sequences and to correlate these properties with the currently used simple Funaki classification and
with clinical symptoms.
Secondary Objective(s):
To determine the correlation of symptom reduction after 3 months of medically treated patients
with the in this study evaluated new, extra MRI parameters.
3. STUDY DESIGN
The proposed research will concern a single-center, explorative research. Data collection and
experiments are performed in the Isala Zwolle at the gynecology and radiology department.
The flow-chart on page 12 shows the course of events. On the left, the course of events in current
practice is shown. The green fields on the right are the extra study events.
All new patients presenting with fibroid related symptoms in the gynecology department are
registered in the study database. Based on the in-/exclusion criteria as further described in section
4.2 and 4.3, only a selective patient group will undergo the screening MRI.
With the screening MRI, biological tissue parameters are determined with a new MRI protocol. These
tissue parameters are correlated to the existing tissue classification method (Funaki classification)
and clinical findings. Clinical findings are examined by means of the Uterine Fibroid Symptom and
health related Quality of Life questionnaire (UFS-QoL). Medically treated patients will be asked to
complete the UFS-QoL questionnaire again after 3 months.
Patient visits gynaecologist
Anamnesis and vaginal
ultrasonography are taken
Patient starts treatment
Patient visits gynaecologist
Anamnesis and vaginal
ultrasonography are taken
Patient starts treatment
MRI scan is performed
Patient completes UFS-QoL
questionnaire
Current Practice Study Design
Medically treated patients complete
UFS-QoL again after 3 months
4. STUDY POPULATION
4.1 Population (base)
210 new patients per year present themselves in Isala with complains that can be attributed to
uterine fibroids.
4.2 Inclusion criteria
Patients with a diagnosed uterine fibroid (based on anamnesis, physical examination and vaginal
ultrasonography) and uterine fibroid related symptoms are included in the study.
4.3 Exclusion criteria
Exclusion criteria for the MRI screening, based on anamnesis, physical examination and vaginal
ultrasonography, are defined as follows:
Post-menopausal patients
Pregnant patients
Calcified uterine fibroids
Severe abdominal obesity
Uterine artery embolization in medical history
MRI contra-indications
4.4 Sample size calculation
Sample size is determined based on the objective of the study: the distribution and variation in
quantitative MRI parameters. From literature it is known, type 3 uterine fibroids (based on the
Funaki classification) are difficult to treat. Therefore, distribution and variation is especially of
added value in type 3 uterine fibroids. When looking at literature about the incidence of type 3
uterine fibroids, an average incidence of 20-25% is seen. For a reliable comparison between
patients with type 3 uterine fibroids, an inclusion of 80 patients is desirable. In this case, we can
include about 20 patients with type 3 uterine fibroids.
5. METHODS
5.1 Study parameters/endpoints
5.1.1 Main study parameter/endpoint
Distribution and variation of MRI parameters (ADC map, Ktrans map, ve, vp and T2 map), and
the correlation between the MRI parameters and the Funaki score and clinical UFS-QoL
score.
5.1.2 Secondary study parameters/endpoints
Correlation between UFS-QoL improvement after 3 months and the MRI parameters (ADC
map, Ktrans map, ve, vp and T2 map) in medically treated patients
5.2 Randomisation, blinding and treatment allocation
Not applicable
5.3 Study procedures
Patients presenting with uterine fibroid related symptoms at the department of
gynaecology will undergo standard consultation, physical examination and vaginal
ultrasonography.
When the inclusion and exclusion criteria (section 4.2 and 4.3) are met, the patient will be
asked informed consent and the screening MRI will be scheduled as soon as possible.
Patients also are asked to complete the Uterine Fibroid Symptom and Health related
Quality of Life questionnaire (UFS-QoL). The UFS-QoL is a validated, disease-specific
questionnaire.
The screening MRI is performed at the radiology department in the Isala. The MRI protocol
consists of multiple sequences, schematically visualised below. The first two sequences are
part of the conventional protocol for patients undergoing pelvic MRI with an uterine fibroid
indication. Three sequences are added to this protocol for evaluation of the new, multi-
parametric classification approach.
Medically treated patients will be asked to complete the UFS-QoL questionnaire again after
3 months.
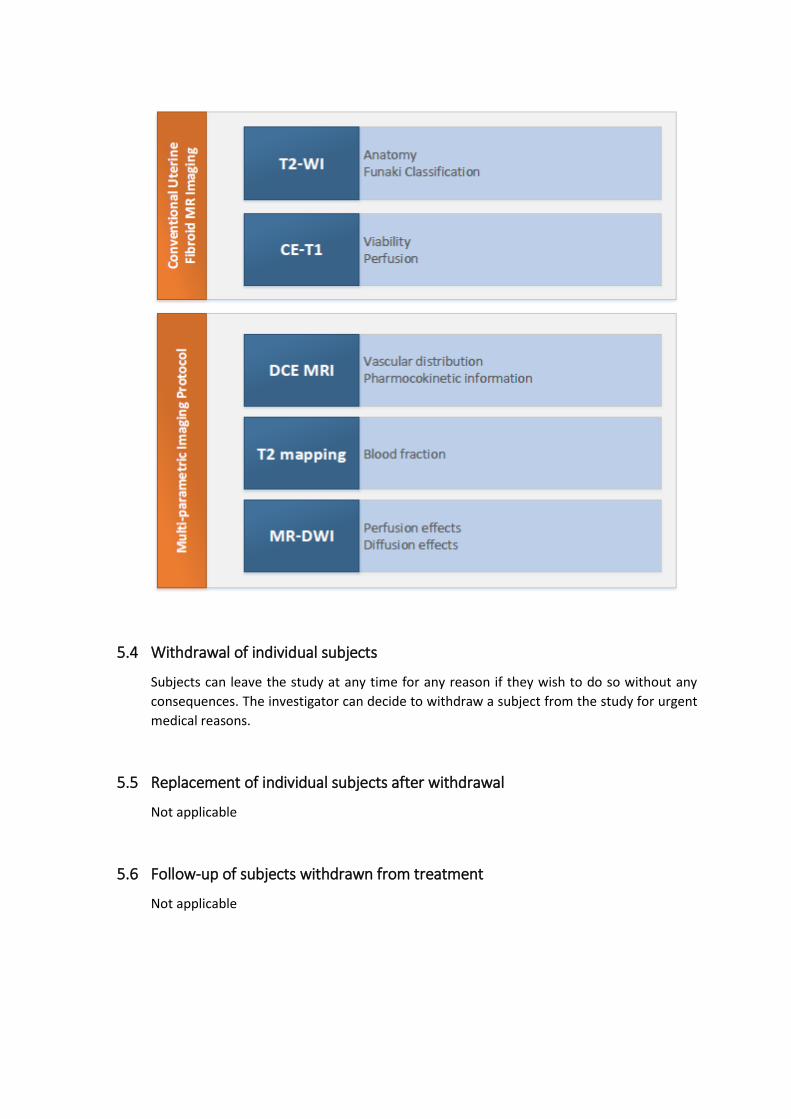
5.4 Withdrawal of individual subjects
Subjects can leave the study at any time for any reason if they wish to do so without any
consequences. The investigator can decide to withdraw a subject from the study for urgent
medical reasons.
5.5 Replacement of individual subjects after withdrawal
Not applicable
5.6 Follow-up of subjects withdrawn from treatment
Not applicable
6. SAFETY REPORTING
6.1 Section 10 WMO event
In accordance to section 10, subsection 1, of the WMO, the investigator will inform the subjects
and the reviewing accredited METC if anything occurs, on the basis of which it appears that the
disadvantages of participation may be significantly greater than was foreseen in the research
proposal. The study will be suspended pending further review by the accredited METC, except
insofar as suspension would jeopardise the subjects’ health. The investigator will take care that
all subjects are kept informed.
6.2 Adverse events (AEs) and Serious adverse events (SAEs)
6.2.1 Adverse events (AEs)
Adverse events are defined as any undesirable experience occurring to a subject during the
study, whether or not considered related to the screening MRI as described in this protocol.
All adverse events reported spontaneously by the subject or observed by the investigator or
his staff will be recorded.
6.2.2 Serious adverse events (SAEs)
A serious adverse event is any untoward medical occurrence or effect that at any dose:
- results in death;
- is life threatening (at the time of the event);
- requires hospitalisation or prolongation of existing inpatients’ hospitalisation;
- results in persistent or significant disability or incapacity;
- is a congenital anomaly or birth defect;
- Any other important medical event that may not result in death, be life threatening, or
require hospitalization, may be considered a serious adverse experience when, based upon
appropriate medical judgement, the event may jeopardize the subject or may require an
intervention to prevent one of the outcomes listed above.
The sponsor will report the SAEs through the web portal ToetsingOnline to the accredited
METC that approved the protocol, within 15 days after the sponsor has first knowledge of
the serious adverse events.
SAEs that result in death or are life threatening should be reported expedited. The
expedited reporting will occur not later than 7 days after the responsible investigator has
first knowledge of the adverse event. This is for a preliminary report with another 8 days for
completion of the report.

6.3 Annual safety report
Not applicable
6.4 Follow-up of adverse events
All AEs will be followed until they have abated, or until a stable situation has been reached.
Depending on the event, follow up may require additional tests or medical procedures as
indicated, and/or referral to the general physician or a medical specialist.
SAEs need to be reported till end of study within the Netherlands, as defined in the protocol
7. STATISTICAL ANALYSIS
7.1 Primary study parameter(s)
Descriptive statistics
The different variables are statistically described as follows:
MRI parameters (ADC map, Ktrans map, ve, vp and T2 map) are quantitative continuous
variables. Each parameter will be tested for normality with the Shapiro-Wilk test. If the
parameter has a normal distribution, it will be described with the mean ± standard
deviation. When the distribution is skewed, the parameter will be described with the
median and the minimum/maximal value.
The Funaki classification is a categorical variable (values 1, 2 and 3). This variable will be
described by the number of patients within each group and the corresponding
percentages.
The UFS-QoL questionnaire score is a discrete variable (range 0-100). It will be described
with the median and minimum/maximal value. The Shapiro-Wilk test is used to test the
normality.
Variation in MRI parameter
To describe the variation in each MRI parameter (ADC map, Ktrans map, ve, vp and T2 map), the
coefficient of variation is used for all parameters. Because all MRI parameters have different
units, a standardized measure of dispersion is used to compare the variation of each parameter.
MRI parameters versus Funaki classification
To describe the relationship between the MRI parameters and the Funaki classification,
scatterplots and boxplots are made for each MRI parameter (ADC map, Ktrans map, ve, vp and T2
map).
To statistical test the relationship between each MRI parameter and the Funaki classification, the
Spearman’s rank correlation coefficient is used. This univariate analysis is performed for each
MRI parameter (ADC map, Ktrans map, ve, vp and T2 map) in relation to the Funaki classification.
UFS-QoL score on t0 versus MRI parameters and Funaki classification
To describe the relationship between the MRI parameters and the UFS-QoL score on t0,
scatterplots and boxplots are made for each MRI parameter (ADC map, Ktrans map, ve, vp and T2
map) and the Funaki classification.
To statistical test which parameter is the best predictor for clinical symptoms, regression analysis
on the UFS-QoL will be performed. If the UFS-QoL variable has a normal distribution, linear
regression is used for the correlation between the UFS-QoL score and the MRI parameter. If the
distribution of the variable is skewed, a logistic transformation is performed. When the
distribution is normalized after this transformation, linear regression is used. When the variable is
still skewed after the transformation, the UFS-QoL is dichotomized, based on the median. After
dichotomization, logistic regression is used for the association between the UFS-QoL score and
the MRI parameters.
7.2 Secondary study parameter(s)
Descriptive statistics
The difference in UFS-QoL score after 3 months (Δ UFS-QoL) will be described with the means
(±sd) or median (minimum-maximal) value, in the case of skewed distribution. The Shapiro-Wilk
test is used to test normality.
Correlation between Δ UFS-QoL and the MRI parameters
The association between the MRI parameters (ADC map, Ktrans map, ve, vp, T2 map and Funaki
classification) and the difference in UFS-QoL score after 3 months (Δ UFS-QoL) is determined
univariate as well as multivariable. If the Δ UFS-QoL variable has a normal distribution, linear
regression is used for the correlation between the Δ UFS-QoL score and the MRI parameter. If the
distribution of the variable is skewed, a logistic transformation is performed. When the
distribution is normalized after this transformation, linear regression is used. When the variable is
still skewed after the transformation, the Δ UFS-QoL is dichotomized, based on the median. After
dichotomization, logistic regression is used for the association between the Δ UFS-QoL score and
the MRI parameters.

8. ETHICAL CONSIDERATIONS
8.1 Regulation statement
This study will be conducted in accordance with the ethical principles that have their origin in the
current Declaration of Helsinki. The study will be conducted in compliance with the
protocol. The protocol and any Amendments and the subjects Informed Consent will receive
Institutional Review Board (IRB/Independent Ethics Committee (IEC) approval/favorable opinion
prior to initiation of the study.
8.2 Recruitment and consent
Freely written informed consent will be obtained from every subject prior to study
participation, including informed consent for any screening procedures conducted to establish
subject eligibility for the study.
8.3 Benefits and risks assessment, group relatedness
Subjects meeting all inclusion criteria without meeting any exclusion criterion will be eligible for
the screening MRI. Patients entering the screening MRI study do not directly benefit from study
participation. Risks associated with study participation are negligible. The contrast agent used in
this study (Dotarem) is a monocyclic coated gadolinium-based contrast agent. The occurance of
Nephrogenic systemic fibrosis (NSF) is according to the FDA not recurred. Also allergic reactions
are very rare.
8.4 Compensation for injury
Statutory obligation to provide insurance is at time of writing under construction.
9. ADMINISTRATIVE ASPECTS, MONITORING AND PUBLICATION
9.1 Handling and storage of data and documents
Research Manager is used in this study for the storage of data. For each module, specific rights
are assigned. All gynaecologists can include patients in this database. At inclusion, all patients will
be assigned a unique study number. The database which links the study number to the Isala
patients numbers is only available to coordinating investigators.
9.2 Amendments
Amendments are changes made to the research after a favourable opinion by the accredited
METC has been given. All amendments will be notified to the METC that gave a favourable
opinion.
9.3 Annual progress report
The sponsor/investigator will submit a summary of the progress of the trial to the accredited
METC once a year. Information will be provided on the date of inclusion of the first subject,
numbers of subjects included and numbers of subjects that have completed the trial, serious
adverse events/ serious adverse reactions, other problems, and amendments.
9.4 End of study report
The investigator will notify the accredited METC of the end of the study within a period of 8
weeks. The end of the study is defined as the latest patient inclusion and MRI scan.
In case the study is ended prematurely, the investigator will notify the accredited METC within 15
days, including the reasons for the premature termination.
Within one year after the end of the study, the investigator/sponsor will submit a final study
report with the results of the study, including any publications/abstracts of the study, to the
accredited METC.
REFERENCES
1. Murase E, Siegelman ES, Outwater EK, Perez-Jaffe LA, Tureck RW. Uterine leiomyomas: Histopathologic features, MR
imaging findings, differential diagnosis, and treatment 1. Radiographics. 1999;19(5):1179-1197.
2. Crow J. 3 pathology of uterine fibroids. Baillière's clinical obstetrics and gynaecology. 1998;12(2):197-211.
3. Funaki K, Fukunishi H, Funaki T, Sawada K, Kaji Y, Maruo T. Magnetic resonance-guided focused ultrasound surgery for
uterine fibroids: Relationship between the therapeutic effects and signal intensity of preexisting T2-weighted magnetic
resonance images. Obstet Gynecol. 2007;196(2):184. e1-184. e6.
4. Zhao W, Chen J, Chen W. Effect of biological characteristics of different types of uterine fibroids, as assessed with T2-
weighted magnetic resonance imaging, on ultrasound-guided high-intensity focused ultrasound ablation. Ultrasound Med
Biol. 2014.
5. Liu J, Keserci B, Yang X, et al. Volume transfer constant (K trans) maps from dynamic contrast enhanced MRI as
potential guidance for MR-guided high intensity focused ultrasound treatment of hypervascular uterine fibroids. Magn Reson
Imaging. 2014;32(9):1156-1161.
6. Yoon SW, Lee C, Kim KA, Kim SH. Contrast-enhanced dynamic MR imaging of uterine fibroids as a potential predictor
of patient eligibility for MR guided focused ultrasound (MRgFUS) treatment for symptomatic uterine fibroids. Obstet
Gynecol Int. 2010;2010:10.1155/2010/834275. Epub 2010 Aug 16.
7. Kim YS, Lim HK, Kim JH, et al. Dynamic contrast-enhanced magnetic resonance imaging predicts immediate therapeutic
response of magnetic resonance-guided high-intensity focused ultrasound ablation of symptomatic uterine fibroids. Invest
Radiol. 2011;46(10):639-647.
8. Shimada K, Ohashi I, Kasahara I, et al. Differentiation between completely hyalinized uterine leiomyomas and ordinary
leiomyomas: Three‐phase dynamic magnetic resonance imaging (MRI) vs. diffusion‐weighted MRI with very small b‐
factors. Journal of Magnetic Resonance Imaging. 2004;20(1):97-104.
9. Ikink ME, Voogt MJ, van den Bosch, Maurice AAJ, et al. Diffusion-weighted magnetic resonance imaging using different
b-value combinations for the evaluation of treatment results after volumetric MR-guided high-intensity focused ultrasound
ablation of uterine fibroids. Eur Radiol. 2014;24(9):2118-2127.
Studie naar het in beeld brengen van vleesbomen in de baarmoeder met behulp van
een MRI scan
Inleiding
Geachte mevrouw,
U bent gevraagd om mee te doen aan de hierboven genoemde medisch-wetenschappelijke studie (zie
titel).
Om te beoordelen of u mee wilt doen, is goede voorlichting van onze kant nodig, en een zorgvuldige
afweging van uw kant. Vandaar dat u deze schriftelijke informatie ontvangt. U kunt deze rustig
(her)lezen en in eigen kring bespreken. Ook daarna kunt u nog altijd vragen stellen aan de
artsen/onderzoekers die aan het eind van deze informatie staan genoemd.
1. Wat is het doel van het onderzoek?
Het doel van dit onderzoek is om vleesbomen in de baarmoeder af te beelden met een MRI scan. Met
dit onderzoek wordt gekeken of de MRI scan meer informatie kan geven over vleesbomen.
2. Welk product, geneesmiddel, medisch hulpmiddel of behandeling wordt onderzocht?
Het extra MRI onderzoek wordt in deze studie onderzocht.
3. Hoe wordt het onderzoek uitgevoerd?
Nadat bij u is vastgesteld dat u een vleesboom in uw baarmoeder heeft, zal u gevraagd worden aan
het onderzoek deel te nemen. Als u dit wilt, zal een afspraak worden gemaakt voor het MRI
onderzoek. Het MRI onderzoek heeft geen invloed op uw behandeling.
4. Wat wordt er van u verwacht?
Van u wordt verwacht een extra MRI scan te ondergaan. Voor deze MRI scan zijn thuis geen extra
voorbereidingen nodig. Tijdens het onderzoek krijgt u een koptelefoon met muziek om het kloppende
geluid van de MRI te dempen. Ook krijgt u een infuus in uw arm. Door dit infuus wordt contrastmiddel
in uw bloedvaten ingebracht. Voor uitgebreide informatie over een MRI scan, kunt u kijken op de
website van de Isala: http://www.isala.nl/patienten/folders/5707-mri
Ook wordt u gevraagd om een vragenlijst in te vullen. Deze krijgt u digitaal in via e-mail. Mocht u liever
een vragenlijst op papier ontvangen, dan is dit ook mogelijk. Wanneer u door de gynaecoloog
medicijnen krijgt voorgeschreven, vragen we u de vragenlijst nogmaals na 3 maanden in te vullen.
5. Wat is meer of anders dan de reguliere behandelingen die u ontvangt?
Uw reguliere behandeling zal niet anders zijn.
6. Welke bijwerkingen kunt u verwachten?
De arts zal met u een vragenlijst doornemen om uw veiligheid in de MRI te garanderen. Het
contrastmiddel wat in uw bloedvaten wordt gespoten, kan bij sommige patiënten een allergische
reactie oproepen. Dit zou een warm gevoel, hoofdpijn of misselijkheid kunnen geven. Deze reacties
zijn zeer zeldzaam.
7. Wat zijn de mogelijke voor- en nadelen van deelname aan dit onderzoek?
Dit onderzoek kan nuttige wetenschappelijke gegevens voor de toekomst leveren. Er zitten geen
nadelen aan deelname aan dit onderzoek.
8. Wat gebeurt er als u niet wenst deel te nemen aan dit onderzoek?
Deelname aan dit onderzoek is geheel vrijwillig. Als u niet wilt deelnemen, hoeft u daarvoor geen
reden op te geven. Als u besluit niet mee te doen, geeft dat geen enkele verandering in uw verdere
behandeling of begeleiding. Ook als u nu toestemming geeft, kunt u die te allen tijde zonder opgave
van redenen weer intrekken. Het onderzoek zal zo nauwkeurig mogelijk volgens plan verlopen. Als uw
veiligheid of welbevinden in gevaar zijn, beëindigt de onderzoeker uw deelname aan het
wetenschappelijk onderzoek direct.
9. Bent u verzekerd wanneer u aan het onderzoek meedoet?
Voor de deelnemers aan dit onderzoek is een verzekering afgesloten bij Landschot en Chabot. Deze
verzekering dekt schade door letsel of overlijden als gevolg van deelname aan het onderzoek, en die
zich gedurende de deelname aan het onderzoek openbaart, of binnen vier jaar na beëindiging van de
deelname aan het onderzoek.
Zie voor verzekerde bedragen, de uitsluiting gronden en adresgegevens van de verzekeraar, de
bijlage.
10. Wat gebeurt er met uw gegevens?
Tot uw persoon herleidbare gegevens kunnen slechts met uw toestemming (aan te geven op het
toestemmingsformulier) door derden worden ingezien. En dan ook alleen als zij hiertoe bevoegd zijn,
zoals medewerkers van het onderzoeksteam, medewerkers van de Inspectie voor de
Gezondheidszorg (IGZ) of bevoegde inspecteurs van een buitenlandse overheid, en leden van de
Medisch Ethische Toetsingscommissie. Inzage kan nodig zijn om de betrouwbaarheid en kwaliteit van
het onderzoek na te gaan. Onderzoeksgegevens worden gehanteerd met inachtneming van de Wet
Bescherming Persoonsgegevens.
Persoonsgegevens die tijdens de studie worden verzameld, worden vervangen door een
codenummer. Alleen dat nummer wordt gebruikt voor studiedocumentatie, in rapporten of publicaties
over dit onderzoek. Slechts degene die de sleutel van de code heeft (de onderzoeker/ behandelend
arts) weet wie de persoon achter het codenummer is.
Uw persoonsgegevens worden bewaard gedurende het onderzoek en na afloop vernietigd, of (indien
van toepassing) de gegevens worden gedurende vijftien jaar bewaard.
11. Zijn er extra kosten wanneer u besluit aan dit onderzoek mee te doen?
Voor dit onderzoek dient u een keer extra naar het ziekenhuis te komen. Voor eventuele reiskosten
kunt u contact met ons opnemen. Wanneer u al een andere afspraak in de Isala heeft staan, proberen
we deze te combineren. De MRI scan brengt voor u geen extra kosten met zich mee.
12. Is het onderzoek goedgekeurd door een medisch-ethische toetsingscommissie?
Voor dit onderzoek is goedkeuring verkregen van de Medisch Ethische Toetsingscommissie van de
Isala klinieken te Zwolle. De voor dit onderzoek geldende nationale en internationale richtlijnen
worden nauwkeurig in acht genomen.
13. Wilt u verder nog iets weten?
Voor het stellen van vragen en het inwinnen van nadere informatie voor, tijdens en na het onderzoek
is een niet bij het onderzoek betrokken arts beschikbaar. Indien u behoefte heeft aan een
onafhankelijk advies over dit onderzoek, kunt u terecht bij Walter Kuchenbecker
([email protected], 038 424 7010).
Voor inhoudelijke vragen kunt u ook altijd contact op nemen met de één van de hoofdonderzoekers:
I. Slouwerhof (stagiaire Technische Geneeskunde)
038 424 4587
M.F. Boomsma (radioloog)
038 424 7202
J.R. Dijkstra (gynaecoloog)
038 424 7011
Appendix IV: METC Application MASS 2 Study
RESEARCH PROTOCOL
Minimal invasive treatment of Uterine Fibroids with
Magnetic Resonance guided High Intensity Focused
Ultrasound – the search for revealing imaging
parameters
January 2016
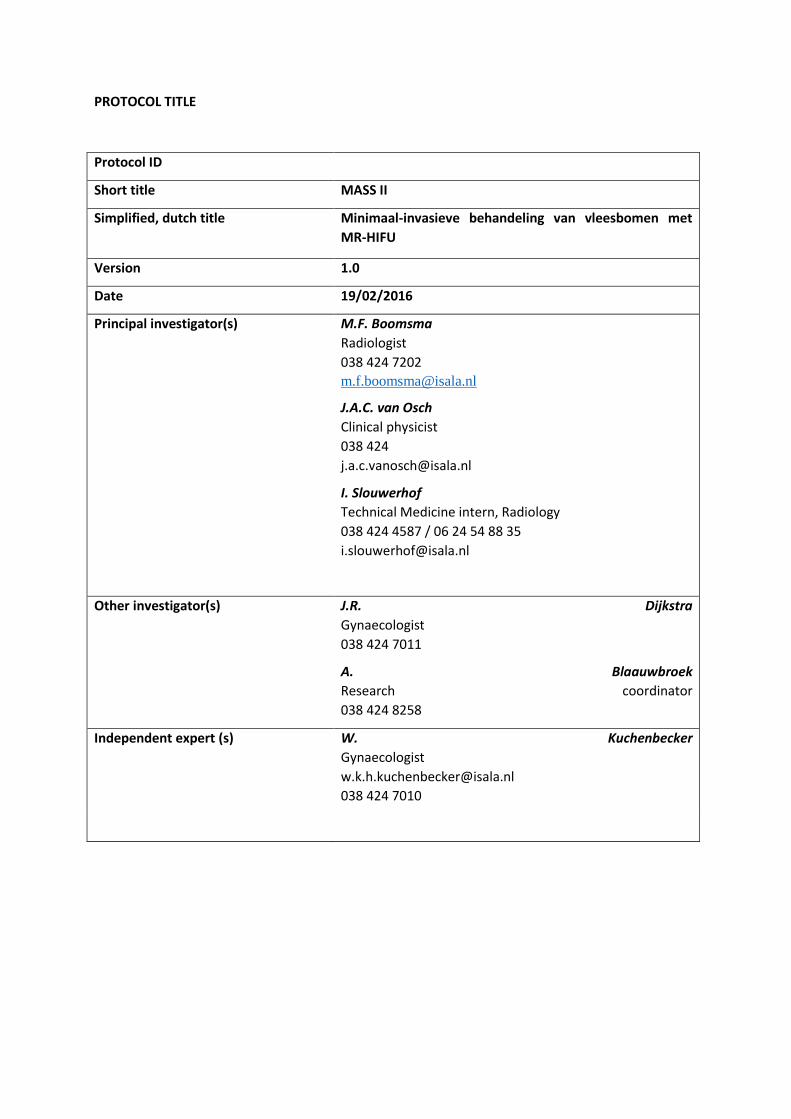
PROTOCOL TITLE
Protocol ID
Short title MASS II
Simplified, dutch title Minimaal-invasieve behandeling van vleesbomen met
MR-HIFU
Version 1.0
Date 19/02/2016
Principal investigator(s)
M.F. Boomsma
Radiologist
038 424 7202
J.A.C. van Osch
Clinical physicist
038 424
I. Slouwerhof
Technical Medicine intern, Radiology
038 424 4587 / 06 24 54 88 35
Other investigator(s) J.R. Dijkstra
Gynaecologist
038 424 7011
A. Blaauwbroek
Research coordinator
038 424 8258
Independent expert (s) W. Kuchenbecker
Gynaecologist
038 424 7010

PROTOCOL SIGNATURE SHEET
Name Signature Date
Martijn Boomsma
Radiologist
Inge Slouwerhof
Technical Medicine Intern
Jochen van Osch
Clinical physicist

TABLE OF CONTENTS
ENGLISH SUMMARY .............................................................................................................................. 76
NEDERLANDSE SAMENVATTING ........................................................................................................... 77
1. INTRODUCTION AND RATIONALE .................................................................................................. 78
2. OBJECTIVES .................................................................................................................................... 80
3. STUDY DESIGN ............................................................................................................................... 81
4. STUDY POPULATION ...................................................................................................................... 83
4.1 Population (base) .................................................................................................................. 83
4.2 Inclusion criteria .................................................................................................................... 83
4.3 Exclusion criteria ................................................................................................................... 83
5. METHODS ...................................................................................................................................... 84
5.1 Study parameters/endpoints ................................................................................................ 84
5.1.1 Main study parameter/endpoint................................................................................... 84
5.1.2 Secondary study parameters/endpoints ....................................................................... 84
5.2 Randomisation, blinding and treatment allocation .............................................................. 84
5.3 Study procedures .................................................................................................................. 84
5.4 Withdrawal of individual subjects ......................................................................................... 86
5.5 Replacement of individual subjects after withdrawal ........................................................... 86
5.6 Follow-up of subjects withdrawn from treatment ................................................................ 86
5.7 Premature termination of the study ..................................................................................... 86
6. SAFETY REPORTING ....................................................................................................................... 87
6.1 Section 10 WMO event ......................................................................................................... 87
6.2 Adverse events (AEs) and Serious adverse events (SAEs) ..................................................... 87
6.2.1 Adverse events (AEs) ..................................................................................................... 87
6.2.2 Serious adverse events (SAEs) ....................................................................................... 87
6.3 Annual safety report .............................................................................................................. 88
6.4 Follow-up of adverse events ................................................................................................. 88
7. STATISTICAL ANALYSIS ................................................................................................................... 89
7.1 Primary study parameter(s) .................................................................................................. 89
7.2 Secondary study parameter(s) .............................................................................................. 89
8. ETHICAL CONSIDERATIONS ........................................................................................................... 90
8.1 Regulation statement ............................................................................................................ 90
8.2 Recruitment and consent ...................................................................................................... 90
8.3 Benefits and risks assessment, group relatedness ................................................................ 90

8.4 Compensation for injury ........................................................................................................ 90
9. ADMINISTRATIVE ASPECTS, MONITORING AND PUBLICATION .................................................... 91
9.1 Handling and storage of data and documents ...................................................................... 91
9.2 Amendments ......................................................................................................................... 91
9.3 Annual progress report ......................................................................................................... 91
9.4 End of study report ................................................................................................................ 91
10. REFERENCES .............................................................................................................................. 92
LIST OF ABBREVIATIONS AND RELEVANT DEFINITIONS
ABR ABR form, General Assessment and Registration form, is the application form that
is required for submission to the accredited Ethics Committee (In Dutch, ABR =
Algemene Beoordeling en Registratie)
ADC Apparent Diffusion Coefficient
AE Adverse Event
CE Contrast Enhanced
CCMO Central Committee on Research Involving Human Subjects; in Dutch: Centrale
Commissie Mensgebonden Onderzoek
CV Curriculum Vitae
DCE-MRI Dynamic Contrast Enhanced Magnetic Resonance Imaging
GCP Good Clinical Practice
IC Informed Consent
METC Medical research ethics committee (MREC); in Dutch: medisch ethische toetsing
commissie (METC)
MR-DWI Magnetic Resonance, Diffusion Weighted, Imaging
MRI Magnetic Resonance Imaging
MR-HIFU Magnetic Resonance guided High Intensity Focused Ultrasound
mp-MRI Multi-parametric Magnetic Resonance Imaging
NPV Non-perfused Volume
ROI Region of Interest
(S)AE (Serious) Adverse Event
SI Signal Intensity
Sponsor The sponsor is the party that commissions the organisation or performance of the
research, for example a pharmaceutical
company, academic hospital, scientific organisation or investigator. A party that
provides funding for a study but does not commission it is not regarded as the
sponsor, but referred to as a subsidising party.
UFS-QoL Uterine Fibroid Symptom and Health related Quality of Life
Wbp Personal Data Protection Act (in Dutch: Wet Bescherming Persoonsgevens)
WMO Medical Research Involving Human Subjects Act (in Dutch: Wet Medisch-
wetenschappelijk Onderzoek met Mensen
ENGLISH SUMMARY
Rationale:
Patient selection and inclusion for treatment of uterine fibroids with MR-HIFU is worldwide still in
progress. Results of the MR-HIFU treatment show a large variety in volume- and symptom-reduction.
Knowledge of MRI based predictors of success prior to treatment, may contribute to an optimization
of patient selection, treatment planning and treatment outcomes.
Objective:
We are looking for MRI determinants to determine patient suitability for a successful treatment of
symptomatic uterine fibroids using MR-HIFU. Also, we want to eliminate the use of an intravenous
contrast agent. Therefor we want to determine the feasibility of 3 MRI parameters to monitor
thermal ablation effects.
Study design:
The proposed research will concern a single-center research, performed on the departments of
gynecology and radiology. Fifty patients will be included in this study. Patients undergoing MR-HIFU
treatment within the clinical trial, will additionally undergo three extra MRI sequences and are asked
to fulfill the UFS-QoL four times. Also, a patient satisfactory survey is held for the new introduced
MR-HIFU treatment.
Study population:
The study population consists of women, diagnosed with a uterine fibroid and presenting uterine
fibroid related symptoms willing to undergo MR-HIFU treatment. All gynecological and MRI in-
/exclusion criteria must be met.
Main study parameters/endpoints:
The main study parameter is regression analysis to find MRI determinants for a clinical successful
treatment. MRI parameters are ADC values, quantitative T2 value and ktrans values.
Nature and extent of the burden and risks associated with participation, benefit and group
relatedness:
Patients included in this study will undergo three extra MRI sequences during MRI examination. Also
the patients are asked to fulfill the UFS-QoL questionnaire four times. The additional MRI sequences
have no additional risks compared to the standard MRI protocol.
NEDERLANDSE SAMENVATTING
Rationale:
Patiënt selectie en inclusie voor de behandeling van uterus myomen met MR-HIFU is wereldwijd een
belangrijk onderzoeksgebied. De resultaten van de MR-HIFU behandeling laten een grote variëteit
zien in volume- en symptoom reductie. Kennis van MRO gebaseerde succesvoorspellers vóór
behandeling kunnen bijdragen aan een optimalisatie van patiënt selectie, behandelingsplanning en
behandelresultaten.
Doelstelling:
We zijn op zoek naar MRI determinanten om de patiënt-geschiktheid voor een succesvolle MR-HIFU
behandeling te bepalen. Ook willen we het gebruik van intraveneus contrastmiddel proberen te
elimineren. Daarvoor bepalen we de mogelijkheden van drie MRI-parameters om de thermale ablatie
effecten (en daarmee het behandeleffect) te monitoren.
Studie opzet:
Het voorgestelde onderzoek zal een single-center onderzoek zijn, uitgevoerd op de afdelingen
gynaecologie en radiologie. Vijftig patiënten zullen worden geïncludeerd. Patiënten die een MR-HIFU
behandeling zullen ondergaan in studie verband, zullen drie extra MRI sequenties ondergaan. Ook
worden ze gevraagd vier keer de UFS-QoL vragenlijst in te vullen en daarbij één keer een patiënt
tevredenheidsonderzoek.
Studie populatie:
De studie populatie bestaat uit vrouwen, gediagnosticeerd met een uterus myoom, bekend met
myoom gerelateerde klachten en bereid om een MR-HIFU behandeling te ondergaan. De patiënten
moeten voldoen aan alle gynaecologische en MRI in-/exclusie criteria.
Belangrijkste studie parameter/eindpunt:
De belangrijkste studie parameter is de regressie analyse om zo MRI determinanten te vinden voor
een klinisch succesvolle behandeling. De MRI parameters zijn: ADC, kwantitatieve T2 en ktrans.
Aard en omvang van de lasten en risico’s verbonden aan deelname:
Patiënten die worden geïncludeerd zullen drie extra MRI sequenties ondergaan. Deze drie sequenties
geven geen additionele risico’s bovenop het standaard protocol. Ook wordt aan de patiënten
gevraagd om de UFS-QoL vragenlijst viermaal in te vullen.
INTRODUCTION AND RATIONALE
Uterine fibroids are the most common benign gynecological tumors affecting a high percentage of
women. Symptoms of uterine fibroids are abnormal uterine bleeding and pelvic discomfort due to
the existing mass, leading to a significant negative effect on the quality of life. Treatment possibilities
include drug therapy, hysterectomy, myomectomy, uterine artery embolization and recently
magnetic resonance guided “High Intensity Focused Ultrasound” (MR-HIFU).
Surgical approaches often go along with complications, longer hospital stays and longer recovery
times. The advantages of the minimally invasive MR-HIFU treatment are a lower morbidity, no need
for general anesthesia, no radiation exposure, low probability of bleeding and infection and short
recovery times. Patients return to work approximately 24 hours after treatment1.
Thermal ablation using MR-HIFU allows for a non-invasive treatment of uterine fibroids by selective
tissue heating. The heat generating possibilities of ultrasound are combined with the imaging
capabilities of MRI. The MRI facilitates in treatment planning, thermometry for real-time
temperature feedback during the treatment and for evaluation of treatment outcome. The energy of
the focused ultrasound causes heating of the tissue on the focal spot to locally induce coagulative
necrosis, while the surrounding tissue remains unaffected. In figure 1, a schematic view of the MR-
HIFU system is shown. The ultrasound transducer is incorporated in the MRI table, on which the
patients lies in prone position during the treatment.
Figure 18: MR HIFU system
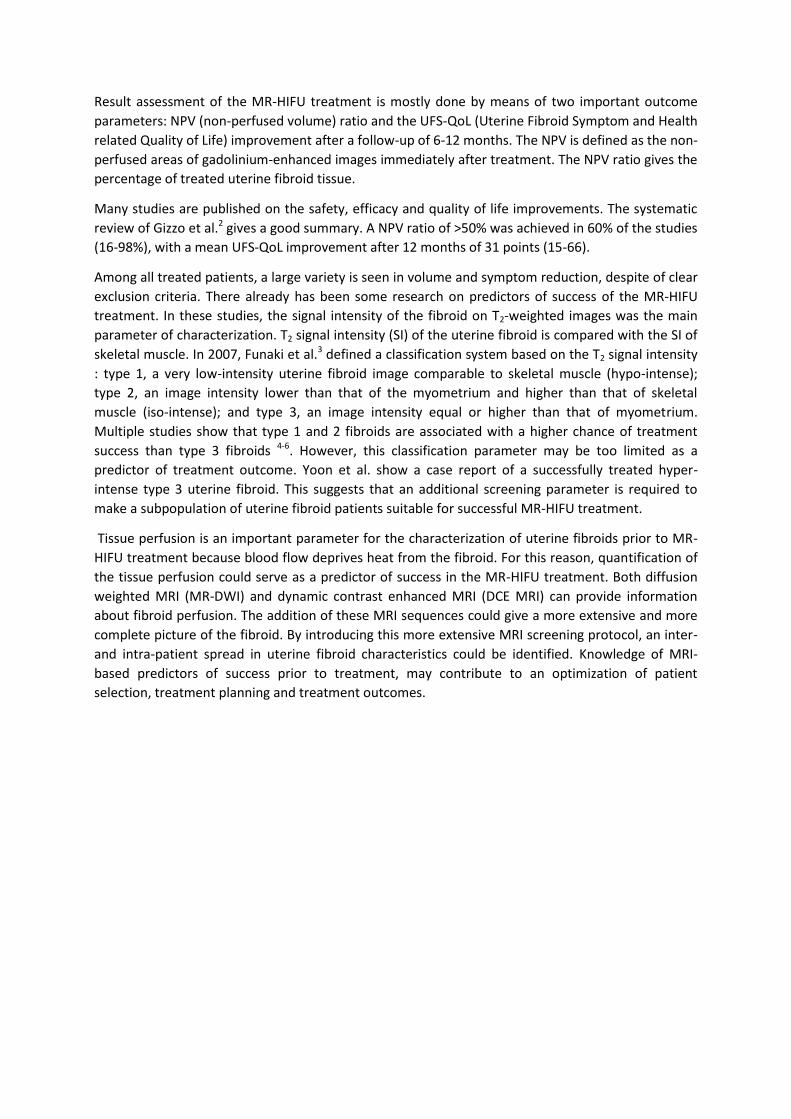
Result assessment of the MR-HIFU treatment is mostly done by means of two important outcome
parameters: NPV (non-perfused volume) ratio and the UFS-QoL (Uterine Fibroid Symptom and Health
related Quality of Life) improvement after a follow-up of 6-12 months. The NPV is defined as the non-
perfused areas of gadolinium-enhanced images immediately after treatment. The NPV ratio gives the
percentage of treated uterine fibroid tissue.
Many studies are published on the safety, efficacy and quality of life improvements. The systematic
review of Gizzo et al.2 gives a good summary. A NPV ratio of >50% was achieved in 60% of the studies
(16-98%), with a mean UFS-QoL improvement after 12 months of 31 points (15-66).
Among all treated patients, a large variety is seen in volume and symptom reduction, despite of clear
exclusion criteria. There already has been some research on predictors of success of the MR-HIFU
treatment. In these studies, the signal intensity of the fibroid on T2-weighted images was the main
parameter of characterization. T2 signal intensity (SI) of the uterine fibroid is compared with the SI of
skeletal muscle. In 2007, Funaki et al.3 defined a classification system based on the T2 signal intensity
: type 1, a very low-intensity uterine fibroid image comparable to skeletal muscle (hypo-intense);
type 2, an image intensity lower than that of the myometrium and higher than that of skeletal
muscle (iso-intense); and type 3, an image intensity equal or higher than that of myometrium.
Multiple studies show that type 1 and 2 fibroids are associated with a higher chance of treatment
success than type 3 fibroids 4-6. However, this classification parameter may be too limited as a
predictor of treatment outcome. Yoon et al. show a case report of a successfully treated hyper-
intense type 3 uterine fibroid. This suggests that an additional screening parameter is required to
make a subpopulation of uterine fibroid patients suitable for successful MR-HIFU treatment.
Tissue perfusion is an important parameter for the characterization of uterine fibroids prior to MR-
HIFU treatment because blood flow deprives heat from the fibroid. For this reason, quantification of
the tissue perfusion could serve as a predictor of success in the MR-HIFU treatment. Both diffusion
weighted MRI (MR-DWI) and dynamic contrast enhanced MRI (DCE MRI) can provide information
about fibroid perfusion. The addition of these MRI sequences could give a more extensive and more
complete picture of the fibroid. By introducing this more extensive MRI screening protocol, an inter-
and intra-patient spread in uterine fibroid characteristics could be identified. Knowledge of MRI-
based predictors of success prior to treatment, may contribute to an optimization of patient
selection, treatment planning and treatment outcomes.
OBJECTIVES
Primary Objective:
We are looking for MRI determinants to better determine patient suitability for a successful
treatment of symptomatic uterine fibroids using MR-HIFU. A successful treatment is determined as a
symptom reduction of minimal 10 points on the UFS-QoL questionnaire.
The possible MRI determinants are that can predict treatment outcome, are:
ADC value
Quantitative T2 value
ktrans
Secondary Objective(s):
Because we want to eliminate the use of an intravenous contrast agent, we are looking for a
functional MRI parameter that is capable of measuring the treated tissue. Therefore, the secondary
objective of this study is to determine the feasibility of ADC mapping, T2 mapping and DCE in
monitoring thermal ablation effects from MR-HIFU in the treatment of uterine fibroids.
STUDY DESIGN
Data collection and experiments are performed in the Isala Zwolle. Patient inclusion is the
responsibility of the gynecology department. Imaging and treatment are performed on the radiology
department.
The flow-chart on page 12 shows the course of events. All new patients presenting with fibroid
related symptoms on the gynecology department are registered in the database with the aim to
chart the total patient population in the Isala. Based on the in-/exclusion criteria as further described
in section 4.2 and 4.3, only a selective patient group will undergo the screening MRI. Patients
excluded for the screening MRI can start directly with the conventional treatment path on the
gynecology department.
Patients that meet the inclusion criteria, undergo a screening MRI. After this screening MRI, again in-
and exclusion criteria apply to further determine HIFU treatment eligibility. Patients that meet all
criteria will be informed about the MR HIFU treatment and once given informed consent will undergo
treatment. At baseline (t=0), the UFS-QoL score is measured by means of an online questionnaire.
Follow-up consists of visits at the gynecologist’s office, and MRI and the UFS-QoL questionnaire is
repeated.
Because the MR-HIFU treatment is a new introduced treatment option in the Isala Hospital, patient
satisfactory surveys are held after treatment. The survey is included in the appendix. It will be
digitally send to the treated patients by Research Manager.
Relation to the MASS I study
In the MASS I study, a screenings MRI is made of patients potentially suitable for MR-HIFU treatment.
This screening MRI is the same as the protocol that will be used in the MASS II study. Therefore,
patients can be included in the MASS I as well as the MASS II study. The MASS I study does not have
to be completed in order to start the MASS II study.

General practitioner
Gynaecology department
Label patient Anamnesis: are the
symptoms uterine fibroid related?
Vaginal ultrasonography MRI contra-indications
1st shift in-/exclusion criteria
Conventional treatment gynaecologist
Exclusion
Screening MRIInclusion
MR HIFU protocol, conventional anatomic sequences and functional research sequences
2nd shift in-/exclusion criteriaExclusion
UFS-QoL questionnaire
Inclusion
MR-HIFU treatment
t = 0
Follow-up at department of gynaecology
t = 1,6 and 12 months
MRI Follow Up
t = 6 months
UFS-QoL questionnaire
t = 3 , 6 and 12 months
STUDY POPULATION
Population (base)
All new patients presenting with uterine fibroid related symptoms on the department of
gynecology at Isala are included in the study database. In most cases, these patients will be
referred by their general practitioner for a consult on the gynecology department. For MRI
screening in preparation of the MR-HIFU treatment, only patients meeting the in-/exclusion
criteria based on physical examination and vaginal ultrasonography are concerned as candidates.
Inclusion criteria
For MRI screening inclusion, the following criteria are applied based on anamnesis, physical
examination and vaginal ultrasonography:
18 – 59 years old
Uterine fibroid related symptoms
Pre- or perimenopausal
To determine whether the patient is eligible for the MR-HIFU treatment after the screening MRI,
the following inclusion criteria are used.
Type 1 & 2 uterine fibroids (based on Funaki classification)
Diameter of 1-10 cm of dominant fibroid
Exclusion criteria
Exclusion criteria for the MRI screening, based on anamnesis, physical examination and vaginal
ultrasonography, are defined as follows:
Post-menopausal
Wish for future fertility
Pregnancy
Severe abdominal obesity or BMI > 40
Uterine artery embolization in medical history
MRI contra-indications
Calcifications in uterine fibroid
To determine whether the patient is eligible for the MR-HIFU treatment after screening MRI, the
following exclusion criteria are used.
Type 3 uterine fibroids (based on Funaki classification)
Calcified or pedunculated uterine fibroids
Close to sciatic nerve or sacrum
Interposition of bowel or ovary
Diameter of < 1 cm or > 10 cm
Distance skin – uterine fibroid > 12 cm
METHODS
Study parameters/endpoints
Main study parameter/endpoint
The main study endpoint is the symptom reduction measured with the Uterine Fibroid
Symptom and Health related Quality of Life questionnaire (UFS-QoL) to measure the clinical
efficacy of the MR-HIFU treatment. Since uterine fibroids are benign, symptom reduction is
the most important outcome in the treatment of uterine fibroids. The UFS-QoL is a
standardized, worldwide accepted and used questionnaire to measure the specific
symptoms caused by uterine fibroids. Based on literature, a symptom reduction of 10
points on the UFS-QoL is proven clinically efficient. The number of treated patients
minimally compassing this 10 point reduction are seen as clinical efficient treatments.
Secondary study parameters/endpoints
Second study parameter is the non-perfused volume (NPV) ratio. Just like the UFS-QoL
symptom reduction score, this parameter assesses the clinical efficacy of the MR-HIFU
treatment. The NPV represent the tissue undergoing successful ablation, measured directly
after the total treatment.
Randomisation, blinding and treatment allocation
Not applicable
Study procedures
Patients presenting with uterine fibroid related symptoms at the department of
gynaecology will undergo standard consultation, physical examination and vaginal
ultrasonography.
When the inclusion criteria (section 4.2) are met, the screening MRI will be scheduled as
soon as possible. After informed consent, patients also are asked to complete the Uterine
Fibroid Symptom and Health related Quality of Life questionnaire (UFS-QoL). The UFS-QoL
is a validated, disease-specific questionnaire.
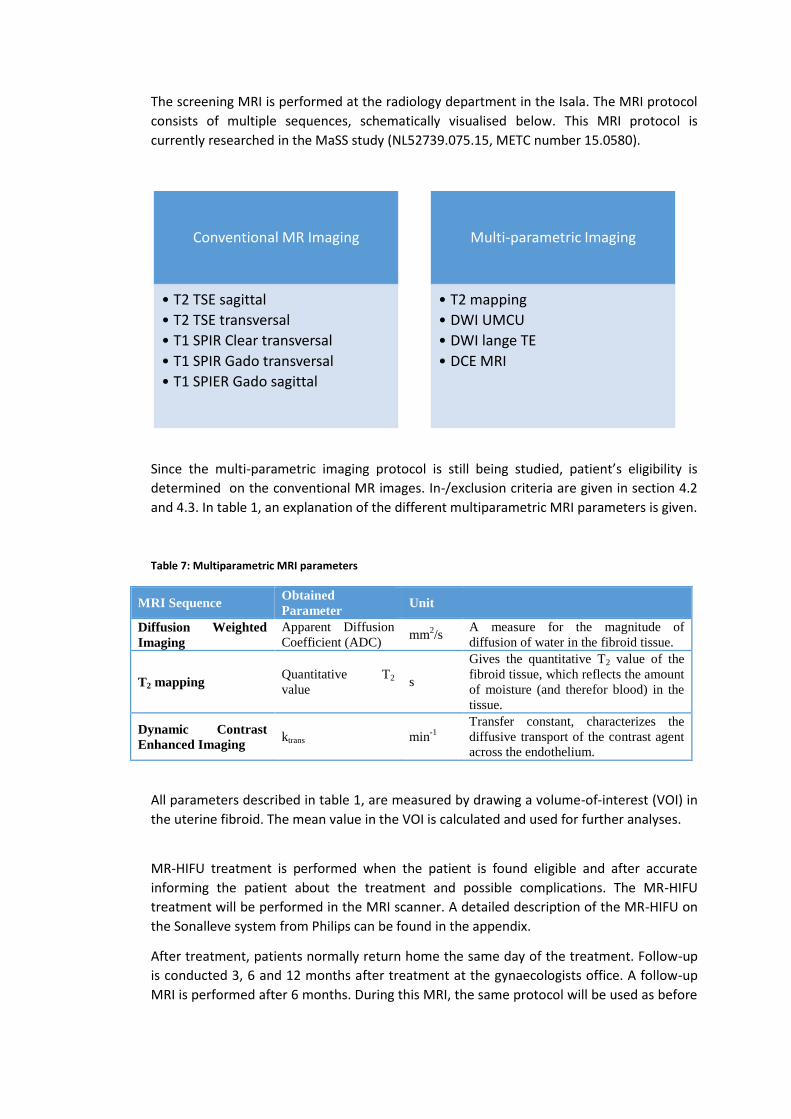
The screening MRI is performed at the radiology department in the Isala. The MRI protocol
consists of multiple sequences, schematically visualised below. This MRI protocol is
currently researched in the MaSS study (NL52739.075.15, METC number 15.0580).
Since the multi-parametric imaging protocol is still being studied, patient’s eligibility is
determined on the conventional MR images. In-/exclusion criteria are given in section 4.2
and 4.3. In table 1, an explanation of the different multiparametric MRI parameters is given.
Table 7: Multiparametric MRI parameters
MRI Sequence Obtained
Parameter Unit
Diffusion Weighted
Imaging
Apparent Diffusion
Coefficient (ADC) mm
2/s
A measure for the magnitude of
diffusion of water in the fibroid tissue.
T2 mapping Quantitative T2
value s
Gives the quantitative T2 value of the
fibroid tissue, which reflects the amount
of moisture (and therefor blood) in the
tissue.
Dynamic Contrast
Enhanced Imaging ktrans min
-1
Transfer constant, characterizes the
diffusive transport of the contrast agent
across the endothelium.
All parameters described in table 1, are measured by drawing a volume-of-interest (VOI) in
the uterine fibroid. The mean value in the VOI is calculated and used for further analyses.
MR-HIFU treatment is performed when the patient is found eligible and after accurate
informing the patient about the treatment and possible complications. The MR-HIFU
treatment will be performed in the MRI scanner. A detailed description of the MR-HIFU on
the Sonalleve system from Philips can be found in the appendix.
After treatment, patients normally return home the same day of the treatment. Follow-up
is conducted 3, 6 and 12 months after treatment at the gynaecologists office. A follow-up
MRI is performed after 6 months. During this MRI, the same protocol will be used as before
Conventional MR Imaging
• T2 TSE sagittal
• T2 TSE transversal
• T1 SPIR Clear transversal
• T1 SPIR Gado transversal
• T1 SPIER Gado sagittal
Multi-parametric Imaging
• T2 mapping
• DWI UMCU
• DWI lange TE
• DCE MRI
the treatment. Also, the UFS-QoL questionnaire is taken after 3, 6 and 12 months to
monitor symptom relief.
Withdrawal of individual subjects
Subjects can leave the study at any time for any reason if they wish to do so without any
consequences. The investigator can decide to withdraw a subject from the study for urgent
medical reasons.
Replacement of individual subjects after withdrawal
Not applicable
Follow-up of subjects withdrawn from treatment
Not applicable
Premature termination of the study
We do not expect a premature termination of the study, as the MR-HIFU Sonalleve system
is a dedicated technique with a CE mark for the treatment of uterine fibroids. Also, MRI
with the use of a contrast agent has no serious expected complications or adverse events.
SAFETY REPORTING
Section 10 WMO event
In accordance to section 10, subsection 1, of the WMO, the investigator will inform the subjects
and the reviewing accredited METC if anything occurs, on the basis of which it appears that the
disadvantages of participation may be significantly greater than was foreseen in the research
proposal. The study will be suspended pending further review by the accredited METC, except
insofar as suspension would jeopardise the subjects’ health. The investigator will take care that
all subjects are kept informed.
Adverse events (AEs) and Serious adverse events (SAEs)
Adverse events (AEs)
Adverse events are defined as any undesirable experience occurring to a subject during the
study, whether or not considered related to the screening MRI as described in this protocol.
All adverse events reported spontaneously by the subject or observed by the investigator or
his staff will be recorded.
Serious adverse events (SAEs)
A serious adverse event is any untoward medical occurrence or effect that at any dose:
- results in death;
- is life threatening (at the time of the event);
- requires hospitalisation or prolongation of existing inpatients’ hospitalisation;
- results in persistent or significant disability or incapacity;
- is a congenital anomaly or birth defect;
- Any other important medical event that may not result in death, be life threatening, or
require hospitalization, may be considered a serious adverse experience when, based upon
appropriate medical judgement, the event may jeopardize the subject or may require an
intervention to prevent one of the outcomes listed above.
The sponsor will report the SAEs through the web portal ToetsingOnline to the accredited
METC that approved the protocol, within 15 days after the sponsor has first knowledge of
the serious adverse events.
SAEs that result in death or are life threatening should be reported expedited. The
expedited reporting will occur not later than 7 days after the responsible investigator has
first knowledge of the adverse event. This is for a preliminary report with another 8 days for
completion of the report.

Annual safety report
Not applicable
Follow-up of adverse events
All AEs will be followed until they have abated, or until a stable situation has been reached.
Depending on the event, follow up may require additional tests or medical procedures as
indicated, and/or referral to the general physician or a medical specialist.
SAEs need to be reported till end of study within the Netherlands, as defined in the protocol
STATISTICAL ANALYSIS
Primary study parameter(s)
The primary study parameter are the possible MRI determinants, summarized below:
Mean ADC values, measured by diffusion weighted imaging. It is a continuous parameter, measure in mm2/s/
Quantitative T2 values, measured by T2 mapping. It is a continuous parameter measured in seconds.
Mean ktrans, measured by dynamic contrast enhanced imaging. It is a continuous parameter, measured in min-1
Each study parameter described above is a continuous variable. All parameters will be tested for
normality with the Shapiro-Wilk test. If the parameter has a normal distribution, it will be
described with the mean ± standard deviation. If the distribution is skewed, the parameter will be
described with the median and the minimum/maximal values.
For each possible determinant, a regression analysis is performed. This is a logistic regression
analysis, because the endpoint (a clinical relevant successful treatment with a symptom reduction
of minimal 10 points) is dichotome. From this regression analysis, the regression coefficient, p-
value and confidence intervals are calculated. If the p-value is smaller than 0.05, a dependency
between the determinant and a clinical relevant successful treatment is confirmed. This is done
for all 3 determinants.
If one or more of the determinants is confirmed, a multivariable regression is performed. This
could result in a useful algorithm. However, we are aware that this algorithm has to be cross
validated before use in clinical practice.
Secondary study parameter(s)
The NPV ratio and the three MRI determinants are continuous variables. All parameters will be
tested for normality with the Shapiro-Wilk test. If the parameter has a normal distribution, it will
be described with the mean ± standard deviation. If the distribution is skewed, the parameter will
be described with the median and the minimum/maximal values.
To validate of a MRI parameter can be used in order to measure the NPV, the following steps are
taken. This is done for each of the three MRI parameters.
Scatterplot, in which the MRI parameter is plotted against the golden standard (NPV)
Bland-Altman plot
The ICC is calculated
ETHICAL CONSIDERATIONS
Regulation statement
This study will be conducted in accordance with the ethical principles that have their origin in the
current Declaration of Helsinki. The study will be conducted in compliance with the
protocol. The protocol and any Amendments and the subjects Informed Consent will receive
Institutional Review Board (IRB/Independent Ethics Committee (IEC) approval/favorable opinion
prior to initiation of the study.
Recruitment and consent
Freely written informed consent will be obtained from every subject prior to study
participation, including informed consent for any screening procedures conducted to establish
subject eligibility for the study.
Benefits and risks assessment, group relatedness
Subjects meeting all inclusion criteria without meeting any exclusion criteria will be eligible for
the MR-HIFU treatment. Patients entering the MR-HIFU study do not directly benefit from study
participation in comparison to the standard MR-HIFU treatment. Risks associated with study
participation are negligible, as the additional MRI sequences have no additional risks compared
to the standard protocol.
Compensation for injury
A dispensation from the statutory obligation to provide insurance is requested.
ADMINISTRATIVE ASPECTS, MONITORING AND PUBLICATION
Handling and storage of data and documents
Research Manager is used in this study for the storage of data. For each module, specific rights
are assigned. All gynaecologists can include patients in this database. At inclusion, all patients will
be assigned a unique study number. The database which links the study number to the Isala
patients numbers is only available to coordinating investigators.
Amendments
Amendments are changes made to the research after a favourable opinion by the accredited
METC has been given. All amendments will be notified to the METC that gave a favourable
opinion.
Annual progress report
The sponsor/investigator will submit a summary of the progress of the trial to the accredited
METC once a year. Information will be provided on the date of inclusion of the first subject,
numbers of subjects included and numbers of subjects that have completed the trial, serious
adverse events/ serious adverse reactions, other problems, and amendments.
End of study report
The investigator will notify the accredited METC of the end of the study within a period of 8
weeks. The end of the study is defined as the latest patient inclusion and MRI scan.
In case the study is ended prematurely, the investigator will notify the accredited METC within 15
days, including the reasons for the premature termination.
Within one year after the end of the study, the investigator/sponsor will submit a final study
report with the results of the study, including any publications/abstracts of the study, to the
accredited METC.
10. REFERENCES
1. Stewart EA, Gostout B, Rabinovici J, Kim HS, Regan L, Tempany CM. Sustained relief of leiomyoma symptoms by using focused ultrasound surgery. Obstet Gynecol. 2007;110(2 Pt 1):279-287.
2. Gizzo S, Saccardi C, Patrelli TS, et al. Magnetic resonance-guided focused ultrasound myomectomy: Safety, efficacy,
subsequent fertility and quality-of-life improvements, a systematic review. Reprod Sci. 2014;21(4):465-476.
3. Funaki K, Fukunishi H, Funaki T, Kawakami C. Mid-term outcome of magnetic resonance-guided focused ultrasound
surgery for uterine myomas: From six to twelve months after volume reduction. Journal of minimally invasive gynecology. 2007;14(5):616-621.
4. Funaki K, Fukunishi H, Sawada K. Clinical outcomes of magnetic resonance‐guided focused ultrasound surgery for uterine
myomas: 24‐month follow‐up. Ultrasound in Obstetrics & Gynecology. 2009;34(5):584-589.
5. Machtinger R, Inbar Y, Cohen-Eylon S, Admon D, Alagem-Mizrachi A, Rabinovici J. MR-guided focus ultrasound
(MRgFUS) for symptomatic uterine fibroids: Predictors of treatment success. Human Reproduction. 2012;27(12):3425-3431.
6. Lénárd ZM, McDannold NJ, Fennessy FM, et al. Uterine leiomyomas: MR imaging–guided focused ultrasound Surgery—Imaging predictors of success 1. Radiology. 2008;249(1):187-194.
7. Kim YS, Lim HK, Kim JH, et al. Dynamic contrast-enhanced magnetic resonance imaging predicts immediate therapeutic
response of magnetic resonance-guided high-intensity focused ultrasound ablation of symptomatic uterine fibroids. Invest Radiol. 2011;46(10):639-647.
8. Yoon SW, Lee C, Kim KA, Kim SH. Contrast-enhanced dynamic MR imaging of uterine fibroids as a potential predictor
of patient eligibility for MR guided focused ultrasound (MRgFUS) treatment for symptomatic uterine fibroids. Obstet
Gynecol Int. 2010;2010:10.1155/2010/834275. Epub 2010 Aug 16.
9. Liu J, Keserci B, Yang X, et al. Volume transfer constant (K trans) maps from dynamic contrast enhanced MRI as
potential guidance for MR-guided high intensity focused ultrasound treatment of hypervascular uterine fibroids. Magn Reson Imaging. 2014;32(9):1156-1161.
10. Ikink ME, Voogt MJ, van den Bosch, Maurice AAJ, et al. Diffusion-weighted magnetic resonance imaging using
different b-value combinations for the evaluation of treatment results after volumetric MR-guided high-intensity focused ultrasound ablation of uterine fibroids. Eur Radiol. 2014;24(9):2118-2127.