Embed Size (px)
Citation preview

Dam removal as a tool for restoring fish connectivity – a literature review and field study
By
Brittany G. Sullivan
B.Sc., Carleton University, 2015
A thesis submitted to the Faculty of Graduate and Postdoctoral Affairs in partial fulfillment of
the requirements for the degree of
Master of Science
In
Biology
Carleton University
Ottawa, Ontario

i
Dedication
To my boyfriend Andrew Bond, for supporting me in all my life’s crazy adventures,
whether that be living at a biology station near Kingston, Ontario, or driving across Canada with
me to help with fish research. You have been my constant support system and have watched me
grow from an undergrad to a graduate student, that is crazy about fish. I can’t wait to see where
life takes us and I am so happy you have been by my side for every step of this journey. I also
dedicate this thesis to my parents for always encouraging me to pursue a career in a field that I
love, you have both had a huge influence on me and have shaped the determined and passionate
woman I am today.
ii
Abstract
Little is known about whether dam removal achieves fish restoration objectives. In Chapter 2, I
document the characteristics of dams that have been removed along with the methods and trends
in fish response to dam removal. In addition, this chapter provides guidance for those embarking
on dam removal projects to improve the evidence base (e.g., reliability, replicability, relevance)
so that a systematic review that advances the science will be possible in the future. In Chapter 3,
I document the effectiveness of a nature-like fishway in supporting up- and down- stream
movement of a threatened salmonid, bull trout (Salvelinus confluentus) in Forty Mile Creek,
Banff National Park. This chapter explores the biotic and abiotic factors influencing the
probability of fish to approach and pass through the fishway as well as passage duration. This
information will expand our understanding on system connectivity as a whole by combining both
dam removal and fishway research together.

iii
Acknowledgements
First, I would like to thank Steven Cooke and Mark Taylor for providing me with this
incredible research opportunity, and continually supporting me with all aspects of my research.
This thesis would not have been possible without help from both field assistants and Parks
Canada employees. Specifically, I would like to thank Taylor Ward, Shannon Clarke, Chris
Carli, Colby Whelan, Brenna Stanford, Kayla Eykelboom, Fonya Irvine and Hedin Nelson-
Chorney for assistance in the field and always being great team players. I would also like to
acknowledge Mark Taylor, Robert Lennox, Lee Gutowsky and Phil Harrison for helping me
tackle this new world called “R”, whether that be with coding advice or providing ideas for
statistical analysis, it was greatly appreciated. Approval for animal care was administered from
the Canadian Council for Animal Care through Carleton University. Funding for this thesis was
provided by Parks Canada. Additional financial and technical support was provided from
Carleton University.
iv
Co-Authorship
Chapter 2. Approaches for investigating the effects of dam removal for achieving fish
restoration objectives: building the evidence base by improving the science. Brittany Sullivan,
Steven Cooke.
While this study is my own, the research was undertaken as part of a collaborative effort
with Dr. Cooke. The project was conceived by Sullivan and Cooke. Data were extrapolated by
Sullivan. All figure construction and analyses were conducted by Sullivan. Data were interpreted
by Sullivan and Cooke. All writing was conducted by Sullivan. Cooke also provided comments
and feedback on the manuscript. This manuscript has been prepared for submission to the
Journal of Ecological Engineering.
Chapter 3. Bull trout (Salvelinus confluentus) passage behaviour at a nature-like fishway
following a partial dam removal in a national protected area. Brittany Sullivan, Chris Carli,
Taylor Ward, Robert Lennox, Mark Taylor, Steven Cooke.
While this study is my own, the research was undertaken as part of a collaborative effort
and each co-author played a role in its completion. The project was conceived by Sullivan,
Taylor and Cooke. Data were collected by Sullivan, Carli and Ward. The figures were
constructed by Sullivan with the assistance of Phil Harrison and Lee Gutowsky. The map of the
study area was constructed by Carli. Data interpretation and analysis were conducted by Sullivan
with direction from Taylor, Lennox and Cooke. All writing was conducted by Sullivan. All co-
authors provided comments and feedback on the manuscript. This manuscript has been prepared
for submission to River Research and Applications.

v
Table of Contents
Dedication .............................................................................................................................................. i
Abstract .................................................................................................................................................ii
Acknowledgements ............................................................................................................................ iii
Co-Authorship...................................................................................................................................... iv
Table of Contents .................................................................................................................................. v
List of Figures .....................................................................................................................................vii
List of Tables ....................................................................................................................................... ix
Chapter 1: General Introduction ..................................................................................................... 1
Chapter 2: Approaches for investigating the effects of dam removal for achieving
restoration objectives: building the evidence base by improving the science ........................... 3
2.1 Abstract ....................................................................................................................................... 3
2.2 Introduction ................................................................................................................................. 4
2.3 Methods ....................................................................................................................................... 5
2.3.1 Key words for primary literature search............................................................................. 6
2.3.2 Electronic Database selection ............................................................................................. 6
2.3.3 Primary and Grey Literature Selection for Review ........................................................... 7
2.3.4 How metrics were identified ............................................................................................... 7
2.4 Analysis and Discussion ............................................................................................................ 8
2.4.1 Characteristics of dams that have been removed ............................................................... 8
2.4.2 How fish response has been quantified for dam removals .............................................. 11
2.4.3 General trends .................................................................................................................... 13
2.4.4 Practical Considerations for Study Design ...................................................................... 20
2.4.5 Conclusion.......................................................................................................................... 22
2.5 Figures ....................................................................................................................................... 24
2.6 Tables ........................................................................................................................................ 26
Chapter 3: Bull trout (Salvelinus confluentus) passage behaviour at a nature-like fishway
following a partial dam removal in a national protected area .................................................. 27
3.1 Abstract ..................................................................................................................................... 27
3.2 Introduction ............................................................................................................................... 28
3.3 Methods ..................................................................................................................................... 31
3.3.1 Study Site ........................................................................................................................... 31
3.3.2 Experimental Design ......................................................................................................... 31

vi
3.3.3 Data Analysis ..................................................................................................................... 34
3.3.4 Statistical Analysis............................................................................................................. 36
3.4 Results ....................................................................................................................................... 38
3.5 Discussion ................................................................................................................................. 40
3.6 Figures ....................................................................................................................................... 45
3.7 Tables ........................................................................................................................................ 51
Chapter 4: General Discussion ....................................................................................................... 54
4.1 Findings and Implications ........................................................................................................ 54
4.2 Future Directions ...................................................................................................................... 55
4.3 Conclusion ................................................................................................................................ 56
References ........................................................................................................................................... 57
vii
List of Figures
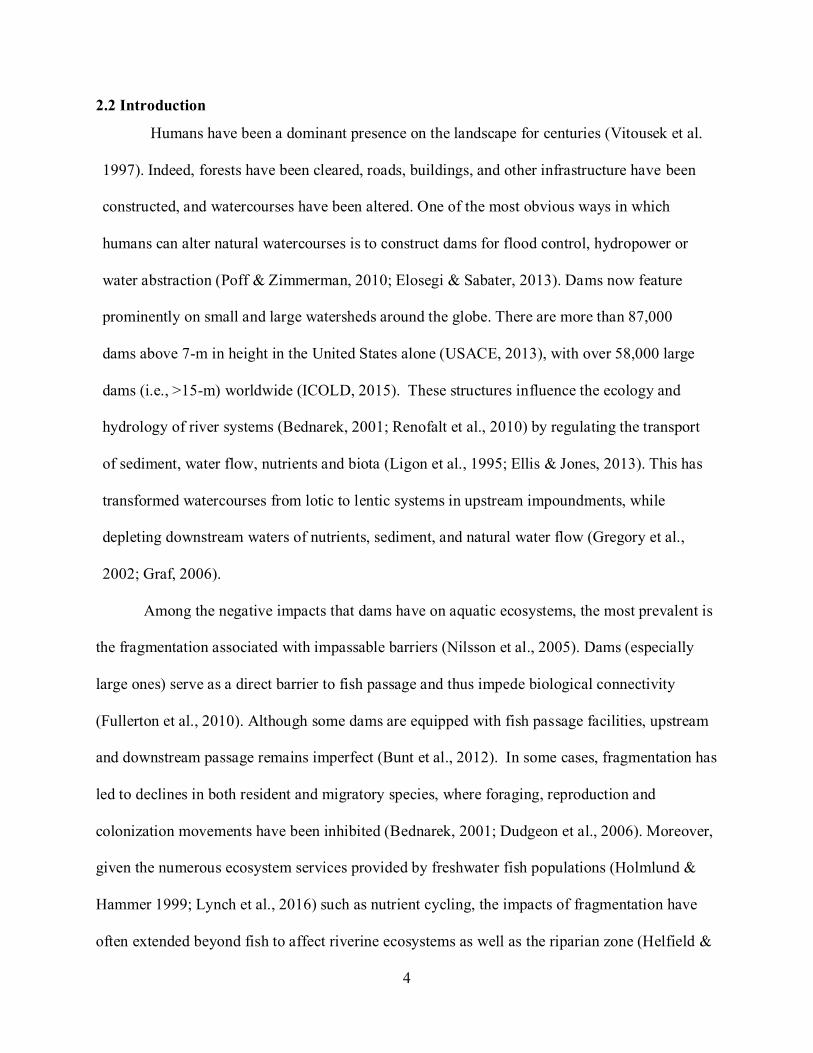
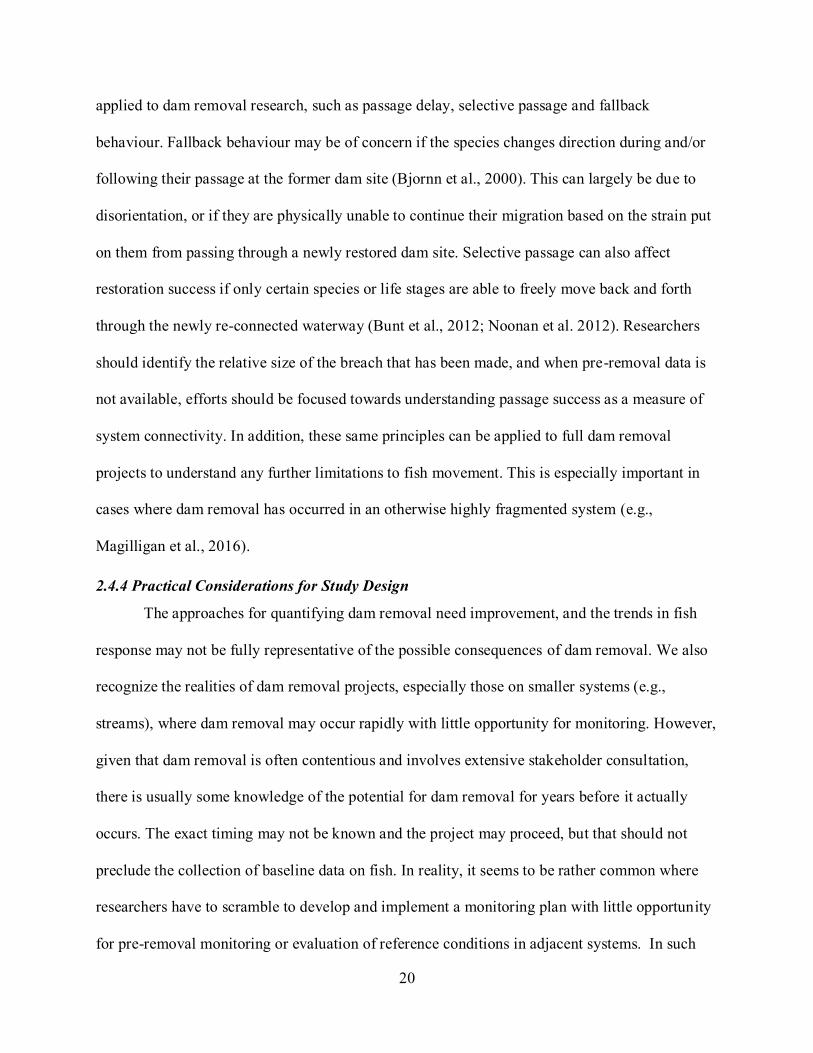
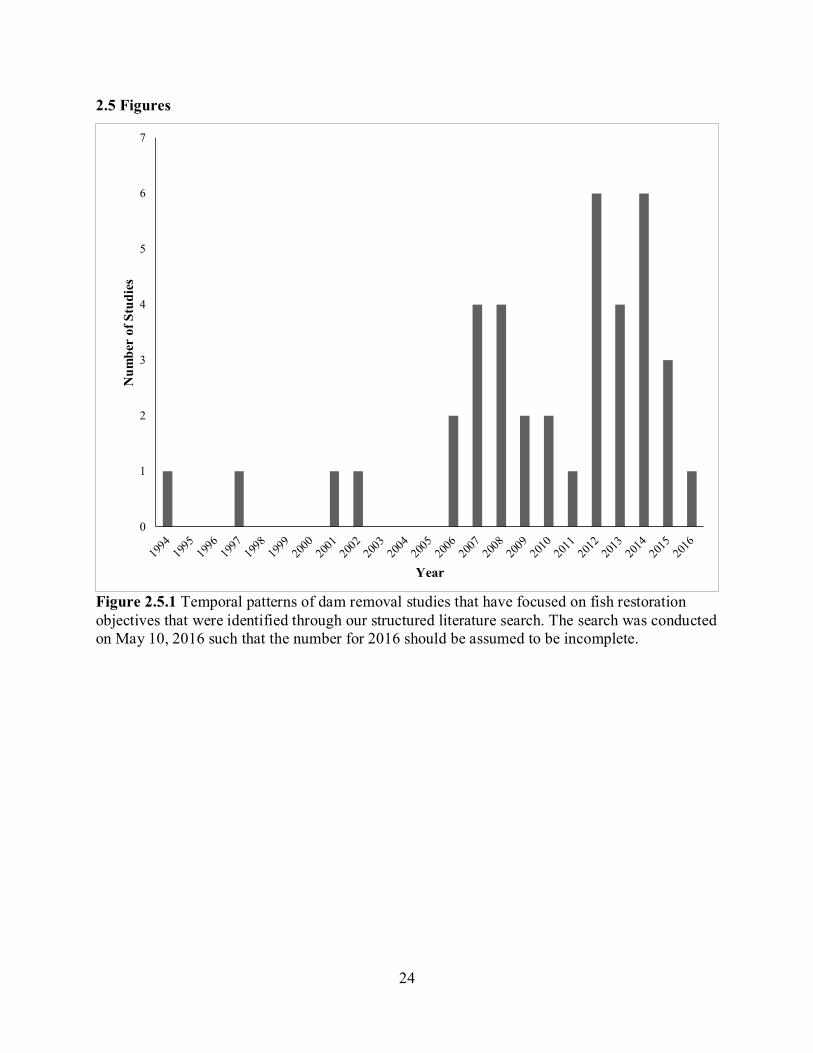
Figure 2.5.1 Temporal patterns of dam removal studies that have focused on fish restoration
objectives that were identified through our structured literature search. The search was conducted
on May 10, 2016 such that the number for 2016 should be assumed to be incomplete.
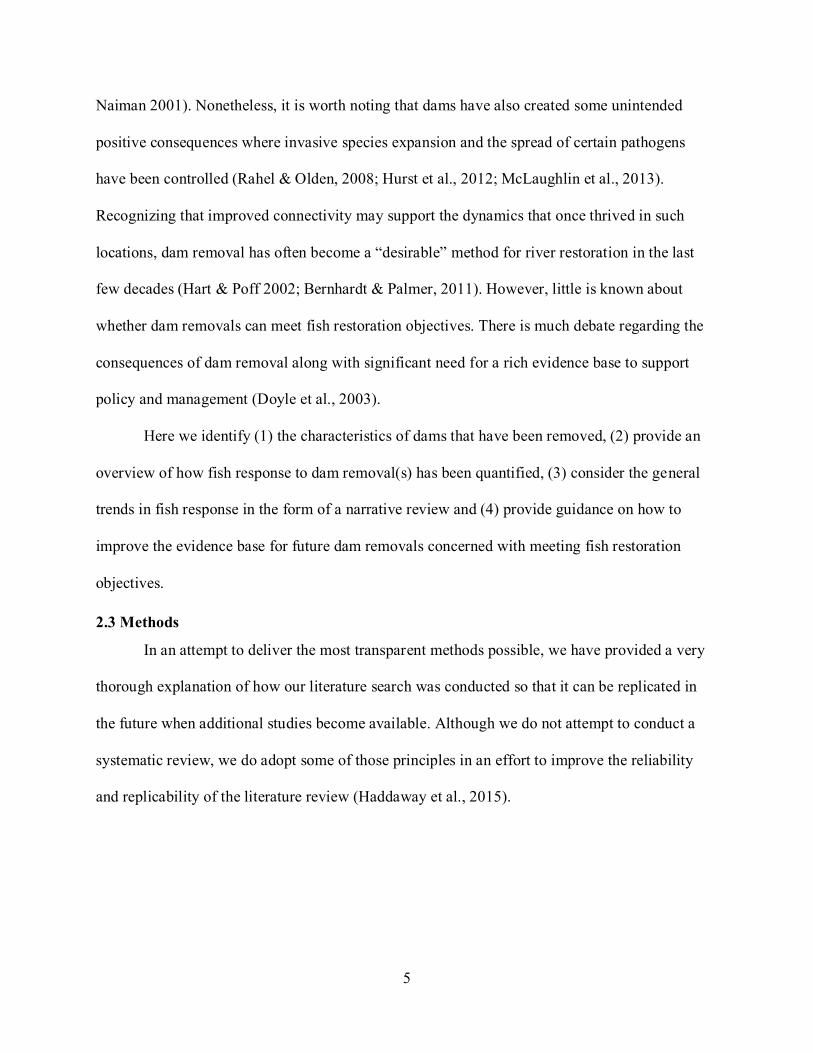
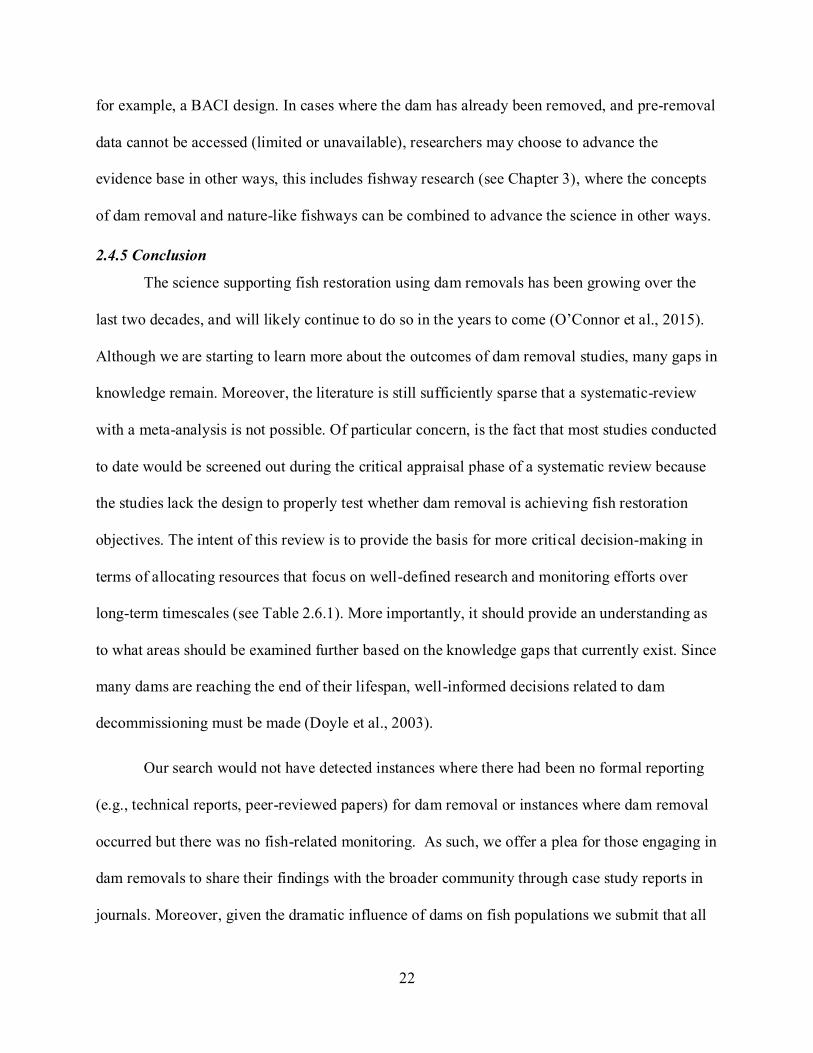
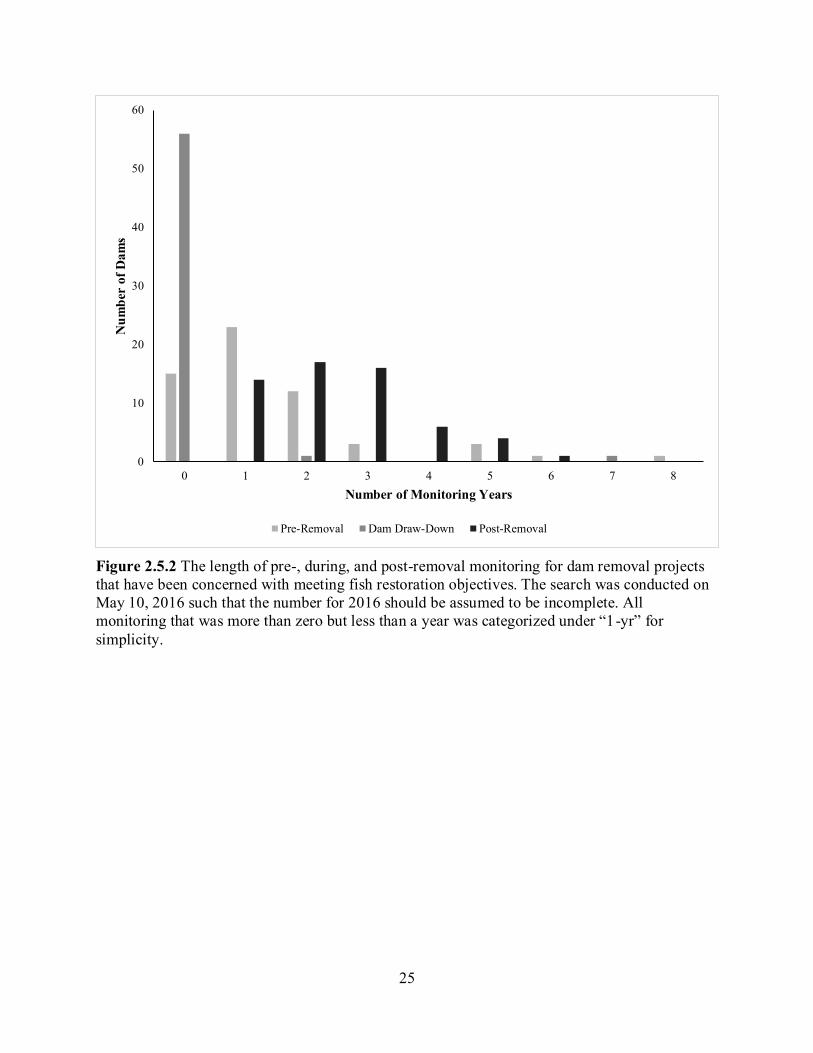
Figure 2.5.2 The length of pre-, during, and post-removal monitoring for dam removal projects
that have been concerned with meeting fish restoration objectives. The search was conducted on
May 10, 2016 such that the number for 2016 should be assumed to be incomplete. All
monitoring that was more than zero but less than a year was categorized under “1-yr” for
simplicity.
Figure 3.6.1 Schematic drawing of nature-like fishway in Forty Mile Creek, Banff National
Park, the upstream entrance of the fishway is characterized by 11 evenly spaced baffles to
control flow and reduce potential bank erosion, the interior of the fishway and downstream
entrance are characterized by natural rocky substrate (e.g., cobble, boulders). Fixed receiver
stations are represented by antennas at the up- and down- stream entrance of the fishway. The
two antennas depicted at the upstream entrance account for one fixed receiver station, whereas
the single antenna at the downstream entrance accounts for a second fixed receiver station.
Figure 3.6.2 Radio telemetry fixed receiver stations along Forty Mile Creek in Banff National
Park. S3 represents the site of the nature-like fishway, S4 and S2 are stations positioned 2-km
up- and down- stream of the fishway respectively, while S1 and S5 are 6-km up- and
downstream of the fishway respectively.
viii
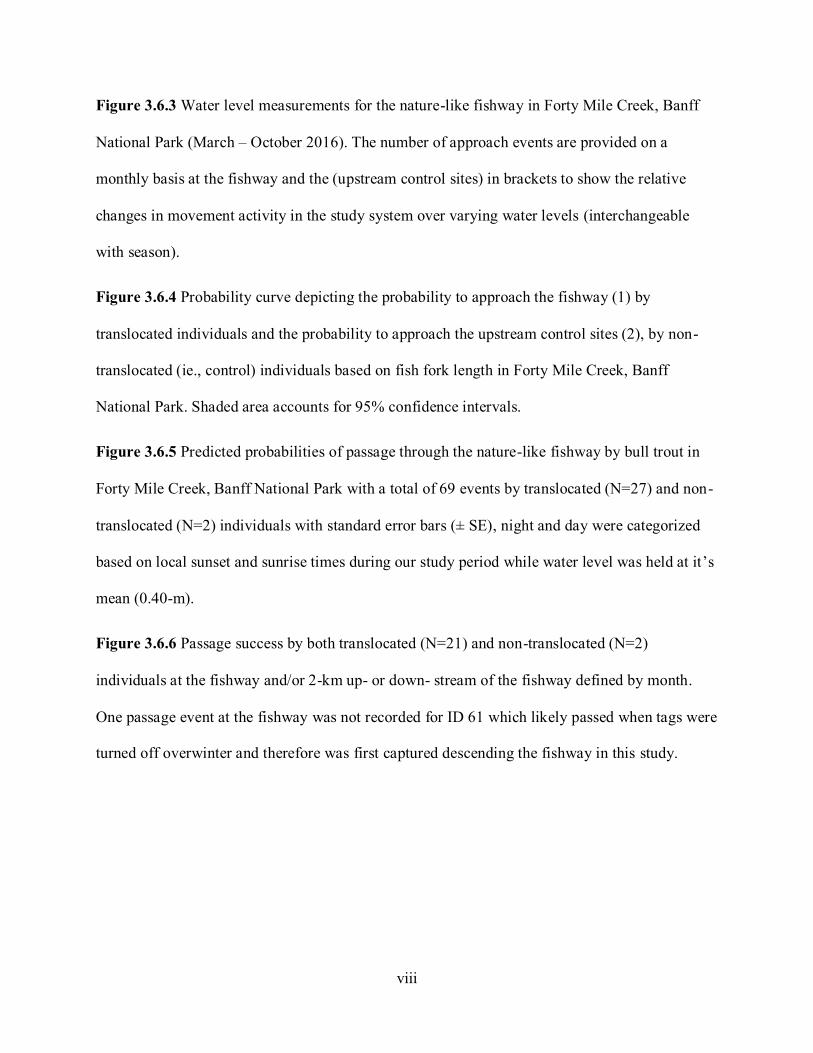
Figure 3.6.3 Water level measurements for the nature-like fishway in Forty Mile Creek, Banff
National Park (March – October 2016). The number of approach events are provided on a
monthly basis at the fishway and the (upstream control sites) in brackets to show the relative
changes in movement activity in the study system over varying water levels (interchangeable
with season).
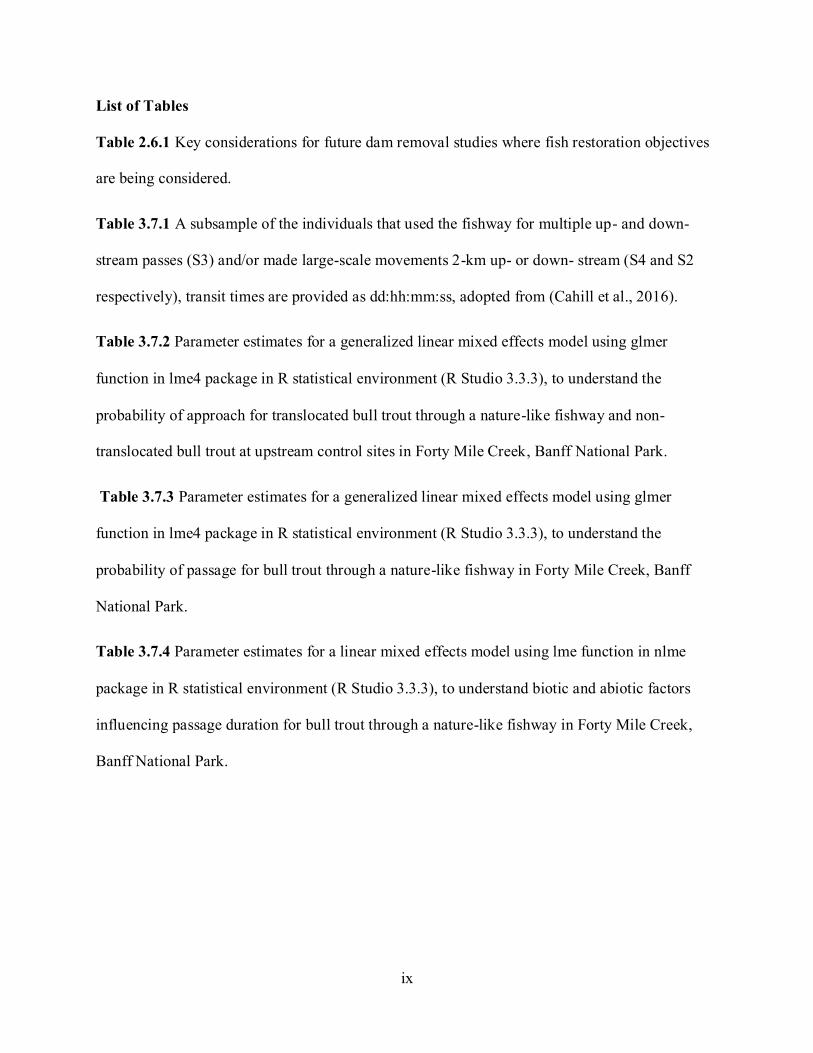
Figure 3.6.4 Probability curve depicting the probability to approach the fishway (1) by
translocated individuals and the probability to approach the upstream control sites (2), by non-
translocated (ie., control) individuals based on fish fork length in Forty Mile Creek, Banff
National Park. Shaded area accounts for 95% confidence intervals.
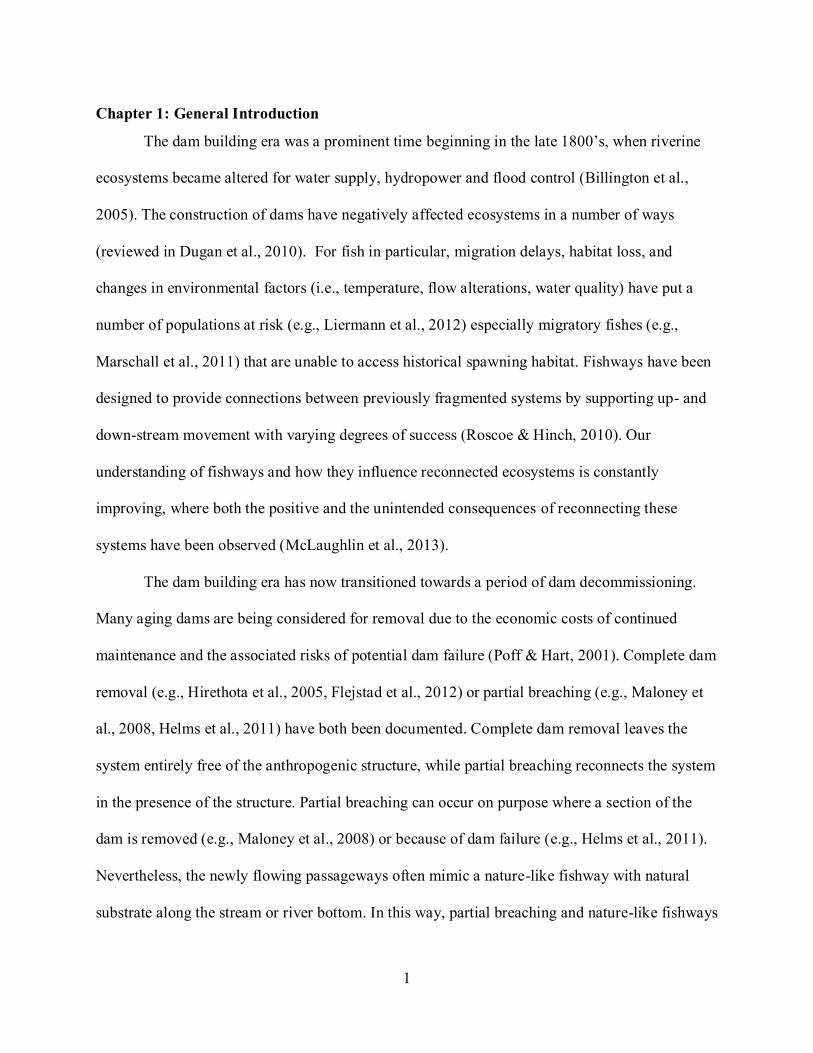
Figure 3.6.5 Predicted probabilities of passage through the nature-like fishway by bull trout in
Forty Mile Creek, Banff National Park with a total of 69 events by translocated (N=27) and non-
translocated (N=2) individuals with standard error bars (± SE), night and day were categorized
based on local sunset and sunrise times during our study period while water level was held at it’s
mean (0.40-m).
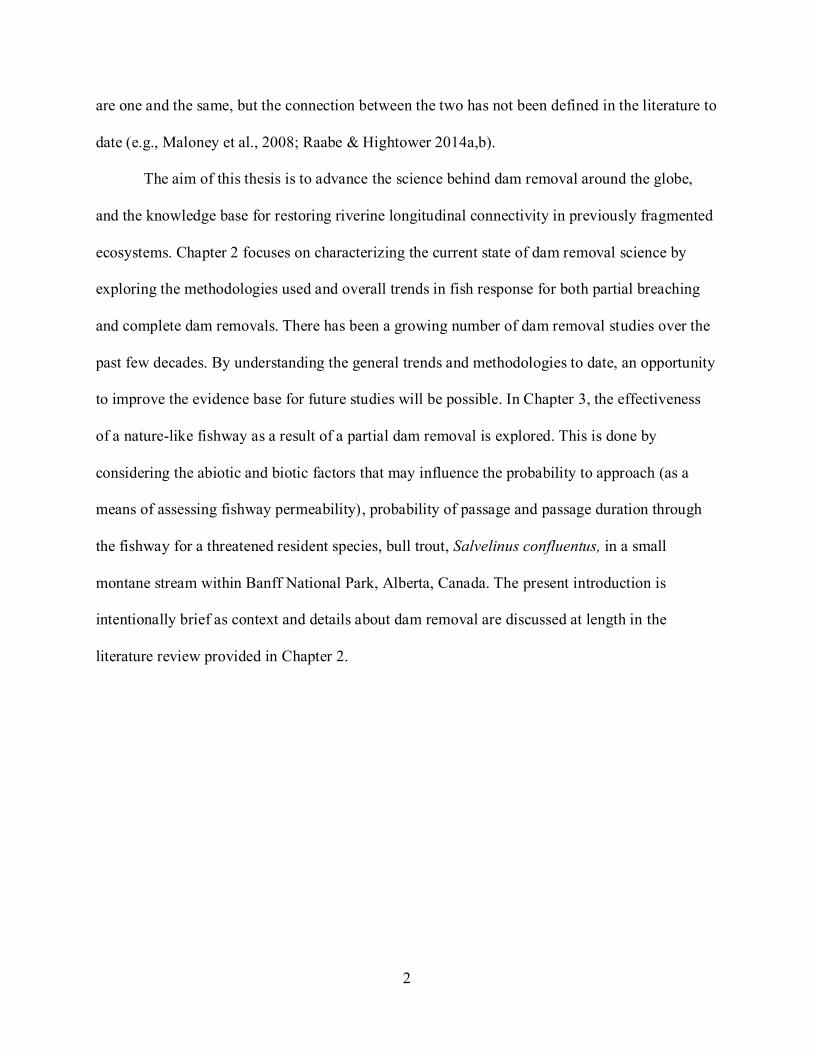
Figure 3.6.6 Passage success by both translocated (N=21) and non-translocated (N=2)
individuals at the fishway and/or 2-km up- or down- stream of the fishway defined by month.
One passage event at the fishway was not recorded for ID 61 which likely passed when tags were
turned off overwinter and therefore was first captured descending the fishway in this study.
ix
List of Tables
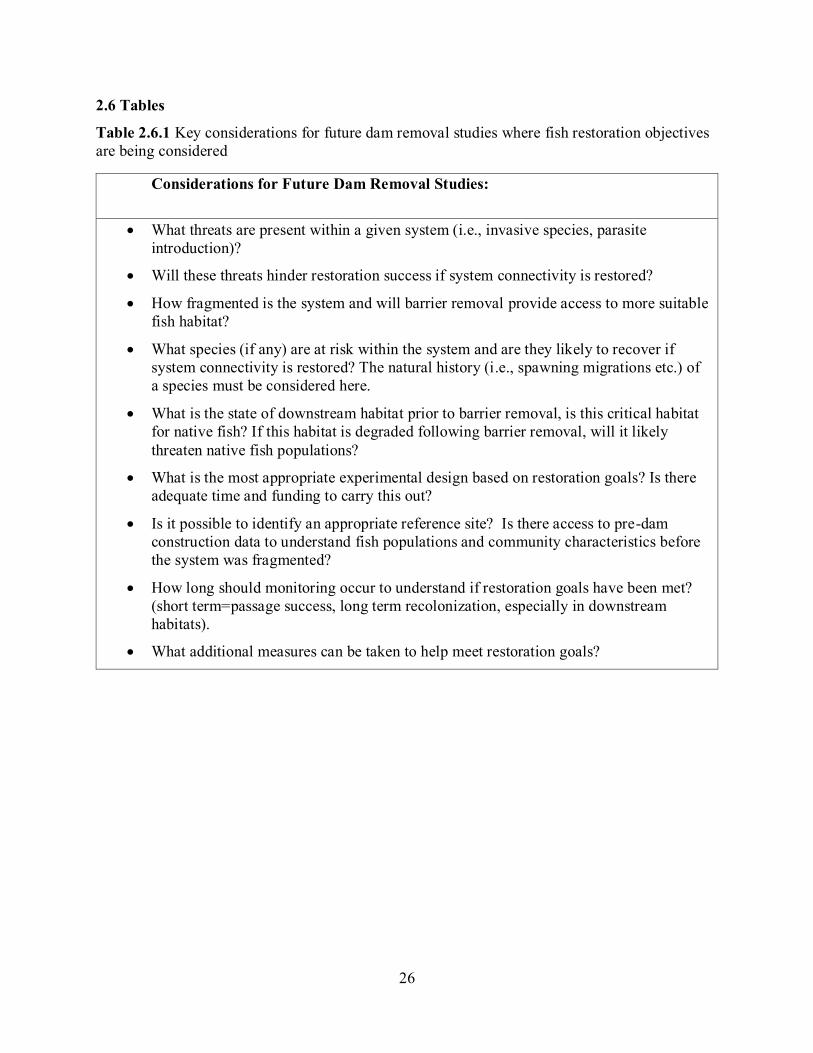
Table 2.6.1 Key considerations for future dam removal studies where fish restoration objectives
are being considered.
Table 3.7.1 A subsample of the individuals that used the fishway for multiple up- and down-
stream passes (S3) and/or made large-scale movements 2-km up- or down- stream (S4 and S2
respectively), transit times are provided as dd:hh:mm:ss, adopted from (Cahill et al., 2016).
Table 3.7.2 Parameter estimates for a generalized linear mixed effects model using glmer
function in lme4 package in R statistical environment (R Studio 3.3.3), to understand the
probability of approach for translocated bull trout through a nature-like fishway and non-
translocated bull trout at upstream control sites in Forty Mile Creek, Banff National Park.
Table 3.7.3 Parameter estimates for a generalized linear mixed effects model using glmer
function in lme4 package in R statistical environment (R Studio 3.3.3), to understand the
probability of passage for bull trout through a nature-like fishway in Forty Mile Creek, Banff
National Park.
Table 3.7.4 Parameter estimates for a linear mixed effects model using lme function in nlme
package in R statistical environment (R Studio 3.3.3), to understand biotic and abiotic factors
influencing passage duration for bull trout through a nature-like fishway in Forty Mile Creek,
Banff National Park.
1
Chapter 1: General Introduction
The dam building era was a prominent time beginning in the late 1800’s, when riverine
ecosystems became altered for water supply, hydropower and flood control (Billington et al.,
2005). The construction of dams have negatively affected ecosystems in a number of ways
(reviewed in Dugan et al., 2010). For fish in particular, migration delays, habitat loss, and
changes in environmental factors (i.e., temperature, flow alterations, water quality) have put a
number of populations at risk (e.g., Liermann et al., 2012) especially migratory fishes (e.g.,
Marschall et al., 2011) that are unable to access historical spawning habitat. Fishways have been
designed to provide connections between previously fragmented systems by supporting up- and
down-stream movement with varying degrees of success (Roscoe & Hinch, 2010). Our
understanding of fishways and how they influence reconnected ecosystems is constantly
improving, where both the positive and the unintended consequences of reconnecting these
systems have been observed (McLaughlin et al., 2013).
The dam building era has now transitioned towards a period of dam decommissioning.
Many aging dams are being considered for removal due to the economic costs of continued
maintenance and the associated risks of potential dam failure (Poff & Hart, 2001). Complete dam
removal (e.g., Hirethota et al., 2005, Flejstad et al., 2012) or partial breaching (e.g., Maloney et
al., 2008, Helms et al., 2011) have both been documented. Complete dam removal leaves the
system entirely free of the anthropogenic structure, while partial breaching reconnects the system
in the presence of the structure. Partial breaching can occur on purpose where a section of the
dam is removed (e.g., Maloney et al., 2008) or because of dam failure (e.g., Helms et al., 2011).
Nevertheless, the newly flowing passageways often mimic a nature-like fishway with natural
substrate along the stream or river bottom. In this way, partial breaching and nature-like fishways
2
are one and the same, but the connection between the two has not been defined in the literature to
date (e.g., Maloney et al., 2008; Raabe & Hightower 2014a,b).
The aim of this thesis is to advance the science behind dam removal around the globe,
and the knowledge base for restoring riverine longitudinal connectivity in previously fragmented
ecosystems. Chapter 2 focuses on characterizing the current state of dam removal science by
exploring the methodologies used and overall trends in fish response for both partial breaching
and complete dam removals. There has been a growing number of dam removal studies over the
past few decades. By understanding the general trends and methodologies to date, an opportunity
to improve the evidence base for future studies will be possible. In Chapter 3, the effectiveness
of a nature-like fishway as a result of a partial dam removal is explored. This is done by
considering the abiotic and biotic factors that may influence the probability to approach (as a
means of assessing fishway permeability), probability of passage and passage duration through
the fishway for a threatened resident species, bull trout, Salvelinus confluentus, in a small
montane stream within Banff National Park, Alberta, Canada. The present introduction is
intentionally brief as context and details about dam removal are discussed at length in the
literature review provided in Chapter 2.

3
Chapter 2: Approaches for investigating the effects of dam removal for achieving
restoration objectives: building the evidence base by improving the science
2.1 Abstract
Dam removal has become an increasingly popular method for attempting to restore fish
populations in fragmented river systems. However, little is known about whether dam removal
promotes the achievement of fish restoration objectives. Here we review the characteristics of
dams that have been removed, the metrics used and the overall trends in fish response to dam
removal. We also share recommendations for the study of future dam removals to improve the
evidence base in order to predict with better certainty the effects of dam removal in the future.
Our synthesis revealed that most studies included dams that were small in size (<15-m), focusing
on a single dam removal. However, several studies considered multiple dams on a river or in a
watershed implying systems-level thinking. It was common for studies to provide less than 1-
year of pre-removal monitoring and/or infrequent use of the before-after-control-impact design.
A variety of endpoints have been used to assess fish responses to dam removal (e.g., species
richness, abundance, density), where upstream community-level responses were often linked to
positive outcomes and downstream responses tended to be negative, at least over short
timescales. The use of multiple endpoints, appropriate reference sites (when available) and
longer pre- and post-removal monitoring is advised. In cases where there is limited baseline or
reference conditions, we suggest researchers use data in creative ways (e.g., use of comparative
historical records and/or stakeholder knowledge, pooling resources). As the evidence base
expands it will be possible to conduct a systematic review and meta-analysis on the effectiveness
of dam removal for achieving fish restoration objectives. However, the quality of evidence must
be improved (e.g., reliability, replicability, relevance) before this can occur.
4
2.2 Introduction
Humans have been a dominant presence on the landscape for centuries (Vitousek et al.
1997). Indeed, forests have been cleared, roads, buildings, and other infrastructure have been
constructed, and watercourses have been altered. One of the most obvious ways in which
humans can alter natural watercourses is to construct dams for flood control, hydropower or
water abstraction (Poff & Zimmerman, 2010; Elosegi & Sabater, 2013). Dams now feature
prominently on small and large watersheds around the globe. There are more than 87,000
dams above 7-m in height in the United States alone (USACE, 2013), with over 58,000 large
dams (i.e., >15-m) worldwide (ICOLD, 2015). These structures influence the ecology and
hydrology of river systems (Bednarek, 2001; Renofalt et al., 2010) by regulating the transport
of sediment, water flow, nutrients and biota (Ligon et al., 1995; Ellis & Jones, 2013). This has
transformed watercourses from lotic to lentic systems in upstream impoundments, while
depleting downstream waters of nutrients, sediment, and natural water flow (Gregory et al.,
2002; Graf, 2006).
Among the negative impacts that dams have on aquatic ecosystems, the most prevalent is
the fragmentation associated with impassable barriers (Nilsson et al., 2005). Dams (especially
large ones) serve as a direct barrier to fish passage and thus impede biological connectivity
(Fullerton et al., 2010). Although some dams are equipped with fish passage facilities, upstream
and downstream passage remains imperfect (Bunt et al., 2012). In some cases, fragmentation has
led to declines in both resident and migratory species, where foraging, reproduction and
colonization movements have been inhibited (Bednarek, 2001; Dudgeon et al., 2006). Moreover,
given the numerous ecosystem services provided by freshwater fish populations (Holmlund &
Hammer 1999; Lynch et al., 2016) such as nutrient cycling, the impacts of fragmentation have
often extended beyond fish to affect riverine ecosystems as well as the riparian zone (Helfield &
5
Naiman 2001). Nonetheless, it is worth noting that dams have also created some unintended
positive consequences where invasive species expansion and the spread of certain pathogens
have been controlled (Rahel & Olden, 2008; Hurst et al., 2012; McLaughlin et al., 2013).
Recognizing that improved connectivity may support the dynamics that once thrived in such
locations, dam removal has often become a “desirable” method for river restoration in the last
few decades (Hart & Poff 2002; Bernhardt & Palmer, 2011). However, little is known about
whether dam removals can meet fish restoration objectives. There is much debate regarding the
consequences of dam removal along with significant need for a rich evidence base to support
policy and management (Doyle et al., 2003).
Here we identify (1) the characteristics of dams that have been removed, (2) provide an
overview of how fish response to dam removal(s) has been quantified, (3) consider the general
trends in fish response in the form of a narrative review and (4) provide guidance on how to
improve the evidence base for future dam removals concerned with meeting fish restoration
objectives.
2.3 Methods
In an attempt to deliver the most transparent methods possible, we have provided a very
thorough explanation of how our literature search was conducted so that it can be replicated in
the future when additional studies become available. Although we do not attempt to conduct a
systematic review, we do adopt some of those principles in an effort to improve the reliability
and replicability of the literature review (Haddaway et al., 2015).
6
2.3.1 Key words for primary literature search
To conduct a primary literature search, a number of key words were selected in specified
strings. We used * to define each search word. To avoid overlooking any possible studies we
provided a wide range of search strings that in some instances led to repetition. However, this
ensured that the greatest number of studies could be accounted for on the topic for fish
restoration with dam removal. The search strings were as follows: (1) dam* + removal*, (2)
weir* + removal* (3) partial* + dam * + removal* (4) breached* + dam* (5) dam*+ removal* +
biological* (6) dam* + removal + fish* (7) dam* + removal* + fish* + passage*, (8) dam* +
removal* + fish* + community*, (9) dam* + removal* + restor*, (10) dam* + removal* +
ecological*, (6) weir* + removal* + fish*, (11) weir* + removal* + fish* + passage*, (12) weir*
+ removal* + fish* + community*, (13) weir* + removal* + restor*, (14) weir* + removal* +
ecological*, (15) breached* + dam* + fish*, (16) breached* + dam* + fish* + passage*, (17)
breached* + dam* + fish* + community*, (18) breached* + dam* + restor*, (19) breached* +
dam* + ecological*, (20) river* + restor* + fish*, (21) stream* + restor*+ fish* (22) barrier* +
removal* +fish* (23) barrier* + removal* +fish* +passage* (24) barrier* + removal* + fish* +
community* (25) barrier* + removal* + ecological* (26) weir* + removal* + biological* (27)
breached* + dam* + biological* (28) partial* + dam* + removal* + biological*.
2.3.2 Electronic Database selection
Multiple databases were considered for this review. The databases used were as follows;
(1) Google Scholar (2) Scopus (3) Web of Science (4) USGS Dam Removal Science Database
(5) DFO Waves Database. Google Scholar, Scopus and Web of Science were used to locate
articles in other jurisdictions, where keywords used in search strings were expanded to include
English speaking countries such as Australia*, New Zealand* and a number of European
7
countries. Our search was inclusive of all articles that were published up until May 10, 2016
which was when the search was conducted.
2.3.3 Primary and Grey Literature Selection for Review
Articles that were identified based on search strings in the selected databases were
imported into a reference management program, Mendeley. Once imported, multiple screening
processes were conducted to ensure that the selected articles were appropriate based on the scope
of the review. This was done by first screening the articles based on titles to ensure they focused
on dam removal and removing articles deemed inappropriate. Second, the abstracts of all the
articles were viewed to ensure they explicitly mentioned the evaluation of fish response to dam
removal in some form. Finally, there was a review of the articles themselves, which focused
specifically on the methods and results section to ensure that fish response to dam removal had
been addressed and quantified. If an article was published in grey literature as well as a peer-
reviewed publication, the peer-reviewed publication was included in our synthesis.
The search provided 143 studies with empirical data concerned with varying responses to
dam removal (e.g., geomorphology, water quality). There were 37 studies that were relevant to
fish restoration and dam removal that were included in this review. If the same dam was used for
multiple studies, we only included the height of the dam once in our synthesis on dam size.
2.3.4 How metrics were identified
A number of metrics were identified in this synthesis for assessing fish response to dam
removal. For our purposes, we identified species abundance as a relative measure of abundance
based on sampling effort (i.e., catch-per-unit effort) which was commonly reported as number of
individuals captured per electrofishing seconds. In contrast, fish density was identified as an
absolute measure of abundance for the area being sampled and was reported as the number of
individuals captured per unit area. Fish biomass was also identified as an absolute measure of
8
abundance for the area being sampled and was reported as the mass of individuals captured per
unit area (Bradford et al., 2016).
2.4 Analysis and Discussion
2.4.1 Characteristics of dams that have been removed
Publication information
Of the 37 studies included in our review, 65% (N=24) were peer-reviewed publications,
19% (N=7) were technical reports and 16% (N=6) were theses.
Geographic location of studies
Although dam removal for fish restoration (that can be paired with dams that have safety
concerns or obsolete in use) is becoming more common in North America, it is still a relatively
new concept in other regions. We found that 92% (N=34) of the dam removals included in our
analyses were from North America, while 5% (N=2) were from Europe, and an additional 3%
(N=1) were from Asia. Primary and grey literature on fish response to dam removal at the
international scale is still quite rare; for example, there has only been one peer-reviewed study
published on this subject in Norway (Fjeldstad et al., 2012). Since we limited our search to
English it is likely that some international grey literature sources were excluded from the study.
Temporal range of studies
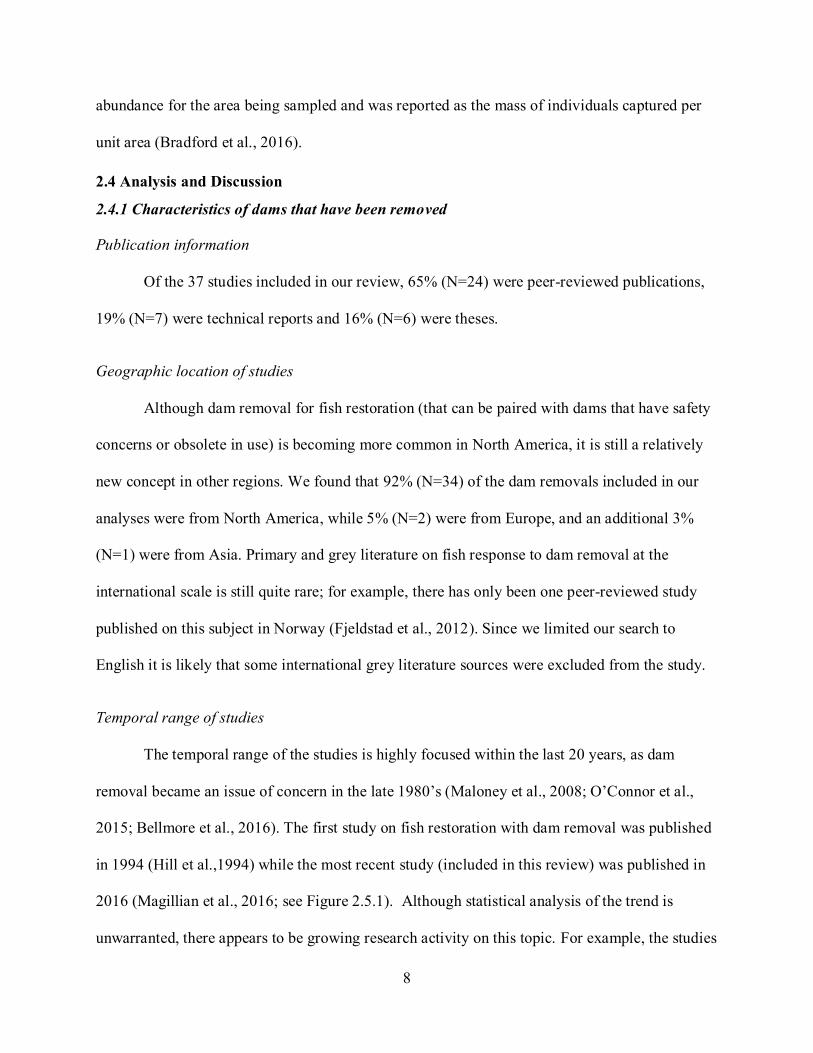
The temporal range of the studies is highly focused within the last 20 years, as dam
removal became an issue of concern in the late 1980’s (Maloney et al., 2008; O’Connor et al.,
2015; Bellmore et al., 2016). The first study on fish restoration with dam removal was published
in 1994 (Hill et al.,1994) while the most recent study (included in this review) was published in
2016 (Magillian et al., 2016; see Figure 2.5.1). Although statistical analysis of the trend is
unwarranted, there appears to be growing research activity on this topic. For example, the studies
9
published between 2010 to 2015 alone have accounted for 60% (N=22) of the total number of
publications included in this review.
Relative size and number of dams considered for removal
Out of the 37 studies used in our synthesis, 65% (N=24) studies completely (or partially)
(3%, (N=1)) removed one dam, there were 19% (N=7) of studies that removed two dams, 3%
(N=1) removed three dams, and 11% (N=4) removed four or more dams (including partially
removed/relict dams). This was done to restore connectivity in highly fragmented river systems
(e.g., Catalano et al., 2007, Raabe & Hightower, 2014a). Out of the 24 studies that identified the
height of the structures, a total of 33 dams were removed, the majority were <15-m in height
97% (N=32), with only one dam (3%, (N=1)) >15-m in height.
Purpose of dam removal
Of the 30 studies that provided reasoning for dam removal, 47% (N=20) considered fish
restoration as a main objective for dam decommissioning, 32% (N=14) of studies considered
dams that were obsolete in use, 16% (N=7) considered structural and safety concerns, and 5%
(N=2) were due to public demand (i.e., social pressures from grassroots organizations, NGOs).
Over half of the studies (67%, (N=20)) provided one reason for barrier removal, while 33%
(N=10) provided two or more reasons, which were primarily a combination of fish restoration
and dams that were obsolete in use (40%, (N=4)) or fish restoration and safety concerns (30%,
(N= 3)).
A review conducted by Bellmore et al., (2016) stated that over 1200 dams have been
removed in the United States alone, with only 9% of them being accompanied by published
scientific studies (which have spanned topics including sediment transport, water quality, and
biota). The small number of scientific studies that have accompanied dam removal(s) have likely
10
influenced our results as we only accounted for dam removals that were coupled with scientific
studies. In addition, we focused on dam removals where “fish restoration” was considered and
consequently excluded scientific studies that solely looked at hydrologic and geomorphic
responses (to name a few).
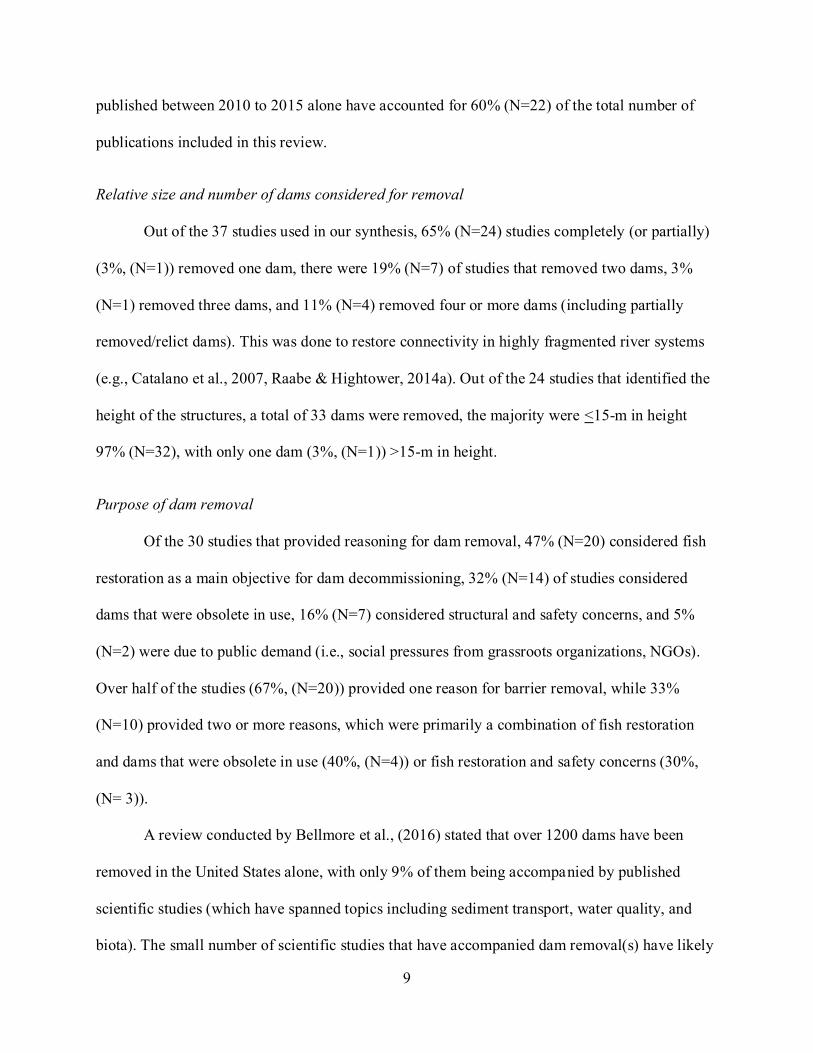
It is also likely that scientific studies on dam removal have been paired with dams that
were already supposed to be removed for other reasons, but failed to identify as such. This is
probable given that out of all 58 dam removals included in this synthesis, the majority of dam
removals provided only < 1-year pre-removal monitoring (40%, (N=23)), or none at all (26%,
(N=15)) (see Figure 2.5.2). A single year of baseline data has little power to statistically detect
changes from the natural variability of a system (i.e., influences from hydrology, climate and/or
stochastic events; Kibler et al., 2011). However, there are instances where certain end points are
only worthy of study after dam removal. For example, consider a scenario in which a dam was
blocking all upstream passage of a diadromous species, such as a Pacific salmonid.
Abundance/presence of that species immediately prior to dam removal would be “zero/absent”
such that it would only be necessary to monitor re-establishment after removal. In that case,
appropriate baselines may be from periods prior to dam construction.
There were many dam removal projects that lacked appropriate reference sites, with only
22% (N=13) of dam removals using the Before-After-Control-Impact (BACI) design. If long-
term pre-removal monitoring on a system is possible, the number of pre-removal monitoring
years will largely depend on the objectives of the study. For example, at least 3-yrs of baseline
data is recommended for fish restoration, especially when funding is limited (see Smokorowski
et al., 2017). In contrast, an ecosystem approach to dam removal will require far more pre-
removal monitoring years to capture the natural variability in the system (e.g., riparian zone,
11
invertebrates, water chemistry), which has been shown in the Hubbard Brook experiments (see
Likens & Busso, 2006; Holmes & Likens, 2016). In this synthesis, the number of post-removal
monitoring years has largely been short-term and has ranged from 1-yr (24%, (N=14)), 2-yrs
(29%, (N=17)) or 3-yrs (28%, (N=16)). Since dam removal is not a gentle process and can act as
an initial disturbance on the system, it is important to recognize the need for more long-term
studies on dam removal that address the objectives of the study (e.g., fish restoration or
ecosystem approach) with the appropriate monitoring timescales.
We also recognize that in some instances it may be difficult to find appropriate reference
locations (e.g., lack of appropriate habitat). In these circumstances, researchers should evaluate
the strengths and weaknesses of alternative experimental designs (see Kibler et al., 2011) and
select the most appropriate design based on the inferences they intend to make on the population.
Alternatively, researchers can use data in creative ways to provide a more balanced study design
(see Section 2.4.4) or combine dam removal with other areas of research (e.g., nature-like
fishways) to advance the science in other ways.
2.4.2 How fish response has been quantified for dam removals
Characteristics of Species Considered
The majority of studies considered in our review focused on community level response to
dam removal (54%, (N=20)), or community level response with a species of interest (11%,
N=4)). The remaining studies (35%, (N=13)) failed to recognize the community and considered a
single (or multiple) species of interest, this subset of studies largely focused on diadromous
species (N=11), but riverine (N=2) species were also noted.
12
Summary of metrics considered
The metrics used to quantify fish response to dam removal (partial or full dam removal)
were dependent on the species of interest (and/or community at large). The majority of studies
included species composition (and/or a shift in species assemblage) (22%, (N=15)), while 16%
(N=11) considered species abundance, 12% (N=8) considered species richness, 7% (N=5)
considered fish biomass, 7% (N=5) considered fish density, while 6% (N=4) considered species
diversity. A number of studies included metrics related to reproduction or recruitment (28%,
(N=19)), with one study that focused on movement patterns in response to dam removal (outside
of spawning season) (1%, (N=1)) (see Chen, 2012).
The metrics used to quantify fish response to dam removal have been applied to
communities (or species of interest) at varying frequencies. We recognize that in most instances,
populations are the fundamental unit that matter to managers. We suggest that future studies
include as many metrics as possible on the same population. If applied, we will be able to
identify which metric(s) are best at detecting population level effects when a larger evidence
base becomes available in the future. This is also important as some metrics can be used to offset
possible misinterpretation of results. For example, fish density can be paired with reproduction
and recruitment metrics to assess population viability. This ensures that possible aggregation
effects (described by fish density) are distinguished from population level increases (with
reproduction and recruitment metrics; Bernhardt & Palmer, 2011). By recognizing these
intricacies and the importance of using a wide range of metrics, a clear understanding of fish
response to dam removal (that can be applied across studies) will be possible in the years to
come.
13
2.4.3 General trends
Synthesis on upstream fish response
There were 4 studies (with 4 dam removals) that looked at a single (N=3) or multiple
(N=1) species upstream response, but failed to include community level responses. Most of these
studies were concerned with diadromous species (Raabe & Hightower, 2014a) with only one
study that looked at riverine species (e.g., smallmouth bass) of recreational significance (Kanehl
& Lyons, 1997). Species abundance was shown to increase in upstream waters for all 3 dam
removals it was quantified in (100%, (N=3)) and fish biomass was shown to increase upstream
for the one dam removal it was considered (Kanehl & Lyons, 1997). In addition, there was one
study that focused on movement patterns outside of spawning season for the Taiwan Salmon.
This was done to assess connectivity up- and down- stream during draw-down and following
dam removal. It was found that this species could indeed access upstream waters and would
undergo large-scale movements motivated by translocation following dam removal (see Chen,
2012).
There were 23 studies that considered upstream community level response to dam
removal, in which 34 dam removals were examined. We analyzed fish response to each dam
removal separately, so that dam specific responses could be quantified. For the 8 dam removals
that considered relative abundance, 75% (N=6) saw an increase in relative abundance, 13%
(N=1) noted a decrease, which was likely due to further upstream fragmentation and flooding
that occurred during monitoring (see Magilligan et al., 2016), while 13% (N=1) remained
unchanged. For species richness, 9 dam removals were considered, which found that 67% (N=6)
saw an increase in species richness, 11% (N=1) saw a decrease (see Magilligan et al., 2016), and
22% (N=2) remained unchanged (i.e., same study with multiple dam removals). For species
diversity, 4 dam removals were considered and 75% (N=3) saw an increase in diversity, while
14
25% (N=1) remained unchanged. When considering upstream community level response for fish
density, 4 dam removals were considered and found that 75% (N=3) saw an increase, 25% (N=1)
saw a decrease. Out of the 4 dam removals that looked at fish biomass, it was found that 75%
(N=3) saw an increase and 25% (N=1) saw a decrease. For changes in species composition (or
assemblage shifts), 25 dam removals were considered. The majority saw a shift from lentic to
lotic species (36%, (N=9)), or an overall increase in natives (tolerant and/or intolerant) (32%,
(N=8)), 8% (N=2) saw in increase in invasive or non-native species that moved upstream from
downstream waters, while 24% (N=6) remained unchanged.
There is a general consensus that upstream community level responses to dam removal
have positive outcomes in which biodiversity of previously isolated reaches can be restored
(Bushaw-Newton et al., 2002; Greathouse et al., 2006). Our synthesis found that fish
communities generally improved following dam removal, with the exception of two instances
where invasive/non-native species were found in upstream waters (see Gottgens et al., 2009;
Copper, 2013). Mclaughlin et al., (2013) considered the unintended consequences of restoring
connectivity to upstream reaches. The authors highlighted that restoring connectivity to
previously isolated fish communities can cause unwanted predator-prey interactions,
introgression between wild and hatchery fish, hybridization with introduced species, and
potentially facilitate the spread of disease (Kiffney et al., 2009; Marks et al., 2010). Evidence of
this has been largely limited to fishways. This is not surprising given the long history associated
with fishway evaluation (Schwalme et al., 1985; Bunt et al., 2001; Roscoe et al., 2011). In
contrast, the concept of dam removal is still relatively new and has had much less time to mature
(Bellmore et al., 2016). This may explain why upstream community level response to dam
15
removal have generally provided positive outcomes, with limited evidence to support the
potential negative effects.
Synthesis on downstream fish response
There have been 3 studies (with 3 dam removals) that have looked at either a single
(N=2) or multiple (N=1) species downstream response, but failed to include community level
responses. All three studies considered relative abundance, one study noted an increase (N=1),
one study noted an initial decline and then an increase (N=1), and the third study saw no clear
trend in native species abundance (i.e., smallmouth bass), with a gradual decline in a non-native
species abundance (i.e., common carp; N=1; Kanehl & Lyons, 1997).
There were 16 studies that considered downstream community level response to dam
removal, in which 25 dam removals were examined. A subset of dam removals (N=7), only
considered upstream community level response (monitoring impounded reaches and reference
sites) or did not provide clear indication of downstream responses and so were excluded from
this section (e.g., Chatham et al., 2007). We analyzed fish response to each dam removal
separately, so that dam specific responses could be quantified. For the 8 dam removals that
considered species abundance, 38% (N=3) saw a decrease, 25% (N=2) saw a decrease and then
increase, 25% (N=2) remained unchanged, with one instance that followed species specific
trends (13%, (N=1)). For species richness, a total of 9 dam removals were considered, 11%
(N=1) saw an increase, 33% (N=3) saw an initial decline but then began to recover within one to
two years (see Catalano et al., 2007), 44% (N=4) saw a steady decline, and one instance
remained unchanged (11%, (N=1)). For fish density, 4 dam removals were considered, 75%
(N=3) saw a decline, and there was one case that predator and prey densities were inversely
correlated (which was consistent with pre-removal data) (25%, (N=1)). There were two
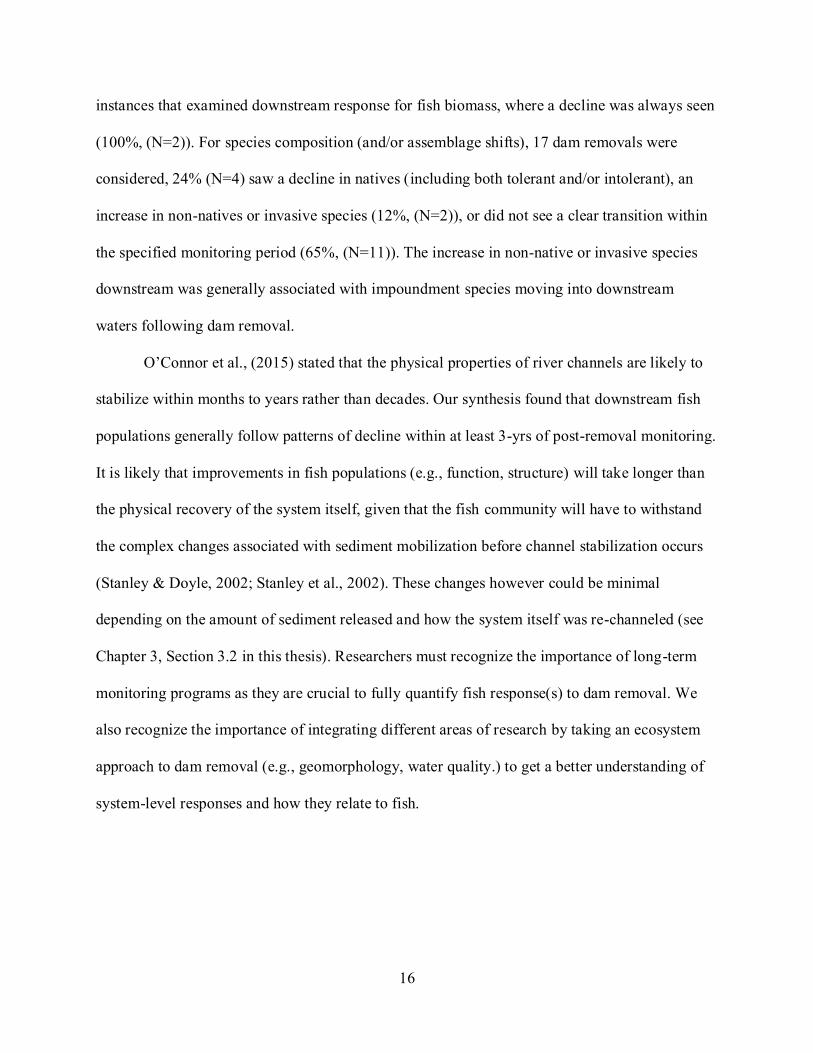
16
instances that examined downstream response for fish biomass, where a decline was always seen
(100%, (N=2)). For species composition (and/or assemblage shifts), 17 dam removals were
considered, 24% (N=4) saw a decline in natives (including both tolerant and/or intolerant), an
increase in non-natives or invasive species (12%, (N=2)), or did not see a clear transition within
the specified monitoring period (65%, (N=11)). The increase in non-native or invasive species
downstream was generally associated with impoundment species moving into downstream
waters following dam removal.
O’Connor et al., (2015) stated that the physical properties of river channels are likely to
stabilize within months to years rather than decades. Our synthesis found that downstream fish
populations generally follow patterns of decline within at least 3-yrs of post-removal monitoring.
It is likely that improvements in fish populations (e.g., function, structure) will take longer than
the physical recovery of the system itself, given that the fish community will have to withstand
the complex changes associated with sediment mobilization before channel stabilization occurs
(Stanley & Doyle, 2002; Stanley et al., 2002). These changes however could be minimal
depending on the amount of sediment released and how the system itself was re-channeled (see
Chapter 3, Section 3.2 in this thesis). Researchers must recognize the importance of long-term
monitoring programs as they are crucial to fully quantify fish response(s) to dam removal. We
also recognize the importance of integrating different areas of research by taking an ecosystem
approach to dam removal (e.g., geomorphology, water quality.) to get a better understanding of
system-level responses and how they relate to fish.
17
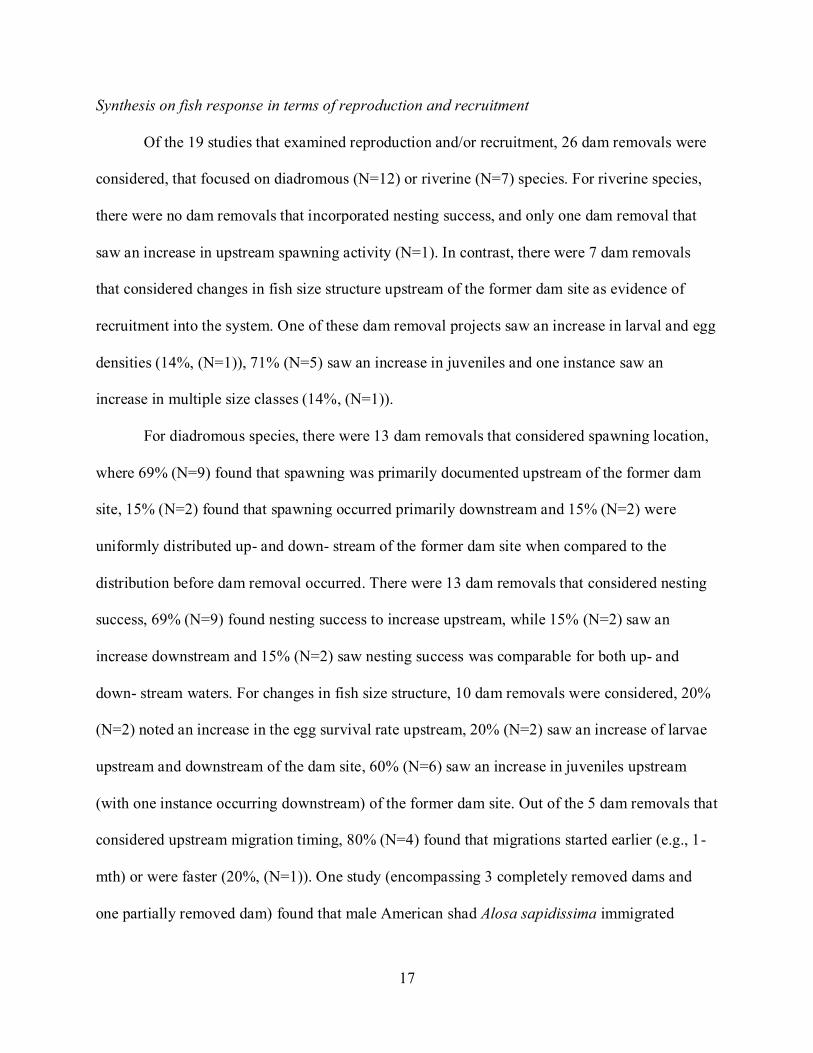
Synthesis on fish response in terms of reproduction and recruitment
Of the 19 studies that examined reproduction and/or recruitment, 26 dam removals were
considered, that focused on diadromous (N=12) or riverine (N=7) species. For riverine species,
there were no dam removals that incorporated nesting success, and only one dam removal that
saw an increase in upstream spawning activity (N=1). In contrast, there were 7 dam removals
that considered changes in fish size structure upstream of the former dam site as evidence of
recruitment into the system. One of these dam removal projects saw an increase in larval and egg
densities (14%, (N=1)), 71% (N=5) saw an increase in juveniles and one instance saw an
increase in multiple size classes (14%, (N=1)).
For diadromous species, there were 13 dam removals that considered spawning location,
where 69% (N=9) found that spawning was primarily documented upstream of the former dam
site, 15% (N=2) found that spawning occurred primarily downstream and 15% (N=2) were
uniformly distributed up- and down- stream of the former dam site when compared to the
distribution before dam removal occurred. There were 13 dam removals that considered nesting
success, 69% (N=9) found nesting success to increase upstream, while 15% (N=2) saw an
increase downstream and 15% (N=2) saw nesting success was comparable for both up- and
down- stream waters. For changes in fish size structure, 10 dam removals were considered, 20%
(N=2) noted an increase in the egg survival rate upstream, 20% (N=2) saw an increase of larvae
upstream and downstream of the dam site, 60% (N=6) saw an increase in juveniles upstream
(with one instance occurring downstream) of the former dam site. Out of the 5 dam removals that
considered upstream migration timing, 80% (N=4) found that migrations started earlier (e.g., 1-
mth) or were faster (20%, (N=1)). One study (encompassing 3 completely removed dams and
one partially removed dam) found that male American shad Alosa sapidissima immigrated
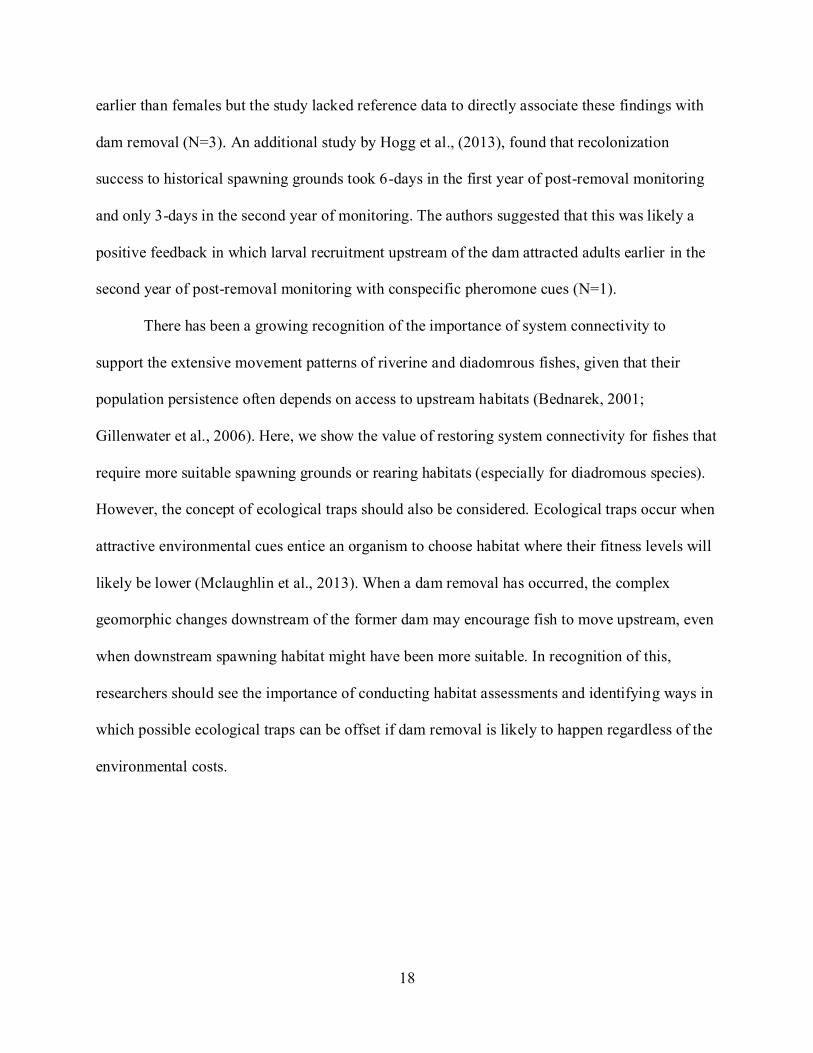
18
earlier than females but the study lacked reference data to directly associate these findings with
dam removal (N=3). An additional study by Hogg et al., (2013), found that recolonization
success to historical spawning grounds took 6-days in the first year of post-removal monitoring
and only 3-days in the second year of monitoring. The authors suggested that this was likely a
positive feedback in which larval recruitment upstream of the dam attracted adults earlier in the
second year of post-removal monitoring with conspecific pheromone cues (N=1).
There has been a growing recognition of the importance of system connectivity to
support the extensive movement patterns of riverine and diadomrous fishes, given that their
population persistence often depends on access to upstream habitats (Bednarek, 2001;
Gillenwater et al., 2006). Here, we show the value of restoring system connectivity for fishes that
require more suitable spawning grounds or rearing habitats (especially for diadromous species).
However, the concept of ecological traps should also be considered. Ecological traps occur when
attractive environmental cues entice an organism to choose habitat where their fitness levels will
likely be lower (Mclaughlin et al., 2013). When a dam removal has occurred, the complex
geomorphic changes downstream of the former dam may encourage fish to move upstream, even
when downstream spawning habitat might have been more suitable. In recognition of this,
researchers should see the importance of conducting habitat assessments and identifying ways in
which possible ecological traps can be offset if dam removal is likely to happen regardless of the
environmental costs.
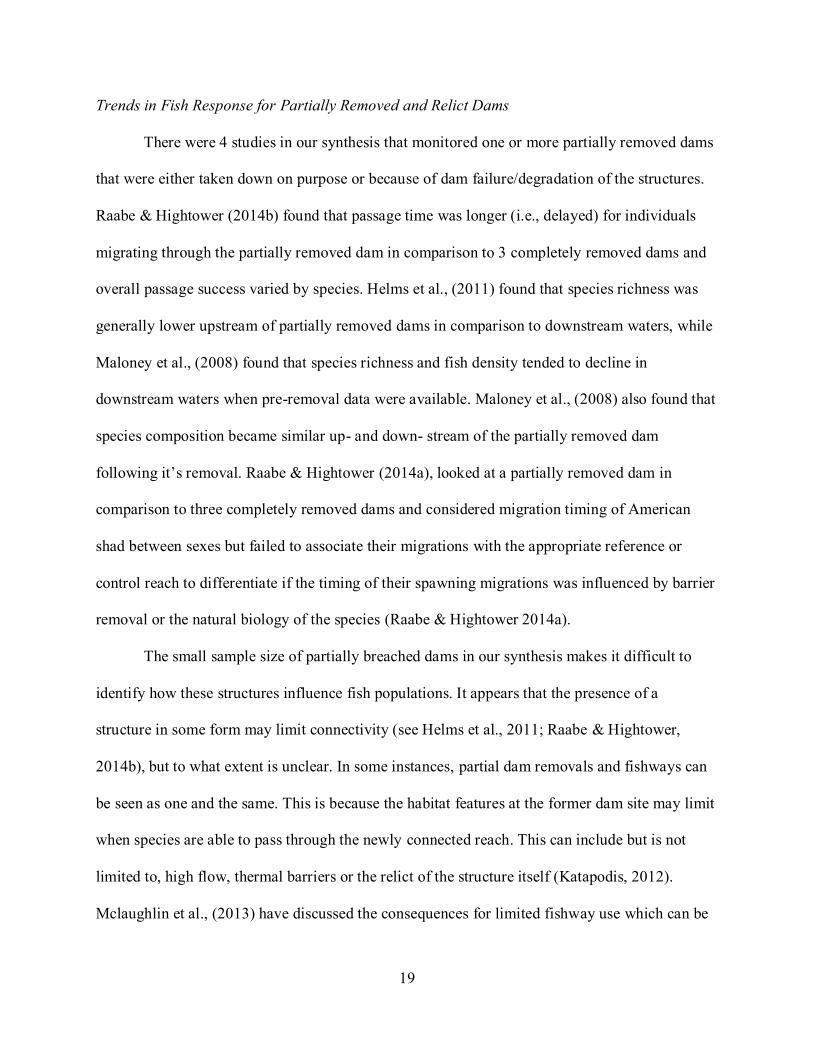
19
Trends in Fish Response for Partially Removed and Relict Dams
There were 4 studies in our synthesis that monitored one or more partially removed dams
that were either taken down on purpose or because of dam failure/degradation of the structures.
Raabe & Hightower (2014b) found that passage time was longer (i.e., delayed) for individuals
migrating through the partially removed dam in comparison to 3 completely removed dams and
overall passage success varied by species. Helms et al., (2011) found that species richness was
generally lower upstream of partially removed dams in comparison to downstream waters, while
Maloney et al., (2008) found that species richness and fish density tended to decline in
downstream waters when pre-removal data were available. Maloney et al., (2008) also found that
species composition became similar up- and down- stream of the partially removed dam
following it’s removal. Raabe & Hightower (2014a), looked at a partially removed dam in
comparison to three completely removed dams and considered migration timing of American
shad between sexes but failed to associate their migrations with the appropriate reference or
control reach to differentiate if the timing of their spawning migrations was influenced by barrier
removal or the natural biology of the species (Raabe & Hightower 2014a).
The small sample size of partially breached dams in our synthesis makes it difficult to
identify how these structures influence fish populations. It appears that the presence of a
structure in some form may limit connectivity (see Helms et al., 2011; Raabe & Hightower,
2014b), but to what extent is unclear. In some instances, partial dam removals and fishways can
be seen as one and the same. This is because the habitat features at the former dam site may limit
when species are able to pass through the newly connected reach. This can include but is not
limited to, high flow, thermal barriers or the relict of the structure itself (Katapodis, 2012).
Mclaughlin et al., (2013) have discussed the consequences for limited fishway use which can be
20
applied to dam removal research, such as passage delay, selective passage and fallback
behaviour. Fallback behaviour may be of concern if the species changes direction during and/or
following their passage at the former dam site (Bjornn et al., 2000). This can largely be due to
disorientation, or if they are physically unable to continue their migration based on the strain put
on them from passing through a newly restored dam site. Selective passage can also affect
restoration success if only certain species or life stages are able to freely move back and forth
through the newly re-connected waterway (Bunt et al., 2012; Noonan et al. 2012). Researchers
should identify the relative size of the breach that has been made, and when pre-removal data is
not available, efforts should be focused towards understanding passage success as a measure of
system connectivity. In addition, these same principles can be applied to full dam removal
projects to understand any further limitations to fish movement. This is especially important in
cases where dam removal has occurred in an otherwise highly fragmented system (e.g.,
Magilligan et al., 2016).
2.4.4 Practical Considerations for Study Design
The approaches for quantifying dam removal need improvement, and the trends in fish
response may not be fully representative of the possible consequences of dam removal. We also
recognize the realities of dam removal projects, especially those on smaller systems (e.g.,
streams), where dam removal may occur rapidly with little opportunity for monitoring. However,
given that dam removal is often contentious and involves extensive stakeholder consultation,
there is usually some knowledge of the potential for dam removal for years before it actually
occurs. The exact timing may not be known and the project may proceed, but that should not
preclude the collection of baseline data on fish. In reality, it seems to be rather common where
researchers have to scramble to develop and implement a monitoring plan with little opportunity
for pre-removal monitoring or evaluation of reference conditions in adjacent systems. In such

21
instances, there is a need for creativity. One method is to identify where data already exists (i.e.,
long term monitoring programs) that could provide baseline information on the population (e.g.,
community structure, biomass, presence/absence) or appropriate reference conditions (e.g., data
available from a separate watershed). Many natural resource management agencies conduct
routine monitoring and in some instances these could align, such that they are relevant to dam
removal monitoring. In doing so, researchers will be able to extract the necessary information to
help shape a study design that asks critical questions pertaining to the information that is already
available on the system.
We also recognize that funding opportunities may not always be available to satisfy site
specific needs. Indeed, an obvious question is who pays for dam removal monitoring. The
answer will of course be context specific but given the role of natural resource management
agencies in stewardship of public resources, they are an obvious starting point. In instances
where the dam owner is a utility or other entity with financial resources or where there are legal
obligations to support monitoring, funding could be provided by those sources. However, there
will still be many lost opportunities where the resources do not exist to conduct high-quality
monitoring with the potential to deepen the evidence base. As such, we encourage funding
bodies to pool resources together that provide long-term funding opportunities for developing
appropriate study designs or monitoring programs in watersheds with aging dams that are likely
to be decommissioned in the coming years. This would enable researchers to pull from this
common pot of resources to better address questions related to dam removal or access
information that is pre-emptively being collected to support the replicability, reliability and
relevance that is needed for dam removal science. Waiting until a project is given “final
approval” for dam removal is often far too late to mount an effective monitoring program using,
22
for example, a BACI design. In cases where the dam has already been removed, and pre-removal
data cannot be accessed (limited or unavailable), researchers may choose to advance the
evidence base in other ways, this includes fishway research (see Chapter 3), where the concepts
of dam removal and nature-like fishways can be combined to advance the science in other ways.
2.4.5 Conclusion
The science supporting fish restoration using dam removals has been growing over the
last two decades, and will likely continue to do so in the years to come (O’Connor et al., 2015).
Although we are starting to learn more about the outcomes of dam removal studies, many gaps in
knowledge remain. Moreover, the literature is still sufficiently sparse that a systematic-review
with a meta-analysis is not possible. Of particular concern, is the fact that most studies conducted
to date would be screened out during the critical appraisal phase of a systematic review because
the studies lack the design to properly test whether dam removal is achieving fish restoration
objectives. The intent of this review is to provide the basis for more critical decision-making in
terms of allocating resources that focus on well-defined research and monitoring efforts over
long-term timescales (see Table 2.6.1). More importantly, it should provide an understanding as
to what areas should be examined further based on the knowledge gaps that currently exist. Since
many dams are reaching the end of their lifespan, well-informed decisions related to dam
decommissioning must be made (Doyle et al., 2003).
Our search would not have detected instances where there had been no formal reporting
(e.g., technical reports, peer-reviewed papers) for dam removal or instances where dam removal
occurred but there was no fish-related monitoring. As such, we offer a plea for those engaging in
dam removals to share their findings with the broader community through case study reports in
journals. Moreover, given the dramatic influence of dams on fish populations we submit that all

23
dam removal studies should include as many fish-related endpoints as possible in their
monitoring irrespective as to whether the dam removal had specific fish restoration goals (or
using an ecosystem approach when possible). This will also provide the basis of assessing which
metrics are best suited in identifying fish-related population level effects in the future.
With the direction provided here along with a commitment to strengthening the evidence
base on dam removal, within the next decade it should be possible to conduct a systematic
review where there is substantial, high-quality evidence to determine the extent to which such
interventions are warranted. For large-scale dam decommissioning we are starting to see this,
with many pre-removal monitoring studies being published (e.g., Woodward et al., 2008; Winans
et al., 2017) and follow-up studies still to come. Failure to conduct studies that generate reliable
and relevant data on the effectiveness of dam removal for achieving fish restoration objectives
represents a lost opportunity and one that will require practitioners to continue to rely on
narrative syntheses or to selectively pick/avoid individual empirical studies which is inconsistent
with best practices for evidence-based conservation and environmental management (Sutherland
et al. 2004).
24
2.5 Figures
Figure 2.5.1 Temporal patterns of dam removal studies that have focused on fish restoration
objectives that were identified through our structured literature search. The search was conducted
on May 10, 2016 such that the number for 2016 should be assumed to be incomplete.
0
1
2
3
4
5
6
7N
um
ber
of
Stu
die
s
Year
25
Figure 2.5.2 The length of pre-, during, and post-removal monitoring for dam removal projects
that have been concerned with meeting fish restoration objectives. The search was conducted on
May 10, 2016 such that the number for 2016 should be assumed to be incomplete. All
monitoring that was more than zero but less than a year was categorized under “1-yr” for
simplicity.
0
10
20
30
40
50
60
0 1 2 3 4 5 6 7 8
Nu
mb
er o
f D
am
s
Number of Monitoring Years
Pre-Removal Dam Draw-Down Post-Removal
26
2.6 Tables
Table 2.6.1 Key considerations for future dam removal studies where fish restoration objectives
are being considered
Considerations for Future Dam Removal Studies:
• What threats are present within a given system (i.e., invasive species, parasite
introduction)?
• Will these threats hinder restoration success if system connectivity is restored?
• How fragmented is the system and will barrier removal provide access to more suitable
fish habitat?
• What species (if any) are at risk within the system and are they likely to recover if
system connectivity is restored? The natural history (i.e., spawning migrations etc.) of
a species must be considered here.
• What is the state of downstream habitat prior to barrier removal, is this critical habitat
for native fish? If this habitat is degraded following barrier removal, will it likely
threaten native fish populations?
• What is the most appropriate experimental design based on restoration goals? Is there
adequate time and funding to carry this out?
• Is it possible to identify an appropriate reference site? Is there access to pre-dam
construction data to understand fish populations and community characteristics before
the system was fragmented?
• How long should monitoring occur to understand if restoration goals have been met?
(short term=passage success, long term recolonization, especially in downstream
habitats).
• What additional measures can be taken to help meet restoration goals?
27
Chapter 3: Bull trout (Salvelinus confluentus) passage behaviour at a nature-like fishway
following a partial dam removal in a national protected area
3.1 Abstract
Dams represent one of the major forms of river alteration. In recent years, many of these
structures are reaching the end of their lifespan, where there has been need to consider either
extensive refurbishments or dam removal. The partial removal of a small-scale water supply dam
in Banff National Park (Alberta, Canada) created a nature-like fishway. This provided the
opportunity to investigate probability to approach, probability of passage and passage duration of
a threatened species, bull trout (Salvelinus confluentus) through a nature-like fishway. Using
radio telemetry, we determined that the probability for a fish to approach the fishway was low
(37%) and size dependent, but for those that approached, their probability to pass was high, with
a passage efficiency of 78%. Passage success was related to water depth and time of day. Fish
were likely to pass at high water levels (>0.40-m) in the late spring to summer months in this
system. Although some passage events occurred during day-light, the probability to pass the
fishway was significantly higher at night. Passage duration ranged from 5-min to 13-days,
suggesting that this resident species could have used the fishway for a variety of purposes (e.g.,
foraging, cover) and not just transiting. Some individuals underwent large-scale movements 2-
km upstream (N=11) or downstream (N=2) of the nature-like fishway following a successful
passage event. This study provides new insights on how partial dam removals and nature-like
fishways can be combined to expand the knowledge base on fishway permeability for newly
restored ecosystems.
28
3.2 Introduction
Human-made structures (e.g. dams, water mills, water diversion facilities) have
influenced stream connectivity for centuries. It has only been in the last few decades that their
negative ecological and environmental effects have been recognized (e.g., Ligon et al., 1995;
Rosenburg et al., 1997; Vörösmarty et al. 2010). Of particular concern are migrating fishes
(including both potamodromous and diadromous species) that may be limited or have lost
complete connection to upstream waters, often associated with critical spawning or rearing
habitats (Peter, 1998; Lucas & Baras, 2000). Longitudinal connectivity in fluvial ecosystems is
regarded as important for gene transfer, nutrient cycling, and population persistence (Wiens
2002; Pringle 2003). As such, contemporary perspectives on river restoration typically call for
efforts to re-establish or enhance ecological connectivity in fragmented systems (Jansson et al.
2007; Cooke et al. 2012).
Negative effects arising from river fragmentation have been mitigated through strategies
such as dam removal (ranging from partial removal to full removal) and construction of different
types of fishways. Fishways have been used in various forms for decades (See Clay, 1961;
Katopodis & Williams 2012) and range in appearance from highly engineered (e.g., Denil or
vertical slot fishways) structures to designs that are meant to more closely mimic natural
channels (i.e., nature-like fishways; Katapodis et al., 2001). Passage success rates are influenced
by fish physiology (e.g., swimming capacities), species life stage and other biotic and/or abiotic
factors (e.g., Mallen-Cooper & Stuart, 2007; Bunt et al., 2012). Complete dam removal has
become more common in the last few decades, especially for aging structures that pose a liability
(i.e., dam failure), or impractical costs for continued dam maintenance (Poff & Hartt, 2002). This
process requires substantial efforts to not only remove the structure but also restore the system
itself (e.g., Hartt et al., 2002; Stanley & Doyle, 2002). In some instances, complete dam removal
29
is not possible (e.g., limited funding or higher environmental risk) and so partial dam removal is
considered, whereby a section of the dam is removed to enhance connectivity. Partial dam
removal can be seen as a nature-like fishway by providing up- and down- stream access to
resident and/or migrating individuals, but the connection between the two concepts has not been
made in the literature so far (e.g., Maloney et al., 2008; Raabe & Hightower 2014a,b). This
connection is important to consider when there is limited to no pre-removal or reference data on
the system such that understanding dam removal as the “intervention” is not possible (for which
this Chapter is a case study for).
For the purpose of this study, we focus on Forty Mile Creek Dam in Banff National Park,
Alberta, Canada. This is an example of a nature-like fishway that was created as the result of a
partial dam removal. For this case study, we focus on fishway permeability rather than fish
response to dam removal given that there was insufficient pre-removal data on the system to
understand dam removal as the “intervention”. The Forty Mile Creek Dam was built in several
stages starting in the early 1900s as a source of the town’s drinking water and for fire protection.
However, in the mid-1980s the dam ceased to have a function after deep-water wells were drilled
in the area. The Town of Banff expressed interest in removing the dam as it was rendered a
liability to the town and had fundamental costs associated with continued dam maintenance (e.g.,
routine inspections, maintaining road access to the dam). The dam stood without purpose until
2014 when the access road was demolished during a 100-yr flood. Managers wanted to invest
funds to demolishing the dam instead of re-building the access road. However, the budget was
estimated to not be enough to demolish the full concrete structure. Furthermore, removing the
entire dam would require fluming (i.e., redirecting) the entire creek while simultaneously
demolishing 8-m high and 2-m thick concrete walls. By constructing a nature-like fishway beside

30
the remaining structure it allowed an existing bypass channel within the dam to act as a flume
managing the water while the breach was created. The breach was therefore created in a section
beside the bypass channel without water passing through, which mitigated the need for
complicated sediment control measures.
Bull trout, Salvelinus confluentus, are the species of interest for this study, which have
been protected under the Alberta Wildlife Act (Alberta Sustainable Resource Development
2015) and more recently have been assessed as “threatened” by Canada’s Committee on the
Status of Endangered Wildlife in Canada (COSEWIC, 2012). In Alberta, 57% of bull trout
populations are declining, with the Bow River Watershed having experienced the greatest
declines due to habitat fragmentation as well as an increase in the cumulative effects of industrial
and recreational activities (COSEWIC, 2012; Alberta Sustainable Resource Development, 2015).
The objectives of this study were to (1) assess the probability to approach, the probability
of passage and passage duration of bull trout through the nature-like fishway, (2) identify the
biotic and abiotic factors influencing the probability to approach (as a means of assessing
fishway permeability), probability of passage and passage duration, and (3) determine the
distance travelled by a fish following a passage event (i.e., 2-km, 6-km up- or down- stream of
the fishway). If the fishway is deemed permeable, it will likely benefit bull trout by reducing
habitat fragmentation and thus restoring connectivity to the system.
31
3.3 Methods
3.3.1 Study Site
This study was conducted in Forty Mile Creek in Banff National Park, Alberta at the site
of a nature-like fishway (50° 07'N; 96° 01'W). Forty Mile Creek is groundwater fed and flows
into the Bow River approximately 6-km downstream of the nature-like fishway. The fishway is
50-m in length, with an average width of 8-m. The upstream entrance is characterized by a
concrete apron (8.5-m × 10.4-m), which was the foundation for the dam. This was left to ensure
the integrity of the remaining structure. Eleven evenly spaced baffles (0.38-m width, 3.8-m
length, 0.20-m spacing) were added to the concrete apron to disrupt high flow. The remaining
length of the fishway was characterized by natural rock formations (e.g., cobble, boulders) that
ranged from 2.5-cm to 71.3-cm in diameter (from intermediate axis), with boulder spacing that
ranged from 1.8-m to 7.8-m formed from natural flow in the system (not engineered). The slope
of the natural stream channel directly upstream of the fishway was 1.3%, the slope within the
interior of the fishway (between the up- and down- stream fishway entrance) was 5.3% and the
slope of the stream channel directly downstream of the fishway was 4.9% (see Figure 3.6.1).
3.3.2 Experimental Design
This study was conducted over one year between the fall season of 2015 (October 27,
2015- Nov. 14, 2015) and into 2016 (March 14, 2015 – Oct. 30, 2016). All fish were captured
with a pulsed DC backpack electrofisher (Smith Root, Vancouver, WA). Once caught, fish were
temporarily held in a stream-side holding facility (diameter = 243-cm, depth= 90-cm and
volume= 2839-L) supplied with ambient fresh water. Fish were anesthetized with clove oil (1
part clove oil to 10 parts ETOH) and then were measured, weighed and transferred to a v-shaped
surgery trough in the supine position so that they could be implanted with a uniquely-coded radio
transmitter (Sigma-Eight Inc., Markham, ON; 1.5V, 84 dB, 150-mHz). Fresh water was
32
continuously pumped across their gills, maintained with a water pump. Transmitters were
inserted into the body cavity through a 10-mm incision made on the ventral body surface of the
fish, posterior to the girdle, using a scalpel (number 3 blade, rounded cutting point). The incision
was closed with two simple interrupted sutures (PDS II, 3/0, Ethicon Inc). Fish were then
returned to a recovery tank before their release. Since our target species, resident bull trout, are
known to hybridize with non-native brook trout (Salvelinus fontinalis), it is possible that some of
our tagged fish were hybrids (see Popowich et al., 2011). All transmitters were programmed to
turn off during the winter (Nov. 15, 2015 – March 13, 2016) following the fall 2015 field season
(Oct. 27, 2015 – Nov. 14, 2015). This was done as a method of conserving battery life and
because large-scale movements were not expected in the winter upon the development of frazzle
ice and based on previous studies of overwintering salmonid biology (Jakober et al., 2000;
Muhlfeld et al., 2003).
Our study was conducted within a 12-km reach of Forty Mile Creek, using six fixed
radio-telemetry receiver stations (Figure 3.6.2). Each fixed receiver station included one SRX
800 radio tracking receiver (Lotek Wireless, Newmarket, ON) and one or two 3-element yagi
antennas (AF Antronics, Urbana, IL) (e.g., pointed up- or down- stream) powered by solar power
(G2 Solar Corp, Carlgary, AB), to record passage events. Antennas were secured to a tree in both
the up- or down- stream direction, except for the fishway antennas that were placed at a 90°
angle, perpendicular to the stream bank. At the nature-like fishway, there were two fixed receiver
stations; one was placed at the upstream entrance, while the other was placed at the downstream
entrance, collectively referred to as Site 3 (S3). The downstream entrance station had one yagi
antenna, pointed at a 90° angle towards the downstream entrance to detect fish entering (and
approaching) the fishway. The second station at the upstream entrance had two yagi antennas,
33
one pointed at a 90° angle towards the upstream entrance (concrete apron) and the other antenna
pointed at a greater angle to detect fish exiting (or approaching) the fishway (see Figure 3.6.1).
This provided the opportunity to track a fish’s location as it passed through the fishway in a
specified order based on relative signal strengths between the antennas. There were four
additional fixed receiver stations, at both 2-km and 6-km up- and down- stream of the dam. The
downstream sites were referred to as Site 1 (S1) and Site 2 (S2). The dam site was called Site 3
(S3) and the two upstream sites were Sites 4 and 5 (S4 & S5 respectively; see Figure 3.6.2).
Our study involved two groups of fish. Because we knew from historical sampling that
bull trout existed at very low densities downstream of the dam, we enhanced the population by
transporting upstream residents downstream (i.e., below the fishway; Parks Canada, unpublished
data), in the hope that these individuals would exhibit homing behaviour which has been
displayed in other salmonids (e.g., Halvorsen & Stabell, 1990). We also acknowledged that these
fish were residents and may not move upstream at a high enough frequency to ensure adequate
sampling size of fish if translocation was not used.
The translocated group of fish were caught upstream (~14-km upstream of the nature-like
fishway) and transported within 1-km downstream of the fishway (S3) by helicopter in a Bambi
bucket in the fall of 2015 (N = 52; Oct. 29 – 30, 2015) and spring of 2016 (N = 21; May 2 – 3,
2016; N=21, Fork Length (FL), 210-mm to 320-mm) where they were tagged and released. A
control group of non-translocated fish (N=60; FL, 238-mm to 388-mm) were released within a
few 100-meters of their capture sites in the reach upstream of the dam. The non-translocated fish
release sites were located within 1-km to 2-km downstream of the upstream fixed receiver
stations (S4 and S5). This was done to determine fishway permeability by comparing the number
of approaches at the fishway by translocated fish (S3), with the number of approaches at
34
upstream control sites by non-translocated fish (S4 and S5). The upstream fixed receiver stations
(S4, S5) as well as the downstream fixed receiver stations (S1, S2) also provided a method of
quantifying coarse-scale movement patterns of fish following a passage event through the
fishway (2-km or 6-km in both directions).
To ensure the fixed receiver stations were working properly, range testing was conducted
on a weekly basis at the nature-like fishway (S3) and bi-weekly at the remaining up- and down-
stream stations (S1, S2, S4, S5). The translocated individuals were also manually tracked on a
seasonal basis to understand their relative movements and spatial location outside of the fishway.
This was especially important for the individuals that never approached the fishway. There were
7 translocated individuals in our study that were never recorded during our manual tracking
sessions. It is possible that these individuals could have left the system, experienced tag failure,
or were predated and removed from the system.
To gain insight on the environmental conditions that may influence fishway use, water
level loggers (model U20L, Onset Hobo Inc.) were used to collect water depth (to the nearest
cm) and water temperature (to the nearest 0.5 °C) at 30-min intervals. These loggers were
installed within a few 100-m downstream of the fishway. Passage events were correlated with
the closest water level and temperature measurements in our dataset.
3.3.3 Data Analysis
A number of conditions were used to define movement activity in this study. At the
fishway, an approach event was defined by a fish that was recorded at the entrance of the
fishway (or upstream control sites) regardless if the fish went on to pass through the fishway. A
“no approach” event was defined as a fish that was never recorded at the fishway. There were
two options that defined the probability of passage. An “attempt” was defined as an event where
35
a fish entered the fishway and was recorded at the up- or down- stream entrance of the fishway,
but did not make a successful pass through the fishway. This meant that the fish was not
recorded by the fixed receiver station at the opposite entrance from which the fish entered.
Oftentimes studies will differentiate between the individuals that enter the fishway or remain
within 3-m of the fishway entrance (Bunt et al., 2012). Based on these definitions we were
unable to differentiate between the fish that “entered” the fishway in comparison to fish that
were within a reasonable distance from the entrance (i.e., 5-m), and so we included both possible
events as “attempts” in this study. A successful “passage” was defined as an event where a fish
was recorded on all three antennas at the fishway (downstream entrance, fishway interior and
upstream entrance) in consecutive order, and was dependent on passage direction. Passage
duration was determined for each successful passage event, it began when a fish entered at one
of the fishway entrances (up- or down- stream) and was completed when a fish reached the
opposite entrance.
We recognize that using translocation could influence the standardized estimates for
evaluating the effectiveness of fishways (such as attraction efficiency) by manipulating a fish’s
behaviour in the hopes of motivating them to approach the fishway (i.e., homing; Hinch &
Cooke, 2013). As such, we modified this efficiency estimate to reflect a more appropriate
estimate given our study design. We term this estimate as “probability to approach”, which was
calculated as the proportion of translocated fish (tagged and released downstream of the fishway)
that subsequently approached the fishway, in comparison to the total number of translocated fish
that were released in our study. We assumed that the non-translocated fish released upstream of
the fishway were unlikely to move downstream as they were probably habituated to the dam
being a barrier, and so they were not included in our estimate. Bunt et al. (2012), define passage
36
efficiency by dividing the number of fish that entered the fishway by the number of fish that
exited the fishway. In our study, individuals that passed through the fishway were likely to do so
more than once and so we defined “passage efficiency” as the total number of successful passage
events through the fishway compared to the total number of attempts at the fishway (regardless
of fish ID). This provided a more conservative estimate because “multiple” attempts and passage
events per fish occurred over various environmental conditions in our study period (i.e., late
winter – fall).
3.3.4 Statistical Analysis
To account for two separate release dates for translocated fish we ran a chi-square test to
compare the proportion of individuals that approached the fishway by release date. This analysis
failed to detect a significant difference (X2=1.97, df=1, p=0.16) between the two release groups
so they were grouped together for modelling. When multiple observations are made on the same
individuals, the data are not independent (Heck et al., 2010). This was true for our study as fish
that approached the fishway were likely to approach (and pass) more than once (multiple
observations per fish). In recognition of this, we incorporated individual fish ID as a random
effect in mixed effects regression models. We used backward model selection with Akaike’s
information criterion (AIC, Akaike, 1974) to objectively compare model fits, and determine the
most parsimonious model with the lowest AIC value. Prior to modeling, we used pairwise
Spearman’s rank correlation plots and variance inflation factors (VIF) to assess if there was
multicollinearity between predictor variables. It was found that fish weight and fork length were
collinear (upon visual inspection), and so fish weight was removed from any further analyses.
This was done as we recognized that fork length provided an equivalent metric to evaluate the
37
influence of body size and has often been used in other studies related to fishway science (e.g.,
Stuart & Mallen-Cooper, 1999).
To determine the probability to approach the fishway (and upstream control sites), we ran
a generalized linear mixed effects model (GLMM) with a binomial response (i.e., approach or no
approach). Data were analyzed with glmer function in lme4 package in R statistical environment
(R Studio 3.3.3; Bates et al., 2015). This model included presence/absence data for each fish
(i.e., translocated and non-translocated) by season (“late” winter, spring, summer and fall) at the
upstream control site or nature-like fishway (termed as “location”) with fish ID as a random
effect. Season was treated as a fixed factor with four levels, winter (March), spring (April &
May), summer (June, July and August) and fall (September and October) and we used winter as
baseline from which to generate the comparisons. Location was treated as a fixed factor with two
levels that included the treatment group (i.e., the fishway (S3)) and control (S4 and S5). By
comparing the probability to approach each site, we could compare whether fish approached the
fishway at the same rate as the upstream control sites. This is effectively a measure of
“permeability” under the assumption that a perfect fishway would be “invisible” to fish (i.e. fish
would approach the fishway as often as any other area in the stream). We used predicted
probabilities using the predict function in R statistical environment to describe relationships
between predictor variables.
To determine the probability to pass through the fishway itself, we used a generalized
linear mixed effects model (GLMM) with a binomial response (pass or attempt). This was done
to test if water depth, water temperature, time of day and passage direction (up- or down- stream)
influenced the probability of a fish to pass. In this model, we only included the fish that
approached the fishway because we did not have environmental data for the fish that never
38
approached the fishway. Time of day was included as a binary predictor of night or day. We also
included both up- and down- stream passage as a binary predictor. Water temperature and water
depth were included as continuous predictors and fish ID was included as a random effect.
To determine if passage duration was influenced by biotic and/or abiotic factors, we used
a linear mixed model. The response (i.e., passage duration) was modeled as a continuous variable
with a Gaussian error distribution. We included water depth and water temperature as
continuous, time of day (as a factor with two levels) and fork length in our model, where fish ID
was specified as a random effect (as there were more than one passage duration per fish). Data
were analyzed using lme function in nlme package implemented in R statistical environment (R
Studio version 3.3.3; Pinheiro et al., 2014). Residual plotting was used to test for model
assumptions that included normality and homogeneity of fixed effects residuals (Zuur et al.,
2009). Where heterogeneity of variance between fixed effects was observed, the variance
weighting function varIdent from the nlme package (Pinheiro et al., 2014) was applied (Zuur et
al., 2009).
3.4 Results
The probability for translocated fish to approach the fishway was low (37%; 27 of 73
translocated individuals) and consistent with upstream control sites (33%; 20 of 60 non-
translocated individuals). However, most of translocated fish that approached the fishway passed
through the fishway (21 of 27 translocated individuals), as well as two non-translocated
individuals that were released upstream of the fishway. Fish were likely to pass the fishway more
than once, with a passage efficiency of 78% (54 of 69 passage events). There was only 22%
(N=15) attempt-only events at the fishway. These were likely not failed attempts but rather a lack
of motivation of a fish to ascend (or descend) the fishway.
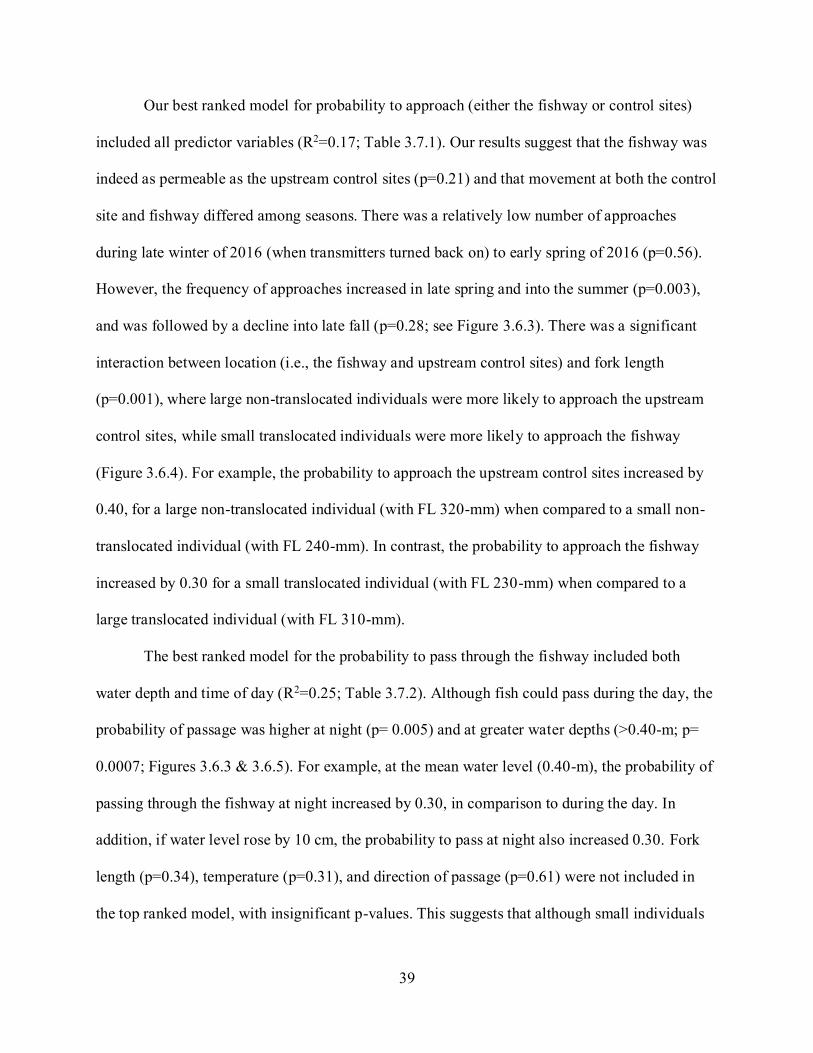
39
Our best ranked model for probability to approach (either the fishway or control sites)
included all predictor variables (R2=0.17; Table 3.7.1). Our results suggest that the fishway was
indeed as permeable as the upstream control sites (p=0.21) and that movement at both the control
site and fishway differed among seasons. There was a relatively low number of approaches
during late winter of 2016 (when transmitters turned back on) to early spring of 2016 (p=0.56).
However, the frequency of approaches increased in late spring and into the summer (p=0.003),
and was followed by a decline into late fall (p=0.28; see Figure 3.6.3). There was a significant
interaction between location (i.e., the fishway and upstream control sites) and fork length
(p=0.001), where large non-translocated individuals were more likely to approach the upstream
control sites, while small translocated individuals were more likely to approach the fishway
(Figure 3.6.4). For example, the probability to approach the upstream control sites increased by
0.40, for a large non-translocated individual (with FL 320-mm) when compared to a small non-
translocated individual (with FL 240-mm). In contrast, the probability to approach the fishway
increased by 0.30 for a small translocated individual (with FL 230-mm) when compared to a
large translocated individual (with FL 310-mm).
The best ranked model for the probability to pass through the fishway included both
water depth and time of day (R2=0.25; Table 3.7.2). Although fish could pass during the day, the
probability of passage was higher at night (p= 0.005) and at greater water depths (>0.40-m; p=
0.0007; Figures 3.6.3 & 3.6.5). For example, at the mean water level (0.40-m), the probability of
passing through the fishway at night increased by 0.30, in comparison to during the day. In
addition, if water level rose by 10 cm, the probability to pass at night also increased 0.30. Fork
length (p=0.34), temperature (p=0.31), and direction of passage (p=0.61) were not included in
the top ranked model, with insignificant p-values. This suggests that although small individuals
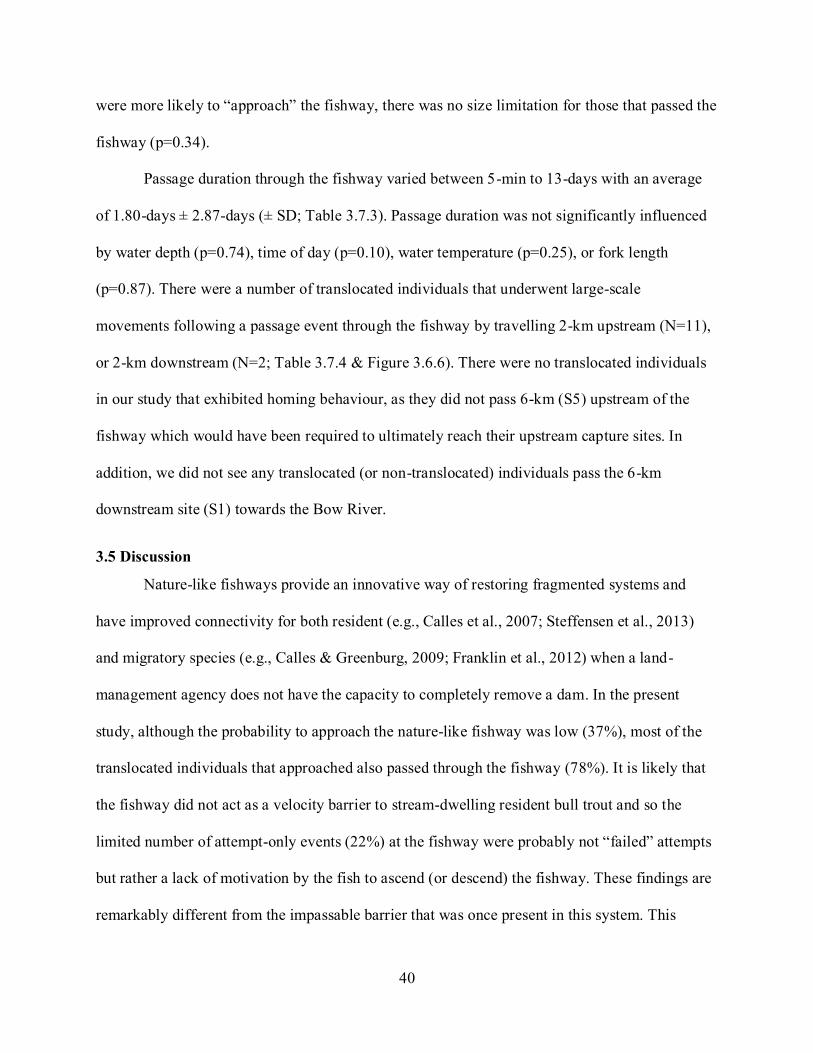
40
were more likely to “approach” the fishway, there was no size limitation for those that passed the
fishway (p=0.34).
Passage duration through the fishway varied between 5-min to 13-days with an average
of 1.80-days ± 2.87-days (± SD; Table 3.7.3). Passage duration was not significantly influenced
by water depth (p=0.74), time of day (p=0.10), water temperature (p=0.25), or fork length
(p=0.87). There were a number of translocated individuals that underwent large-scale
movements following a passage event through the fishway by travelling 2-km upstream (N=11),
or 2-km downstream (N=2; Table 3.7.4 & Figure 3.6.6). There were no translocated individuals
in our study that exhibited homing behaviour, as they did not pass 6-km (S5) upstream of the
fishway which would have been required to ultimately reach their upstream capture sites. In
addition, we did not see any translocated (or non-translocated) individuals pass the 6-km
downstream site (S1) towards the Bow River.
3.5 Discussion
Nature-like fishways provide an innovative way of restoring fragmented systems and
have improved connectivity for both resident (e.g., Calles et al., 2007; Steffensen et al., 2013)
and migratory species (e.g., Calles & Greenburg, 2009; Franklin et al., 2012) when a land-
management agency does not have the capacity to completely remove a dam. In the present
study, although the probability to approach the nature-like fishway was low (37%), most of the
translocated individuals that approached also passed through the fishway (78%). It is likely that
the fishway did not act as a velocity barrier to stream-dwelling resident bull trout and so the
limited number of attempt-only events (22%) at the fishway were probably not “failed” attempts
but rather a lack of motivation by the fish to ascend (or descend) the fishway. These findings are
remarkably different from the impassable barrier that was once present in this system. This
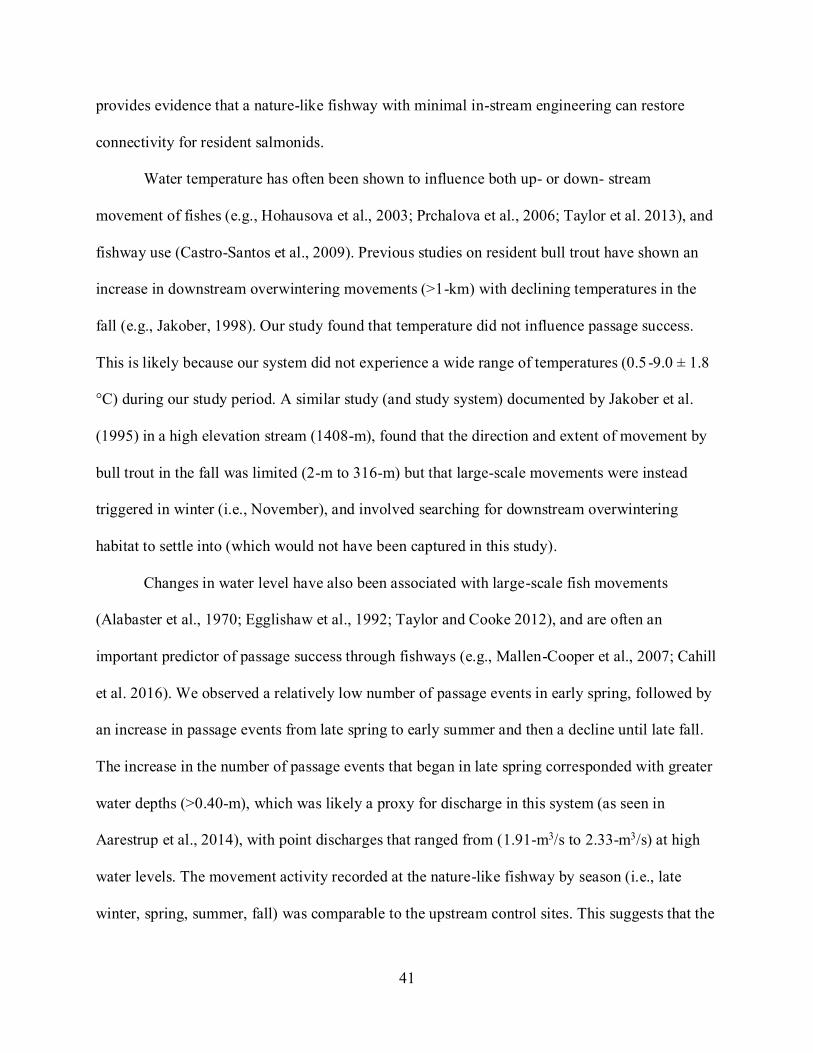
41
provides evidence that a nature-like fishway with minimal in-stream engineering can restore
connectivity for resident salmonids.
Water temperature has often been shown to influence both up- or down- stream
movement of fishes (e.g., Hohausova et al., 2003; Prchalova et al., 2006; Taylor et al. 2013), and
fishway use (Castro-Santos et al., 2009). Previous studies on resident bull trout have shown an
increase in downstream overwintering movements (>1-km) with declining temperatures in the
fall (e.g., Jakober, 1998). Our study found that temperature did not influence passage success.
This is likely because our system did not experience a wide range of temperatures (0.5 -9.0 ± 1.8
°C) during our study period. A similar study (and study system) documented by Jakober et al.
(1995) in a high elevation stream (1408-m), found that the direction and extent of movement by
bull trout in the fall was limited (2-m to 316-m) but that large-scale movements were instead
triggered in winter (i.e., November), and involved searching for downstream overwintering
habitat to settle into (which would not have been captured in this study).
Changes in water level have also been associated with large-scale fish movements
(Alabaster et al., 1970; Egglishaw et al., 1992; Taylor and Cooke 2012), and are often an
important predictor of passage success through fishways (e.g., Mallen-Cooper et al., 2007; Cahill
et al. 2016). We observed a relatively low number of passage events in early spring, followed by
an increase in passage events from late spring to early summer and then a decline until late fall.
The increase in the number of passage events that began in late spring corresponded with greater
water depths (>0.40-m), which was likely a proxy for discharge in this system (as seen in
Aarestrup et al., 2014), with point discharges that ranged from (1.91-m3/s to 2.33-m3/s) at high
water levels. The movement activity recorded at the nature-like fishway by season (i.e., late
winter, spring, summer, fall) was comparable to the upstream control sites. This suggests that the
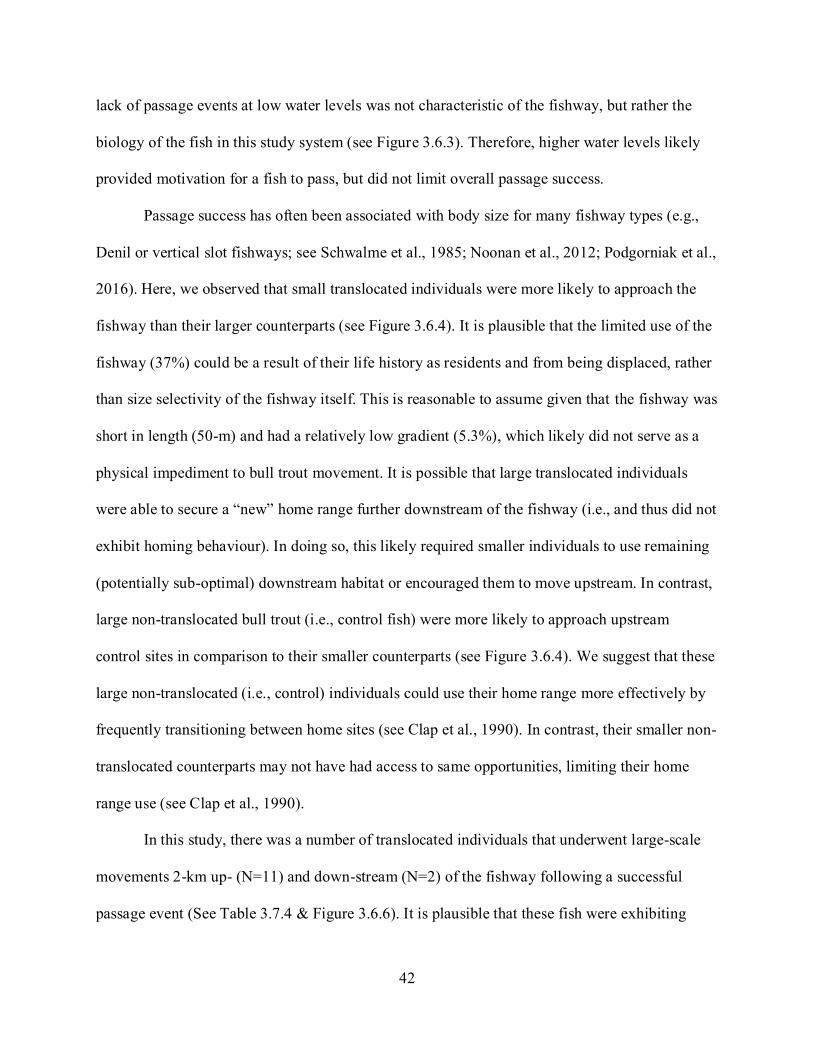
42
lack of passage events at low water levels was not characteristic of the fishway, but rather the
biology of the fish in this study system (see Figure 3.6.3). Therefore, higher water levels likely
provided motivation for a fish to pass, but did not limit overall passage success.
Passage success has often been associated with body size for many fishway types (e.g.,
Denil or vertical slot fishways; see Schwalme et al., 1985; Noonan et al., 2012; Podgorniak et al.,
2016). Here, we observed that small translocated individuals were more likely to approach the
fishway than their larger counterparts (see Figure 3.6.4). It is plausible that the limited use of the
fishway (37%) could be a result of their life history as residents and from being displaced, rather
than size selectivity of the fishway itself. This is reasonable to assume given that the fishway was
short in length (50-m) and had a relatively low gradient (5.3%), which likely did not serve as a
physical impediment to bull trout movement. It is possible that large translocated individuals
were able to secure a “new” home range further downstream of the fishway (i.e., and thus did not
exhibit homing behaviour). In doing so, this likely required smaller individuals to use remaining
(potentially sub-optimal) downstream habitat or encouraged them to move upstream. In contrast,
large non-translocated bull trout (i.e., control fish) were more likely to approach upstream
control sites in comparison to their smaller counterparts (see Figure 3.6.4). We suggest that these
large non-translocated (i.e., control) individuals could use their home range more effectively by
frequently transitioning between home sites (see Clap et al., 1990). In contrast, their smaller non-
translocated counterparts may not have had access to same opportunities, limiting their home
range use (see Clap et al., 1990).
In this study, there was a number of translocated individuals that underwent large-scale
movements 2-km up- (N=11) and down-stream (N=2) of the fishway following a successful
passage event (See Table 3.7.4 & Figure 3.6.6). It is plausible that these fish were exhibiting
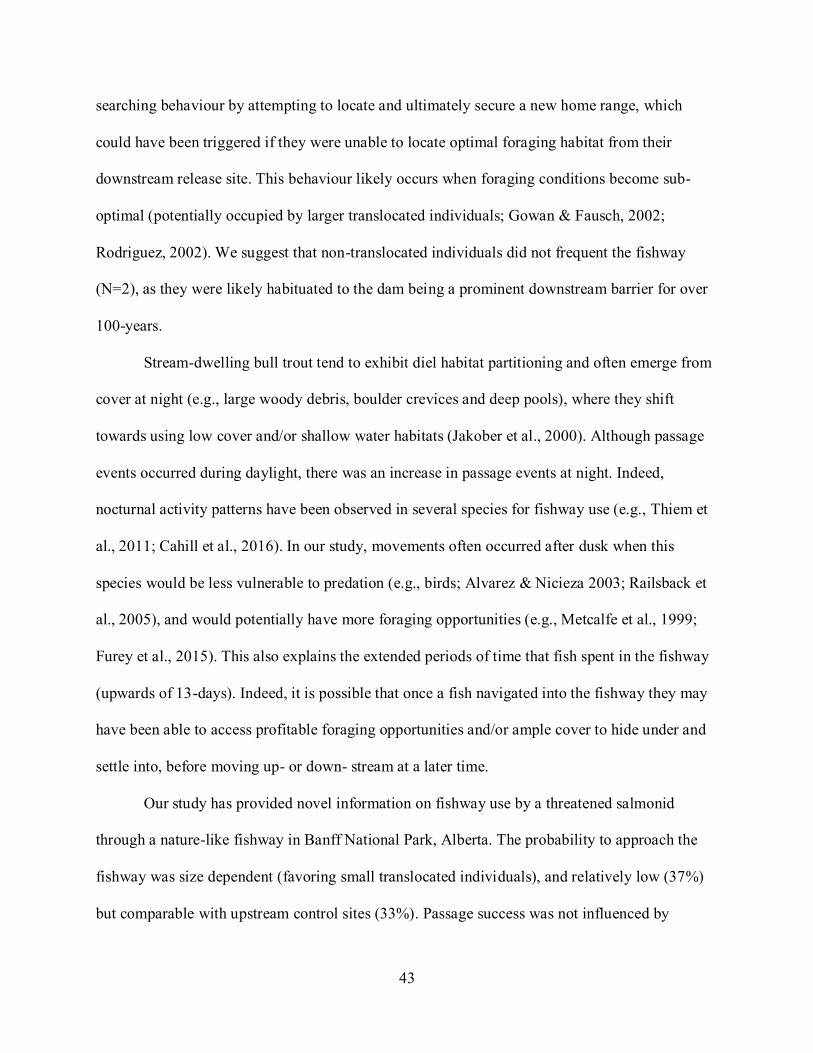
43
searching behaviour by attempting to locate and ultimately secure a new home range, which
could have been triggered if they were unable to locate optimal foraging habitat from their
downstream release site. This behaviour likely occurs when foraging conditions become sub-
optimal (potentially occupied by larger translocated individuals; Gowan & Fausch, 2002;
Rodriguez, 2002). We suggest that non-translocated individuals did not frequent the fishway
(N=2), as they were likely habituated to the dam being a prominent downstream barrier for over
100-years.
Stream-dwelling bull trout tend to exhibit diel habitat partitioning and often emerge from
cover at night (e.g., large woody debris, boulder crevices and deep pools), where they shift
towards using low cover and/or shallow water habitats (Jakober et al., 2000). Although passage
events occurred during daylight, there was an increase in passage events at night. Indeed,
nocturnal activity patterns have been observed in several species for fishway use (e.g., Thiem et
al., 2011; Cahill et al., 2016). In our study, movements often occurred after dusk when this
species would be less vulnerable to predation (e.g., birds; Alvarez & Nicieza 2003; Railsback et
al., 2005), and would potentially have more foraging opportunities (e.g., Metcalfe et al., 1999;
Furey et al., 2015). This also explains the extended periods of time that fish spent in the fishway
(upwards of 13-days). Indeed, it is possible that once a fish navigated into the fishway they may
have been able to access profitable foraging opportunities and/or ample cover to hide under and
settle into, before moving up- or down- stream at a later time.
Our study has provided novel information on fishway use by a threatened salmonid
through a nature-like fishway in Banff National Park, Alberta. The probability to approach the
fishway was size dependent (favoring small translocated individuals), and relatively low (37%)
but comparable with upstream control sites (33%). Passage success was not influenced by
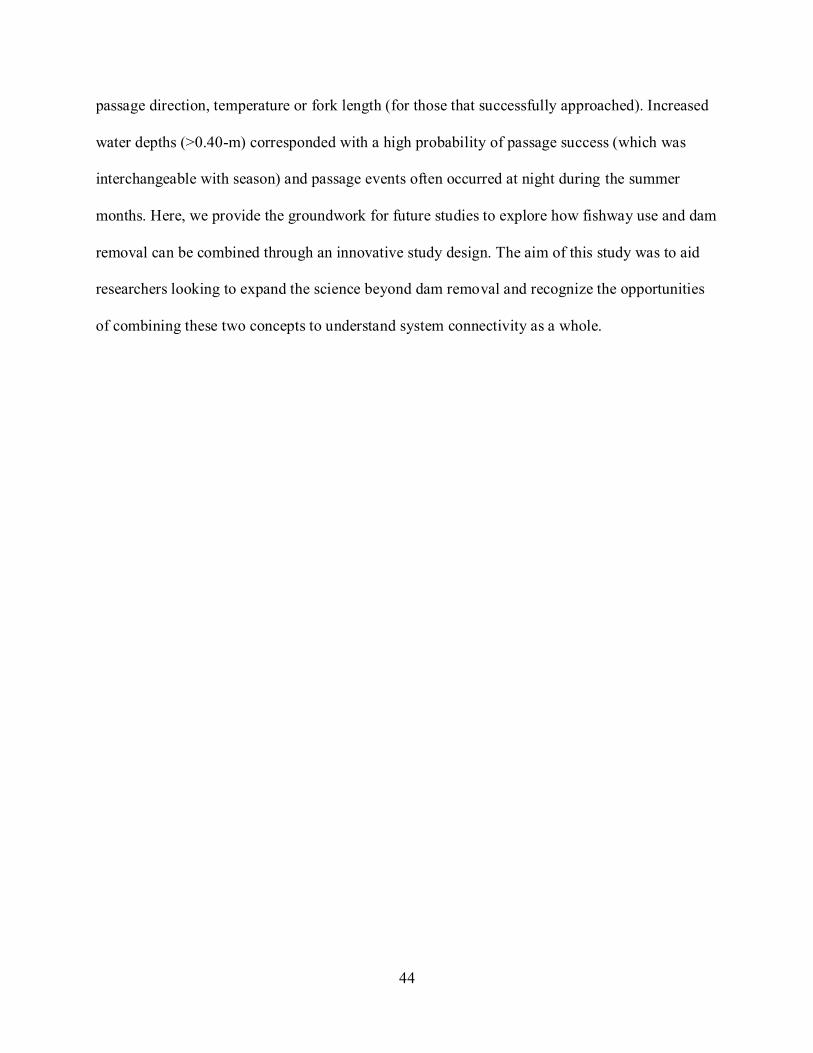
44
passage direction, temperature or fork length (for those that successfully approached). Increased
water depths (>0.40-m) corresponded with a high probability of passage success (which was
interchangeable with season) and passage events often occurred at night during the summer
months. Here, we provide the groundwork for future studies to explore how fishway use and dam
removal can be combined through an innovative study design. The aim of this study was to aid
researchers looking to expand the science beyond dam removal and recognize the opportunities
of combining these two concepts to understand system connectivity as a whole.
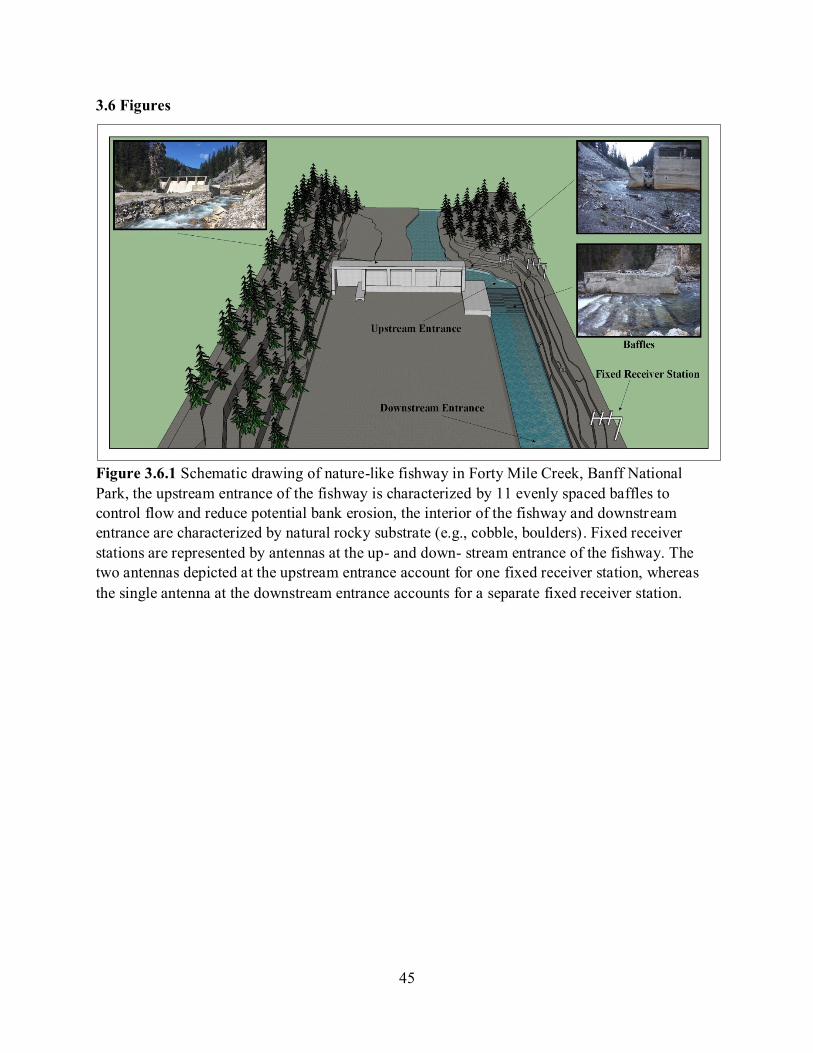
45
3.6 Figures
Figure 3.6.1 Schematic drawing of nature-like fishway in Forty Mile Creek, Banff National
Park, the upstream entrance of the fishway is characterized by 11 evenly spaced baffles to
control flow and reduce potential bank erosion, the interior of the fishway and downstream
entrance are characterized by natural rocky substrate (e.g., cobble, boulders). Fixed receiver
stations are represented by antennas at the up- and down- stream entrance of the fishway. The
two antennas depicted at the upstream entrance account for one fixed receiver station, whereas
the single antenna at the downstream entrance accounts for a separate fixed receiver station.
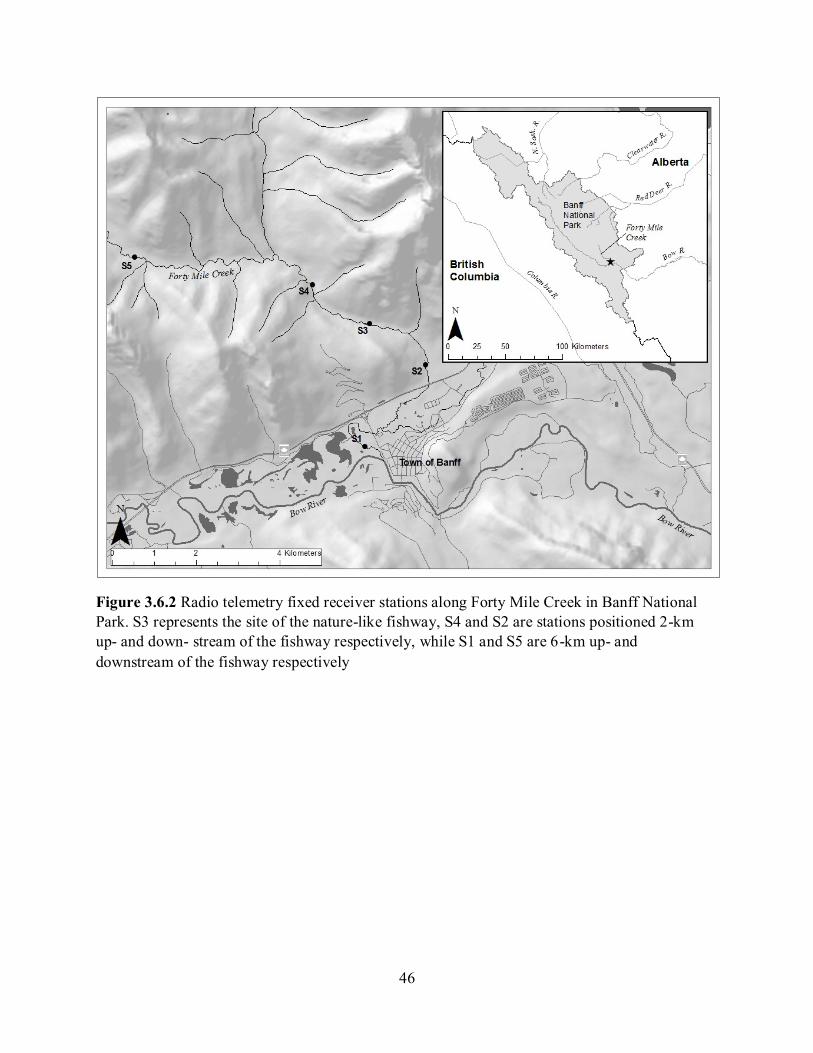
46
Figure 3.6.2 Radio telemetry fixed receiver stations along Forty Mile Creek in Banff National
Park. S3 represents the site of the nature-like fishway, S4 and S2 are stations positioned 2-km
up- and down- stream of the fishway respectively, while S1 and S5 are 6-km up- and
downstream of the fishway respectively
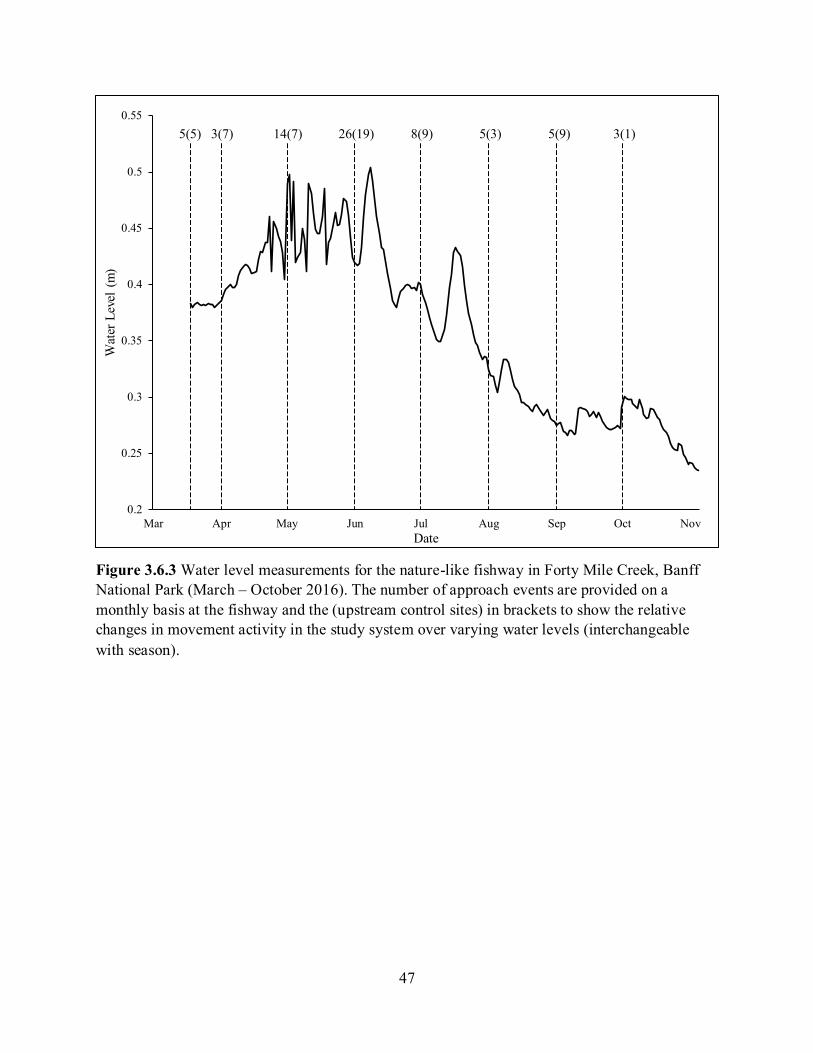
47
Figure 3.6.3 Water level measurements for the nature-like fishway in Forty Mile Creek, Banff
National Park (March – October 2016). The number of approach events are provided on a
monthly basis at the fishway and the (upstream control sites) in brackets to show the relative
changes in movement activity in the study system over varying water levels (interchangeable
with season).
0.2
0.25
0.3
0.35
0.4
0.45
0.5
0.55
Mar Apr May Jun Jul Aug Sep Oct Nov
Wat
er L
evel
(m
)
Date
5(5) 3(7) 14(7) 26(19) 8(9) 5(3) 5(9) 3(1)
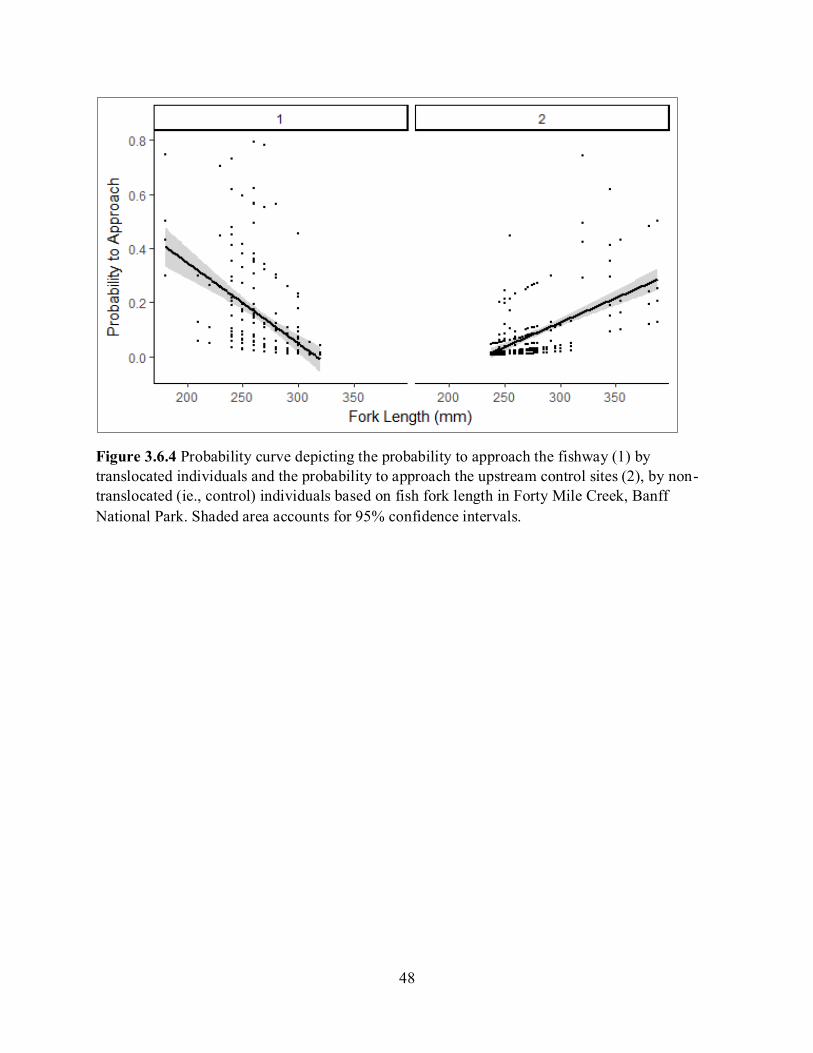
48
Figure 3.6.4 Probability curve depicting the probability to approach the fishway (1) by
translocated individuals and the probability to approach the upstream control sites (2), by non-
translocated (ie., control) individuals based on fish fork length in Forty Mile Creek, Banff
National Park. Shaded area accounts for 95% confidence intervals.
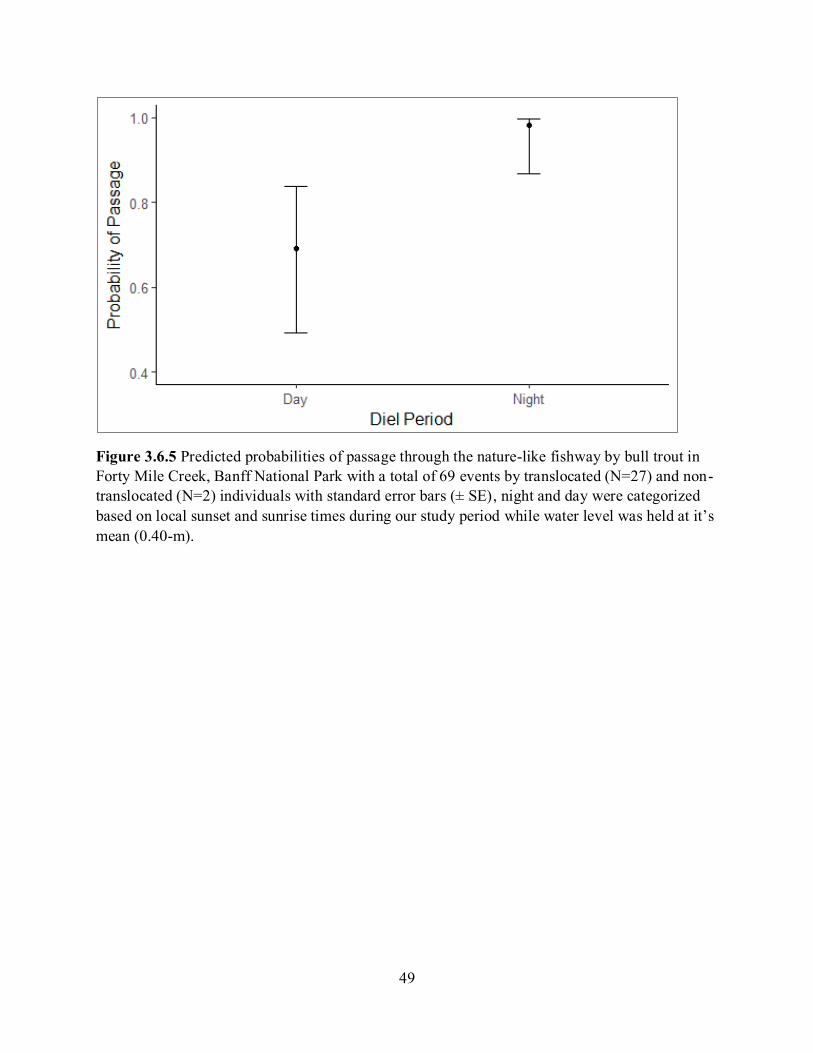
49
Figure 3.6.5 Predicted probabilities of passage through the nature-like fishway by bull trout in
Forty Mile Creek, Banff National Park with a total of 69 events by translocated (N=27) and non-
translocated (N=2) individuals with standard error bars (± SE), night and day were categorized
based on local sunset and sunrise times during our study period while water level was held at it’s
mean (0.40-m).
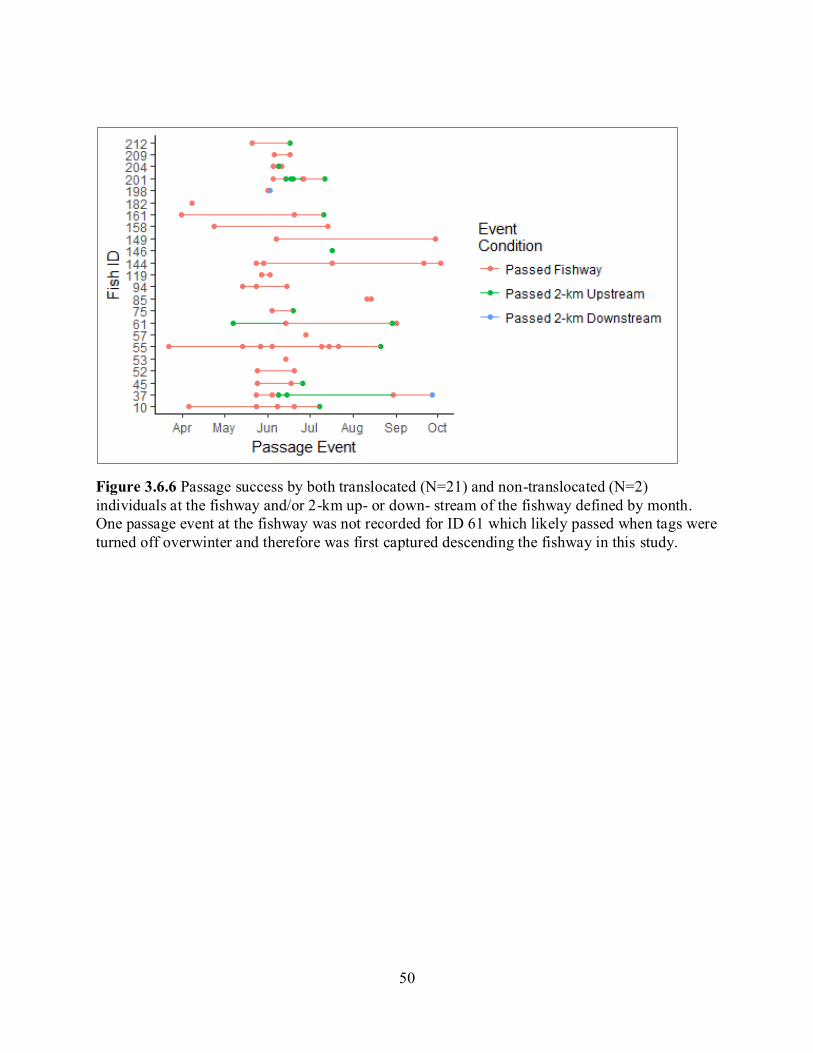
50
Figure 3.6.6 Passage success by both translocated (N=21) and non-translocated (N=2)
individuals at the fishway and/or 2-km up- or down- stream of the fishway defined by month.
One passage event at the fishway was not recorded for ID 61 which likely passed when tags were
turned off overwinter and therefore was first captured descending the fishway in this study.
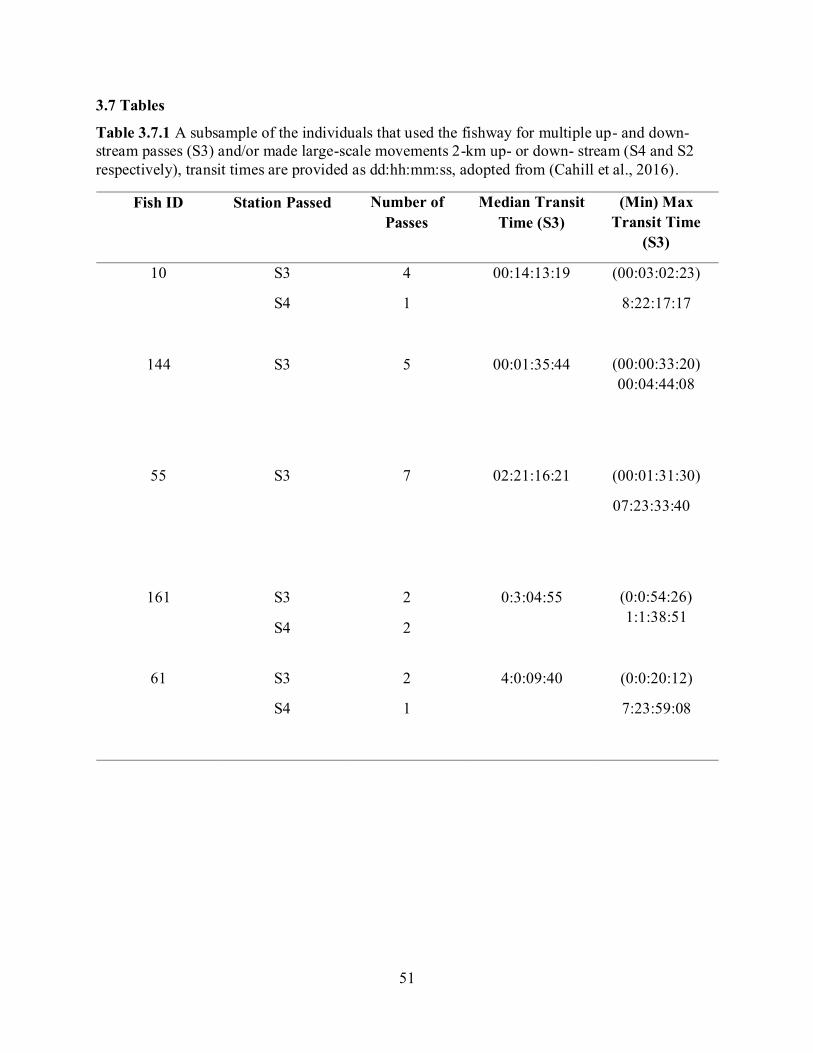
51
3.7 Tables
Table 3.7.1 A subsample of the individuals that used the fishway for multiple up- and down-
stream passes (S3) and/or made large-scale movements 2-km up- or down- stream (S4 and S2
respectively), transit times are provided as dd:hh:mm:ss, adopted from (Cahill et al., 2016).
Fish ID Station Passed Number of
Passes
Median Transit
Time (S3)
(Min) Max
Transit Time
(S3)
10 S3 4 00:14:13:19
(00:03:02:23)
8:22:17:17
S4 1
144 S3 5 00:01:35:44
(00:00:33:20)
00:04:44:08
55 S3 7 02:21:16:21
(00:01:31:30)
07:23:33:40
161 S3
S4
2
2
0:3:04:55
(0:0:54:26)
1:1:38:51
61 S3 2 4:0:09:40
(0:0:20:12)
7:23:59:08
S4 1
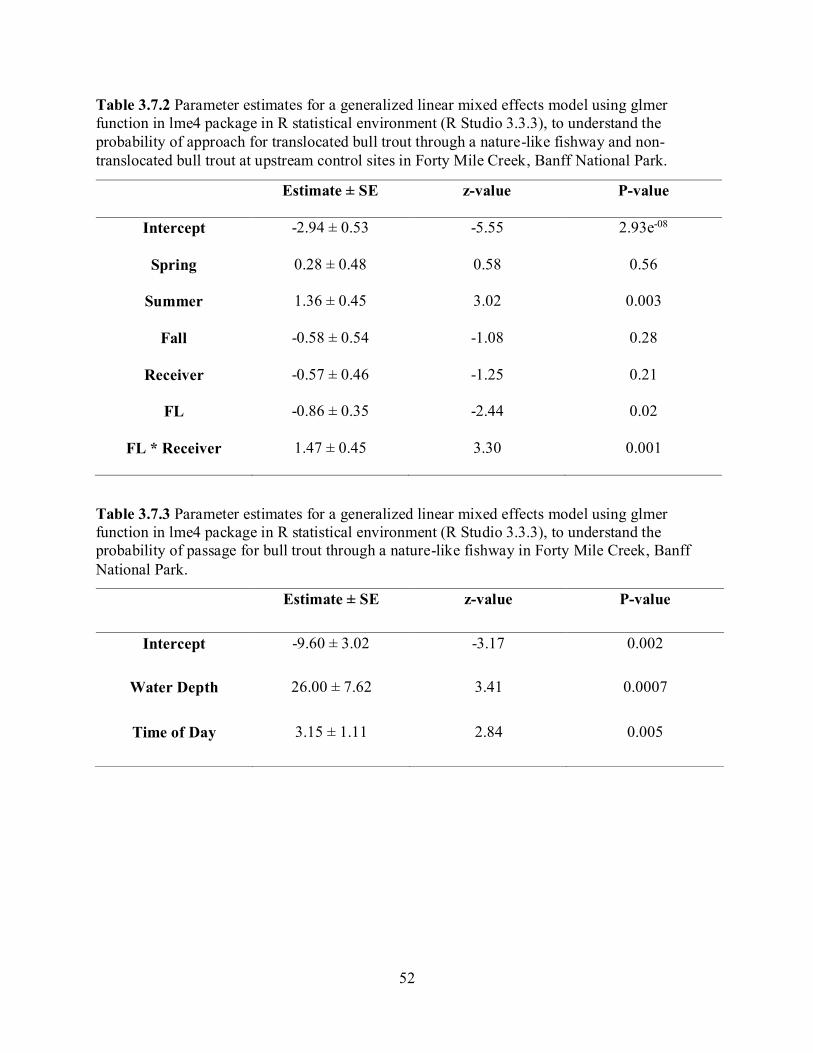
52
Table 3.7.2 Parameter estimates for a generalized linear mixed effects model using glmer
function in lme4 package in R statistical environment (R Studio 3.3.3), to understand the
probability of approach for translocated bull trout through a nature-like fishway and non-
translocated bull trout at upstream control sites in Forty Mile Creek, Banff National Park.
Estimate ± SE z-value P-value
Intercept -2.94 ± 0.53 -5.55 2.93e-08
Spring 0.28 ± 0.48 0.58 0.56
Summer 1.36 ± 0.45 3.02 0.003
Fall -0.58 ± 0.54 -1.08 0.28
Receiver -0.57 ± 0.46 -1.25 0.21
FL -0.86 ± 0.35 -2.44 0.02
FL * Receiver 1.47 ± 0.45 3.30 0.001
Table 3.7.3 Parameter estimates for a generalized linear mixed effects model using glmer
function in lme4 package in R statistical environment (R Studio 3.3.3), to understand the
probability of passage for bull trout through a nature-like fishway in Forty Mile Creek, Banff
National Park.
Estimate ± SE z-value P-value
Intercept -9.60 ± 3.02 -3.17 0.002
Water Depth 26.00 ± 7.62 3.41 0.0007
Time of Day 3.15 ± 1.11 2.84 0.005
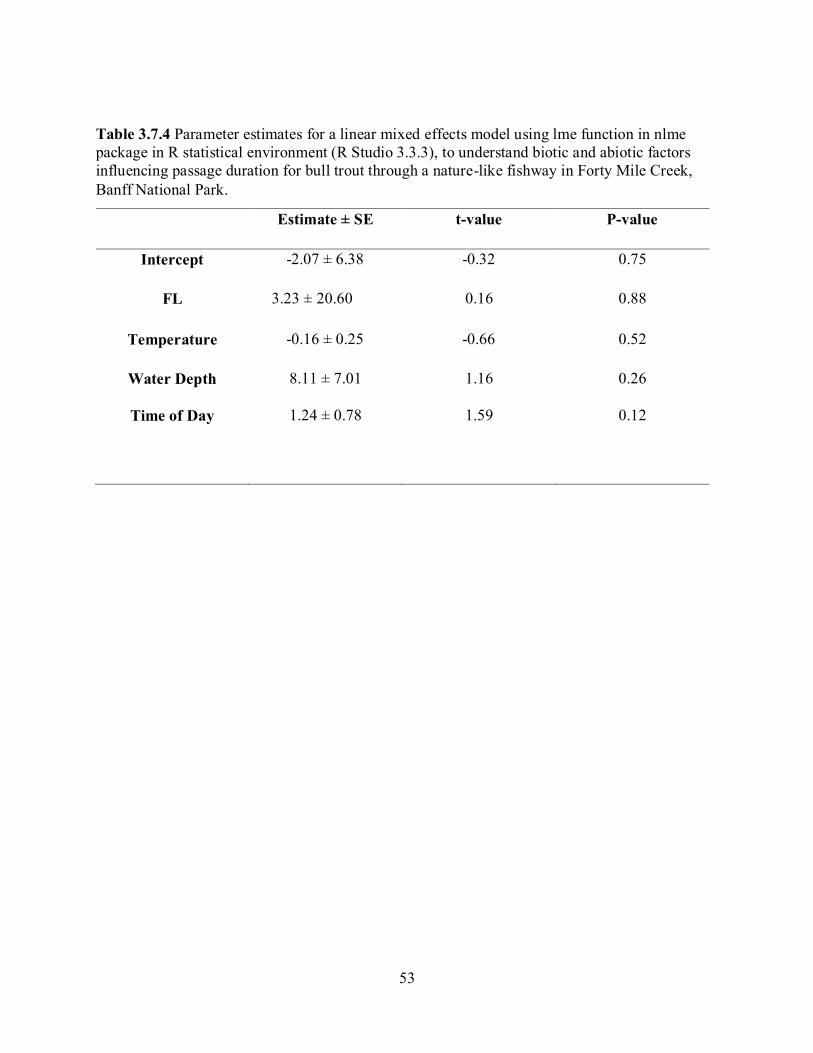
53
Table 3.7.4 Parameter estimates for a linear mixed effects model using lme function in nlme
package in R statistical environment (R Studio 3.3.3), to understand biotic and abiotic factors
influencing passage duration for bull trout through a nature-like fishway in Forty Mile Creek,
Banff National Park.
Estimate ± SE t-value P-value
Intercept -2.07 ± 6.38 -0.32 0.75
FL 3.23 ± 20.60 0.16 0.88
Temperature -0.16 ± 0.25 -0.66 0.52
Water Depth 8.11 ± 7.01 1.16 0.26
Time of Day 1.24 ± 0.78 1.59 0.12
54
Chapter 4: General Discussion
4.1 Findings and Implications
As an effort to improve dam removal science around the globe and expand the knowledge
base on restoring connectivity in streams (i.e., nature-like fishways), this thesis began with a
review that synthesized the methodologies and trends in fish responses to dam removal. It was
found that most studies lacked an appropriate experimental design (including replicability,
reliability, and relevance) to properly test whether dam removal is achieving fish restoration
objectives. These findings will hopefully stimulate discussion and action towards using data in
creative ways through extracting information from long-term monitoring programs or
comparative watersheds to understand the system prior to dam removal, as well as putting
monitoring programs in place for systems that will likely undergo dam decommissioning in the
coming years. By allocating resources that focus on well-defined research and monitoring efforts
over long-term timescales (using multiple end points), it will be possible to grow a high-quality
evidence base for future research in an era where dam decommissioning is likely to occur more
than ever before (Poff & Hart, 2002), and the importance of evidence based decision-making is
at large (Sutherland et al., 2004).
Chapter 3 set out to investigate the effectiveness of a nature-like fishway in supporting
the up- and down- stream movement of bull trout following the partial removal of a small-scale
dam. The biological evaluation of the nature-like fishway explored both abiotic and biotic factors
that may influence the probability to approach, probability of passage and passage duration. It
was found that the probability to approach the fishway was low when individuals were
translocated downstream of the fishway (37%), but for those that approached the fishway, their
passage success was high, with a passage efficiency of 78%. Movement captured at the nature-
like fishway by translocated individuals was similar to non-translocated individuals at upstream
55
control sites. Passage success was determined by water depth and time of day, while passage
duration ranged from 5-min to upwards of 13-days, showing that the fishway could have other
purposes for fish (e.g., foraging). This research also suggests that resident bull exhibit size
dependent movement that may be triggered from displacement (i.e., translocation), or level of
habitat use (i.e., non-translocated).
4.2 Future Directions
As part of Chapter 2, we provided guidance for improving the evidence base on dam
removal in meeting fish restoration objectives. When future research pertaining to dam removal
cannot effectively follow these guidelines due to time limitations (i.e., possible dam failure,
liability) or lack of sufficient baseline data (e.g., including watershed reference data), we
encourage researchers to evaluate the study system itself and proceed accordingly. For example,
instead of quantifying fish response to dam removal directly, it can be combined with other
topics to answer pressing questions that will enrich the evidence base in other ways (i.e., nature-
like fishways), in doing so we will gain a better understanding of system connectivity as a whole.
As part of Chapter 3, we noted size dependent movement patterns in non-translocated
(control) individuals, in which large individuals were more mobile than their smaller
counterparts. Gerking (1959) proposed a theory concerning the restricted movement of stream
fishes, that was later termed a paradigm for salmonid biology. The so-called “restricted
movement paradigm” (RMP) proposed that resident stream-dwelling salmonids are sedentary
and stay within deep pools with little movement outside of these small home ranges (less than a
few 100-m; defined in Gowan et al., 1994). However, most of the studies that support this
paradigm rely on mark re-capture estimates that have been recognized as biased for detecting
movement (e.g., Gerking, 1953; Berra & Gunning 1972). In recognition of this, researchers have
56
moved towards using telemetry to depict movement patterns in resident fishes. By using
telemetry, it has been found that many resident species undergo extensive up- and down-stream
movements (Walker et al., 2012), and furthermore these movements have the potential of being
an important indicator of habitat enhancement (Deboer et al., 2015).
Future research should focus on understanding the mechanisms that influence size
dependent movements for bull trout on a continuous scale (i.e., fixed receiver stations) with
supplemental fine-scale manual tracking to assess habitat use (as a potential trigger for
movement). This will provide clarity on the patterns (or processes) defining these movements,
from which an evidence-based approach to fisheries management (e.g., regulations, habitat
modifications) can be enacted that accounts for the “size dependent” mobile and sedentary
components of this threatened salmonid’s population.
4.3 Conclusion
We hope this thesis advances dam removal science across the globe and connects the topic of
dam removal with other important areas of research (i.e., nature-like fishways). With case studies on
the topic of dam removal (that follow guidelines/advice provided in this thesis) as well as those that
combine dam removal with nature-like fishways together (as shown in Chapter 3), we will be able to
continue to enrich the knowledge base for restoring connectivity in riverine systems in the years to
come.
57
References
Aarestrup, K., Lucas, M.C. and Hansen, J.A., 2003. Efficiency of a nature‐like bypass channel
for sea trout (Salmo trutta) ascending a small Danish stream studied by PIT
telemetry. Ecology of freshwater fish 12, 160-168.
Akaike, H., 1974. A new look at the statistical model identification. IEEE transactions on
automatic control 19, 716-723.
Alberta Sustainable Resource Development 2012. Bull trout Conservation Management Plan
2012-17. Alberta Sustainable Resource Development, Species at Risk Conservation
Management Plan No. 8. Edmonton, AB, 90.
Alvarez, D. and Nicieza, A.G. 2003. Predator avoidance behaviour in wild and hatchery‐reared
brown trout: the role of experience and domestication. Journal of Fish Biology 63, 1565-
1577.
Bradford, M.J., Smokorowski, K.E., Clarke, K.E., Keatley, B.E., Wong, M.C. 2016. Equivalency
metrics for determining offset requirements for the Fisheries Protection Program. Research
Document, Pacific Region, 046.
Bernhardt, E.S., Palmer, M.A., 2011. River restoration: the fuzzy logic of repairing reaches to
reverse catchment scale degradation. Ecological applications 21, 1926-1931.
Bates, D., Maechler, M., Bolker, B., Walker, S. 2015. Fitting Linear Mixed-Effects Models
Using lme4. Journal of Statistical Software 67, 1-48.
58
Berra, T. M., and G. E. Gunning. 1972. Seasonal movement and home range of the longear
sunfish, Lepomis megalotis (Rafinesque), in Louisiana. American Midland Naturalist, 88,
368-375.
Billington, D.P., Jackson, D.C. and Melosi, M.V. 2005. The history of large federal dams:
planning, design, and construction in the era of big dams. Government Printing Office.
Bunt, C.M., Castro‐Santos, T. and Haro, A., 2012. Performance of fish passage structures at
upstream barriers to migration. River Research and Applications 28, 457-478.
Calles, E.O. and Greenberg, L.A., 2007. The use of two nature‐like fishways by some fish
species in the Swedish River Emån. Ecology of freshwater fish 16, 183-190.
Calles, O. and Greenberg, L. 2009. Connectivity is a two‐way street—the need for a holistic
approach to fish passage problems in regulated rivers. River Research and Applications 25,
1268-1286.
Castro-Santos, T. and Haro, A. 2003. Quantifying migratory delay: a new application of survival
analysis methods. Canadian Journal of Fisheries and Aquatic Sciences, 60, 986-996.
Castro-Santos, T., A. Cotel, and P. W. Webb. 2009. Fishway evaluations for better
bioengineering: an integrative approach. in A. J. Haro, K. L. Smith, R. A. Rulifson, C. M.
Moffit, R. J. Klauda, M. J. Dadswell, R. A. Cunjak, J. E. Cooper, K. L. Beal, and T. S.
Avery, editors. Challenges for diadromous fishes in a dynamic global environment.
American Fisheries Society, Symposium 69, Bethesda, Maryland. 557-575.

59
Carson, R.J. 2001. Bull trout spawning movements and homing behaviour back to pre-spawning
locations in the McLeod River, Alberta. In Bull Trout II Conf. Proc. M.K. Brewin and M.
Monita (editors). Trout Unlimited Canada, Calgary, Alta. 137–140.
Chatham, L., 2007. Carbonton Dam – Deep River Watershed Restoration Site. Annual Report
EEP Project No. D-04012A.
Clapp, D.F., Clark R.D. and Diana, J.S. 1990. Range, activity, and habitat of large, free-ranging
brown trout in a Michigan stream. Transactions of the American Fisheries Society 119,
1022-1034.
Cooke, S.J. and Hinch, S.G., 2013. Improving the reliability of fishway attraction and passage
efficiency estimates to inform fishway engineering, science, and practice. Ecological
Engineering 58, 123-132.
Clay, C. H. 1994. Design of fishways and other fish facilities. CRC Press.
Cooke, S. J., Paukert, C., & Hogan, Z. 2012. Endangered river fish: factors hindering
conservation and restoration. Endangered Species Research 17, 179-191.
COSEWIC. 2012. COSEWIC assessment and status report on the Bull Trout Salvelinus
confluentus in Canada. Committee on the Status of Endangered Wildlife in Canada. Ottawa.
(www.registrelep-sararegistry.gc.ca/default_e.cfm).
Deboer, J.A., Holtgren, J.M., Ogren, S.A. and Snyder, E.B., 2015. Movement and habitat use by
mottled sculpin after restoration of a sand-dominated 1st-order stream. The American
Midland Naturalist, 173, 335-345.
60
Dudgeon, D., Arthington, A.H., Gessner, M.O., Kawabata, Z.I., Knowler, D.J., Leveque, C.,
Naiman, R.J., Prieur-Richard, A.H., Soto, D., Stiassny, M.L.J., Sullivan, C.A. 2006.
Freshwater biodiversity: importance, threats, status and conservation challenges. Biological
Reviews 81, 163-182.
Dugan, P.J., Barlow, C., Agostinho, A.A., Baran, E., Cada, G.F., Chen, D., Cowx, I.G.,
Ferguson, J.W., Jutagate, T., Mallen-Cooper, M. and Marmulla, G. 2010. Fish migration,
dams, and loss of ecosystem services in the Mekong basin. AMBIO: A Journal of the
Human Environment 39, 344-348.
Egglishaw, H.J. and Shackley, P.E., 1982. Influence of water depth on dispersion of juvenile
salmonids, Salmo salar L. and S. trutta L., in a Scottish stream. Journal of Fish Biology 21,
141-155.
Ellis, L.E., Jones, N.E. 2013. Longitudinal trends in regulated rivers a review and synthesis
within the context of serial discontinuity concept. Environmental Reviews 21, 136-148.
Elosegi, A., Sabatar, S. 2013. Effects of hydromorphological impacts on river ecosystem
functioning: a review and suggestions for assessing ecological impacts. Hydrobiologia 712,
129-143.
Fjeldstad, H.P., Barlaup, B.T., Stickler, M., Gabrielsen, S.E., Alfredsen, K. 2012. Removal of
weirs and the influence on physical habitat for salmonids in a Norwegian river. River
research and applications 28, 753-763.
61
Franklin, A.E., Haro, A., Castro-Santos, T. and Noreika, J. 2012. Evaluation of nature-like and
technical fishways for the passage of alewives at two coastal streams in New
England. Transactions of the American Fisheries Society 141, 624-637.
Fullerton, A.H., Burnett, K.M., Steel, E.A., Flitcroft, R.L., Pess, G.R., Feist, B.E., Torgersen,
C.E., Miller, D.J., Sanderson, B.L. 2010. Hydrological connectivity for riverine fish:
measurement challenges and research opportunities. Freshwater Biology 55, 2215-2237.
Furey, N. B., Hinch, S. G., Lotto, A. G., Beauchamp, D. A. 2015. Extensive feeding on sockeye
salmon Oncorhynchus nerka smolts by bull trout Salvelinus confluentus during initial
outmigration into a small, unregulated and inland British Columbia river. Journal of fish
biology 86, 392-401.
Gerking, S.D., 1953. Evidence for the concepts of home range and territory in stream
fishes. Ecology, 34, 347-365.
Gottgens, J.F., Arceo, A.I., Crail, T.D., 2009. Impact of the Removal of the Secor Road Dam on
the Fish Community Structure and Composition in the Ottawa River, Ohio. Final Report to
Toledo Metropolitan Area Council of Governments Project, 6.
Gowan, C. and Fausch, K.D. 2002. Why do foraging stream salmonids move during summer?
In Ecology, behaviour and conservation of the charrs, genus Salvelinus. Springer
Netherlands, 139-153.
Graf, W.L. 2006. Downstream hydrologic and geomorphologic effects of large dams on
American rivers. Geomorphology 79, 336-360.
62
Gregory, S., Li, H., Li, J. 2002. The conceptual basis for ecological responses to dam removal.
American Institute of Biological Sciences 52, 713-723.
Halvorsen, M., Stabell, O.B., 1990. Homing behaviour of displaced stream-dwelling brown
trout. Animal Behaviour 39, 1089-1097.
Hart, D.D., Poff, L. 2002 Special section on dam removal and river restoration. BioScience 52,
653-655.
Hart, David D., Thomas E. Johnson, Karen L. Bushaw-Newton, Richard J. Horwitz, Angela T.
Bednarek, Donald F. Charles, Daniel A. Kreeger, and David J. Velinsky. 2002. Dam
removal: challenges and opportunities for ecological research and river restoration: we
develop a risk assessment framework for understanding how potential responses to dam
removal vary with dam and watershed characteristics, which can lead to more effective use
of this restoration method. BioScience 52, 669-682.
Heck R. H., Thoma, S.L., Tabata, L.N. 2010. Multilevel and Longitudinal Modeling with IBM
SPSS. Routledge, Taylor & Francis Group: New York, NY.
Helms, B.S., Werneke, D.C., Gangloff, M.M., Hartfield, E.E., Feminella, J.W. 2011. The
influence of low-head dams on fish assemblages in streams across Alabama. Journal of the
North American Benthological Society 30, 1095-1106.
Hirethota, P.S., Burzinski, T. E., Eggold, B.T. 2005. Changing habitat and biodiversity of the
lower Milwaukee River and estuary. Wisconsin Department of Natural Resources. Technical
Report. Milwaukee, Wisconsin.
63
Hohausova, E., Copp, G.H. and Jankovský, P., 2003. Movement of fish between a river and its
backwater: diel activity and relation to environmental gradients. Ecology of Freshwater Fish
12, 107-117.
Holmes, R.T., Likens, G.E., 2016. Hubbard Brook: the story of a forest ecosystem. Yale
University Press.
International Commission on Large Dams. 2015. Register of Dams. http://www.icoldcigb.
org/GB/World_register/general_synthesis.asp. Accessed February 2, 2016.
Jakober, M.J., 1995. Autumn and winter movement and habitat use of resident bull trout and
westslope cutthroat trout in Montana Doctoral dissertation, Montana State University-
Bozeman, College of Letters & Science.
Jakober, M.J., McMahon, T.E., Thurow, R.F. and Clancy, C.G., 1998. Role of stream ice on fall
and winter movements and habitat use by bull trout and cutthroat trout in Montana
headwater streams. Transactions of the American Fisheries Society 127, 223-235.
Jakober, M. J., McMahon, T. E., & Thurow, R. F. 2000. Diel habitat partitioning by bull charr
and cutthroat trout during fall and winter in rocky mountain streams. Environmental Biology
of Fishes 59, 79-89.
Jansson, R., Nilsson, C., Malmqvist, B. 2007. Restoring freshwater ecosystems in riverine
landscapes: the roles of connectivity and recovery processes. Freshwater Biology 52, 589-
596.
64
Katopodis, C., Kells, J.A. and Acharya, M., 2001. Nature-like and conventional fishways:
Alternative concepts? Canadian Water Resources Journal 26, 211-232.
Katopodis, C., & Williams, J. G. 2012. The development of fish passage research in a historical
context. Ecological Engineering 48, 8-18.
Liermann, C.R., Nilsson, C., Robertson, J. and Ng, R.Y., 2012. Implications of dam obstruction
for global freshwater fish diversity. BioScience, 62, 539-548.
Ligon, F.K., Dietrich, W.E., Trush, W.J. 1995. Downstream ecological effects of dams.
BioScience 45, 183-192.
Likens, G.E., Buso, D.C., 2006. Variation in streamwater chemistry throughout the Hubbard
Brook Valley. Biogeochemistry 78, 1-30.
Lucas, M. and Baras, E., 2000. Migration of freshwater fishes. John Wiley & Sons.
Magilligan, F.J., Nislow, K.H., Kynard, B.E. and Hackman, A.M. 2016. Immediate changes in
stream channel geomorphology, aquatic habitat, and fish assemblages following dam
removal in a small upland catchment. Geomorphology, 252: 158-170.
Mallen‐Cooper, M. and Brand, D.A., 2007. Non‐salmonids in a salmonid fishway: what do 50
years of data tell us about past and future fish passage? Fisheries Management and
Ecology 14, 319-332.
Maloney, K.O., Dodd, H.R., Butler, S.E., Wahl, D.H. 2008. Changes in macroinvertebrate and
fish assemblages in a medium-sized river following a breach of a low-head dam. Freshwater
Biology 53, 1055-2068.
65
Marschall, E.A., Mather, M.E., Parrish, D.L., Allison, G.W. and McMenemy, J.R., 2011.
Migration delays caused by anthropogenic barriers: modeling dams, temperature, and
success of migrating salmon smolts. Ecological Applications 21, 3014-3031.
McLaughlin, R.L., Smyth, E.R., Castro-Santos, T., Jones, M.L., Koops, M.A., Pratt, T.C., Velez-
Espino, L.A. 2013. Unintended consequences and trade-offs of fish passage. Fish and
Fisheries 14, 580-604.
McPhail, J.D., and Baxter, J.S. 1996. A review of bull trout (Salvelinus confluentus) life history
and habitat use in relation to compensation and improvement opportunities. Fish. Manage.
Report No. 104, Department of Zoology, The University of British Columbia, Vancouver.
Metcalfe, N.B., Fraser, N.H. and Burns, M.D. 1999. Food availability and the nocturnal vs.
diurnal foraging trade‐off in juvenile salmon. Journal of Animal Ecology 68, 371-381.
Muhlfeld, C.C., Glutting, S., Hunt, R., Daniels, D. and Marotz, B., 2005. Winter Diel Habitat
Use and Movement by Subadult Bull Trout in the Upper Flathead River, Montana. North
American Journal of Fisheries Management 23, 163-171.
Murray, D.L., 2006. On improving telemetry-based survival estimation. Journal of Wildlife
Management 70, 1530-1543.
Nilsson, C., Reidy, C.A., Dynesius, M., Revenga, C. 2005. Fragmentation and flow of the
world’s large river systems. Science 308, 405.
Noonan, M.J., Grant, J.W., Jackson, C.D. 2012. A quantitative assessment of fish passage
efficiency. Fish and Fisheries 13, 450-464.
66
Peter A. 1998. Interruption of the river continuum by barriers and the consequences for
migratory fish. In: Jungwirth M, Schmutz S, Weiss S (eds) Fish migration and fish bypasses.
Fishing News Books, Oxford, 99–112.
Pinheiro, J., Bates D., DebRoy, S., Deepayan, S. 2014. nlme: Linear and Nonlinear Mixed
Effects Models. R Core Team. URL: https://CRAN.R-project.org/package=nlme.
Podgorniak, T., Angelini, M., De Oliveira, E., Daverat, F. and Pierron, F. 2016. Selective
pressure of fishways upon morphological and muscle enzymatic traits of migrating glass
eels. Canadian Journal of Fisheries and Aquatic Sciences 9, 1-7.
Popowich, R.C., Venturelli, P.A., Stelfox, J.D. and Taylor, E.B. 2011. Validation of
morphological characteristics used for field identification of bull trout × brook trout
hybrids. North American Journal of Fisheries Management 31, 548-553.
Poff, N.L. and Hart, D.D., 2002. How dams vary and why it matters for the emerging science of
dam removal. BioScience 52, 659-668.
Poff, N.L., Zimmerman, J.K.H. 2010. Ecological responses to altered flow regimes: a literature
review to inform the science and management of environmental flows. Freshwater Biology
55, 194-205.
Prchalová, M., Slavík, O. and Bartoš, L., 2006. Patterns of cyprinid migration through a fishway
in relation to light, water temperature and fish circling behaviour. International Journal of
River Basin Management 4, 213-218.
67
Pringle, C. 2003. What is hydrologic connectivity and why is it ecologically important?.
Hydrological Processes 17, 2685-2689.
Raabe, J.K. and Hightower, J.E., 2014a. American Shad migratory behavior, weight loss,
survival, and abundance in a North Carolina river following dam removals. Transactions of
the American Fisheries Society 143, 673-688.
Raabe, J.K., Hightower, J.E. 2014b. Assessing distribution of migratory fishes and connectivity
following complete and partial dam removals in a North Carolina river. North American
Journal of Fisheries Management, 34, 955-969.
Rahel, F.J., Olden, J.D. 2008. Assessing the effects of climate change on aquatic invasive
species. Conservation Biology 22, 521-533.
Railsback, S.F., Harvey, B.C., Hayse, J.W. and LaGory, K.E., 2005. Tests of theory for diel
variation in salmonid feeding activity and habitat use. Ecology 86, 947-959.
Renofalt, B.M., Jansson, R., Nilsson, C. 2010. Effects of hydropower generation and
opportunities for environmental flow management in Swedish riverine ecosystems,
Freshwater Biology 55, 49-67.
Rodríguez, M.A., 2002. Restricted movement in stream fish: the paradigm is incomplete, not
lost. Ecology, 83, 1-13.
Rosenberg, D.M., Berkes, F. Bodaly, R.A. Hecky, R.E., Kelly, C.A., Rudd, J.W.M. 1997. Large-
scale impacts of hydroelectric development. Environmental Reviews 5, 27-54.
68
Roscoe, D.W. and Hinch, S.G., 2010. Effectiveness monitoring of fish passage facilities:
historical trends, geographic patterns and future directions. Fish and Fisheries 11, 12-33.
Schmetterling, D.A., Pierce, R.W. and Liermann, B.W. 2002. Efficacy of three Denil fish ladders
for low-flow fish passage in two tributaries to the Blackfoot River, Montana. North
American Journal of Fisheries Management 22, 929-933.
Schwalme, K., Mackay, W.C. and Lindner, D. 1985. Suitability of vertical slot and Denil
fishways for passing north-temperate, nonsalmonid fish. Canadian Journal of Fisheries and
Aquatic Sciences 42, 1815-1822.
Smithson, E.B. and Johnston, C.E. 1999. Movement patterns of stream fishes in a Ouachita
Highlands stream: an examination of the restricted movement paradigm. Transactions of the
American fisheries Society, 128, 847-853.
Smokorowski, K.E., Randall, R.G., 2017. Cautions on using the Before-After-Control-Impact
design in environmental effects monitoring programs. FACETS 2, 212-232.
Stanley, E.H. and Doyle, M.W. 2002. A geomorphic perspective on nutrient retention following
dam removal: Geomorphic models provide a means of predicting ecosystem responses to
dam removal. BioScience 52, 693-701.
Steffensen, S.M., Thiem, J.D., Stamplecoskie, K.M., Binder, T.R., Hatry, C., Langlois‐Anderson,
N. and Cooke, S.J. 2013. Biological effectiveness of an inexpensive nature‐like fishway for
passage of warmwater fish in a small Ontario stream. Ecology of Freshwater Fish 22, 374-
383.
69
Stuart, I.G., Mallen-Cooper, M., 1999. An Assessment of the Effectiveness of a Vertical-Slot
Fishway for Non-Salmonid Fish at a Tidal Barrier on a Large Tropical/Sub Tropical
River. Regulated Rivers: Research & Management 15, 575-590.
Swanberg, T.R. 1997. Movements of and habitat use by fluvial bull trout in the Blackfoot River,
Montana. Transaction of the American Fisheries Society 126, 735–746.
Sutherland, W.J., Pullin, A.S., Dolman, P.M. and Knight, T.M., 2004. The need for evidence-
based conservation. Trends in ecology & evolution, 19, 305-308.
Taylor, M.K., Hasler, C.T., Findlay, C.S., Lewis, B., Schmidt, D.C., Hinch, S.G. and Cooke, S.J.,
2014. Hydrologic correlates of bull trout (Salvelinus confluentus) swimming activity in a
hydropeaking river. River research and applications 30, 756-765.
Thiem, J.D., Binder, T.R., Dawson, J.W., Dumont, P., Hatin, D., Katopodis, C., Zhu, D.Z. and
Cooke, S.J., 2011. Behaviour and passage success of upriver-migrating lake sturgeon
Acipenser fulvescens in a vertical slot fishway on the Richelieu River, Quebec,
Canada. Endangered Species Research 15, 1-11.
Vörösmarty, C. J., McIntyre, P. B., Gessner, M. O., Dudgeon, D., Prusevich, A., Green, P.,
et al. 2010. Global threats to human water security and river biodiversity. Nature
467, 555−561.
Wiens, J. A. 2002. Riverine landscapes: taking landscape ecology into the water. Freshwater
Biology 47, 501-515.

70
Walker, R.H., Adams, G.L. and Reid Adams, S., 2013. Movement patterns of southern redbelly
dace, Chrosomus erythrogaster, in a headwater reach of an Ozark stream. Ecology of
Freshwater Fish, 22, 216-227.