Embed Size (px)
Citation preview
flyn
F~IL IUJyNWC TP 69880In
00
Coso Monitoring ProgramOctober 1987 Through September 1988
byE. M. Edwards
andD. E. Condon
Comarco Weapons Support Divisionfor the
Geothermal Program OfficePublic Works Department
APRIL 1989
NAVAL WEAPONS CENTERCHINA LAKE, CA 93555-6001
Approved for public release; distribution is unlimited.
DTICELECTE
FEB 26 fl990 02 23
i .4"
Naval Weapons Center
FOREWORD
This report presents the status of the Coso Monitoring Program conducted for the periodOctober 1987 through September 1988 by the Naval Weapons Center (NWC), China Lake,Calif. The investigation funded under the NWC Coso Geothermal Development Program, isbeing conducted to provide baseline information on hydrology and surface geothermal activityin the Coso Hot Springs area.
The Coso Monitoring Program was carried out under Comarco contractN60530-83-D-0024 for the Public Works Department, NWC.
This report was reviewed for technical accuracy by Steven C. Bjornstad.
Approved by Under authority ofK. C. KELLEY J. A. BURTCapt., CEC, U.S. Navy Capt., U.S. NavyPublic Works Officer Commander3 April 1989
Released for publication byG. R. SCHIEFERTechnical Director
NWC Technical Publication 6988
Published by ............................................. Public Works DepartmentCollation .......................................................... Cover, 55 leavesFirst printing ........................................................... 150 copies
IUNCLASSIFIED
SECURITY CLASSIFICATION OF THIS PAGE (When Data Entered)
REPORT DOCUMENTATION PAGEI a REPORT SECURITY CLASSIFICATION lb RESTRICTIVE MARKINGS
UNCLASSIFIED
2a SECURITY CLASSIFICATION AUTHORITY 3 DISTRIBUTION/AVAILABILTY OF REPORT
2b _____________________________ _ SCHEDULEApproved for public release; distribution is unlimited.W2b DECLASSIF1CATION/DOWNGRA DING SCHEULE
I4 PERFORMING ORGANIZATION REPORT NUMBER(S) S MONITORING ORGAN ZATION REPORT NUMBER(S)
NWC TP 6988Sa NAME OF PERFORMING ORGANIZATION 61b OFFICE SYMBOL 7a NAAE OF MONITORING ORGANIZATION
* (If Aplicable)
Naval Weapons Center If___________
Sc ADDRESS (City, State, and ZIP Code) 7b ADDRESS (City, State, nd ZIP Code)
China Lake, CA 93555-6001Sa NAME OF FUNOING/SPONSORING ORGANIZATION Tb OFFICE SYMBOL 9 PROCUREMENT INSTRUMENT IDENTIFICATION NUMBER
Naval Weapons Center (11 Applc-bl) N60530-83-D-0024
Sc Address (City, State, and ZIP Code) 10 SOURCE OF FUNDING NUMBERS
China Lake, CA 93555-6001 PROGRAM PROJECT NO TASK NO WORK UNIT NOELEMENT NO
See back of form.
1 TITLE (Include Security Classification)
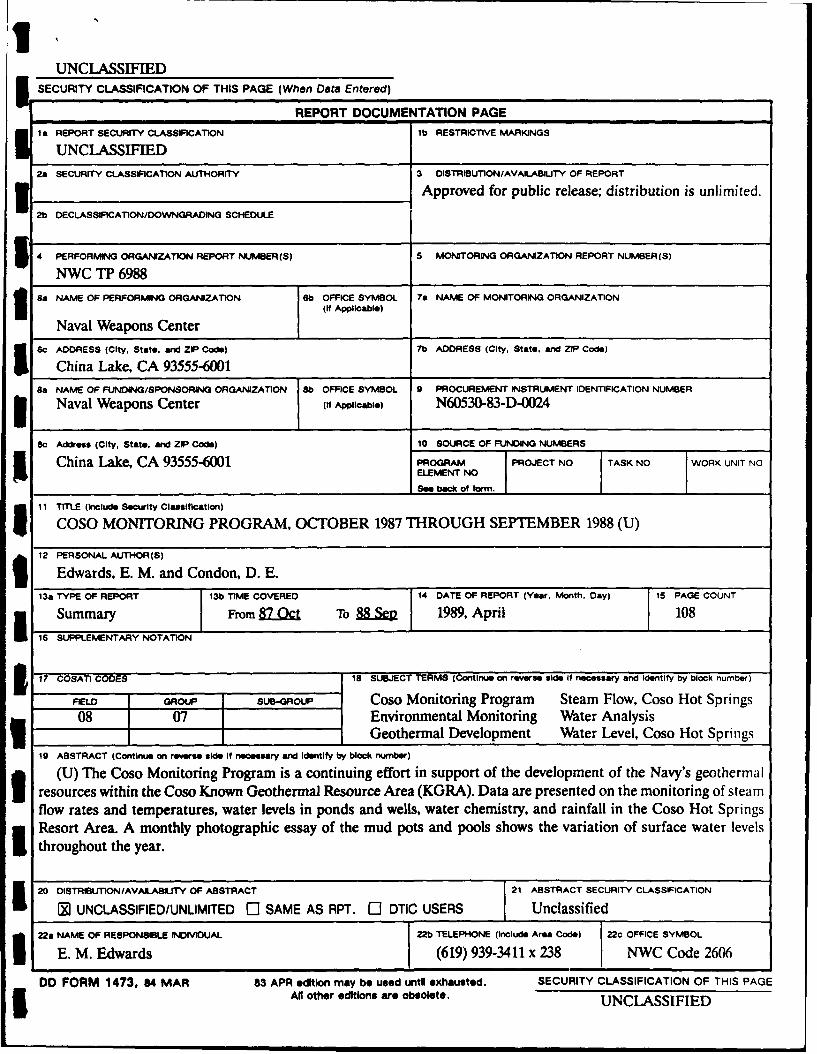
COSO MONITORING PROGRAM, OCTOBER 1987 THROUGH SEPTEMBER 1988 (U)
12 PERSONAL AUTHOR(S)
Edwards, E. M. and Condon, D. E.
13a TYPE OF REPORT 13b TIME COVERED 14 DATE OF REPORT (Year, Month, Day) 15 PAGE COUNT
Summary From 87Ogt To 88 Sep 1989, April 10816 SUPPLEMENTARY NOTATION
17 COSATI CODES 18 SUBJECT TERMS (Continue on r ewse side If necessary and identify by block number)
SIELD_ GRO. sU-oouP Coso Monitoring Program Steam Flow, Coso Hot Springs08 07 Environmental Monitoring Water Analysis
Geothermal Development Water Level, Coso Hot Springs19 ABSTRACT (Continue on reverse side If necessary and Identify by block number)
(U) The Coso Monitoring Program is a continuing effort in support of the development of the Navy's geothermalresources within the Coso Known Geothermal Resource Area (KGRA). Data are presented on the monitoring of steamflow rates and temperatures, water levels in ponds and wells, water chemistry, and rainfall in the Coso Hot SpringsResort Area. A monthly photographic essay of the mud pots and pools shows the variation of surface water levelsthroughout the year.
20 DISTRIBUTION/AVAILASILrTY OF ABSTRACT 21 ABSTRACT SECURITY CLASSIFICATION
(0 UNCLASSIFIED/UNLIMITED ] SAME AS RPT. Cl DTIC USERS Unclassified
22a NAME OF RESPONSIBLE INDIVIDUAL 22b TELEPHONE (Include Area Code) 22c OFFICE SYMBOL
E. M. Edwards (619) 939-3411 x 238 NWC Code 2606
DD FORM 1473, 84 MAR 83 APR edition may be used untU exhausted. SECURITY CLASSIFICATION OF THIS PAGEAl other editIons are obsolete. UNCLASSIFIED
UNCLASSIFIEDSECURITY CLASSIFICATION OF THIS PAGE (When Data Entered)
10. Contract N60530-83-D-0024.
COPY
Aooesaon 7W
DTIC TABtkinaounoed 0Just it 1eat o
By-
Dtstribut ion/__
Availability Cedes
Avall and/or
Dist Speoal
SECURITY CLASSIFICATION OF THIS PAGE
UNCLASSIFIED
NWC TP 6988
V CONTENTS
3 Introduction ........................................................................................ 3
Temperature and Steam Flow Monitoring ....................................................... 5D evils K itchen .................................................................................. 5Coso Resort Corrosion Array ................................................................ 7Two-Inch Steam Well ..................................................................... 9Eight-Inch "Stove-Pipe" Well ........................................................... 10Schober's Resort ............................................................................. 12Coso Mud Pots ........................................................................... 15
Other Geothermal Activity at Coso ............................................................. 16
Coso Mud Pot Photographic Investigation ................................................. 17
3 Water Level Monitoring ..................................................................... 30
Rainfall at Coso Resort Area and Rose Valley ................................................ 34
Water Analysis of Coso Hot Springs Area Sites ............................................. 38
Plans for 1989 .................................................................................... 46
Summary ..................................................... 46
R eferences ......................................................................................... 47I Appendixes:
A. Daily Steam Flow Data ................................................................. 49B. Daily Temperature Data ............................................................. 77
Figures:1. Monitoring Sites ....................................................................... 42. Devils Kitchen Steam Flow ....................................3. Devils Kitchen Steam Flow Manometer Readings ............................... 64. Coso Resort Corrosion Array Steam Flow ...................... 75. Coso Resort Corrosion Array Steam Flow ........................................ 86. Two-Inch Steam Well Steam Flow ................................................. 97. Two-Inch Steam Well Temperature ............................................... 108. Eight-Inch "Stove-Pipe" Well Manometer Readings ............................ 119. Schober's Resort Steam Flow ...................................................... 12
10. Schober's Resort Steam Temperature, OF ...................................... 1311. Schober's Resort Ambient Temperature, OF ...................................... 1412. Coso Resort Mud Pot Ambient Temperature, OF ................................. 1513. Coso Resort Mud Pot Water Temperature, OF ........... . . . . . . . . . . . . . . . . . . . . . . . . . 1614. Coso Mud Pots, October 1987 ........................................................ 1815. Coso Mud Pots, November 1987 .................................................. 1916. Coso Mud Pots, December 1987 ................................ 2017. Coso Mud Pots, January 1988 ........................................................ 2131
I
NWC TP 6988
Figures (Contd.)18. Coso Mud Pots, February 1988 ..................................................... 2219. Coso Mud Pots, March 1988 .......................................................... 2320. Coso Mud Pots, April 1988 ......................................................... 2421. Coso Mud Pots, May 1988 .......................................................... 2522. Coso Mud Pots, June 1988 .......................................................... 2623. Coso Mud Pots, July 1988 ........................................................ 2724. Coso Mud Pots, August 1988 ......................................................... 2825. Coso Mud Pots, September 1988 ................................................... 2926. Stiff Diagram, Coso Well #1 ....................................................... 4427. Stiff Diagram, Observation Well #1 .............................................. 4428. Stiff Diagram, Well 4K-1 ........................................................... 45
Tables:1. Monitoring Functions and Locations ................................................ 32. Devils Kitchen Statistical Steam Flow Data,
Pounds Per Hour (pph) ............................................................... 63. Devils Kitchen Steam Flow Manometer Data ....................................... 64. Coso Resort Corrosion Array Statistical Steam Flow Data,
Pounds Per Hour (pph) ............................................................... 75. Coso Resort Corrosion Array Statistical Steam Flow Data,
Pounds Per Hour (pph) ........................................... .................. 86. Two-Inch Steam Well Statistical Steam Flow Data
Pounds Per Hour (pph) ............................................................... 97. Two-Inch Steam Well Statistical Steam Temperature
D ata, OF ................................................................................. 108. Eight-Inch "Stove-Pipe" Well Manometer Data ................................... 119. Schober's Resort Statistical Steam Flow Data,
Pounds Per Hour (pph) ............................................................. 1210. Schober's Resort Statistical Steam Temperature Data, OF ........................ 1311. Schober's Resort Statistical Ambient Temperature Data, OF .................... 1412. Coso Resort Mud Pot Statistical Ambient Temperature
D ata, OF ................................................................................. 1513. Coso Resort Statistical Mud Pot Water Temperature Data, OF .................... 1614. Elevation Data on Coso South Pool and Red Mud Pot,
October 1987 Through September 1988 ........................................... 3115. Summary of Water Levels at South Pool, True Elevation,
Referenced USGS Benchmark 3635-1905-13B, January 1980Through September 1988 .............................................................. 34
16. Inches of Rainfall Recorded at Coso Monitoring Stations ...................... 3517. Rose Valley Cumulative Rainfall, October 1987 Through
September 1988 ...................................................................... 3718. Chemical Analysis of 4K1 .......................................................... 3919. Chemical Analysis of Coso 1 .......................................................... 4020. Chemical Analysis of Red Mud Pots ............................................... 4121. Chemical Analysis of South Pool West Edge ...................................... 4222. Chemical Analysis of Devils Kitchen Array ..................................... 43
2
I •
NWC TP 6988
5 INTRODUCTION
The Coso Monitoring Program was initiated in 1978 to gather baseline data on thesurface and near surface geothermal activity at Devils Kitchen and Coso Hot Springs, themain thermal sites within the Coso Known Geothermal Resource Area (Coso KGRA).
IThis report represents the eleventh year of continual baseline data collection. Theauthors collected data and photographs and reduced data. Personnel in the GeothermalProgram Office have helped on the monitoring Program.
Monitored sites of the Coso Hot Springs area are referred to in Table 1 and Figure 1of this report. Monitoring functions for each site are also listed. Individual sites aredescribed only if new to the program or if a significant change to a site was made.
ZI -- --V
Schober's Resort X X
j Eight-Inch Steam Well X
Coso Well #1 X X
I Coso Corrosion Array X
3 Coso Mud Pots X X X X
South Pool X X X X
3 Well 4P- 1 X
Two-Inch Steam Well X X
Devils Kitchen Corrosion Array X X
Coso Well #2 X X
Observation Well #2 X
5 TABLE 1. Monitoring Functions and Locations.
1 3
NWC TP 6988
i.0 .
0 emu 0, 0
E CL
Cr0 //* f )-c~ .~
I I /
A92
C OL 4
NWC TP 6988
TEMPERATURE AND STEAM FLOW MONITORING
Steam flow and temperature are measured at several sites in the Coso Hot Springs
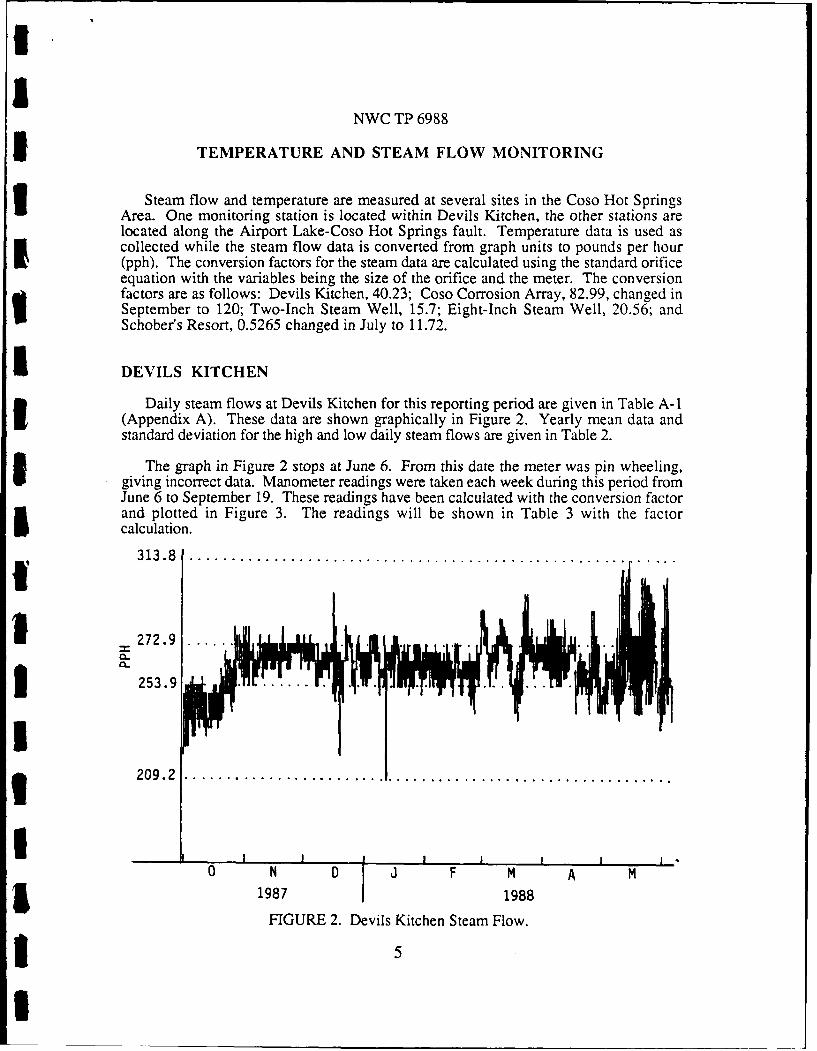
Area. One monitoring station is located within Devils Kitchen, the other stations arelocated along the Airport Lake-Coso Hot Springs fault. Temperature data is used ascollected while the steam flow data is converted from graph units to pounds per hour(pph). The conversion factors for the steam data are calculated using the standard orificeequation with the variables being the size of the orifice and the meter. The conversionfactors are as follows: Devils Kitchen, 40.23; Coso Corrosion Array, 82.99, changed inSeptember to 120; Two-Inch Steam Well, 15.7; Eight-Inch Steam Well, 20.56; andSchober's Resort, 0.5265 changed in July to 11.72.
DEVILS KITCHEN
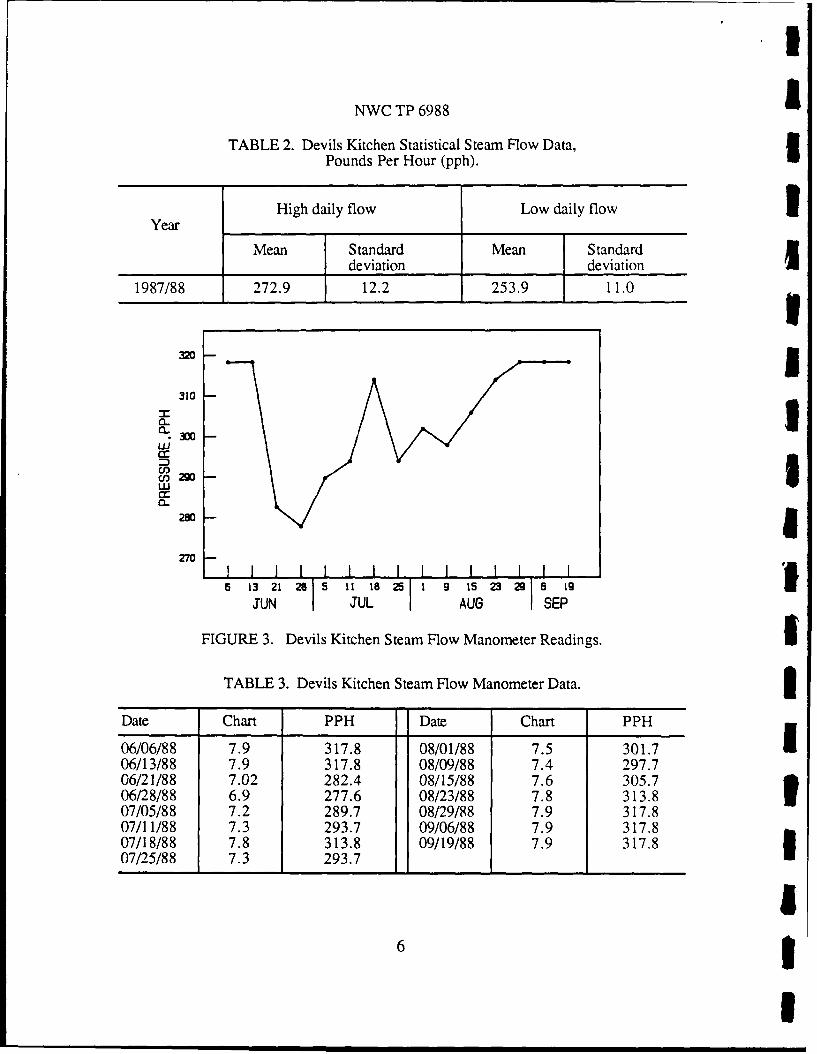
Daily steam flows at Devils Kitchen for this reporting period are given in Table A-I(Appendix A). These data are shown graphically in Figure 2. Yearly mean data andstandard deviation for the high and low daily steam flows are given in Table 2.
The graph in Figure 2 stops at June 6. From this date the meter was pin wheeling,giving incorrect data. Manometer readings were taken each week during this period fromJune 6 to September 19. These readings have been calculated with the conversion factor
and plotted in Figure 3. The readings will be shown in Table 3 with the factorcalculation.
313.8 ..................................................
I
209.2......................................................
lI I I
0 N D J F M A M
1987 1988
FIGURE 2. Devils Kitchen Steam Flow.
5
I
NWC TP 6988
TABLE 2. Devils Kitchen Statistical Steam Flow Data,Pounds Per Hour (pph). I
High daily flow Low daily flow IYear
Mean Standard Mean Standard ldeviation deviation l
1987/88 272.9 12.2 253.9 11.0
3203
310
CL,
U)Ju) 290
2803 I.I
27M S I 1 I I I I I I II I I l6 13 21 28 5 It 18 25 1 9 15 23 21 8 19
JUN JUL AUG SEP
FIGURE 3. Devils Kitchen Steam Flow Manometer Readings. ftTABLE 3. Devils Kitchen Steam Flow Manometer Data. 3
Date Chart PPH Date Chart PPH
06/06/88 7.9 317.8 08/01/88 7.5 301.706/13/88 7.9 317.8 08/09/88 7.4 297.706/21/88 7.02 282.4 08/15/88 7.6 305.706/28/88 6.9 277.6 08/23/88 7.8 313.8 I07/05/88 7.2 289.7 08/29/88 7.9 317.8
07/11/88 7.3 293.7 09/06/88 7.9 317.807/18/88 7.8 313.8 09/19/88 7.9 317.807/25/88 7.3 293.7
6 3I
NWC TP 6988
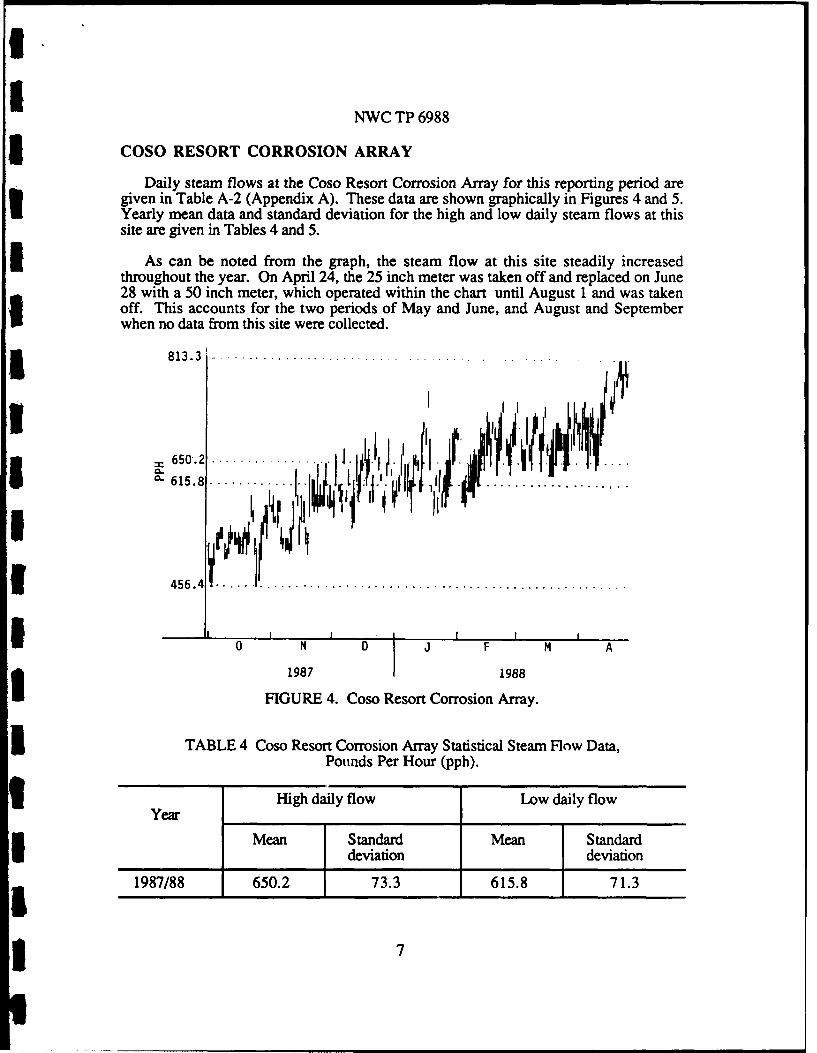
COSO RESORT CORROSION ARRAY
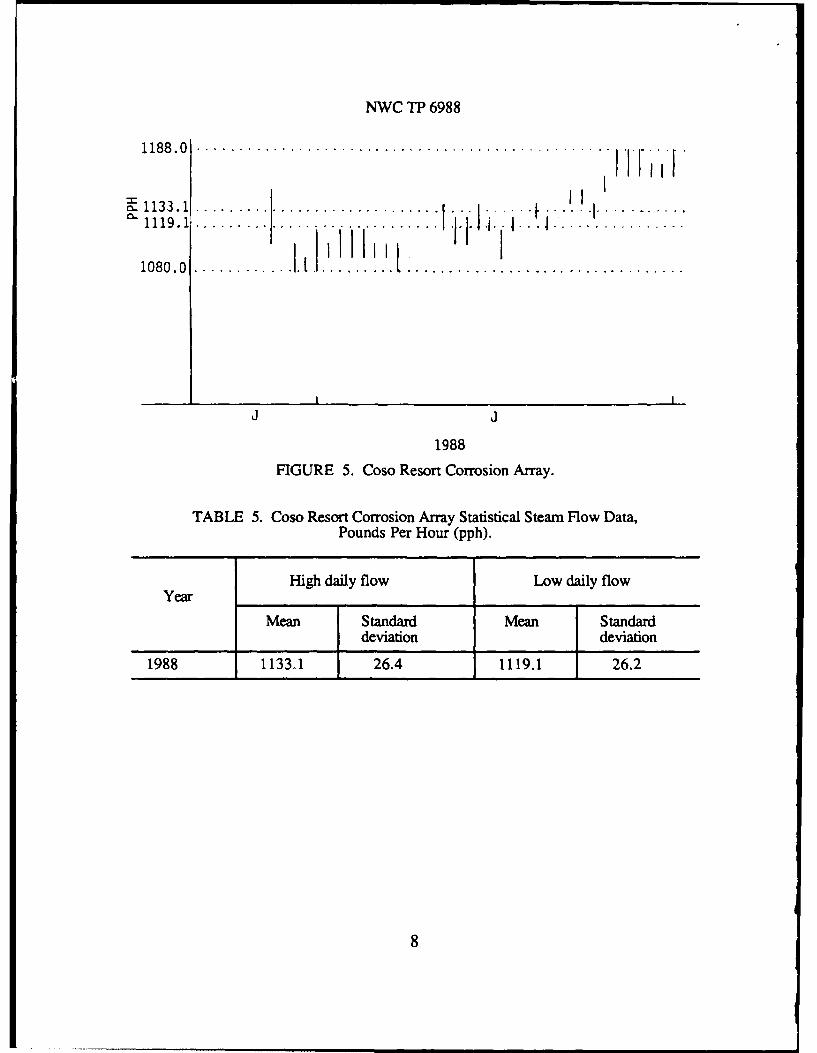
Daily steam flows at the Coso Resort Corrosion Array for this reporting period aregiven in Table A-2 (Appendix A). These data are shown graphically in Figures 4 and 5.Yearly mean data and standard deviation for the high and low daily steam flows at thissite are given in Tables 4 and 5.
As can be noted from the graph, the steam flow at this site steadily increasedthroughout the year. On April 24, the 25 inch meter was taken off and replaced on June28 with a 50 inch meter, which operated within the chart until August 1 and was takenoff. This accounts for the two periods of May and June, and August and Septemberwhen no data from this site were collected.
813.3 . .. .. ... ........
650 ........... .. ... .~- 615.8 . . . . . .
II4 5 6 . 4 .................................................... . .
0 N 0 F M A
1987 1988
FIGURE 4. Coso Resort Corrosion Array.
TABLE 4 Coso Resort Corrosion Array Statistical Steam Flow Data,Pounds Per Hour (pph).
Y High daily flow Low daily flow
Mean Standard Mean Standarddeviation deviation
1987/88 650.2 73.3 615.8 71.3
7
NWC TP 6988
1 18 8 .0 ...................... .................... ...I i
1133.1 ............................... ...1 1 9 . ..... ........ ......l.l
1080.0 . .. ' ......
1988
FIGURE 5. Coso Resort Corrosion Array.
TABLE 5. Coso Resort Corrosion Array Statistical Steam Flow Data,Pounds Per Hour (pph).
High daily flow Low daily flowYear
Mean Standard Mean Standarddeviation deviation
1988 1133.1 26.4 1119.1 26.2
8
NWC TP 6988
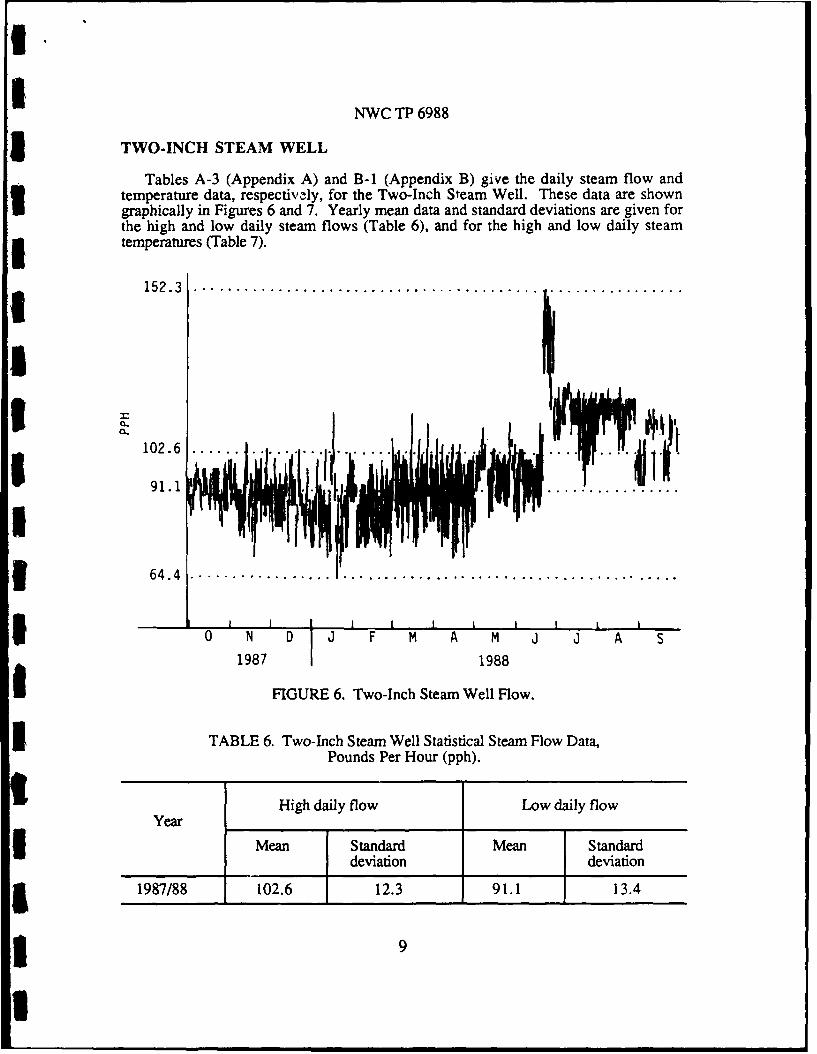
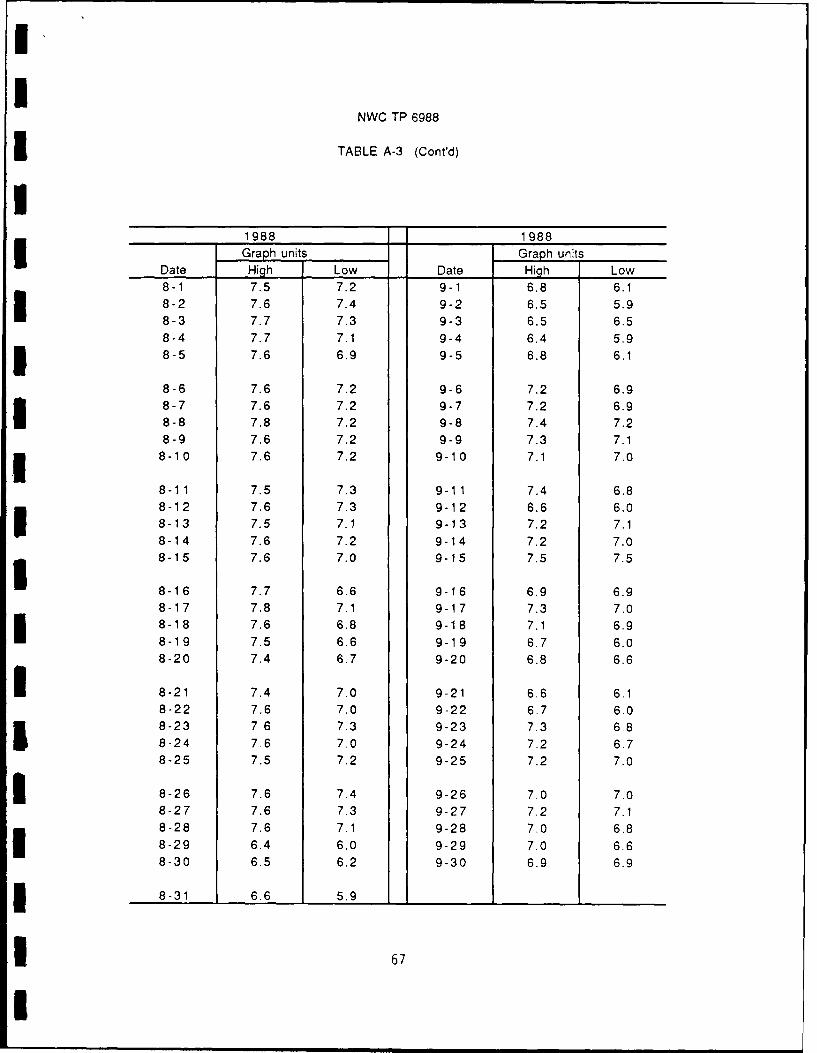
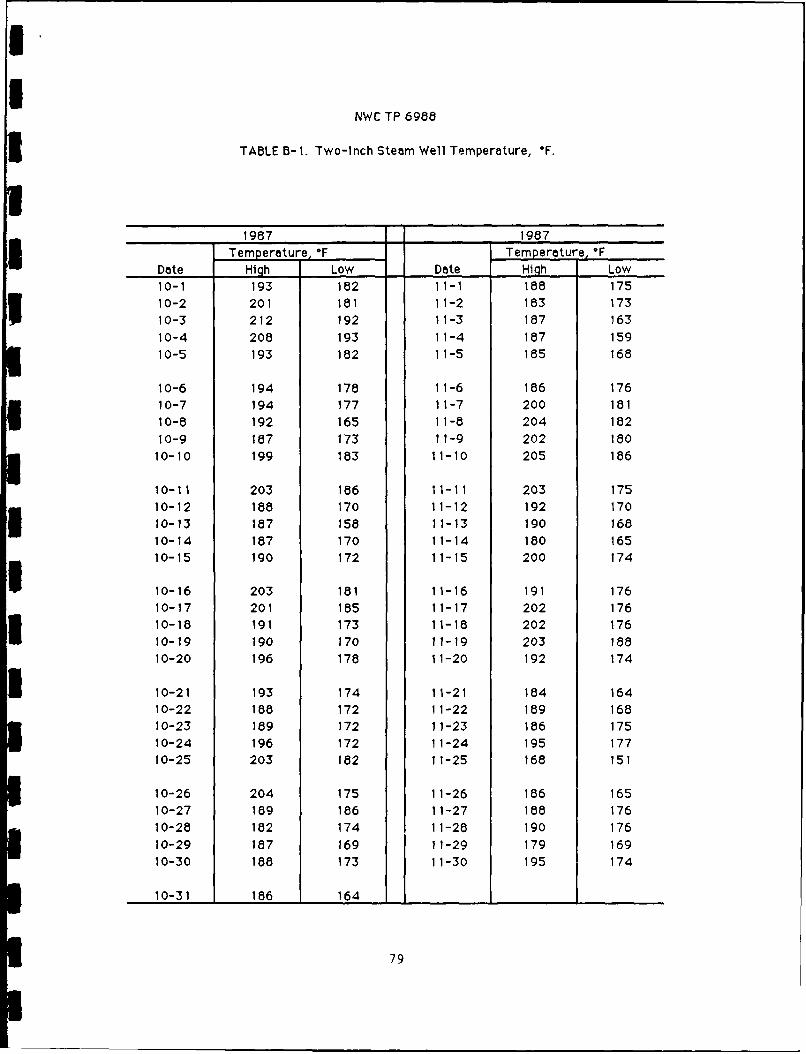
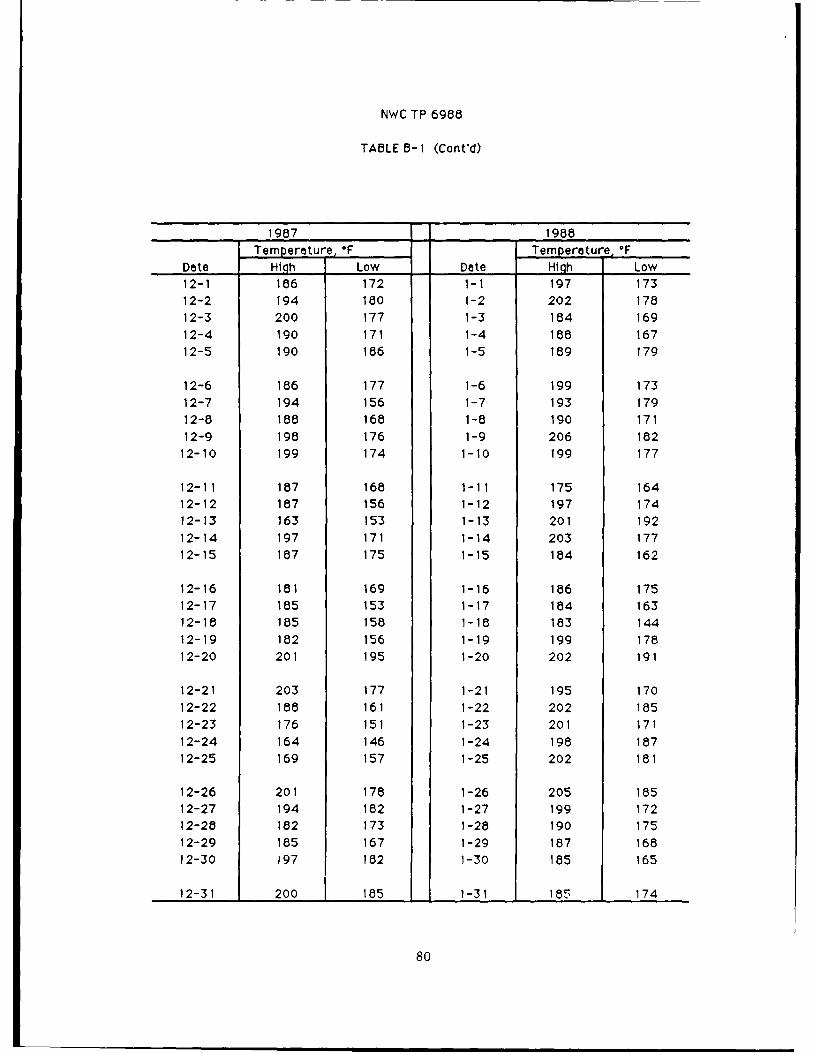
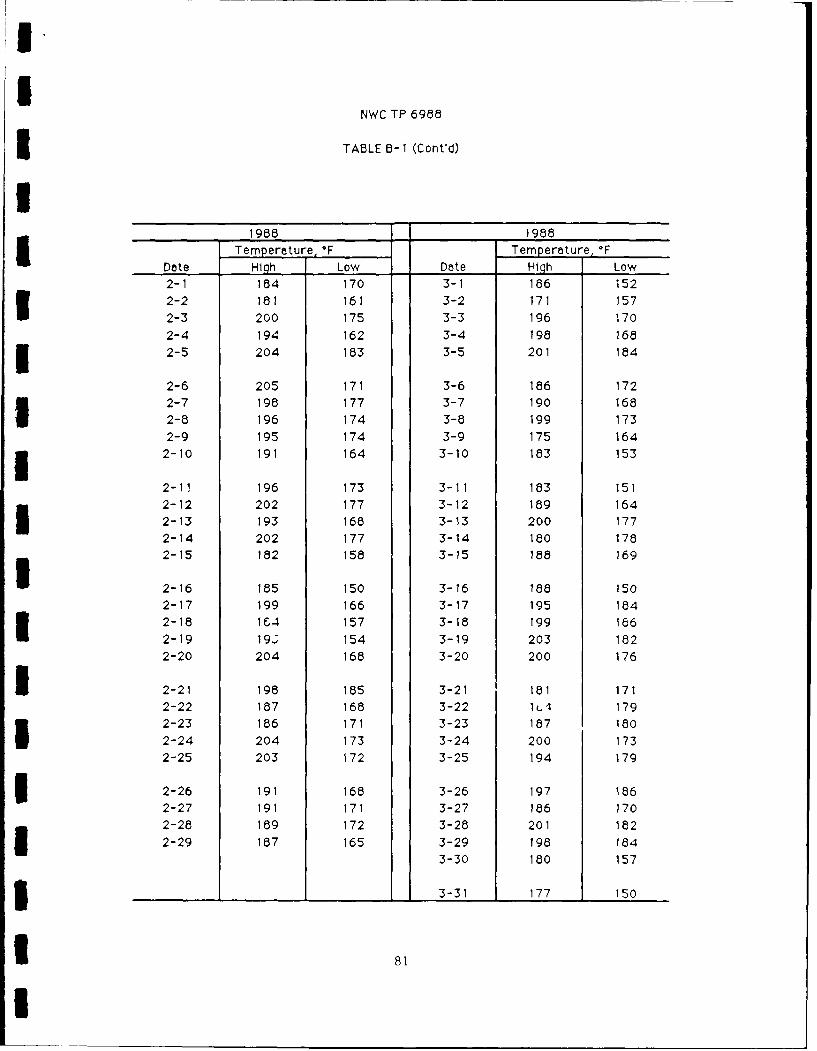
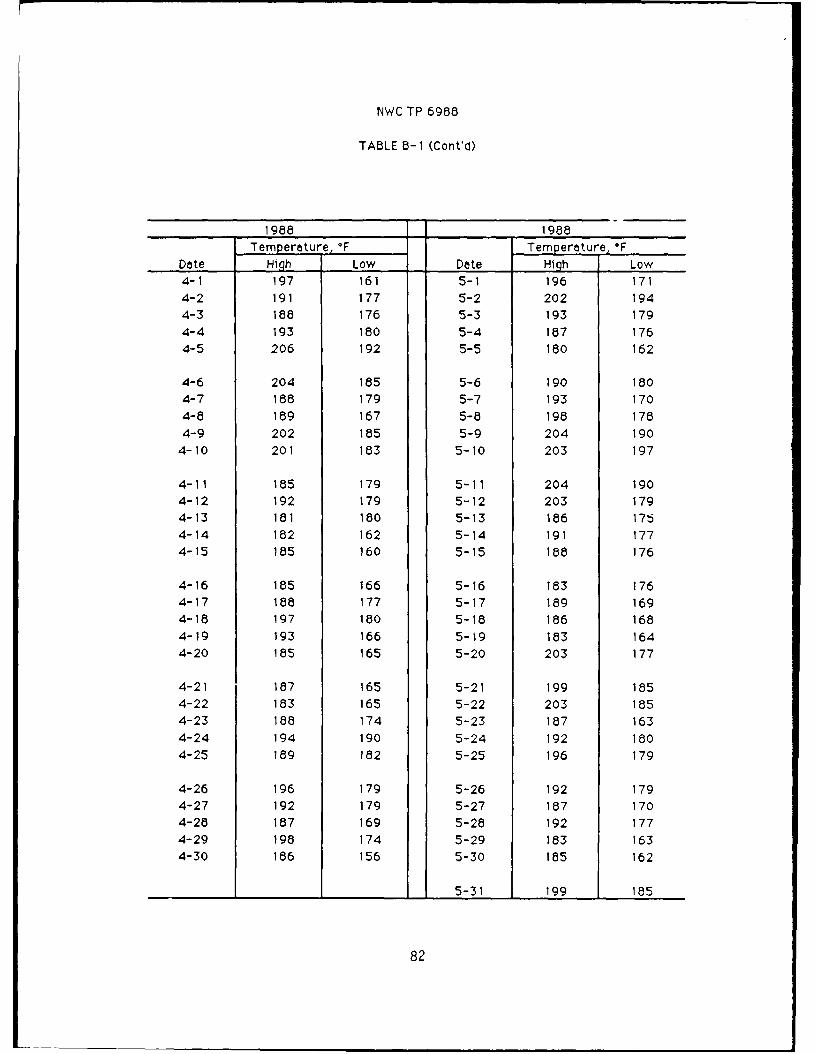
5 TWO-INCH STEAM WELL
Tables A-3 (Appendix A) and B-i (Appendix B) give the daily steam flow andtemperature data, respectively, for the Two-Inch Steam Well. These data are showngraphically in Figures 6 and 7. Yearly mean data and standard deviations are given forthe high and low daily steam flows (Table 6), and for the high and low daily steamtemperatures (Table 7).£ 152.3 ...... ................... ........
I
102.6 ...............
64.4........................................... ....
_ _ _ _I II I I I I I0 N 0 I F M A M j I A S
1987 1988
FIGURE 6. Two-Inch Steam Well Flow.
TABLE 6. Two-Inch Steam Well Statistical Steam Flow Data,Pounds Per Hour (pph).
High daily flow Low daily flow
YearMean Standard Mean Standard
deviation deviation
£ 1987/88 102.6 12.3 91.1 13.4
I 9
NWC TP 6988
212 .0
0-. 190.
173. V
0 N I I I M A M I I A S
1987 1 1988
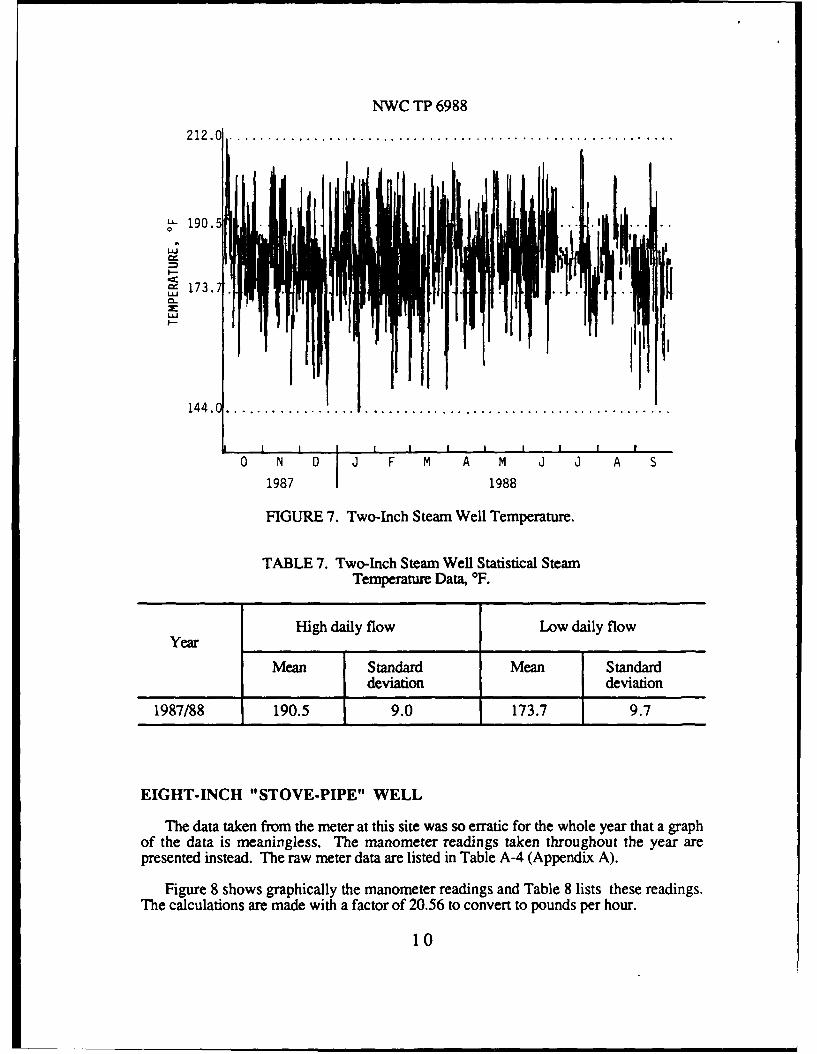
FIGURE 7. Two-Inch Steam Well Temperature.
TABLE 7. Two-Inch Steam Well Statistical SteamTemperature Data, OF.
High daily flow Low daily flowYear
Mean Standard Mean Standarddeviation deviation
1987/88 190.5 9.0 173.7 9.7
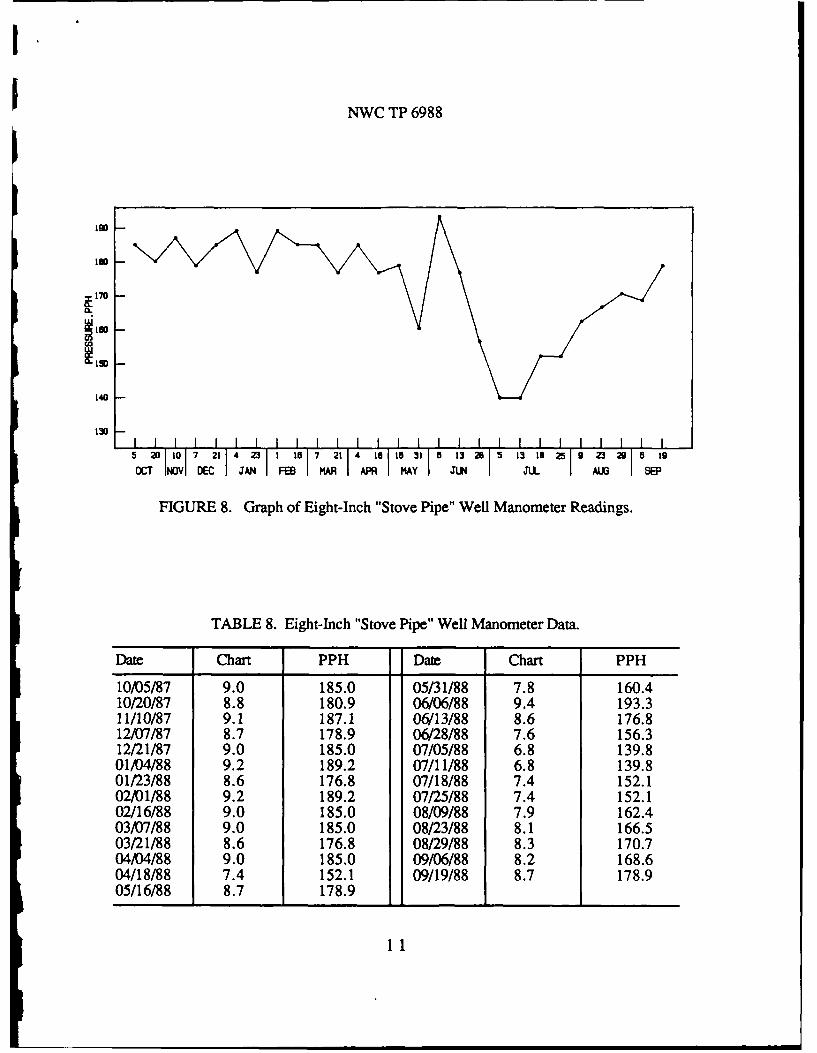
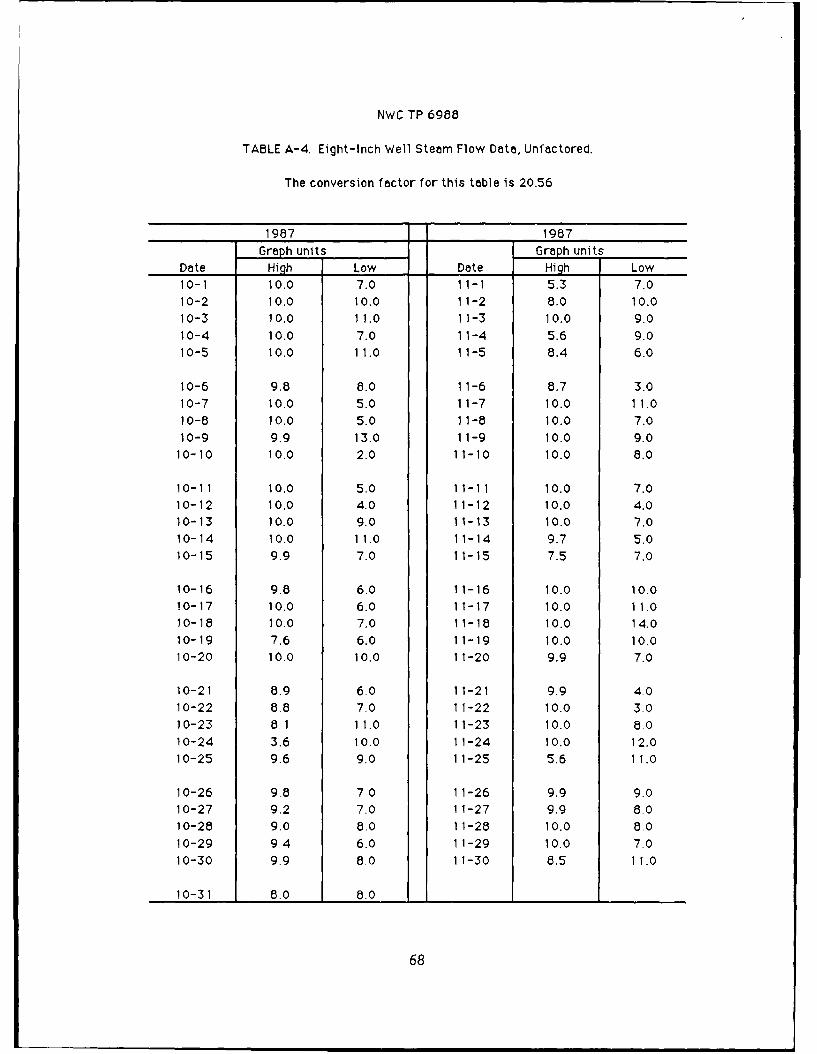
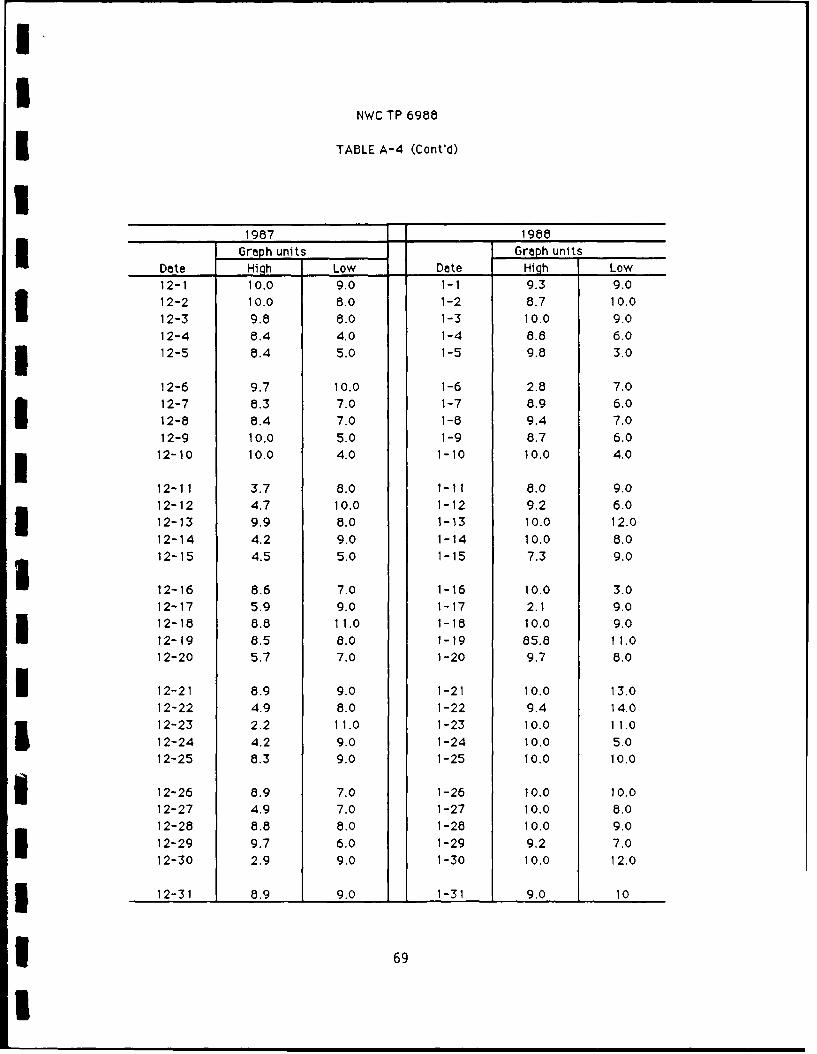
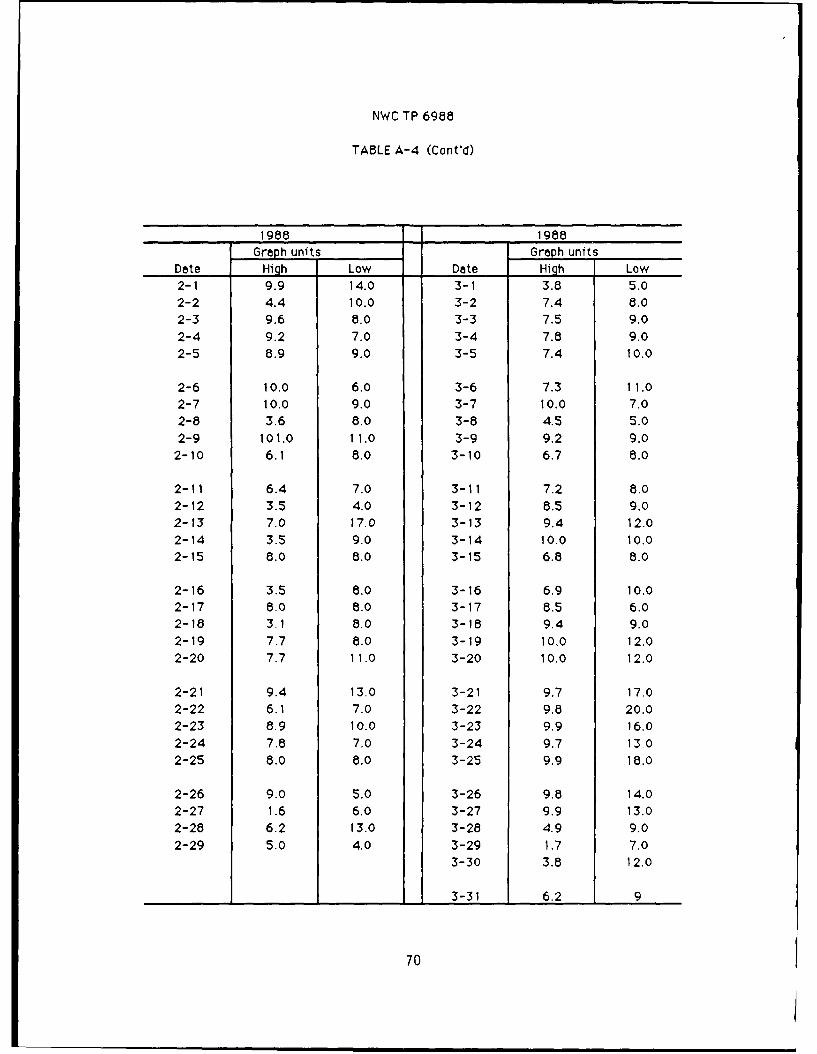
EIGHT-INCH "STOVE-PIPE" WELL
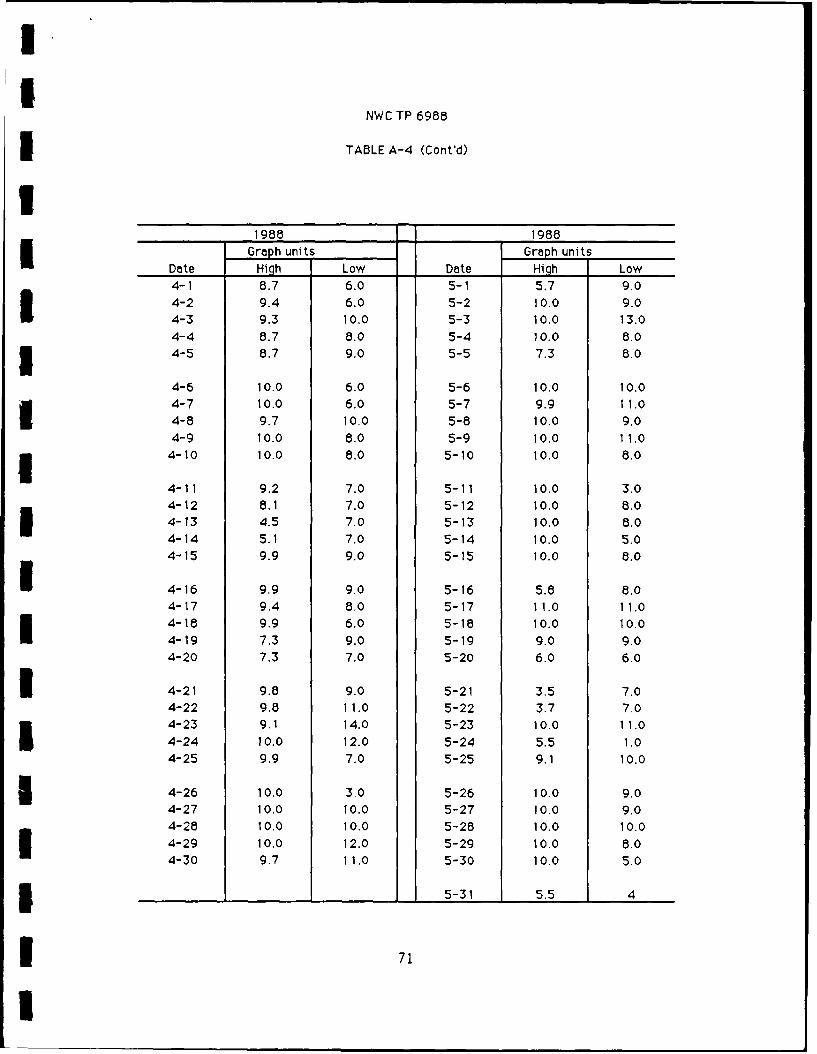
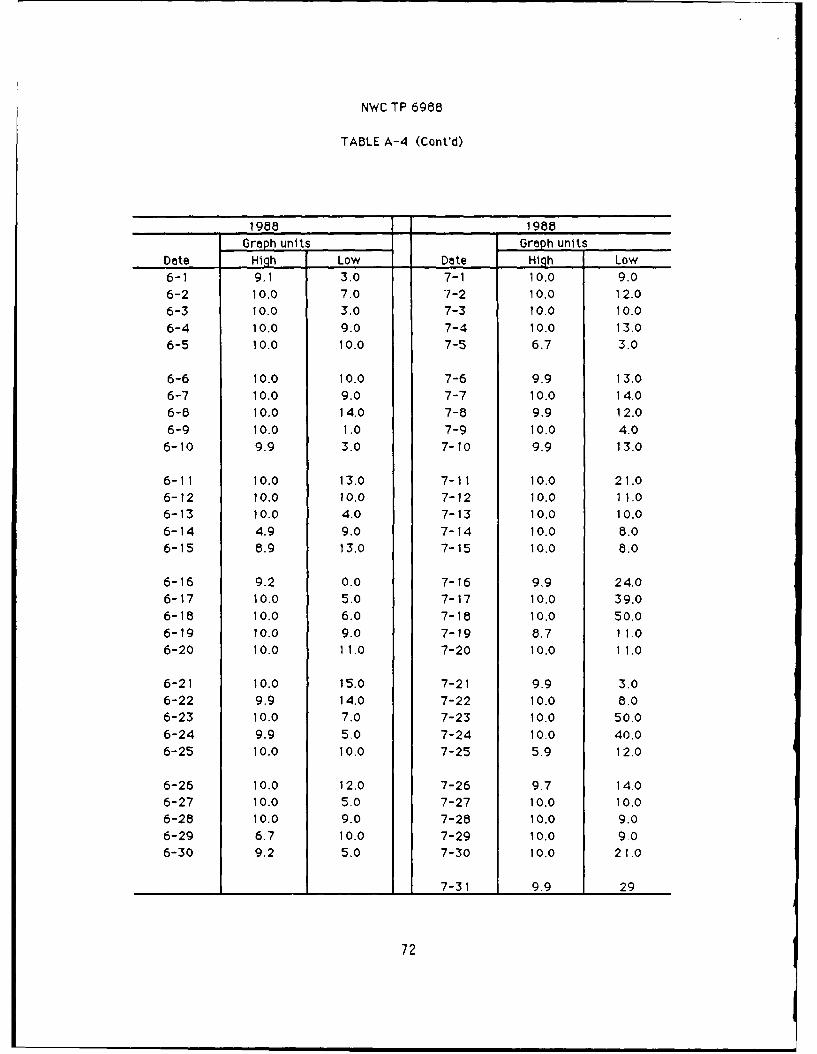
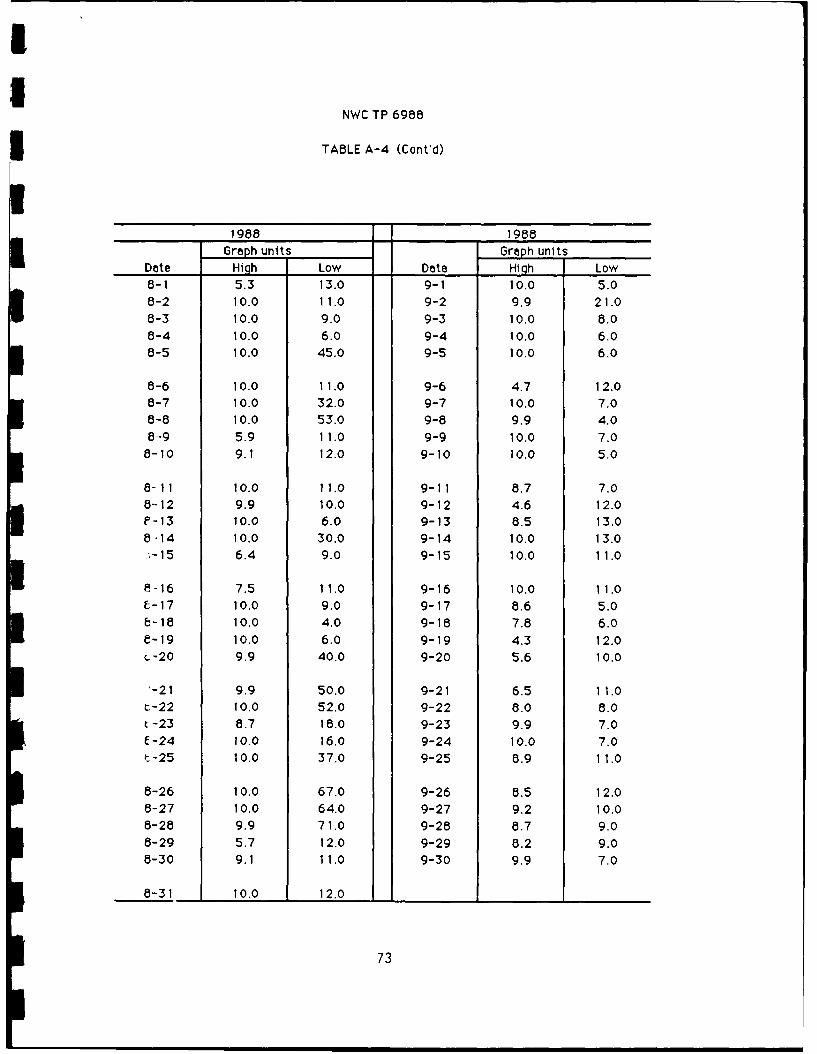
The data taken from the meter at this site was so erratic for the whole year that a graphof the data is meaningless. The manometer readings taken throughout the year arepresented instead. The raw meter data are listed in Table A-4 (Appendix A).
Figure 8 shows graphically the manometer readings and Table 8 lists these readings.The calculations are made with a factor of 20.56 to convert to pounds per hour.
10
NWC TP 6988
I.~
170
140
130 I Ii I I I I I 1 l I I I I 1 I I l I I iI I i I5 20 1 101 721 14Z 2311 1617 21141 81163116 13 265 13 18 25 9 23 2 9SOCT INOV IDEC JAN FB MAR IARIMAYI AN* JU.L IAMG 6
FIGURE 8. Graph of Eight-Inch "Stove Pipe" Well Manometer Readings.
TABLE 8. Eight-Inch "Stove Pipe" Well Manometer Data.
Date Chart PPH Date Chart PPH
10/05/87 9.0 185.0 05/31/88 7.8 160.410/20/87 8.8 180.9 06/06/88 9.4 193.311/10/87 9.1 187.1 06/13/88 8.6 176.812/07/87 8.7 178.9 06/28/88 7.6 156.312/21/87 9.0 185.0 07/05/88 6.8 139.801/04/88 9.2 189.2 07/11/88 6.8 139.801/23/88 8.6 176.8 07/18/88 7.4 152.102/01/88 9.2 189.2 07/25/88 7.4 152.102/16/88 9.0 185.0 08/09/88 7.9 162.403/07/88 9.0 185.0 08/23/88 8.1 166.503/21/88 8.6 176.8 08/29/88 8.3 170.704/04/88 9.0 185.0 09/06/88 8.2 168.604/18/88 7.4 152.1 09/19/88 8.7 178.905/16/88 8.7 178.9
11
NWC TP 6988
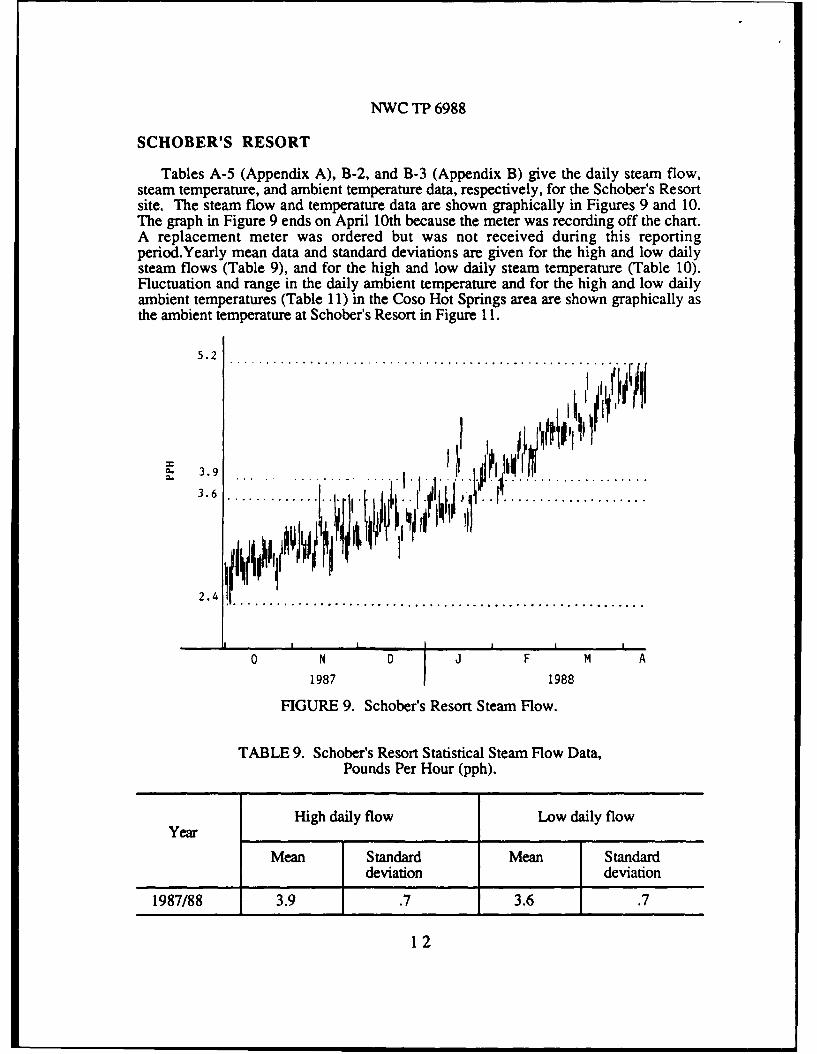
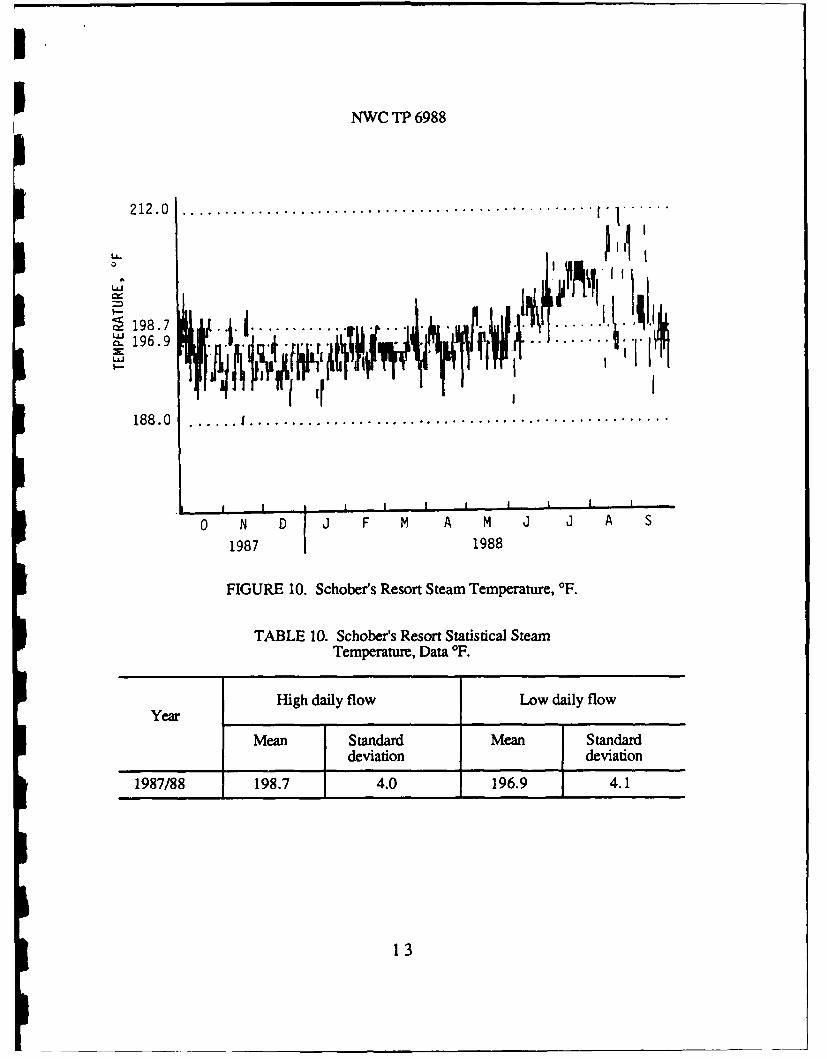
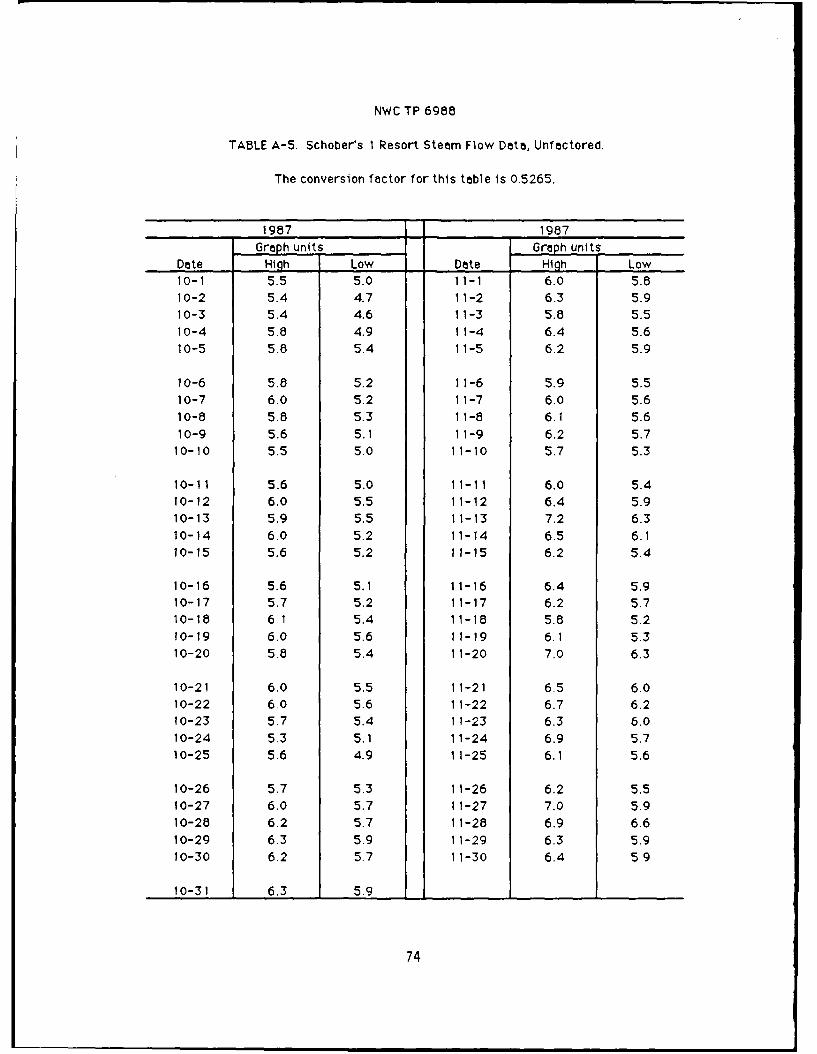
SCHOBER'S RESORT
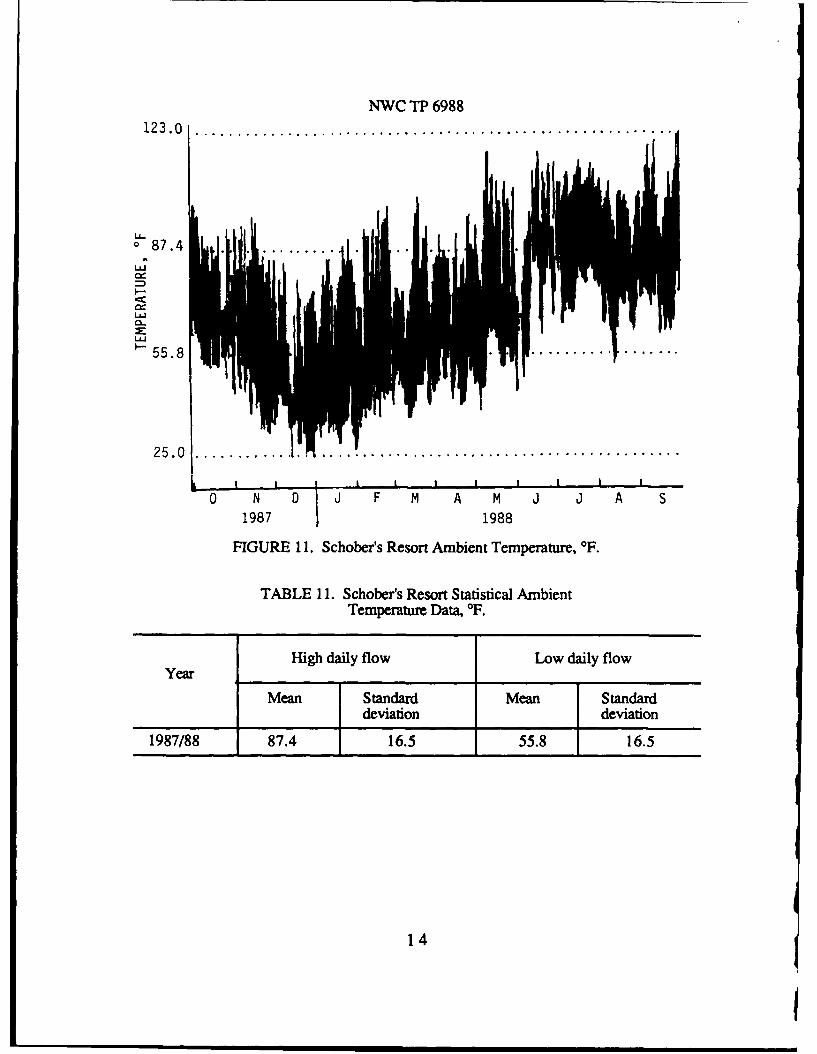
Tables A-5 (Appendix A), B-2, and B-3 (Appendix B) give the daily steam flow,steam temperature, and ambient temperature data, respectively, for the Schober's Resortsite. The steam flow and temperature data are shown graphically in Figures 9 and 10.The graph in Figure 9 ends on April 10th because the meter was recording off the chart.A replacement meter was ordered but was not received during this reportingperiod.Yearly mean data and standard deviations are given for the high and low dailysteam flows (Table 9), and for the high and low daily steam temperature (Table 10).Fluctuation and range in the daily ambient temperature and for the high and low dailyambient temperatures (Table 11) in the Coso Hot Springs area are shown graphically asthe ambient temperature at Schober's Resort in Figure 11.
5.2
2 .4 ........................... .... ............................ ......39. I.!l l f i ,
2.4
III I
0 N 0 J F M A
1987 1988
FIGURE 9. Schober's Resort Steam Flow.
TABLE 9. Schober's Resort Statistical Steam Flow Data,Pounds Per Hour (pph).
High daily flow Low daily flowYear
Mean Standard Mean Standarddeviation deviation
1987/88 3.9 .7 3.6 .7
12
NWC TP 6988
2 12 .0 .. .. .... .. .... ... ..... ............. .. ....... .. ... . . .
LI. II0
LL;
198.7 l.....,a.196.9
"'1'!
188 .0 ... ... j .... ..... ...... ... .. .. .... ..... .... ... ... ...... ...
I I I I I I I I I
0 N D i F M A M d J A S1987 1 1988
FIGURE 10. Schober's Resort Steam Temperature, F.
TABLE 10. Schober's Resort Statistical SteamTemperature, Data OF.
High daily flow Low daily flow
Year
Mean Standard Mean Standarddeviation deviation
1987/88 198.7 1 4.0 196.9 i 4.1
13
NWC TP 698812 3 .0 . .. . . .. . . . . . . . . . . .. . . . . . . . . . . . . . .. . .. . .. . .. . . . . .. .. .. . . . .
LU° 87.4
CCI.-
- 55.8
25.0 . . . . . .
II I I I i I I i i
0 N D J F M A M J J A S1987 1988
FIGURE 11. Schober's Resort Ambient Temperature, OF.
TABLE 11. Schober's Resort Statistical AmbientTemperature Data, OF.
High daily flow Low daily flowYear
Mean Standard Mean Standarddeviation deviation
1987/88 87.4 16.5 55.8 16.5
14
I
NWC TP 6988
COSO MUD POTS
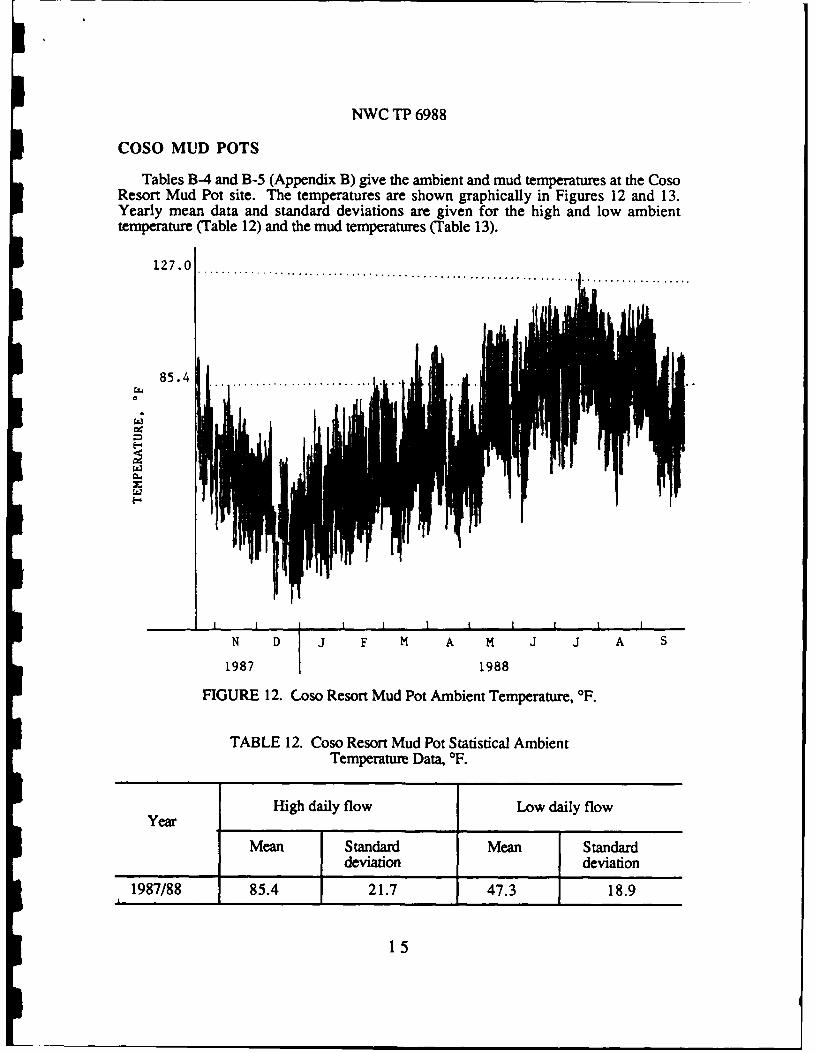
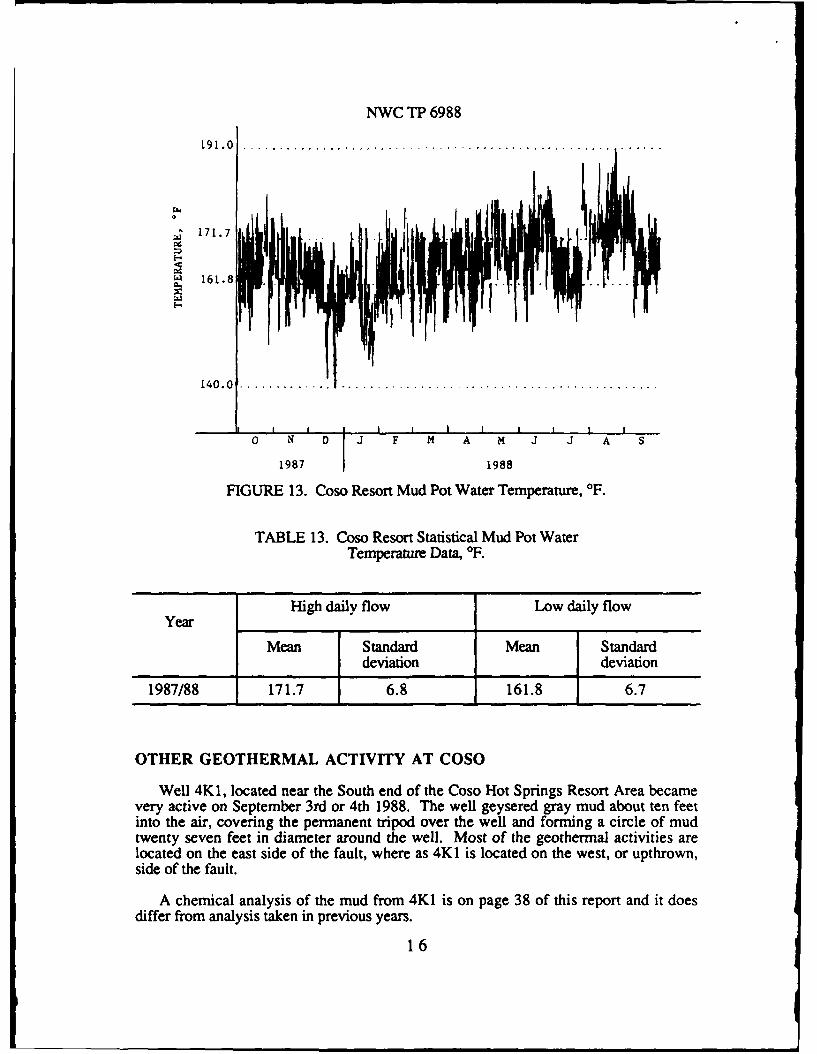
Tables B-4 and B-5 (Appendix B) give the ambient and mud temperatures at the CosoResort Mud Pot site. The temperatures are shown graphically in Figures 12 and 13.Yearly mean data and standard deviations are given for the high and low ambienttemperature (Table 12) and the mud temperatures (Table 13).
127.0................ ................................ i...................
85.48
S I I I I I I I II
N D J F M A M J J A S
1987 1988
FIGURE 12. Coso Resort Mud Pot Ambient Temperature, OF.
TABLE 12. Coso Resort Mud Pot Statistical AmbientTemperature Data, OF.
High daily flow Low daily flowYear
Mean Standard Mean Standarddeviation deviation
1987/88j 85.4 21.7 47.3 18.9
15
NWC TP 6988
191.0 . .-
S171.7 jS161.8
14 0 .0 . . . . . . . . . . . . . . . . . . . . . . . . . . . . . . . . . . . . . . . . . . . . . . . . . . . . . . . .
0 N D J F M A M J J A S
1987 1988
FIGURE 13. Coso Resort Mud Pot Water Temperature, OF.
TABLE 13. Coso Resort Statistical Mud Pot WaterTemperature Data, OF.
High daily flow Low daily flow
Year
Mean Standard Mean Standarddeviation deviation
1987/88 171.7 6.8 161.8 6.7
OTHER GEOTHERMAL ACTIVITY AT COSO
Well 4K1, located near the South end of the Coso Hot Springs Resort Area becamevery active on September 3rd or 4th 1988. The well geysered gray mud about ten feetinto the air, covering the permanent tripod over the well and forming a circle of mudtwenty seven feet in diameter around the well. Most of the geothermal activities arelocated on the east side of the fault, where as 4K1 is located on the west, or upthrown,side of the fault.
A chemical analysis of the mud from 4K1 is on page 38 of this report and it doesdiffer from analysis taken in previous years.
16
NWC TP 6988
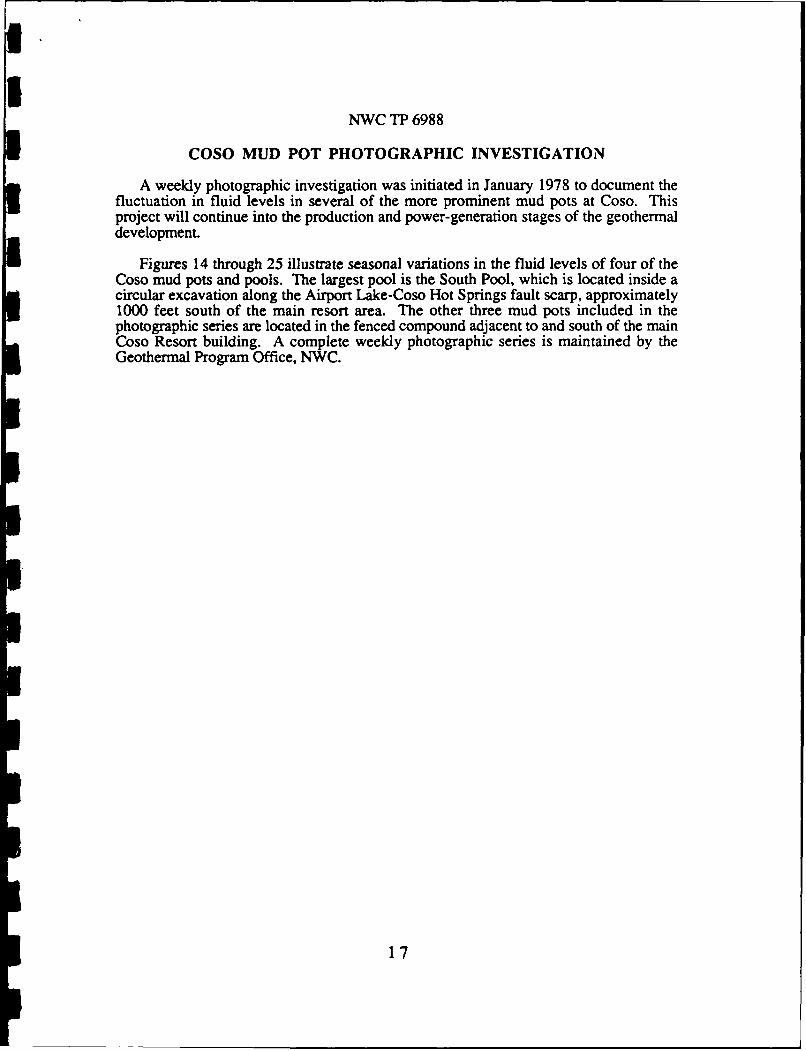
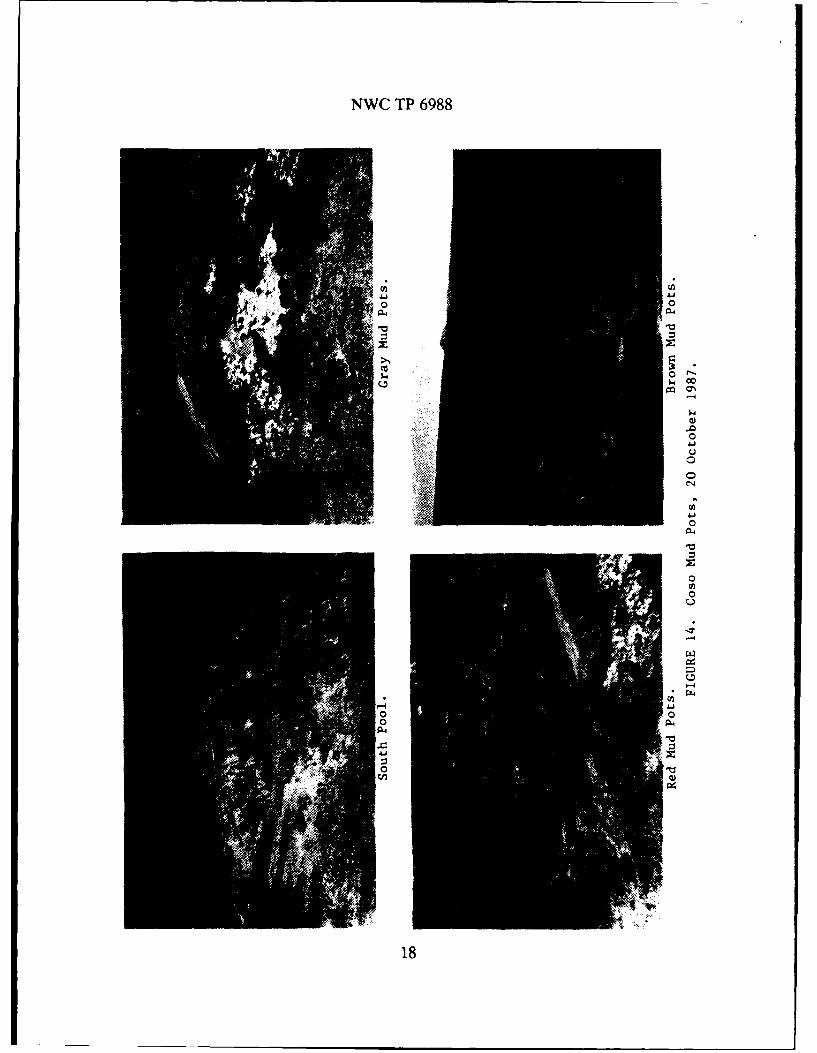
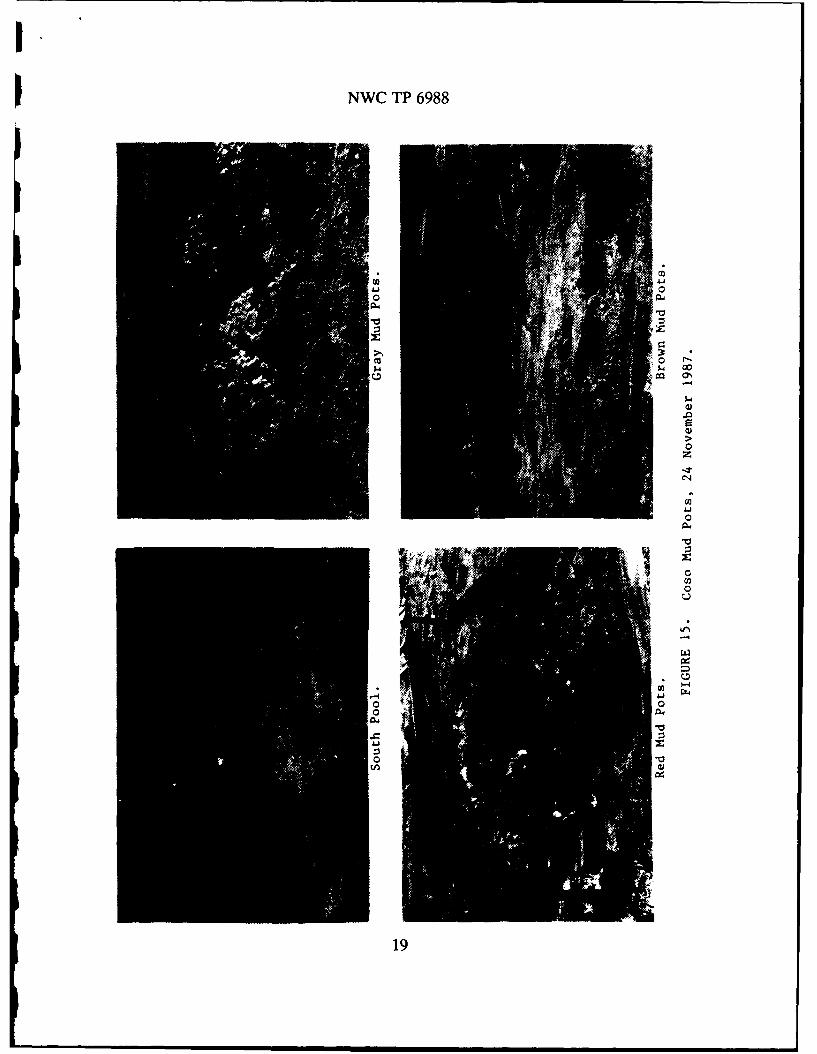
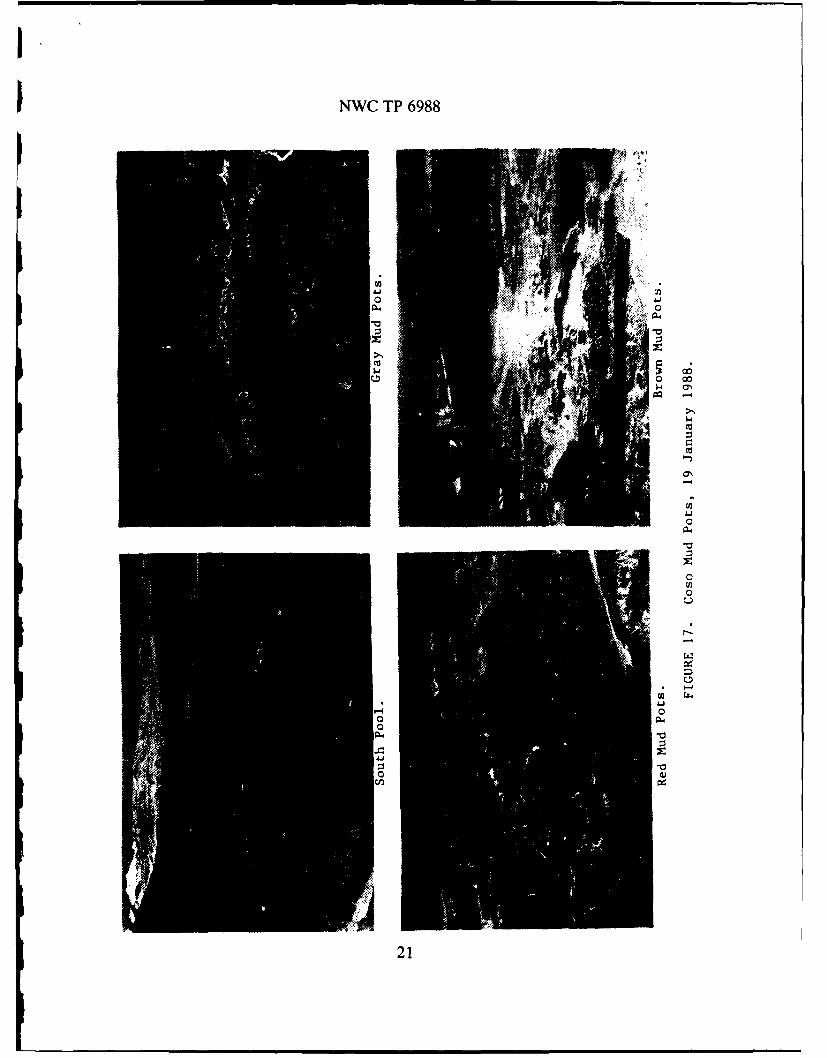
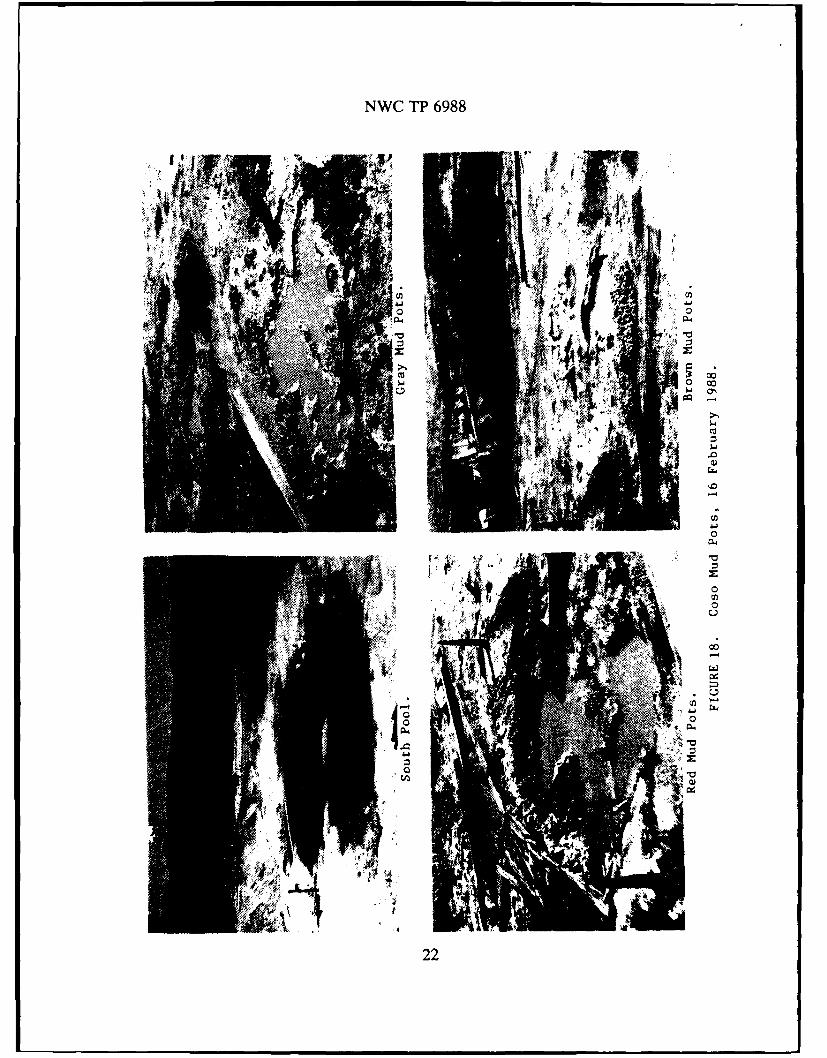
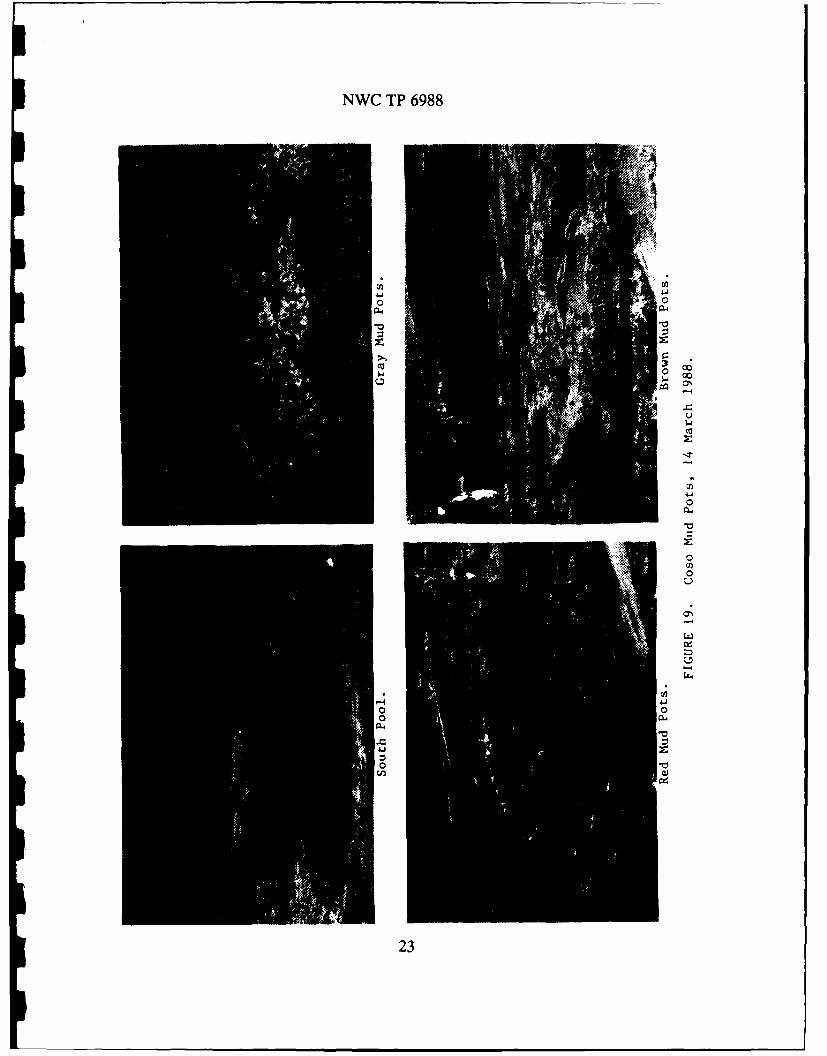
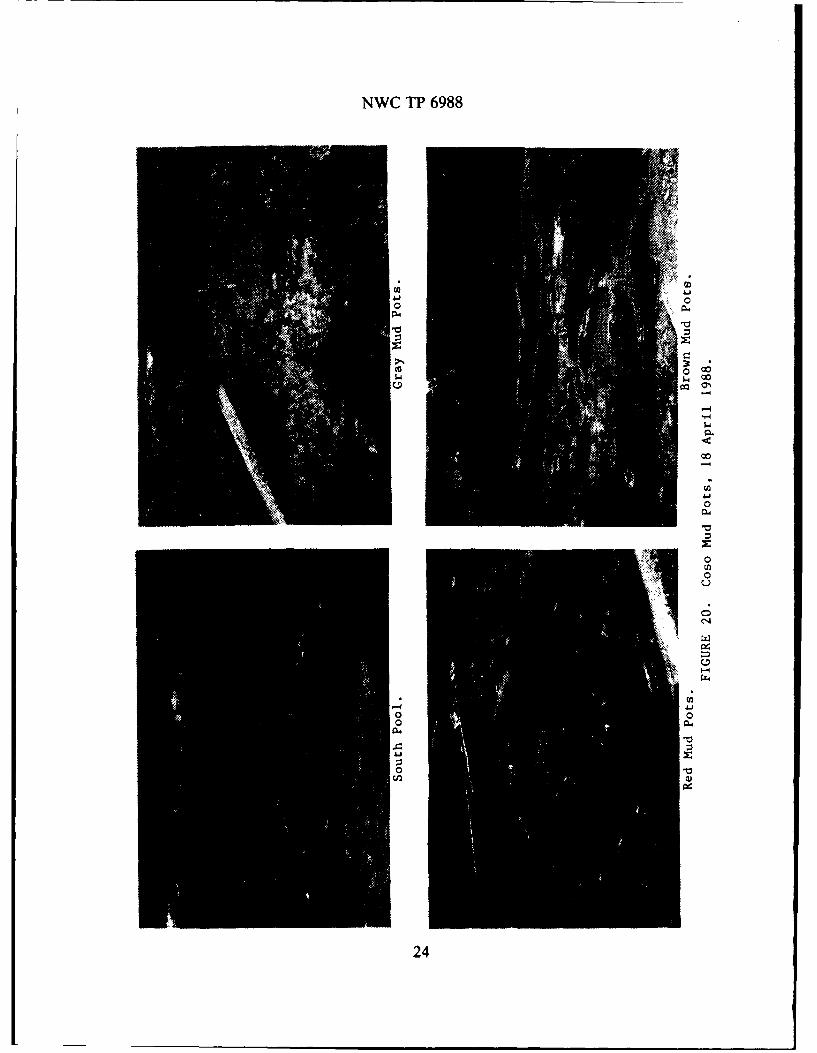
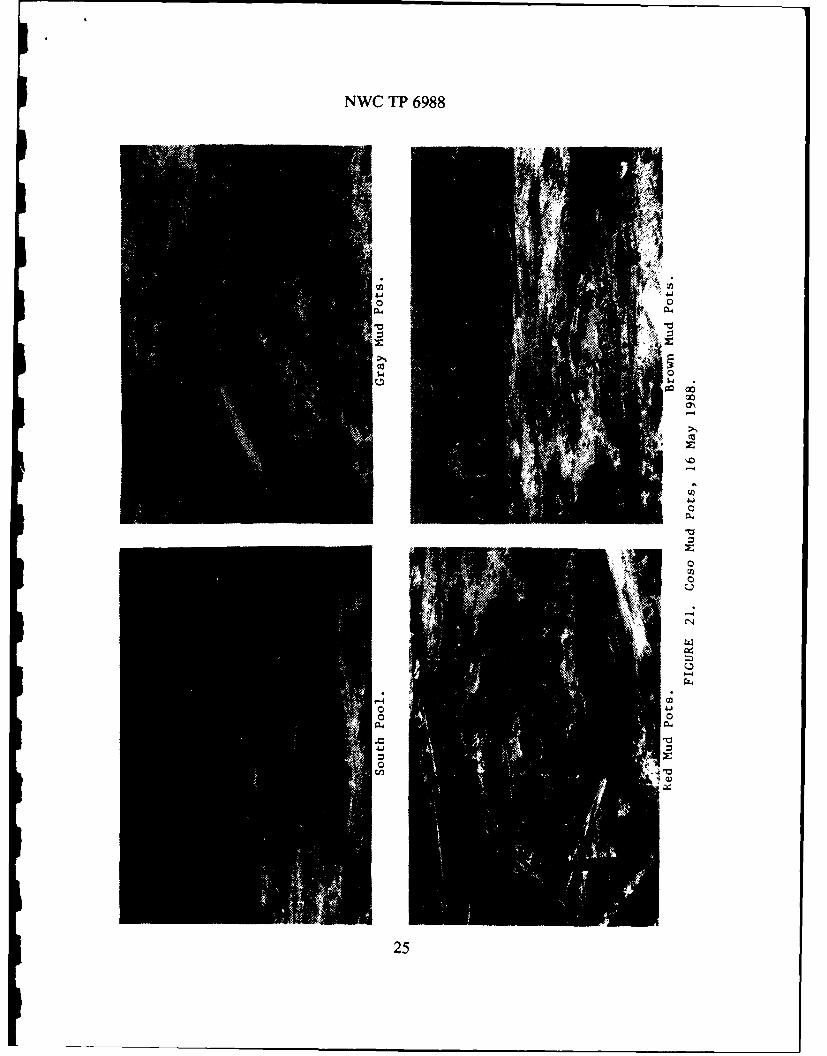
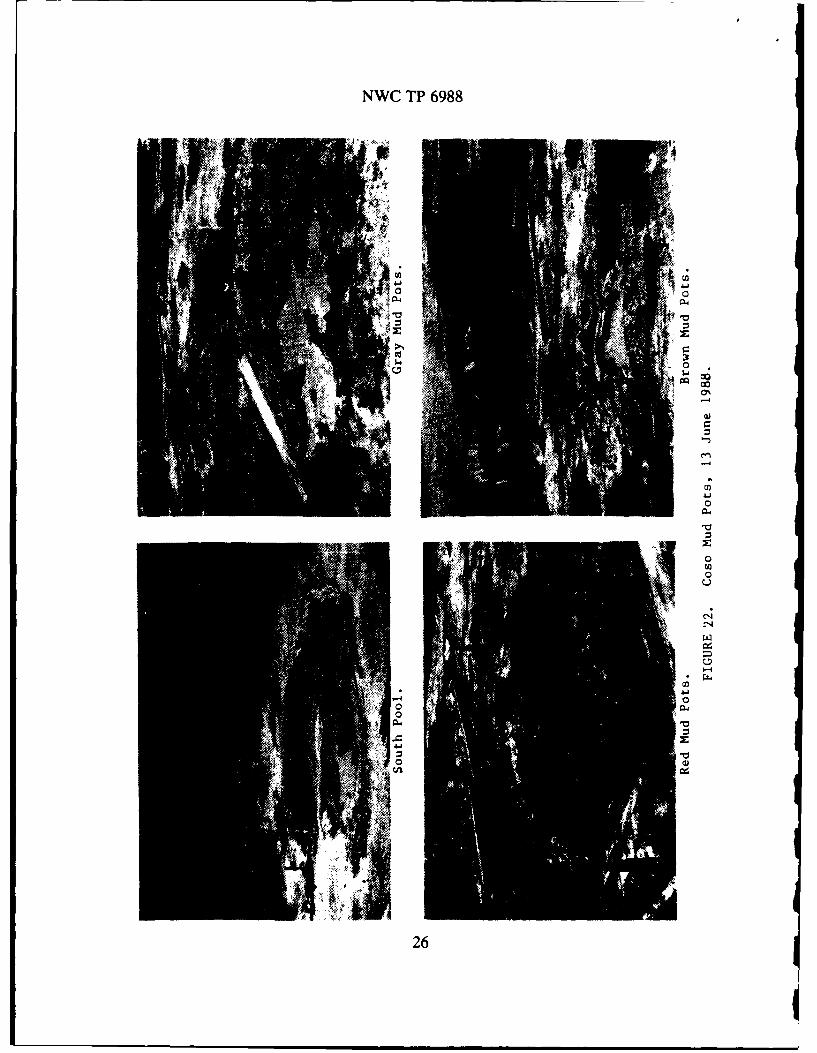
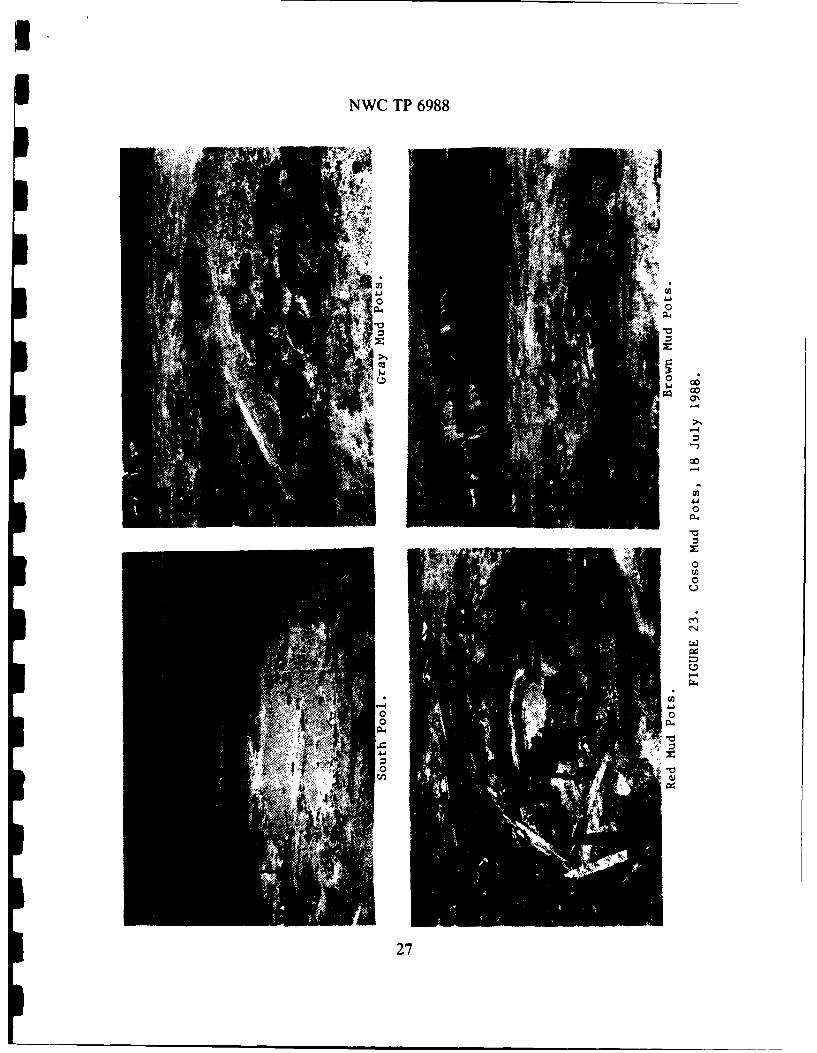
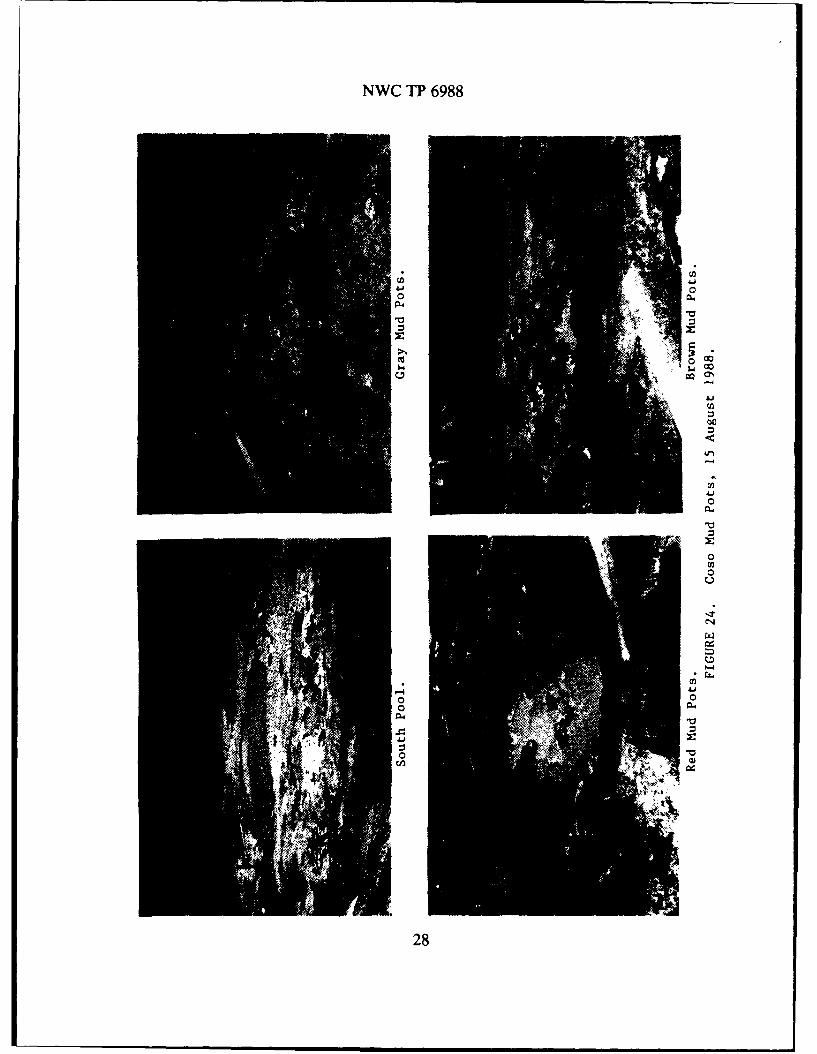
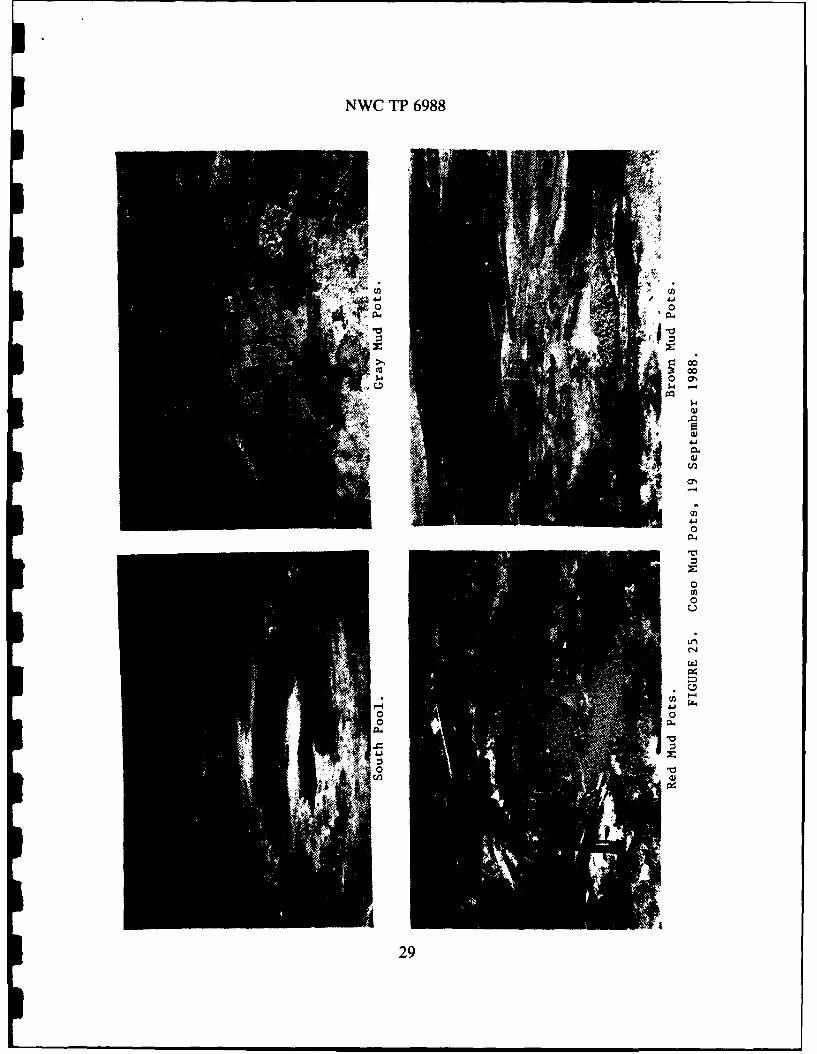
COSO MUD POT PHOTOGRAPHIC INVESTIGATION
A weekly photographic investigation was initiated in January 1978 to document thefluctuation in fluid levels in several of the more prominent mud pots at Coso. Thisproject will continue into the production and power-generation stages of the geothermaldevelopment.
Figures 14 through 25 illustrate seasonal variations in the fluid levels of four of theCoso mud pots and pools. The largest pool is the South Pool, which is located inside acircular excavation along the Airport Lake-Coso Hot Springs fault scarp, approximately1000 feet south of the main resort area. The other three mud pots included in thephotographic series are located in the fenced compound adjacent to and south of the mainCoso Resort building. A complete weekly photographic series is maintained by theGeothermal Program Office, NWC.
17
NWC TP 6988
0
CO
C4
0
C.,
V.0
181
NWC TP 6988
0
00cz
19,
NWC TP 6988
00
0.4
0
200
NWC TP 6988
oc
214
NWC TP 6988
Ytt
0
sJ (7
22q
NWC TP 6988
4.J
00
23
NWC TP 6988
co
JJ040.
4-I z
24z
NWC TP 6988
00
044 04
25
NWC TP 6988
04
C4
26
NWC TP 6988
''Aa
00
-$127
NWC TP 6988
4100
P.4
I4'r
C.,
0P.,
0cIn
280
NWC TP 6988
o00
4 0%
291
NWC TP 6988
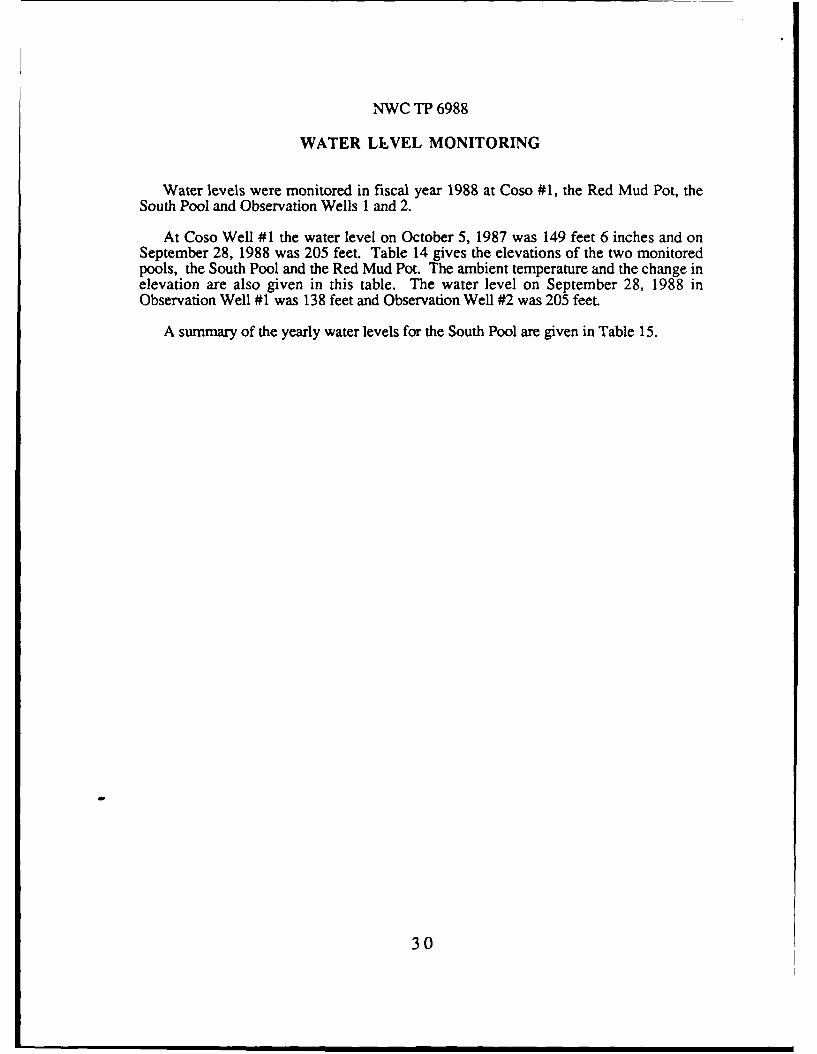
WATER LLVEL MONITORING
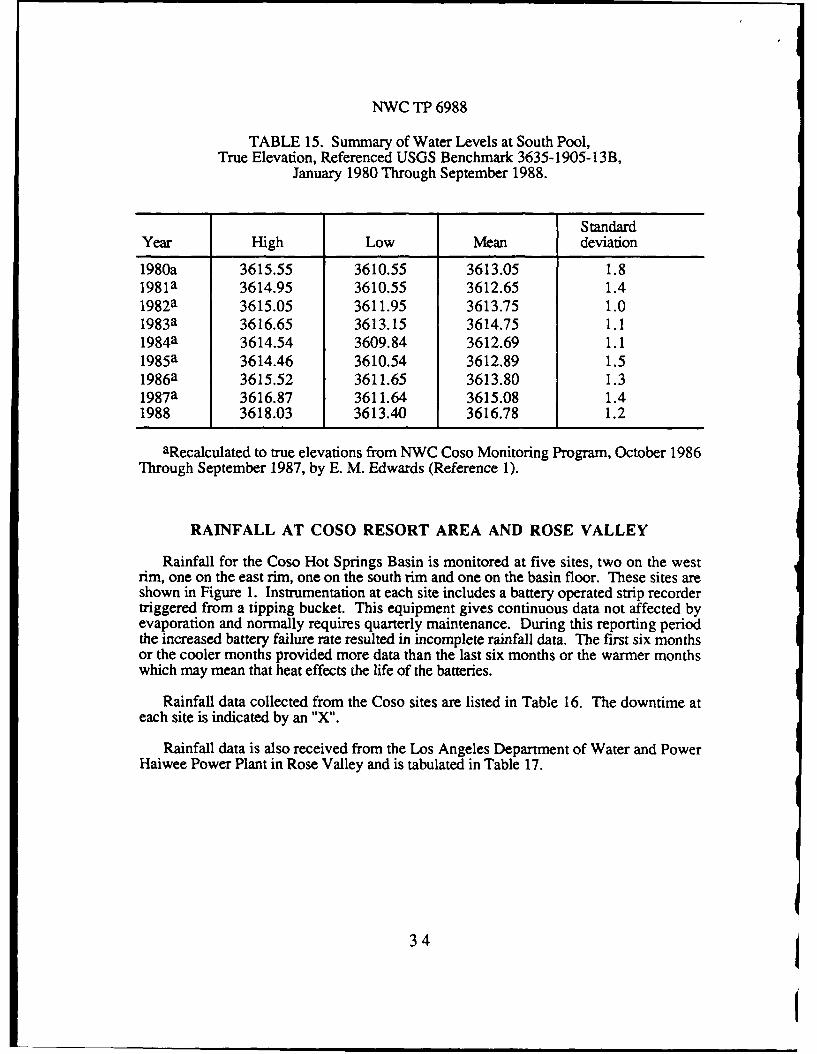
Water levels were monitored in fiscal year 1988 at Coso #1, the Red Mud Pot, theSouth Pool and Observation Wells 1 and 2.
At Coso Well #1 the water level on October 5, 1987 was 149 feet 6 inches and onSeptember 28, 1988 was 205 feet. Table 14 gives the elevations of the two monitoredpools, the South Pool and the Red Mud Pot. The ambient temperature and the change inelevation are also given in this table. The water level on September 28, 1988 inObservation Well #1 was 138 feet and Observation Well #2 was 205 feet.
A summary of the yearly water levels for the South Pool are given in Table 15.
30
NWC TP 6988
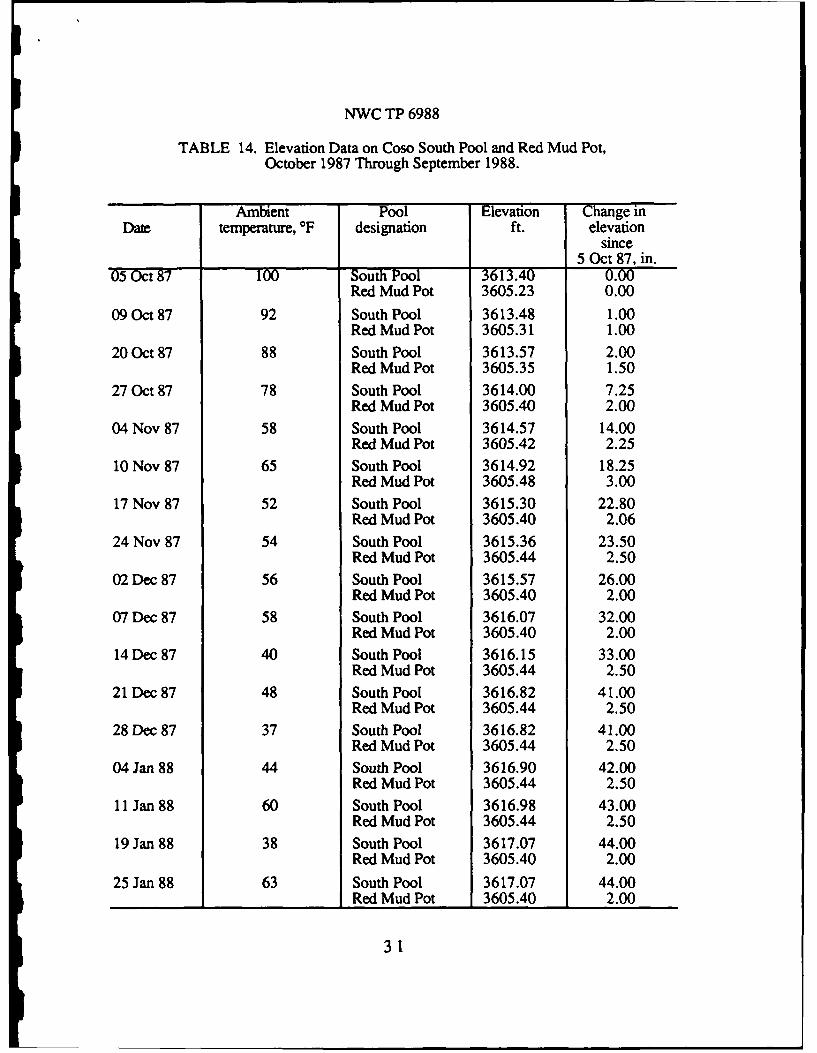
TABLE 14. Elevation Data on Coso South Pool and Red Mud Pot,October 1987 Through September 1988.
Ambient Pool Elevation Change inDate temperature, OF designation ft. elevation
since5 Oct 87, in.
05 Oct 87 100 South Pool 3613.40 0.00Red Mud Pot 3605.23 0.00
09 Oct 87 92 South Pool 3613.48 1.00Red Mud Pot 3605.31 1.00
20 Oct 87 88 South Pool 3613.57 2.00Red Mud Pot 3605.35 1.50
27 Oct 87 78 South Pool 3614.00 7.25Red Mud Pot 3605.40 2.00
04 Nov 87 58 South Pool 3614.57 14.00Red Mud Pot 3605.42 2.25
10 Nov 87 65 South Pool 3614.92 18.25Red Mud Pot 3605.48 3.00
17 Nov 87 52 South Pool 3615.30 22.80Red Mud Pot 3605.40 2.06
24 Nov 87 54 South Pool 3615.36 23.50Red Mud Pot 3605.44 2.50
02 Dec 87 56 South Pool 3615.57 26.00Red Mud Pot 3605.40 2.00
07 Dec 87 58 South Pool 3616.07 32.00Red Mud Pot 3605.40 2.00
14 Dec 87 40 South Pool 3616.15 33.00Red Mud Pot 3605.44 2.50
21 Dec 87 48 South Pool 3616.82 41.00Red Mud Pot 3605.44 2.50
28 Dec 87 37 South Pool 3616.82 41.00Red Mud Pot 3605.44 2.50
04 Jan 88 44 South Pool 3616.90 42.00Red Mud Pot 3605.44 2.50
11 Jan 88 60 South Pool 3616.98 43.00Red Mud Pot 3605.44 2.50
19 Jan 88 38 South Pool 3617.07 44.00Red Mud Pot 3605.40 2.00
25 Jan 88 63 South Pool 3617.07 44.00Red Mud Pot 3605.40 2.00
31
NWC TP 6988
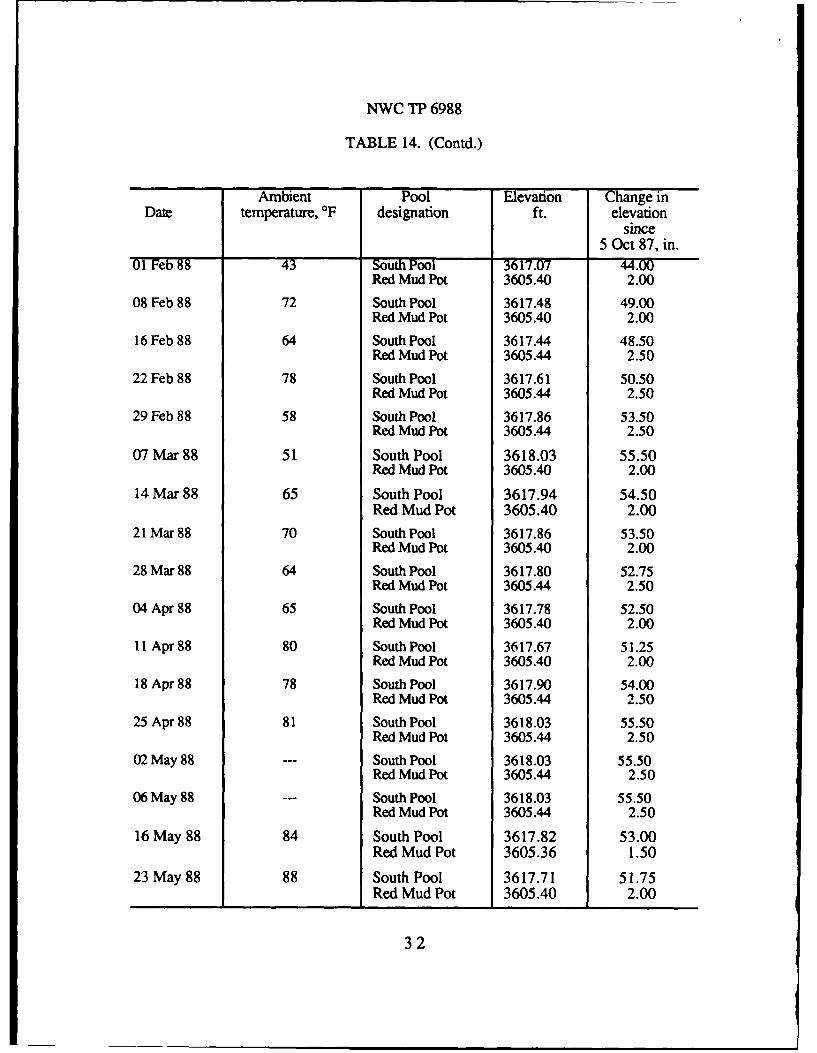
TABLE 14. (Contd.)
Ambient Pool Elevation Change inDate temperature, IF designation ft. elevation
since5 Oct 87, in.
01 Feb 88 43 South Pool 3617.07 44.00Red Mud Pot 3605.40 2.00
08 Feb 88 72 South Pool 3617.48 49.00Red Mud Pot 3605.40 2.00
16 Feb 88 64 South Pool 3617.44 48.50Red Mud Pot 3605.44 2.50
22 Feb 88 78 SouthPool 3617.61 50.50Red Mud Pot 3605.44 2.50
29 Feb 88 58 South Pool 3617.86 53.50Red Mud Pot 3605.44 2.50
07 Mar 88 51 South Pool 3618.03 55.50Red Mud Pot 3605.40 2.00
14 Mar 88 65 South Pool 3617.94 54.50Red Mud Pot 3605.40 2.00
21 Mar 88 70 South Pool 3617.86 53.50Red Mud Pot 3605.40 2.00
28 Mar 88 64 South Pool 3617.80 52.75Red Mud Pot 3605.44 2.50
04 Apr 88 65 South Pool 3617.78 52.50Red Mud Pot 3605.40 2.00
11 Apr 88 80 South Pool 3617.67 51.25Red Mud Pot 3605.40 2.00
18 Apr 88 78 South Pool 3617.90 54.00Red Mud Pot 3605.44 2.50
25 Apr 88 81 South Pool 3618.03 55.50Red Mud Pot 3605.44 2.50
02 May 88 South Pool 3618.03 55.50Red Mud Pot 3605.44 2.50
06 May 88 South Pool 3618.03 55.50Red Mud Pot 3605.44 2.50
16 May 88 84 South Pool 3617.82 53.00Red Mud Pot 3605.36 1.50
23 May 88 88 South Pool 3617.71 51.75Red Mud Pot 3605.40 2.00
32
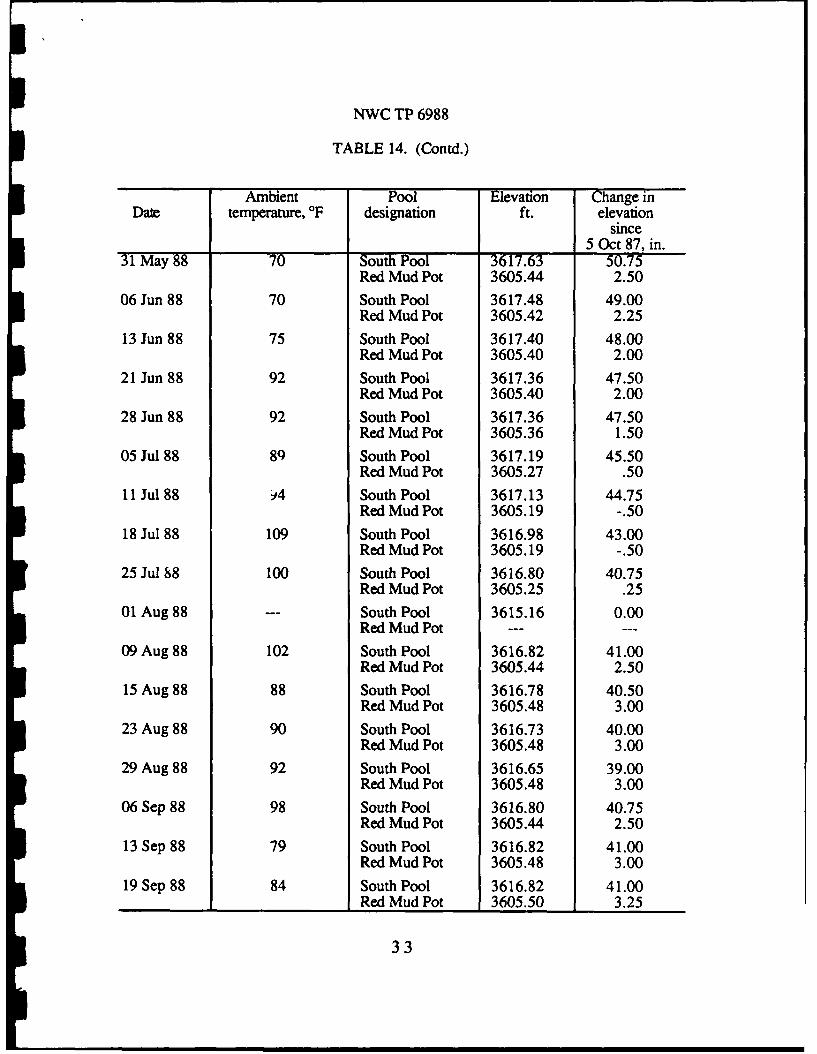
NWC TP 6988
TABLE 14. (Contd.)
Ambient Pool Elevation Change inDate temperature, OF designation ft. elevation
since5 Oct 87, in.
31 May 88 70 South Pool 3617.63 50.75Red Mud Pot 3605.44 2.50
06 Jun 88 70 South Pool 3617.48 49.00Red Mud Pot 3605.42 2.25
13 Jun 88 75 South Pool 3617.40 48.00Red Mud Pot 3605.40 2.00
21 Jun 88 92 South Pool 3617.36 47.50Red Mud Pot 3605.40 2.00
28 Jun 88 92 South Pool 3617.36 47.50Red Mud Pot 3605.36 1.50
05 Jul 88 8) South Pool 3617.19 45.50Red Mud Pot 3605.27 .50
11 Jul 88 '4 South Pool 3617.13 44.75Red Mud Pot 3605.19 -.50
18 Jul 88 109 South Pool 3616.98 43.00Red Mud Pot 3605.19 -.50
25 Jul 88 100 South Pool 3616.80 40.75Red Mud Pot 3605.25 .25
01 Aug 88 --- South Pool 3615.16 0.00Red Mud Pot ---
09 Aug 88 102 South Pool 3616.82 41.00Red Mud Pot 3605.44 2.50
15 Aug 88 88 South Pool 3616.78 40.50Red Mud Pot 3605.48 3.00
23 Aug 88 90 South Pool 3616.73 40.00Red Mud Pot 3605.48 3.00
29 Aug 88 92 South Pool 3616.65 39.00Red Mud Pot 3605.48 3.00
06 Sep 88 98 South Pool 3616.80 40.75Red Mud Pot 3605.44 2.50
13 Sep 88 79 South Pool 3616.82 41.00Red Mud Pot 3605.48 3.00
19 Sep 88 84 South Pool 3616.82 41.00Red Mud Pot 3605.50 3.25
33
NWC TP 6988
TABLE 15. Summary of Water Levels at South Pool,True Elevation, Referenced USGS Benchmark 3635-1905-13B,
January 1980 Through September 1988.
StandardYear High Low Mean deviation
1980a 3615.55 3610.55 3613.05 1.81981a 3614.95 3610.55 3612.65 1.41982a 3615.05 3611.95 3613.75 1.01983a 3616.65 3613.15 3614.75 1.11984a 3614.54 3609.84 3612.69 1.11985a 3614.46 3610.54 3612.89 1.51986a 3615.52 3611.65 3613.80 1.31987 a 3616.87 3611.64 3615.08 1.41988 3618.03 3613.40 3616.78 1.2
aRecalculated to true elevations from NWC Coso Monitoring Program, October 1986Through September 1987, by E. M. Edwards (Reference 1).
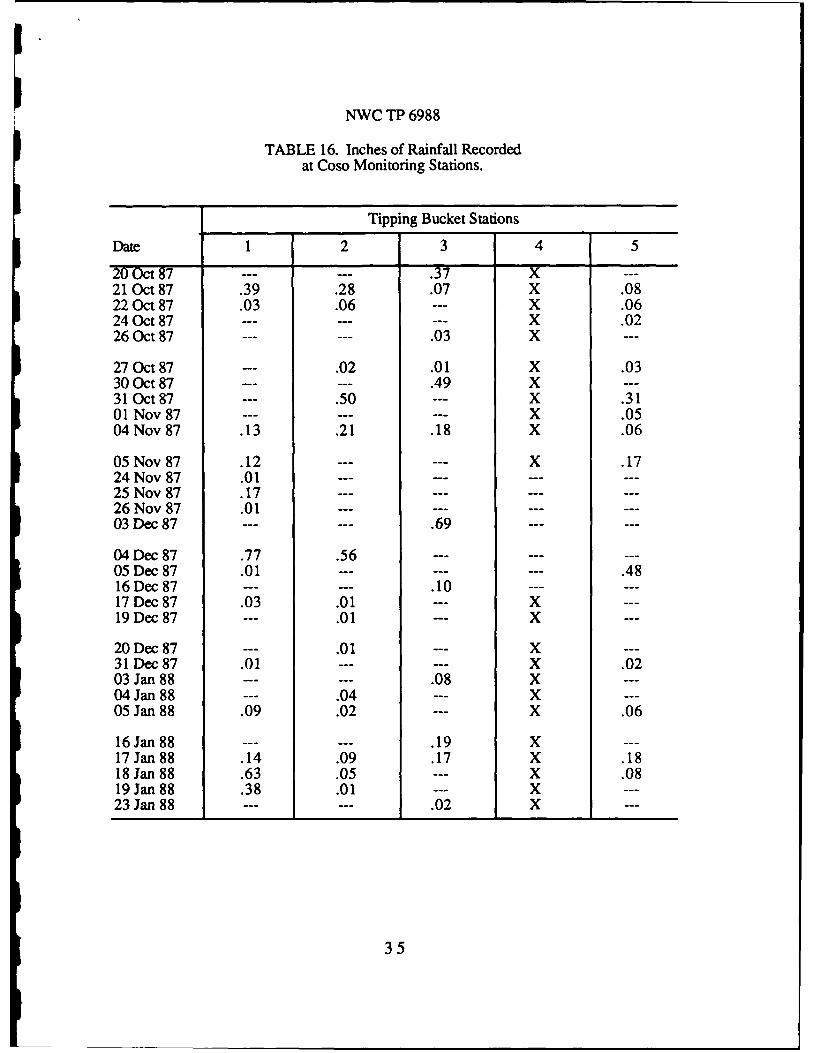
RAINFALL AT COSO RESORT AREA AND ROSE VALLEY
Rainfall for the Coso Hot Springs Basin is monitored at five sites, two on the westrim, one on the east rim, one on the south rim and one on the basin floor. These sites areshown in Figure 1. Instrumentation at each site includes a battery operated strip recordertriggered from a tipping bucket. This equipment gives continuous data not affected byevaporation and normally requires quarterly maintenance. During this reporting periodthe increased battery failure rate resulted in incomplete rainfall data. The first six monthsor the cooler months provided more data than the last six months or the warmer monthswhich may mean that heat effects the life of the batteries.
Rainfall data collected from the Coso sites are listed in Table 16. The downtime ateach site is indicated by an "X".
Rainfall data is also received from the Los Angeles Department of Water and PowerHaiwee Power Plant in Rose Valley and is tabulated in Table 17.
34
i
NWC TP 6988
TABLE 16. Inches of Rainfall Recordedat Coso Monitoring Stations.
__ _Tipping Bucket Stations
Date 1 2 3 4 5
2Oct87 .37 X ---21 Oct 87 .39 .28 .07 X .0822 Oct 87 .03 .06 --- X .0624 Oct 87 ......... X .0226 Oct 87 --- .03 X
27 Oct 87 --- .02 .01 X .0330 Oct 87 --- .49 X ---31 Oct 87 .50 X .3101 Nov 87 .........- X .0504 Nov 87 .13 .21 .18 X .06
05 Nov 87 .12 ---...- X .1724 Nov 87 .01 ---....25 Nov 87 .17 ............26 Nov 87 .01 ............03 Dec 87 --- .69 ......
04 Dec 87 .77 .56 .........05 Dec 87 .01 ... 4816 Dec 87 --- .10 ......17 Dec 87 .03 .01 --- X19 Dec 87 --- .01 --- X ---
20 Dec 87 --- .01 --- X ---31 Dec 87 .01 ---...- X .0203 Jan 88 --- .08 X ---04 Jan 88 --- .04 --- X ---05 Jan 88 .09 .02 --- X .06
16 Jan 88 --- .19 X ---17 Jan 88 .14 .09 .17 X .1818 Jan 88 .63 .05 X .0819 Jan 88 .38 .01 --- X ---23 Jan 88 .02 X ---
35
NWC TP 6988
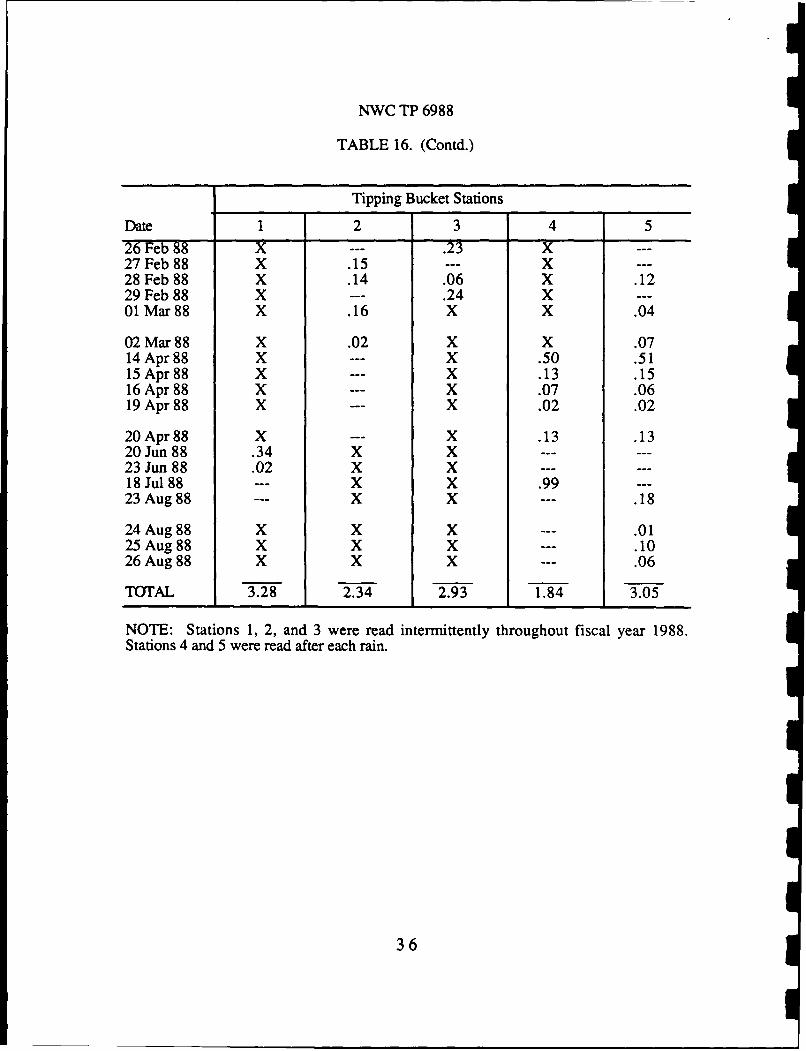
TABLE 16. (Contd.)
Tipping Bucket Stations
Date 1 2 3 4 526Feb88 x --- .23 x ---27 Feb 88 X .15 --- X28 Feb 88 X .14 .06 X .1229 Feb 88 X --- .24 X ---01 Mar 88 X .16 X X .04
02 Mar 88 X .02 X X .0714 Apr 88 X --- X .50 .5115 Apr88 X X .13 .1516 Apr 88 X --- X .07 .0619 Apr 88 X --- X .02 .02
20 Apr 88 X --- X .13 .1320 Jun 88 .34 X X ......23 Jun 88 .02 X X ---18 Jul 88 X X .99 ---23 Aug 88 X X --- .18
24 Aug 88 X X X --- .0125 Aug 88 X X X --- .1026 Aug 88 X X X --- .06
TOTAL 3.28 2.34 2.93 1.84 3.05
NOTE: Stations 1, 2, and 3 were read intermittently throughout fiscal year 1988.Stations 4 and 5 were read after each rain.
36
NWC TP 6988
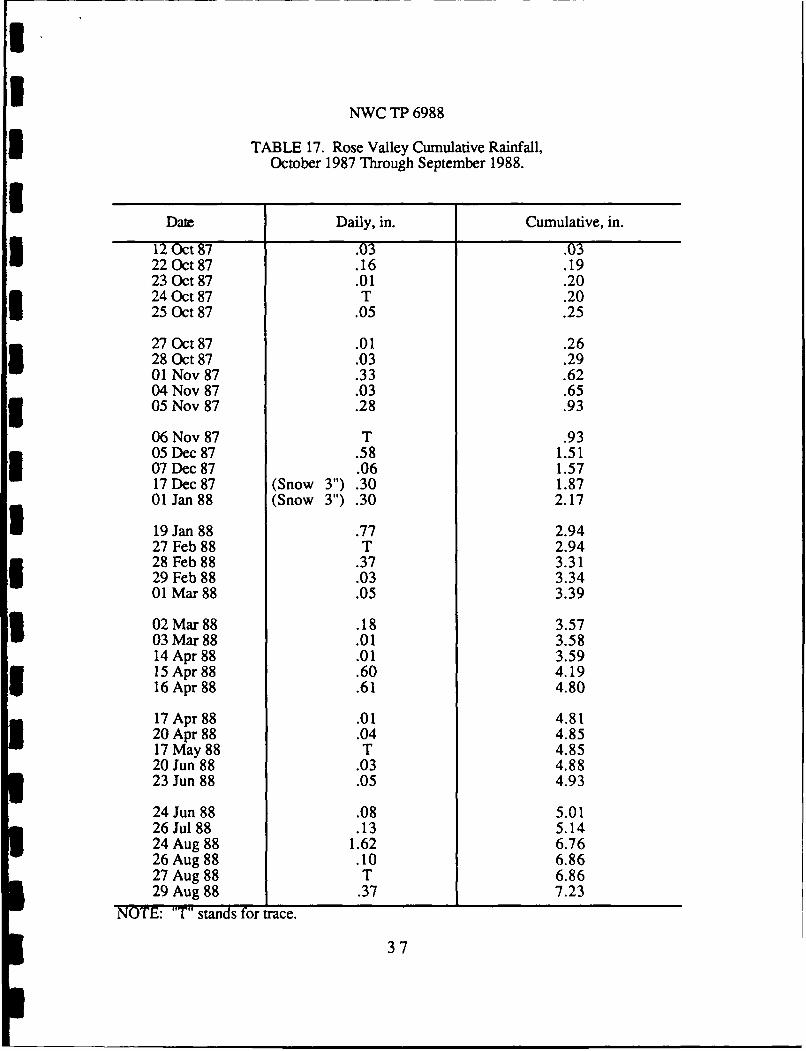
TABLE 17. Rose Valley Cumulative Rainfall,October 1987 Through September 1988.
Date Daily, in. Cumulative, in.
12 Oct 87 .03 .0322 Oct 87 .16 .1923 Oct 87 .01 .2024 Oct 87 T .2025 Oct 87 .05 .25
27 Oct87 .01 .2628 Oct 87 .03 .2901 Nov 87 .33 .6204 Nov 87 .03 .6505 Nov 87 .28 .93
06 Nov 87 T .9305 Dec 87 .58 1.5107 Dec 87 .06 1.5717 Dec 87 (Snow 3") .30 1.8701 Jan 88 (Snow 3") .30 2.17
19 Jan 88 .77 2.9427 Feb 88 T 2.9428 Feb 88 .37 3.3129 Feb 88 .03 3.3401 Mar 88 .05 3.39
02 Mar 88 .18 3.5703 Mar 88 .01 3.5814 Apr 88 .01 3.5915 Apr 88 .60 4.1916 Apr 88 .61 4.80
17 Apr 88 .01 4.8120 Apr 88 .04 4.8517 May 88 T 4.8520 Jun 88 .03 4.8823 Jun 88 .05 4.93
24 Jun 88 .08 5.0126 Jul 88 .13 5.1424 Aug 88 1.62 6.7626 Aug 88 .10 6.8627 Aug 88 T 6.8629 Aug 88 .37 7.23
NOTE: "T" stands for trace.
37
NWC TP 6988
WATER ANALYSIS OF COSO HOT SPRINGS AREA SITES
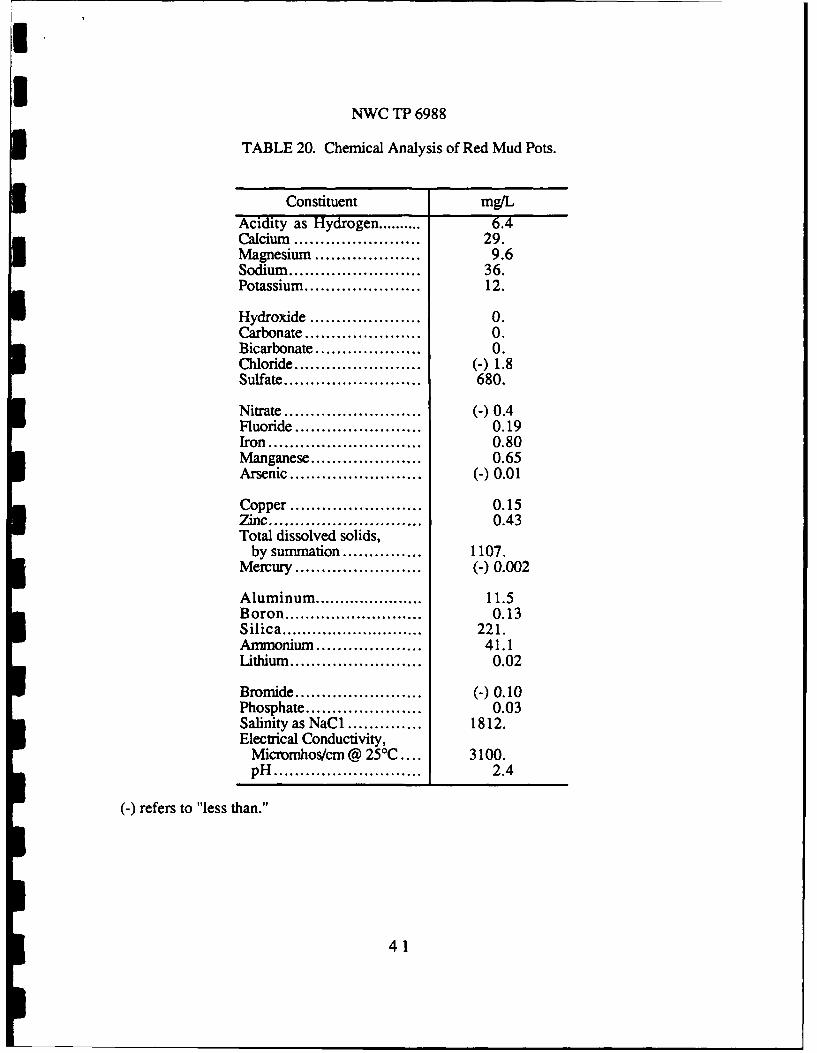
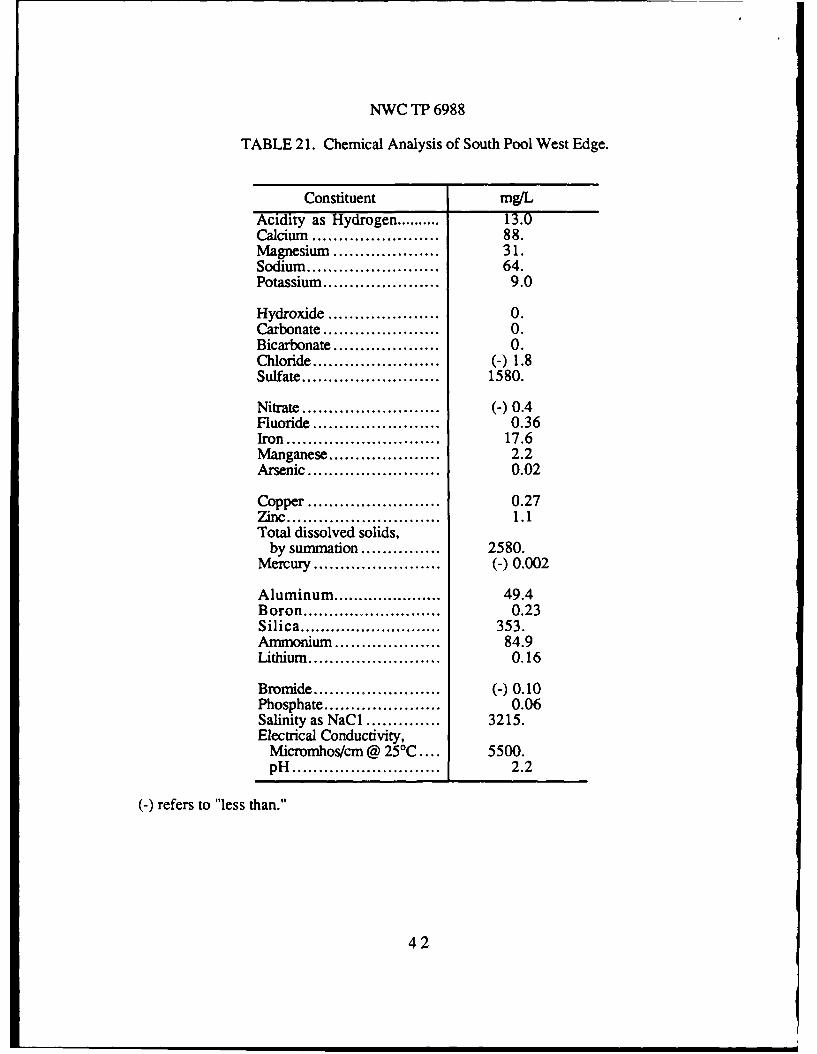
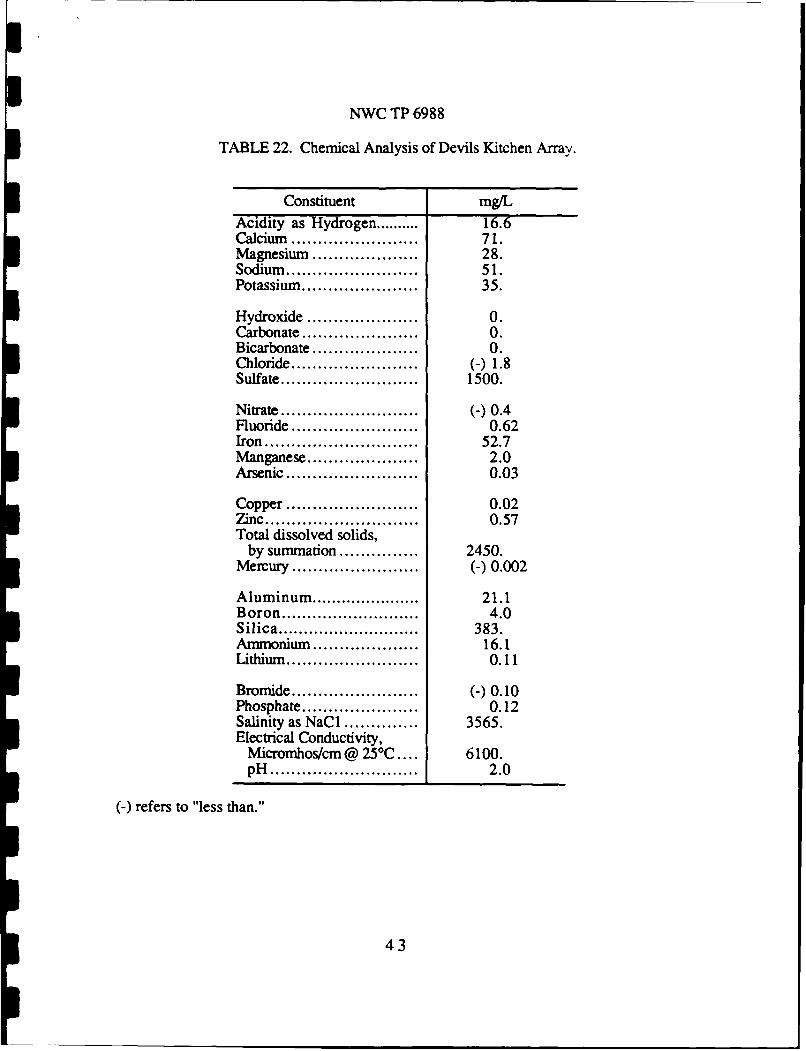
Water samples were taken from several sites in the Hot Springs area duringSeptember 1988. These samples were analyzed for chemical composition by B.C.Laboratories, Inc., Bakersfield, Calif. The results are given in Tables 18 through 22.
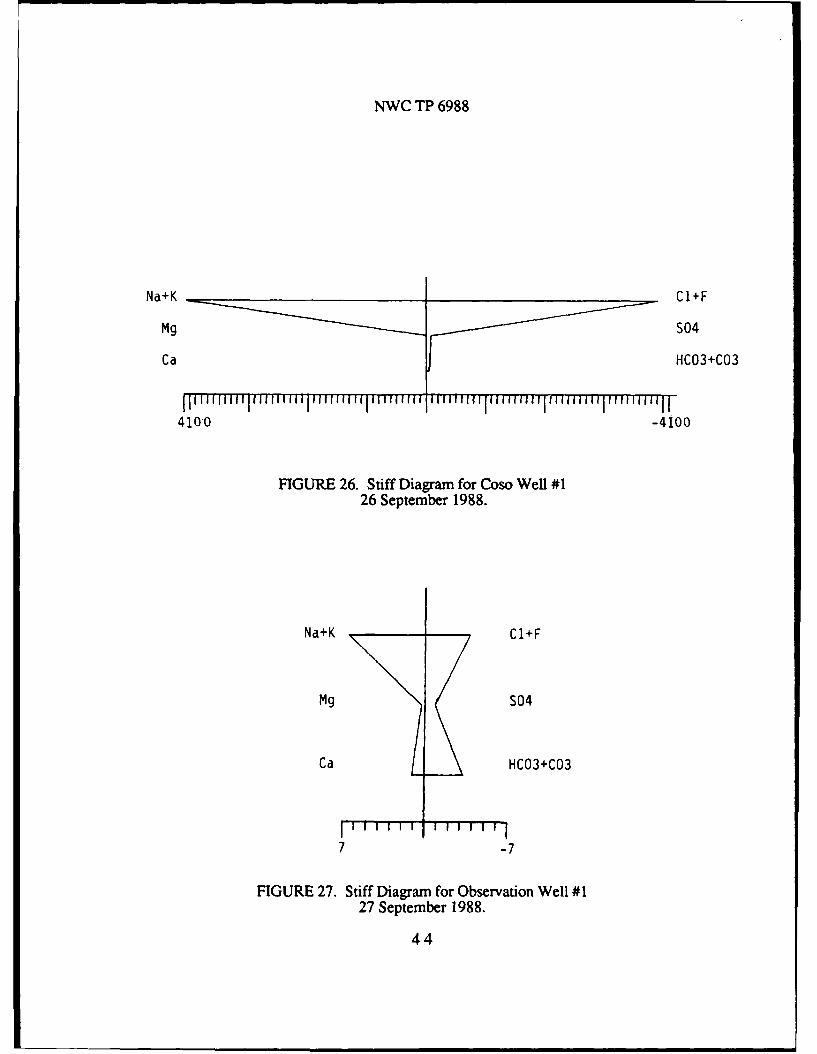
In last years report a comparison of these Coso waters was presented using stiffdiagrams 1. A visual comparison of the previous sample analyses and those taken during ithe current reporting period indicates that the close similarity of the acid sulfate waters ofDevils Kitchen, the South Pool, and the Red Mud Pot has been maintained. Newdiagrams have not been printed in this report. 5
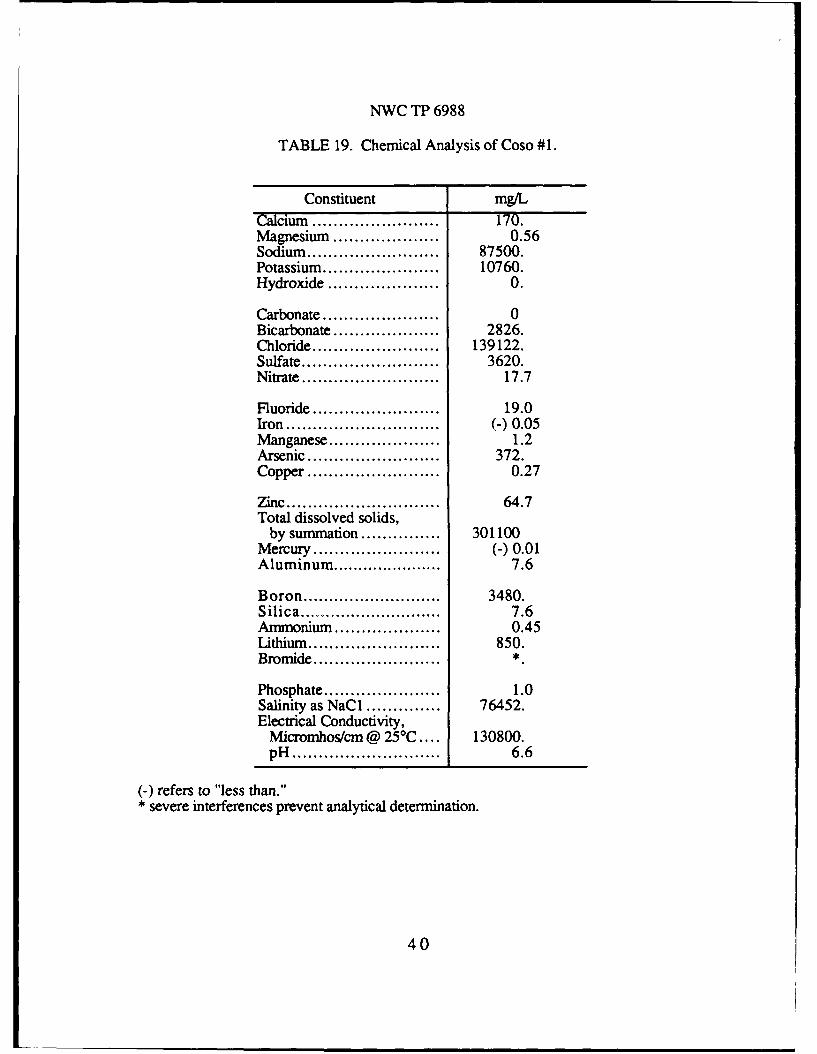
Stiff diagrams of the September samples of Coso Well #1, Observation Well #1(formally Coso Well #2) are given as Figures 26 and 27. Coso Well #1 shows a markedincrease in constituent concentrations. This increase, combined with the drop in water Ilevel noted on page 30, indicates that the amount of water entering the well has not beenable to keep up with the evaporation rate, or boiling, in the wellbore. When we attemptedto take further water samples, we found a constriction in the wellbore at about 210 feet.We will attempt to rehabilitate this well in 1989.
Observation Well #1 also shows a significant change, a decrease in concentration. Asstated in last years report' Observation Well #1 waters are a combination of geothermal Ileakage similar to Coso Well #1 and Haiwee Spring type waters. This well was pumpedto provide water for the geothermal production well drilling until April 1988. Since thereis no longer pumping stress on the Coso Valley Aquifer at this point what we are seeing Iis a return to more natural conditions and a larger component of Haiwee Springs typewater in the aquifer on the east side of the valley.
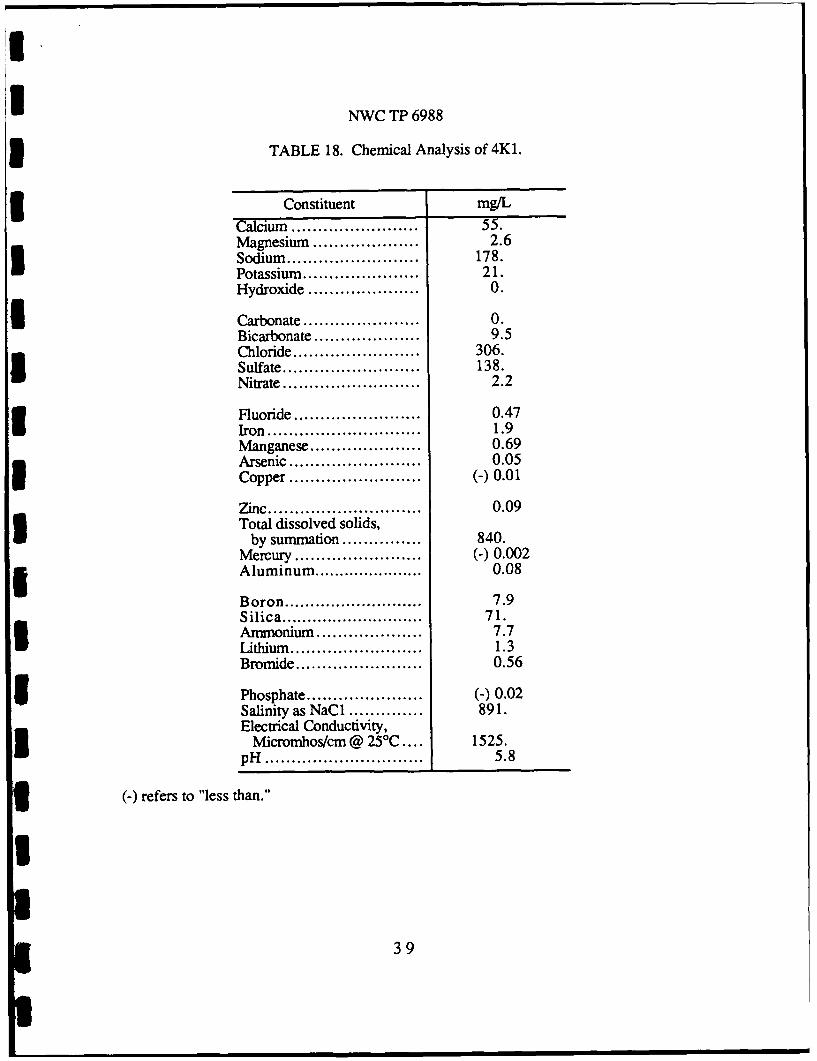
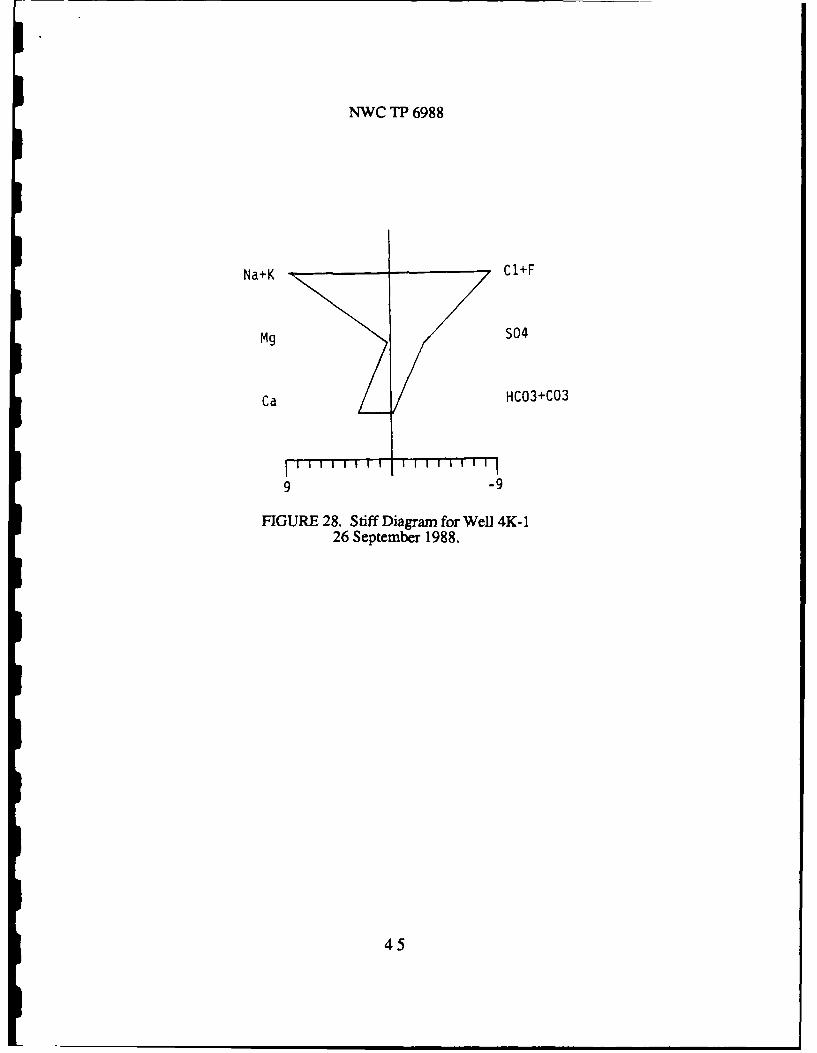
A stiff diagram for well 4K-1 is given in Figure 28. This well has not beenIdiagramed before. It shows a mixed water that has predominantly geothermal leakagecomponents but the very low concentrations substantiate our view that this water isprimarily a condensate from the geothermal system. I
3IIII
38 5I
NWC TP 6988
TABLE 18. Chemical Analysis of 4K1.
Constituent mg/LCalcium ....................... . 55.Magnesium .................... 2.6Sodium ......................... 178.Potassium ...................... 21.Hydroxide ....... ........... 0.
Carbonate ..................... 0.Bicarbonate .................... 9.5Chloride ........................ 306.Sulfate .......................... 138.Nitrate .......................... 2.2
Fluoride ........................ 0.47Iron ............................. 1.9Manganese ..................... 0.69Arsenic ......................... 0.05
I Copper ......................... (-) 0.01
Zinc ............................. 0.09Total dissolved solids,
by summation ............... 840.Mercury ........................ (-) 0.0023 Aluminum ...................... 0.08
Boron ........................... 7.9Silica ............................ 71.Ammonium ................... 7.7Lithium ......................... 1.3Bromide ........................ 0.56
Phosphate ...................... (-) 0.02Salinity as NaC1 .............. 891.Electrical Conductivity,
Micromhos/cm @ 251C 1525.pH .............................. 5.8
3 (-) refers to "less than."
I3
m 39
NWC TP 6988
TABLE 19. Chemical Analysis of Coso #1.
Constituent mg/LCalcium ........................ 170.Magnesium .................... 0.56Sodium ......................... 87500.Potassium ...................... 10760.Hydroxide .................... 0.
Carbonate ...................... 0Bicarbonate .................... 2826.Chloride ........................ 139122.Sulfate .......................... 3620.Nitrate .......................... 17.7
Fluoride ........................ 19.0Iron ............................. (-)0.05Manganese ..................... 1.2Arsenic ......................... 372.Copper ......................... 0.27
Zinc ............................. 64.7Total dissolved solids,
by summation ............... 301100Mercury ........................ (-) 0.01Aluminum ...................... 7.6
Boron ........................... 3480.Silica ............................ 7.6Ammonium .................... 0.45Lithium ......................... 850.Bromide ........................ .*
Phosphate ...................... 1.0Salinity as NaC1 .............. 76452.Electrical Conductivity,
Micromhos/cm @ 250C .... 130800.pH ............................ 6.6
(-) refers to "less than."• severe interferences prevent analytical determination.
40
I.NWC TP 6988
TABLE 20. Chemical Analysis of Red Mud Pots.
Constituent mg/LAcidity as Hydrogen .......... 6.4Calcium ........................ 29.Magnesium .................... 9.6Sodium ......................... 36.Potassium ...................... 12.
Hydroxide ................... 0.Carbonate ................... 0.Bicarbonate .................. 0.Chloride ........................ (-) 1.8Sulfate .......................... 680.
Nitrate .......................... (-) 0.4Fluoride ........................ 0.19Iron ............................. 0.80Manganese ..................... 0.65Arsenic ......................... (-) 0.01
Copper ......................... 0.15Zinc ............................. 0.43Total dissolved solids,
by summation ............... 1107.Mercury ........................ (-) 0.002
Aluminum ...................... 11.5Boron ........................... 0.13Silica ............................ 221.Ammonium .................... 41.1Lithium ......................... 0.02
Bromide ........................ (-) 0.10Phosphate ...................... 0.03Salinity as NaCi .............. 1812.Electrical Conductivity,
Micromhos/cm @ 25 0C .... 3100.pH ............................ 2.4
(-) refers to "less than."
41
NWC TP 6988
TABLE 21. Chemical Analysis of South Pool West Edge.
Constituent mg/LAcidity as Hydrogen .......... 13.0Calcium ........................ 88.Magnesium .................... 31.Sodium ......................... 64.Potassium ...................... 9.0
Hydroxide ................... 0.Carbonate ................ ..... 0.Bicarbonate .................. 0.Chloride ........................ (-) 1.8Sulfate .......................... 1580.
Nitrate .......................... (-) 0.4Fluoride ........................ 0.36Iron ............................. 17.6Manganese ..................... 2.2Arsenic ......................... 0.02
Copper ......................... 0.27Zinc ............................. 1.1Total dissolved solids,
by summation ............... 2580.Mercury ........................ (-) 0.002
Aluminum ...................... 49.4Boron ........................... 0.23Silica ............................ 353.Ammonium .................... 84.9Lithium ......................... 0.16
Bromide ........................ (-)0.10Phosphate ...................... 0.06Salinity as NaC1 .............. 3215.Electrical Conductivity,
Micromhos/cm @ 25*C .... 5500.pH ............................ 2.2
(-) refers to "less than."
42
NWC TP 6988
TABLE 22. Chemical Analysis of Devils Kitchen Array.
Constituent mg/LAcidity as Hydrogen .......... 16.6Calcium ........................ 71.Magnesium .................... 28.Sodium ......................... 51.Potassium ...................... 35.
Hydroxide ................... 0.Carbonate ................ ..... 0.Bicarbonate .................. 0.Chloride ........................ (-) 1.8Sulfate .......................... 1500.
Nitrate .......................... (-) 0.4Fluoride ........................ 0.62Iron ............................. 52.7Manganese ..................... 2.0Arsenic ......................... 0.03
Copper ......................... 0.02Zinc ............................. 0.57Total dissolved solids,
by summation ............... 2450.Mercury ........................ (-) 0.002
Aluminum ...................... 21.1Boron ........................... 4.0Silica ............................ 383.Ammonium .................... 16.1Lithium ......................... 0.11
Bromide ........................ (-)0.10Phosphate ...................... 0.12Salinity as NaCI .............. 3565.Electrical Conductivity,
Micromhos/cm @ 25'C .... 6100.pH ............................ 2.0
(-) refers to "less than."
43
NWC TP 6988
Na+K C 1 +F
Mg9 S04
Ca HC03+C03
410-0 -4100
FIGURE 26. Stiff Diagram for Coso Well #126 September 1988.
Na+K C1+F
Mg S04
Ca HCO3+C03
7 -7
FIGURE 27. Stiff Diagram for Observation Well #1
27 September 1988.
44
NWC TP 6988
Na+K C 1+F
Mg S04
Ca HC03+C03
9 -9
FIGURE 28. Stiff Diagram for Well 4K-I26 September 1988.
45
NWC TP 6988
PLANS FOR 1989
The present program will continue throughout 1989. In addition, the followingrepairs, etc. are planned: 1) determine the problems with, and rehabilitate Coso Well #1;2) replace the Barton meter at Schober's Resort; 3) redesign the steam flow manifolds ateach of the steam sites to give more consistent data; 4) rehabilitate rain gauges; and 5)install water level measuring systems in each of the wells, as available.
SUMMARY
The ongoing monitoring program has successfully continued during this eleventh yearreporting period. Instruments have been updated and changed as required and calibratedon a monthly basis or as needed for more consistent data.
The steam flow instrumentation shows an increase in activity which is also indicatedby the photographic essay and water level measurements at the Mud Pots and South Pool.The long term continuity in the data gathered indicates that local evaporation and rainfallare the major controlling factors of the observable surface phenomena. However, asindicated in this report, changes occurred at several sites which will be watched veryclosely during the coming year so that the magnitude or significance of the apparentchanges can be properly gaged.
The testing of the steam wells in the California Energy Steam Field have shown noidentifiable effect on the mud pots or pools within the national register site during thisreporting period.
46
NWC TP 6988
3 REFERENCES
1. Naval Weapons Center. Coso Monitoring ProEgram. October 1986 ThroughSeptember 1987. E. M. Edwards. China Lake, Calif., NWC, June 1988. 112 pp.(NWC TP 6919, publication UNCLASSIFIED.)
IIIIIIIIII
IU
I 47
U
NWC TP 6988
Appendix A
DAILY STEAM FLOW
49
I
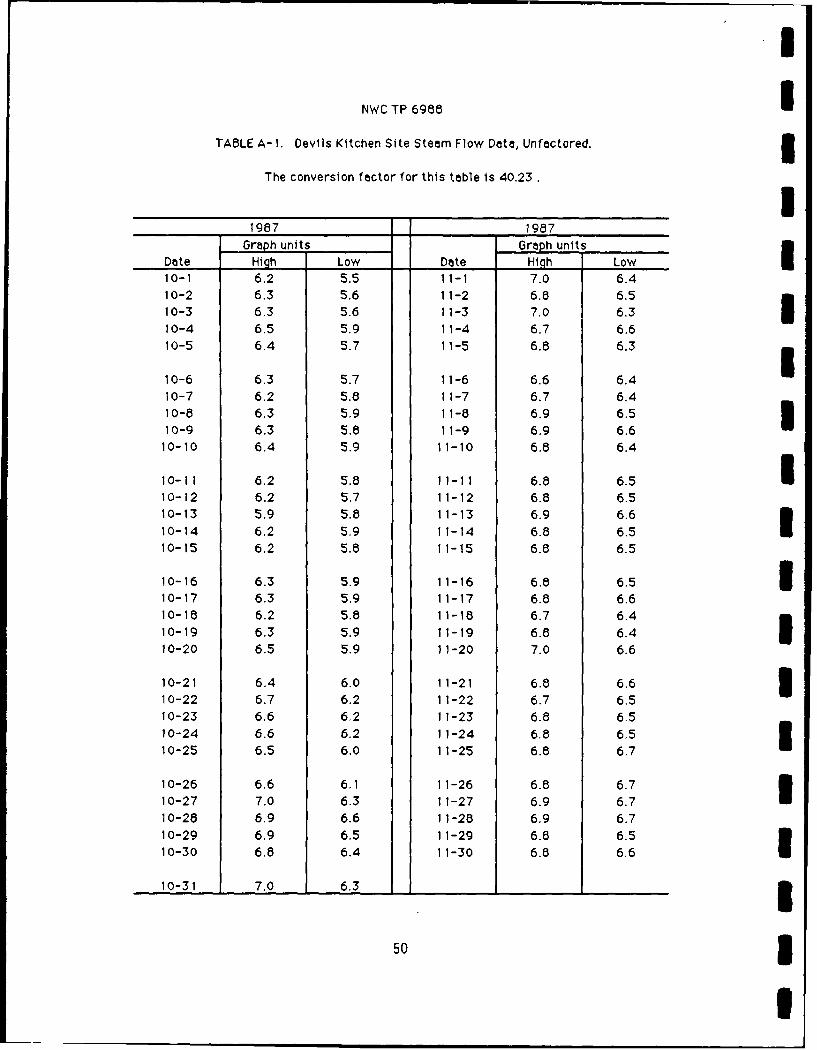
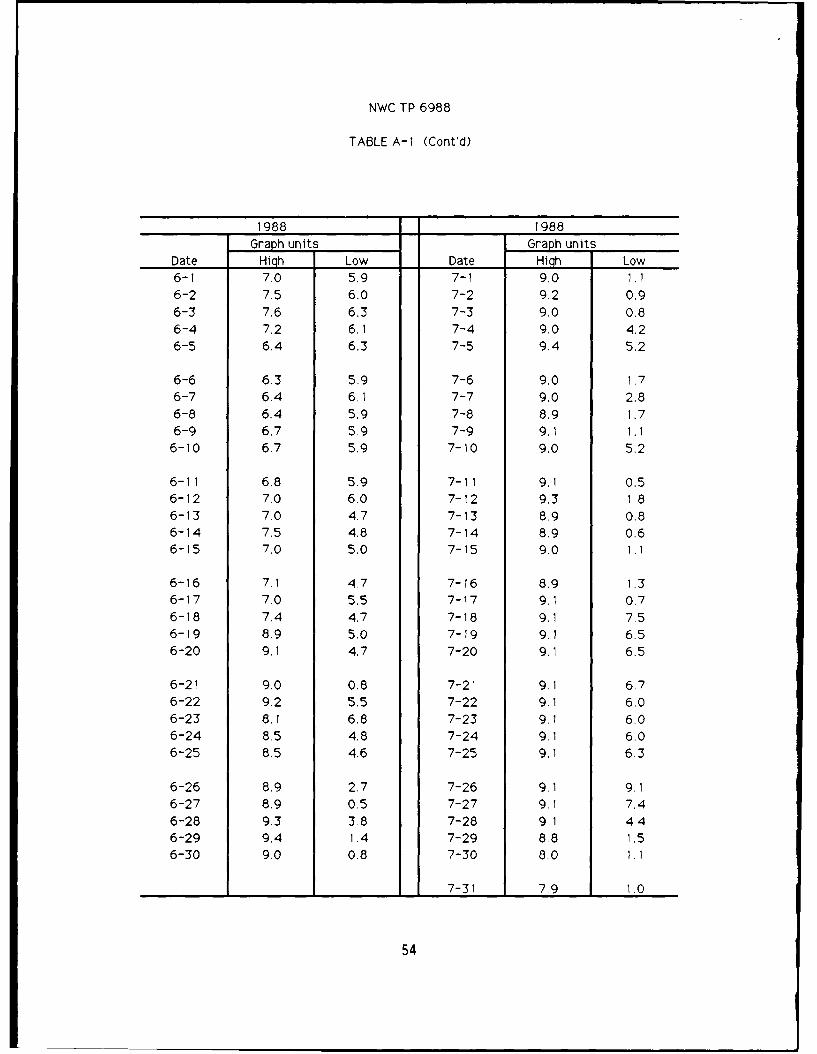
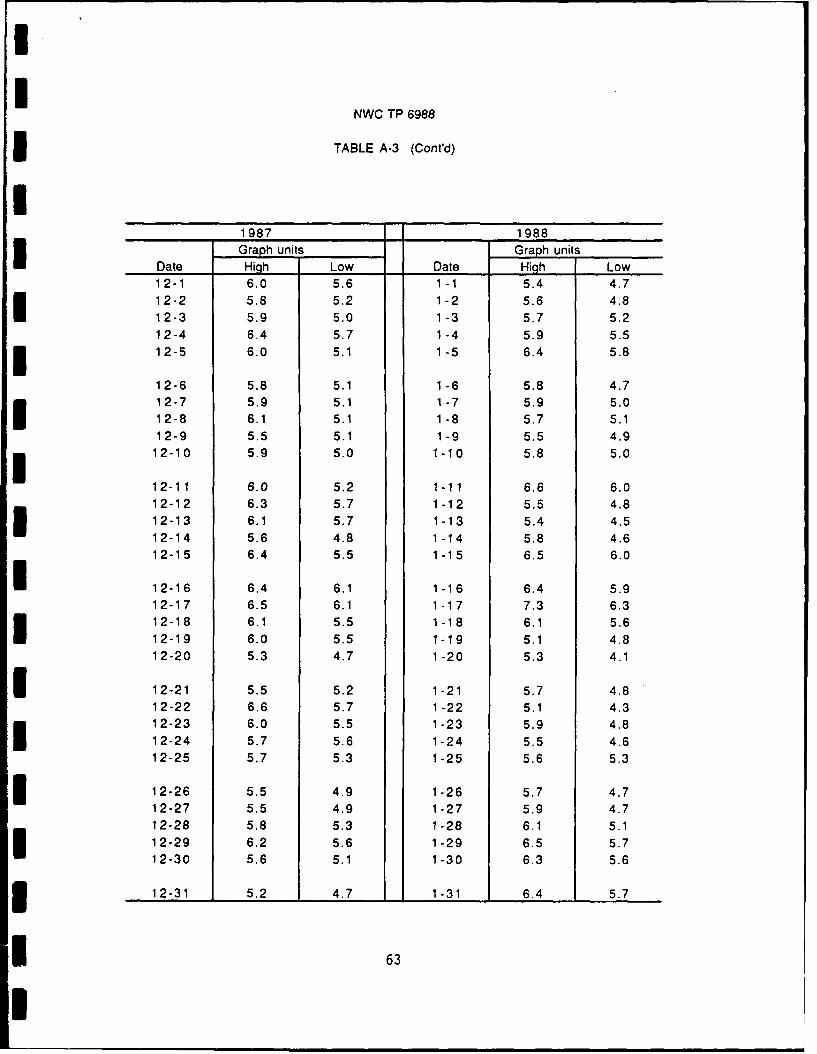
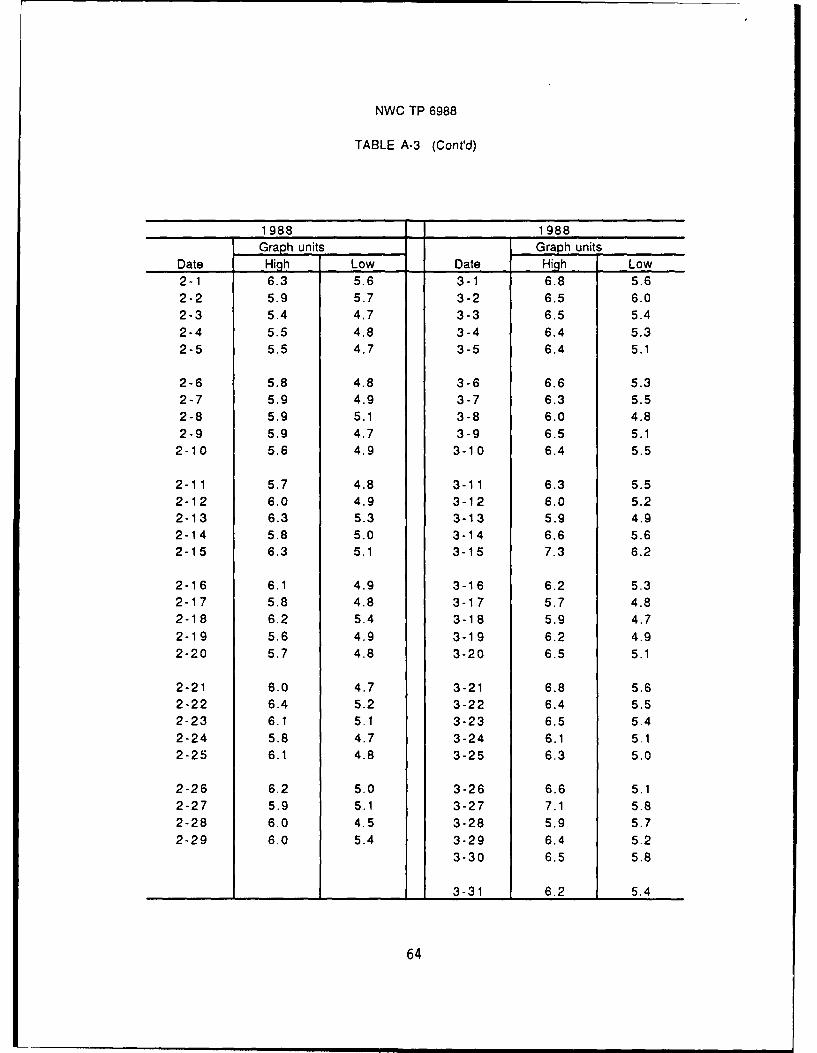
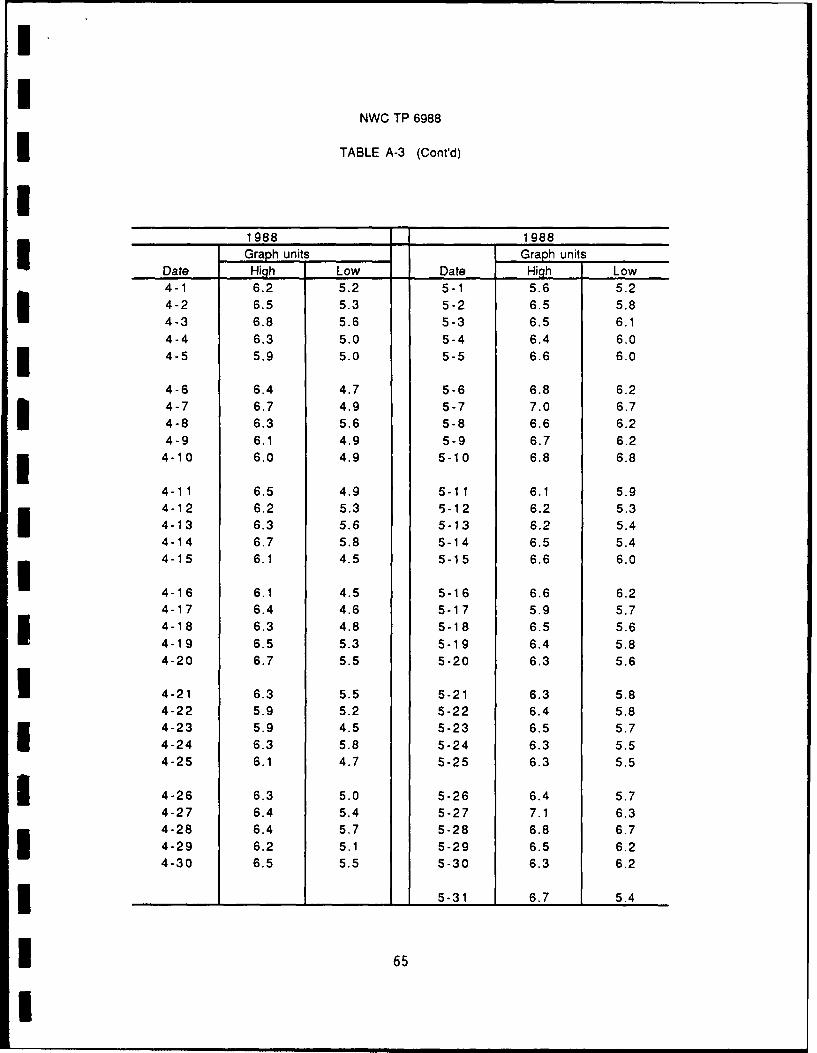
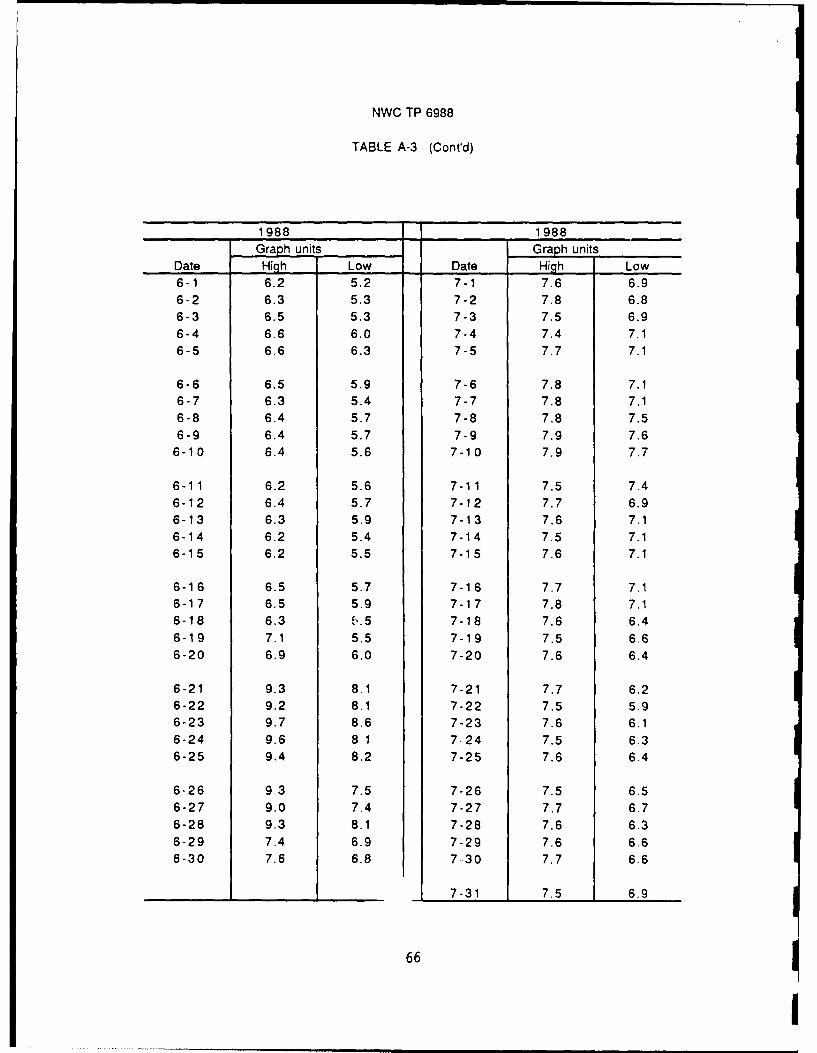
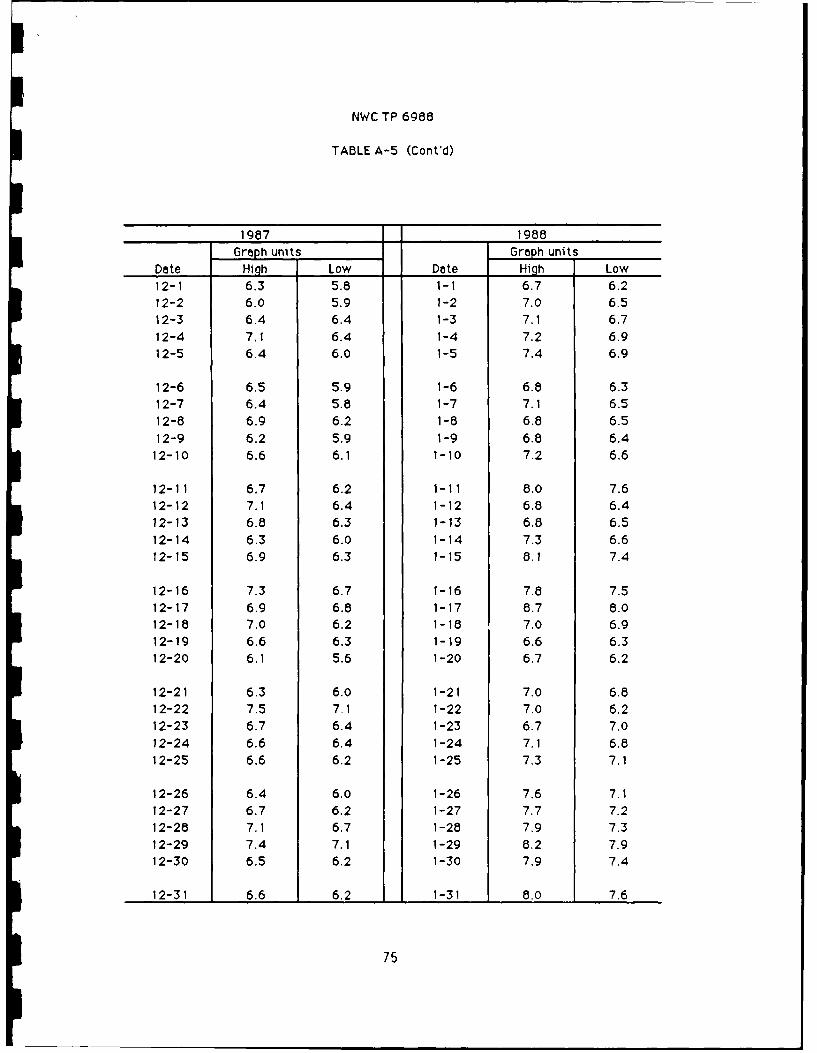
NWC TP 6988 ITABLE A-I. Devils Kitchen Site Steam Flow Date, Unfactored.
The conversion factor for this table is 40.23.
1987 1987
Graph units Graph unitsDate High Low Date High Low10-1 6.2 5.5 1 1-1 7.0 6.410-2 6.3 5.6 11-2 6.8 6.510-3 6.3 5.6 11-3 7.0 6.310-4 6.5 5.9 11-4 6.7 6.610-5 6.4 5.7 11-5 6.8 6.3
10-6 6.3 5.7 11-6 6.6 6.410-7 6.2 5.8 11-7 6.7 6.410-8 6.3 5.9 11-8 6.9 6.510-9 6.3 5.8 11-9 6.9 6.6
10-10 6.4 5.9 11-10 6.8 6.4
10-11 6.2 5.8 11-11 6.8 6.5 I10-12 6.2 5.7 11-12 6.8 6.510-13 5.9 5.8 11-13 6.9 6.610-14 6.2 5.9 11-14 6.8 6.510-15 6.2 5.6 11-15 6.6 6.5
10-16 6.3 5.9 11-16 6.8 6.5 I10-17 6.3 5.9 11-17 6.8 6.610-18 6.2 5.8 11-18 6.7 6.410-19 6.3 5.9 11-19 6.8 6.410-20 6.5 5.9 11-20 7.0 6.6
10-21 6.4 6.0 11-21 6.8 6.610-22 6.7 6.2 11-22 6.7 6.510-23 6.6 6.2 11-23 6.8 6.510-24 6.6 6.2 11-24 6.8 6,510-25 6.5 6.0 11-25 6.8 6.7
10-26 6.6 6.1 11-26 6.6 6.710-27 7.0 6.3 11-27 6.9 6.710-28 6.9 6.6 11-28 6.9 6.710-29 6.9 6.5 11-29 6.8 6.5
10-30 6.8 6.4 11-30 6.8 6.6
10-31 7.0 6.3 3
503
NWC TP 6988
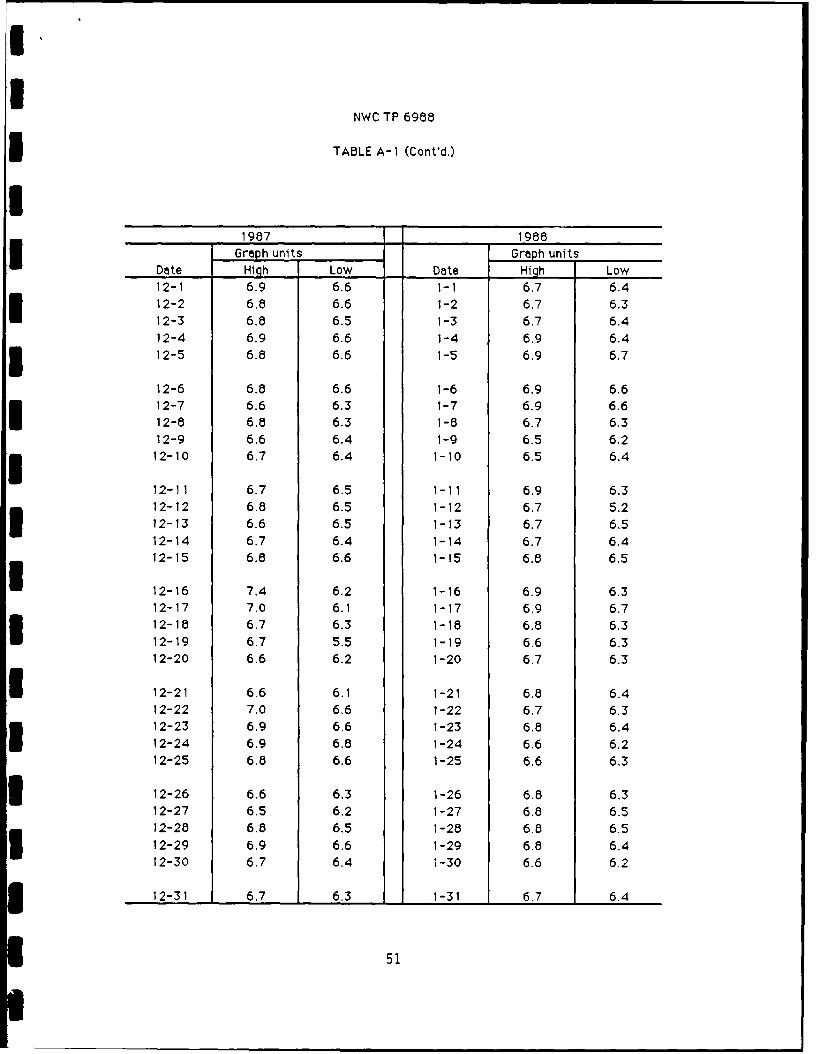
TABLE A- 1 (Cont'd.)
1987 1988Graph units Graph units
Date High Low Date High Low12-1 6.9 6.6 1-1 6.7 6.412-2 6.8 6.6 1-2 6.7 6.312-3 6.8 6.5 1-3 6.7 6.4
12-4 6.9 6.6 1-4 6.9 6.412-5 6.8 6.6 1-5 6.9 6.7
12-6 6.8 6.6 1-6 6.9 6.612-7 6.6 6.3 1-7 6.9 6.612-8 6.8 6.3 1-8 6.7 6.312-9 6.6 6.4 1-9 6.5 6.2
12-10 6.7 6.4 1-10 6.5 6.4
12-11 6.7 6.5 1-11 6.9 6.312-12 6.8 6.5 1-12 6.7 5.212-13 6.6 6.5 1-13 6.7 6.512-14 6.7 6.4 1-14 6.7 6.412-15 6.8 6.6 1-15 6.8 6.5
12-16 7.4 6.2 1-16 6.9 6.312-17 7.0 6.1 1-17 6.9 6.712-18 6.7 6.3 1-18 6.8 6.312-19 6.7 5.5 1-19 6.6 6.312-20 6.6 6.2 1-20 6.7 6.3
1 12-21 6.6 6.1 1-21 6.8 6.412-22 7.0 6.6 1-22 6.7 6.312-23 6.9 6.6 1-23 6.8 6.4
12-24 6.9 6.8 1-24 6.6 6.212-25 6.8 6.6 1-25 6.6 6.3
I 12-26 6.6 6.3 1-26 6.8 6.312-27 6.5 6.2 1-27 6.8 6.512-28 6.8 6.5 1-28 6.8 6.512-29 6.9 6.6 1-29 6.8 6.412-30 6.7 6.4 1-30 6.6 6.2
12-31 6.7 6.3 1-31 6.7 6.4
51
NWC TP 6988
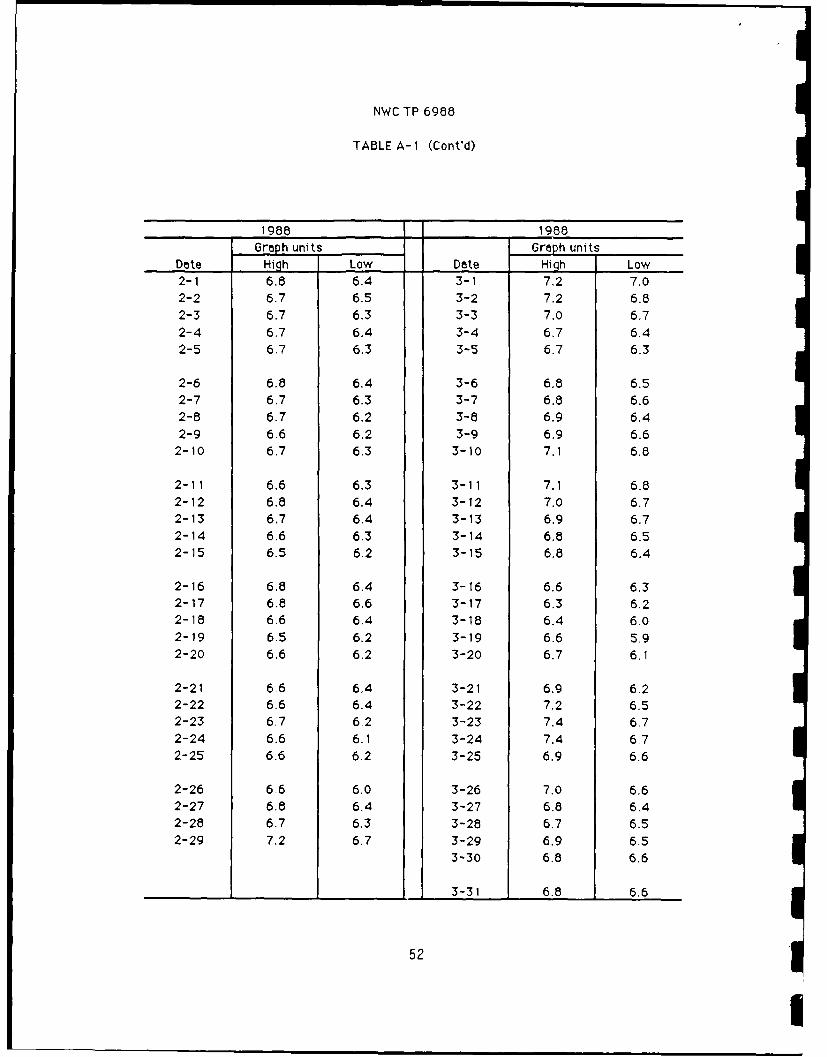
TABLE A-i (Cont'd)
1988 1988
Graph units Graph unitsDate High Low Date High Low2-1 6.8 6.4 3-1 7.2 7.02-2 6.7 6.5 3-2 7.2 6.82-3 6.7 6.3 3-3 7.0 6.72-4 6.7 6.4 3-4 6.7 6.42-5 6.7 6.3 3-5 6.7 6.3
2-6 6.8 6.4 3-6 6.8 6.52-7 6.7 6.3 3-7 6.8 6.62-8 6.7 6.2 3-8 6.9 6.42-9 6.6 6.2 3-9 6.9 6.62-10 6.7 6.3 3-10 7.1 6.8
2-11 6.6 6.3 3-11 7.1 6.82-12 6.8 6.4 3-12 7.0 6.72-13 6.7 6.4 3-13 6.9 6.72-14 6.6 6.3 3-14 6.8 6.52-15 6.5 6.2 3-15 6.8 6.4
2-16 6.8 6.4 3-16 6.6 6.32-17 6.8 6.6 3-17 6.3 6.22-18 6.6 6.4 3-18 6.4 6.02-19 6.5 6.2 3-19 6.6 5.92-20 6.6 6.2 3-20 6.7 6. 1
2-21 6.6 6.4 3-21 6.9 6.22-22 6.6 6.4 3-22 7.2 6.52-23 6.7 6.2 3-23 7.4 6.72-24 6.6 6.1 3-24 7.4 6.72-25 6.6 6.2 3-25 6.9 6.6
2-26 6.6 6.0 3-26 7.0 6.62-27 6.8 6.4 3-27 6.8 6.42-26 6.7 6.3 3-28 6.7 6.52-29 7.2 6.7 3-29 6.9 6.5
3-30 6.8 6.6
3-31 6.8 6.6
52
I
NWC TP 6988
TABLE A-i (Cont'd)
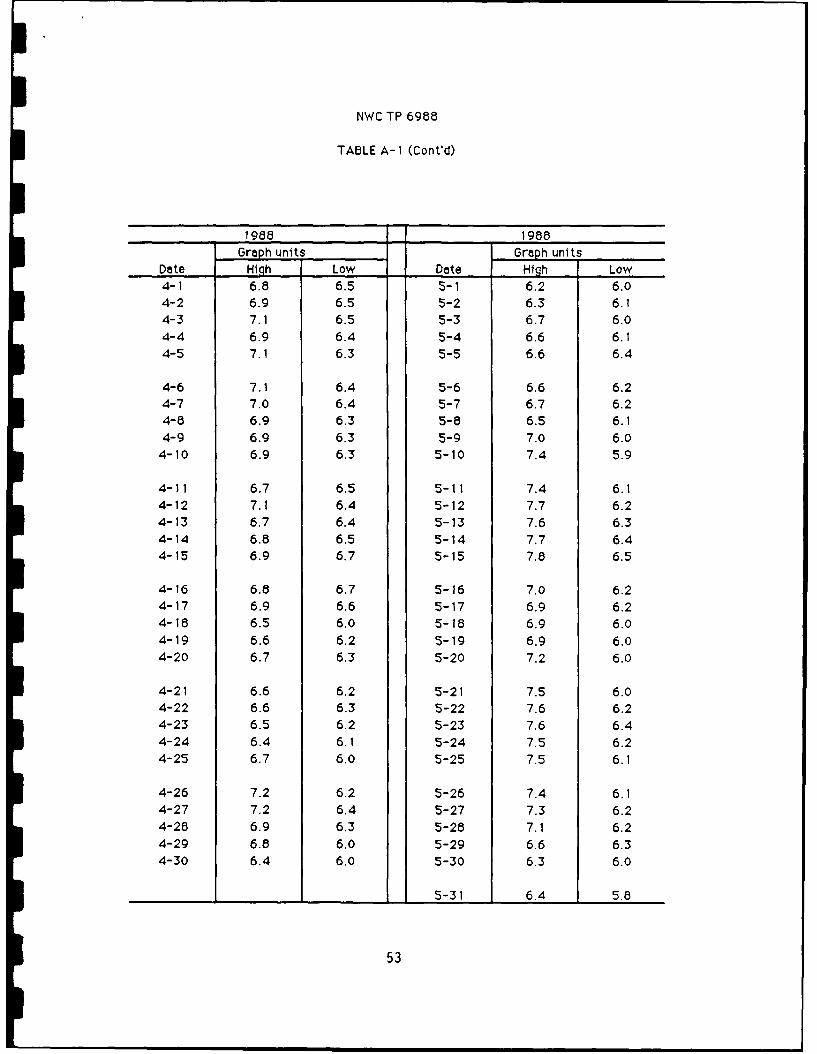
1988 1988Graph units Greph units
Date High Low Date High Low4-1 6.8 6.5 5-1 6.2 6.04-2 6.9 6.5 5-2 6.3 6.14-3 7.1 6.5 5-3 6.7 6.04-4 6.9 6.4 5-4 6.6 6.14-5 7.1 6.3 5-5 6.6 6.4
4-6 7.1 6.4 5-6 6.6 6.24-7 7.0 6.4 5-7 6.7 6.24-8 6.9 6.3 5-8 6.5 6.14-9 6.9 6.3 5-9 7.0 6.04-10 6.9 6.3 5-10 7.4 5.9
4-11 6.7 6.5 5-11 7.4 6.14-12 7.1 6.4 5-12 7.7 6.24-13 6.7 6.4 5-13 7.6 6.34-14 6.8 6.5 5-14 7.7 6.44-15 6.9 6.7 5-15 7.8 6.5
4-16 6.8 6.7 5-16 7.0 6.24-17 6.9 6.6 5-17 6.9 6.24-18 6.5 6.0 5-18 6.9 6.04-19 6.6 6.2 5-19 6.9 6.04-20 6.7 6.3 5-20 7.2 6.0
4-21 6.6 6.2 5-21 7.5 6.04-22 6.6 6.3 5-22 7.6 6.24-23 6.5 6.2 5-23 7.6 6.44-24 6.4 6. 1 5-24 7.5 6.24-25 6.7 6.0 5-25 7.5 6.1
4-26 7.2 6.2 5-26 7.4 6.14-27 7.2 6.4 5-27 7.3 6.24-28 6.9 6.3 5-28 7.1 6.24-29 6.8 6.0 5-29 6.6 6.34-30 6.4 6.0 5-30 6.3 6.0
5-31 6.4 5.8
53
NWC TP 6988
TABLE A-I (Cont'd)
1988 1988Graph units Graph units
Date Hilh Low Date High Low6-1 7.0 5.9 7-1 9.0 1.16-2 7,5 6.0 7-2 9.2 0.96-3 7.6 6.3 7-3 9.0 0.86-4 7,2 6.1 7-4 9.0 4.26-5 6.4 6.3 7-5 9.4 5.2
6-6 6,3 5.9 7-6 9.0 1.76-7 6.4 6, 1 7-7 9.0 2.86-8 6.4 5.9 7-8 8.9 1.76-9 6.7 5.9 7-9 9.1 1.16-10 6.7 5.9 7-10 9.0 5.2
6-11 6.8 5.9 7-11 9.1 0.56-12 7.0 6.0 7-12 9.3 1.86-13 7.0 4.7 7-13 8.9 0.86-14 7.5 4.8 7-14 8.9 0.66-15 7.0 5.0 7-15 9.0 1.1
6-16 7.1 4.7 7-16 8.9 1.36-17 7.0 5.5 7-17 9.1 0.76-18 7.4 4.7 7-18 9.1 7.56-19 8.9 5.0 7-19 9.1 6.56-20 9.1 4.7 7-20 9.1 6.5
6-21 9.0 0.8 7-21 9.1 6.76-22 9.2 5.5 7-22 9.1 6.06-23 8.1 6.8 7-23 9.1 6.06-24 8.5 4.8 7-24 9.1 6.06-25 8.5 4.6 7-25 9.1 6.3
6-26 8.9 2.7 7-26 9.1 9.16-27 8.9 0.5 7-27 9. 1 7.46-28 9.3 3.8 7-28 9 1 4.46-29 9.4 1.4 7-29 8.8 1.56-30 9.0 0.8 7-30 8.0 1.1
7-31 7,9 1.0
54
NWC TP 6988
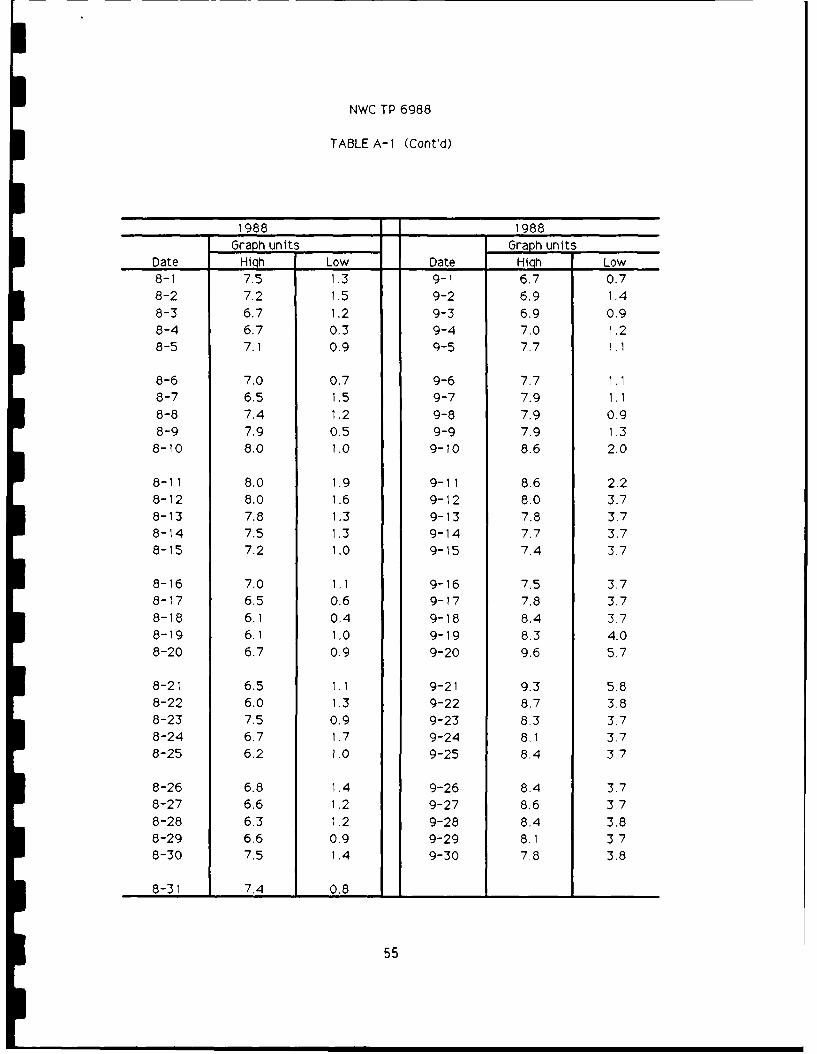
TABLE A-1 (Cont'd)
1988 1988
Graph units Graph unitsDate High Low Date High Low8-1 7.5 1.3 9-1 6.7 0.78-2 7.2 1.5 9-2 6.9 1.48-3 6.7 1.2 9-3 6.9 0.98-4 6.7 0.3 9-4 7.0 1.28-5 7.1 0.9 9-5 7.7 1.1
8-6 7.0 0.7 9-6 7.7 1.18-7 6.5 1.5 9-7 7.9 1.18-8 7.4 1.2 9-8 7.9 0.98-9 7.9 0.5 9-9 79 1.38-10 8.0 1.0 9-10 8.6 2.0
8-11 8.0 1.9 9-11 8.6 2.28-12 8.0 1.6 9-12 8.0 3.78-13 7.8 1.3 9-13 7.8 3.78-14 7.5 1.3 9-14 7.7 3.78-15 7.2 1.0 9-15 7.4 3.7
8-16 7.0 1.1 9-16 7.5 3.78-17 6.5 0.6 9-17 7.8 3.78-18 6.1 0.4 9-18 8.4 3.78-19 6,1 1.0 9-19 8.3 4.08-20 6.7 0.9 9-20 9.6 5.7
8-21 6.5 1.1 9-21 9.3 5.88-22 6.0 1.3 9-22 87 3.88-23 75 0.9 9-23 83 3.78-24 6.7 1.7 9-24 8.1 378-25 6.2 1,0 9-25 8.4 3.7
8-26 6.8 1.4 9-26 84 3.78-27 6.6 1.2 9-27 8.6 378-28 63 1.2 9-28 8.4 3.88-29 6.6 0.9 9-29 8.1 3.78-30 7.5 1.4 9-30 7,8 3.8
8-31 7.4 0.8
55
NWC TP 6988
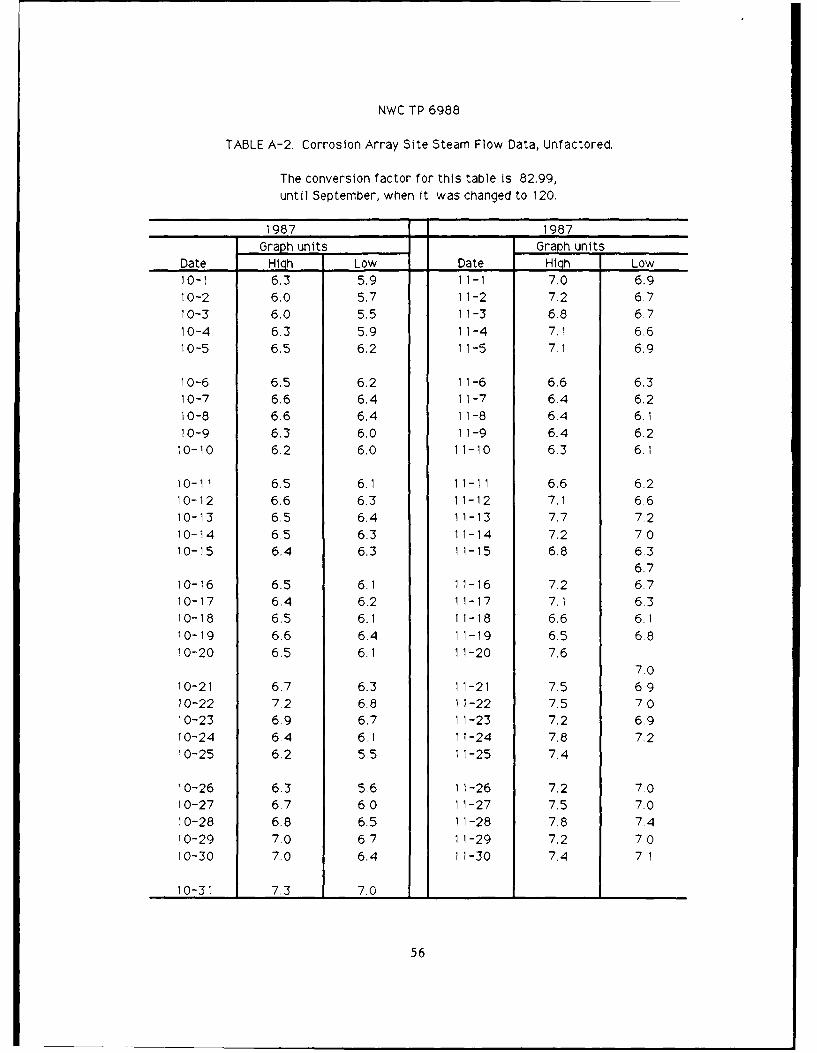
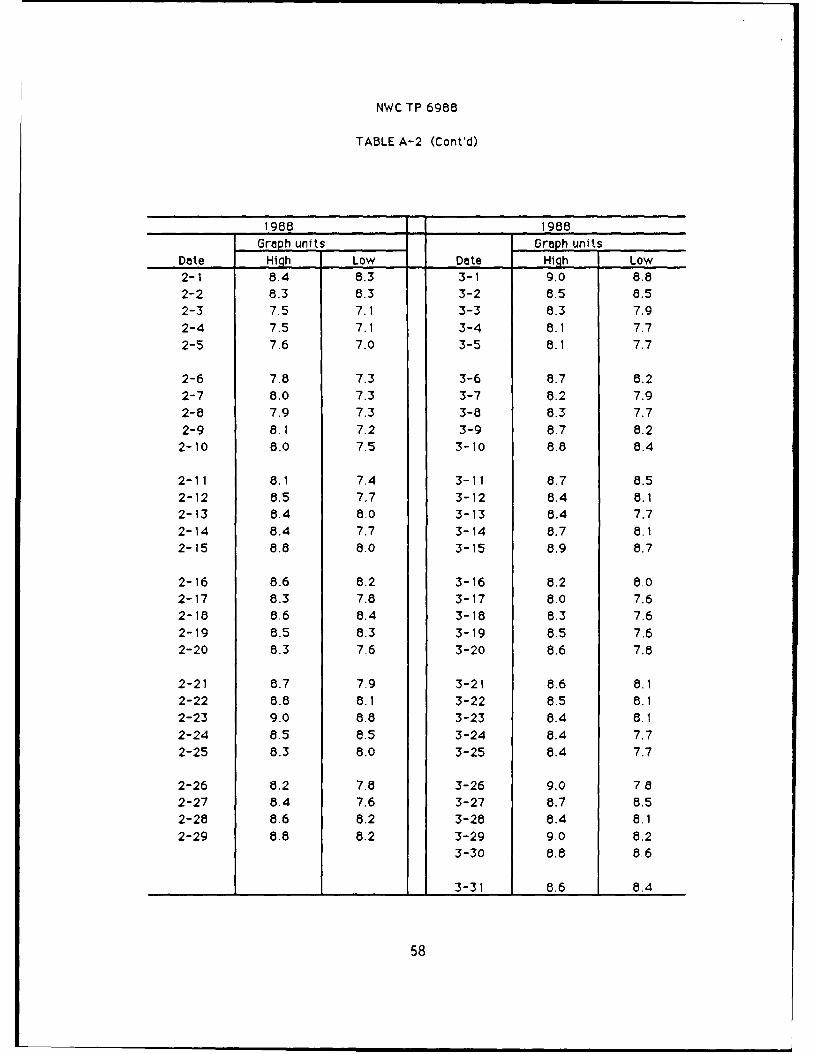
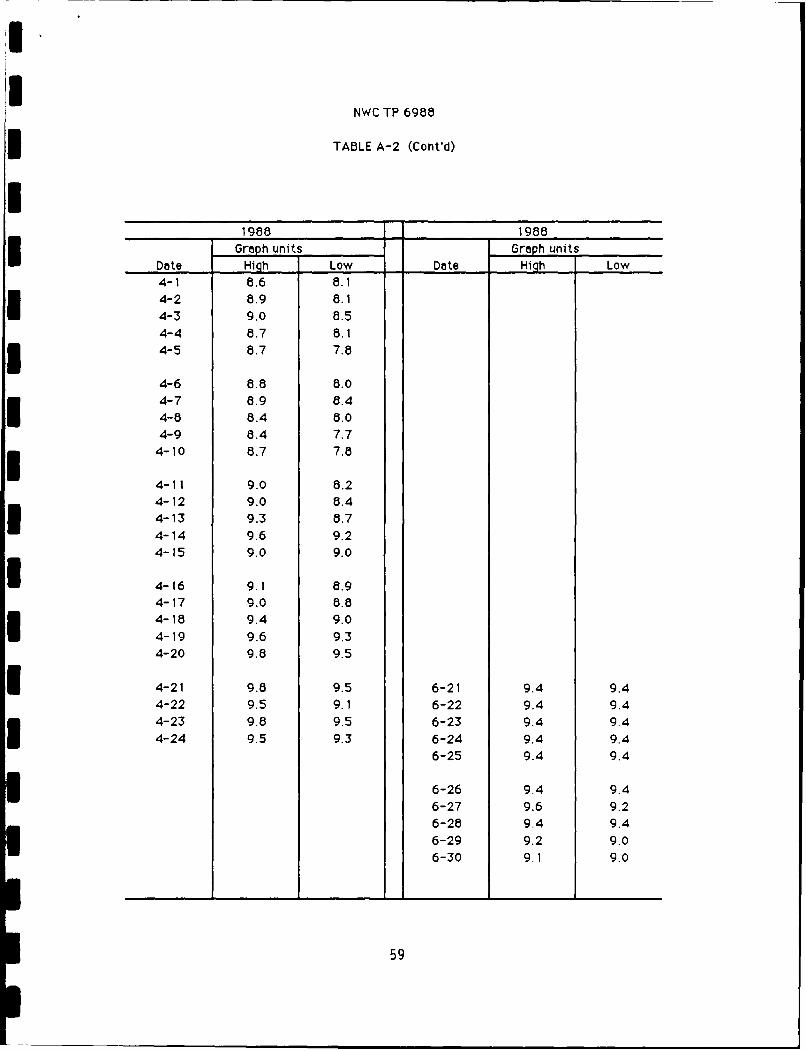
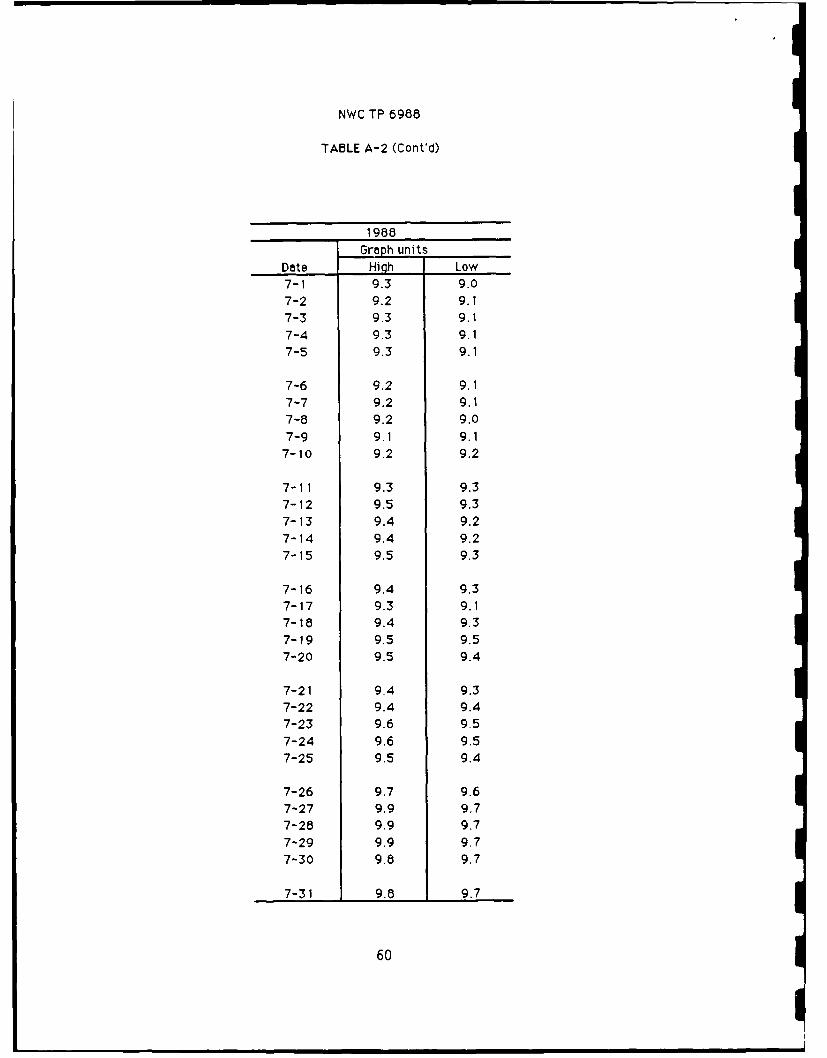
TABLE A-2. Corrosion Array Site Steam Flow Data, Unfactored.
The conversion factor for this table is 82.99,until September, when it was changed to 120.
1987 1987
Graph units Graph unitsDate High Low Date High Low10-1 6.3 5.9 1 1-1 7.0 6.910-2 6.0 5.7 11-2 7.2 6.710-3 6.0 5.5 11-3 6.8 6.710-4 6.3 5.9 11-4 7.1 6.610-5 6.5 6.2 11-5 7.1 6.9
10-6 6.5 6.2 11-6 6.6 6.310-7 6.6 6.4 11-7 6.4 6.210-8 6.6 6.4 11-8 6.4 6.110-9 6.3 6.0 11-9 6.4 6.2
10-10 6.2 6.0 11-10 6.3 6.1
10-11 6.5 6.1 11-11 6.6 6.210-12 6.6 6.3 11-12 7.1 6.610-13 6.5 6.4 11-13 7.7 7.210-14 6.5 6.3 11-14 7.2 7,010-15 6.4 6.3 11-15 6.8 6.3
6.710-16 6.5 6.1 11-16 7.2 6.710-17 6.4 6.2 11-17 7.1 6.310-18 6.5 6.1 11-18 6.6 6.110-19 6.6 6.4 11-19 6.5 6.810-20 6.5 6.1 1 1-20 7.6
7.010-21 6.7 6.3 11-21 7.5 6910-22 7.2 6.8 11-22 7.5 7010-23 69 6.7 11-23 7.2 6.910-24 6.4 6.1 11-24 7.8 7.210-25 6.2 5.5 11-25 7.4
10-26 6.3 5.6 11-26 7.2 7.010-27 6.7 60 11-27 7.5 7.010-28 6.8 6.5 11-28 7.8 7.410-29 70 67 11-29 7.2 7010-30 7.0 6.4 11-30 7.4 7 1
10-31 7.3 7.0
56
NWC TP 6988
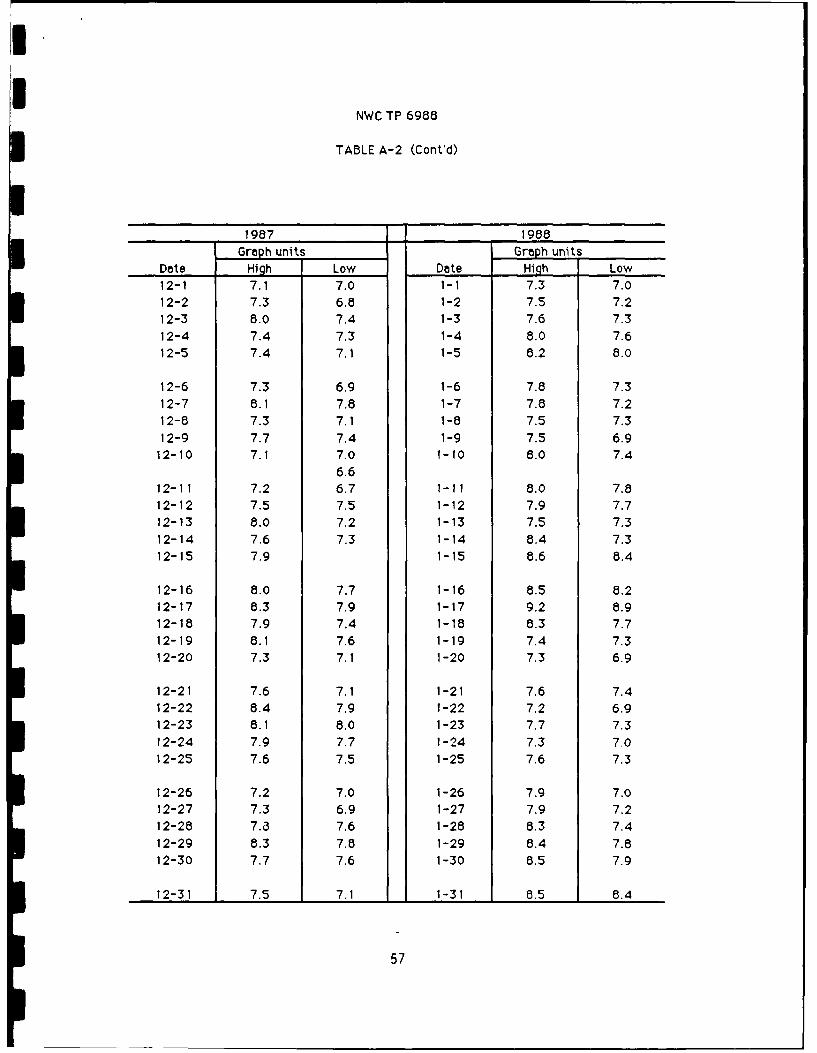
TABLE A-2 (Cont'd)
1987 1988Graph units Graph units
Date High Low Date High Low12-1 7.1 7.0 1-1 7.3 7.012-2 7.3 6.8 1-2 7.5 7.212-3 8.0 7.4 1-3 7.6 7.312-4 7.4 7.3 1-4 8.0 7.612-5 7.4 7.1 1-5 8.2 8.0
12-6 7.3 6.9 1-6 7.8 7.312-7 8.1 7.8 1-7 7.8 7.212-8 7.3 7.1 1-8 7.5 7.312-9 7.7 7.4 1-9 7.5 6.9
12-10 7.1 7.0 1-10 8.0 7.46.6
12-11 7.2 6.7 1-11 8.0 7.812-12 7.5 7.5 1-12 7.9 7.712-13 8.0 7.2 1-13 7.5 7.312-14 7.6 7.3 1-14 8.4 7.312-15 7.9 1-15 8.6 8.4
12-16 8.0 7.7 1-16 8.5 8.212-17 8.3 7.9 1-17 9.2 8.912-18 7.9 7.4 1-18 8.3 7.712-19 8.1 7.6 1-19 7.4 7.312-20 7.3 7.1 1-20 7.3 6.9
12-21 7.6 7.1 1-21 7.6 7.412-22 8.4 7.9 1-22 7.2 6.912-23 8.1 8.0 1-23 7.7 7.312-24 7.9 7.7 1-24 7.3 7.012-25 7.6 7.5 1-25 7.6 7.3
12-26 7.2 7.0 1-26 7.9 7.012-27 7.3 6.9 1-27 7.9 7.212-28 7.a 7.6 1-28 8.3 7.412-29 8.3 7.8 1-29 8.4 7.812-30 7.7 7.6 1-30 8.5 7.9
12-31 7.5 7.1 1-31 8.5 8.4
57
NWC TP 6988
TABLE A-2 (Cont'd)
1988 1988
Graph units Graph unitsDate High Low Date High Low
2-1 8.4 8.3 3-1 9.0 8.82-2 8.3 8.3 3-2 8.5 8.52-3 7.5 7.1 3-3 8.3 7.9
2-4 7.5 7.1 3-4 8.1 7.7
2-5 7.6 7.0 3-5 8.1 7.7
2-6 7.8 7.3 3-6 8.7 8.2
2-7 8.0 7.3 3-7 1.2 7.92-8 7.9 7.3 3-8 8.3 7.72-9 8. 1 7.2 3-9 8.7 8.2
2-10 8.0 7.5 3-10 8.8 8.4
2-11 8.1 7.4 3-11 8.7 8.52-12 8.5 7,7 3-12 8.4 8.12-13 8.4 8,0 3-13 8.4 7.7
2-14 8.4 7.7 3-14 8.7 8.12-15 6.8 8.0 3-15 8.9 8.7
2-16 8.6 8.2 3-16 8.2 8.02-17 8.3 7.8 3-17 8.0 7.62-18 8.6 8.4 3-18 8.3 7.62-19 8.5 8.3 3-19 8.5 7.62-20 8.3 7.6 3-20 8.6 7.8
2-21 8.7 7.9 3-21 8.6 8. 12-22 8.8 6.1 3-22 8.5 8.12-23 9.0 8.8 3-23 8.4 8.1
2-24 8.5 8.5 3-24 8.4 7.72-25 8.3 8.0 3-25 8.4 7.7
2-26 8.2 7.8 3-26 9.0 7.82-27 8.4 7.6 3-27 8.7 8.52-28 8.6 8.2 3-28 8.4 8.1
2-29 8.8 8.2 3-29 9.0 8.23-30 8.8 8.6
3-31 8.6 8.4
58
INWC TP 6988
TABLE A-2 (Cont'd)
1988 1988
Graph units Graph unitsDate Hiqh Low Date Hi gh Low4-1 8.6 8.14-2 8.9 8.14-3 9.0 8.5
4-4 8.7 8.14-5 8.7 7.8
4-6 8.8 6.04-7 8.9 8.44-8 8.4 8.04-9 8.4 7.7
4-10 8.7 7.8
4-11 9.0 8.24-12 9.0 8.4
4-13 9.3 6.7
4-14 9.6 9.24-15 9.0 9.0
4-16 9.1 8.94-17 9.0 8.84-18 9.4 9.0
4-19 9.6 9.34-20 9.8 9.5
I 4-21 9.8 9.5 6-21 9.4 9.4
4-22 9.5 9. 1 6-22 9.4 9.44-23 9.8 9.5 6-23 9.4 9.4
4-24 9.5 9.3 6-24 9.4 9.46-25 9.4 9.4
3 6-26 9.4 9.46-27 9.6 9.26-26 9.4 9.46-29 9.2 9.0
6-30 9. 1 9.0
59
NWC TP 6988
TABLE A-2 (Cont'd)
_____ _____ 1988
Graph unitsDate High Low7-1 9.3 9.07-2 9.2 9.17-3 9.3 9.17-4 9.3 9.17-5 9.3 9.1
7-6 9.2 9.17-7 9.2 9.17-8 9.2 9.07-9 9.1 9.1
7-10 9.2 9.2
7-11 9.3 9.37-12 9.5 9.37-13 9.4 9.27-14 9.4 9.27-15 9.5 9.3
7-16 9.4 9.37-17 9.3 9.17-18 9.4 9.37-19 9.5 9.57-20 9.5 9.4
7-21 9.4 9.37-22 9.4 9.47-23 9.6 9.57-24 9.6 9.57-25 9.5 9.4
7-26 9.7 9.67-27 9.9 9.77-28 9.9 9.77-29 9.9 9.77-30 9.8 9.7
7-31 9.8 9.7
60
I'I
NWC TP 6988
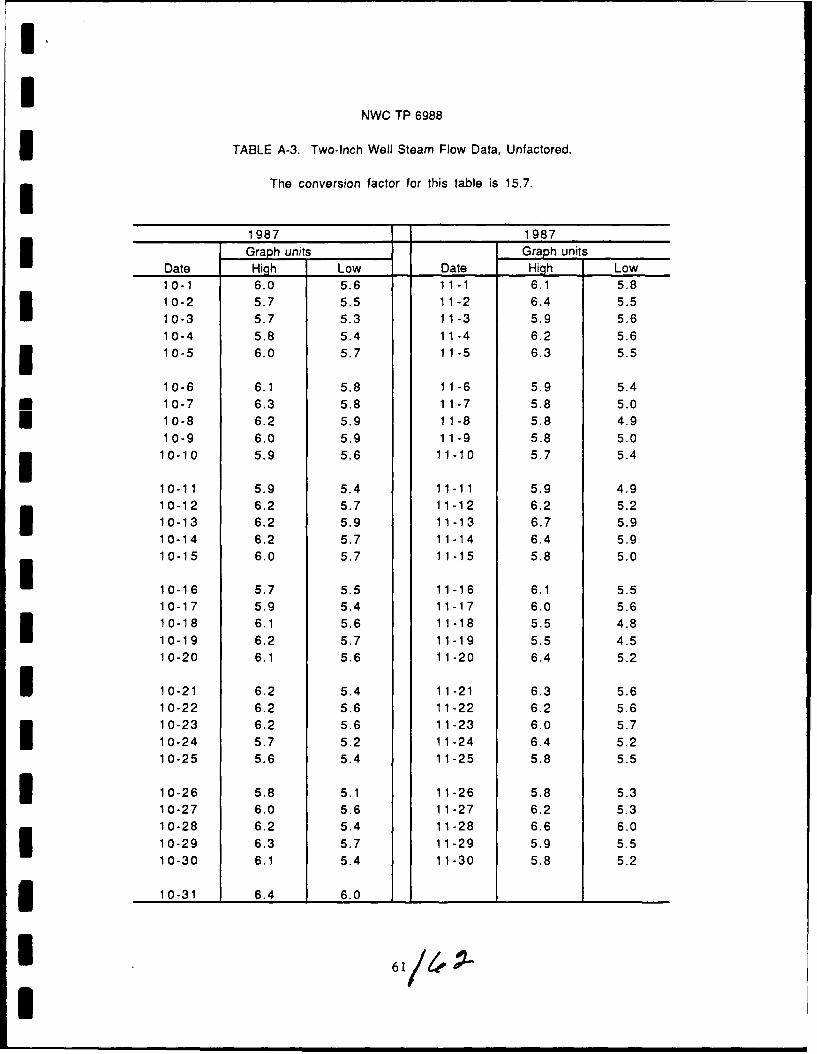
TABLE A-3. Two-Inch Well Steam Flow Data, Unfactored.
The conversion factor for this table is 15.7.
1987 1987Graph unit Graph units
Date High Low Date High Low10-1 6.0 5.6 1 1 -1 6.1 5.810-2 5.7 5.5 11-2 6.4 5.510-3 5.7 5.3 11-3 5.9 5.610-4 5.8 5.4 11-4 6.2 5.610-5 6.0 5.7 1 1-5 6.3 5.5
10-6 6.1 5.8 11-6 5.9 5.4* 10-7 6.3 5.8 1 1-7 5.8 5.0
10-8 6.2 5.9 1 1-8 5.8 4.910-9 6.0 5.9 1 1-9 5.8 5.0
10-10 5.9 5.6 11-10 5.7 5.4
10-11 5.9 5.4 11-11 5.9 4.910-12 6.2 5.7 11-12 6.2 5.210-13 6.2 5.9 11-13 6.7 5.910-14 6.2 5.7 11-14 6.4 5.910-15 6.0 5.7 11-15 5.8 5.0
10-16 5.7 5.5 11-16 6.1 5.510-17 5.9 5.4 11-17 6.0 5.610-18 6.1 5.6 11-18 5.5 4.810-19 6.2 5.7 11-19 5.5 4.510-20 6.1 5,6 11-20 6.4 5.2
I 10-21 6.2 5.4 11-21 6.3 5.610-22 6.2 5.6 11-22 6.2 5.610-23 6.2 5.6 11-23 6.0 5.710-24 5.7 5.2 11-24 6.4 5.210-25 5.6 5.4 11-25 5.8 5.5
3 10-26 5.8 5.1 11-26 5.8 5.310-27 6.0 5.6 11-27 6.2 5.310-28 6.2 5.4 11-28 6.6 6.010-29 6.3 5.7 11-29 5.9 5.510-30 6.1 5.4 11-30 5.8 5.2
10-31 6.4 6.0
I
II
NWC TP 6988
3 TABLE A-3 (Cont'd)
1987 1988Graph units Graph units
Date High Low Date High Low12-1 6.0 5.6 1 -1 5.4 4.712-2 5.8 5.2 1-2 5.6 4.812-3 5.9 5.0 1-3 5.7 5.212-4 6.4 5.7 1-4 5.9 5.512-5 6.0 5.1 1-5 6.4 5.8
12-6 5.8 5.1 1-6 5.8 4.712-7 5.9 5.1 1-7 5.9 5.012-8 6.1 5.1 1-8 5.7 5.112-9 5.5 5.1 1-9 5.5 4.912-10 5.9 5.0 1-10 5.8 5.0
12-11 6.0 5.2 1-1 1 6.6 6.012-12 6.3 5.7 1-12 5.5 4.812-13 6.1 5.7 1-13 5.4 4.512-14 5.6 4.8 1-14 5.8 4.612-15 6.4 5.5 1-15 6.5 6.0
12-16 6.4 6.1 1-16 6.4 5.912-17 6.5 6.1 1-17 7.3 6.312-18 6.1 5.5 1-18 6.1 5.612-19 6.0 5.5 1-19 5.1 4.812-20 5.3 4.7 1 -20 5.3 4.1
I 12-21 5.5 5.2 1-21 5.7 4.812-22 6.6 5.7 1-22 5.1 4.312-23 6.0 5.5 1-23 5.9 4.812-24 5.7 5.6 1-24 5.5 4.612-25 5.7 5.3 1-25 5.6 5.3
12-26 5.5 4.9 1-26 5.7 4.712-27 5.5 4.9 1-27 5.9 4.712-28 5.8 5.3 1-28 6.1 5.112-29 6.2 5.6 1-29 6.5 5.712-30 5.6 5.1 1-30 6.3 5.6
3 12-31 5.2 4.7 1-31 6.4 5.7
I 63
NWC TP 6988
TABLE A-3 (Cont'd)
1988 1988Graph units Graph units
Date High Low Date High Low2-1 6.3 5.6 3-1 6.8 5.62-2 5.9 5.7 3-2 6.5 6.02-3 5.4 4.7 3-3 6.5 5.42-4 5.5 4.8 3-4 6.4 5.32-5 5.5 4.7 3-5 6.4 5.1
2-6 5.8 4.8 3-6 6.6 5.32-7 5.9 4.9 3-7 6.3 5.52-8 5.9 5.1 3-8 6.0 4.82-9 5.9 4.7 3-9 6.5 5.12-10 5.6 4.9 3-10 6.4 5.5
2-11 5.7 4.8 3-11 6.3 5.52-12 6.0 4.9 3-12 6.0 5.22-13 6.3 5.3 3-13 5.9 4.92-14 5.8 5.0 3-14 6.6 5.62-15 6.3 5.1 3-15 7.3 6.2
2-16 6.1 4.9 3-16 6.2 5.32-17 5.8 4.8 3-17 5.7 4.82-18 6.2 5.4 3-18 5.9 4.72-19 5.6 4.9 3-19 6.2 4.92-20 5.7 4.8 3-20 6.5 5.1
2-21 6.0 4.7 3-21 6.8 5.62-22 6.4 5.2 3-22 6.4 5.52-23 6.1 5.1 3-23 6.5 5.42-24 5.8 4.7 3-24 6.1 5.12-25 6.1 4.8 3-25 6.3 5.0
2-26 6.2 5.0 3-26 6.6 5.12-27 5.9 5.1 3-27 7.1 5.82-28 6.0 4.5 3-28 5.9 5.72-29 6.0 5.4 3-29 6.4 5.2
3-30 6.5 5.8
3-31 6.2 5.4
64
II
NWC TP 6988
TABLE A-3 (Cont'd)
1988 1988Graph unit Graph units
Date High Low Date High Low4-1 6.2 5.2 5-1 5.6 5.24-2 6.5 5.3 5-2 6.5 5.84-3 6.8 5.6 5-3 6.5 6.14-4 6.3 5.0 5-4 6.4 6.04-5 5.9 5.0 5-5 6.6 6.0
4-6 6.4 4.7 5-6 6.8 6.24-7 6.7 4.9 5-7 7.0 6.74-8 6.3 5.6 5-8 6.6 6.24-9 6.1 4.9 5-9 6.7 6.24-10 6.0 4.9 5-10 6.8 6.8
4-11 6.5 4.9 5-11 6.1 5.94-12 6.2 5.3 5-12 6.2 5.34-13 6.3 5.6 5-13 6.2 5.44-14 6.7 5.8 5-14 6.5 5.44-15 6.1 4.5 5-15 6.6 6.0
4-16 6.1 4.5 5-16 6.6 6.24-17 6.4 4.6 5-17 5.9 5.74-18 6.3 4.8 5-18 6.5 5.64-19 6.5 5.3 5-19 6.4 5.84-20 6.7 5.5 5-20 6.3 5.6
4-21 6.3 5.5 5-21 6.3 5.84-22 5.9 5.2 5-22 6.4 5.84-23 5.9 4.5 5-23 6.5 5.74-24 6.3 5.8 5-24 6.3 5.54-25 6.1 4.7 5-25 6.3 5.5
4-26 6.3 5.0 5-26 6.4 5.74-27 6.4 5.4 5-27 7.1 6.34-28 6.4 5.7 5-28 6.8 6.74-29 6.2 5.1 5-29 6.5 6.24-30 6.5 5.5 5-30 6.3 6.2
5-31 6.7 5.4
65
NWC TP 6988
TABLE A-3 (Cont'd)
1988 1988
Graph units Graph unitsDate Hijh Low Date High Low6-1 6.2 5.2 7-1 7.6 6.96-2 6.3 5.3 7-2 7.8 6.86-3 6.5 5.3 7-3 7.5 6.96-4 6.6 6.0 7-4 7.4 7.16-5 6.6 6.3 7-5 7.7 7.1
6-6 6.5 5,9 7-6 7,8 7.16-7 6.3 5.4 7-7 7.8 7.16-8 6.4 5.7 7-8 7.8 7.56-9 6.4 5.7 7-9 7.9 7.66-10 6.4 5.6 7-10 7.9 7.7
6-11 6.2 5.6 7-11 7.5 7.46-12 6.4 5.7 7-12 7.7 6.96-13 6.3 5.9 7-13 7.6 7.16-14 6.2 5.4 7-14 7.5 7.16-15 6.2 5.5 7-15 7.6 7.1
6-16 6.5 5.7 7-16 7.7 7.16-17 6.5 5.9 7-17 7.8 7.16-18 6.3 5.5 7-18 7.6 6.46-19 7.1 5.5 7-19 7.5 6.66-20 6.9 6.0 7-20 7.6 6.4
6-21 9.3 8.1 7-21 7.7 6.26-22 9.2 8.1 7-22 7.5 5.96-23 9.7 8.6 7-23 7.6 6.16-24 9.6 8.1 7.24 7.5 6.36-25 9.4 8.2 7-25 7.6 6.4
6-26 9,3 7.5 7-26 7.5 6.56-27 9.0 7.4 7-27 7.7 6.76-28 9.3 8.1 7-28 7.6 6.36-29 7.4 6.9 7-29 7.6 6.66-30 7.6 6.8 7-.30 7.7 6.6
7-31 7.5 6.9
66
I
I,I
NWC TP 6988
I TABLE A-3 (Cont'd)
1988 1988Graph units Graph units
Date High Low Date High Low8-1 7.5 7.2 9-1 6.8 6.18-2 7.6 7.4 9-2 6.5 5.9
8-3 7.7 7.3 9-3 6.5 6.58-4 7.7 7.1 9-4 6.4 5.98-5 7.6 6.9 9-5 6.8 6.1
8-6 7.6 7.2 9-6 7.2 6.98-7 7.6 7.2 9-7 7.2 6.98-8 7.8 7.2 9-8 7.4 7.28-9 7.6 7.2 9-9 7.3 7.18-10 7.6 7.2 9-10 7.1 7.0
8-11 7.5 7.3 9-1 1 7.4 6.88-12 7.6 7.3 9-12 6.6 6.08-13 7.5 7.1 9-13 7.2 7.18-14 7.6 7.2 9-14 7.2 7.08-15 7.6 7.0 9-15 7.5 7.5
8-16 7.7 6.6 9-16 6.9 6.98-17 7.8 7.1 9-17 7.3 7.08-18 7.6 6.8 9-18 7.1 6.9
8-19 7.5 6.6 9-19 6.7 6.08-20 7.4 6.7 9-20 6.8 6.6
8-21 7.4 7.0 9-21 6.6 6.18-22 7.6 7.0 9-22 6.7 6.08-23 7 6 7.3 9-23 7.3 6.88-24 7.6 7.0 9-24 7.2 6.78-25 7.5 7.2 9-25 7.2 7.0
8-26 7.6 7.4 9-26 7.0 7.08-27 7.6 7.3 9-27 7.2 7.18-28 7.6 7.1 9-28 7.0 6.88-29 6.4 6.0 9-29 7.0 6,68-30 6.5 6.2 9-30 6.9 6,9
8-31 6.6 5.9
* 67
I
NWC TP 6988
TABLE A-4. Eight-inch Well Steam Flow Data, Unfactored.
The conversion factor for this table is 20.56
1967 1987
Graph units Graph unitsDate High Low Date High Low10-1 10.0 7.0 1-1 5.3 7.0
10-2 10.0 10.0 11-2 8.0 10.010-3 10.0 11.0 1 I-3 10.0 9.010-4 10.0 7.0 11-4 5.6 9.010-5 10.0 11.0 11-5 8.4 6.0
10-6 9.8 6.0 11-6 8.7 3.010-7 10.0 5.0 11-7 10.0 11.010-8 10.0 5.0 11-8 10.0 7.010-9 9.9 13.0 11-9 10.0 9.0
10-10 10.0 2.0 11-10 10.0 0.0
10-11 10.0 5.0 11-11 10.0 7.010-12 10.0 4.0 11-12 10.0 4.010-13 10.0 9.0 11-13 10.0 7.010-14 10.0 11.0 11-14 9.7 5.010-15 9.9 7.0 11-15 7.5 7.0
10-16 9.8 6.0 11-16 10.0 10.010-17 10.0 6.0 11-17 10.0 11.010-18 10.0 7.0 11-18 10.0 14.010-19 7.6 6.0 11-19 10.0 10.010-20 10.0 10.0 11-20 9.9 7.0
10-21 8.9 6.0 11-21 9.9 4.010-22 6.8 7.0 11-22 10.0 3.010-23 8.1 11.0 11-23 10.0 8.0
10-24 3.6 10.0 11-24 10.0 12.010-25 9.6 9.0 11-25 5.6 11.0
10-26 9.8 70 11-26 9.9 9.010-27 9.2 7.0 11-27 9.9 8.0
10-28 9.0 8.0 11-28 10.0 8.0
10-29 94 6.0 11-29 10.0 7.010-30 9.9 0.0 11-30 8.5 11.0
10-31 8.0 8.0
68
I.I
NWC TP 6988
TABLE A-4 (Cont'd)
1987 1988Graph units Graph units
Date High Low Date Hi gh Low12-1 10.0 9.0 1-1 9.3 9.012-2 10.0 8.0 1-2 8.7 10.0
12-3 9.8 8.0 1-3 10.0 9.012-4 8.4 4.0 1-4 8.8 6.01 12-5 8.4 5.0 1-5 9.8 3.0
12-6 9.7 10.0 1-6 2.8 7.012-7 8.3 7.0 1-7 8.9 6.012-8 8.4 7.0 1-8 9.4 7.012-9 10.0 5.0 1-9 8.7 6.0
12-10 10.0 4.0 1-10 10.0 4.0
12-11 3.7 8.0 1-11 8.0 9.012-12 4.7 10.0 1-12 9.2 6.012-13 9.9 8.0 1-13 10.0 12.012-14 4.2 9.0 1-14 10.0 8.012-15 4.5 5.0 1-15 7.3 9.0
12-16 8.6 7.0 1-16 10.0 3.0
12-17 5.9 9.0 1-17 2.1 9.012-18 8.8 11.0 1-18 10.0 9.012-19 8.5 8.0 1-19 85.8 11.012-20 5.7 7.0 1-20 9.7 8.0
I 12-21 8.9 9.0 1-21 10.0 13.012-22 4.9 8.0 1-22 9.4 14.012-23 2.2 11.0 1-23 10.0 1 1.0
12-24 4.2 9.0 1-24 10.0 5.012-25 8.3 9.0 1-25 10.0 10.0
12-26 8.9 7.0 1-26 10.0 10.012-27 4.9 7.0 1-27 10.0 8.012-28 8.8 8.0 1-28 10.0 9.012-29 9.7 6.0 1-29 9.2 7.012-30 2.9 9.0 1-30 10.0 12.0
3 12-31 8.9 9.0 1-31 9.0 10
1 69I
NWC TP 6988
TABLE A-4 (Cont'd)
1988 1988Graph units Graph units
Date High Low Date High Low2-1 9.9 14.0 3-1 3.8 5.02-2 4.4 10.0 3-2 7.4 8.02-3 9.6 8.0 3-3 7.5 9.02-4 9.2 7.0 3-4 7.8 9.02-5 8.9 9.0 3-5 7.4 10.0
2-6 10.0 6.0 3-6 7.3 11.02-7 10.0 9.0 3-7 10.0 7.02-8 3.6 8.0 3-8 4.5 5.02-9 101.0 11.0 3-9 9.2 9.02-10 6.1 8.0 3-10 6.7 8.0
2-11 6.4 7.0 3-11 7.2 8.02-12 3.5 4.0 3-12 8.5 9.02-13 7.0 17.0 3-13 9.4 12.02-14 3.5 9.0 3-14 10.0 10.02-15 8.0 8.0 3-15 6.8 8.0
2-16 3.5 8.0 3-16 6.9 10.02-17 8.0 8.0 3-17 8.5 6.02-16 3.1 8.0 3-18 9.4 9.02-19 7.7 8.0 3-19 10.0 12.02-20 7.7 11.0 3-20 10.0 12.0
2-21 9.4 13.0 3-21 9.7 17.02-22 6.1 7.0 3-22 9.8 20.02-23 8.9 10.0 3-23 9.9 16.02-24 7.8 7.0 3-24 9.7 13.02-25 8.0 8.0 3-25 9.9 18.0
2-26 9.0 5.0 3-26 9.8 14.02-27 1.6 6.0 3-27 9.9 13.02-28 6.2 13.0 3-28 4.9 9.02-29 5.0 4.0 3-29 1.7 7.0
3-30 3.8 12.0
3-31 6.2 9
70
I'I
NWC TP 6988
3 TABLE A-4 (Cont'd)
1968 1988
Graph units Graph units
Date High Low Date High Low4-1 8.7 6.0 5-1 5.7 9.04-2 9.4 6.0 5-2 10.0 9.04-3 9.3 10.0 5-3 10.0 13.04-4 8.7 8.0 5-4 10.0 8.03 4-5 8.7 9.0 5-5 7.3 8.0
4-6 10.0 6.0 5-6 10.0 10.04-7 10.0 6.0 5-7 9.9 11.04-8 9.7 10.0 5-8 10.0 9.04-9 10.0 8.0 5-9 10.0 11.04-10 10.0 8.0 5-10 10.0 8.0
4-11 9.2 7.0 5-11 10.0 3.04-12 8.1 7.0 5-12 10.0 8.04-13 4.5 7.0 5-13 10.0 8.04-14 5.1 7.0 5-14 10.0 5.04-15 9.9 9.0 5-15 10.0 8.0
4-16 9.9 9.0 5-16 5.8 8.04-17 9.4 8.0 5-17 11.0 11.04-18 9.9 6.0 5-18 10.0 10.0
4-19 7.3 9.0 5-19 9.0 9.04-20 7.3 7.0 5-20 6.0 6.0
1 4-21 9.8 9.0 5-21 3.5 7.04-22 9.8 11.0 5-22 3.7 7.04-23 9.1 14.0 5-23 10.0 11.0
4-24 10.0 12.0 5-24 5.5 1.04-25 9.9 7.0 5-25 9.1 10.0
5 4-26 10.0 3.0 5-26 10.0 9.04-27 10.0 10.0 5-27 10.0 9.04-28 10.0 10.0 5-28 10.0 10.04-29 10.0 12.0 5-29 10.0 8.04-30 9.7 11.0 5-30 10.0 5.0
5 5-31 5.5 4
I71
NWC TP 6988
TABLE A-4 (Cont'd)
1988 1988Graph units Graph units
Date High Low Date High Low
6-1 9.1 3.0 7-1 10.0 9.06-2 10.0 7.0 7-2 10.0 12.06-3 10.0 3.0 7-3 10.0 10.06-4 10.0 9.0 7-4 10.0 13.06-5 10.0 10.0 7-5 6.7 3.0
6-6 10.0 10.0 7-6 9.9 13.06-7 10.0 9.0 7-7 10.0 14.06-8 10.0 14.0 7-8 9.9 12.06-9 10.0 1.0 7-9 10.0 4.06-10 9.9 3.0 7-10 9.9 13.0
6-11 10.0 13.0 7-11 10.0 21.06-12 10.0 10.0 7-12 10.0 11.06-13 10.0 4.0 7-13 10.0 10.06-14 4.9 9.0 7-14 10.0 8.06-15 8.9 13.0 7-15 10.0 8.0
6-16 9.2 0.0 7-16 9.9 24.06-17 10.0 5.0 7-17 10.0 39.06-18 10.0 6.0 7-18 10.0 50.06-19 10.0 9.0 7-19 8.7 1 1.06-20 10.0 11.0 7-20 10.0 11.0
6-21 10.0 15.0 7-21 9.9 3.06-22 9.9 14.0 7-22 10.0 8.06-23 10.0 7.0 7-23 10.0 50.06-24 9.9 5.0 7-24 10.0 40.06-25 10.0 10.0 7-25 5.9 12.0
6-26 10.0 12.0 7-26 9.7 14.06-27 10.0 5.0 7-27 10.0 10.06-28 10.0 9.0 7-28 10.0 9.06-29 6.7 10.0 7-29 10.0 9.06-30 9.2 5.0 7-30 10.0 2 1.0
7-31 9.9 29
72
NWC TP 6988
TABLE A-4 (Cont'd)
1988 1988Graph units Graph units
Date High Low Date High Low8-1 5.3 13.0 9-1 10.0 5.08-2 10.0 11.0 9-2 9.9 21.08-3 10.0 9.0 9-3 10.0 8.08-4 10.0 6.0 9-4 10.0 6.08-5 10.0 45.0 9-5 10.0 6.0
8-6 10.0 11.0 9-6 4.7 12.08-7 10.0 32.0 9-7 10.0 7.08-8 10.0 53.0 9-8 9.9 4.08--9 5.9 11.0 9-9 10.0 7.0
8-10 9.1 12.0 9-10 10.0 5.0
8-11 10.0 11.0 9-11 8.7 7.08-12 9.9 10,0 9-12 4.6 12.0e-13 10.0 6.0 9-13 8.5 13.08-14 10.0 30.0 9-14 10.0 13.0,-15 6.4 9.0 9-15 10.0 11.0
1-16 7.5 11.0 9-16 10.0 11.0C-17 10.0 9.0 9-17 8.6 5.0
6-18 10.0 4.0 9-18 7.8 6.0
e-19 10.0 6.0 9-19 4.3 12.0-20 9.9 40.0 9-20 5.6 10.0
'-21 9.9 50.0 9-21 6.5 11.0c-22 10.0 52.0 9-22 8.0 8.0t-23 8.7 18.0 9-23 9.9 7.0C-24 10.0 16.0 9-24 10.0 7.0t-25 10.0 37.0 9-25 8.9 11.0
8-26 10.0 67.0 9-26 6.5 12.08-27 10.0 64.0 9-27 9.2 10.08-28 9.9 71.0 9-28 8.7 9.08-29 5.7 12.0 9-29 8.2 9.08-30 9.1 11.0 9-30 9.9 7.0
8-31 10.0 12.0
73
NWC TP 6988
TABLE A-5. Schober's I Resort Steam Flow Date, Unfactored.
The conversion factor for this table is 0.5265.
1987 1987Graph units Graph units
Date High Low Date High Low10-1 5.5 5.0 1 1-1 6.0 5.810-2 5.4 4.7 11-2 6.3 5.910-3 5.4 4.6 11-3 5.8 5.510-4 5.8 4.9 1 1-4 6.4 5.610-5 5.8 5.4 11-5 6.2 5.9
10-6 5.8 5.2 11-6 5.9 5.510-7 6.0 5.2 11-7 6.0 5.610-8 5.8 5.3 11-8 6.1 5.610-9 5.6 5.1 11-9 6.2 5.7
10-10 5.5 5.0 11-10 5.7 5.3
10-11 5.6 5.0 11-11 6.0 5.410-12 6.0 5.5 11-12 6.4 5.910-13 5.9 5.5 11-13 7.2 6.310-14 6.0 5.2 11-14 6.5 6.110-15 5.6 5.2 11-15 6.2 5.4
10-16 5.6 5.1 11-16 6.4 5.910-17 5.7 5.2 11-17 6.2 5.710-18 6.1 5.4 11-18 5.8 5.210-19 6.0 5.6 11-19 6.1 5.310-20 5.8 5.4 11-20 7.0 6.3
10-21 6.0 5.5 11-21 6.5 6.010-22 6.0 5.6 11-22 6.7 6.210-23 5.7 5.4 11-23 6.3 6.010-24 5.3 5.1 11-24 6.9 5,710-25 5.6 4.9 11-25 6.1 5.6
10-26 5.7 5.3 11-26 6.2 5.510-27 6.0 5.7 11-27 7.0 5.910-28 6.2 5.7 11-28 6.9 6.610-29 6.3 59 11-29 6.3 5.910-30 6.2 5.7 11-30 6.4 59
10-31 6.3 5.9
74
NWC TP 6968
TABLE A-5 (Cont'd)
1987 1988Graph units Graph units
Date High Low Date High Low12-1 6.3 5.8 1-1 6.7 6.212-2 6.0 5.9 1-2 7.0 6.5
12-3 6.4 6.4 1-3 7.1 6.712-4 7.1 6.4 1-4 7.2 6.912-5 6.4 6.0 1-5 7.4 6.9
12-6 6.5 5.9 1-6 6.8 6.312-7 6.4 5.8 1-7 7.1 6.512-8 6.9 6.2 1-8 6.8 6.5
12-9 6.2 5.9 1-9 6.8 6.412-10 6.6 6.1 1-10 7.2 6.6
12-11 6.7 6.2 1-11 8.0 7.612-12 7.1 6.4 1-12 6.8 6.412-13 6.8 6.3 1-13 6.8 6.512-14 6.3 6.0 1-14 7.3 6.612-15 6.9 6.3 1-15 8.1 7.4
12-16 7.3 6.7 1-16 7.8 7.512-17 6.9 6.8 1-17 8.7 8.012-18 7.0 6.2 1-18 7.0 6.912-19 6.6 6.3 1-19 6.6 6.312-20 6.1 5.6 1-20 6.7 6.2
12-21 6.3 6.0 1-21 7.0 6.812-22 7.5 7.1 1-22 7.0 6.212-23 6.7 6.4 1-23 6.7 7.012-24 6.6 6.4 1-24 7.1 6.8
12-25 6.6 6.2 1-25 7.3 7.1
12-26 6.4 6.0 1-26 7,6 7.112-27 6.7 6.2 1-27 7,7 7.212-28 7.1 6.7 1-28 7.9 7.3
12-29 7.4 7.1 1-29 8.2 7.912-30 6.5 6.2 1-30 7.9 7.4
12-31 6.6 6,2 1-31 8.0 7.6
75
NWC TP 6988
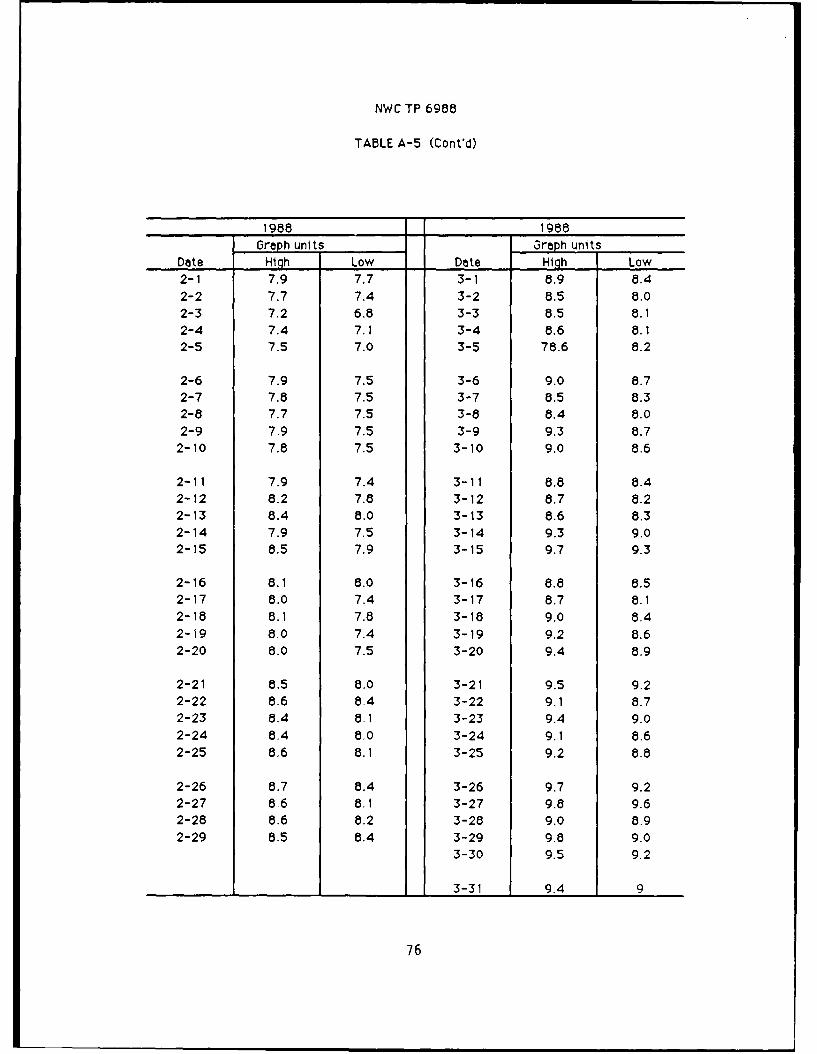
TABLE A-5 (Cont'd)
1988 1988Graph units Graph units
Date High Low Date High Low2-1 7.9 7.7 3-1 8.9 8.42-2 7.7 7.4 3-2 8.5 8.02-3 7.2 6.8 3-3 8.5 8.12-4 7.4 7.1 3-4 8.6 8.12-5 7.5 7.0 3-5 78.6 8.2
2-6 7.9 7.5 3-6 9.0 8.72-7 7.8 7.5 3-7 8.5 8.32-8 7.7 7.5 3-8 8.4 8.0
2-9 7.9 7.5 3-9 9.3 8.72-10 7.8 7.5 3-10 9.0 8.6
2-11 7.9 7.4 3-11 8.8 8.42-12 8.2 7.8 3-12 8.7 8.22-13 8.4 8.0 3-13 8.6 8.32-14 7.9 7.5 3-14 9.3 9.02-15 8.5 7.9 3-15 9.7 9.3
2-16 8.1 8.0 3-16 8.8 8.52-17 8.0 7.4 3-17 8.7 8.12-18 8.1 7.8 3-18 9.0 8.42-19 8.0 7.4 3-19 9.2 8.62-20 8.0 7.5 3-20 9.4 8.9
2-21 8.5 8.0 3-21 9.5 9.22-22 8.6 8.4 3-22 9.1 8.72-23 8.4 8. 1 3-23 9.4 9.02-24 8.4 8.0 3-24 9.1 8.6
2-25 8.6 8.1 3-25 9.2 8.8
2-26 8.7 8.4 3-26 9.7 9.22-27 8.6 8.1 3-27 9.8 9.62-28 8.6 8.2 3-28 9.0 8.92-29 8.5 8.4 3-29 9.8 9.0
3-30 9.5 9.2
3-31 9.4 9
76
NWC TP 6988
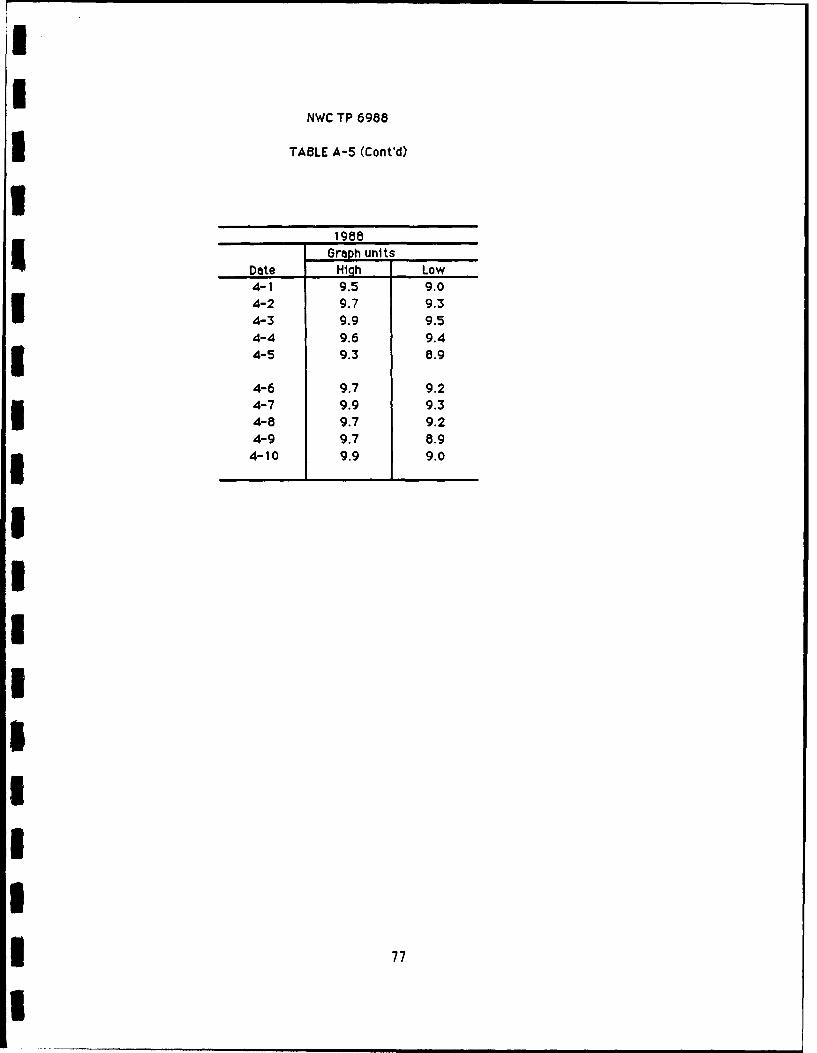
TABLE A-5 (Cont'd)
1988Graph units
Date Hiqh Low4-1 9.5 9.04-2 9.7 9.34-3 9.9 9.54-4 9.6 9.44-5 9.3 8.9
4-6 9.7 9.24-7 9.9 9.34-8 9.7 9.24-9 9.7 8.9
4-10 9.9 9.0
7I
I
1 77
NWC TP 6988
Appendix B
DAILY TEMPERATURE DATA
78
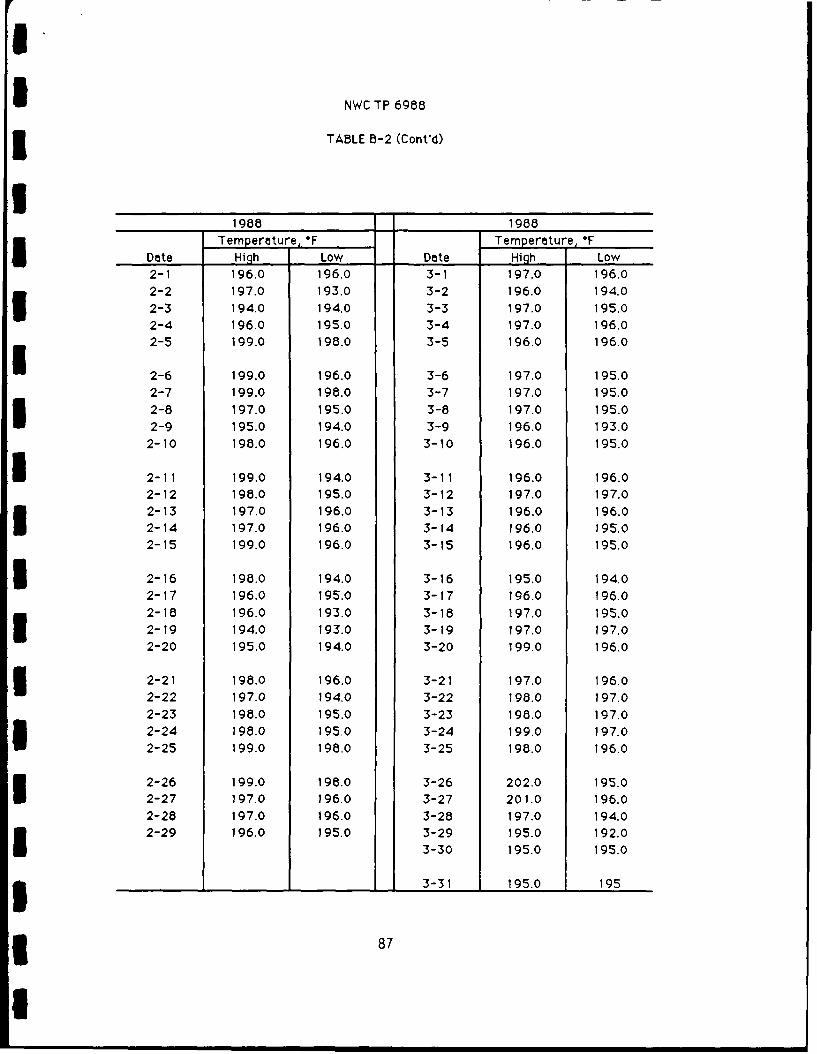
NWC TP 6988
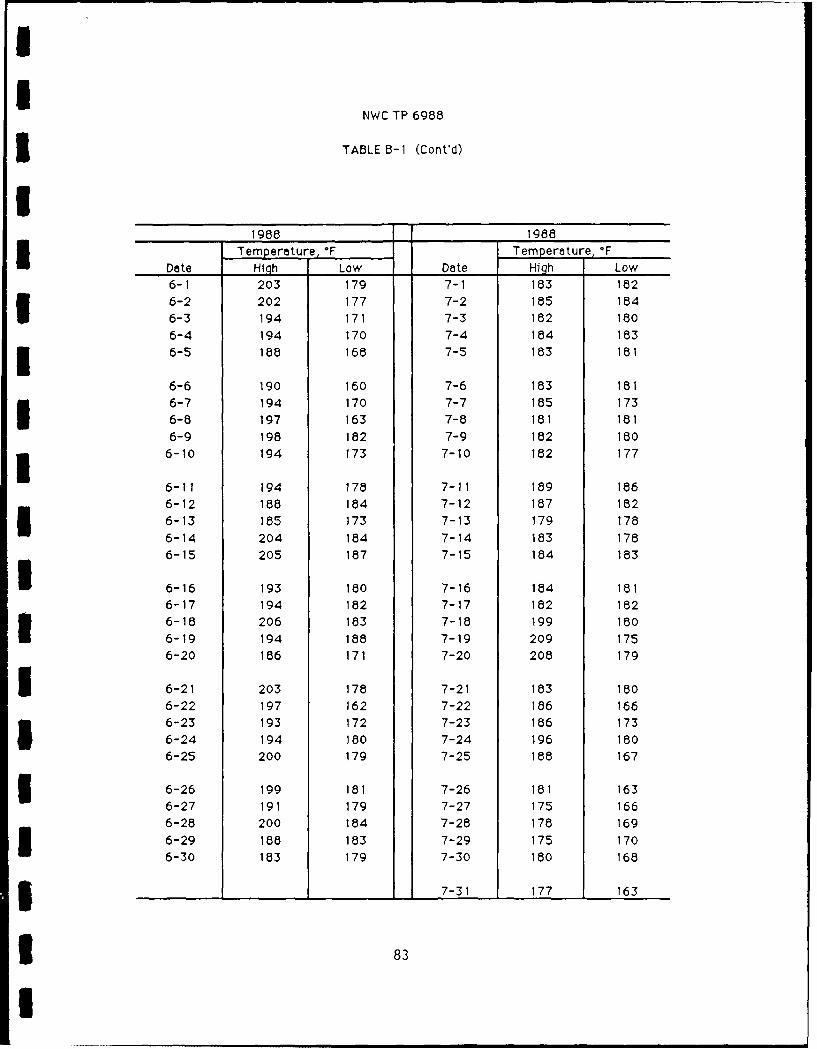
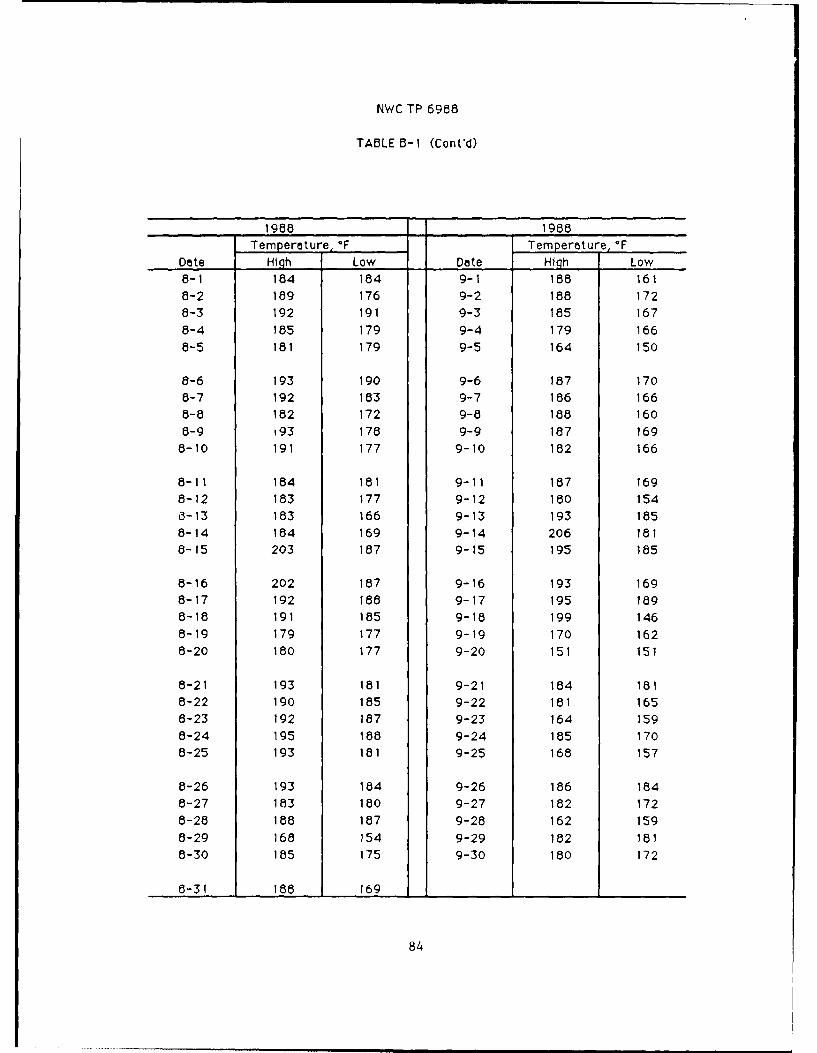
TABLE B-1. Two-Inch Steam Well Temperature, OF.
1987 1987
Temperature, Temperatu*eF°FDate High Low Date High Low10-1 193 182 11-1 188 17510-2 201 181 11-2 183 173
10-3 212 192 11-3 187 16310-4 208 193 11-4 187 15910-5 193 182 11-5 185 168
10-6 194 178 11-6 186 17610-7 194 177 11-7 200 18110-8 192 165 11-8 204 18210-9 187 173 11-9 202 18010-10 199 183 11-10 205 186
10-11 203 186 11-11 203 17510-12 188 170 11-12 192 17010-13 187 158 11-13 190 16810-14 187 170 11-14 180 16510-15 190 172 11-15 200 174
10-16 203 181 11-16 191 17610-17 201 185 11-17 202 17610-18 191 173 11-18 202 17610-19 190 170 11-19 203 18810-20 196 178 11-20 192 174
10-21 193 174 11-21 184 16410-22 188 172 11-22 189 16810-23 189 172 11-23 186 17510-24 196 172 11-24 195 17710-25 203 182 11-25 168 151
10-26 204 175 11-26 186 16510-27 189 186 11-27 188 17610-28 182 174 11-28 190 17610-29 187 169 11-29 179 16910-30 188 173 11-30 195 174
10-31 186 164
79
NWC TP 6988
TABLE B-I (Cont'd)
1987 1988Temperature,°F Temperature, F
Date High Low Date High Low12-1 186 172 1-1 197 173
12-2 194 180 1-2 202 178
12-3 200 177 1-3 184 169
12-4 190 171 1-4 188 167
12-5 190 166 1-5 189 179
12-6 186 177 1-6 199 173
12-7 194 156 1-7 193 179
12-8 188 168 1-8 190 171
12-9 198 176 1-9 206 182
12-10 199 174 1-10 199 177
12-11 187 168 1-11 175 164
12-12 187 156 1-12 197 174
12-13 163 153 1-13 201 192
12-14 197 171 1-14 203 177
12-15 187 175 1-15 184 162
12-16 181 169 1-16 186 175
12-17 185 153 1-17 184 163
12-18 185 158 1-18 183 144
12-19 182 156 1-19 199 178
12-20 201 195 1-20 202 191
12-21 203 177 1-21 195 170
12-22 188 161 1-22 202 185
12-23 176 151 1-23 201 171
12-24 164 146 1-24 198 187
12-25 169 157 1-25 202 181
12-26 201 178 1-26 205 185
12-27 194 182 1-27 199 172
12-28 182 173 1-28 190 17512-29 185 167 1-29 187 168
12-30 197 182 1-30 185 165
12-31 200 185 1-31 185 174
80
II
NWC TP 6968
3 TABLE 1- 1 (Cont'd)
1988 1988
Temperature, F Temperature, °F
Date Hiqh Low Date High Low2-1 184 170 3-1 186 152
2-2 181 161 3-2 171 157
2-3 200 175 3-3 196 170
2-4 194 162 3-4 198 168
2-5 204 183 3-5 201 184
2-6 205 171 3-6 186 172
2-7 198 177 3-7 190 168
2-8 196 174 3-8 199 173
2-9 195 174 3-9 175 164
2-10 191 164 3-10 183 153
2-11 196 173 3-11 183 151
2-12 202 177 3-12 189 164
2-13 193 168 3-13 200 177
2-14 202 177 3-14 180 178
2-15 182 158 3-15 188 169
2-16 185 150 3-16 188 150
2-17 199 166 3-17 195 184
2-18 164 157 3-18 199 166
2-19 19J 154 3-19 203 1822-20 204 168 3-20 200 176
1 2-21 198 185 3-21 181 1712-22 187 168 3-22 16¢ 179
2-23 186 171 3-23 187 1802-24 204 173 3-24 200 1732-25 203 172 3-25 194 179
3 2-26 191 168 3-26 197 186
2-27 191 171 3-27 186 170
2-28 189 172 3-28 201 182
2-29 187 165 3-29 196 184
3-30 180 157
5 3-31 177 150
*81
NWC TP 6988
TABLE B-1 (Cont'd)
1988 1988
Temperatu e, Temperature, F
Date High Low Dete High Low
4-1 197 161 5-1 196 171
4-2 191 177 5-2 202 194
4-3 188 176 5-3 193 179
4-4 193 180 5-4 187 176
4-5 206 192 5-5 180 162
4-6 204 185 5-6 190 180
4-7 188 179 5-7 193 170
4-8 189 167 5-8 198 178
4-9 202 185 5-9 204 190
4-10 201 183 5-10 203 197
4-11 185 179 5-11 204 1904-12 192 179 5-12 203 179
4-13 181 180 5-13 186 175
4-14 182 162 5-14 191 177
4-15 185 160 5-15 188 176
4-16 185 166 5-16 183 176
4-17 188 177 5-17 189 1694-18 197 180 5-18 166 1664-19 193 166 5-19 183 164
4-20 185 165 5-20 203 177
4-21 187 165 5-21 199 185
4-22 183 165 5-22 203 185
4-23 188 174 5-23 187 163
4-24 194 190 5-24 192 180
4-25 189 182 5-25 196 179
4-26 196 179 5-26 192 179
4-27 192 179 5-27 187 170
4-28 187 169 5-28 192 177
4-29 198 174 5-29 183 163
4-30 186 156 5-30 185 162
5-31 199 185
82
II
NWC TP 6988
3 TABLE B-i (Cont'd)
1988 1988Temperature, OF Temperature, F
Date High Low Date High Low6-1 203 179 7-1 183 182
6-2 202 177 7-2 185 184
6-3 194 171 7-3 182 180
6-4 194 170 7-4 184 1833 6-5 188 168 7-5 183 181
6-6 190 160 7-6 183 181
6-7 194 170 7-7 185 173
6-8 197 163 7-8 181 181
6-9 198 182 7-9 182 180
6-10 194 173 7-10 182 177
6-11 194 178 7-11 189 186
6-12 188 184 7-12 187 182
6-13 185 173 7-13 179 178
6-14 204 184 7-14 183 178
6-15 205 187 7-15 184 183
6-16 193 180 7-16 184 181
6-17 194 182 7-17 182 182
6-18 206 183 7-18 199 180
6-19 194 188 7-19 209 1756-20 186 171 7-20 208 179
1 6-21 203 178 7-21 183 180
6-22 197 162 7-22 186 166
6-23 193 172 7-23 186 173
6-24 194 180 7-24 196 1806-25 200 179 7-25 188 167
1 6-26 199 181 7-26 181 163
6-27 191 179 7-27 175 166
6-28 200 184 7-28 178 169
6-29 188 183 7-29 175 170
6-30 183 179 7-30 180 168
1 7-31 177 163
383
NWC TP 69a8
TABLE B-I (Contd)
1988 1988
Temperature, F Temperature, F
Date High Low Date High Low8-I 184 184 9-1 188 161
8-2 189 176 9-2 188 1728-3 192 191 9-3 185 167
8-4 185 179 9-4 179 166
8-5 181 179 9-5 164 150
8-6 193 190 9-6 187 170
8-7 192 183 9-7 186 166
8-8 182 172 9-8 188 160
8-9 193 178 9-9 187 169
8-10 191 177 9-10 182 166
8-11 184 181 9-11 187 169
8-12 183 177 9-12 180 154
3-13 183 166 9-13 193 185
8-14 184 169 9-14 206 181
8-15 203 187 9-15 195 185
8-16 202 187 9-16 193 169
8-17 192 188 9-17 195 1898-18 191 185 9-18 199 146
8-19 179 177 9-19 170 162
8-20 180 177 9-20 151 151
8-21 193 181 9-21 184 181
8-22 190 185 9-22 181 165
8-23 192 187 9-23 164 159
8-24 195 188 9-24 185 170
8-25 193 181 9-25 168 157
8-26 193 184 9-26 186 184
8-27 183 180 9-27 182 172
8-28 188 187 9-28 162 159
8-29 168 154 9-29 182 181
8-30 185 175 9-30 180 172
8-31 188 169
84
NWC TP 6988
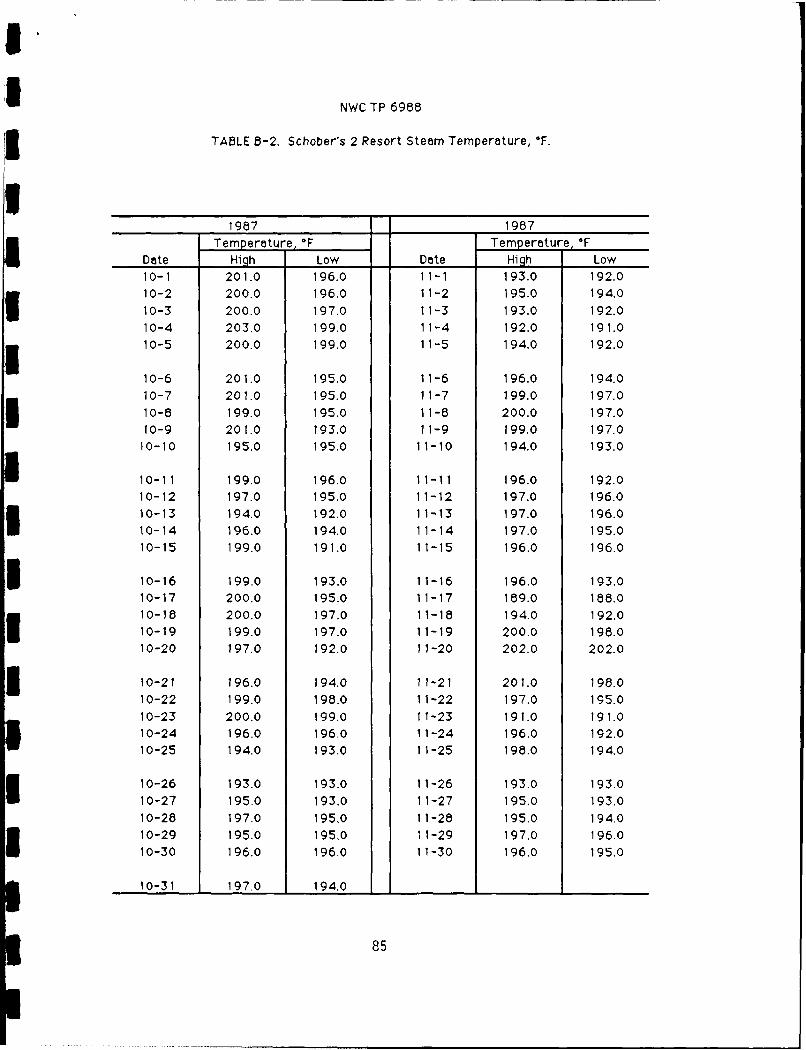
3 TABLE 8-2. Schober's 2 Resort Steam Temperature, OF.
1987 1987Temperature, OF Temperature, OF
Date High Low Date High Low10-1 201.0 196.0 11-1 193.0 192.010-2 200.0 196.0 11-2 195.0 194.0
10-3 200.0 197.0 11-3 193.0 192.010-4 203.0 199.0 11-4 192.0 191.010-5 200.0 199.0 11-5 194.0 192.0
10-6 201.0 195.0 11-6 196.0 194.0
10-7 201.0 195.0 11-7 199.0 197.010-8 199.0 195.0 11-8 200.0 197.010-9 201.0 193.0 11-9 199.0 197.0
10-10 195.0 195.0 11-10 194.0 193.0
10-11 199.0 196.0 11-11 196.0 192.010-12 197.0 195.0 11-12 197.0 196.010-13 194.0 192.0 11-13 197.0 196.010-14 196.0 194.0 11-14 197.0 195.010-15 199.0 191.0 11-15 196.0 196.0
10-16 199.0 193.0 11-16 196.0 193.010-17 200.0 195.0 11-17 189.0 188.010-18 200.0 197,0 11-18 194.0 192.0
10-19 199.0 197.0 11-19 200.0 198.010-20 197.0 192.0 11-20 202.0 202.0
10-21 196.0 194.0 11-21 201.0 198.010-22 199.0 198.0 11-22 197.0 195.010-23 200.0 199.0 11-23 191.0 191.010-24 196.0 196.0 11-24 196.0 192.010-25 194.0 193.0 11-25 198.0 194.0
10-26 193.0 193.0 11-26 193.0 193.010-27 195.0 193.0 11-27 195.0 193.010-28 197.0 195.0 11-28 195.0 194.010-29 195.0 195.0 11-29 197.0 196.0
10-30 196.0 196.0 11-30 196.0 195.0
10-31 197.0 194.0
85
NWC TP 6988
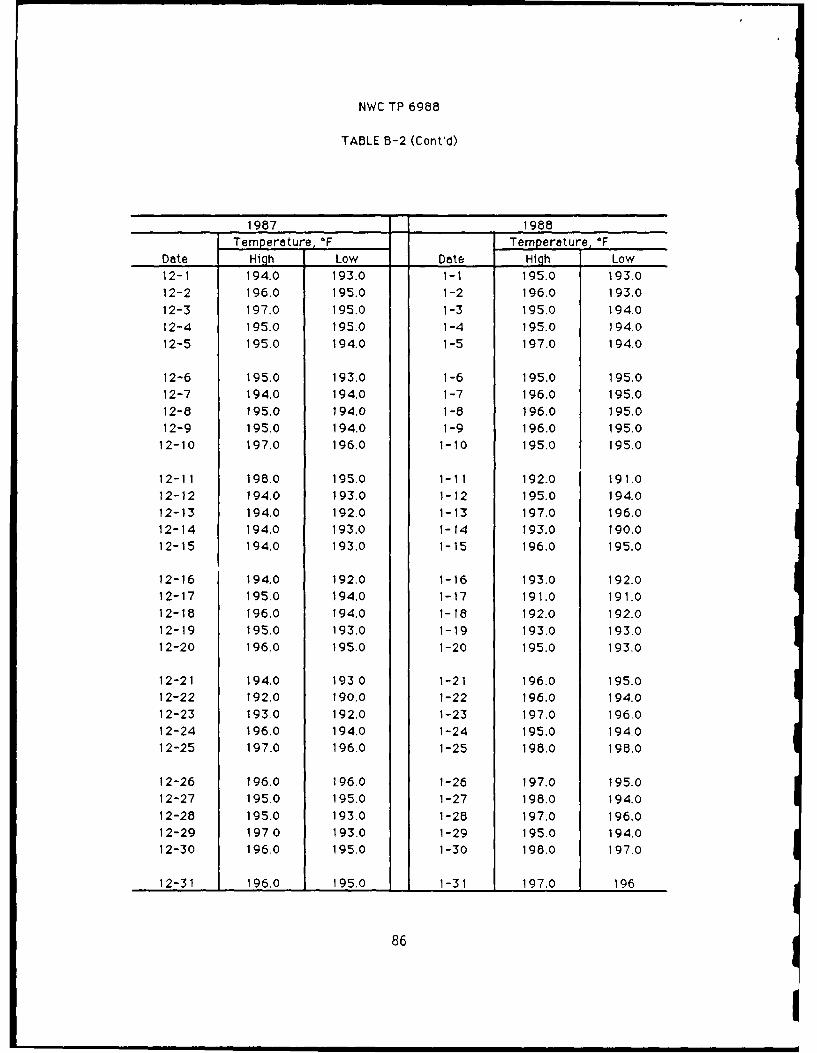
TABLE B-2 (Cont'd)
1987 1988
Temperature, °F Temperature, °F
Date Hiqh Low Date High Low12-1 194.0 193.0 1-1 195.0 193.012-2 196.0 195.0 1-2 196.0 193.012-3 197.0 195.0 1-3 195.0 194.012-4 195.0 195.0 1-4 195.0 194.012-5 195.0 194.0 1-5 197.0 194.0
12-6 195.0 193.0 1-6 195.0 195.012-7 194.0 194.0 1-7 196.0 195.012-8 195.0 194.0 1-8 196.0 195.012-9 195.0 194.0 1-9 196.0 195.0
12-10 197.0 196.0 1-10 195.0 195.0
12-11 198.0 195.0 1-11 192.0 191.012-12 194.0 193.0 1-12 195.0 194.012-13 194.0 192.0 1-13 197.0 196.012-14 194.0 193.0 1-14 193.0 190.012-15 194.0 193.0 1-15 196.0 195.0
12-16 194.0 192.0 1-16 193.0 192.012-17 195.0 194.0 1-17 191.0 191.012-18 196.0 194.0 1-18 192.0 192.012-19 195.0 193.0 1-19 193.0 193.012-20 196.0 195.0 1-20 195.0 193.0
12-21 194.0 1930 1-21 196.0 195.012-22 192.0 190.0 1-22 196.0 194.012-23 193.0 192.0 1-23 197.0 196.012-24 196.0 194.0 1-24 195.0 194.012-25 197.0 196.0 1-25 198.0 198.0
12-26 196.0 196.0 1-26 197.0 195.012-27 195.0 195.0 1-27 198.0 194.012-28 195.0 193.0 1-28 197.0 196,012-29 197.0 193.0 1-29 195.0 194.012-30 196.0 195.0 1-30 198.0 197.0
12-31 196.0 195.0 1-31 197.0 196
86
NWC TP 6988
TABLE B-2 (Cont'd)
1988 1988
Temperature, OF Temperature, OFDate High Low Date High Low2-1 196.0 196.0 3-1 197.0 196.02-2 197.0 193.0 3-2 196.0 194.02-3 194.0 194.0 3-3 197.0 195.02-4 196.0 195.0 3-4 197.0 196.02-5 199.0 198.0 3-5 196.0 196.0
2-6 199.0 196.0 3-6 197.0 195.02-7 199.0 198.0 3-7 197.0 195.02-8 197.0 195.0 3-8 197.0 195.02-9 195.0 194.0 3-9 196.0 193.0
2-10 198.0 196.0 3-10 196.0 195.0
1 2-11 199.0 194.0 3-11 196.0 196.02-12 198.0 195.0 3-12 197.0 197.02-13 197.0 196.0 3-13 196.0 196.02-14 197.0 196.0 3-14 196.0 195.02-15 199.0 196.0 3-15 196.0 195.0
3 2-16 198.0 194.0 3-16 195.0 194.02-17 196.0 195.0 3-17 196.0 196.02-18 196.0 193.0 3-18 197.0 195.02-19 194.0 193.0 3-19 197.0 197.02-20 195.0 194.0 3-20 199.0 196.0
5 2-21 198.0 196.0 3-21 197.0 196.02-22 197.0 194.0 3-22 198.0 197.02-23 198.0 195.0 3-23 198.0 197.02-24 198.0 195.0 3-24 199.0 197.02-25 199.0 198.0 3-25 198.0 196.02-26 199.0 198.0 3-26 202.0 195.0
2-27 197.0 196.0 3-27 201.0 196.02-28 197.0 196.0 3-28 197.0 194.02-29 196.0 195.0 3-29 195.0 192.0
3-30 195.0 195.0
1 3-31 195.0 195
£87
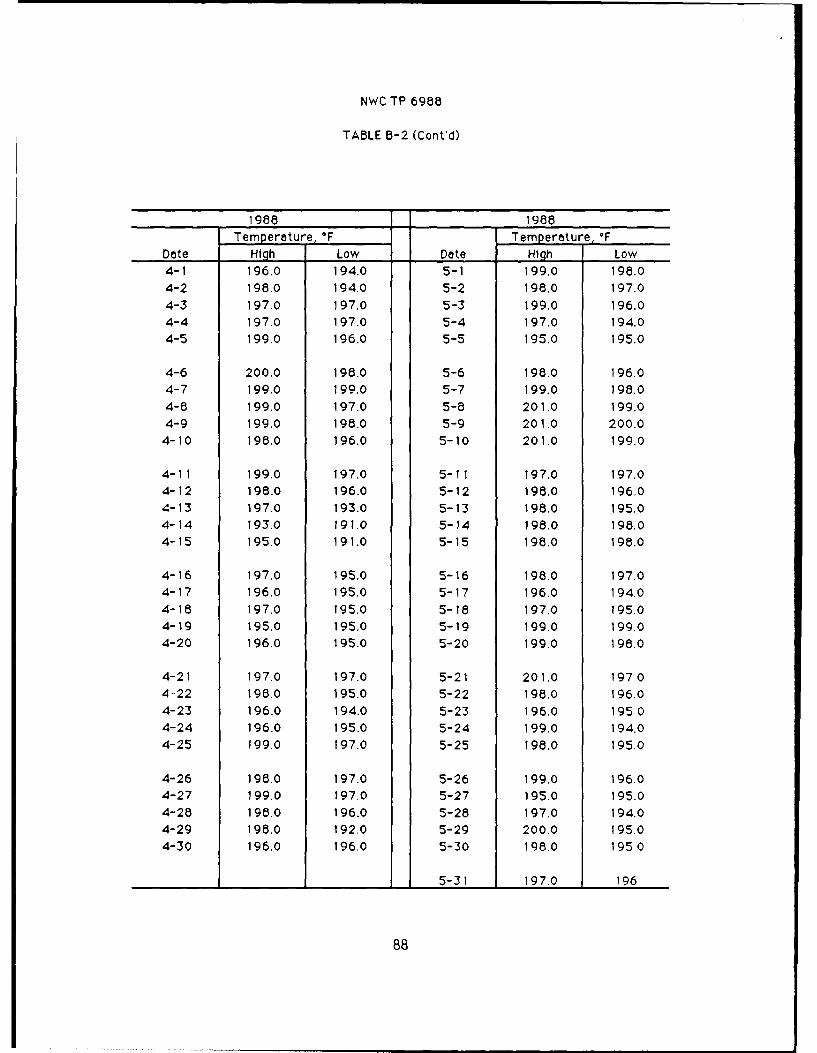
NWC TP 6988
TABLE B-2 (Cont'd)
1988 1988
Temperature, OF Temperature, OFDate High Low Date High Low4-1 196.0 194.0 5-1 199.0 196.04-2 198.0 194.0 5-2 198.0 197.04-3 197.0 197.0 5-3 199.0 196.04-4 197.0 197.0 5-4 197.0 194.04-5 199.0 196.0 5-5 195.0 195.0
4-6 200.0 198.0 5-6 198.0 196.04-7 199.0 199.0 5-7 199.0 198.04-8 199.0 197.0 5-8 201.0 199.0
4-9 199.0 198.0 5-9 201.0 200.04-10 198.0 196.0 5-10 201.0 199.0
4-11 199.0 197.0 5-11 197.0 197.04-12 198.0 196.0 5-12 198.0 196.04-13 197.0 193.0 5-13 198.0 195.04-14 193.0 191.0 5-14 198.0 198.04-15 195.0 191.0 5-15 198.0 198.0
4-16 197.0 195.0 5-16 198.0 197.04-17 196.0 195.0 5-17 196.0 194.0
4-18 197.0 195.0 5-18 197.0 195.04-19 195.0 195.0 5-19 199.0 199.04-20 196.0 195.0 5-20 199.0 198.0
4-21 197.0 197.0 5-21 201.0 19704-22 198.0 195.0 5-22 198.0 196.0
4-23 196.0 194.0 5-23 196.0 195.04-24 196.0 195.0 5-24 199.0 194.0
4-25 199.0 197.0 5-25 198.0 195.0
4-26 198.0 197.0 5-26 199.0 19604-27 199.0 197.0 5-27 195.0 195.04-28 196.0 196.0 5-28 197.0 194.04-29 198.0 192.0 5-29 200.0 195.04-30 196.0 196.0 5-30 198.0 1950
88 5-31 197.0 196
88
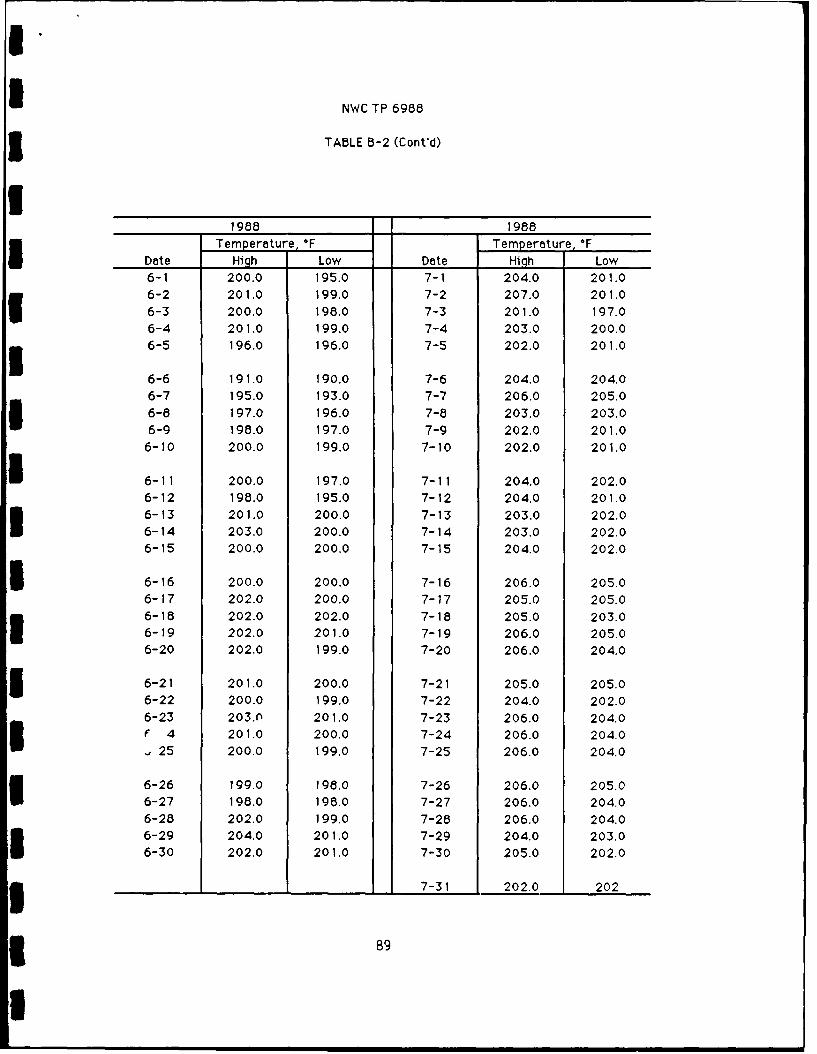
I.I NWC TP 6966
3 TABLE B-2 (Cont'd)
II1988 1988
Temperature, OF Temperature, OF
Date Hioh Low Date High Low
6-1 200.0 195.0 7-1 204.0 201.06-2 201.0 199.0 7-2 207.0 201.0
6-3 200.0 198.0 7-3 201.0 197.06-4 201.0 199.0 7-4 203.0 200.06-5 196.0 196.0 7-5 202.0 201.0
6-6 191.0 190.0 7-6 204.0 204.06-7 195.0 193.0 7-7 206.0 205.06-8 197.0 196.0 7-8 203.0 203.06-9 198.0 197.0 7-9 202.0 201.0
6-10 200.0 199.0 7-10 202.0 201.0
6-11 200.0 197.0 7-11 204.0 202.06-12 196.0 195.0 7-12 204.0 201.06-13 201.0 200.0 7-13 203.0 202.06-14 203.0 200.0 7-14 203.0 202.06-15 200.0 200.0 7-15 204.0 202.0
6-16 200.0 200.0 7-16 206.0 205.06-17 202.0 200.0 7-17 205.0 205.06-18 202.0 202.0 7-18 205.0 203.0
6-19 202.0 201.0 7-19 206.0 205.06-20 202.0 199.0 7-20 206.0 204.0
6-21 201.0 200.0 7-21 205.0 205.06-22 200.0 199.0 7-22 204.0 202.06-23 203. 201.0 7-23 206.0 204.0
f 4 201.0 200.0 7-24 206.0 204.0
25 200.0 199.0 7-25 206.0 204.0
6-26 199.0 198.0 7-26 206.0 205.06-27 198.0 198.0 7-27 206.0 204.06-28 202.0 199.0 7-28 206.0 204.06-29 204.0 201.0 7-29 204.0 203.0
6-30 202.0 201.0 7-30 205.0 202.0
3 7-31 202.0 202
3 89
I
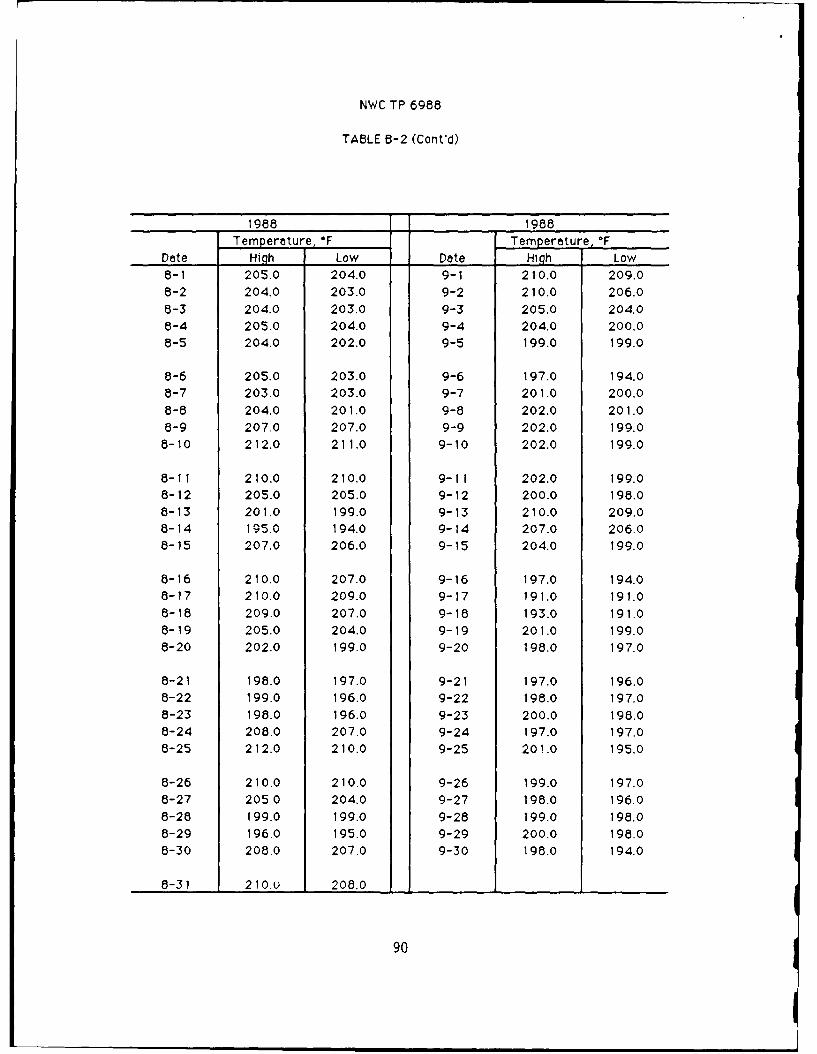
NWC TP 6988
TABLE 5-2 (Cont'd)
1988 1988Temperature, °F Temperature, 'F
Date High Low Date High Low8-1 205.0 204.0 9-1 210.0 209.08-2 204.0 203.0 9-2 210.0 206.01-3 204.0 203.0 9-3 205.0 204.0B-4 205.0 204.0 9-4 204.0 200.0B-5 204.0 202.0 9-5 199.0 199.0
B-6 205.0 203.0 9-6 197.0 194.08-7 203.0 203.0 9-7 201.0 200.06-8 204.0 201.0 9-8 202.0 201.08-9 207.0 207.0 9-9 202.0 199.0
8-10 212.0 21 1.0 9-10 202.0 199.0
8-11 210.0 210.0 9-11 202.0 199.08-12 205.0 205.0 9-12 200.0 198.08-13 201.0 199.0 9-13 210.0 209.08-14 195.0 194.0 9-14 207.0 206.08-15 207.0 206.0 9-15 204.0 199.0
6-16 210.0 207.0 9-16 197.0 194.08-17 210.0 209.0 9-17 191.0 191.06-18 209.0 207.0 9-18 193.0 191.08-19 205.0 204.0 9-19 201.0 199.08-20 202.0 199.0 9-20 196.0 197.0
8-21 198.0 197.0 9-21 197.0 196.08-22 199.0 196.0 9-22 198.0 197.08-23 198.0 196.0 9-23 200.0 198.06-24 206.0 207.0 9-24 197.0 197.06-25 212.0 210.0 9-25 201.0 195.0
8-26 210.0 210.0 9-26 199.0 197.08-27 205.0 204.0 9-27 198.0 196.08-28 199.0 199.0 9-28 199.0 198.06-29 196.0 195.0 9-29 200.0 198.06-30 208.0 207.0 9-30 198.0 194.0
8-31 2 1 0.u 208.0
90
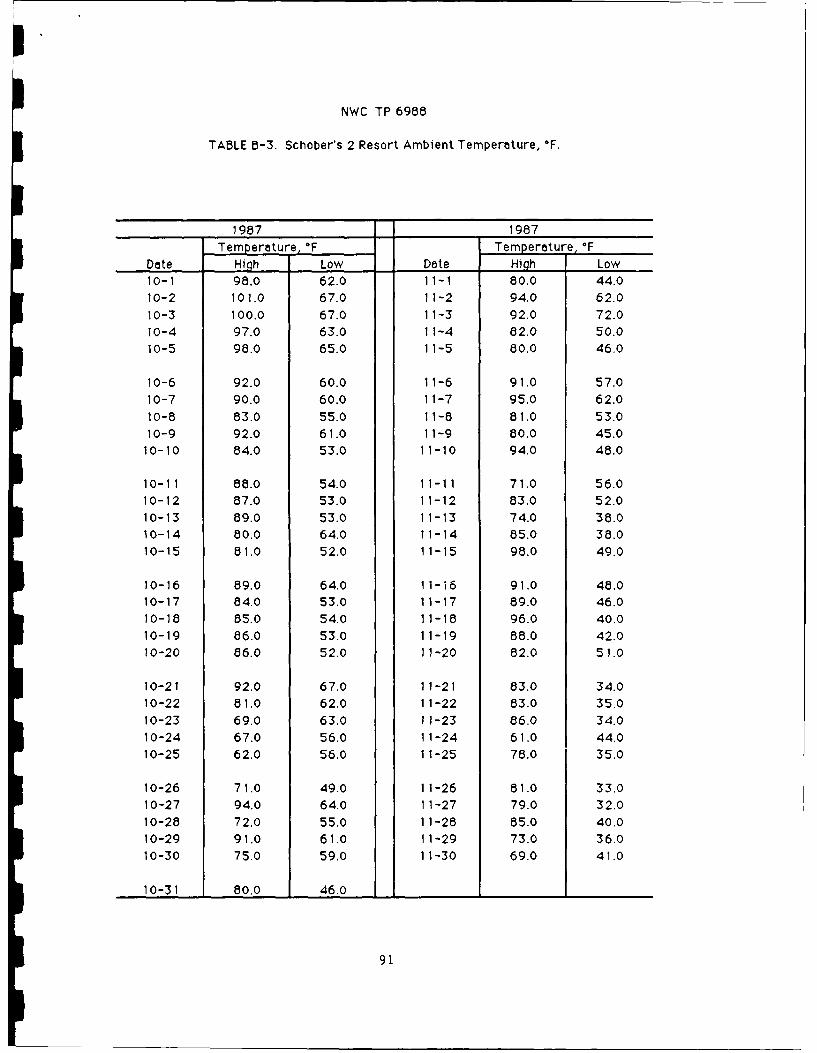
NWC TP 6988
TABLE B-3. Schober's 2 Resort Ambient Temperature, F.
1987 1987
Temperature, OF Temperature, OF
Date High Low Date High Low
10-1 98.0 62.0 11- 80.0 44.010-2 101.0 67.0 11-2 94.0 62.0
10-3 100.0 67.0 11-3 92.0 72.010-4 97.0 63.0 11-4 82.0 50.010-5 98.0 65.0 11-5 80.0 46.0
10-6 92.0 60.0 11-6 91.0 57.010-7 90.0 60.0 11-7 95.0 62.010-8 83.0 55.0 1 1-8 81.0 53.010-9 92.0 61.0 11-9 80.0 45.0
10-10 84.0 53.0 11-10 94.0 48.0
10-11 88.0 54.0 11-11 71.0 56.010-12 87.0 53.0 11-12 83.0 52.010-13 89.0 53.0 11-13 74.0 38.010-14 80.0 64.0 11-14 85.0 38.010-15 81.0 52.0 11-15 98.0 49.0
10-16 89.0 64.0 1 1-116 91.0 48.010-17 84.0 53.0 11-17 89.0 46.010-18 85.0 54.0 11-18 96.0 40.010-19 86.0 53.0 11-19 88.0 42.010-20 86.0 52.0 11-20 82.0 51.0
10-21 92.0 67.0 11-21 83.0 34.010-22 81.0 62.0 11-22 83.0 35.010-23 69.0 63.0 11-23 86.0 34.010-24 67.0 56.0 11-24 61.0 44.010-25 62.0 56.0 11-25 78.0 35.0
10-26 71.0 49.0 11-26 81.0 33.010-27 94.0 64.0 11-27 79.0 32.010-28 72.0 55.0 1 1-28 85.0 40.010-29 91.0 61.0 11-29 73.0 36.010-30 75.0 59.0 11-30 69.0 41.0
10-31 80.0 46.0
!9
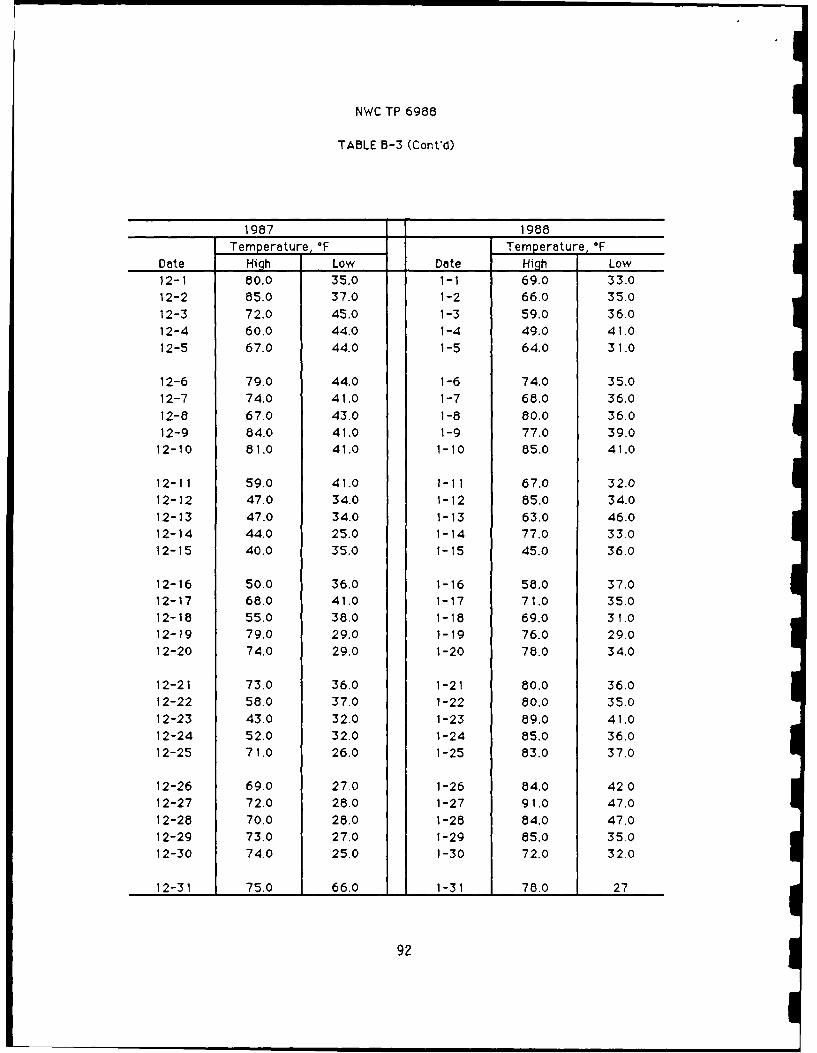
NWC TP 6988
TABLE B-3 (Cont'd)
1987 1988Temperature, Temperature, OF
Date High Low Date High Low12-1 80.0 35.0 1-1 69.0 33.012-2 85.0 37.0 1-2 66.0 35.012-3 72.0 45.0 1-3 59.0 36.012-4 60.0 44.0 1-4 49.0 41.012-5 67.0 44.0 1-5 64.0 31.0
12-6 79.0 44.0 1-6 74.0 35.012-7 74.0 41.0 1-7 68.0 36.012-8 67.0 43.0 1-8 80.0 36.012-9 84.0 41.0 1-9 77.0 39.0
12-10 81.0 41.0 1-10 85.0 41.0
12-11 59.0 41.0 1-11 67.0 32.012-12 47.0 34.0 1-12 85,0 34.012-13 47.0 34.0 1-13 63,0 46.012-14 44.0 25.0 1-14 77.0 33.012-15 40.0 35.0 1-15 45.0 36.0
12-16 50.0 36.0 1-16 58.0 37.012-17 68.0 41.0 1-17 71.0 35.012-16 55.0 38.0 1-18 69.0 31.012-19 79.0 29.0 1-19 76.0 29.012-20 74.0 29.0 1-20 78.0 34.0
12-21 73.0 36.0 1-21 80.0 36.012-22 58.0 37.0 1-22 80.0 35.012-23 43.0 32.0 1-23 89.0 41.012-24 52.0 32.0 1-24 85.0 36.012-25 71.0 26.0 1-25 83.0 37.0
12-26 69.0 27.0 1-26 84.0 42 012-27 72.0 28.0 1-27 91.0 47.012-28 70.0 28.0 1-28 84.0 47.012-29 73.0 27.0 1-29 85.0 35.012-30 74.0 25.0 1-30 72.0 32.0
12-31 75.0 66.0 1-31 78.0 27
92
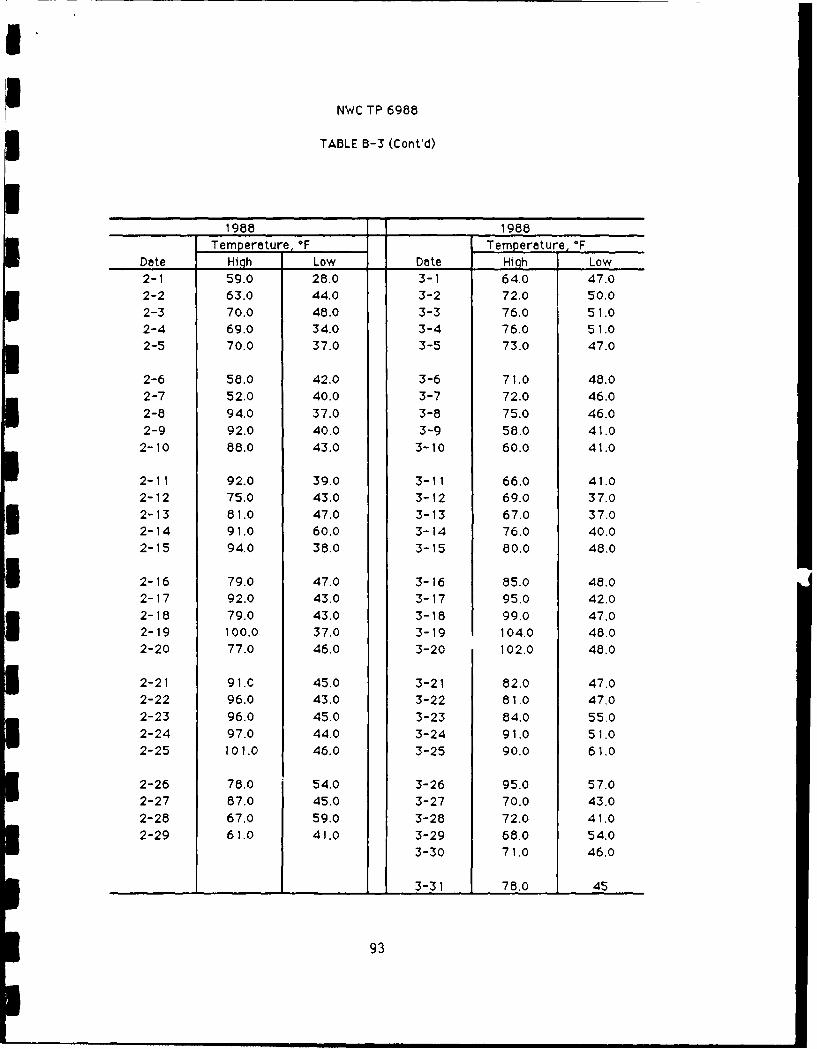
NWC TP 6988
TABLE B-3 (Cont'd)
1988 1988Temperature, OF Temperature, OF
Date High Low Date High Low2-1 59.0 28.0 3-1 64.0 47.02-2 63.0 44.0 3-2 72.0 50.02-3 70.0 48.0 3-3 76.0 51.02-4 69.0 34.0 3-4 76.0 51.02-5 70.0 37.0 3-5 73.0 47.0
2-6 58.0 42.0 3-6 71.0 48.02-7 52.0 40.0 3-7 72.0 46.0
2-8 94.0 37.0 3-8 75.0 46.02-9 92.0 40.0 3-9 58.0 41.0
2-10 88.0 43.0 3-10 60.0 41.0
2-11 92.0 39.0 3-11 66.0 41.02-12 75.0 43.0 3-12 69.0 37.02-13 81.0 47.0 3-13 67.0 37.02-14 91.0 60.0 3-14 76.0 40.02-15 94.0 38.0 3-15 80.0 48.0
2-16 79.0 47.0 3-16 85.0 48.02-17 92.0 43.0 3-17 95.0 42.02-18 79.0 43.0 3-18 99.0 47,0
2-19 100.0 37.0 3-19 104.0 48.02-20 77.0 46.0 3-20 102.0 48.0
2-21 9 I.C 45.0 3-21 82.0 47.02-22 96.0 43.0 3-22 81.0 47.02-23 96.0 45.0 3-23 84.0 55.02-24 97.0 44.0 3-24 91.0 51.02-25 101.0 46.0 3-25 90.0 61.0
2-26 78.0 54.0 3-26 95.0 57.02-27 87.0 45.0 3-27 70.0 43.02-28 67.0 59.0 3-28 72.0 41.02-29 61.0 41.0 3-29 68.0 54.0
3-30 71.0 46.0
3-31 78.0 45
93
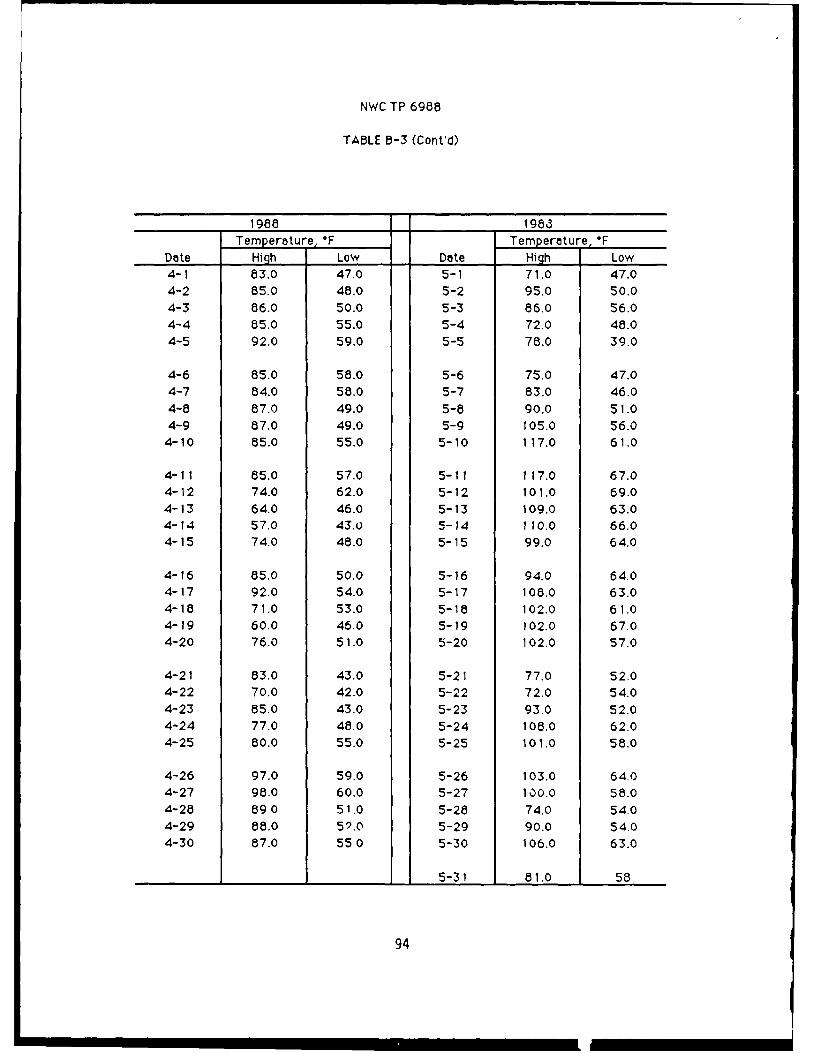
NWC TP 6985
TABLE B-3 (Cont'd)
198a 1983Temperature, OF Temperature, OF
Date Hi gh Low Date High Low4-1 83.0 47.0 5-1 71.0 47.04-2 85.0 48.0 5-2 95.0 50.04-3 86.0 50.0 5-3 86.0 56.04-4 85.0 55.0 5-4 72.0 48.0
4-5 92.0 59.0 5-5 78.0 39.0
4-6 85.0 58.0 5-6 75.0 47.04-7 84.0 58.0 5-7 83.0 46.04-8 87.0 49.0 5-8 90.0 51.04-9 87.0 49.0 5-9 105.0 56.0
4-10 85.0 55.0 5-10 117.0 61.0
4-11 85.0 57.0 5-11 117.0 67.04-12 74.0 62.0 5-12 101.0 69.04-13 64.0 46.0 5-13 109.0 63.04-14 57.0 43.0 5-14 110.0 66.04-15 74.0 48.0 5-15 99.0 64.0
4-16 85.0 50.0 5-16 94.0 64.04-17 92.0 54.0 5-17 108.0 63.04-18 71.0 53.0 5-18 102.0 61.04-19 60.0 46.0 5-19 102.0 67.0
4-20 76.0 51.0 5-20 102.0 57.0
4-21 83.0 43.0 5-21 77.0 52.04-22 70.0 42.0 5-22 72.0 54.0
4-23 85.0 43.0 5-23 93.0 52.04-24 77.0 48.0 5-24 108.0 62.04-25 80.0 55.0 5-25 101.0 58.0
4-26 97.0 59.0 5-26 103.0 64.04-27 98.0 60.0 5-27 100.0 58.04-28 89 0 51.0 5-28 74.0 54.04-29 88.0 59.0 5-29 90.0 54.04-30 87.0 550 5-30 106.0 63.0
5-31 81.0 58
94
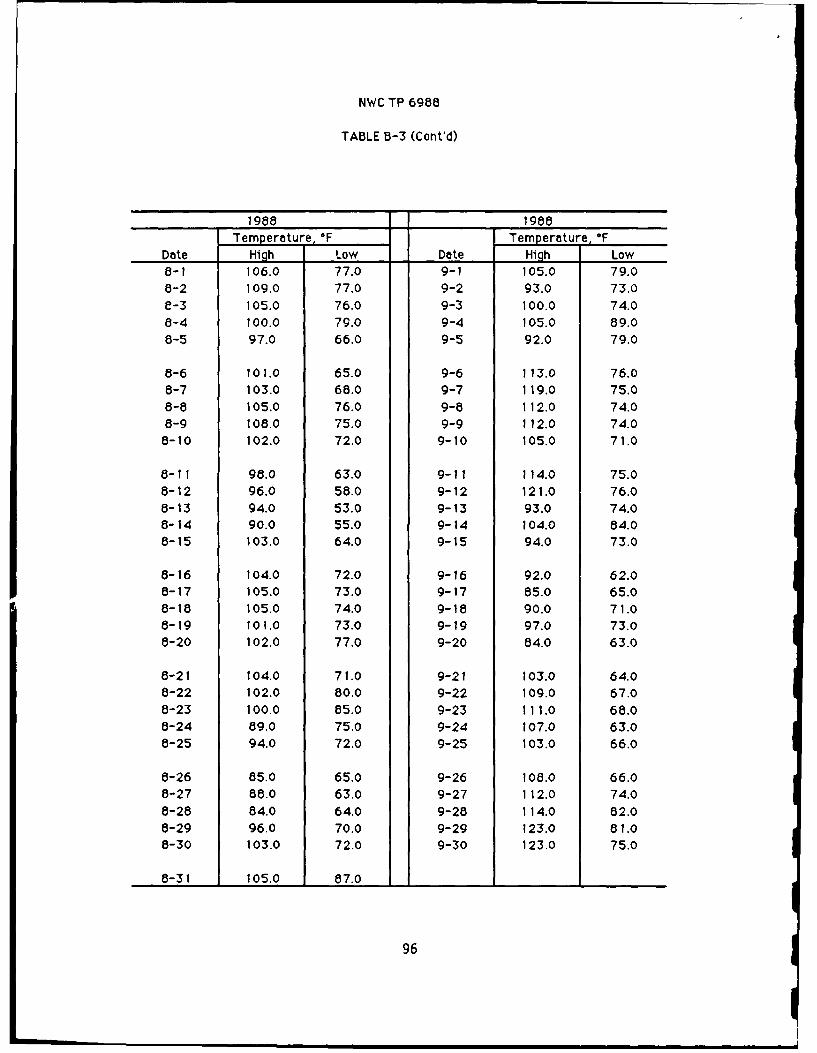
NWC TP 6988
TABLE B-3 (Cont'd)
1988 1988Temperature, OF Temperature, OF
Date High Low Date High Low8-1 106.0 77.0 9-1 105.0 79.08-2 109.0 77.0 9-2 93.0 73.0L-3 105.0 76.0 9-3 100.0 74.08-4 100.0 79.0 9-4 105.0 89.08-5 97.0 66.0 9-5 92.0 79.0
8-6 101.0 65.0 9-6 113.0 76.08-7 103.0 68.0 9-7 119.0 75.08-8 105.0 76.0 9-8 112.0 74.08-9 108.0 75.0 9-9 112.0 74.08-10 102.0 72.0 9-10 105.0 71.0
8-11 98.0 63.0 9-11 114.0 75.08-12 96.0 58.0 9-12 121.0 76.08-13 94.0 53.0 9-13 93.0 74.08-14 90.0 55.0 9-14 104.0 84.08-15 103.0 64.0 9-15 94.0 73.0
8-16 104.0 72.0 9-16 92.0 62.08-17 105.0 73.0 9-17 85.0 65.08-18 105.0 74.0 9-18 90.0 71.08-19 101.0 73.0 9-19 97.0 73.08-20 102.0 77.0 9-20 84.0 63.0
8-21 104.0 71.0 9-21 103.0 64.08-22 102.0 80.0 9-22 109.0 67.08-23 100.0 85.0 9-23 111.0 68.08-24 89.0 75.0 9-24 107.0 63.08-25 94.0 72.0 9-25 103.0 66.0
8-26 85.0 65.0 9-26 108.0 66.08-27 88.0 63.0 9-27 112.0 74.08-28 84.0 64.0 9-28 114.0 82.08-29 96.0 70.0 9-29 123.0 81.08-30 103.0 72.0 9-30 123.0 75.0
8-31 105.0 87.0 I
96
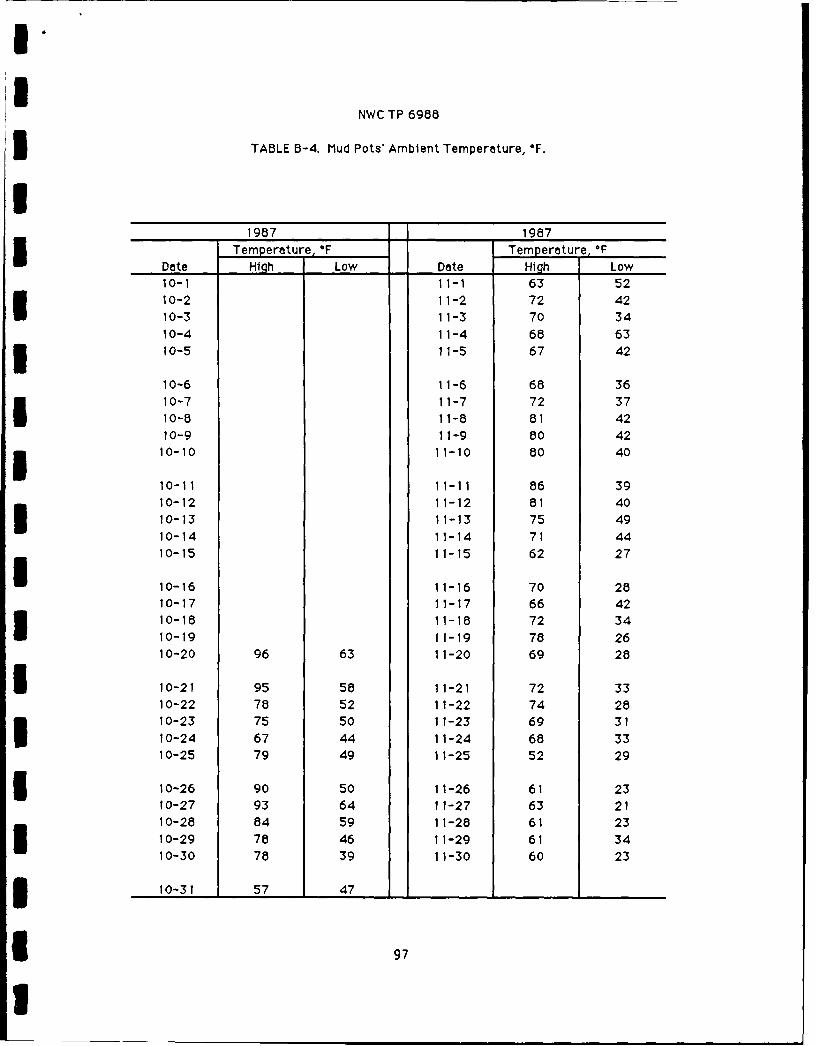
I.NWC TP 6988
3 TABLE B-4. Mud Pots' Ambient Temperature, F.
1987 1987Temperature, OF Temperature, OF
Date High Low Date High Low10-1 11-1 63 5210-2 11-2 72 4210-3 11-3 70 3410-4 11-4 68 63
I 10-5 11-5 67 42
10-6 11-6 68 3610-7 11-7 72 3710-8 11-8 81 4210-9 11-9 80 4210-10 11-10 80 40
10-11 11-11 86 3910-12 11-12 81 4010-13 11-13 75 49
10-14 11-14 71 44
10-15 11-15 62 27
10-16 11-16 70 2810-17 11-17 66 4210-18 11-18 72 34
10-19 11-19 78 2610-20 96 63 11-20 69 28
I 10-21 95 58 11-21 72 33
10-22 78 52 11-22 74 28
10-23 75 50 11-23 69 31
10-24 67 44 11-24 68 3310-25 79 49 11-25 52 29
5 10-26 90 50 11-26 61 23
10-27 93 64 11-27 63 21
10-28 84 59 11-28 61 2310-29 76 46 11-29 61 34
10-30 78 39 11-30 60 231 10-31 57 47
1 97
I
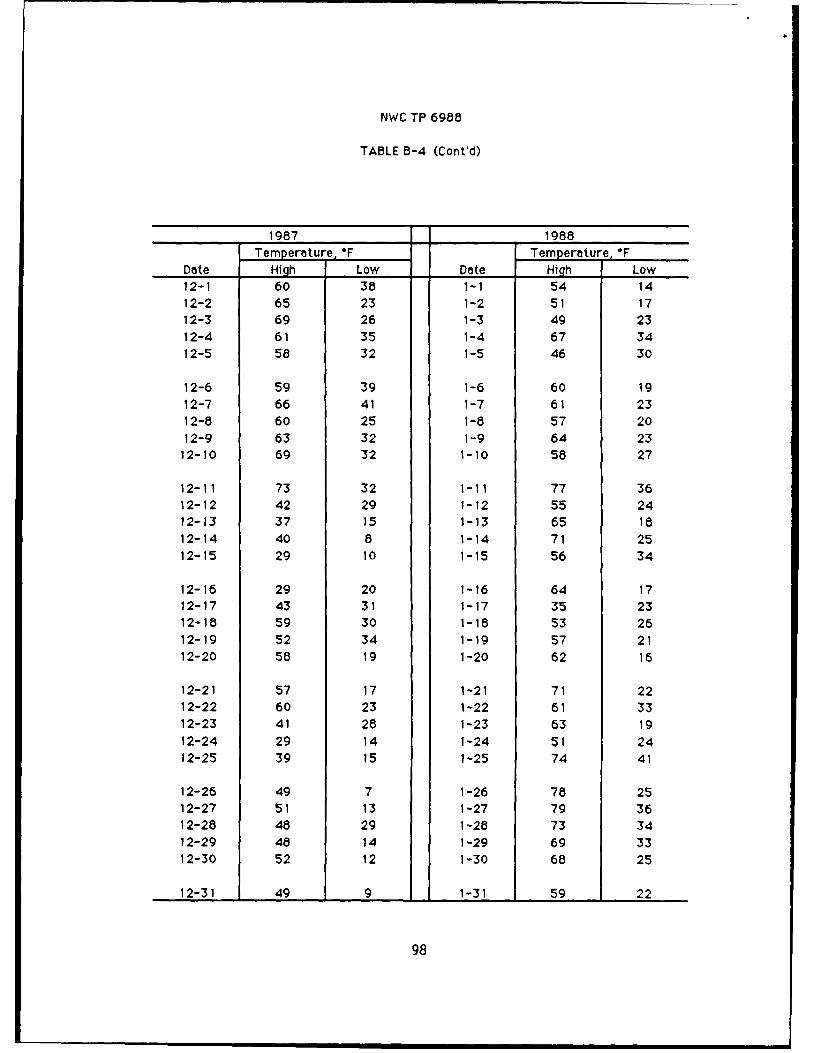
NWC TP 6988
TABLE B-4 (Cont'd)
1987 1988Temperature,°F Temperature, F
Date High Low Date High Low12-1 60 38 1-1 54 1412-2 65 23 1-2 51 1712-3 69 26 1-3 49 2312-4 61 35 1-4 67 3412-5 58 32 1-5 46 30
12-6 59 39 1-6 60 1912-7 66 41 1-7 61 2312-8 60 25 1-8 57 2012-9 63 32 1-9 64 2312-10 69 32 1-10 58 27
12-11 73 32 1-11 77 36
12-12 42 29 1-12 55 24
12-13 37 15 1-13 65 18
12-14 40 8 1-14 71 25
12-15 29 10 1-15 56 34
12-16 29 20 1-16 64 17
12-17 43 31 1-17 35 2312-18 59 30 1-18 53 26
12-19 52 34 1-19 57 21
12-20 58 19 1-20 62 16
12-21 57 17 1-21 71 22
12-22 60 23 1-22 61 3312-23 41 28 1-23 63 19
12-24 29 14 1-24 51 24
12-25 39 15 1-25 74 41
12-26 49 7 1-26 78 25
12-27 51 13 1-27 79 3612-28 48 29 1-28 73 34
12-29 48 14 1-29 69 3312-30 52 12 1-30 68 25
12-31 49 9 1-31 59 22
98
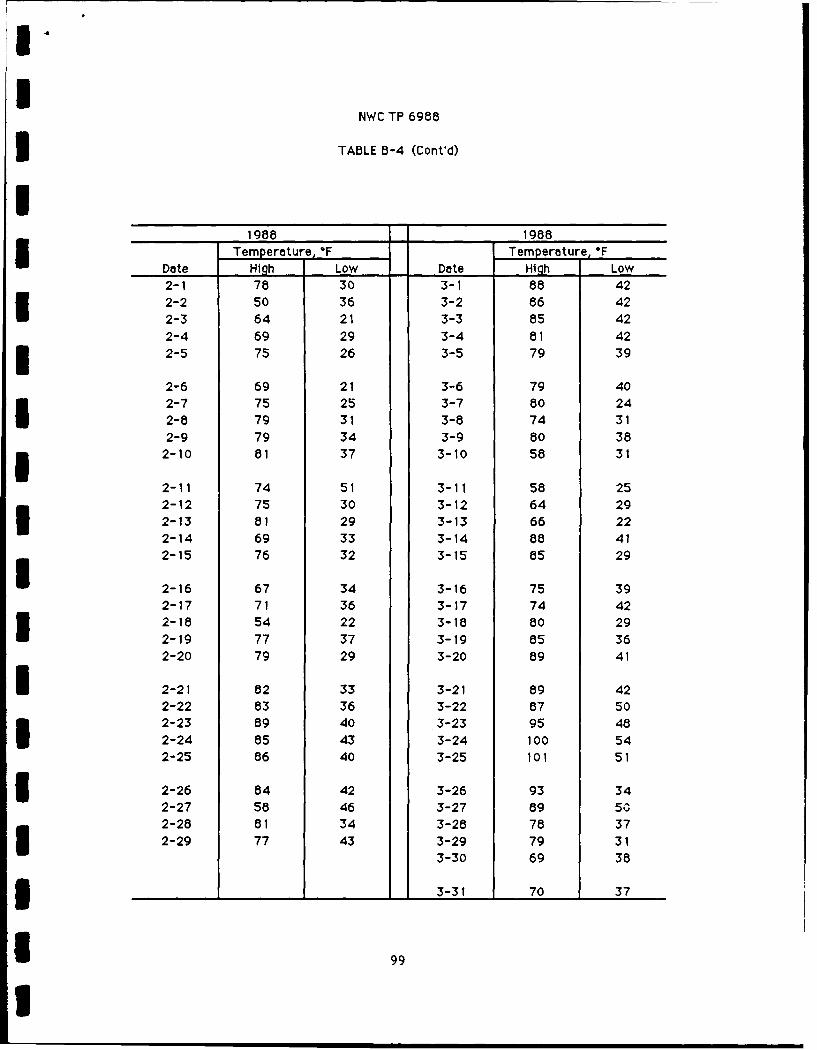
INWC TP 6988
3 TABLE B-4 (Cont'd)
1988 1988Temperature, OF Temperature, OF
Date Hi h Low Date High Low2-3 78 30 5-1 88 422-2 50 36 3-2 86 42
2-3 64 21 3-3 85 422-4 69 29 3-4 81 42
2-5 75 26 3-5 79 39
2-6 69 21 3-6 79 402-7 75 25 3-7 80 24
2-8 79 31 3-8 74 312-9 79 34 3-9 80 38
2-10 81 37 3-10 58 31
2-11 74 51 3-11 58 25
2-12 75 30 3-12 64 29
2-13 81 29 3-13 66 22
2-14 69 33 3-14 88 41
2-15 76 32 3-15 85 29
2-16 67 34 3-16 75 39
2-17 71 36 3-17 74 42
2-18 54 22 3-18 80 292-19 77 37 3-19 85 362-20 79 29 3-20 89 41
1 2-21 82 33 3-21 89 42
2-22 83 36 3-22 87 50
2-23 89 40 3-23 95 48
2-24 85 43 3-24 100 542-25 86 40 3-25 101 51
1 2-26 84 42 3-26 93 34
2-27 58 46 3-27 89 50
2-28 81 34 3-28 78 37
2-29 77 43 3-29 79 313-30 69 38
3 3-31 70 37
199
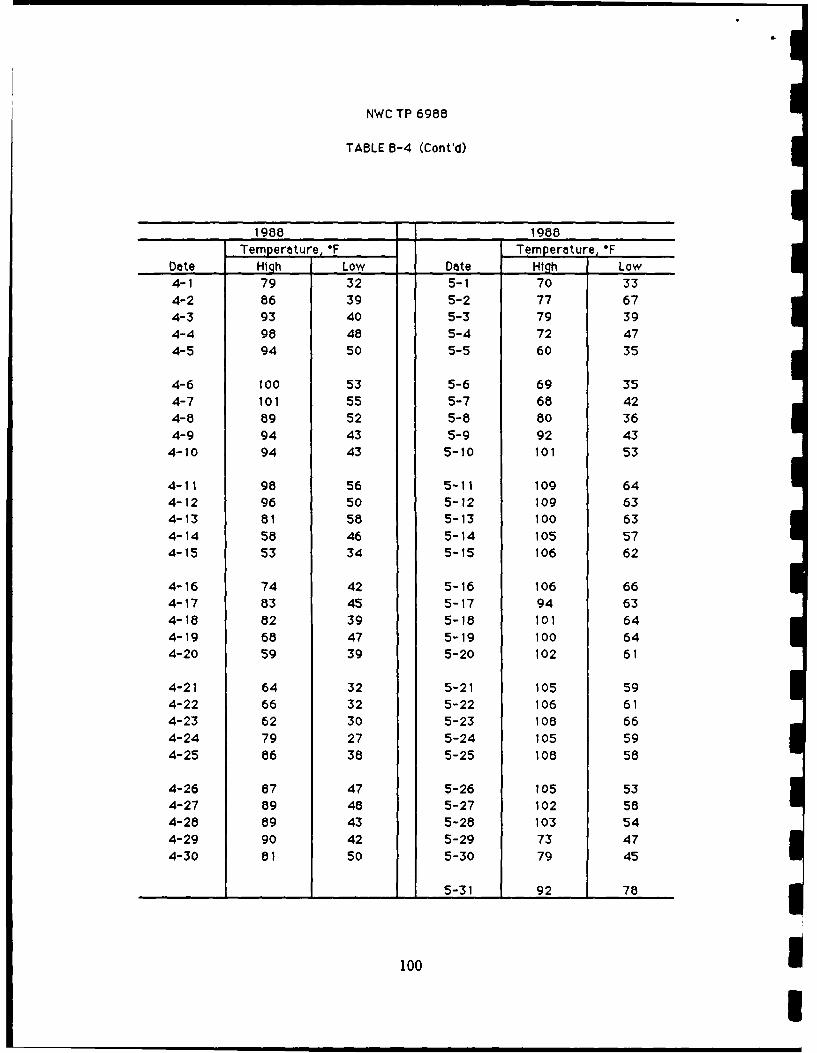
NWC TP 6988
TABLE B-4 (Cont'd)
1988 1988Temperature, OF Temperature, OF
Date High Low Date High Low4-1 79 32 5-1 70 334-2 86 39 5-2 77 674-3 93 40 5-3 79 39
4-4 98 48 5-4 72 474-5 94 50 5-5 60 35
4-6 100 53 5-6 69 354-7 101 55 5-7 68 42
4-8 89 52 5-8 80 364-9 94 43 5-9 92 434-10 94 43 5-10 101 53
4-11 98 56 5-11 109 64
4-12 96 50 5-12 109 634-13 81 58 5-13 100 63
4-14 58 46 5-14 105 57
4-15 53 34 5-15 106 62
4-16 74 42 5-16 106 66
4-17 83 45 5-17 94 63
4-18 82 39 5-18 101 64
4-19 68 47 5-19 100 64
4-20 59 39 5-20 102 61
4-21 64 32 5-21 105 594-22 66 32 5-22 106 61
4-23 62 30 5-23 108 66
4-24 79 27 5-24 105 594-25 86 38 5-25 108 58
4-26 87 47 5-26 105 53
4-27 89 48 5-27 102 58
4-28 89 43 5-28 103 54
4-29 90 42 5-29 73 47
4-30 81 50 5-30 79 45
5-31 92 78
100 1I
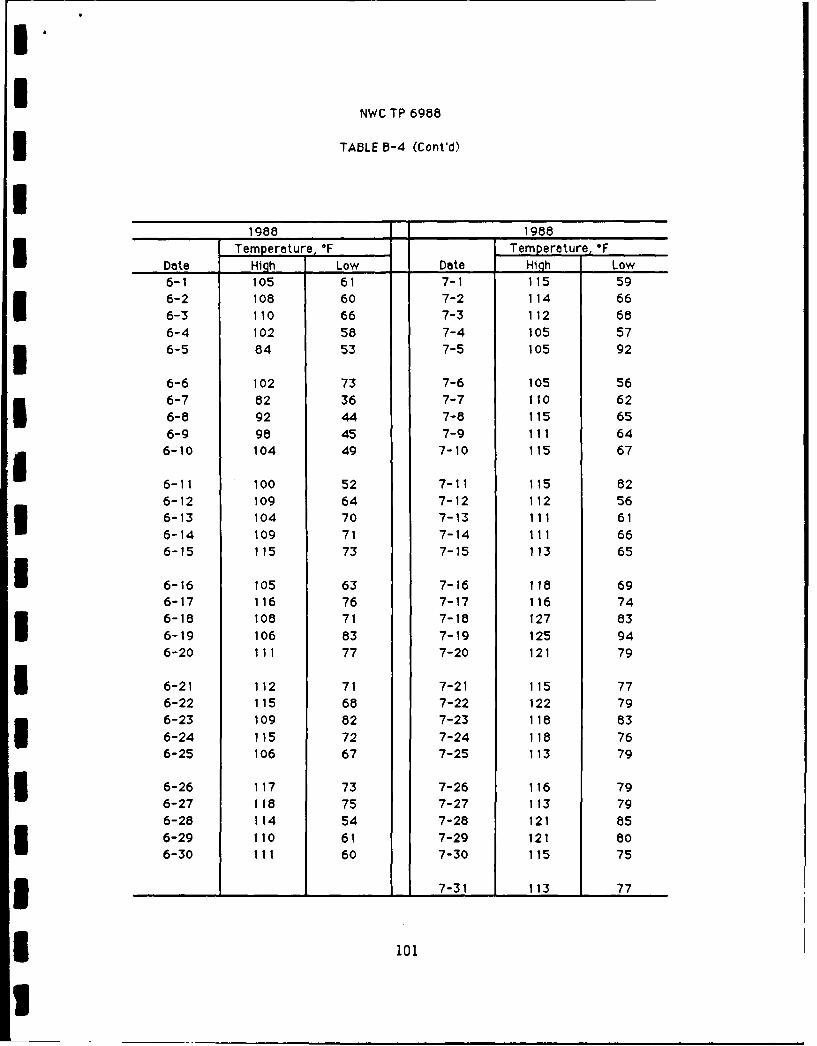
NWC TP 6988
3 TABLE 5-4 (Cont'd)
1988 1988Temperature OF Temperature, F
Date Hiqh Low Date High Low6-1 105 61 7-1 115 59
6-2 108 60 7-2 114 666-3 110 66 7-3 112 686-4 102 58 7-4 105 57
6-5 84 53 7-5 105 92
6-6 102 73 7-6 105 566-7 82 36 7-7 110 626-8 92 44 7-8 115 656-9 98 45 7-9 111 646-10 104 49 7-10 115 67
6-11 100 52 7-11 115 82
6-12 109 64 7-12 112 56
6-13 104 70 7-13 111 61
6-14 109 71 7-14 111 66
6-15 115 73 7-15 113 65
1 6-16 105 63 7-16 118 69
6-17 116 76 7-17 116 74
6-18 108 71 7-18 127 836-19 106 83 7-19 125 946-20 111 77 7-20 121 79
I 6-21 112 71 7-21 115 77
6-22 115 68 7-22 122 79
6-23 109 82 7-23 118 83
6-24 115 72 7-24 118 766-25 106 67 7-25 113 79
3 6-26 117 73 7-26 116 79
6-27 118 75 7-27 113 79
6-28 114 54 7-28 121 85
6-29 110 61 7-29 121 80
6-30 111 60 7-30 115 75
3 7-31 113 77
3 101
I
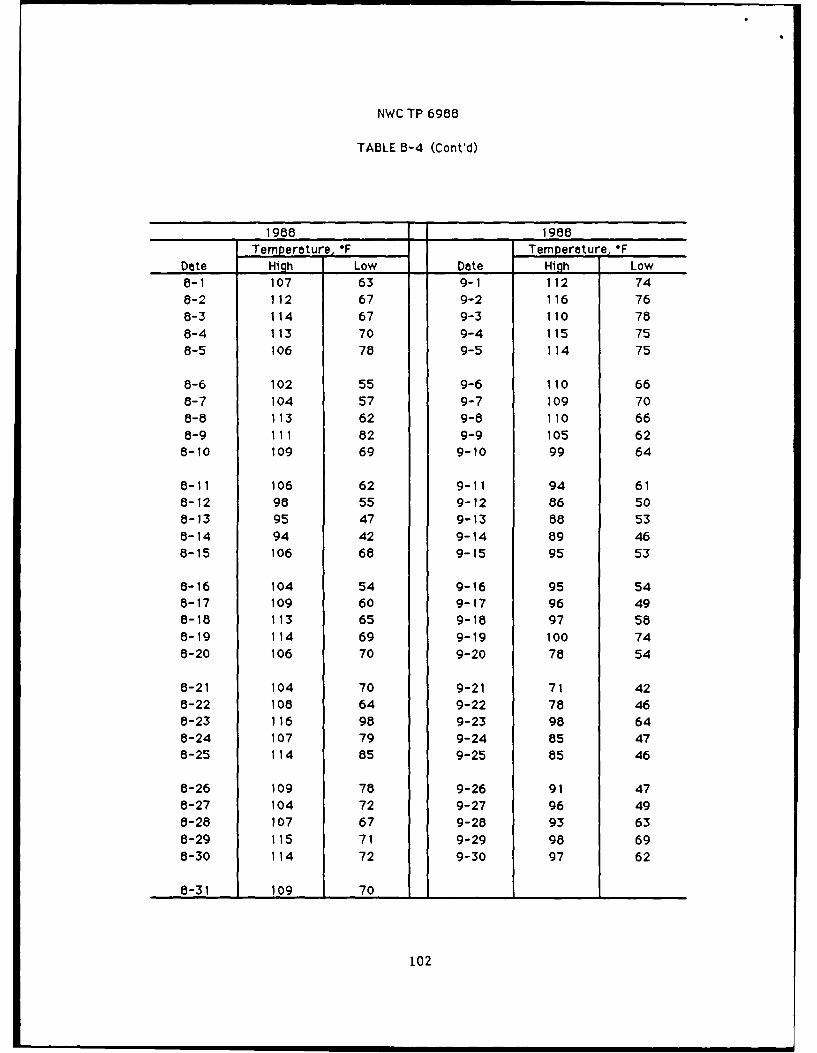
NWC TP 6988
TABLE B-4 (Cont'd)
1988 1988Temperature,°F Temperature, F
Date High Low Date High Low8-1 107 63 9-1 112 748-2 112 67 9-2 116 768-3 114 67 9-3 110 788-4 113 70 9-4 115 758-5 106 78 9-5 114 75
8-6 102 55 9-6 110 668-7 104 57 9-7 109 708-8 113 62 9-8 110 668-9 111 82 9-9 105 628-10 109 69 9-10 99 64
8-11 106 62 9-11 94 618-12 98 55 9-12 86 508-13 95 47 9-13 88 538-14 94 42 9-14 89 468-15 106 68 9-15 95 53
8-16 104 54 9-16 95 548-17 109 60 9-17 96 498-18 113 65 9-18 97 588-19 114 69 9-19 100 74
8-20 106 70 9-20 78 54
8-21 104 70 9-21 71 428-22 108 64 9-22 78 468-23 116 98 9-23 98 648-24 107 79 9-24 85 478-25 114 85 9-25 85 46
8-26 109 78 9-26 91 478-27 104 72 9-27 96 498-28 107 67 9-28 93 638-29 115 71 9-29 98 698-30 114 72 9-30 97 62
8-31 109 70
102
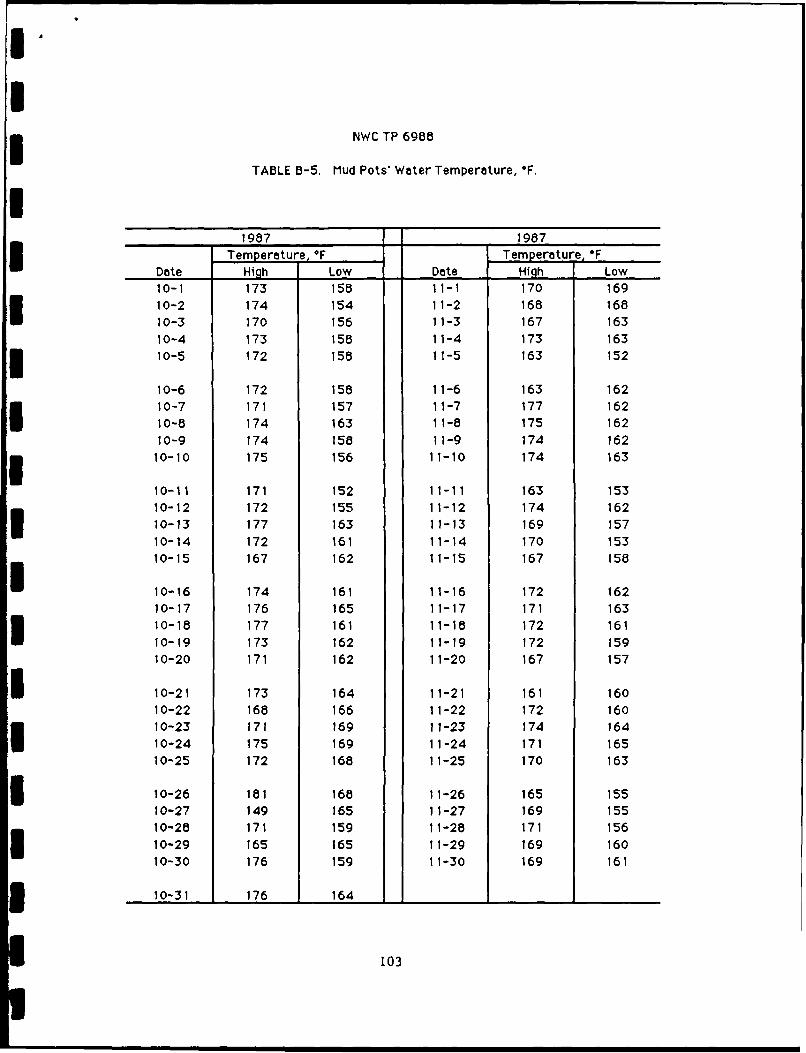
NWC TP 6985
TABLE B-5. Mud Pots Water Temperature, F.
1987 1987Temperature,°F Temperature, F
Date High Low Date High Low10-1 173 158 11-1 170 16910-2 174 154 11-2 168 16810-3 170 156 11-3 167 16310-4 173 158 11-4 173 16310-5 172 158 11-5 163 152
10-6 172 158 11-6 163 16210-7 171 157 11-7 177 16210-8 174 163 11-8 175 16210-9 174 158 11-9 174 16210-10 175 156 11-10 174 163
10-11 171 152 11-11 163 15310-12 172 155 11-12 174 16210-13 177 163 11-13 169 15710-14 172 161 11-14 170 15310-15 167 162 11-15 167 158
10-16 174 161 11-16 172 16210-17 176 165 11-17 171 16310-18 177 161 11-18 172 16110-19 173 162 11-19 172 15910-20 171 162 11-20 167 157
10-21 173 164 11-21 161 16010-22 168 166 11-22 172 16010-23 171 169 11-23 174 164
10-24 175 169 11-24 171 16510-25 172 168 11-25 170 163
10-26 181 168 11-26 165 15510-27 149 165 11-27 169 15510-28 171 159 11-28 171 15610-29 165 165 11-29 169 16010-30 176 159 11-30 169 161
10-31 176 164
103
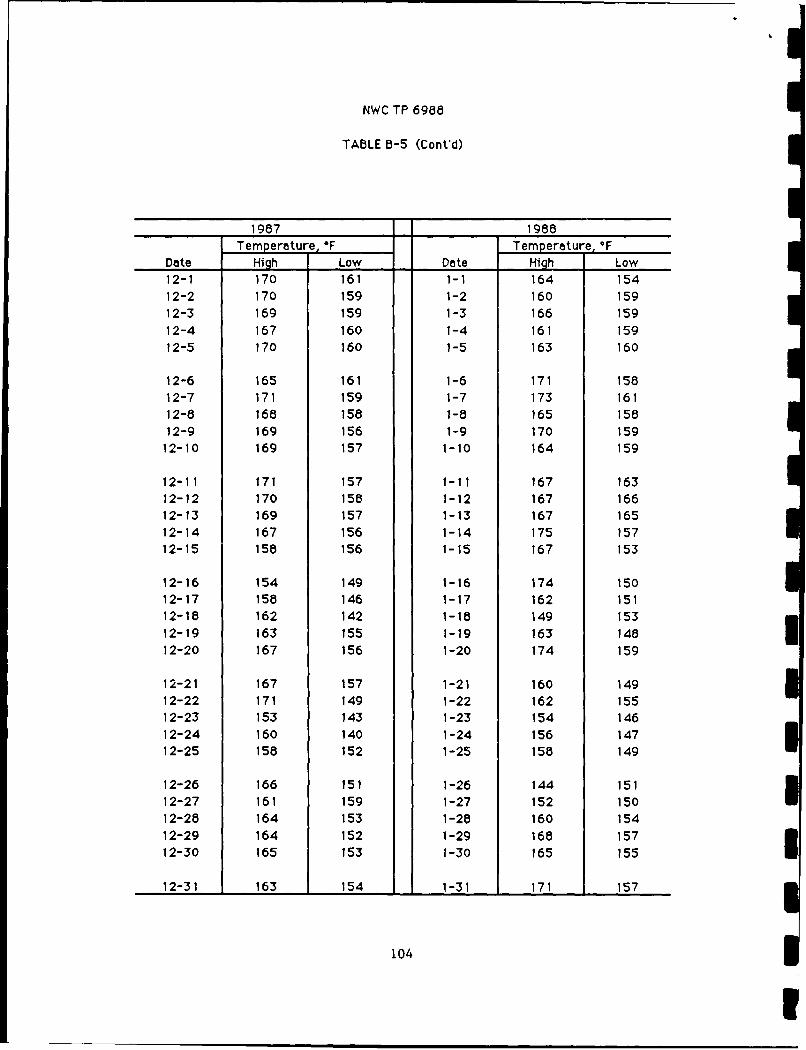
NWC TP 6988
TABLE B-5 (Cont'd)
1987 1988Temperature, F Temperature, F
Date High Low Date High Low12-1 170 161 1-1 164 154
12-2 170 159 1-2 160 159
12-3 169 159 1-3 166 159
12-4 167 160 1-4 161 159
12-5 170 160 1-5 163 160
12-6 165 161 1-6 171 158
12-7 171 159 1-7 173 161
12-8 168 158 1-8 165 158
12-9 169 156 1-9 170 159
12-10 169 157 1-10 164 159
12-11 171 157 1-11 167 163
12-12 170 158 1-12 167 166
12-13 169 157 1-13 167 165
12-14 167 156 1-14 175 157
12-15 158 156 1-15 167 153
12-16 154 149 1-16 174 150
12-17 158 146 1-17 162 151
12-18 162 142 1-18 149 153
12-19 163 155 1-19 163 148
12-20 167 156 1-20 174 159
12-21 167 157 1-21 160 14912-22 171 149 1-22 162 155
12-23 153 143 1-23 154 146
12-24 160 140 1-24 156 147
12-25 158 152 1-25 158 149
12-26 166 151 1-26 144 151
12-27 161 159 1-27 152 150
12-28 164 153 1-28 160 154
12-29 164 152 1-29 168 157
12-30 165 153 1-30 165 155
12-31 163 154 1-31 171 157
104
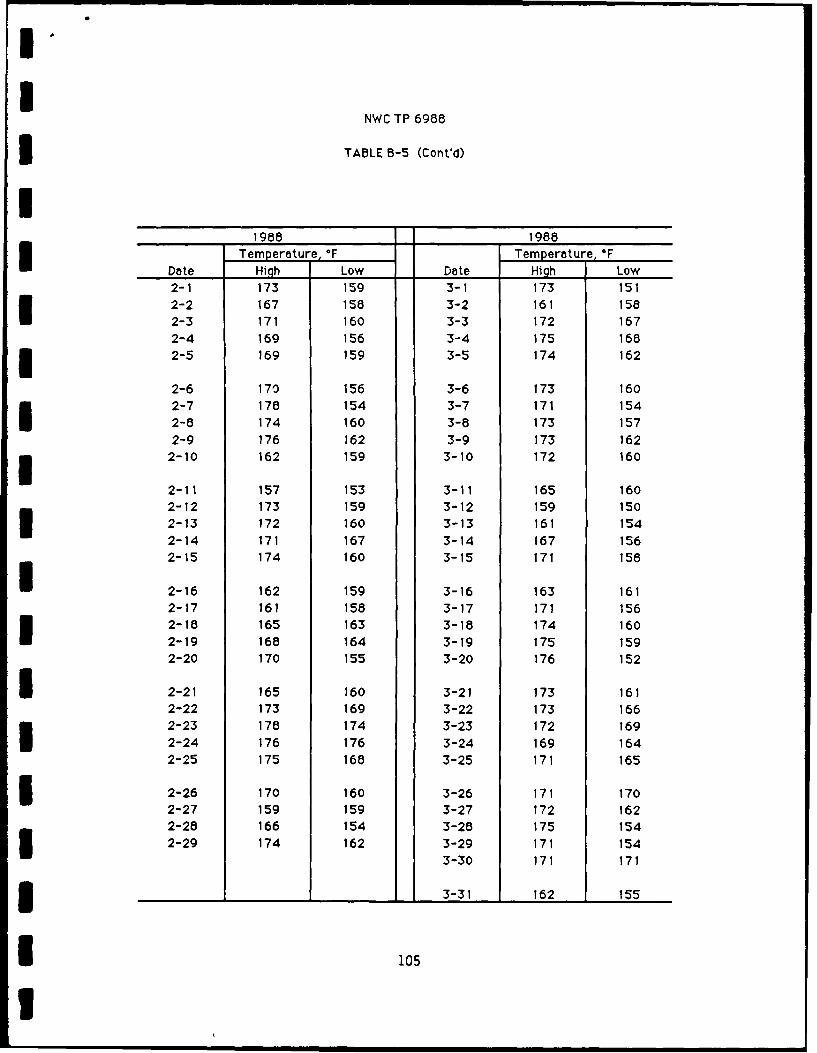
NWC TP 6988
3 TABLE B-5 (Cont'd)
1988 1988
Temperature, OF Temperature, FDate High Low Date High Low
2-1 173 159 3-1 173 1512-2 167 158 3-2 161 158
2-3 171 160 3-3 172 1672-4 169 156 3-4 175 1682-5 169 159 3-5 174 162
2-6 170 156 3-6 173 1602-7 178 154 3-7 171 1542-8 174 160 3-8 173 1572-9 176 162 3-9 173 162
i 2-10 162 159 3-10 172 160
2-11 157 153 3-11 165 1602-12 173 159 3-12 159 1502-13 172 160 3-13 161 1542-14 171 167 3-14 167 1562-15 174 160 3-15 171 158
2-16 162 159 3-16 163 1612-17 161 158 3-17 171 1562-18 165 163 3-18 174 160
2-19 168 164 3-19 175 1592-20 170 155 3-20 176 152
I 2-21 165 160 3-21 173 1612-22 173 169 3-22 173 1662-23 178 174 3-23 172 169
2-24 176 176 3-24 169 1642-25 175 168 3-25 171 165
I 2-26 170 160 3-26 171 1702-27 159 159 3-27 172 1622-28 166 154 3-28 175 1542-29 174 162 3-29 171 154
3-30 171 171
I 3-31 162 155
I 105
I
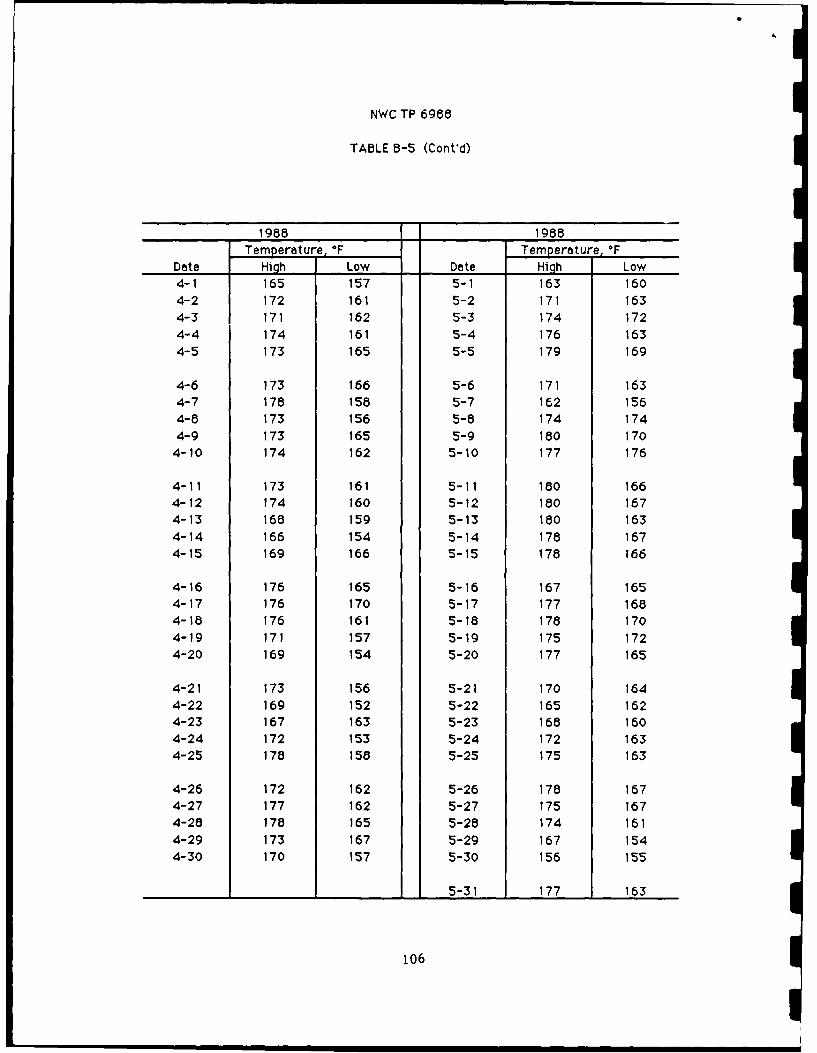
NWC TP 6988
TABLE B-5 (Cont'd)
1988 1988
Temperature,°F Temperature, FDate High Low Date High Low4-1 165 157 5-1 163 160
4-2 172 161 5-2 171 163
4-3 171 162 5-3 174 172
4-4 174 161 5-4 176 163
4-5 173 165 5-5 179 169
4-6 173 166 5-6 171 163
4-7 178 158 5-7 162 156
4-8 173 156 5-8 174 174
4-9 173 165 5-9 180 170
4-10 174 162 5-10 177 176
4-11 173 161 5-11 180 1664-12 174 160 5-12 180 167
4-13 168 159 5-13 180 163
4-14 166 154 5-14 178 167
4-15 169 166 5-15 178 166
4-16 176 165 5-16 167 165
4-17 176 170 5-17 177 1684-18 176 161 5-18 178 170
4-19 171 157 5-19 175 172
4-20 169 154 5-20 177 165
4-21 173 156 5-21 170 164
4-22 169 152 5-22 165 162
4-23 167 163 5-23 168 160
4-24 172 153 5-24 172 163
4-25 178 158 5-25 175 163
4-26 172 162 5-26 178 167
4-27 177 162 5-27 175 167
4-28 178 165 5-28 174 161
4-29 173 167 5-29 167 154
4-30 170 157 5-30 156 155
5-31 177 163
106
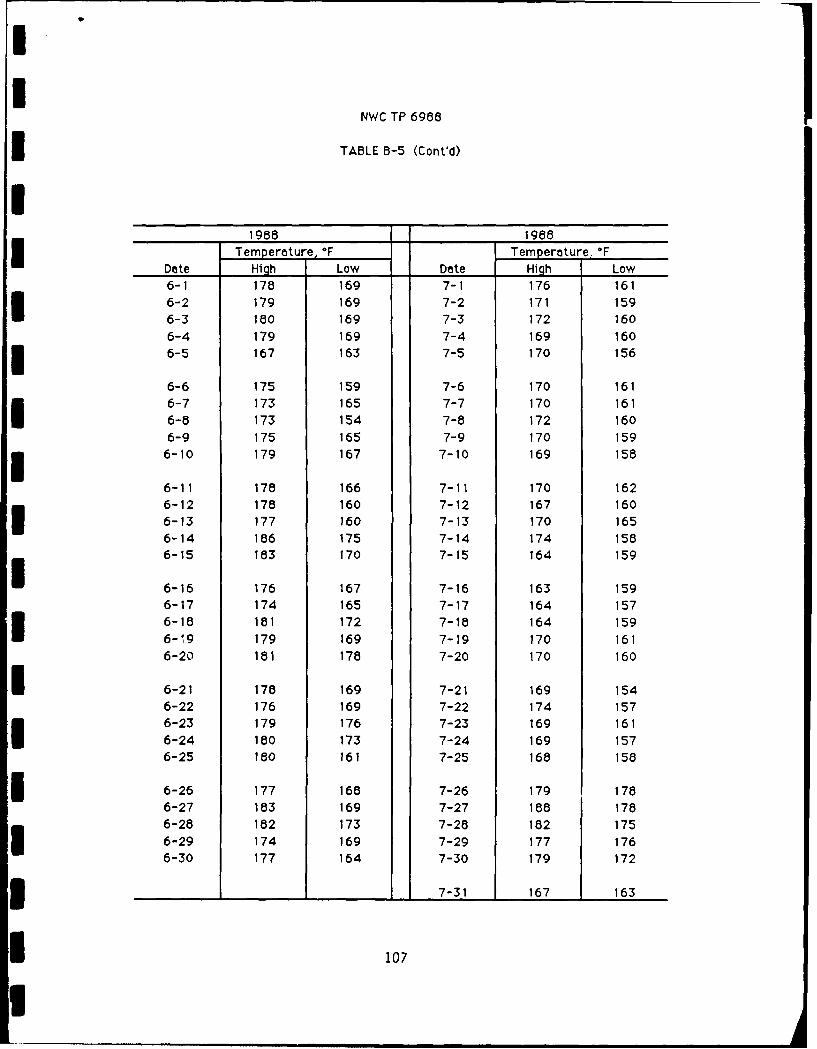
II
NWC TP 6988
TABLE B-5 (Cont'd)
1988 1988Temperature, OF Temperoture. OF
Dete Hiqh Low Date High Low6-1 178 169 7-1 176 161
6-2 179 169 7-2 171 159
6-3 180 169 7-3 172 160
6-4 179 169 7-4 169 160
6-5 167 163 7-5 170 156
6-6 175 159 7-6 170 161
6-7 173 165 7-7 170 161
6-8 173 154 7-8 172 160
6-9 175 165 7-9 170 159
6-10 179 167 7-10 169 158
6-11 178 166 7-11 170 162
6-12 178 160 7-12 167 160
6-13 177 160 7-13 170 165
6-14 186 175 7-14 174 158
6-15 183 170 7-15 164 159
6-16 176 167 7-16 163 159
6-17 174 165 7-17 164 157
6-18 181 172 7-18 164 159
6-19 179 169 7-19 170 1616-20 181 178 7-20 170 160
I 6-21 178 169 7-21 169 154
6-22 176 169 7-22 174 157
6-23 179 176 7-23 169 161
6-24 180 173 7-24 169 1576-25 180 161 7-25 168 158
6-26 177 168 7-26 179 178
6-27 183 169 7-27 188 178
6-28 182 173 7-28 182 175
6-29 174 169 7-29 177 176
6-30 177 164 7-30 179 172
3 7-31 167 163
I 107
I
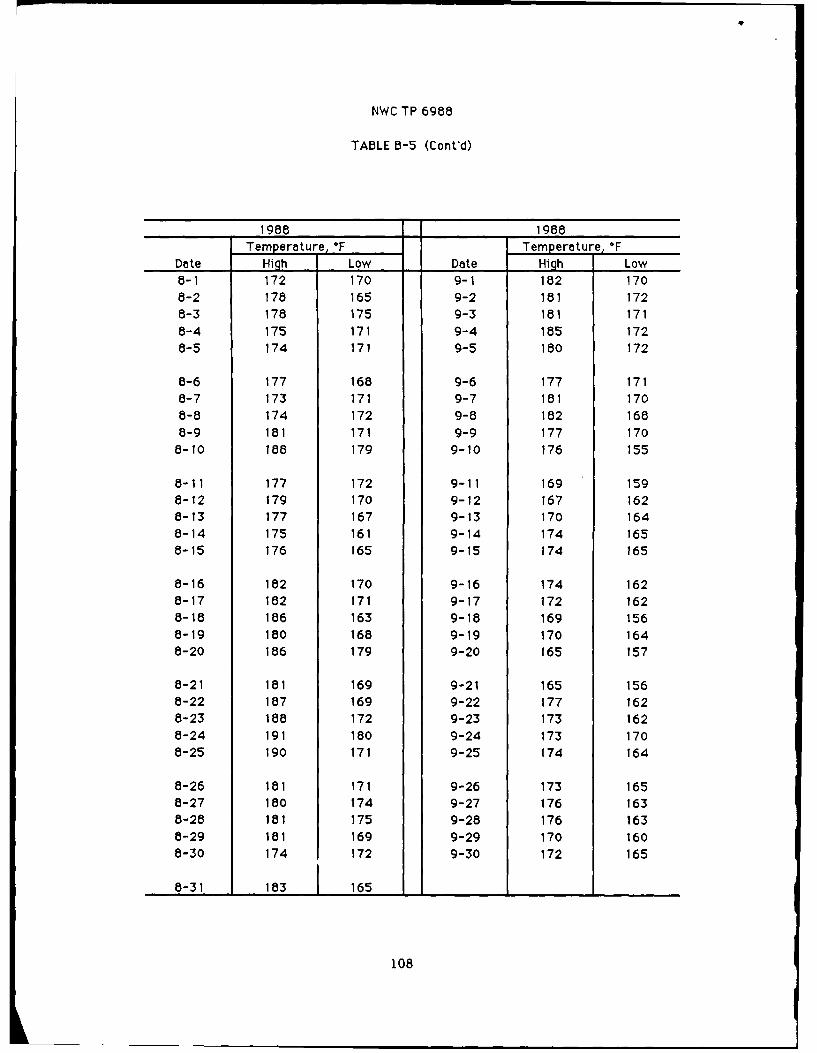
NWC TP 6988
TABLE B-5 (Cont'd)
1988 1988
Temperature,°F Temperature, F
Date HiQh Low Date High Low8-1 172 170 9-1 182 170
8-2 178 165 9-2 181 172
8-3 178 175 9-3 181 171
8-4 175 171 9-4 185 172
8-5 174 171 9-5 180 172
8-6 177 168 9-6 177 171
8-7 173 171 9-7 181 1708-8 174 172 9-8 182 168
8-9 181 171 9-9 177 170
8-10 188 179 9-10 176 155
8-11 177 172 9-11 169 159
8-12 179 170 9-12 167 1628-13 177 167 9-13 170 164
8-14 175 161 9-14 174 1658-15 176 165 9-15 174 165
8-16 182 170 9-16 174 162
8-17 182 171 9-17 172 162
8-18 186 163 9-18 169 1568-19 180 168 9-19 170 164
8-20 186 179 9-20 165 157
8-21 181 169 9-21 165 156
8-22 187 169 9-22 177 1628-23 188 172 9-23 173 162
8-24 191 180 9-24 173 170
8-25 190 171 9-25 174 164
8-26 181 171 9-26 173 165
a-27 180 174 9-27 176 163
8-28 181 175 9-28 176 163
8-29 181 169 9-29 170 160
8-30 174 172 9-30 172 165
8-31 183 165
108
NWC TP 6988
INITIAL DISTRIBUTION
2 Chief of Naval OperationsOP-413F (1)OP-45 (1)
7 Naval Facilities Engineering Command, AlexandriaNAVFAC-03 (1)NAVFAC-032E (1)NAVFAC-04 (1)NAVFAC-09B (1)NAVFAC-111 (1)NAVFAC-1111B (1)NAVFAC-1113 (1)
2 Nval Sea Systems Command (SEA-09B312)
1 Space and Naval Warfare Systems Command (SPAWAR-005)3 Naval Academy, Annapolis
Director of Research (2)Library (1)
3 Naval Civil Engineering Laboratory, Port HuenemeCommanding Officer (1)Technical Library (1)Code L70PM, D. Holmes (1)
2 Naval Energy and Engiionmental Support Activity, Port HuenemeCode 1101 (1)Code lIlA (1)
I Naval Postgraduate School, Monterey (Library)I Naval War College, Newport
Air Force Academy, Colorado SpringsLibary (1)
Code LGSF (1)1 Civil Engineering Center Tyndall Air Force Base (DEB)
12 Defense Technical Information Center, Alexandria1 Department of Energy, San Francisco Operations, Oakland, CA (J. Crawford)1 Los Alamos National Laboratory, Los Alamos, NM (Reports Library)1 Oak Ridge National Laboratory, Oak Ridge, TN (Energy Division)I Advisory Council on Historic Preservation, Golden, CO1 Associated Universities, Incorporaed, Upton, NY (Brookhaven National Laboratory)2 California Energy Company, Incorporated, Santa Rosa, CA
A. K. Carter, Administrative Manager, Compliance (1)J. L. Moore, Vice President, Exploration (1)
1Laurie S. McClenahan, San Mateo, CA1 Lawrence Berkeley Laboratory, Berkeley, CA
Lone Pine Band of Owens Valley Paiute-Shoshone Indians, Lone Pine, CA1 Native American Heritage Commision, Sacramento, CA
2 State Historic Preservation Office, Sacramento, CA1 The Johns Hopkins University, Applied Physics Laboratory, Laurel, MDI United States Geological Survey, Menlo Park, CA (Library)1 University of Utah Research Institute, Salt Lake City, UT (Earth Sciences Group)1 University of Utah, Salt Lake City, UT (Department of Geology, Dr. J. A. Whelan)