Embed Size (px)
Citation preview
materials
Article
Microstructural Evolution and Phase Formationin 2nd-Generation Refractory-Based HighEntropy Alloys
Eyal Eshed 1, Natalya Larianovsky 1, Alexey Kovalevsky 1, Vladimir Popov Jr. 1, Igor Gorbachev 2,Vladimir Popov 2 and Alexander Katz-Demyanetz 1,*
1 Israel Institute of Metals, Haifa 3200003, Israel; [email protected] (E.E.);[email protected] (N.L.); [email protected] (A.K.); [email protected] (V.P.J.)
2 Institute of Metals Physics Ural Branch of RAS, 620041 Ekaterinburg, Russia; [email protected] (I.G.);[email protected] (V.P.)
* Correspondence: [email protected]; Tel.: +972-4-829-5496
Received: 27 December 2017; Accepted: 22 January 2018; Published: 23 January 2018
Abstract: Refractory-based high entropy alloys (HEAs) of the 2nd-generation type are newintensively-studied materials with a high potential for structural high-temperature applications.This paper presents investigation results on microstructural evolution and phase formation inas-cast and subsequently heat-treated HEAs at various temperature-time regimes. Microstructuralexamination was performed by means of scanning electron microscopy (SEM) combined with theenergy dispersive spectroscopy (EDS) mode of electron probe microanalysis (EPMA) and qualitativeX-ray diffraction (XRD). The primary evolutionary trend observed was the tendency of Zr to graduallysegregate as the temperature rises, while all the other elements eventually dissolve in the BCC solidsolution phase once the onset of Laves phase complex decomposition is reached. The performedthermodynamic modelling was based on the Calculation of Phase Diagrams method (CALPHAD).The BCC A2 solid solution phase is predicted by the model to contain increasing amounts of Cr as thetemperature rises, which is in perfect agreement with the actual results obtained by SEM. However,the model was not able to predict the existence of the Zr-rich phase or the tendency of Zr to segregateand form its own solid solution—most likely as a result of the Zr segregation trend not being anequilibrium phenomenon.
Keywords: high-entropy; refractory; thermodynamics; solid solution; intermetallic phase
1. Introduction
High entropy alloys (HEAs) are, in relative terms, newcomers to the world of metallurgy.These alloys are composed of roughly equimolar proportions of metallic elements [1–3]. There are twomajor types of HEAs, each differing greatly from the other in its physical, chemical, and mechanicalproperties: the FCC HEAs comprise mostly of the late transition metals, while BCC HEAs comprisemostly of refractory metals [1–4]. Ideally, HEAs should possess a single disorderly solid solution phase,which lends them their high entropy characteristic [1].
It is common practice to classify the refractory element-based HEAs according to generations(1st, 2nd, and 3rd) based solely on their chronological formulation. The 1st-generation HEAs werethe original compositions belonging to this family—Mo25Nb25Ta25W25 and Mo20Nb20Ta20V20W20,both are BCC and possess a single solid solution [4,5]. Owing to the resilience of HEAs at hightemperatures, researchers most aspire to apply them in the aerospace industry (such as turbine engineblades). The one significant drawback to such an application is the high density and low corrosionresistance exhibited by the refractory elements, separately or alloyed [5].
Materials 2018, 11, 75; doi:10.3390/ma11020175 www.mdpi.com/journal/materials
Materials 2018, 11, 75 2 of 13
The 2nd- and 3rd-generation HEAs categories relate to the desire of researchers to lower thedensity and impart corrosion resistance to these alloys. To that end, some of the heavier elements,such as W, Mo, and Ta, have been eliminated or reduced in quantity, while passivating elementsthat provide corrosion protection, such as Cr, Ti, Zr, and Al, have been introduced [6,7]. Plasticdeformation involving changes and dislocations of the fine structure evolution occurring throughrolling of Co-, Cr-, Ni-, Fe-, Mn-containing FCC-based cast HEA was studied by Klimova et al. [8].The effect of yttria particle reinforcement on the microstructure and mechanical properties ofCoCrNiFeMn-sintered HEA was investigated by Liu at al. [9]. A positive effect of ceramic reinforcementon high-temperature mechanical properties without a negative effect on tribological properties wasestablished. Feng et al. [10] studied an effect of short-range order in FeCoNi(AlSi)x HEAs on themagnetic properties and found a good coincidence between the experimental results and the results ofa Monte Carlo simulation of the nearest neighbor distribution, as well as between the elastic modulusand magnetic moment.
Second-generation, which are the subject of this publication, usually comprise at least one ofthe core refractory elements, namely Nb, while incorporating elements which fall under the widerdefinition of refractory elements (elements which share only some of their attributes with the refractoryelement, such as a high melting point), such as Cr, Ti, V, Zr, and Hf.
This alteration of composition in the 2nd-generation HEA results in the emergence of severalphases, some of which having intermetallic nature, in the microstructure. From a thermodynamicstandpoint, the stability of the multi-phase microstructure originates in a total high negative enthalpy offormation, which offsets the high entropy of the solid solution form, thereby enabling a highly-negativeGibbs free energy of formation for the multi-phase form. Having said that, at a sufficiently hightemperature the entropy component of the free Gibbs energy (−T∆S f ) for the single solid solutionform becomes so negative that it turns into the stable form.
The purpose of this publication is to investigate the effect of the rise in temperatures over themicrostructure of two 2nd generation HEAs—
Cr20Nb20Ti20V20Zr20
Cr20Mo10Nb20Ti20Ta10Zr20
2. Results
2.1. Cr20Nb20Ti20V20Zr20 Alloy
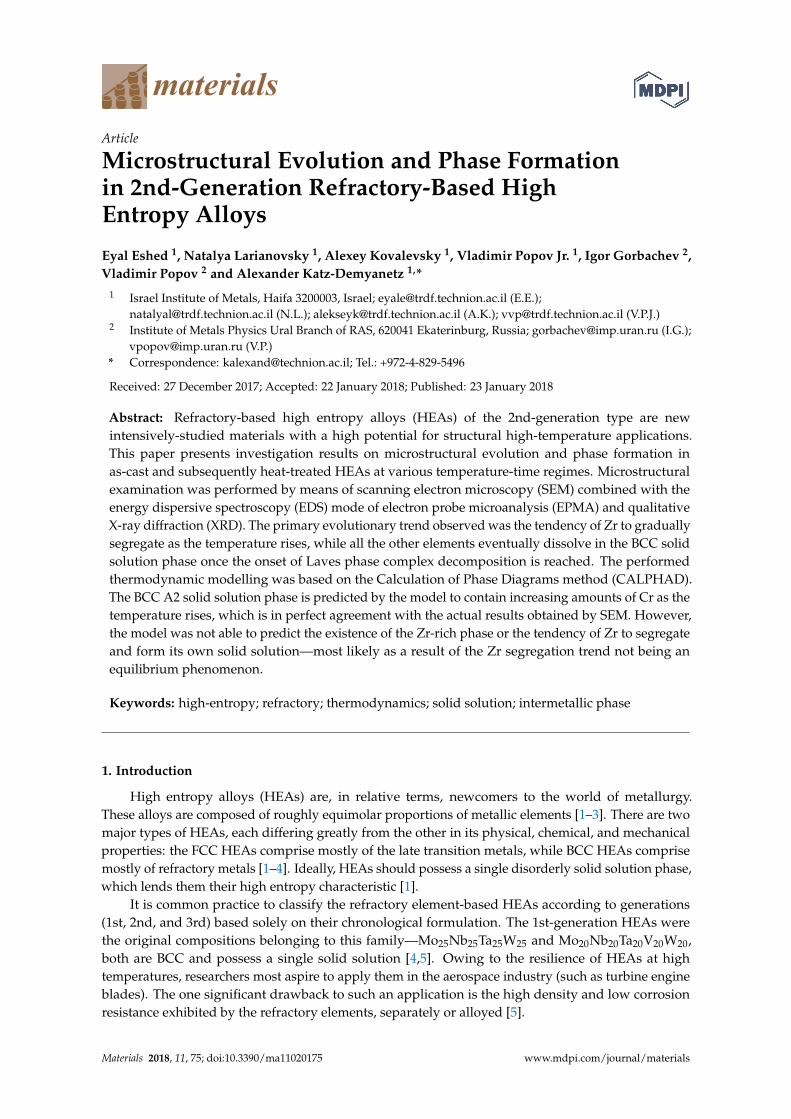
The following figures (Figure 1a–d) show the microstructure of the alloy at designatedtemperatures (i.e., the thermally-treated products) as captured by scanning electron microscopy(SEM). The associated phase compositions and fractions represent the approximated stoichiometry(based on energy dispersive spectroscopy (EDS) measurements) and volume percentages respectively.Parentheses in phase identification indicate substantial amounts of dissolved elements.
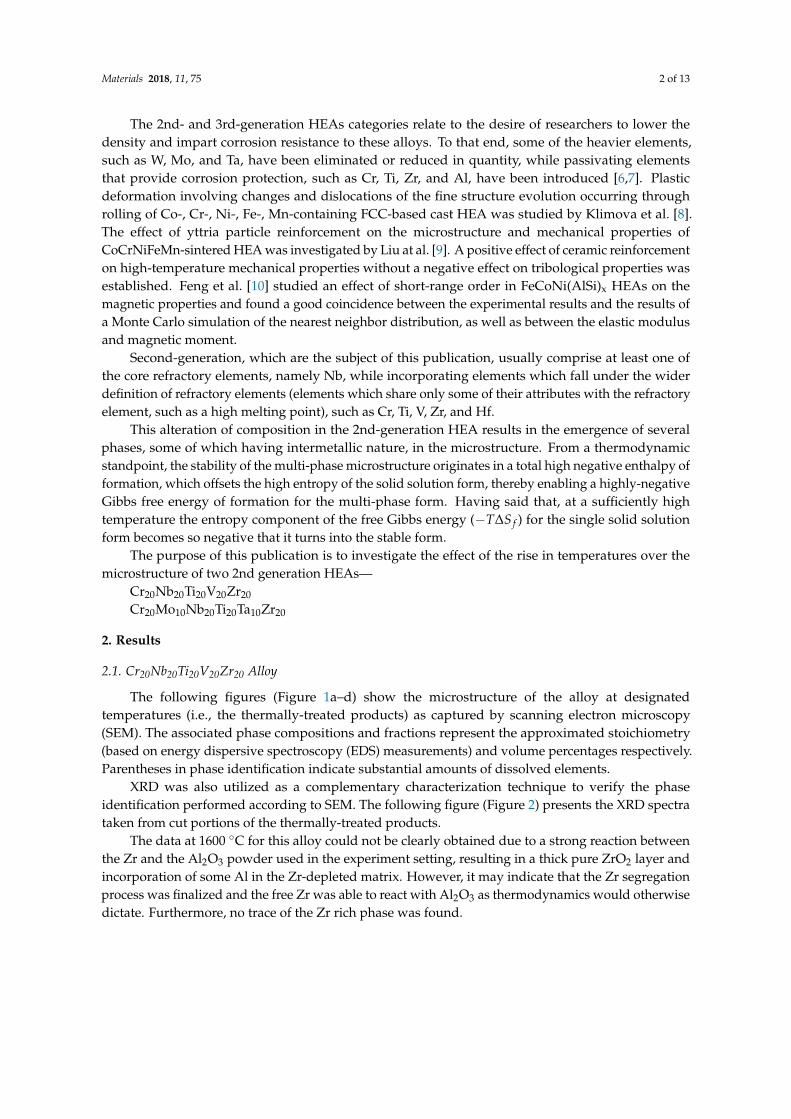
XRD was also utilized as a complementary characterization technique to verify the phaseidentification performed according to SEM. The following figure (Figure 2) presents the XRD spectrataken from cut portions of the thermally-treated products.
The data at 1600 ◦C for this alloy could not be clearly obtained due to a strong reaction betweenthe Zr and the Al2O3 powder used in the experiment setting, resulting in a thick pure ZrO2 layer andincorporation of some Al in the Zr-depleted matrix. However, it may indicate that the Zr segregationprocess was finalized and the free Zr was able to react with Al2O3 as thermodynamics would otherwisedictate. Furthermore, no trace of the Zr rich phase was found.
Materials 2018, 11, 75 3 of 13Materials 2018, 11, x FOR PEER REVIEW 3 of 14
(a) (b)
1—NbTiZr(V) (BCC solid solution)—45% 2—(Nb, Zr)Cr2, ZrV2 (Intermetallic)—55%
1—NbTiZr(V) (BCC solid solution)—45% 2—(Nb, Zr)Cr2, ZrV2 (Intermetallic)—55%
(c) (d)
1—NbTiZr(V) (BCC solid solution)— 04 % 2—(Nb, Zr)Cr2, ZrV2 (Intermetallic)—60%
1—Zr6Cr3V2 (Intermetallic)—15% 2—NbTiV(ZrCr) (BCC solid solution)—45% 3—(Nb, Zr)Cr2, ZrV2 (Intermetallic)—40%
Figure 1. SEM micrographs of Cr20Nb20Ti20V20Zr20 at (a) 25 °C, (b) 800 °C, (c) 1000 °C, and (d) 1300 °C at 1000× magnification in BSE mode.
XRD was also utilized as a complementary characterization technique to verify the phase identification performed according to SEM. The following figure (Figure 2) presents the XRD spectra taken from cut portions of the thermally-treated products.
Figure 1. SEM micrographs of Cr20Nb20Ti20V20Zr20 at (a) 25 ◦C, (b) 800 ◦C, (c) 1000 ◦C, and (d) 1300 ◦Cat 1000×magnification in BSE mode.
Materials 2018, 11, x FOR PEER REVIEW 4 of 14
Figure 2. XRD traces of the Cr20Nb20Ti20V20Zr20 alloy at 25 °C, 1000 °C, and 1300 °C; the shifts in 2θ values of certain peaks as a result of the rising temperature are marked in arrows.
The data at 1600 °C for this alloy could not be clearly obtained due to a strong reaction between the Zr and the Al2O3 powder used in the experiment setting, resulting in a thick pure ZrO2 layer and incorporation of some Al in the Zr-depleted matrix. However, it may indicate that the Zr segregation process was finalized and the free Zr was able to react with Al2O3 as thermodynamics would otherwise dictate. Furthermore, no trace of the Zr rich phase was found.
2.2. Cr20Mo10Nb20Ta10Ti20Zr20 Alloy
The following figures (Figures 3–7) display the microstructure of this alloy at the designated temperatures as captured by SEM. The associated volume fractions of each phase are presented. Parentheses in the phase identification indicate substantial amounts of dissolved elements.
(a) (b)
1—CrMo2Nb4Ta2Ti2Zr (BCC solid solution)—40% 2—NbTiZr (BCC solid solution)—15% 3—(Nb, Zr, Ta, Ti)Cr2, ZrMo2 (Intermetallic)—45%
Figure 3. SEM micrograph of Cr20Mo10Nb20Ta10Ti20Zr20 at 25 °C at (a) 1000× and (b) 4000× magnifications in BSE mode.
Figure 2. XRD traces of the Cr20Nb20Ti20V20Zr20 alloy at 25 ◦C, 1000 ◦C, and 1300 ◦C; the shifts in 2θvalues of certain peaks as a result of the rising temperature are marked in arrows.

Materials 2018, 11, 75 4 of 13
2.2. Cr20Mo10Nb20Ta10Ti20Zr20 Alloy
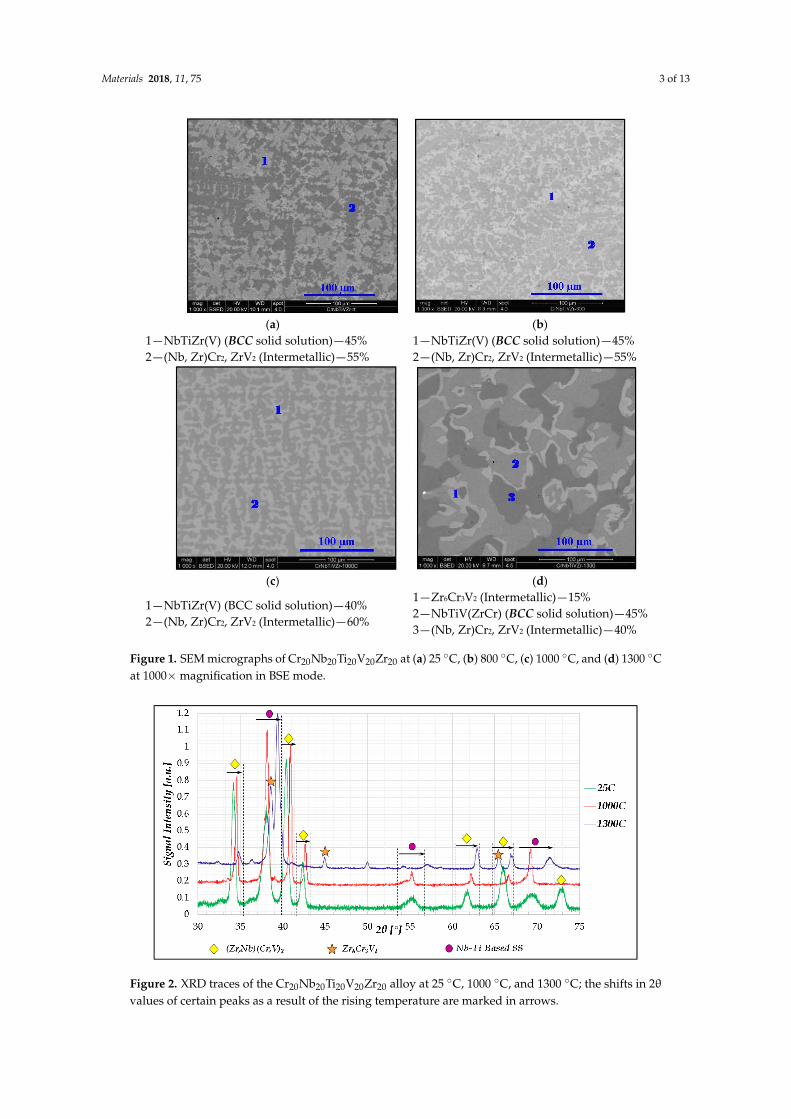
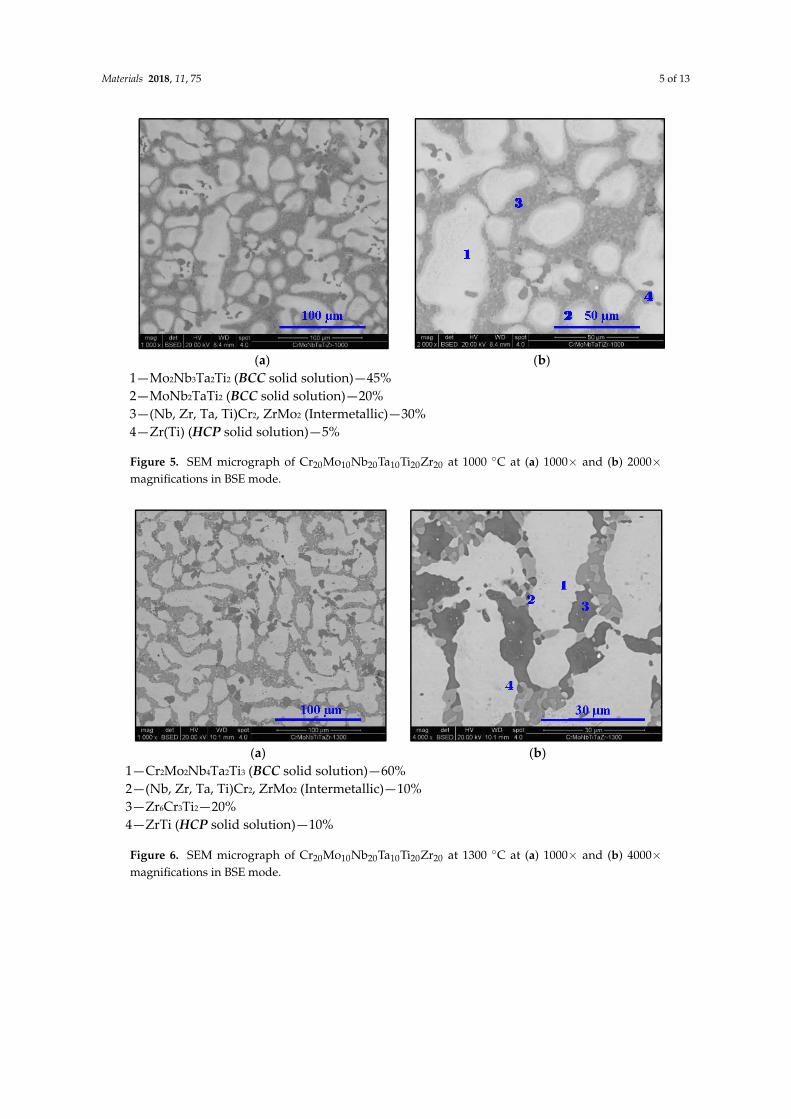
The following figures (Figures 3–7) display the microstructure of this alloy at the designatedtemperatures as captured by SEM. The associated volume fractions of each phase are presented.Parentheses in the phase identification indicate substantial amounts of dissolved elements.
Materials 2018, 11, x FOR PEER REVIEW 4 of 14
Figure 2. XRD traces of the Cr20Nb20Ti20V20Zr20 alloy at 25 °C, 1000 °C, and 1300 °C; the shifts in 2θ values of certain peaks as a result of the rising temperature are marked in arrows.
The data at 1600 °C for this alloy could not be clearly obtained due to a strong reaction between the Zr and the Al2O3 powder used in the experiment setting, resulting in a thick pure ZrO2 layer and incorporation of some Al in the Zr-depleted matrix. However, it may indicate that the Zr segregation process was finalized and the free Zr was able to react with Al2O3 as thermodynamics would otherwise dictate. Furthermore, no trace of the Zr rich phase was found.
2.2. Cr20Mo10Nb20Ta10Ti20Zr20 Alloy
The following figures (Figures 3–7) display the microstructure of this alloy at the designated temperatures as captured by SEM. The associated volume fractions of each phase are presented. Parentheses in the phase identification indicate substantial amounts of dissolved elements.
(a) (b)
1—CrMo2Nb4Ta2Ti2Zr (BCC solid solution)—40% 2—NbTiZr (BCC solid solution)—15% 3—(Nb, Zr, Ta, Ti)Cr2, ZrMo2 (Intermetallic)—45%
Figure 3. SEM micrograph of Cr20Mo10Nb20Ta10Ti20Zr20 at 25 °C at (a) 1000× and (b) 4000× magnifications in BSE mode.
Figure 3. SEM micrograph of Cr20Mo10Nb20Ta10Ti20Zr20 at 25 ◦C at (a) 1000× and (b) 4000×magnifications in BSE mode.Materials 2018, 11, x FOR PEER REVIEW 5 of 14
(a) (b)
1—MoNb2TaTi2(ZrCr) (BCC solid solution)—40% 2—(Nb, Zr, Ta, Ti)Cr2, ZrMo2 (Intermetallic)—45% 3—Zr(Ti) (HCP solid solution)—15%
Figure 4. SEM micrograph of Cr20Mo10Nb20Ta10Ti20Zr20 at 800 °C at (a) 1000× and (b) 8000× magnifications in BSE mode.
(a) (b)1—Mo2Nb3Ta2Ti2 (BCC solid solution)—45% 2—MoNb2TaTi2 (BCC solid solution)—20% 3—(Nb, Zr, Ta, Ti)Cr2, ZrMo2 (Intermetallic)—30% 4—Zr(Ti) (HCP solid solution)—5%
Figure 5. SEM micrograph of Cr20Mo10Nb20Ta10Ti20Zr20 at 1000 °C at (a) 1000× and (b) 2000× magnifications in BSE mode.
Figure 4. SEM micrograph of Cr20Mo10Nb20Ta10Ti20Zr20 at 800 ◦C at (a) 1000× and (b) 8000×magnifications in BSE mode.
Materials 2018, 11, 75 5 of 13
Materials 2018, 11, x FOR PEER REVIEW 5 of 14
(a) (b)
1—MoNb2TaTi2(ZrCr) (BCC solid solution)—40% 2—(Nb, Zr, Ta, Ti)Cr2, ZrMo2 (Intermetallic)—45% 3—Zr(Ti) (HCP solid solution)—15%
Figure 4. SEM micrograph of Cr20Mo10Nb20Ta10Ti20Zr20 at 800 °C at (a) 1000× and (b) 8000× magnifications in BSE mode.
(a) (b)1—Mo2Nb3Ta2Ti2 (BCC solid solution)—45% 2—MoNb2TaTi2 (BCC solid solution)—20% 3—(Nb, Zr, Ta, Ti)Cr2, ZrMo2 (Intermetallic)—30% 4—Zr(Ti) (HCP solid solution)—5%
Figure 5. SEM micrograph of Cr20Mo10Nb20Ta10Ti20Zr20 at 1000 °C at (a) 1000× and (b) 2000× magnifications in BSE mode.
Figure 5. SEM micrograph of Cr20Mo10Nb20Ta10Ti20Zr20 at 1000 ◦C at (a) 1000× and (b) 2000×magnifications in BSE mode.Materials 2018, 11, x FOR PEER REVIEW 6 of 14
(a) (b)1—Cr2Mo2Nb4Ta2Ti3 (BCC solid solution)—60% 2—(Nb, Zr, Ta, Ti)Cr2, ZrMo2 (Intermetallic)—10% 3—Zr6Cr3Ti2—20% 4—ZrTi (HCP solid solution)—10%
Figure 6. SEM micrograph of Cr20Mo10Nb20Ta10Ti20Zr20 at 1300 °C at (a) 1000× and (b) 4000× magnifications in BSE mode.
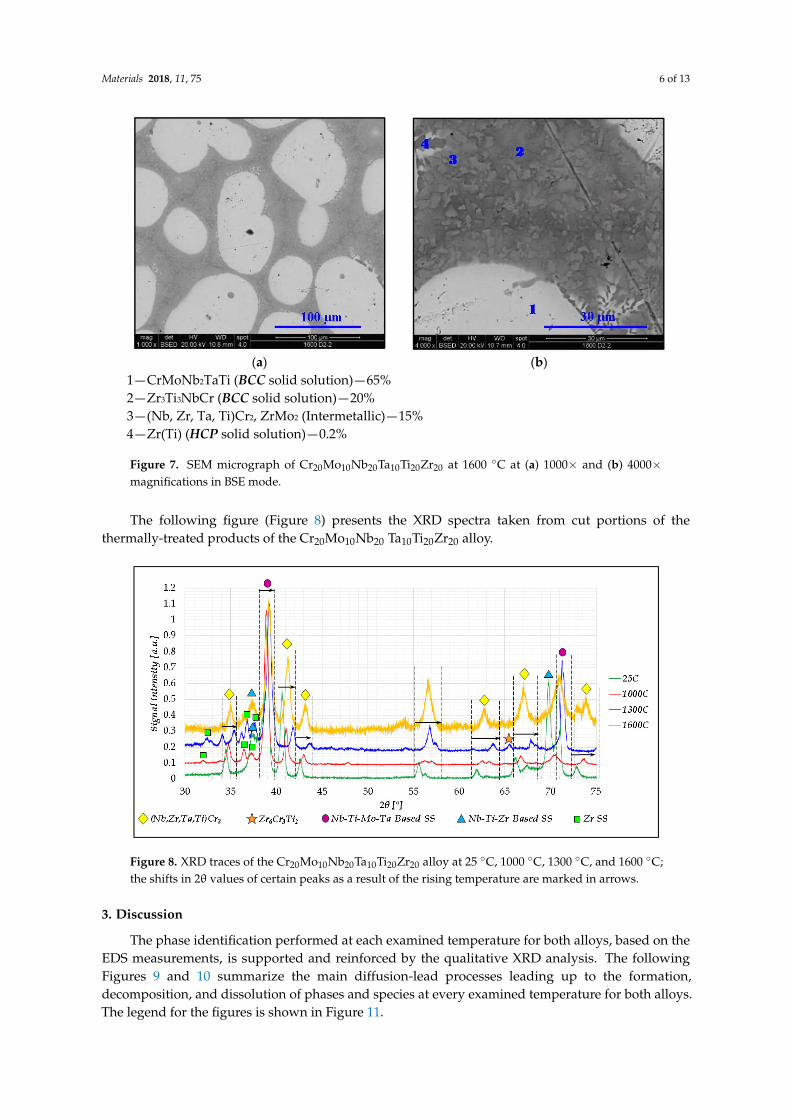
(a) (b)1—CrMoNb2TaTi (BCC solid solution)—65% 2—Zr3Ti3NbCr (BCC solid solution)—20% 3—(Nb, Zr, Ta, Ti)Cr2, ZrMo2 (Intermetallic)—15% 4—Zr(Ti) (HCP solid solution)—0.2%
Figure 7. SEM micrograph of Cr20Mo10Nb20Ta10Ti20Zr20 at 1600 °C at (a) 1000× and (b) 4000× magnifications in BSE mode.
The following figure (Figure 8) presents the XRD spectra taken from cut portions of the thermally-treated products of the Cr20Mo10Nb20 Ta10Ti20Zr20 alloy.
Figure 6. SEM micrograph of Cr20Mo10Nb20Ta10Ti20Zr20 at 1300 ◦C at (a) 1000× and (b) 4000×magnifications in BSE mode.
Materials 2018, 11, 75 6 of 13
Materials 2018, 11, x FOR PEER REVIEW 6 of 14
(a) (b)1—Cr2Mo2Nb4Ta2Ti3 (BCC solid solution)—60% 2—(Nb, Zr, Ta, Ti)Cr2, ZrMo2 (Intermetallic)—10% 3—Zr6Cr3Ti2—20% 4—ZrTi (HCP solid solution)—10%
Figure 6. SEM micrograph of Cr20Mo10Nb20Ta10Ti20Zr20 at 1300 °C at (a) 1000× and (b) 4000× magnifications in BSE mode.
(a) (b)1—CrMoNb2TaTi (BCC solid solution)—65% 2—Zr3Ti3NbCr (BCC solid solution)—20% 3—(Nb, Zr, Ta, Ti)Cr2, ZrMo2 (Intermetallic)—15% 4—Zr(Ti) (HCP solid solution)—0.2%
Figure 7. SEM micrograph of Cr20Mo10Nb20Ta10Ti20Zr20 at 1600 °C at (a) 1000× and (b) 4000× magnifications in BSE mode.
The following figure (Figure 8) presents the XRD spectra taken from cut portions of the thermally-treated products of the Cr20Mo10Nb20 Ta10Ti20Zr20 alloy.
Figure 7. SEM micrograph of Cr20Mo10Nb20Ta10Ti20Zr20 at 1600 ◦C at (a) 1000× and (b) 4000×magnifications in BSE mode.
The following figure (Figure 8) presents the XRD spectra taken from cut portions of thethermally-treated products of the Cr20Mo10Nb20 Ta10Ti20Zr20 alloy.Materials 2018, 11, x FOR PEER REVIEW 7 of 14
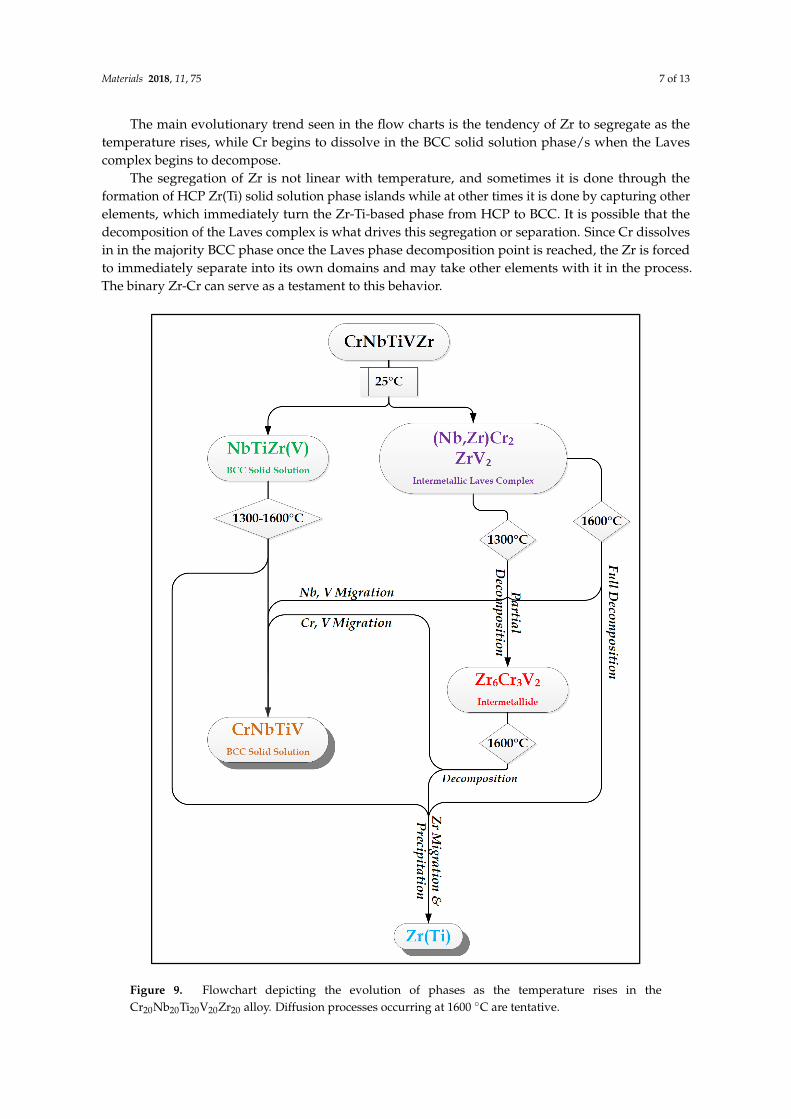
Figure 8. XRD traces of the Cr20Mo10Nb20Ta10Ti20Zr20 alloy at 25 °C, 1000 °C, 1300 °C, and 1600 °C; the shifts in 2θ values of certain peaks as a result of the rising temperature are marked in arrows.
3. Discussion
The phase identification performed at each examined temperature for both alloys, based on the EDS measurements, is supported and reinforced by the qualitative XRD analysis. The following Figures 9 and 10 summarize the main diffusion-lead processes leading up to the formation, decomposition, and dissolution of phases and species at every examined temperature for both alloys. The legend for the figures is shown in Figure 11.
Figure 8. XRD traces of the Cr20Mo10Nb20Ta10Ti20Zr20 alloy at 25 ◦C, 1000 ◦C, 1300 ◦C, and 1600 ◦C;the shifts in 2θ values of certain peaks as a result of the rising temperature are marked in arrows.
3. Discussion
The phase identification performed at each examined temperature for both alloys, based on theEDS measurements, is supported and reinforced by the qualitative XRD analysis. The followingFigures 9 and 10 summarize the main diffusion-lead processes leading up to the formation,decomposition, and dissolution of phases and species at every examined temperature for both alloys.The legend for the figures is shown in Figure 11.
Materials 2018, 11, 75 7 of 13
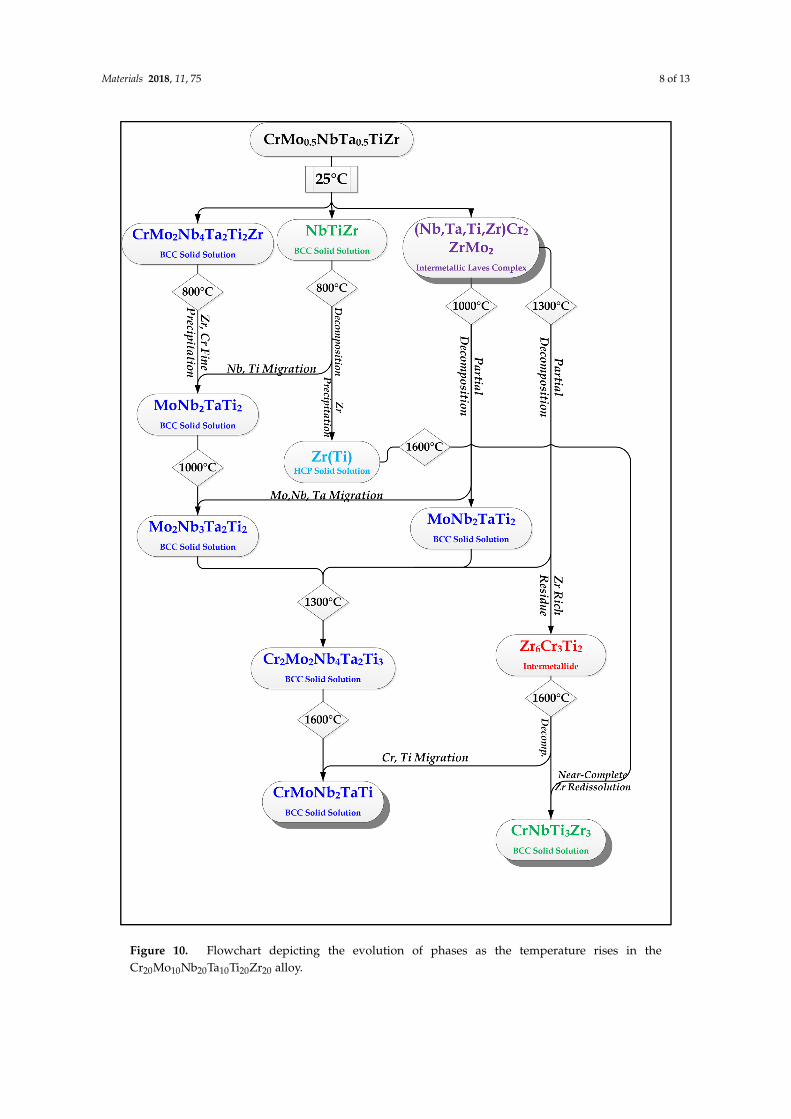
The main evolutionary trend seen in the flow charts is the tendency of Zr to segregate as thetemperature rises, while Cr begins to dissolve in the BCC solid solution phase/s when the Lavescomplex begins to decompose.
The segregation of Zr is not linear with temperature, and sometimes it is done through theformation of HCP Zr(Ti) solid solution phase islands while at other times it is done by capturing otherelements, which immediately turn the Zr-Ti-based phase from HCP to BCC. It is possible that thedecomposition of the Laves complex is what drives this segregation or separation. Since Cr dissolvesin in the majority BCC phase once the Laves phase decomposition point is reached, the Zr is forcedto immediately separate into its own domains and may take other elements with it in the process.The binary Zr-Cr can serve as a testament to this behavior.Materials 2018, 11, x FOR PEER REVIEW 8 of 14
Figure 9. Flowchart depicting the evolution of phases as the temperature rises in the Cr20Nb20Ti20V20Zr20 alloy. Diffusion processes occurring at 1600 °C are tentative. Figure 9. Flowchart depicting the evolution of phases as the temperature rises in the
Cr20Nb20Ti20V20Zr20 alloy. Diffusion processes occurring at 1600 ◦C are tentative.
Materials 2018, 11, 75 8 of 13
Materials 2018, 11, x FOR PEER REVIEW 9 of 14
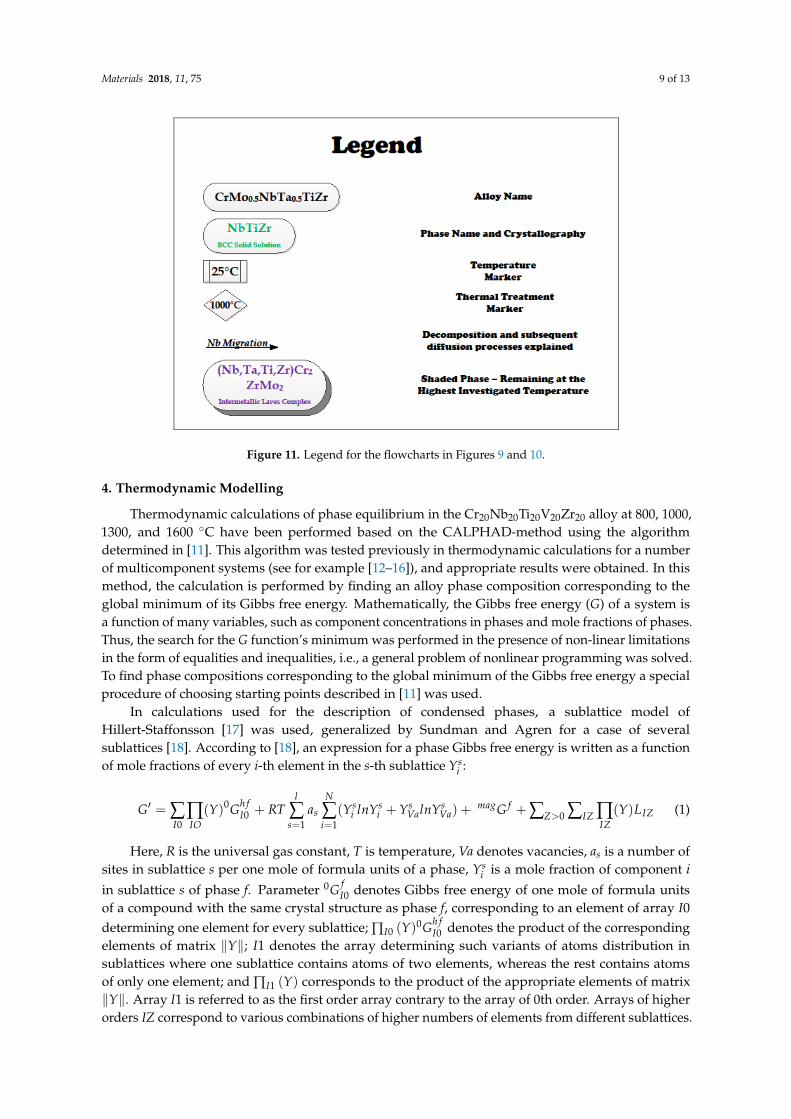
Figure 10. Flowchart depicting the evolution of phases as the temperature rises in the Cr20Mo10Nb20Ta10Ti20Zr20 alloy. Figure 10. Flowchart depicting the evolution of phases as the temperature rises in theCr20Mo10Nb20Ta10Ti20Zr20 alloy.
Materials 2018, 11, 75 9 of 13
Materials 2018, 11, x FOR PEER REVIEW 10 of 14
Figure 11. Legend for the flowcharts in Figures 9 and 10.
The main evolutionary trend seen in the flow charts is the tendency of Zr to segregate as the temperature rises, while Cr begins to dissolve in the BCC solid solution phase/s when the Laves complex begins to decompose.
The segregation of Zr is not linear with temperature, and sometimes it is done through the formation of HCP Zr(Ti) solid solution phase islands while at other times it is done by capturing other elements, which immediately turn the Zr-Ti-based phase from HCP to BCC. It is possible that the decomposition of the Laves complex is what drives this segregation or separation. Since Cr dissolves in in the majority BCC phase once the Laves phase decomposition point is reached, the Zr is forced to immediately separate into its own domains and may take other elements with it in the process. The binary Zr-Cr can serve as a testament to this behavior.
4. Thermodynamic Modelling
Thermodynamic calculations of phase equilibrium in the Cr20Nb20Ti20V20Zr20 alloy at 800, 1000, 1300, and 1600 °C have been performed based on the CALPHAD-method using the algorithm determined in [11]. This algorithm was tested previously in thermodynamic calculations for a number of multicomponent systems (see for example [12–16]), and appropriate results were obtained. In this method, the calculation is performed by finding an alloy phase composition corresponding to the global minimum of its Gibbs free energy. Mathematically, the Gibbs free energy (G) of a system is a function of many variables, such as component concentrations in phases and mole fractions of phases. Thus, the search for the G function’s minimum was performed in the presence of non-linear limitations in the form of equalities and inequalities, i.e., a general problem of nonlinear programming was solved. To find phase compositions corresponding to the global minimum of the Gibbs free energy a special procedure of choosing starting points described in [11] was used.
In calculations used for the description of condensed phases, a sublattice model of Hillert-Staffonsson [17] was used, generalized by Sundman and Agren for a case of several sublattices [18]. According to [18], an expression for a phase Gibbs free energy is written as a function of mole fractions of every i-th element in the s-th sublattice s
iY :
= ( ) + ( + )+ + ( ) (1)
Figure 11. Legend for the flowcharts in Figures 9 and 10.
4. Thermodynamic Modelling
Thermodynamic calculations of phase equilibrium in the Cr20Nb20Ti20V20Zr20 alloy at 800, 1000,1300, and 1600 ◦C have been performed based on the CALPHAD-method using the algorithmdetermined in [11]. This algorithm was tested previously in thermodynamic calculations for a numberof multicomponent systems (see for example [12–16]), and appropriate results were obtained. In thismethod, the calculation is performed by finding an alloy phase composition corresponding to theglobal minimum of its Gibbs free energy. Mathematically, the Gibbs free energy (G) of a system isa function of many variables, such as component concentrations in phases and mole fractions of phases.Thus, the search for the G function’s minimum was performed in the presence of non-linear limitationsin the form of equalities and inequalities, i.e., a general problem of nonlinear programming was solved.To find phase compositions corresponding to the global minimum of the Gibbs free energy a specialprocedure of choosing starting points described in [11] was used.
In calculations used for the description of condensed phases, a sublattice model ofHillert-Staffonsson [17] was used, generalized by Sundman and Agren for a case of severalsublattices [18]. According to [18], an expression for a phase Gibbs free energy is written as a functionof mole fractions of every i-th element in the s-th sublattice Ys
i :
G′ = ∑I0
∏IO
(Y)0Gh fI0 + RT
l
∑s=1
as
N
∑i=1
(Ysi lnYs
i + YsValnYs
Va) +magG f + ∑Z>0 ∑IZ ∏
IZ(Y)LIZ (1)
Here, R is the universal gas constant, T is temperature, Va denotes vacancies, as is a number ofsites in sublattice s per one mole of formula units of a phase, Ys
i is a mole fraction of component i
in sublattice s of phase f. Parameter 0G fI0 denotes Gibbs free energy of one mole of formula units
of a compound with the same crystal structure as phase f, corresponding to an element of array I0determining one element for every sublattice; ∏I0 (Y)0Gh f
I0 denotes the product of the correspondingelements of matrix ‖Y‖; I1 denotes the array determining such variants of atoms distribution insublattices where one sublattice contains atoms of two elements, whereas the rest contains atomsof only one element; and ∏I1 (Y) corresponds to the product of the appropriate elements of matrix‖Y‖. Array I1 is referred to as the first order array contrary to the array of 0th order. Arrays of higherorders IZ correspond to various combinations of higher numbers of elements from different sublattices.
Materials 2018, 11, 75 10 of 13
Parameters LIZ characterize the interaction energy of components of the corresponding element ofarray IZ.
For a liquid phase a model of regular solution was used, according to which its molar Gibbsenergy is expressed as follows:
GL = ∑i
XL0i GL
i + RT ∑Ni=1 XL
i lnXLi + ∑Z ∑IZ ∏
IZ(X)LL
IZ (2)
where XLi is the mole fraction of the ith component in a liquid phase; 0GL
i is the molar Gibbs energy ofpure component i in a liquid state; and LL
IZ are the solution parameters.Nowadays, the CALPHAD method is most widely used for thermodynamic description of
concentration dependences of thermodynamic properties of phases. A distinguishing feature of theCALPHAD method is that the thermodynamic description of high order systems is based on thoseof lower order systems. To ensure mutual consistency of different systems of higher orders, similardescriptions of lower order systems are used.
As a rule, for the thermodynamic description of multicomponent systems the procedure is asfollows: Firstly, the thermodynamic descriptions of binary systems are summed. Then, they aresupplemented with interaction parameters of third, fourth and higher orders taking into accountspecific features of three-component systems, four-component systems, etc. However, the availableexperimental data and thermodynamic descriptions are often not enough for doing so. In this case,the lacking parameters are assumed equal to zero.
The thermodynamic description of the Cr-Nb-Ti-V-Zr system was performed this way. Accordingto the available literature data, there are sufficient descriptions of sub-systems belonging to this system.For the thermodynamic description of the Cr-Nb-Ti-V-Zr system, we preferred the data, which is basedon the SGTE database for pure elements [19], which are maximally formally consistent with each otherand take into account up-to-date experimental information. There are thermodynamic descriptions forall binary systems involved. For the systems Cr-Nb, Cr-Zr, and Nb-Zr the thermodynamic data wastaken from [20], for the Ti-Zr, V-Zr, and Ti-V systems, the source was [21]; for Cr-Ti and Cr-V the sourcewas [22]; for Nb-Ti we used the findings of [23]; and for Nb-V the data was based on publication [24].Parameters of third-order interactions are available only for three systems: Cr-Ti-Zr [10], Ti-V-Zr [21],and Cr-Nb-Ti [22], and the data on fourth-order parameters are absent in the literature. The lack of dataon considerable number of thermodynamic parameters could surely affect the calculation accuracy,and that is why the obtained thermodynamic description and corresponding calculations should beconsidered only as the first approach.
The formation possibility of the following phases was taken into account in calculations: liquidphase, solid solutions with BBC and HCP crystal lattices, and Laves phases C14, C15, and C36.
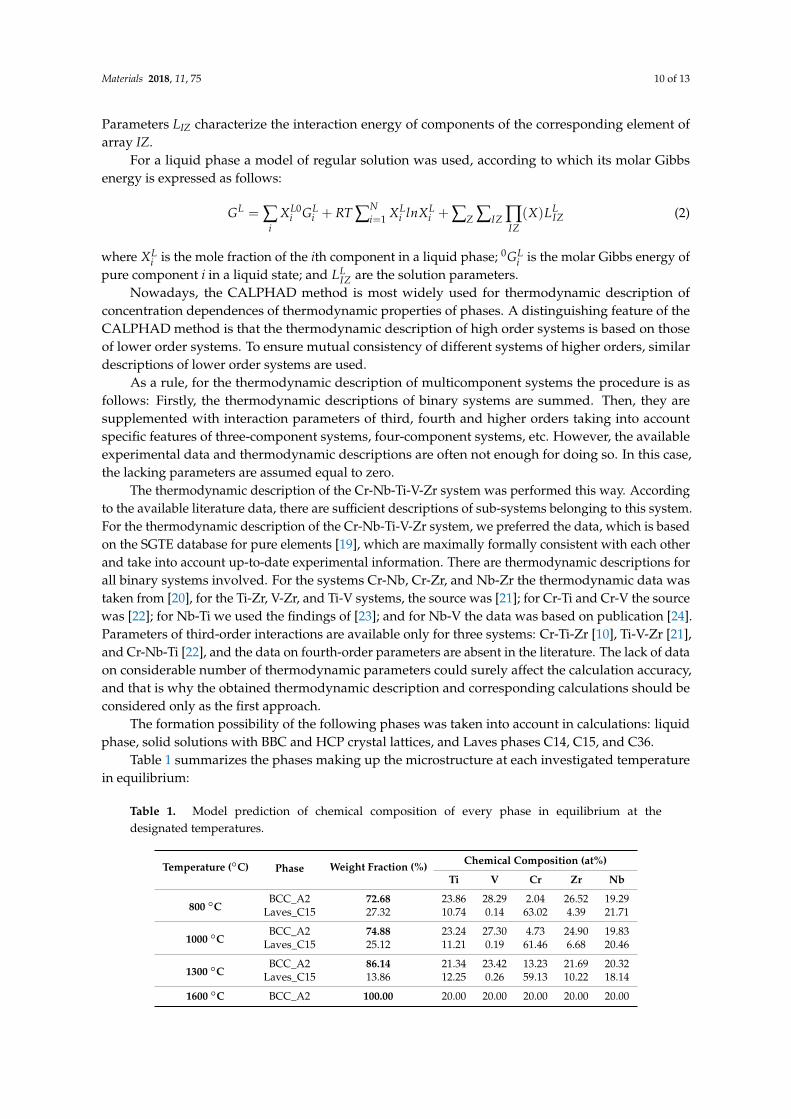
Table 1 summarizes the phases making up the microstructure at each investigated temperaturein equilibrium:
Table 1. Model prediction of chemical composition of every phase in equilibrium at thedesignated temperatures.
Temperature (◦C) Phase Weight Fraction (%) Chemical Composition (at%)
Ti V Cr Zr Nb
800 ◦CBCC_A2 72.68 23.86 28.29 2.04 26.52 19.29
Laves_C15 27.32 10.74 0.14 63.02 4.39 21.71
1000 ◦CBCC_A2 74.88 23.24 27.30 4.73 24.90 19.83
Laves_C15 25.12 11.21 0.19 61.46 6.68 20.46
1300 ◦CBCC_A2 86.14 21.34 23.42 13.23 21.69 20.32
Laves_C15 13.86 12.25 0.26 59.13 10.22 18.14
1600 ◦C BCC_A2 100.00 20.00 20.00 20.00 20.00 20.00
Materials 2018, 11, 75 11 of 13
The general increasing trend of the solid solution content as the temperature rises, which ispredicted by the model, is in line with the actual findings of the scanning electron microscopy analyses;however, the absolute values do not correlate.
Furthermore, The BCC A2 solid solution phase is predicted by the model to contain increasingamounts of Cr as the temperature rises, which is in agreement with the actual results.
The tendency of Zr to gradually segregate, forming a Zr-rich phase and its own solid solution(with some dissolved Ti) is probably a non-equilibrium process resulting from the “frozen” state ofthe as-cast products, which solidified relatively quickly after arc melting. In other words, the thermaltreatments only serve as a means to relieve the stresses that exist in the as-cast products and enablesome diffusion, to a degree the specific temperature permits. These diffusion processes can only bringthe microstructure closer to equilibrium state but cannot fully reach it, especially at low temperatures.
Additionally, the Laves complex phase is predicted to consist mostly of NbCr2 with negligible Vamounts, which is not the actual case (it consists mostly of ZrCr2 and ZrV2).
5. Materials and Methods
All materials used for the research have been supplied by Holland Moran Ltd. (Yahud, Israel)The first stage of the experiments consisted of alloying. Both alloys were prepared in MaterialsResearch Furnaces Inc. vacuum arc melting furnace produced in Allenstown, NH, USA modelABJ-900-1-VD-LL-02/GG-VAC-BF, while the nominal mixtures of the corresponding elements wereused. All elements had a purity of 99.5%. Arc melting was conducted on a water-cooled copper plate.High-purity molten titanium was used as a getter for residual oxygen, nitrogen, and hydrogen.
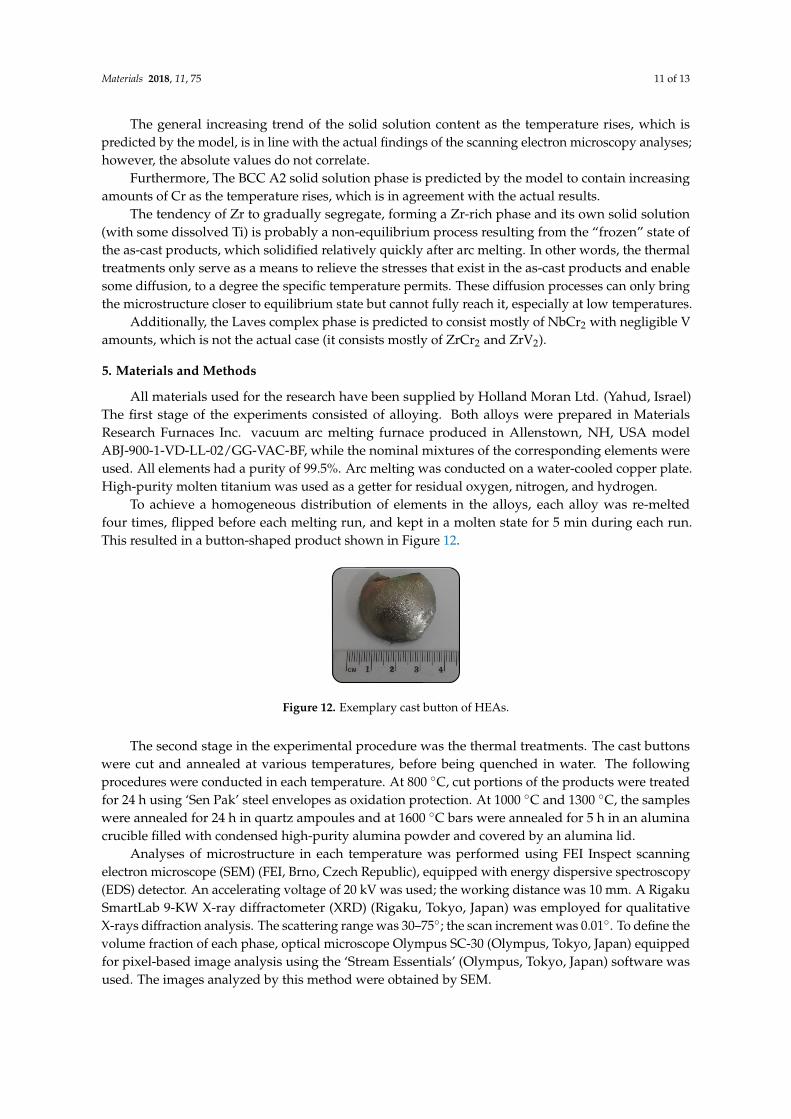
To achieve a homogeneous distribution of elements in the alloys, each alloy was re-meltedfour times, flipped before each melting run, and kept in a molten state for 5 min during each run.This resulted in a button-shaped product shown in Figure 12.
Materials 2018, 11, x FOR PEER REVIEW 12 of 14
Table 1. Model prediction of chemical composition of every phase in equilibrium at the designated temperatures.
Temperature (°C) Phase Weight Fraction (%) Chemical Composition (at%)
Ti V Cr Zr Nb
800 °C BCC_A2 72.68 23.86 28.29 2.04 26.52 19.29 Laves_C15 27.32 10.74 0.14 63.02 4.39 21.71
1000 °C BCC_A2 74.88 23.24 27.30 4.73 24.90 19.83 Laves_C15 25.12 11.21 0.19 61.46 6.68 20.46
1300 °C BCC_A2 86.14 21.34 23.42 13.23 21.69 20.32 Laves_C15 13.86 12.25 0.26 59.13 10.22 18.14
1600 °C BCC_A2 100.00 20.00 20.00 20.00 20.00 20.00
The general increasing trend of the solid solution content as the temperature rises, which is predicted by the model, is in line with the actual findings of the scanning electron microscopy analyses; however, the absolute values do not correlate.
Furthermore, The BCC A2 solid solution phase is predicted by the model to contain increasing amounts of Cr as the temperature rises, which is in agreement with the actual results.
The tendency of Zr to gradually segregate, forming a Zr-rich phase and its own solid solution (with some dissolved Ti) is probably a non-equilibrium process resulting from the “frozen” state of the as-cast products, which solidified relatively quickly after arc melting. In other words, the thermal treatments only serve as a means to relieve the stresses that exist in the as-cast products and enable some diffusion, to a degree the specific temperature permits. These diffusion processes can only bring the microstructure closer to equilibrium state but cannot fully reach it, especially at low temperatures.
Additionally, the Laves complex phase is predicted to consist mostly of NbCr2 with negligible V amounts, which is not the actual case (it consists mostly of ZrCr2 and ZrV2).
5. Materials and Methods
All materials used for the research have been supplied by Holland Moran Ltd. (Yahud, Israel) The first stage of the experiments consisted of alloying. Both alloys were prepared in Materials Research Furnaces Inc. vacuum arc melting furnace produced in Allenstown (NH, USA) model ABJ-900-1-VD-LL-02/GG-VAC-BF, while the nominal mixtures of the corresponding elements were used. All elements had a purity of 99.5%. Arc melting was conducted on a water-cooled copper plate. High-purity molten titanium was used as a getter for residual oxygen, nitrogen, and hydrogen.
To achieve a homogeneous distribution of elements in the alloys, each alloy was re-melted four times, flipped before each melting run, and kept in a molten state for 5 min during each run .This resulted in a button-shaped product shown in Figure 12.
Figure 12. Exemplary cast button of HEAs.
The second stage in the experimental procedure was the thermal treatments. The cast buttons were cut and annealed at various temperatures, before being quenched in water. The following procedures were conducted in each temperature. At 800 °C, cut portions of the products were treated for 24 h using ‘Sen Pak’ steel envelopes as oxidation protection. At 1000 °C and 1300 °C, the samples were annealed for 24 h in quartz ampoules and at 1600 °C bars were annealed for 5 h in an alumina crucible filled with condensed high-purity alumina powder and covered by an alumina lid.
Figure 12. Exemplary cast button of HEAs.
The second stage in the experimental procedure was the thermal treatments. The cast buttonswere cut and annealed at various temperatures, before being quenched in water. The followingprocedures were conducted in each temperature. At 800 ◦C, cut portions of the products were treatedfor 24 h using ‘Sen Pak’ steel envelopes as oxidation protection. At 1000 ◦C and 1300 ◦C, the sampleswere annealed for 24 h in quartz ampoules and at 1600 ◦C bars were annealed for 5 h in an aluminacrucible filled with condensed high-purity alumina powder and covered by an alumina lid.
Analyses of microstructure in each temperature was performed using FEI Inspect scanningelectron microscope (SEM) (FEI, Brno, Czech Republic), equipped with energy dispersive spectroscopy(EDS) detector. An accelerating voltage of 20 kV was used; the working distance was 10 mm. A RigakuSmartLab 9-KW X-ray diffractometer (XRD) (Rigaku, Tokyo, Japan) was employed for qualitativeX-rays diffraction analysis. The scattering range was 30–75◦; the scan increment was 0.01◦. To define thevolume fraction of each phase, optical microscope Olympus SC-30 (Olympus, Tokyo, Japan) equippedfor pixel-based image analysis using the ‘Stream Essentials’ (Olympus, Tokyo, Japan) software wasused. The images analyzed by this method were obtained by SEM.
Materials 2018, 11, 75 12 of 13
6. Conclusions
1. In high-entropy alloys based on Zr and BCC elements, such as Cr, Ti, and Nb (the first twofalling under the wider definition of refractory elements and Nb being a refractory element),a unique phenomenon of gradual Zr segregation as the temperature rises can be observed.This phenomenon is apparently related to the contrasting crystal structures of the HCP Zr solidsolution and the BCC Cr-Nb based solid solution. It is more than likely that this phenomenon isnot in equilibrium since Zr is expected to have a BCC structure at high temperatures as well.
Some Ti is also incorporated in the secluded Zr solid solution regions and, to a small degree,it behaves in the same manner, being an HCP element itself.
2. The Zr segregation is initiated by the onset of Laves phase decomposition at around 1000 ◦C,which leaves behind a Zr-rich phase. The other elements are then incorporated in the increasinglyZr-depleted BCC solid solution phase, which gradually grows in volume as the temperaturerises further.
3. The thermodynamic simulation successfully predicts the general trend of increasing volumepercentage of the Cr-inclusive solid solution phase, as well as the increasing Cr incorporationin it, as a function of temperature (around 1000 ◦C and higher), however, Zr segregation is notaccounted for, due to the fact that it may not be an equilibrium phenomenon. The Nb-Ti-Zr basedsolid solution phase appearing at low to moderate temperatures in both alloys forms as a resultof the relatively rapid cooling associated with arc melting and is not likely to be the equilibriumsolid solution phase predicted at those temperatures by the model.
Acknowledgments: The research was carried out within the state assignment of FASO of Russia (theme “Spin”)with partial support by the Ural Branch of RAS (project No. 18-10-2-3).
Author Contributions: Eyal Eshed performed the literature survey, established the phase formation sequencebased on the obtained results, participated in discussions of the results and the formulation of the conclusions,and wrote the manuscript. Natalya Larianovsky contributed to the literature survey, performed SEM/EPMAexamination and analysis of the samples, participated in the discussions of the results and formulation of theconclusions. Alexey Kovalevsky performed alloy preparations and participated in discussions of the results.Vladimir Popov Jr. performed sample preparations and heat treatment and participated in discussions of theresults. Igor Gorbachev performed the thermodynamic modelling of the phase formation in the examinedsystem of materials. Vladimir Popov established the objectives of the thermodynamic modelling and participatedin the discussions of its results and in comparison of the modelling results with the experimental obtainedones. Alexander Katz-Demyanetz established the research objectives, contributed to the literature survey,performed XRD examination of the samples, gathered the results, and participated in discussions of the resultsand formulation of the conclusions.
Conflicts of Interest: The authors declare no conflict of interest.
References
1. Yeh, J.W.; Chen, S.K.; Lin, S.J.; Gan, J.Y.; Chin, T.S.; Shun, T.T.; Tsau, C.H.; Chang, S.Y. Nanostructuredhigh-entropy alloys with multiple principal elements: Novel alloy design concepts and outcomes.Adv. Eng. Mater. 2004, 6, 299–303. [CrossRef]
2. Wang, Y.P.; Li, B.S.; Fu, H.Z. Solid solution or intermetallics in a high-entropy alloy. Adv. Eng. Mater. 2009,11, 641–644. [CrossRef]
3. Zhang, Y.; Yang, X.; Liaw, P.K. Alloy design and properties optimization of high-entropy alloys. J. Miner.Met. Mater. Soc. 2012, 64, 830–838. [CrossRef]
4. Senkov, O.N.; Scott, J.M.; Senkova, S.V. Microstructure and room temperature properties of a high entropyTaNbHfZrTi alloy. J. Alloys Compd. 2011, 509, 6043–6048. [CrossRef]
5. Senkov, O.N.; Wilks, G.B.; Scott, J.M.; Miracle, D.B. Mechanical properties of Nb25Mo25Ta25W25 andV20Nb20Mo20Ta20W20 refractory high entropy alloys. Intermetallics 2011, 19, 698–706. [CrossRef]
6. Senkov, O.N.; Woodward, C.; Miracle, D.B. Microstructure of Aluminum-containing refractory high-entropyalloys. J. Miner. Met. Mater. Soc. 2014, 66, 2030–2042. [CrossRef]
7. Li, C.; Xue, Y.; Hua, M.; Cao, T.; Ma, L.; Wang, L. Microstructure and mechanical properties ofAlxSi0.2CrFeCoNiCu1-x high entropy alloys. Mater. Des. 2016, 90, 601–609. [CrossRef]
Materials 2018, 11, 75 13 of 13
8. Klimova, M.; Stepanov, N.; Shaysultanov, D.; Chernichenko, R.; Yurchenko, N.; Sanin, V.; Zherebtsov, S.Microstructure and Mechanical Properties Evolution of the Al, C-containing CoCrFeNiMn-typeHigh-Entropy Alloy during Cold Rolling. Materials 2018, 11, 53. [CrossRef] [PubMed]
9. Liu, X.; Yin, H.; Xu, Y. Microstructure, MAchanical Properties and Tribological Properties of Oxide DispersionStrengthened High-Entropy Alloys. Materials 2017, 10, 1312. [CrossRef] [PubMed]
10. Feng, W.; Qi, Y.; Wang, S. Effects of Short-Range Order on the mAgnetic and Mechanical Properties ofFeCoNo(AlSi)x High Entropy Alloys. Metals 2017, 7, 482. [CrossRef]
11. Popov, V.V.; Gorbachev, I.I. Analysis of solubility of carbides, nitrides, and carbonitrides is steels usingmethods of computer thermodynamics: I. Description of thermodynamic properties. Computation procedure.Phys. Met. Metallogr. 2004, 98, 344–354.
12. Popov, V.V.; Gorbachev, I.I. Analysis of solubility of carbides, nitrides, and carbonitrides in steels usingmethods of computer thermodynamics: II. Solubility of carbides, nitrides, and carbonitrides in the Fe–V–C,Fe–V–N, and Fe–V–C–N systems. Phys. Met. Metallogr. 2005, 99, 286–299.
13. Popov, V.V.; Gorbachev, I.I. Analysis of solubility of carbides, nitrides, and carbonitrides in steels usingmethods of computer thermodynamics: II. Solubility of carbides, nitrides, and carbonitrides in the Fe–Ti–C,Fe–Ti–N, and Fe–Ti–C–N systems. Phys. Met. Metallogr. 2009, 108, 484–495.
14. Gorbachev, I.I.; Popov, V.V. Analysis of the solubility of carbides, nitrides, and carbonitrides in steels usingmethods of computer thermodynamics: IV. Solubility of carbides, nitrides, and carbonitrides in the Fe-Nb-C,Fe-Nb-N, and Ft-Nb-C-N systems. Phys. Met. Metallogr. 2010, 110, 52–61. [CrossRef]
15. Gorbachev, I.I.; Popov, V.V. Thermodynamic simulation of the Fe-V-Nb-C-N system using the CALPHADmethod. Phys. Met. Metallogr. 2011, 111, 495–502. [CrossRef]
16. Gorbachev, I.I.; Popov, V.V.; Pasynkov, A.Y. Thermodynamic modeling of carbonitride formation in steelswith V and Ti. Phys. Met. Metallogr. 2012, 113, 974–981. [CrossRef]
17. Hillert, M.; Staffonsson, L.-I. The regular solution model for stoichiometric phases and ionic melts.Acta Chem. Scand. 1970, 24, 3618–3626. [CrossRef]
18. Sundman, B.; Agren, J. A regular solution model for phase with several components and sublattices, suitablefor computer applications. J. Phys. Chem. Sol. 1981, 42, 297–301. [CrossRef]
19. Dinsdale, A.T. SGTE data for pure elements. Calphad 1991, 15, 317–425. [CrossRef]20. Lu, H.-J.; Wang, W.-B.; Zou, N.; Shen, J.-Y.; Lu, X.-G.; He, Y.-L. Thermodynamic modeling of Cr-Nb and
Zr-Cr with extension to the ternary Zr-Nb-Cr system. Calphad 2015, 50, 134–143. [CrossRef]21. Cui, J.; Guo, C.; Zou, L.; Li, C.; Du, Z. Experimental investigation and thermodynamic modeling of the
Ti-V-Zr system. Calphad 2016, 55 Pt 2, 189–198. [CrossRef]22. Ghosh, G. Thermodynamic and kinetic modeling of the Cr-Ti-V system. J. Phase Equilib. 2002, 23, 310–328.
[CrossRef]23. Lee, B.-J. Thermodynamic assessment of the Fe-Nb-Ti-C-N system. Metall. Mater. Trans. A 2001, 32, 2423–2439.
[CrossRef]24. Hari Kumar, K.C.; Wollants, P.; Delaey, L. Thermodynamic calculation of Nb-Ti-V phase diagram. Calphad
1994, 18, 71–79. [CrossRef]
© 2018 by the authors. Licensee MDPI, Basel, Switzerland. This article is an open accessarticle distributed under the terms and conditions of the Creative Commons Attribution(CC BY) license (http://creativecommons.org/licenses/by/4.0/).