Embed Size (px)
Citation preview

i
Improving Wastewater Use
in Agriculture:
An Emerging Priority
June 30, 2010
Energy Transport and Water Department
Water Anchor (ETWWA)
The World Bank
i
Contents
Acknowledgements ....................................................................................................................... iv
Abbreviations and Acronyms ....................................................................................................... v
Executive Summary ...................................................................................................................... vi
Chapter 1. Introduction ............................................................................................................ 1
Chapter 2. Issues and Trends in Wastewater Use in Agriculture ........................................ 4
2.1 Wastewater use in agriculture: past and current practice .................................................................. 4
2.2 Key issues in wastewater use in agriculture ..................................................................................... 9
2.3 Powerful drivers toward growing wastewater use in irrigation ...................................................... 22
Chapter 3. Risks and Benefits of Wastewater Use in Agriculture ...................................... 31
3.4 Risks to public health ..................................................................................................................... 32
3.5 Environmental risks and benefits .................................................................................................... 41
3.6 Agricultural and water resources management benefits ................................................................. 43
3.7 Objectives for improving wastewater irrigation ............................................................................. 44
Chapter 4. Assessing and Managing Microbial Risk to Public Health .............................. 45
4.1 Risk assessment and management framework of the 2006 WHO Guidelines ................................ 45
4.2 Currently recommended microbial risks assessment and management framework ........................ 52
4.3 Options for reducing microbial risks .............................................................................................. 57
4.4 Applying quantitative microbial risk analysis ................................................................................ 59
Chapter 5. Toward an Agenda for Improving Wastewater Use in Agriculture ............... 63
5.1 Implementing measures for reducing public health risks ............................................................... 63
5.2 Promoting an integrated approach to planned wastewater use for irrigation .................................. 77
Chapter 6. Moving Forward ................................................................................................ 100
6.1 Toward a strategy for planned wastewater use in agriculture ....................................................... 100
6.2 Concluding Remarks .................................................................................................................... 103
Annex A: Development of Guidelines for Wastewater Use in Agriculture 1918-2010 ....... 106
Annex B: Involvement of the World Bank .............................................................................. 145
References ................................................................................................................................... 152

ii
List of Boxes
Box 2.1 Sewage Farming in Melbourne, Australia............................................................................. 5
Box 2.2 Urban Wastewater—The Basics ........................................................................................... 6
Box 2.3 Wastewater Use in Agriculture—A Typology ...................................................................... 7
Box 2.4 Wastewater treatment in the LAC region ............................................................................ 13
Box 2.5 Wastewater use in a low-income country: Kumasi, Ghana................................................. 17
Box 2.6 Santiago, Chile—indirect use of untreated wastewater ...................................................... 19
Box 2.7 Lima, Peru—indirect use of untreated wastewater ............................................................. 20
Box 2.8 Amman, Jordan—indirect use of treated wastewater .......................................................... 20
Box 2.9 Tunisia—direct use of treated wastewater .......................................................................... 21
Box 2.10 Urban agriculture in Germany .......................................................................................... 28
Box 2.11 Urban agriculture in the United Kingdom ......................................................................... 28
Box 3.1 Pathogens in wastewaters .................................................................................................... 33
Box 3.2 Actual and potential health risks in wastewater irrigation .................................................. 35
Box 3.3 Total coliforms, fecal coliforms and Escherichia coli ........................................................ 36
Box 4.1 Disability-adjusted Life Years (DALYs) ............................................................................ 48
Box 4.2 Quantitative microbial risk analysis .................................................................................... 49
Box 4.3 Examples of the usefulness of QMRA ................................................................................ 60
Box 4.4 QMRA investigations in urban Ghana ................................................................................ 62
Box 5.1 Sample strategy and action plan for incremental application of WHO guidelines ............. 70
Box 5.2 Ghana: From scratch, through the application of QMRA, to a national strategy ................ 72
Box 5.3 Santiago, Chile—From fear of cholera to full wastewater treatment in two decades ......... 74
Box 5.4: Israel’s experience with wastewater reclamation and use for irrigation as part of integrated water resources management ............................................................................................... 76
Box 5.5 EU Water Framework Directive and wastewater use ........................................................ 79
Box 5.6 Land issues and urban agriculture in the peri-urban community of Carapongo ................. 83
Box 5.7, Mendoza, Argentina—creating a special area for direct wastewater irrigation ................. 84
Box 5.8 Emergence of wastewater treatment for irrigation use in China ........................................ 87
Box 5.9 Private sector financing of wastewater treatment plants for irrigation use in Argentina, Chile, Mexico, Jordan and Iran ............................................................................................ 94
List of Tables
Table 2.1 The twenty countries with the largest volume of wastewater used for irrigation ............... 8

iii
Table 2.2 Urban population, water supply and sanitation coverage, and selected disease burden by level of development............................................................................................................ 10
Table 2.3 Urban sanitation and wastewater treatment characteristics by level of economic development ......................................................................................................................... 11
Table 2.4 Wastewater use for irrigation by level of economic development ................................... 15
Table 2.5 Volume and intensity of treated wastewater use for irrigation in selected high-income countries, ranked by intensity .............................................................................................. 22
Table 2.6 Contribution of urban agriculture to food supply in selected cities in Asia and Africa ... 27
Table 2.7 Characteristics of urban agriculture by level of economic development .......................... 29
Table 3.1 Environmental classification of excreta-related diseases important in wastewater-irrigated agriculture ............................................................................................................. 34
Table 3.2 Tentative guideline values for the maximum permissible concentrations of selected inorganic and organic pollutants in wastewater-irrigated soils ............................................ 41
Table 4.1 A framework for the management of microbial risks from wastewater use in agriculture ............................................................................................................................................. 47
Table 4.2 Health-protection control measures and associated pathogen reductions ......................... 51
Table 5.1 Progressive wastewater treatment options by level of economic development ................ 66
Table 5.2 Private sector participation in wastewater treatment for irrigation use and sources of financing .............................................................................................................................. 93
Table 6.1 Typical interventions for planned wastewater use for agriculture, by level of development ........................................................................................................................................... 104
List of Figures
Figure 2.1 Countries with largest areas irrigated by untreated and treated wastewater. ..................... 9
Figure 2.2 World population living in water scarce or water-stressed countries .............................. 23
Figure 2.3 World urban and rural population estimates 1950−2050 ................................................ 25
Figure 2.4 Urban population in developing countries with access to improved sanitation services in 1990 and 2006, and projection for 2015 .............................................................................. 26
Figure 3.1 Percent of wastewater effectively treated in 2000 ........................................................... 31
Figure 3.2 Prevalence of ascariasis and hookworm disease in ‘sewage farm’ workers in India using untreated wastewater for irrigation compared with a control group .................................... 38
Figure 4.1 The multiple barrier approach to microbial risk management ........................................ 50
Figure 4.2 An urban farmer in Accra, Ghana, watering his crops with wastewater from a watering can, working barefoot and thus potentially at risk of hookworm infection ......................... 59

iv
Acknowledgements
This draft report was prepared by Carl Bartone (Consultant) and Duncan Mara (University of
Leeds, UK), with contributions from Pay Drechsel and Alexandra Evans (both International
Water Management Institute, IWMI) under the overall supervision of Susanne Scheierling
(Task Team Leader). The task team would like to extend thanks to following colleagues at the
World Bank for helpful comments on the concept note and during a discussion meeting of
initial study results: Alex Bakalian, Mohammed Benouahi, Julia Bucknall, Sasha Danilenko,
Dan Hoornweg, Pete Kolsky, Paul Kriss, Menahem Libhaber, Abel Mejia, and Halla Qaddumi.
Comments were also received from Blanca Jimenez (UNAM, Mexico) and Mark Redwood
(IDRC). The task team also wishes to acknowledge constructive comments from the peer
reviewers Alexander Bakalian, Menahem Libhaber, and Jamie Bartram (University of North
Carolina at Chapel Hill); and from Marjory-Anne Bromhead and Julia Bucknall who co-
chaired the review meeting. Benedicte Augeard contributed to the portfolio review. Hilary
Gopnik edited parts of the report. The preparation of the report would not have been possible
without funding from the Water Partnership Program (WPP).

v
Abbreviations and Acronyms
BOD biological oxygen demand
COD chemical oxygen demand
CCP critical control points
DALY disability-adjusted life years
EC European Commission
EU European Union
FAO Food and Agriculture Organization of the United Nations
GNI gross national income
HACCP Hazard Analysis Critical Control Point
IFC International Finance Corporation
IDRC International Development Research Centre
IWMI International Water Management Institute
IWRM integrated water resources management
LAC Latin America and the Caribbean region
MC Monte Carlo
MIGA Multilateral Investment Guarantee Agency
NGO Non-governmental organization
NV norovirus
PAD Project Appraisal Document
pppy per person per year
QMRA quantitative microbial risk analysis
RUAF Resource Center on Urban Agriculture and Forestry
SS suspended solids
UNDP United Nations Development Program
WHO World Health Organization
WPP Water Partnership Program
WSP Water Supply and Sanitation Program
WWTP Wastewater treatment plants

vi
Executive Summary
The use of urban wastewater for agricultural irrigation is a growing practice worldwide. Both in semi-arid and arid countries at all levels of development, and in low-income countries where urban agriculture provides livelihood opportunities and food security, irrigation is the most prominent and the most rapidly expanding use of wastewater. Agricultural wastewater use helps to conserve and expand available water supplies, and can contribute toward a more integrated management of urban water resources. Yet if not planned, managed and implemented properly, it is associated with a number of risks, including public health, agronomic, and environmental risks. Microbial health risks are especially severe in low- and middle-income countries, where the practice often involves the direct use of untreated wastewater and/or the indirect use of polluted waters from rivers and streams to irrigate food crops. Farmers and the urban poor are disproportionally affected. Chemical health risks assume greater importance as industrialization occurs.
This report aims to highlight the importance of improving wastewater use in agriculture across the spectrum from low- to high-income countries, assess the outstanding issues and proposed responses, and suggest a strategic focus for implementing wastewater irrigation policies and programs. It sets out the trends and challenges of wastewater use in agriculture, identifies the risks and benefits of wastewater irrigation, describes the risk assessment and management framework adopted by WHO, FAO and other international and national organizations, and proposes measures for reducing health risks and promoting an integrated approach to planned wastewater use for irrigation.
The primary audiences for the report are water professionals, regulators and decision-makers who are involved in agriculture, water supply and sanitation, and water resources management. It is an advocacy piece that also aims to show what actions could be taken in diverse country situations to better incorporate agricultural wastewater use in a framework for managing water resources in and around cities.
The trends and challenges of wastewater use in agriculture
In many regions, as freshwater sources become scarcer, wastewater use has become an attractive option for conserving and expanding available water supplies. Wastewater use can have many types of applications, including irrigation of agricultural land, aquaculture, landscape irrigation, urban and industrial uses, recreational and environmental uses, and artificial groundwater recharge. In principle, wastewater can be used for all purposes for which freshwater is used, given appropriate treatment.
Wastewater use in agriculture is by far the most established application, and the one with the longest tradition. In most cases the irrigated lands are located in or around the urban areas where the wastewater is generated. Estimates on wastewater use worldwide indicate that about 20 million hectares of agricultural land is irrigated with (treated and untreated) wastewater.
Powerful drivers for the expansion of wastewater irrigation include increasing water stress (in part due to climate change), increasing urbanization, growing urban wastewater flows due to the expansion of water supply and sewerage services, and more urban households engaged

vii
in agricultural activities that could be intensified with additional sources of irrigation water and nutrients. These key drivers are expected to become even more powerful in the near future, making improved wastewater use in agriculture an emerging priority.
The problem with this growing trend toward more wastewater irrigation is that in low-income countries, but also many middle-income countries, the practice either involves the direct use of untreated wastewater or the indirect use of polluted waters from rivers and streams that are the recipients of untreated wastewater discharges. With freshwater either unavailable or too expensive, and wastewater treatment not keeping up with urban growth, urban farmers often have no alternative but to use highly polluted water. Many of them belong to the urban poor who depend on agricultural activities as a source of income and employment generation as well as food security.
With the advent of modern sewerage systems and wastewater treatment processes in the early 20th century, industrialized countries began to establish regulatory frameworks for controlling wastewater treatment and use for irrigation. These frameworks continued to evolve over time, but still rely heavily on capital-intensive wastewater treatment as the principal intervention for protecting public health and the environment. Poor countries, however, lack the financial and institutional capacity to build and operate sophisticated wastewater treatment facilities; indeed, universal municipal wastewater treatment has still not been achieved in many industrialized countries because of financial constraints. Other complementary solutions are needed.
To better understand these challenges and help seek solutions, this report presents an innovative approach linking key issues related to different aspects of wastewater irrigation to a country’s level of economic development. It differentiates between four country income levels (low-income, lower-middle income, upper-middle income, and high-income) to create a typology for analyzing current trends and issues across country groups, and for later evaluating and recommending potential solutions tailored to country circumstances.
The risks and benefits of wastewater use in agriculture
Wastewater use in agriculture has substantial benefits for agriculture and water resources management, but can also pose substantial risks to public health – especially when used untreated for crop irrigation. There can also be chemical risks to plant health, and risks to the environment in the form of soil and groundwater pollution. Countries seeking to improve wastewater use in agriculture must reduce the risks, in particular those to public health, and maximize the benefits through properly planned, implemented and managed wastewater irrigation practices.
Risks of wastewater use in agriculture
Microbial risks to public health. In low- and middle-income countries, the greatest risks are primarily to public health from the microbial pathogens (disease-causing organisms) contained in domestic wastewater, including bacteria, viruses, protozoa and helminths. Epidemiological studies carried out over the past four decades have linked the uncontrolled use of untreated or partially treated wastewater for edible crop irrigation to the transmission of endemic and epidemic diseases to farmers and crop consumers. Actual risks of using
viii
untreated wastewater for irrigation include the increased prevalence of helminthic diseases (such as ascariasis and hookworm) in field workers and consumers of uncooked vegetables, and bacterial and viral diseases (such as diarrhea, typhoid, and cholera) in those consuming salad crops and raw vegetables.
Chemical risks to public health. Chemical risks are greater for middle- and high-income countries where industrial wastewaters may be discharged to public sewers and contaminate municipal wastewaters. Chemical risks to human health may be caused by heavy metals (such as cadmium, lead, and mercury) and by many organic compounds (such as pesticides). There is also increasing concern in high-income countries about an emerging class of “anthropogenic” chemical compounds, which include pharmaceuticals, hormones and endocrine disruptors, antibiotics, and personal care products – although their long-term health effects are less clearly understood.
Risks to plant health. The principal risk to plants is reduced crop yields if the physicochemical quality of wastewater used for irrigation is unsuitable – for example by being too saline or having excessive concentrations of boron, heavy metals or other industrial toxicants, nitrogen, and/or sodium. Risks to plant health are reduced if there is little industrial effluent in the wastewater, but in all cases five parameters should be monitored during the irrigation season: electrical conductivity, the sodium adsorption ratio, boron, total nitrogen, and pH.
Environmental risks. Soil and groundwater pollution is the main risk of using wastewater in agriculture; the microbiological pollution of groundwater is a lesser risk as most soils will retain pathogens in the top few meters of soil except in certain hydrogeological situations like limestone formations. Chemical risks include, among others, nitrates in groundwater from sewage irrigation, salination of soils and aquifers, and changes in soil structure from, for example, boron compounds common in industrial and domestic detergents.
The key to controlling many of the chemical risks to humans, plants and the environment is to put in place effective industrial wastewater pretreatment and control programs. Of course, effective programs are not the norm in developing countries, so special attention has to be paid to chemical risks in such circumstances.
Benefits of wastewater use in agriculture
When properly planned, implemented and managed, wastewater irrigation schemes can have several benefits that accrue to the agricultural, water resources management, and environmental sectors.
Agricultural benefits. Agricultural benefits may include: reliable, and possibly less costly irrigation water supply; increased crop yields, often with larger increases than with freshwater due to the wastewater’s nutrient content; more secure and higher urban agricultural production, and contribution to food security; income and employment generation in urban areas; and improved livelihoods for urban agriculturalists, many of whom are poor subsistence farmers, including a large share of women
Water resources management benefits. In terms of water resources management, the benefits may include: additional drought-proof water supply, often with lower cost than expanding

ix
supplies through storage, transfers, or desalinization; more local sourcing of water; inclusion of wastewater in the broader water resources management context; and more integrated urban water resources management.
Environmental benefits. Among the environmental benefits that may accrue to well-managed wastewater irrigation schemes are: avoidance of surface water pollution, which would occur if the wastewater were not used but discharged into rivers or lakes – major environmental pollution problems, such as dissolved oxygen depletion, eutrophication, foaming, and fish kills, can thereby be avoided; conservation or more rational use of freshwater resources, especially in arid and semi-arid areas – that is, freshwater for urban demand, wastewater for agricultural use; reduced requirements for artificial fertilizers, with a concomitant reduction in energy expenditure and industrial pollution elsewhere; soil conservation through humus build-up and through the prevention of land erosion; and desertification control and desert reclamation, through irrigation and fertilization of tree belts.
Objectives for improving wastewater irrigation
Facing these risks and benefits, countries seeking to improve wastewater use in agriculture should pursue the following key objectives: (i) minimize risk to public health; (ii) minimize risk to the environment; (iii) improve livelihoods for urban agriculturists; and (iv) integrate wastewater into the broader water resources management context.
Depending on the level of economic development, a country may seek to pursue one or a combination of these objectives. For example, low-income countries are likely to put highest priority on minimizing the microbial risks to health while improving the livelihoods of urban farmers; but middle- and high-income countries may give higher priority to reducing environmental risks and, especially when they are water stressed, a fuller integration of wastewater into their water resources management system.
A microbial risk assessment and management framework for public health protection
The first international guidelines for the safe use of wastewater in agriculture were developed by WHO in 1973, and were subsequently revised by WHO in 1989 based on new epidemiological evidence of actual versus potential microbial risks. These 1989 Guidelines recommended that for unrestricted irrigation (i.e., for irrigation of crops eaten raw) wastewater should achieve a guideline concentrations of less than 1,000 fecal coliforms per 100 ml, and less than one nematode egg per liter; and for restricted irrigation (crops not for direct human consumption) wastewater should achieve a guideline concentration of less than one nematode egg per liter primarily to protect field workers and their families.
The 1989 Guidelines, however, proved difficult to achieve and did not result in improved wastewater irrigation in many low- and medium-income countries because of their inability to effectively treat wastewater to the guideline values. Furthermore, costly wastewater treatment for irrigation use cannot achieve a real reduction in microbial risks as long as the background risk due to inadequate drinking water and overall sanitation remains as high or higher than the risk from wastewater irrigation.
x
The 2006 WHO “Guidelines for the Safe Use of Wastewater, Excreta and Greywater” have taken a radically different approach from the one taken in the 1973 and 1989 guidelines. The 2006 Guidelines are based on a risk assessment and management approach that follows the Stockholm Framework – the same risk management framework that is now applied to all decisions about drinking water and sanitation interventions. The approach for microbial risks is (i) to define a define a tolerable maximum additional burden of disease, from which it is possible (ii) to derive tolerable risks of disease and infection, (iii) to set health-based targets for pathogen reductions, (iv) to determine how the required pathogen reductions can be achieved, and (v) to put in place a system for verification monitoring.
This approach became possible only after the DALY (disability-adjusted life years) metric was developed and introduced by WHO and the World Bank in 1993, allowing for the definition of a tolerable additional burden of disease and for the comparison of disease burdens resulting from different health risks.
Another principal development in the 2006 WHO Guidelines is the application of quantitative microbial risk analysis (QMRA) to wastewater use in agriculture. QMRA provides a rational basis for microbial risk assessment and management in wastewater irrigation. The Guidelines also foster a ‘multiple barrier’ approach to risk management that includes wastewater treatment together with post-treatment health-protection control measures (such as crop restrictions, safer irrigation methods, and human exposure control through hygienic produce handling and safe food preparation) that can be used singly or in combination when wastewater treatment alone cannot achieve the pathogen reduction targets.
This risk management framework and methodological approach for risk assessment has been used to develop the 2006 Australian National Guidelines for wastewater use, as well as the 2006 WHO Guidelines. In both cases, the QMRA methodology is used the determine total pathogen reduction targets to be achieved by a combination of wastewater treatment and a selection of post-treatment health protection control measures, based on a tolerable maximum additional burden of disease of one-millionth of a DALY loss per person per year (10-6 DALY loss pppy). This is the same as that used in the 2004 WHO Guidelines for Drinking Water Quality, and was chosen as it corresponds to a lifetime excess risk of about 10−5 per person of dying from a fatal cancer induced by drinking fully treated water (i.e., one fatality per 100,000 people), or an annual diarrheal risk of illness of 10–4 (one illness per 10,000 people per year).
For low-income countries with a high background level of diarrheal diseases due to overall poor urban water supply and sanitation conditions, and lacking effective wastewater treatment capacity, a more reasonable initial tolerable maximum additional burden of disease would be 10−4 DALY loss pppy, with the aim of working toward the higher value over time as each country develops. This approach recognizes that substantial improvements in wastewater irrigation practices alone will do little to lower background levels of diarrhea without corresponding improvements in water supply and sanitation services.
The risk assessment and management framework of the 2006 WHO Guidelines has been applied to a number of reference pathogens associated with wastewater irrigation for which dose-response data are available, in order to determine the corresponding required pathogen

xi
reduction targets. Initially, WHO applied the framework to the reference pathogens rotavirus (a viral pathogen), Campylobacter (a bacterial pathogen), and Cryptosporidium (a protozoan pathogen). Since then, the needed dose-response data have become available for norovirus (another viral pathogen deemed to be a more important cause of diarrhea in adults than rotavirus) and Ascaris lumbricoides (a nematode pathogen). Therefore, countries can now apply QMRA for these reference pathogens and determine the pathogen reduction targets that they should meet now and in the future.
Once pathogen reduction targets are established, and an appropriate combination of appropriate treatment and post-treatment health protection control measures has been determined, verification monitoring is needed to ensure that the measures are effective. In the case of unrestricted irrigation, in order to ensure continuous protection of consumer health, a Hazard Analysis Critical Control Point (HACCP) system should be put in place to monitor the efficacy of both treatment and post-treatment health protection measures following the 2003 FAO HACCP Guidelines.
Measures for reducing public health risks
Countries should implement comprehensive and progressive measures for reducing public health and other risks associated with the use of wastewater for irrigation. Depending on their starting point, each country should adopt measures that over time will allow them to progress from unplanned to planned wastewater irrigation and achieve phased improvements in wastewater treatment. To control chemical risks, they should also introduce measures for the pre-treatment and control of industrial wastewater discharges. To reach the goal of planned wastewater irrigation, a multi-phased action plan should be developed, aimed at the steady and measurable progress toward the ultimate goal.
Progressing from unplanned to planned wastewater irrigation
The path toward achieving planned wastewater irrigation depends on the starting point of a particular country. Low-income countries facing water scarcity and seeking food security lack the money and capacity to immediately build and operate the needed wastewater treatment systems that would ensure minimal health risks from wastewater irrigation. They will have to rely initially on multi-barrier options for post-treatment health-protection control. However, they should also begin to introduce low-cost treatment options combined with policy reforms and non-structural interventions that will lay the foundation for subsequent stages of a progressive implementation plan.
Middle-income countries may already have established some of the policies, institutions, and regulations needed for a more comprehensive water resources planning framework, and introduced some degree of wastewater treatment. The experience gained, assuming appropriate monitoring is in place, should provide a solid foundation for moving to subsequent stages. Affordability is still a critical issue, and attention should be focused on improved financial management and identification of opportunities for mobilizing needed investments to maintain the systems in place and steadily upgrade treatment systems and improve overall operations.
xii
High-income countries facing water scarcity generally have undergone a stepwise implementation of policies and regulations resulting in progressively more stringent standards for water and wastewater quality and use for irrigation. This process has required decades.
The challenge for developing countries is not to copy the 100+ years experience of the industrialized countries, but to learn from it and jumpstart a process to apply the risk assessment and reduction framework and develop a multi-phased strategic plan that can be achieved in time intervals of 15 to 20 years. At each stage of the process, countries should seek to identify and implement the most affordable and cost-effective measures for achieving a desired level of risk reduction.
Phased improvements in wastewater treatment
The introduction and progressive improvement of appropriate wastewater treatment – particularly affordable treatments systems that can positively impact food safety – is a fundamental strategic goal for achieving planned wastewater irrigation in developing countries. Low-income countries should seek to introduce non-treatment options and simpler low-cost treatment options as a first step, and progressively move toward expanded sewerage systems and more robust treatment technologies as financial and operational capacity grows. An important part of this first step is to clearly define responsibilities for household, community, and public sanitation service provision, and to put in place the capabilities to monitor operations and verify that treatment targets are met.
A progressive array of appropriate technology treatment options of differing scale can be considered, along with possible pathways to expand sewerage and treatment as development occurs, such as:
On-site wastewater treatment and use. These non-sewered sanitation options may provide greywater from household storage tanks to be used for household gardens, wastewater that has been processed by soil infiltration, or composted human waste for adding nutrients.
Communal wastewater treatment and use. Wastewater from a cluster of homes can be collected by non-conventional systems like small-bore sewers or condominial sewers, treated by simple low-cost options, and used close by on small agricultural plots.
Decentralized wastewater treatment and use. Wastewater from isolated medium-size communities, or portions of larger urban areas, can be collected, treated, and used nearby to irrigate larger urban or peri-urban plots. Low-cost, unconventional treatment options can often provide needed levels of pathogen removal.
Centralized wastewater treatment and use. Wastewater, and sometimes stormwater, is generally drained by an extensive network of pumps and piping for transport to a central location for treatment and reclamation, usually near a point where convenient irrigation use. While unconventional treatment options may be feasible for larger cities, due to land constraints large city systems will often be based on conventional treatment options.
Planning for control of industrial wastewater

xiii
In cities where industries contribute a significant amount of wastewater, the enforcement of industrial pretreatment and control programs is essential for the minimization of chemical risks and the successful operation of any treatment plant or effluent irrigation scheme. The establishment of industrial discharge standards is important in order to promote industrial pretreatment programs and control certain industrial discharges that may be critical to the operation of wastewater treatment plants and the quality of treated effluents and sludge byproducts.
Quality standards are usually set up for industrial wastewater discharged into municipal sewerage systems, in order to ensure that heavy metals, organic toxins, salts, or other harmful contaminants generated by industrial activity do not reach levels that may damage pipes, inhibit the biological treatment processes, remain in the effluent in higher concentrations than permitted for irrigation use or environmental discharge, or accumulate in the sludge and limit or even prevent its disposal or reuse. This report describes the main elements of successful industrial pretreatment and control programs.
Developing an strategy and action plan
A strategy and action plan is needed that will ultimately lead to the desired goal of moving from unplanned to planned wastewater irrigation and that meets internationally-accepted health-based targets, for example, pathogen reduction targets established by applying the 2006 WHO Guidelines. Recognizing that this goal cannot be achieved overnight or even in one phase, the action plan should be multi-phased and aim at steady and measurable progress toward the ultimate goal within an agreed and realistic timeframe. Progress in achieving safe wastewater irrigation may be measured over decades as has been demonstrated in the successful examples of Chile and Israel.
Development of a strategy and action plan for wastewater use in agriculture should take place within a broader multi-sectoral planning framework for integrated water resources management, seeking the maximum economic yield from the use of an increasingly scarce resource. The incorporation of microbial and chemical protocols for safe wastewater use into national water plans is important, especially when water and financial resources are scarce, not only to protect water quality but also to minimize wastewater treatment costs, to safeguard public health, and to obtain the maximum possible agricultural benefit from nutrients and organic matter contained in wastewater.
Possible steps to help develop a strategy and action plan for implementing health risk reduction measures are: (i) conduct surveys of wastewater and excreta use practices; (ii) evaluate and prioritize health risks, in the context of the national burden of disease, using methods such as QMRA; (iii) conduct stakeholder consultation workshops to formulate appropriate strategies for mitigating health impacts; (iv) develop an action plan considering the cost-effectiveness of potential multi-barrier interventions, with time-bound interim health targets for the medium and long term; (v) strengthen institutional capacities to monitor and enforce safe wastewater and excreta use practices; and (vi) review and revise the strategy, action plan, and policies as needed.
A sample strategy and action plan for incremental application of the 2006 WHO Guidelines is presented in this report. Also, based on examples, the evolution of multi-phased programs

xiv
is shown for a low-income country (Ghana), two lower-middle-income countries (Jordan and Tunisia), an upper-middle-income country (Chile), and a high-income country (Israel).
Promoting an integrated approach to planned wastewater use for irrigation
While the risk assessment and management framework allows for reducing risks associated with wastewater irrigation, and strategic action planning can help choose the needed combination of treatment and multi-barrier options to achieve health targets, the successful implementation of planned wastewater irrigation also requires that agricultural wastewater use be embedded in the broader water resources management context.
Integrated water resources management (IWRM) is the accepted international paradigm for efficient, equitable, and sustainable management of water resources. While there is no unambiguous definition of IWRM, a number of management principles have been agreed, namely: adopting a multi-sectoral approach to water management in association with river basin management; encouraging stakeholder participation and devolution of responsibility; promoting private sector involvement; and employing economic instruments.
Adopting an integrated multi-sectoral approach to wastewater management and use
Wastewater use for agriculture requires coordinated decision-making across multiple sectors as it involves consideration of urban water supply, sanitation and land use policies, public health and environmental impacts, agricultural productivity, economic feasibility, and sociocultural aspects – all linked through a broader water resources management framework. This multi-sectoral nature of wastewater use requires the proper identification of the many interested stakeholders and institutions that are typically involved.
These varying sectoral interests and responsibilities must be considered and reconciled if a wastewater use is to succeed. Ideally, wastewater use for irrigation and strategies for its implementation should be part of national water resources planning, and there should be a better integration of wastewater use issues into sectoral policies. At the local level, individual wastewater use projects should be part of the overall river basin planning effort – at the very least at the level of local urban watersheds. Multi-sectoral planning with due consideration of wastewater use for agricultural remains a major challenge, however, not only at national level but also in donor agencies – many of whom do not have clearly stated policies regarding wastewater reclamation and use or how to involve other sectors in such sanitation projects.
For developing countries wishing to engage in effluent irrigation for urban agriculture, the following cross-sectoral issues often require attention:
Economic costs and benefits of wastewater irrigation. The decision to promote wastewater irrigation should depend on a full accounting of the economic costs and benefits of projects. Most economic assessments, however, rarely encompass all relevant aspects of effluent irrigation and rarely go beyond financial feasibility analysis. For example, the scarcity of water and the marginal cost of new sources are often ignored, and similarly, the financial, social, and pollution burden of effluent disposal to the environment are rarely considered. Nor are the public health consequences of unplanned wastewater irrigation taken into account. Some noteworthy economic studies have demonstrated that wastewater irrigation
xv
can increase agricultural productivity and land values, and that observed health benefits can offset the cost of providing wastewater treatment.
Water and land use policies and planning. Many poor farmers use wastewater without formal water rights, and if wastewater is withheld they will lose their livelihoods. Legislation should define the rights to wastewater, and access to wastewater can be made contingent on farmer compliance with health guidelines. Similarly, secure land tenure is important for preserving the livelihoods of urban farmers and helping commercial farmers gain access needed credit. To increase security of land tenure for producers, municipal land-use policies may need to be redesigned – preferably in consultation with all stakeholders in land-use planning. For large effluent irrigation projects, suitable land areas should be identified and/or preserved in the vicinity of existing or planned wastewater treatment facilities. The examples of the Mendoza ACRE project and Melbourne’s Werribee Farms project illustrate how this can be done in practical and productive ways.
A new paradigm for wastewater treatment decision-making. Standards for wastewater treatment plant design are usually based on environmental legislation aimed at protecting receiving water bodies from polluting discharges. In developing countries, the resulting treatment plants are often viewed as costly means of preparing wastewater for unproductive disposal, and as a result resource-constrained governments seldom rank wastewater treatment high on their agendas. There is a need to shift the paradigm so as to see wastewater as an asset, and to manage water, wastewater, pollution control, and effluent irrigation in an integrated way while ensuring public health protection. In this paradigm shift, treatment facilities are not designed for waste disposal but to conserve resources in wastewater – including the water itself and the nutrients it contains – and reduce pathogen risks. Waste stabilization ponds have long been recognized as an appropriate treatment technology for effluent irrigation schemes, but are land intensive. Where land costs preclude pond treatment, conventional technologies can still be modified to minimize nutrient removal and lower costs, as has been demonstrated in China. Capturing biogas from treatment processes for on-site use can lead to long-term cost savings and reduced carbon emissions.
Promoting stakeholder participation and social acceptance
Given the multi-sectoral nature of wastewater irrigation projects, the varying interests and responsibilities of stakeholders must be considered and reconciled if a project is to succeed. Numerous benefits of stakeholder participation in integrated wastewater irrigation projects include improving public acceptance of decision, improving the quality of alternatives because to the wider range of expertise available, reducing the risk that opposition from disaffected groups will delay implementation of decisions, and increasing the likelihood of compliance with agreements reached during negotiations.
Three key issues need attention when considering stakeholder participation:
Clarifying stakeholder roles and responsibilities. An important lesson from the long and successful Israeli experience with wastewater irrigation is that there should be a clear separation of responsibilities between the urban, rural, and other sectors regarding the treatment and application of wastewater. For example, municipalities (as the producer of polluting wastewater) are responsible for basic treatment costs – where farmers run

xvi
wastewater treatment facilities, they act as a subcontractor of the municipality (as any other private contractor), while final responsibility before the regulatory remains with the municipality. The costs of any additional treatment that may be needed for agricultural applications, storage, and conveyance to irrigation sites is borne by the water sector agency (Mekorot), and part of the cost is recovered from farmers. While there are many different wastewater irrigation schemes in Israel, all seem to work properly when responsibilities are clearly set.
Involving farmers and consumers in health protection measures. The active participation of farmers and consumers is of particular importance to the success of wastewater irrigation projects. Farmers need to be educated on safe irrigation and post-harvest practices. Consumers need to be informed about the safe handling and preparation of food crops irrigated with wastewater. In countries lower on the treatment ladder where a multi-barrier approach is essential, simple incentives to farmers and produce-sellers, such as training in safer production and food handling practices, could accelerate risk reduction significantly. A higher willingness to pay for safer produce could be one of the best incentives for behavior change where regulations alone are not sufficient to support the adoption of safer food production and marketing—this was demonstrated during the cholera emergency in Chile. In low-income countries risk awareness is often not high enough to result in a higher willingness to pay. In such cases, social marketing strategies may be a way to increase consumers’ risk awareness, as demonstrated in Ghana.
Building trust, credibility and confidence. The perception of some public officials and of the general public is that treated wastewater still remains basically sewage. Nor is it widely known that in urbanized catchments the water cycle actually includes indirect, unplanned and uncontrolled use of wastewater. These can be major impediments to advancing effluent irrigation projects. The professional water community should strive to convey the value and safety of planned wastewater through whatever means available including education of the public and of elected officials. Transparency, information sharing, and involvement of users and local communities in the decision making process will also ensure greater acceptance of projects.
Involving the private sector in financing and managing wastewater treatment
Wastewater treatment is capital intensive, and requires additional financial flows to ensure the sustainable operation of treatment facilities and provide for future expansion. Until recently, major treatment works in developing countries were financed by governments or public utilities, often with the help of loans from international or bilateral agencies accompanied by central government guarantees against commercial and political risk. Given the general lack of experience in wastewater treatment plant design and operation, major projects were typically plagued by cost overruns, implementation delays, and operations and maintenance difficulties. In many cases they were on the road to failure as soon as they were commissioned.
In order to overcome these difficulties, some middle- and high-income countries have turned to the private sector to help operate and even finance treatment investments in large cities, while assuming commercial responsibility. Two models have been successful for wastewater treatment in general and wastewater irrigation in particular:

xvii
Design-Build-Operate (DBO) contract. In this model a firm or consortium of firms is responsible for building and subsequently operating the plant for a specified period of time. Payment is usually on a price per m3 basis, and is tied to the successful operation of the plant and meeting effluent quality standards. In DBO contracts, the government or public utility owns the plant and still undertakes to finance the investment, but the commercial risk for operation is assigned to the private partner.
Build-Own-Operate-Transfer (BOOT) contract. An improvement is to allocate the commercial risk for both investment and operation to a private consortium through a BOOT agreement. This model requires that the private partner builds, owns and operates the treatment plant for a defined period of time – usually 20 to 30 years – and transfers ownership to the public partner at the end of that time frame free of charge and in good operating condition. A variant of this model is the Build-Own-Operate (BOO) agreement in which private ownership is retained indefinitely. The private partner normally recovers its investment and operating costs through a price per m3 payment over the life of the agreement.
The main objectives for involving the private sector in wastewater treatment are to make the operation and management of the plant more efficient, to attract new ideas and technologies, which could lower costs, and to finance the investment without public guarantees in any form.
With regard to wastewater treatment for effluent irrigation projects specifically, the experience with private sector participation cuts across lower-middle-income countries (Iran and Jordan), upper-middle-income countries (Argentina, Chile, and Mexico), and high-income countries (Kuwait and Qatar). While most of the examples utilize conventional technologies such as activated sludge and tertiary treatment options, large-scale waste stabilization ponds have also been utilized with success and at low cost in Mendoza, Argentina. These examples show that the private sector can introduce wastewater treatment in countries having little prior experience, can mobilize private investment, and can design and operate the treatment plants so as to meet water quality standards for wastewater irrigation.
The importance of the private sector participation in wastewater treatment has also been confirmed in low-income countries. For example, a survey of about 70 decentralized wastewater treatment plants in Ghana highlighted the relative success of plants built and operated by the private sector, while plants operated by or handed over to the public sector failed.
Using economic instruments to promote wastewater irrigation
Since the international acceptance of the 1992 Dublin Principles, water has been viewed as an economic good. The commonly accepted application of this principle for financing wastewater collection, treatment and disposal is that the “polluter pays,” which assumes that wastewater fees should be used to recover the full costs or full values of wastewater treatment and disposal. This means that, in principle, the fees paid by producers and dischargers of wastewater should achieve “full cost recovery,” reflecting the operation and maintenance costs and the capital costs for renewing and expanding sewerage and treatment systems, and ultimately the opportunity costs (water scarcity) and externality costs (health
xviii
and environmental) of wastewater use.
In addition to cost recovery, other economic instruments may also be effective in mobilizing financing for wastewater treatment and use projects and reducing pollution loads. These may include pricing of treated wastewater, the use of subsidies for wastewater investments, implementing effluent taxes and creating environmental funds to encourage treatment, and designing wastewater fees for industry based on a combination of wastewater volume charges and waste loading charges.
Sustainable cost recovery. While the principle of full cost recovery has been invoked in a number of country water policy frameworks, in reality few countries practice full cost recovery through wastewater charges. Recognizing the difficulties of achieving full cost recovery, the Camdessus Panel formulated the concept of “sustainable cost recovery,” which identified three main characteristics of sustainable cost recovery:
An appropriate mix of tariffs, taxes and transfers (the 3Ts) to finance recurrent and capital costs, and to leverage other forms of financing;
Predictability of public subsidies to facilitate investment (planning); and
Tariff policies that are affordable to all, including the poorest, while ensuring the financial sustainability of service providers.
Each country must find its own balance among the three basic sources of finance (the 3Ts) for renewing and expanding wastewater management systems, but should seek to rely on wastewater fees to cover operation and maintenance costs for sewerage, treatment and disposal services and increasingly to recover a portion of capital costs.
In developing countries, the path to sustainable cost recovery should involve a phased approach, with wastewater fees increasing in stages to cover operation and maintenance costs, and eventually depreciation of assets and some new investments. Where a phased approach is adopted, the process for setting wastewater fees should be part of general water tariff reform, and a realistic balance of central-local obligations and responsibilities should be set out.
Pricing treated wastewater. Setting appropriate fees for treated wastewater provides an important incentive mechanism to encourage wastewater use. This may include:
No charging: Treated wastewater price is set to zero so as to increase its demand and thus reduce or avoid wastewater discharge into sensitive aquatic environments;
Defined percentage of freshwater price: Treated wastewater use is often offered at a lower price than freshwater, thus stimulating wastewater use by farmers and increasing its acceptance.
Price set at willingness to pay of users: The price of treated wastewater is based on what the market will bear, without taking into account the costs required. Farmers’ willingness to pay varies depending on the expected economic returns.
Of course, if the price to farmers is less than treatment, storage, and conveyance costs, they become the beneficiaries of transfers (subsidies) from the operators or taxpayers in general. In view of the actual low cost recovery from farmers for freshwater irrigation, the price of treated wastewater will have to be kept low to remain competitive and subsidies will persist.

xix
Use of subsidies for investment. To lower the cost of treating wastewater, subsidies continue to play a role in covering at least part of the capital costs of wastewater treatment, as is exemplified in history of wastewater treatment in the USA, Europe, and Japan where grants provided motivation for municipal wastewater treatment in general. Some developing countries are following this policy. Mexico, for example, provides a Federal grant for 50 percent of the treatment investments.
Specifically for wastewater reclamation and use projects, the EU provides up to 50% grants for the capital costs along with other incentives. Similarly, in the USA, California provides up to 50% grants for water recycling facility planning and up to 25% capital grants for water recycling facility construction, and Florida is expanding grants and low-interest loans for municipal wastewater reclamation and use projects.
While there is a role for national grants (subsidies) and incentives for wastewater treatment investments in response to national environmental and agricultural priorities, care must be taken, however, to ensure that the mere existence of such grants does not distort investment decisions and promote the use of overly capital-intensive technologies when simpler, lower-cost technologies may be adequate to meet water quality objectives.
Effluent taxes and abstraction taxes. Several countries have introduced effluent taxes to encourage wastewater treatment and discourage discharge into natural waterways. This is an implementation of the “polluter pays principle,” whereby users of water are charged for the pollution load they discharge. This tax can be utilized to create an environmental fund to encourage investment in wastewater treatment, as has been done on a river basin basis in countries like Germany, France, Brazil, China, Colombia, and Mexico. In addition, certain investments for improvements in wastewater treatment and use can be offset against the effluent tax.
Abstraction taxes can be applied to pumped groundwater and diverted surface water so that farmers or other users do not perceive water as free, and may be more disposed to pay for treated wastewater.
Cost recovery from industry. Industrial discharges to municipal sewers vary greatly both in volume and the pollution load that they exert on a wastewater treatment plant. Thus, large industrial dischargers will generally be charged for metered wastewater volumes, and for pollution loads in terms of the mass of organic waste (BOD or COD), suspended solids (SS), nutrients (N, P) and/or other specific contaminants such as heavy metals, depending on the established treated effluent standards. Any pretreatment requirements should be met at industry expense prior to discharge into municipal sewers. The coordination of national effluent taxes with municipal sewer use charges is essential so that a consistent message is sent to industrial dischargers.
Moving forward
Particularly in water-scarce countries, and in low-income countries, wastewater use for urban and peri-urban agriculture is an emerging priority. Wastewater use for irrigation can offset water scarcity and provide a reliable source of water, improve agricultural productivity, reduce pollution, and create livelihood opportunities for urban households and contribute to
xx
their food security. However, there are tradeoffs that need to be managed including risks to human health, to plant health, and to the environment. Wastewater use in agriculture is a key area for investment; for those governments wishing to make it part of their water resources management strategies the report has the following key recommendations:
The characteristics and key issues related to wastewater irrigation evolve as development occurs. Countries can gain considerable insight into how they might develop wastewater irrigation policies and projects by analyzing their position on the treatment ladder, and the global experience summarized in this report.
As unplanned wastewater irrigation with untreated wastewater around the world appears to be an order of magnitude greater than planned wastewater use, more attention should be paid to addressing and reducing the risks to the environment and especially to public health. The microbial health risks are especially severe in low- and lower-middle-income countries and disproportionately affect urban farmers and consumers, and should be given priority attention.
The 2006 WHO “Guidelines on Wastewater Use in Agriculture” present a new and radically different concept for reducing microbial health risks based on a risk assessment and management framework. For the first time, they provide countries at any level of development with the means to rationally take targeted steps to reduce health risks, even when wastewater treatment is not (yet) an option. The report highlights the basic principles of the framework in an effort to ensure wider dissemination and application.
The increasing industrialization of urban areas requires that chemical risks of wastewater irrigation be addressed, primarily through the introduction, progressive implementation, and enforcement of industrial wastewater pretreatment and control programs.
As water scarcity grows, investment in wastewater treatment and irrigation systems will become more viable. To encourage such investments, governments should determine enabling wastewater use policy, establish a clear regulatory framework (based on the 2006 WHO Guidelines), and develop a strategy and action plan for moving from unplanned to planned wastewater use for irrigation.
The wastewater use policy, the regulatory framework, and the strategy and action plan should all be set within an integrated water resource management context that addresses the institutional/planning, economic/financial, technological, and social issues that have been identified in this report.
The experience of relatively successful countries, such as Israel and Chile, suggests that achieving safe wastewater irrigation requires steady progress on all of these fronts for several decades. Governments should be prepared to make a long-term commitment to action, and should be supported in this endeavor by the international donor community.
1
Chapter 1. Introduction
Wastewater use is a growing practice worldwide.1 As freshwater sources become scarcer, wastewater use has become an attractive option for conserving and expanding available water supplies. Wastewater use can have many types of applications, including irrigation of agricultural land, aquaculture, landscape irrigation, urban and industrial uses, recreational and environmental uses, and artificial groundwater recharge (Asano et al., 2007). Principally, wastewater can be used for all purposes for which freshwater is used, given appropriate treatment. With a few exceptions worldwide, wastewater use applications are restricted to nonpotable uses, or at most to indirect potable uses.
Wastewater use in agriculture is by far the most established application, and the one with the longest tradition. In most cases the irrigated lands are located in or near the urban areas where the wastewater is generated. Estimates on wastewater use worldwide indicate that about 20 million hectares or agricultural land is irrigated with (treated and untreated) wastewater (Jiménez and Asano, 2008). Especially in lower income countries and in arid and semi-arid high-income countries, wastewater irrigation is the most prominent and also the most rapidly expanding wastewater use. Besides increasing water stress, drivers for the expansion include increasing urbanization, growing urban wastewater flows due to the expansion of water supply and sewerage services, and more urban households engaged in agricultural activities that could be intensified with additional sources of irrigation water.
The problem with this growing trend toward more agricultural wastewater use is that in low-income countries, but also many middle-income countries, the practice either involves the direct use of untreated wastewater or the indirect use of polluted waters from rivers and streams. With freshwater either unavailable or too expensive, and wastewater treatment not keeping up with urban growth, urban farmers often have no alternative but to use highly polluted water. Many of them belong to the urban poor who depend on agricultural activities as a source of income and employment generation as well as food security (UNDP, 1996; World Bank, 2000).
Especially when untreated wastewater is used for crop irrigation, it poses substantial risks to public health, not only to the farmers, but also the surrounding communities and the consumers of the crops. The biggest risk to health is microbial risk which arises due to pathogens , i.e. disease-causing organisms, that are usually present in untreated or partially treated (and to some level also in treated) wastewater (Feachem et al., 1983). Many excreta-related diseases can be spread by wastewater use in agriculture to those working in the wastewater-irrigated fields and those consuming wastewater-irrigated foods, especially when
1 This refers to intended use. It should be noted that most wastewater use is unintended. Once discharged to the aquatic environment (treated or untreated), effluents are recycled to the natural water flows from which they are withdrawn again for diverse purposes.

2
eaten uncooked. However, the consumption of wastewater-irrigated foods is only one possible route of transmission, and this route may or may not be of local public health importance.
The 1989 World Health Organization “Guidelines on the Safe Use of Wastewater and Excreta in Agriculture and Aquaculture” have long been the standard reference for regulating the most common water use (WHO, 1989). Later research and results from practice have stressed that they needed to be broadened to better accommodate local conditions and, therefore, should be complemented with other health interventions, such as hygiene promotion.
In 2006 the WHO issued new guidelines which consider addressing wastewater use issues as only one component of an integrated risk management strategy (WHO, 2006). The 2006 Guidelines now include health-based targets, which correspond to the ‘tolerable’ burden of disease that would result from agricultural wastewater use. Models were used to calculate the required levels of pathogen reduction to meet the targets for different types of irrigation scenarios and employing different degrees of wastewater treatment and/or non-treatment options. For different health protection control measures, their potential to reduce the amount of pathogens on the crop has been determined. In this way, it is possible to predict the pathogen reductions achievable with each combination of different health protection control measures, and risk management strategies can be chosen based on the targeted pathogen removal. The 2006 Guidelines are intended to provide a framework that supports the establishment of national standards and regulations for agricultural wastewater us that can be readily implemented and enforced.2 Initial applications of the new framework have been made, but the approach needs to be disseminated more widely. This report hopes to contribute to this effort.
The report, which is based on Economic and Sector Work carried out in the Water Anchor of the World Bank, aims to highlight the growing importance of improving wastewater use in agriculture across the spectrum from lower- to high-income countries. It presents an innovative approach linking key issues related to different aspects of wastewater irrigation to a country’s level of economic development. Based on data presented in the World Bank’s World Development Report (World Bank 2010), it differentiates between four country income levels (lower-income, lower-middle income, upper-middle income, and high-income) to create a typology for analyzing current issues, trends, and priorities for improving agricultural wastewater use with a focus on reducing the risks to public health. It also presents the basic principles of the new 2006 WHO Guidelines, and how to apply them. Beyond regulatory aspects, the report also discusses the other aspects that are important for achieving a more integrated approach to agricultural wastewater use, including institutional/planning, technological, economic/financial, and social issues. Finally, the
2 Although outside of the scope of this report, it should be noted that the framework proposed by WHO for wastewater use in aquaculture is similar to that for wastewater use in agriculture (WHO, 2006).

3
report provides recommendations for moving the wastewater irrigation agenda forward. The primary audiences for the report are water professionals, regulators and decision-makers who help to plan and implement projects for wastewater use in agriculture and to develop a coherent policy and regulatory framework for such activities.
The report is organized as follows: Key issues and trends in wastewater use in agriculture are discussed in chapter 2, supported by the introduction and application of the country typology based levels of economic development. Chapter 3 reviews the benefits and risks of wastewater irrigation, with the main risk being the microbial risk to public health. The microbial risk assessment and management framework of the 2008 WHO Guidelines is discussed in Chapter 4. Based on that, Chapter 5 discusses implementation measures for reducing public health risks, and broader issues for achieving a more integrated approach to planned wastewater use for irrigation and to urban water management. Finally, Chapter 6 summarizes the key messages of the report and discusses how countries can tailor a wastewater irrigation strategy to fit their unique circumstances.
4
Chapter 2. Issues and Trends in Wastewater Use in Agriculture
2.1 Wastewater use in agriculture: past and current practice
The use of domestic wastewater for agriculture is not new. The Minoans may have collected wastewater for reuse at Knossos, Crete, some 4000 years ago (Angelakis et al., 2005). In East Asia, human excreta have been used to fertilize crops and replenish depleted soil nutrients since ancient times. In his seminal treatise on traditional Asian agriculture, Farmers of Forty Centuries, F. H. King (1911) noted: “One of the most remarkable agricultural practices adopted by any civilized people is the centuries-long and well nigh universal conservation and utilization of all human waste in China, Korea and Japan, turning it to marvelous account in the maintenance of soil fertility and in the production of food.”3 The earliest documented sewage farms—where wastewater is applied to land for disposal and for agricultural use—were operated in the sixteenth and seventeenth centuries in Bunzlau, Germany and Edinburgh, Scotland (Shuval et al, 1986).
With the advent of water-borne municipal sewage in the mid-nineteenth century, sewage farms were increasingly seen as a solution for the disposal of burgeoning volumes of wastewater from many rapidly growing cities of Europe and the United States including London, Paris, and Berlin. The benefits cited included the prevention of river pollution and the provision of water and nutrients to agriculture. With the development around 1913 of biological wastewater treatment processes, such as trickling filters and activated sludge, that require much less land, sewage farms fell into decline in urbanized industrialized countries (Asano et al, 2007). Odors and concerns about public health, such as the possible transmission of disease from vegetables irrigated with raw sewage, also contributed to the decline of sewage farms and their almost complete abandonment in much of the western world (Shuval et al, 1986). In a few notable exceptions, including Melbourne (Box 2.1), sewage farming was modernized, and wastewater irrigation continues to flourish today.
After World War II scientific and engineering interest in wastewater treatment and disposal through land application grew in both industrialized and developing countries, particularly in the more arid regions. It was seen as a way to prevent river pollution and to increase the supply of water resources for agricultural development.
3 Cited in e-book http://www.gutenberg.org/etext/5350, p. 51.

5
Box 2.1 Sewage Farming in Melbourne, Australia
Sewage farming at the Werribee Farm, Melbourne, began in 1897, and sheep and cattle grazed the lush pasture produced by the wastewater-irrigated land. Today known as Melbourne Water’s Western Treatment Plant, the plant treats some 485,000 cubic meters of wastewater per day in waste stabilization ponds, the effluent from which is used to irrigate pasture, local golf courses, and vegetables in local horticultural enterprises. The Werribee Agriculture Group, a separate business unit of Melbourne Water, manages the grazing of 15,000 cattle and 40,000 sheep on over 8,500 hectares of pasture at the Western Treatment Plant, making Melbourne Water the largest livestock producer in the State of Victoria and enabling it to reduce substantially the cost of wastewater treatment.
Sources: Penrose 2001. www.melbournewater.com.au/content/sewerage/sewerage.asp
Researchers in the United States further investigated the microbiological and public health aspects of wastewater use in agriculture, with the goal of providing a rational basis for evaluating the health risks from the microbial contamination of crops. State health departments established guidelines and regulations to control the sanitary aspects of wastewater irrigation. The state of California was a pioneer; it issued the first regulations in 1918, later modifying them to make them more stringent (Asano and Levine, 1996; see also Annex A). The California regulations provided design engineers, public health authorities, and farmers in the United States with a carefully worked out, rational basis for reintroducing wastewater irrigation in agriculture as a socially acceptable and sanitary practice that could meet the strictest public health criteria. They were replicated or used as a basis for similar regulations in many parts of the world, including developing countries.
Shuval et al. (1986, p.8) summarized these developments as follows: “During the past 100 years, then, the concept of land application and wastewater reuse has gone through a complete cycle. Starting with official blessing and enthusiastic initiation of land application and sewage farming projects in England, Europe, and the United States, it soon became almost the sole method of disposing of municipal wastewater. In the early years of the twentieth century, however, the projects were often ill-conceived, inadequately funded, and poorly regulated, and thus were eventually abandoned. Subsequently, the concept of reuse fell into disrepute. Today, wastewater reuse is becoming widely accepted once again, except that now it is based on more rational scientific and engineering principles. In some countries it is used to control water pollution, but more frequently it is seen as an economically feasible source of water in water-short areas.”
During the past four decades, the use of wastewater in agriculture has become more common, especially in developing countries and in semi-arid and arid areas of industrialized countries. When discussing current practice of wastewater use in agriculture, three issues should be kept in mind: First, wastewater is predominately generated by various urban activities; they are further discussed in Box 2.2. Second, different types of wastewater are used in agriculture; a typology is provided in Box 2.3. And, third, wastewater irrigation is generally limited to agricultural areas near the communities that generate the wastewater; this makes urban and

6
peri-urban areas the target for wastewater use, and irrigated agriculture in and near urban areas the farming system most likely affected.
Box 2.2 Urban Wastewater—The Basics
Urban wastewater usually refers to a combination of one or more of the following flows generated by various urban activities (van der Hoek, 2004):
Domestic effluent consisting of blackwater (feces, urine and associated sludge, i.e. toilet water) and greywater (kitchen and bathing wastewater)
Water from commercial establishments and institutions, including hospitals
Industrial effluent where present
Storm water and other urban runoff
About 80 to 90 percent of the urban water supply to homes, businesses and industries is not consumed by users but is returned to the urban environment as wastewater (Tchobanoglous and Schroeder 1985; Asano et al, 2007). Because urban wastewater contains human excreta and may also contain hazardous chemicals from industry, households, and other sources, it is polluted and constitutes a serious health hazard to local populations. A common health protection measure is to isolate the hazard from local residents by constructing a sewer system to evacuate the wastewater from the neighborhood.
Where sewerage is provide, it concentrates the wastewater flow and transports the associated pollution and health hazards to a downstream location where both downstream populations and water resources are at risk. If such hazards are significant, they can be reduced or controlled by treating the wastewater up to a defined standard in a wastewater treatment plant consisting of one or more physical, chemical and/or biological processes. If the standard is not achieved, the wastewater is considered at best as partially treated. Wastewater treatment produces sludge, a contaminated byproduct that is also a health hazard and requires safe management and disposal.
Where sewerage is not provided, safe wastewater management can be achieved at the domestic level through on-site sanitation options such as simple pit latrines, ventilated improved pit latrines, dry toilets, non-sewered public toilets and aqua privies, and septic tanks. All of the on-site options remain with the problem of accumulating fecal sludge that must periodically be safely removed and disposed so that it does not constitute a public health hazard. In communities without sewerage, the same care has to be applied to greywater flows which may contain significant amounts of excreta derived pathogens, and usually end up in stormwater drains.

7
Box 2.3 Wastewater Use in Agriculture—A Typology
Various attempts have been made to provide a broad typology of wastewater reclamation and use in agriculture (e.g., Asano et al, 2007) or a more restricted typology for wastewater irrigation in developing countries (e.g., von der Hoek, 2004), but differences persist in the terminology used by professionals in this field. The following definitions and distinctions are used in this report:
Direct use of treated (or reclaimed) wastewater is the use of reclaimed water that has been transported from the point of treatment or production to the point of use without an intervening discharge to surface water or groundwater body.
Direct use of untreated wastewater is the use of raw wastewater from a sewage outlet, directly disposed of on land where it is used for crop production.
Indirect use of untreated wastewater is the abstraction of usually diluted wastewater (or polluted stream water) for irrigation. This is common downstream of urban centers where treatment plants are limited. Farmers might or might not be aware of the water quality challenge.
Planned wastewater use is the conscious and controlled use of wastewater either undiluted (direct) or diluted (indirect). Most use of untreated wastewater is unplanned and indirect. Within the category of planned wastewater use for irrigation, two subcategories are important: o Restricted irrigation is the controlled use of wastewater to grow crops that are not eaten
raw by humans; and o Unrestricted irrigation is the controlled use of treated wastewater to grow crops that are
normally eaten raw.
Source: WHO 2006; Jimenez et al. 2010.
Data on current wastewater use in agriculture in different countries worldwide are mostly based on rough estimates. Estimates of the volume of wastewater used in for irrigation are shown in Table 2.1.4
4 The volume estimates mask the exemplary practices of some of the smaller countries in arid zones. See Table 2.5.

8
Table 2.1 The twenty countries with the largest volume of wastewater used for irrigation
Country
Wastewater used for
irrigation (m3/d)
Country
Wastewater used for
irrigation (m3/d)
Mexico 4,493,000 Iran 422,000
Egypt 1,918,000 Chile 380,000
China 1,239,000 Jordan 225,000
Syria 1,182,000 UAE 200,000
Spain 932,000 Turkey 137,000
USAa 911,000 Argentina 130,000
Israel 767,000 Tunisia 118,000
Italy 741,000 Libya 110,000
Saudi Arabia 595,000 Qatar 80,000
Kuwait 432,000 Cyprus 68,000 a California and Florida. Source: Jiménez and Asano 2008.
Estimates on the agricultural areas irrigated with wastewater, both treated and untreated, are shown in Figure 2.1.
Jiménez and Asano (2008) report that globally about 20 million hectares of agricultural land is irrigated with polluted water (i.e., direct use of raw or untreated wastewater, direct use of treated wastewater, as well as indirect use of untreated wastewater). According to Pearce (2004), “a tenth of the world's irrigated crops—everything from lettuce and tomatoes to mangoes and coconuts—are watered by sewage, and much of that sewage is raw and untreated, gushing direct from sewer pipes into fields at the fringes of the developing world's great megacities”.5 The estimates suggest that the extent of unplanned wastewater irrigation (with direct and indirect use of untreated wastewater) is an order of magnitude greater than planned wastewater use (with direct use of treated water and some indirect use of untreated water) (Scott et al. 2010). In lower income countries, wastewater irrigation is predominantly unplanned and either involves the direct use of untreated wastewater or the indirect use of highly polluted waters from rivers and streams. Farmers seldom have other water sources, and unplanned wastewater use is their only means to irrigate when investments in wastewater treatment do not keep pace with urban growth, and/or no other measures are undertaken for a more controlled use of wastewater. In higher income countries where wastewater irrigation occurs, it is normally planned use with treated wastewater.
5 http://www.newscientist.com/article/dn6297

9
Figure 2.1 Countries with largest areas irrigated by untreated and treated wastewater.
Sources: Scott et al. 2010; Jiménez and Asano 2008; Xianjun et al. 2003 ; Xie et al. 2009. *Data uncertain; (1) Area probably underestimated; + Practice reported (including forestry), but data missing
2.2 Key issues in wastewater use in agriculture
2.2.1 Levels of economic development and wastewater issues
The assessment of current practice in wastewater use in agriculture reveals important patterns between a country’s economic status (low-income, lower-middle income, upper-middle income, and high-income) and the types of wastewater issues it faces. Inadequate water supply, sanitation, and unplanned, untreated wastewater use in urban areas are associated with a low level of economic development. Higher levels of economic development are associated with the provision of adequate water supply, sanitation, wastewater treatment for the vast majority of the urban population, and the planned use of wastewater. Based on these patterns, this report uses an innovative approach that distinguishes four country income levels based on 2008 national GNI per capita data from the World Bank’s World Development
Treated wastewater
China 4 million ha; out of proportion
Untreated wastewater
Treated wastewater
0 10 20 30 40 50 60 70 80 90 100 110 120 130 140 150 160 170 180 190 200
Germany S. Arabia
Libya(1) France
Oman(1) Kuwait(1)
Tunisia Syria#
Turkey* Jordan
USA UAE(1)
Australia Argentina
Italy* Cyprus Egypt*
Israel(1)* Mexico
Chile
Bolivia#
Nepal(1) Tunisia Sudan Kuwait#
Egypt(1) Morocco
Turkey Peru
Vietnam Ghana*
SA* Argentina Colombia Pakistan
Syria* Chile(1)* India(1)* Mexico
China*
Area ( '000 ha)
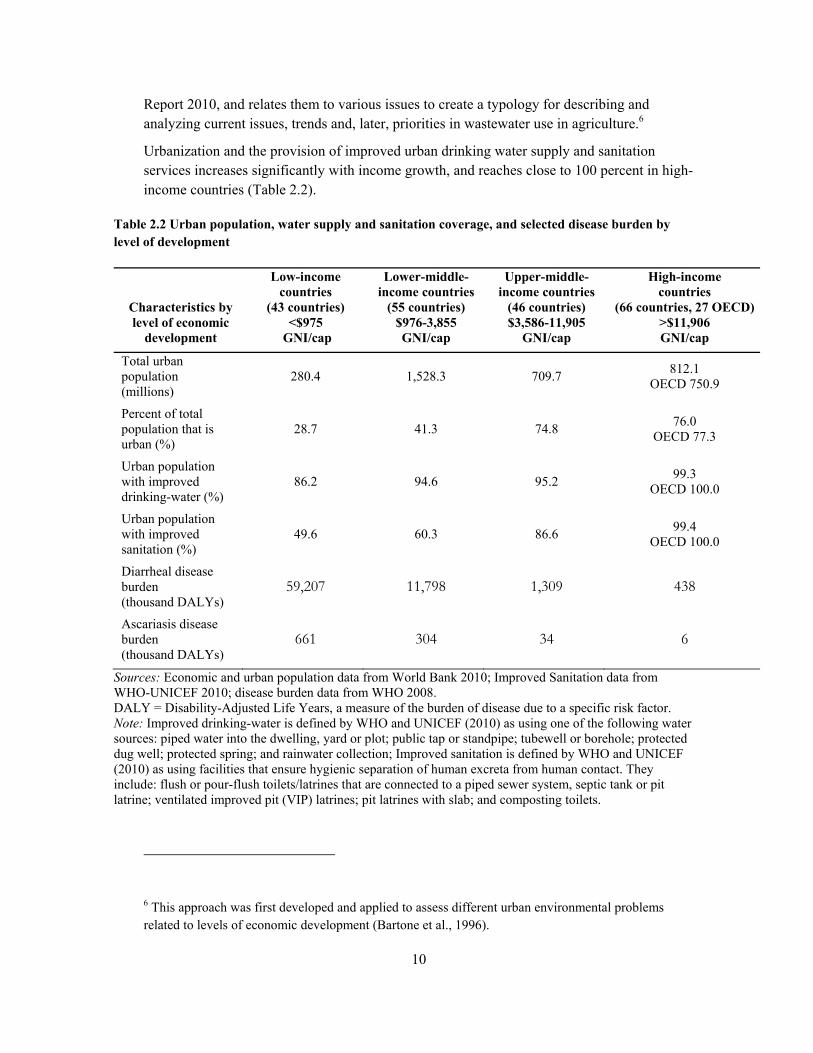
10
Report 2010, and relates them to various issues to create a typology for describing and analyzing current issues, trends and, later, priorities in wastewater use in agriculture.6
Urbanization and the provision of improved urban drinking water supply and sanitation services increases significantly with income growth, and reaches close to 100 percent in high-income countries (Table 2.2).
Table 2.2 Urban population, water supply and sanitation coverage, and selected disease burden by level of development
Characteristics by level of economic
development
Low-income countries
(43 countries) <$975
GNI/cap
Lower-middle-income countries
(55 countries) $976-3,855 GNI/cap
Upper-middle-income countries
(46 countries) $3,586-11,905
GNI/cap
High-income countries
(66 countries, 27 OECD)>$11,906 GNI/cap
Total urban population (millions)
280.4 1,528.3 709.7 812.1
OECD 750.9
Percent of total population that is urban (%)
28.7 41.3 74.8 76.0
OECD 77.3
Urban population with improved drinking-water (%)
86.2 94.6 95.2 99.3
OECD 100.0
Urban population with improved sanitation (%)
49.6 60.3 86.6 99.4
OECD 100.0
Diarrheal disease burden (thousand DALYs)
59,207 11,798 1,309 438
Ascariasis disease burden (thousand DALYs)
661 304 34 6
Sources: Economic and urban population data from World Bank 2010; Improved Sanitation data from WHO-UNICEF 2010; disease burden data from WHO 2008. DALY = Disability-Adjusted Life Years, a measure of the burden of disease due to a specific risk factor. Note: Improved drinking-water is defined by WHO and UNICEF (2010) as using one of the following water sources: piped water into the dwelling, yard or plot; public tap or standpipe; tubewell or borehole; protected dug well; protected spring; and rainwater collection; Improved sanitation is defined by WHO and UNICEF (2010) as using facilities that ensure hygienic separation of human excreta from human contact. They include: flush or pour-flush toilets/latrines that are connected to a piped sewer system, septic tank or pit latrine; ventilated improved pit (VIP) latrines; pit latrines with slab; and composting toilets.
6 This approach was first developed and applied to assess different urban environmental problems related to levels of economic development (Bartone et al., 1996).

11
The table also shows that the disease burdens for diarrheas and Ascariasis decrease rapidly as development occurs—an important observation since both diseases are linked to irrigation of food crops with untreated wastewater.
Countries progress up the treatment ladder from untreated to treated wastewater as per capita incomes increase (Table 2.3). This progression has occurred historically in developed countries and is currently occurring at different paces in emerging countries. It should be noted that there can also be substantial variations among and within the countries that are grouped together in a particular country type. Some countries may be more advanced than others (for example, because of one or more of the drivers discussed in Chapter 2); and within countries, subnational geographic disparities may persist (for example, upper-middle income countries may have pockets with conditions of low-income countries). Nevertheless, the broad typology is useful for assessing key relationships.
Table 2.3 Urban sanitation and wastewater treatment characteristics by level of economic development
Characteristics by level of economic
development
Low-income countries
(43 countries) <$975
GNI/cap
Lower-middle-income countries
(55 countries) $976-3,855 GNI/cap
Upper-middle-income countries
(46 countries) $3,586-11,905
GNI/cap
High- income countries
(66 countries, 27 OECD) >$11,906 GNI/cap
Access to basic sanitation services
Low coverage, especially for urban poor; Mainly non-sewered options
Increasing coverage but low access for urban poor; Increasing use of sewerage
Generally acceptable coverage; Higher sewerage levels
Good coverage; Mainly sewered
Wastewater treatment
Virtually no treatment or very few treatment facilities; Severe operational deficiencies; Affordability issues dominate
Some treatment facilities; Often poorly operated and/or design capacity exceeded; Affordability issues persist
Increasing treatment capacity; Continued operational deficiencies; Difficulties in mobilizing needed investments
Generally high treatment levels; Increasing investments over past 20 years in non-OECD countries; Major investments over past 40-50 years in OECD countries
Water pollution issues
Health problems from inadequate sanitation and raw domestic sewage “in the streets”
Severe health problems from untreated municipal discharges
Severe pollution problems from poorly treated municipal and mixed industrial discharges
Primarily concerned with amenity values and toxic substances
Sources: Adapted from Bartone 1997; income data from World Bank 2010.
Wastewater treatment in low-income countries. In low-income countries, wastewater treatment plants, if they exist, are minimal or function poorly, and basic sanitation is the primary focus. In Ghana, for example, about 70 mostly decentralized wastewater and fecal sludge treatment plants collect less than 10 percent of the generated wastewater. Of the 70

12
plants, about 10 function more or less as designed, and most of these belong to larger hotels (Murray and Drechsel 2010). Under these circumstances, the key pollution concern is to protect public health by isolating households from fecal sludge and raw domestic sewage in the streets.
In these countries, policymakers and consumers face financial, institutional, and technical challenges when considering improvements in sanitation and wastewater management. Affordability is a critical issue. Only non-conventional, low-cost sewerage and treatment options are likely to be feasible alternatives to on-site sanitation options except in the city centers and richer neighborhoods of the larger cities.
Two key constraints affecting many wastewater collection and treatment systems in low-income countries are the high frequency of power-cuts and the low volumes of water supply per capita. Frequent power outages can affect pumps as well as treatment plants. Where sewers exist, many fall into disrepair due to temporal or general lack of sufficient water quantities to flush them.
Wastewater treatment in middle-income countries. In middle-income countries, particularly upper-middle-income countries, wastewater management is becoming an increasingly important concern, and more complex regulatory structures are being developed, along with the political will and the financial resources to implement them. Wastewater treatment has advanced, but both operational deficiencies and difficulties in mobilizing needed investments and operating funds still persist. An example of the wastewater treatment experience of Latin America and the Caribbean (LAC) region, a predominantly middle-income region, is provided in Box 2.4. Statistics about wastewater treatment capacity can be misleading since they usually refer to installed capacity rather than real capacity, as is exemplified by a survey of LAC countries (Egocheaga and Moscoso 2004) and a study from China (Xie et al., 2009).
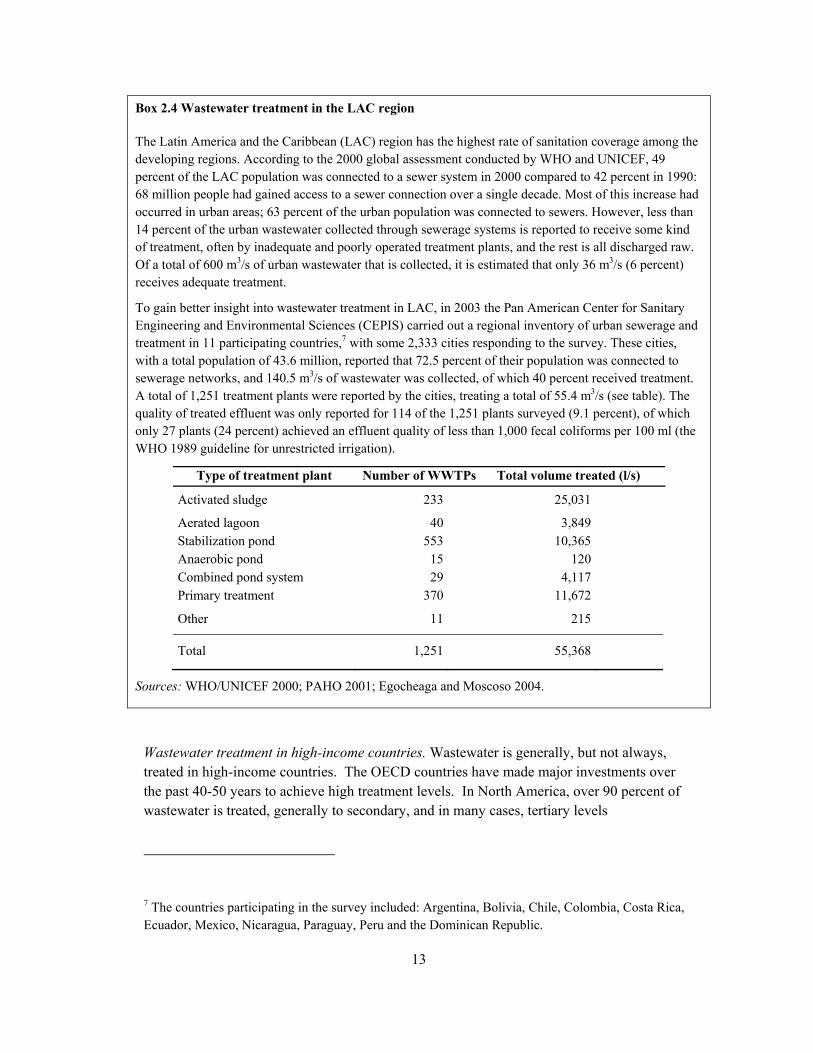
13
Box 2.4 Wastewater treatment in the LAC region
The Latin America and the Caribbean (LAC) region has the highest rate of sanitation coverage among the developing regions. According to the 2000 global assessment conducted by WHO and UNICEF, 49 percent of the LAC population was connected to a sewer system in 2000 compared to 42 percent in 1990: 68 million people had gained access to a sewer connection over a single decade. Most of this increase had occurred in urban areas; 63 percent of the urban population was connected to sewers. However, less than 14 percent of the urban wastewater collected through sewerage systems is reported to receive some kind of treatment, often by inadequate and poorly operated treatment plants, and the rest is all discharged raw. Of a total of 600 m3/s of urban wastewater that is collected, it is estimated that only 36 m3/s (6 percent) receives adequate treatment.
To gain better insight into wastewater treatment in LAC, in 2003 the Pan American Center for Sanitary Engineering and Environmental Sciences (CEPIS) carried out a regional inventory of urban sewerage and treatment in 11 participating countries,7 with some 2,333 cities responding to the survey. These cities, with a total population of 43.6 million, reported that 72.5 percent of their population was connected to sewerage networks, and 140.5 m3/s of wastewater was collected, of which 40 percent received treatment. A total of 1,251 treatment plants were reported by the cities, treating a total of 55.4 m3/s (see table). The quality of treated effluent was only reported for 114 of the 1,251 plants surveyed (9.1 percent), of which only 27 plants (24 percent) achieved an effluent quality of less than 1,000 fecal coliforms per 100 ml (the WHO 1989 guideline for unrestricted irrigation).
Type of treatment plant Number of WWTPs Total volume treated (l/s)
Activated sludge 233 25,031
Aerated lagoon 40 3,849 Stabilization pond 553 10,365 Anaerobic pond 15 120 Combined pond system 29 4,117 Primary treatment 370 11,672
Other 11 215
Total 1,251 55,368
Sources: WHO/UNICEF 2000; PAHO 2001; Egocheaga and Moscoso 2004.
Wastewater treatment in high-income countries. Wastewater is generally, but not always, treated in high-income countries. The OECD countries have made major investments over the past 40-50 years to achieve high treatment levels. In North America, over 90 percent of wastewater is treated, generally to secondary, and in many cases, tertiary levels
7 The countries participating in the survey included: Argentina, Bolivia, Chile, Colombia, Costa Rica, Ecuador, Mexico, Nicaragua, Paraguay, Peru and the Dominican Republic.
14
(WHO/UNICEF, 2000). Progress in the United States has largely been the result of a subsidy program in which US$56 billion in federal construction grants were provided to local governments from 1972–1989 to build mandated secondary treatment facilities, but these grants were eliminated and subsequently replaced by state revolving funds for loans to municipalities (Bartone, 1997).
In Europe, driven by the 1991 European Union (EU) Directive on Urban Waste Water Treatment, over 68 percent of wastewater is treated (CEC, 2004). However, performance varies greatly across EU countries and in 2003 only Austria, Denmark, Germany, and the Netherlands fully complied with the directive. In other countries significant amounts of wastewater—from 40 to 60 percent—were still not being treated adequately before being discharged into the surface waters of the Member States. According to the European Commission, the directive represents the most cost intensive European legislation in the environmental sector. The EU estimates that €152 billion were to be invested in wastewater treatment from 1990 to 2010. The EU provides support for the implementation of the directive in the order of €5 billion per year.
The industrialized countries are now placing more focus on how to improve the management of wastewater sludge and biosolids (UN-HABITAT, 2008). Much of this progress in wastewater treatment has been driven by the desire to protect the aquatic environment and amenity values, and to control toxic substances such as trace chemicals, heavy metals, and newly perceived problems of endocrine-disrupting compounds (EDCs), and pharmaceuticals and personal care products (PPCPs).
Many of the non-OECD high-income countries have made substantial investments in wastewater treatment over the past two decades and have implemented more complex and comprehensive regulatory frameworks. Advance treatment systems have been built, particularly in the high-income Mediterranean Basin and Middle Eastern Countries where the investments have been driven by severe water scarcity.
2.2.2 Levels of economic development and issues in wastewater irrigation
The different wastewater treatment characteristics discussed above are a significant determinant of the key issues in wastewater use in agriculture, again classified along the four types of countries. Again countries tend to progress from unplanned to planned wastewater irrigation as per capita incomes increase (Table 2.4). But a number of constraints need to be addressed during this progression. They include not only technical issues (e.g., the emerging need to increase wastewater treatment), but also institutional (e.g., coordination among stakeholders), regulatory (e.g., wastewater use guidelines), economic/financial (problems of water pricing), and social issues (e.g., perceptions of safety of wastewater use).

15
Table 2.4 Wastewater use for irrigation by level of economic development
Characteristics by level of economic
development
Low-income countries
(43 countries) <$975
GNI/cap
Lower-middle-income countries
(55 countries) $976-3,855 GNI/cap
Upper-middle-income countries
(46 countries) $3,586-11,905
GNI/cap
High-income countries
(66 countries, 27 OECD) >$11,906 GNI/cap
Wastewater use practices
Indirect use of untreated wastewater commonplace due to widespread pollution; Direct use of untreated wastewater and fecal sludge commonplace, especially in water short areas
Indirect use of untreated effluents commonplace; Direct use of untreated wastewater still observed; Direct use of treated effluents appearing
Direct use of treated effluents on the increase; Indirect use of untreated effluents still problematic but increasingly regulated
Direct use of reclaimed wastewater commonplace in agriculture and industry
Wastewater use policy framework
Generally non-existent or unenforced; Informal (or unplanned) use predominates
Emerging policies and framework; Enforcement capacity a major concern
Use policies generally defined within water resources management framework; Enforcement capacity increasing
Use policies established and enforced, often within an integrated water resources management framework, especially in water short areas
Wastewater use health issues
High burden of helminthic and diarrheal diseases (both occupational and consumer exposure); Difficult to distinguish cause due to high background levels from lack of basic water and sanitation services
Continued concern with helminthic and diarrheal diseases (both occupational and consumer exposure); Uncontrolled industrial discharges problematic in emerging economies
Observed outbreaks of typhoid and cholera linked to agricultural use of untreated sewage; Increasing concern with industrial discharges into municipal sewer systems
Pathogens under control; Industrial discharges under control; Primarily concerned with amenity values and exotic toxic substances
Drivers of wastewater use
Subsistence agriculture in and around cities in search of water; Livelihood opportunities; Proximity & reliability of supply; Nutrient value of wastewater
Water scarcity or drought; Urban food demand;Proximity & reliability of supply; Nutrient value of wastewater; Exports protection
Water scarcity or drought; Proximity & reliability of supply; Food security; Pollution of traditional water sources; Exports protection
Water scarcity or drought; Pollution prevention; Food security; Exports protection
Key wastewater use countries
Sub-Saharan Africa except South Africa; Vietnam, Yemen
Bolivia, China, Egypt, India, Iran, Jordan, Morocco, Pakistan, Sudan, Syria, Tunisia, West Bank and Gaza
Argentina, Chile, Colombia, Lebanon, Libya, Mexico, Peru, South Africa
Non-OECD: Bahrain, Cyprus, Israel, Kuwait, Malta, Oman, Qatar, Saudi Arabia, UAE OECD: Australia, France, Greece, Italy, Japan, Portugal, Spain, US (e.g., CA, FL, AZ)
Sources: Shuval et al. 1986; Bartone 1997; Scott et al. 2004; WHO 2006; Jimenez and Asano 2008a; UN-HABITAT 2008; and Drechsel et al. 2010. Income data from World Bank 2010.
16
Wastewater irrigation in low-income countries. In low-income countries, the direct use of untreated wastewater and fecal sludge in urban and peri-urban agriculture is common, particularly in, but by no means restricted to, drier areas. Box 2.5 provides an example from the city of Kumasi in Ghana.
Wastewater provides a reliable source of scarce water in the dry season, permitting multiple crops throughout the year. Production in the off-season, when larger scale dry farming is limited, gives urban and peri-urban agriculture a competitive advantage. Wastewater also contains valuable plant nutrients: crop yields are higher when crops are irrigated with undiluted wastewater than with freshwater. Where sewerage is provided—often only to city centers and higher income neighborhoods—the untreated or poorly treated effluents are discharged to the nearest drainage channel or watercourse, from which the wastewater is taken by farmers to irrigate communal or peri-urban plots. Where there is no sewerage, wastewater flows end up in gutters and open storm drains where they are often still accessible to urban farmers. When the wastewater enters other surface water bodies used for irrigation, all farmers depending on these water sources in and downstream of the cities are affected. In areas with relatively abundant water, this wastewater is usually diluted by its receiving water body, but in drier regions wastewater can remain virtually undiluted. In urban slums and informal settlements where on-site sanitation predominates, greywater, blackwater and/or fecal sludge is used to irrigate and fertilize household gardens or communal plots.
Urban farmers in low-income countries use wastewater for irrigating their crops because it cannot be avoided; the use of wastewater for irrigation is a reality that cannot be denied or effectively banned (Buechler et al, 2002; Drechsel et al., 2002; Scott et al. 2004). Properly managed, wastewater irrigation contributes significantly to sustaining livelihoods, food security, and the quality of the environment. Improperly managed, it imposes significant health risks on farmers and consumers leading to a costly burden of diarrheal and parasitic diseases, and of environmental degradation.

17
Box 2.5 Wastewater use in a low-income country: Kumasi, Ghana
In Kumasi, Ghana, with a population of about 1.1 million in 2000, and a population growth rate of 6 percent, 80–90 percent of the perishable vegetables consumed in the city are produced on a few sites in the city itself. Farmers take advantage of fertile soils along streams and drains passing the city to grow popular exotic vegetables such as spring onions, lettuce and, cabbage which require frequent watering. Although exotic crops are not part of the traditional diet, they are in high demand in the booming street food sector where the common ‘rice and chicken’ dish now comes with a raw salad. Since wastewater collection and treatment only covers 4 percent of the city, all streams are heavily polluted with stormwater, grey water, and excreta, resulting in fecal coliform levels on the vegetables of 106-7 at farm gate. As security of land tenure is low, farmers hardly ever invest in irrigation infrastructure except for mobile equipment such as watering cans, small 2-4 KW pumps, or dugouts near or in smaller streams.
Like in most parts of West Africa, the typical urban vegetable farmer is a male 30–40 years old, and very often a migrant from the another region. The land he is farming is likely government-owned, and may be considered unfit for construction. Individual plots are only 0.05-0.1 hectares large but labour-intensive. Lettuce cultivation is especially labour-intensive, requiring twice-daily watering which consumes up to 60 percent of the labour input. Although Kumasi lies in the humid tropics with annual rainfall of 1400 millimeters, crops must be watered every day that it does not rain. The highest profits are obtained in the two short dry (lean) seasons. Over the year, farmers specialized in exotic vegetables might harvest up to 10 lettuce crops, 2–3 cabbage, and 8–9 times spring onions and can earn about US$400-800 which is at least twice as much as their colleagues who depend on rainfed maize and cassava. Rainfed farmers who switch to irrigated vegetables in the dry season can earn about US$300-500 per year. These urban and peri-urban farmers are examples of the booming informal irrigation sector in sub-Saharan Africa and supply nearly all of the perishable produce for urban consumption (about 1,350 tonnes of lettuce and 7,400 tonnes of cabbage per year in Kumasi). Due to the high profits, urban farming is the main and often only occupation of these farmers.
While the total farming area in the city is small (40–50 hectares under irrigation), there are about 11,900 hectares under dry season vegetable production in a 40 kilometer radius around Kumasi, cultivated by about 12,700 households. These plots are larger and have tenure security, farmers tend to be natives rather than migrants and are on average older (37 years) than those on urban plots. Up to 70 percent of the water comes from polluted streams and rivers (103-6 fecal coliforms), 21 percent from shallow dugouts, and 9 percent from other sources. Many dugouts are adjacent to the streams and are equally polluted. As in the city, watering cans are the most common irrigation tool.
The irrigated farming around Kumasi covers more than twice the area than is under formal irrigation in the rest of Ghana where in 22 irrigation schemes only about 5,600 hectares are farmed using irrigation. It is only in 2006, with support from FAO and IWMI, that the irrigation authorities and related ministries recognized the contribution of the informal irrigation sector in Ghana’s new national irrigation policy and strategy which was endorsed in 2009. The new policy recognizes the constraints of the informal sector, such as credit access, as well as its challenges, like the use of unsafe water in urban and peri-urban farming. It recommends to “Identify, evaluate and where feasible implement or disseminate as appropriate, promising and affordable technologies (including water treatment options) for making the most of specific local conditions and resource endowments for urban and peri-urban irrigation” (Government of Ghana, 2006, p.14).
Sources: Obuobie et al., 2006, Drechsel et al., 2007; Cornish and Lawrence, 2001
18
Wastewater irrigation in middle-income countries. In the arid and semi-arid middle-income countries a common transition is observed: wastewater irrigation grows in scale because of increasing levels of sewerage and the gradual introduction of treatment. The unplanned direct use of untreated wastewater still occurs, but the following scenarios assume greater importance:
The indirect and unplanned use of untreated effluents becomes a growing concern as cities discharge larger volumes of untreated effluents into nearby rivers with the resulting pollution of traditional irrigation sources (e.g., Santiago, Chile).
In some cases untreated effluent may constitute nearly all the dry-weather flow in rivers used for irrigation, so that indirect use in reality is closer to direct reuse (e.g., Lima, Peru).
Some countries, including some of the lower-middle-income countries, have introduced the planned use of treated wastewater, both indirect (e.g., Jordan) and direct (e.g., Tunisia).
Case studies (Boxes 2.6–2.9) show that even lower-middle-income countries can make significant improvements in wastewater irrigation schemes when driven by concerns about health, water scarcity and drought, proximity and reliability of water supply, urban food demand and food security, protection of agricultural export markets, and the pollution of critical water sources. It is apparent that the experience of epidemics or acute water shortages can contribute significantly to the formation of political resolve as a critical element to achieve improvements and to drive progress toward coherent wastewater use and water resources management policies and goals. Also, the introduction of wastewater treatment is an essential step toward achieving planned reuse. However, in most middle-income countries emerging wastewater management still coexists with extensive water pollution and wastewater reuse issues.
19
Box 2.6 Santiago, Chile—indirect use of untreated wastewater
In 1991, the Greater Santiago urban area had a population of 4.7 million and generated 13 m3/s of domestic and industrial wastewater. The latter was projected to double over the next 30 years. The collected wastewater was discharged in more than 40 spots along three major natural river channels that drain the metropolitan area: the Mapocho River, the Maipo River, and the Zanjon de la Aguada. The resulting pollution of the three water courses in turn polluted the entire network of irrigation canals that derive from them and irrigated some 130,000 hectares of high-producing agricultural lands, including 7,000 hectares used for growing vegetable crops for raw consumption in the Santiago market. The larger area also produces 40 percent of Chile’s fruit exports, a major industry for the country, and to a lesser extent vegetable exports.
Endemic typhoid had persisted for decades in Santiago until 1991, with incidence rates in some years reaching hyper-endemic levels in excess of 150 cases per 100,000 population. Epidemiological studies linked typhoid transmission in Santiago to the indirect use of wastewater for irrigation of vegetables via the “long cycle” (infected individual → sewage → water pollution → food → people). The incidence of typhoid in Santiago far exceeded rates in the rest of Chile, and exhibited a seasonal variation with more cases in the dry summer months coinciding with irrigation and vegetable harvesting. Also, the causal agent of typhoid (Salmonella typhi) was isolated directly from irrigation water. The appearance of cholera in Santiago in 1991, when a major cholera epidemic broke out in Latin America, raised another serious health threat to the local population since cholera is spread similar to typhoid via the “long cycle.” The cholera outbreak also posed a considerable threat to Chile’s agricultural export business that was valued at $1.1 billion annually.
How the Chilean authorities confronted and overcame these threats through decisive interventions is described in detail Box 5.3. To briefly summarize, an emergency control program was put into place to improve water quality, change irrigation practices, and change consumer behavior. This was accompanied by health education campaigns and intensive press coverage about cholera and typhoid. The emergency program achieved immediate results, and was later supplemented by development of a sanitation plan in 1998 that will be completed in 2012 when all of Santiago’s wastewater will be treated.
Sources: Bartone 1994; Ferreccio 1995; Larrain 2009.

20
Box 2.7 Lima, Peru—indirect use of untreated wastewater
The Agricultural Zone of San Augustín (ZASA) is an organization of 145 families formed in 1972, who occupy an area of 540 hectares which is completely surrounded by the urban fabric of the Lima-Callao metropolitan region. ZASA annually produces more than 15,000 tons of vegetables that are sold in the markets of Lima (about 20 percent of the vegetables sold in the city). ZASA is irrigated with water from the Rimac River. However, during all but a few months a year, the flow in the river is basically domestic and industrial wastewater discharged just upstream and further degraded by garbage that is illegally dumped in the river. Under increasing pressure from the health authorities because of the significant health risks posed, and the threat of urban encroachment, ZASA is proposing to construct a waste stabilization pond system comprising 30 hectares of ponds in series (anaerobic + secondary + polishing) to achieve 1989 WHO guidelines for unrestricted irrigation. It would treat 400 l/s of raw sewage supplied directly from a nearby interceptor by the Lima water company. The treatment plant would be built by ZASA with a government line of credit (8 years at 8 percent interest). The property owners whose land is occupied by the ponds would be paid the value of their foregone farm profits by the other families. The project would be paid off in 10 years with an estimated financial rate of return of 92.2 percent and a benefit/cost ratio of 2.82, making it appear to be a financially sound and profitable venture.
Source: Egocheaga and Moscoso (2004).
Box 2.8 Amman, Jordan—indirect use of treated wastewater
Jordan is one of the most water-deprived countries of the Middle East, and has some of the highest groundwater depletion rates. To meet growing water demands, more than 70 million m3 of reclaimed wastewater, around 10 percent of the total national water supply, is used either directly or indirectly each year. The majority of reclaimed water is generated in the Amman Zarqua Basin. Treated effluent from the As Samra waste stabilization pond systems is discharged to the Wadi Zarqua that in turn flows into the King Talal Reservoir. Irrigation water taken from the Wadi is considered indirect use of reclaimed wastewater and is controlled as such. Water from the reservoir, however, is blended with other irrigation sources and is no longer considered reclaimed wastewater, and not subject to similar control.
There has been a steady evolution of the wastewater policy framework in Jordan as standards have been adapted to the needs of a severely water-constrained nation. Standards governing wastewater use have gone through four iterations. Initial standards were introduced in 1982 but were replaced in line with the 1989 WHO Guidelines; and in 1995 with a more comprehensive set of standards dealing with wastewater use and environmental discharges. Finally, in 2003 more stringent standards were promulgated following a multi-year consultation process with stakeholders. Under the new standards, groundwater recharge is permitted, but not for potable use. Jordan’s experience demonstrates that wastewater use has great potential in water-scarce areas; but that planning for wastewater use must be integrated coherently with water resources planning, environmental management, and financial arrangements.
Sources: McCornick et al. 2004; Bahri 2008a,b; Kfouri et al. 2009.

21
Box 2.9 Tunisia—direct use of treated wastewater
Wastewater irrigation has had Government support since 1975, and since a severe drought in 1989, treated wastewater use in irrigation has been a part of the Government’s overall water resources management and environmental pollution control strategies. Water quality standards for wastewater use are based on the 1989 WHO Guidelines. Over 78 percent of the urban population is connected to sewerage, and 83 percent of the collected sewage is treated to adequate standards – about 4.7 m3/s. However, only about 1.1 m3/s is currently used for irrigation of 7,000 hectares of fruit trees and fodder. It is estimate that by 2020 about 20,000-30,000 ha, or about 7-10 percent of total irrigated area will be using treated wastewater. Despite strong government support, farmers currently prefer not to use reclaimed wastewater. Among the problems identified are: social acceptance; regulations restricting irrigation of high-value vegetable crops; water quality problems leading to clogging of drip irrigation systems; concerns about long-term impacts of saline wastewater; and inability to match the timing of supply and demand for water due to inadequate storage capacity for treated effluent.
In addition to technical and social concerns, there are institutional and economic issues to be resolved. It is recognized that there is a multiplicity of agencies involved in treated wastewater use, sometimes with conflicting objectives and overlapping responsibilities – efforts are underway to increase coordination and stakeholder involvement. On the economic side, efforts to develop a market-based strategy of treated wastewater should focus on the preferences of intended wastewater users.
Source: Shetty 2004; Bahri 2008b; Kfouri et al. 2009; Louati and Bucknall 2009.
Wastewater irrigation in high-income countries. Wastewater reclamation and use in irrigation is a well-developed practice in the high-income countries, or parts of the countries, that are facing water scarcity, rapid urban growth, and water quality problems. Many OECD countries have achieved technological advances in physical, chemical, and biological processing of wastewater, together with the development of a rational regulatory framework controlling wastewater reclamation and use practices. Examples include the United States (especially the states of California and Florida), Australia, and European countries such as Spain and the southern provinces of France and Italy.
In non-OECD countries, there has also been an effort toward wastewater reclamation and use in irrigation in the water-short countries of the Mediterranean Basin and the Middle East, such as Bahrain, Cyprus, Israel, Kuwait, Malta, Oman, Qatar, Saudi Arabia, and the United Arab Emirates (Jimenez and Asano, 2008b). In addition to water scarcity, wastewater use in these countries is driven by the marginal cost of alternative sources of water of sufficient volume and quality. For example, in Bahrain, cost of tertiary treated effluent is about $0.32/m3 while the cost of desalinated water is about $0.79/ m3 (Bahri, 2008a). These countries also have established regulatory frameworks for controlling wastewater reclamation and use practices, and invested in advanced wastewater treatment technologies.
The volume of reclaimed wastewater used for irrigation and the intensity of wastewater use (in volume per million capita) for key OECD and non-OECD countries is shown in Table 2.5. The data confirms that in response to water scarcity and drought, countries with resources are willing to make the considerable investments required in order to assure water supply augmentation and environmental protection through wastewater reclamation and use.

22
Table 2.5 Volume and intensity of treated wastewater use for irrigation in selected high-income countries, ranked by intensity
Country
Treated wastewater used for irrigation—volume
(m3/d)
Treated wastewater used for irrigation—intensity of use
(m3/d per million capita)
Kuwait 431,520 225,455
Qatar 80,000 141,593
Israel 767,123 127,007
Cyprus 68,493 87,364
United Arab Emirates 200,000 76,746
Malta 26,000 66,667
Bahrain 27,000 42,188
Saudi Arabia 594,521 29,221
Oman 67,000 26,399
USA, California 814,271 23,745
Spain 931,507 23,340
USA, Florida 300,940 16,390
Italy 741,262 12,885
Australia * 103,000 10,853
Greece 20,030 1,888
France 19,178 324
Japan 35,300 278
Sources: Adapted from Jimenez and Asano 2008b; California data from SWRCB 2003; Florida data from FDEP 2009; Australia data from www.recycledwater.com.au. * The volume figure corresponds to wastewater irrigation of 4 cities only: Melbourne, Adelaide, Sydney, and Alice Springs. Intensity is calculated utilizing only the populations of the 4 cities (9.49 million).
2.3 Powerful drivers toward growing wastewater use in irrigation
Key drivers that are leading to growing use of wastewater in agricultural activities in and around urban centers include the following: increased water stress, urbanization, increasing amounts of urban wastewater generation, and growing numbers of people involved in urban and peri-urban agriculture. These drivers are expected to become even more powerful in the near future, making improved wastewater use in agriculture in many regions an emerging priority.
2.3.1 Growing water stress
Mainly because of increasing demands for water, many parts of the world are experiencing growing water stress and water scarcity. A country is considered water-stressed (i.e., approaching water scarcity) when its annual supply of renewable freshwater is less than 1,667 m3 per capita and water scarce when it is less than 1,000 m3 per capita (Falkenmark and Lindh, 1993). Such countries can expect to experience chronic and widespread shortages of water that may hinder their development and welfare (Asano et al., 2007).

23
As indicated in Figure 2.2, the population living in water-scarce and water-stressed countries is projected to grow from the current proportion of about 18 percent of the world’s population to 44 percent by 2050 (Comprehensive Assessment of Water Management in Agriculture, 2007).8
Figure 2.2 World population living in water scarce or water-stressed countries
Sources: Hinrichsen et al. 1998; Comprehensive Assessment of Water Management in Agriculture 2007; and UN Department of Economic and Social Affairs 2008.
In the literature often a further distinction is made between physical and economic water scarcity (Comprehensive Assessment of Water Management in Agriculture, 2007). Physical scarcity occurs when there is not enough water to meet all demands, including environmental flows. In places with physical water scarcity, water resources development is approaching or has exceeded sustainable limits. It is a relative concept that compares the availability of water to actual use. Scarcity may also exist in water-abundant areas if there is heavy population pressure, excessive pollution, or unsustainable consumption levels. About 1.2 billion people are estimated to live in river basins with physical water scarcity, and another 500 million in basis that are fast approaching this situation. Physical scarcity can at least partly be addressed with improved water resources management.
8 It should be noted that such figures only provide an impression of the annual average on a country level, disregarding the spatial and temporal distribution of precipitation, groundwater layers and surface flows. Due to a number of reasons, such as the availability of infrastructure, not all of these resources can actually be used. Furthermore, the figures do not consider that many water uses are nonconsumptive, and that return flows can be reused.

24
On the other hand, economic scarcity occurs when there is a lack of investment in water infrastructure or a lack of human, institutional and/or financial capacity to satisfy the demand for water. Water pollution also contributes to economic scarcity as it drives up the cost of providing safe water. This dilemma plagues an additional 1.6 billion people worldwide. Many low-income countries in Sub-Saharan Africa are characterized by economic scarcity. Further water development (and management) could ease problems of economic scarcity.
Water scarcity (both physical and economic) may be a concern in some regions and countries that are generally thought to have abundant water supplies, because of the unequal spatial distribution of water resources. For example, Latin America is generally considered a humid tropical region. Yet the 20 percent of the land that is arid or semiarid, with only 5 percent of the region’s water resources, supports 60 percent of the region’s population (Bartone, 1990): in Peru, for example, half the population lives along the narrow Pacific coastal desert and suffers from physical water scarcity, while most of Peru’s land area lies in the Andes or the humid Amazon Basin. Water scarcity in Peru is further complicated, by the fact that the bulk of the other half of Peru’s population lives in extreme poverty in the Andean highlands and face economic water scarcity.
In situations of water stress and water scarcity, the incentives and opportunities for wastewater reclamation and use are high, not least because wastewater is an easily available and dependable water resource (Asano et al., 2007). This trend will continue and, most likely, accelerate because of the likely impacts of climate change.
The Intergovernmental Panel on Climate Change (2007) predicts that global warming will alter precipitation patterns around the world, melt mountain glaciers, and worsen the extremes of droughts and floods. Drought-affected areas are projected to increase in extent, with increasing frequency and intensity of drought. In particular, the subtropics and mid-latitudes, where much of the world’s poorest populations live, are expected to become substantially drier, resulting in heightened water scarcity (Meehl et al, 2007). The proportion of land surface in extreme drought is predicted to increase from 1–3 percent today to up to 30 percent by the 2090s. The number of extreme drought events per 100 years and mean drought duration are likely to increase by factors of two and six, respectively (Parry et al, 2007). Regionally, large increases in irrigation water demand are projected as a result of climate changes. At the same time, climate change will also affect water quality in water scarce regions. Reduced river flows lose assimilative capacity, and additional investments will be required to achieve the same standard of environmental protection or to treat wastewater for indirect use in irrigation. Increasing salinity induced by climate change may render water unusable for agriculture (Sadoff and Muller, 2009). As a result of these changes, the demand for wastewater as an extremely reliable water resource will rise, and it will need to be increasingly considered an integral component of local water resources (Asano, 2002).
2.3.2 Growing urbanization
An ever larger share of the growing world population lives in cities. This percentage is projected to further increase, particularly in low- and middle-income countries (Figure 2.3).

25
Figure 2.3 World urban and rural population estimates 1950−2050
Source: UN Department of Economic and Social Affairs 2008 DCs = developing countries; ICs = industrialized countries
In the developing world the urban population is expected to increase by 1.4 billion, or 54 percent; and in the lower-income countries the urban population is projected to more than double from 254 million in 2010 to 539 million in 2030 (UNDESA, 2008).
These trends in the growth of the urban population can be expected to lead to a growing supply of urban wastewater on the one hand, and to a growing demand for irrigation water for agricultural activities in and near urban areas. Both of these drivers will contribute to increased wastewater use in agriculture, and the need to improve that use, especially in the lower- and middle-income countries.
2.3.3 Growing urban wastewater generation
As countries’ income levels rise, the levels of piped water supply and sewer networks tend to rise as well. This leads to increased wastewater flows.
In the recent past, impressive achievements have been made in the provision of improved urban sanitation services, including sewerage. From 1990 to 2006 improved sanitation facilities were provided to some 779 million additional urban residents, a large share of which are connected to sewers (Figure 2.4) (WHO/UNICEF, 2008). However, despite these efforts, the provision of these services has barely kept pace with urban population growth, and the urban service deficit only dropped from 23 percent to 22 percent. Achieving the Millennium Development Goals sanitation target of cutting in half the service deficit by 2015 and achieving sanitation for all by 2025, will require significant ramping up of the pace of improvements. At the current rate of investment, the urban service deficit will only drop to 18 percent by 2015. Nevertheless, in absolute terms wastewater flows in urban areas will continue to grow substantially, and make improved wastewater management a necessity.
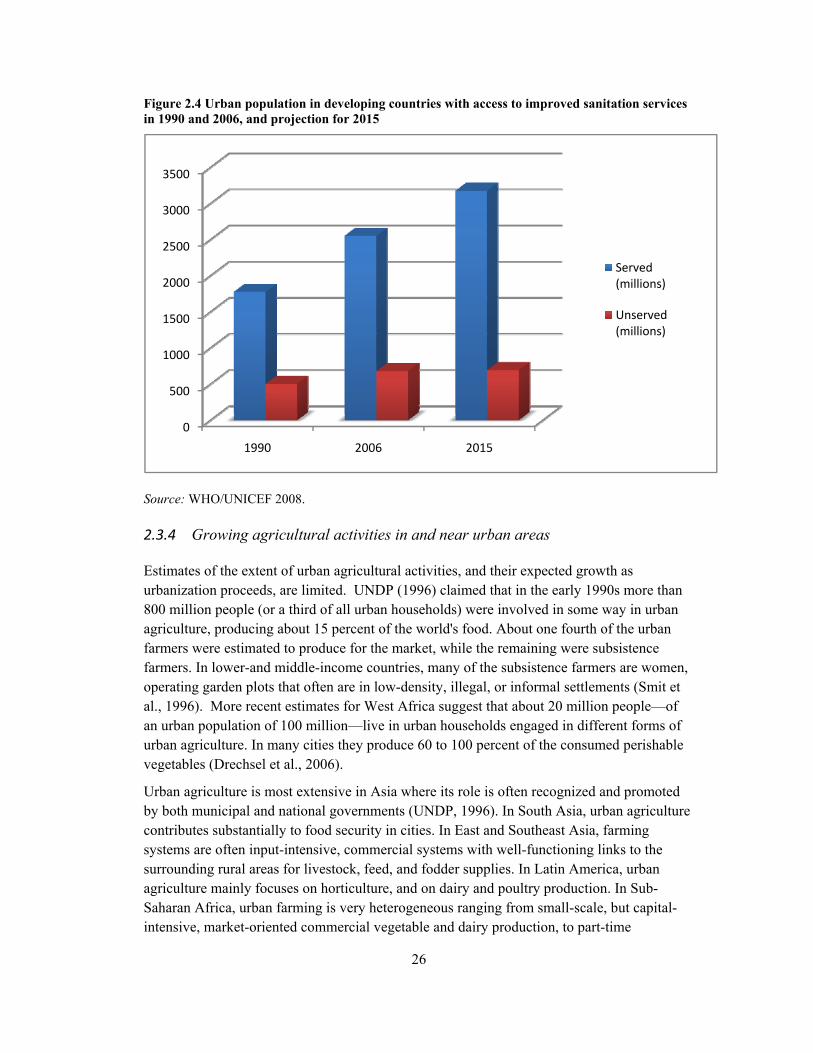
26
Figure 2.4 Urban population in developing countries with access to improved sanitation services in 1990 and 2006, and projection for 2015
Source: WHO/UNICEF 2008.
2.3.4 Growing agricultural activities in and near urban areas
Estimates of the extent of urban agricultural activities, and their expected growth as urbanization proceeds, are limited. UNDP (1996) claimed that in the early 1990s more than 800 million people (or a third of all urban households) were involved in some way in urban agriculture, producing about 15 percent of the world's food. About one fourth of the urban farmers were estimated to produce for the market, while the remaining were subsistence farmers. In lower-and middle-income countries, many of the subsistence farmers are women, operating garden plots that often are in low-density, illegal, or informal settlements (Smit et al., 1996). More recent estimates for West Africa suggest that about 20 million people—of an urban population of 100 million—live in urban households engaged in different forms of urban agriculture. In many cities they produce 60 to 100 percent of the consumed perishable vegetables (Drechsel et al., 2006).
Urban agriculture is most extensive in Asia where its role is often recognized and promoted by both municipal and national governments (UNDP, 1996). In South Asia, urban agriculture contributes substantially to food security in cities. In East and Southeast Asia, farming systems are often input-intensive, commercial systems with well-functioning links to the surrounding rural areas for livestock, feed, and fodder supplies. In Latin America, urban agriculture mainly focuses on horticulture, and on dairy and poultry production. In Sub-Saharan Africa, urban farming is very heterogeneous ranging from small-scale, but capital-intensive, market-oriented commercial vegetable and dairy production, to part-time
0
500
1000
1500
2000
2500
3000
3500
1990 2006 2015
Served (millions)
Unserved (millions)

27
subsistence farming by the urban poor (Veenhuizen and Danso, 2007). Surveys from different cities throughout Sub-Saharan Africa indicate that the percentage of urban households engaged in farming ranges from 25–80 percent, satisfying from 25–100 percent of the vegetable and protein demand (Smit et al., 1996).
It is sometimes argued that urban agriculture is a transitory phenomenon, rising as cities expand in lower-income countries, but fading out as cities become denser, the land more valuable, and other employment opportunities more widespread. However, even in high-income cities like Singapore and Hong Kong the share of certain products supplied from agricultural activities within the city remains astonishingly high (Table 2.6). In Singapore, for example, a large part of the urban vegetable production takes place in rooftop gardens.
Table 2.6 Contribution of urban agriculture to food supply in selected cities in Asia and Africa
City and Country Contribution of urban agriculture
Asia
Shanghai, China City administers 300,000 hectares of land for urban agriculture producing 60 percent of the vegetables consumed ***
Hong Kong, China 50 percent of the vegetables consumed*
Jakarta, Indonesia 20 percent of the food consumed by squatters is self-produced*
Singapore 25 percent of vegetables consumed*
Africa
Bamako, Mali Over 100 percent of horticultural products allowing some urban-rural exports*
Kumasi, Ghana 80-90 percent of consumed perishable vegetables+
Lusaka, Zambia 33 percent of subsistence consumption by squatters*
Dakar, Senegal Niayes zone around Dakar, which constitutes 3 percent of Senegal’s land area, produces nearly 80 percent of the vegetables in the country#
Sources: *Smit et al., 1996; **Mougeot, 2005; ***Yi-Zhang and Zhangen, 2000; #Mbaye and Moustier, 1999; +Drechsel et al., 2007.
In the cities of highly industrialized western countries, such as Germany and the United Kingdom, urban agriculture also continues to thrive, with a history that goes back to the mid-nineteenth century (Boxes 2.10 and 2.11).
28
Box 2.10 Urban agriculture in Germany
In Germany the ‘Schrebergarten’ (allotment or ‘Schreber garden’) movement started in the 19th century. Dr Daniel Schreber drew up plans for children’s sports fields, to which his son added small vegetable gardens to teach the children the elements of gardening and home food production (Spiegel Online 2006). They became very popular with families as a source of fresh fruit, potatoes and vegetables during the First and Second World Wars, and after the Second World War small houses were added as housing was then in very short supply. Today there are thousands of small gardens (200–500 m2) with tiny, often wooden, houses in so-called “Schrebergarten colonies.” These are closely regulated by the 1983 Bundeskleingartengesetz (Federal Small Garden Law), on the outskirts of most German cities and sometimes even in the city, where families spend their weekends. Most colonies are organized as clubs and have their own community leaders. The Schrebergarten movement is also very active in Austria and Switzerland.
Source: http://www.gesetze-im-internet.de/bundesrecht/bkleingg/gesamt.pdf
Box 2.11 Urban agriculture in the United Kingdom
In the United Kingdom the Allotments and Cottage Gardens Compensation for Crops Act (1887) obliged local authorities to provide allotments if there was a demand for them. However, many local authorities resisted complying with the Act and therefore new, more powerful, Acts were passed some ten years later: the Smallholding and Allotment Act (1907) imposed responsibilities on parish, urban district and borough councils to provide allotments, and the Smallholding and Allotment Act (1908) consolidated previous acts and resolved various anomalies. Further legislation has been regularly enacted since then.
In the UK allotments, typically about 250 m2 in size, were seen by parliament as a means whereby low-income families could grow some or all of their own food, so improving nutrition, especially of young children. Their popularity was high throughout the war years with 1.4 million allotments in 1943 but declined in the 1960s and reached a low of just 300,000 in the mid-1990s. Since then demand has rallied and in some areas outstrips supply. This is thought to be due to growing awareness about food contamination, the bio-food boom but also lately concerns about genetic modification of foodstuffs, and the desire for the ultimate in [food] freshness”. The current food and financial crises can only be expected to exacerbate the demand for allotments and encourage more households to grow at least some of their own food in their gardens. 9 The government is actively promoting allotments through its ‘Allotments Regeneration Initiative’.
Sources: http://www.allotment.org.uk/articles/Allotment-History.php; http://www.farmgarden.org.uk/ari; http://www.opsi.gov.uk/RevisedStatutes/Acts/ukpga/1908/cukpga_19080036_en_1
9 Allotments are currently moving decidedly “up-market”: Queen Elizabeth II of the United Kingdom is now “the proud owner of an allotment” in the grounds of Buckingham Palace, London (BBC News website, June 13, 2009: http://news.bbc.co.uk/1/hi/uk/8098799.stm); and in the US “Michelle Obama's First Harvest Gets an A Plus” (U.S. News website, June 20, 2009: http://www.usnews.com/blogs/washington-whispers/2009/06/20/michelle-obamas-first-harvest-gets-an-a-plus.html).
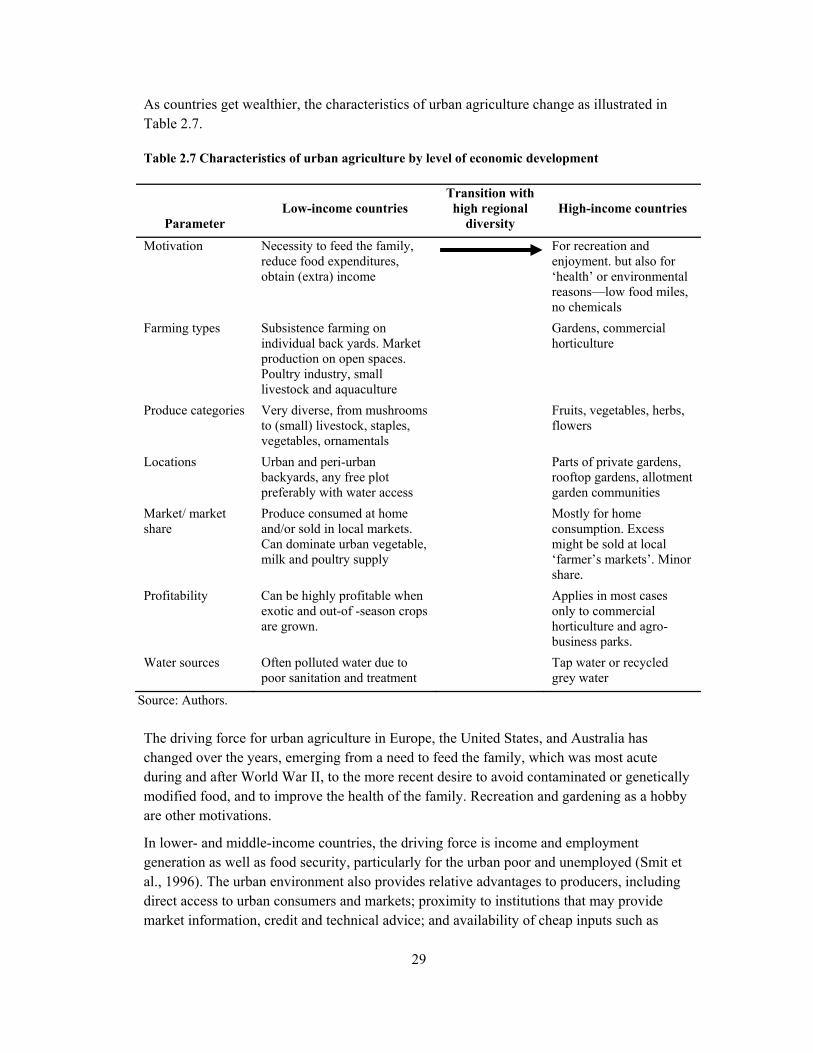
29
As countries get wealthier, the characteristics of urban agriculture change as illustrated in Table 2.7.
Table 2.7 Characteristics of urban agriculture by level of economic development
Parameter Low-income countries
Transition with high regional
diversity High-income countries
Motivation Necessity to feed the family, reduce food expenditures, obtain (extra) income
For recreation and enjoyment. but also for ‘health’ or environmental reasons—low food miles, no chemicals
Farming types Subsistence farming on individual back yards. Market production on open spaces. Poultry industry, small livestock and aquaculture
Gardens, commercial horticulture
Produce categories Very diverse, from mushrooms to (small) livestock, staples, vegetables, ornamentals
Fruits, vegetables, herbs, flowers
Locations Urban and peri-urban backyards, any free plot preferably with water access
Parts of private gardens, rooftop gardens, allotment garden communities
Market/ market share
Produce consumed at home and/or sold in local markets. Can dominate urban vegetable, milk and poultry supply
Mostly for home consumption. Excess might be sold at local ‘farmer’s markets’. Minor share.
Profitability Can be highly profitable when exotic and out-of -season crops are grown.
Applies in most cases only to commercial horticulture and agro-business parks.
Water sources Often polluted water due to poor sanitation and treatment
Tap water or recycled grey water
Source: Authors.
The driving force for urban agriculture in Europe, the United States, and Australia has changed over the years, emerging from a need to feed the family, which was most acute during and after World War II, to the more recent desire to avoid contaminated or genetically modified food, and to improve the health of the family. Recreation and gardening as a hobby are other motivations.
In lower- and middle-income countries, the driving force is income and employment generation as well as food security, particularly for the urban poor and unemployed (Smit et al., 1996). The urban environment also provides relative advantages to producers, including direct access to urban consumers and markets; proximity to institutions that may provide market information, credit and technical advice; and availability of cheap inputs such as

30
urban organic wastes and wastewater for irrigation (Veenhuizen and Danso, 2007). The recent rise in food prices is also likely to have contributed to an increased interest from urban households and local and national governments in expanding urban agriculture.

31
Chapter 3. Risks and Benefits of Wastewater Use in Agriculture
Wastewater use in agriculture has substantial benefits, but can also pose substantial risks to public health—especially when untreated wastewater is used for crop irrigation. Farmers often have no alternative but to use untreated wastewater because there is no wastewater treatment (Figure 3.1) and freshwater is either unavailable or too expensive. The major risks to public health are microbial and chemical. Wastewater use in agriculture can also create environmental risks in the form of soil and groundwater pollution. However, if properly planned, implemented and managed, wastewater irrigation can have several benefits for the environment, as well as for agriculture and water resources management. Given these risks and benefits, countries seeking to improve wastewater use in agriculture must reduce the risks, in particular to public health, and maximize the benefits.
Figure 3.1 Percent of wastewater effectively treated in 2000
Notes: (1) The bulk of wastewater effectively treated in Asia is accounted for by Japan, followed by China. (2) No definition of “effective” wastewater treatment was given by WHO/UNICEF (2000), but it is normally interpreted as the proper operation of at least secondary treatment. However, Box 2.5 suggests that effective treatment in LAC may be closer to 6 percent than 14 percent. Source: WHO/UNICEF 2000.
32
3.4 Risks to public health
3.4.1 Microbial risks10
Wastewater pathogens
At any point in time wastewater contains all the pathogens (disease-causing organisms) being excreted by members of the community from which the wastewater is derived. If no-one in a community is suffering from any excreta-related disease, then the community’s wastewater does not contain any excreta-related pathogens. However, even in high-income countries, this hardly ever occurs, and wastewaters always contain at least some pathogens. Pathogen numbers in a community’s wastewater reflect the amount of excreta-related disease in the community; in general, the number of pathogens is higher in wastewater in low-income countries than it is in wastewater in high-income countries.
The pathogens present in wastewaters are the agents of excreta-related diseases and so comprise the viruses, bacteria, protozoa and helminths that cause these diseases (Box 3.1). The diseases in the community caused by these pathogens may be endemic—i.e., the diseases are maintained within the community by continuous transmission between community members—or they may occur as epidemics—i.e., they are introduced to susceptible communities by persons from outside the community.
Many excreta-related diseases11 can be spread by wastewater use in agriculture to those working in wastewater-irrigated fields and/or those consuming wastewater-irrigated foods, especially when eaten uncooked (e.g., salad crops and some vegetables) (Table 3.1). However the consumption of wastewater-irrigated foods is only one possible route of transmission, and this route may or may not be of local public health importance.
10 Microbes (or micro-organisms) are the life forms in the domains Bacteria and Archaea. Helminths (worms) are in the domain Eukarya and so, strictly speaking, are not microbes. However, in the context of wastewater use in agriculture, the term ‘microbial health risks’ includes the health risks due to helminths (see Box 3.1). 11 Details of all excreta-related diseases are given in Feachem et al. (1983) and in the CDC A-Z Index available at http://www.cdc.gov/az/a.html.

33
Box 3.1 Pathogens in wastewaters
Viruses: Numerous viruses may infect the intestinal tract and be passed in the feces, whereupon they may infect new human hosts by ingestion or inhalation. One gram of human feces may contain 109 infectious virus particles, regardless of whether the individual is experiencing any discernible illness. Concentrations of 105 infectious particles per liter of raw wastewater have been reported. Although threy cannot multiply outside a suitable cell host, the excreted viruses may survive for many weeks in the environment. Five groups of pathogenic excreted viruses are important: adenoviruses, enteroviruses (including poliovirus), hepatitis A virus, reoviruses, and diarrhea-causing viruses (including norovirus and rotavirus).
Bacteria: Human feces contain large numbers (~109−1011 per gram) of commensal bacteria of many species; these are non-pathogenic and essential for the proper functioning of the intestinal tract. However, some bacteria cause excreta-related diseases—for example, Campylobacter and Salmonella (diarrhea), Vibrio cholerae (cholera), Shigella spp. (bacillary dysentery) and Salmonella typhi (typhoid fever). The numbers of these pathogens can be as high as 106−108 per gram of feces and 103−105 per liter of wastewater.
Protozoa: Several species of protozoa infect humans—for example, Entamoeba histolytica (which causes amebic disentery), and Giardia lamblia, Cryptosporidium parvum and C. hominis (severe diarrhea). Numbers can reach 103−105 per gram of feces and 10−103 per liter of wastewater.
Helminths: Helminths are worms. In wastewater-irrigated agriculture the most important intestinal worms are Ascaris lumbricoides (the human roundworm), Trichuris trichiura (the human whipworm), Ancylostoma duodenale and Necator americanus (the two human hookworms) (these four are nematode worms), and Taenia saginata and T. solium (the beef and pork tapeworms) (these two are cestode worms). The eggs of all these helminths are voided in the feces. Ascaris is generally taken as the ‘reference’ helminth as it is the most common (ascariasis affects ~1.2 billion people, almost exclusively in low- and low-middle-income countries), the female worms produce vast quantities of eggs (~200,000 per day), and the eggs can survive for long periods of time (many months to several years) in the environment. Ascaris egg numbers in wastewaters are ~10−103 per liter.
Source: adapted from Feachem et al. 1983; further information in WHO 2008b.

34
Table 3.1 Environmental classification of excreta-related diseases important in wastewater-irrigated agriculture
Category Environmental transmission
featuresa Major examples Exposed groups and
relative infection risksb,c
Non-bacterial feco-oral diseases
Non-latent Low to medium persistence Unable to multiply High infectivity
Viral diseases: Hepatitis A, E and F Diarrhea due to rotavirus, norovirus and adenovirus Protozoan diseases: Amebiasis Cryptosporidiosis Giardiasis Diarrhea due to Cyclo-spora cayetanensis, Enterocytozoon bienusi and Isopora belli
Fieldworkers: + Consumers: +++
Bacterial feco-oral diseases
Non-latent Medium to high persistence Able to multiply Medium to low infectivity
Campylobacteriosis Cholera Pathogenic Escherichia coli infections Salmonellosis Shigellosis
Fieldworkers: + Consumers: +++
Geohelminthiases Latent Very high persistence Unable to multiply High infectivity
Ascariasis Hookworm infection Trichuriasis
Fieldworkers: +++ Consumers: +++
Source: adapted from Feachem et al. 1983. aLatency is the length of time required outside a human host for the pathogen to become infective, and persistence is the length of time the pathogen can survive outside a human host. b+++ = high risk, + = low risk. These risks refer to the use of untreated wastewater for crop irrigation; they can be reduced by wastewater treatment and the use of the post-treatment health-protection control measures detailed in Table 4.2. cNote that fieldworkers are often also consumers.
Transmission of microbial disease through wastewater
The available good-quality epidemiological evidence on the health risks due to wastewater use in agriculture was first reviewed by Shuval et al. (1986). The main findings from their study were:
soil-transmitted helminthic infections12 represented the major actual (as opposed to potential) health risk (Box 3.2) to both those working in wastewater-irrigated fields
12 The principal soil-transmitted helminths (also called geohelminths and human intestinal nematode worms) are detailed in Box 3.1. In the context of wastewater use in agriculture, reference is commonly made to ‘helminth eggs’, rather than ‘soil-transmitted helminth eggs’ or ‘human intestinal nematode eggs.’

35
and those consuming wastewater-irrigated foods uncooked when untreated wastewater was used for crop irrigation, but not when treated wastewater was used.
bacterial feco-oral diseases, such as diarrhea and cholera, can be transmitted to those consuming wastewater-irrigated salad crops and raw vegetables.
There was less compelling evidence for the transmission of viral and protozoan diseases. Blumenthal and Peasey (2002) reviewed the epidemiological evidence reported after the study by Shuval et al. (1986). The main findings of their study were:
Unrestricted irrigation: The use of untreated wastewater to irrigate vegetables led to increased helminth infection (mainly Ascaris lumbricoides infection), bacterial infections (typhoid, cholera, Helicobacter pylori infection), and symptomatic diarrheal disease in consumers. When wastewater was partially treated, there was evidence that the risk of bacterial and viral enteric infections was still significant when consumers ate some types of uncooked vegetables irrigated by water containing ≥105 fecal coliforms per 100 mL (see Box 3.3).
Restricted irrigation: Studies of the risks of viral and bacterial enteric infections related to use of treated wastewater suggested that when sprinkler irrigation was used and the population was exposed to wastewater aerosols, there was an increased risk of infection when the quality of the wastewater was 106 total coliforms per 100 mL, but no increased risk of infection when the quality of the wastewater was 103−104 fecal coliforms per 100 mL. Studies of the risks of symptomatic diarrheal disease and enteric viral infections related to direct contact with treated wastewater through farm work (adults and children) or play suggested that, when flood or furrow irrigation occurs, there was an increased risk of infection in children when the quality of the wastewater was >104 fecal coliforms per 100 mL. For adults, the threshold level for symptomatic diarrheal disease was 105 fecal coliforms per 100 mL, but the threshold level for transmission of a Mexican strain of norovirus was <104 fecal coliforms per 100 mL where high levels of contact occurred, even in a rural area where there were many other transmission routes for this virus.
Box 3.2 Actual and potential health risks in wastewater irrigation
An actual risk to public health occurs as a result of wastewater irrigation when all of the four following conditions are satisfied:
(1) either an infective dose of the pathogen reaches the wastewater-irrigated field or the pathogen multiples in the field to form an infective dose
(2) the infective dose reaches a human host (3) the host becomes infected (4) the infection causes disease or further transmission.
Actual risks can thus only be determined from epidemiological studies. If conditions 1−3 are satisfied but not condition 4, then the risk is only a potential risk.
Source: WHO 1989.
36
Box 3.3 Total coliforms, fecal coliforms and Escherichia coli
Total coliforms are bacteria that can ferment lactose (milk sugar) with the production of acid and gas in the presence of bile salts at 37°C. They exist naturally in the intestines of warm-blooded animals, including man, and so are present in feces in very large numbers (~108−1010 per gram). However, they can also be found in unpolluted environments, so their presence in water does not indicate beyond doubt that the water has been fecally polluted.
Fecal coliforms are coliforms that can ferment lactose at the higher temperature of 44.5°C. They are better indicators of fecal pollution than total coliforms, but some fecal coliforms (especially in tropical and subtropical areas) are not exclusively fecal in origin.
Escherichia coli (generally termed E. coli) is currently the only known fecal coliform that is exclusively fecal in origin.
Both fecal coliforms and E. coli (as well as total coliforms) occur in the feces of man and animals, so they cannot be used to distinguish between human and animal fecal pollution.
The concept of coliforms as fecal indicator organisms has its origin in the bacteriological examination of drinking waters (Smith, 1895). With wastewater, the fecal origin of which is not in question, fecal coliforms and E. coli numbers are used as indicators of bacterial and viral pathogens. They are less than perfect for this purpose, but, given that information on pathogen numbers is scarce, especially in developing countries, they are the best indicators currently available.
Significance of microbial health risks
Feachem et al. (1983) considered that the health problems associated with wastewater use in the production of human food could be broken down into a series of questions:
How many pathogens and of what kind reach the field or crop?
Are pathogens likely to survive in sufficient numbers and for sufficient time to cause subsequent infection?
How significant is this infection route compared to all other potential infection routes?
The answers to the first two questions depend on the diseases endemic in the affected populations and on the degree of wastewater treatment, if any. Feachem et al. (1983, 100–101) answered the third question by describing the following hypothetical, but typical, case study, which refers to crop fertilization with human excreta (‘night soil’) and sewage sludge, but which applies equally to wastewater irrigation:
Imagine a town of moderately wealthy people who live in houses with water connections and flush toilets. Outside this town is a village where people are extremely poor, houses have earth floors, water is drawn from an open well, and no adequate excreta disposal system exists. The main source of income for the village is the cultivation of vegetables for sale to the town; vegetables are also used by the

37
villagers as subsistence crops. These vegetables are fertilized by night soil collected in the village and by sewage sludge obtained free of charge from the treatment works on the outskirts of the town. The prevalence of [ascariasis] in the town is only 8 percent, and the principal means of entry to the home of viable Ascaris eggs is on the vegetables bought from the villagers. Transmission among the wealthy townsfolk does not take place because their excreta are flushed away and high standards of hygiene prevail. The prevalence of ascariasis in the village, however, is 68 percent, and transmission occurs intensively, particularly in the home. The floors and yards of the village houses are contaminated with viable eggs from the feces of infected children. Most transmission is quite unrelated to the contaminated vegetables that the villagers eat. If the supply of contaminated vegetables suddenly ended, the transmission of ascariasis in the town would be reduced very substantially, but transmission in the village would be unaffected.
The same argument applies to poor urban communities with inadequate housing, water supplies and sanitation.
From a more rigorous epidemiological perspective the health risks from working in wastewater-irrigated fields and/or consuming wastewater-irrigated foods (especially those eaten uncooked) are only significant—i.e., of public-health importance—if, in the exposed population compared with a carefully matched control group, they result in:
an excess incidence of disease,
an excess prevalence of disease,
an excess intensity of infection, and/or
further transmission of disease.
“Incidence” refers to the number of new cases of a disease in a community in a specified period of time (usually a week, month, or year), and “prevalence” refers to the number of cases of a disease in a community at a given point in time; incidence is normally used for acute diseases (e.g., diarrheal disease) and prevalence for chronic diseases (helminthiases). In the present context of wastewater use in agriculture, if fieldworkers and/or crop consumers have an excess incidence or prevalence of a disease, or an excess intensity of infection (e.g., a higher worm burden as shown by the number of helminth eggs per gram of feces), compared with a control group, then these excesses are attributable to the use of wastewater in agriculture, which is therefore an issue of public health importance—and this is the only way that this importance can be ascertained.
Shuval et al. (1986) showed that, when untreated wastewater was used for irrigation, there was an excess prevalence (and also an excess intensity of infection) of ascariasis and hookworm disease in fieldworkers compared with a control group (Figure 3.2), but not when treated wastewater was used. Blumenthal and Peasey (2002) confirmed this for both geohelminthic and bacterial diseases.
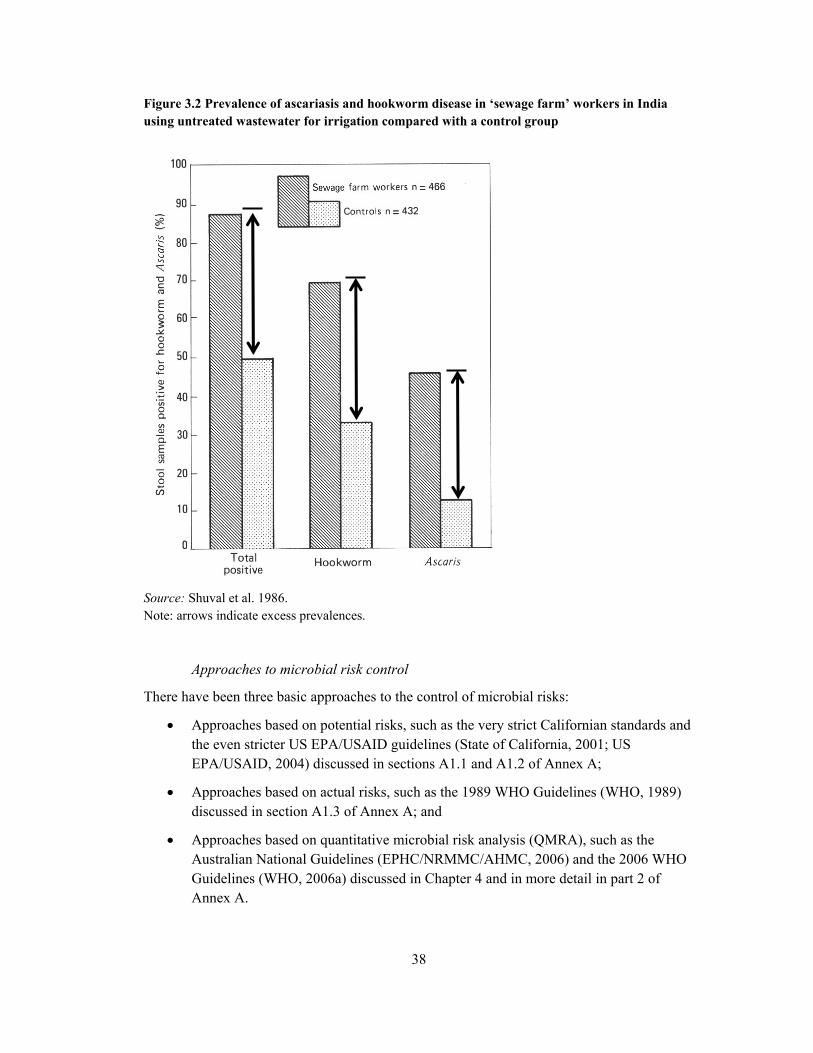
38
Figure 3.2 Prevalence of ascariasis and hookworm disease in ‘sewage farm’ workers in India using untreated wastewater for irrigation compared with a control group
Source: Shuval et al. 1986. Note: arrows indicate excess prevalences.
Approaches to microbial risk control
There have been three basic approaches to the control of microbial risks:
Approaches based on potential risks, such as the very strict Californian standards and the even stricter US EPA/USAID guidelines (State of California, 2001; US EPA/USAID, 2004) discussed in sections A1.1 and A1.2 of Annex A;
Approaches based on actual risks, such as the 1989 WHO Guidelines (WHO, 1989) discussed in section A1.3 of Annex A; and
Approaches based on quantitative microbial risk analysis (QMRA), such as the Australian National Guidelines (EPHC/NRMMC/AHMC, 2006) and the 2006 WHO Guidelines (WHO, 2006a) discussed in Chapter 4 and in more detail in part 2 of Annex A.

39
The currently recommended approach is that based on QMRA as it provides greater flexibility in risk management. Risk reduction, for example, can be achieved not just by wastewater treatment, but also by including post-treatment health-protection control measures. This approach also reduces costs. Full details are provided in Chapter 4 and parts 2 and 3 of Annex A.
3.4.2 Chemical risks
Chemical risks to human health
Health risks from chemicals are caused by heavy metals (e.g., cadmium, lead, and mercury) and many organic compounds (e.g., pesticides). These mostly derive from industrial wastewaters and, if these are discharged to public sewers, they are present in municipal wastewaters. The health effects of prolonged exposure to many of these chemicals is well known (e.g., cancers).13 There is an emerging class of chemical contaminants, the so-called ‘anthropogenic’ compounds, which include pharmaceuticals, hormones and endrocrine disruptors, antimicrobials and antibiotics, and personal care products, the long-term health effects of which are less clearly understood (see Bhandari et al., 2009).
Chang et al. (2002) reviewed the principal chemical risks to human health resulting from the consumption of wastewater-irrigated foods. They found that:
Land application has been a popular option for disposing of municipal wastewater and sewage sludge worldwide for more than a century. While most of the operations appear to be successful, reports from countries such as China suggested that large-scale irrigation of crops with mostly untreated municipal and industrial wastewaters could be harmful to crops and cause injuries to humans because of poorly controlled discharge of toxic and hazardous constituents in the wastes.
Concentrations of potentially hazardous pollutants in the municipal wastewater and the resulting sewage sludge varied considerably from location to location and, for the same community, were subject to temporal variations due primarily to point-source discharges from industries. The frequency of detection for inorganic pollutants, such as the trace elements in the wastewater, usually ranges from 50 to 100 percent and they are invariably concentrated into the sewage sludge in the course of wastewater treatment. The frequency of detection for organic pollutants was considerably lower. They range usually from 5 to 10 percent and their concentrations, when found, were low. Community-wide industrial wastewater pretreatment provisions to prevent the discharge of pollutants by industries have been effective in reducing the pollutant concentrations in wastewater and sewage sludge.
13 A useful summary is given in WHO (2008c).
40
Chang et al. (2002) developed the following two principles to minimize chemical risks to human health:
Prevent pollutant accumulation in waste-receiving soils: In land application, if the pollutant input equals the pollutant output, there will not be a net accumulation of pollutants in the receiving soil. Consequently, the pollutant contents of the soil will remain at the background level and the soil's ecological and chemical integrity are preserved. When this requirement is met, the capacity of the soil to sustain any future land uses is guaranteed and the transfer of pollutants up the food chain is kept to a minimum. Numerical limits, therefore, are set to prevent the pollutant concentration of the soil from rising during the course of land application. Guidelines derived from this approach will have stringent upper limits for pollutants and are universally applicable. The cost of implementation will be high, however, as wastewater treatment plants need to employ advanced wastewater treatment technologies to minimize the pollutant levels in the reclaimed wastewater and sewage sludge.
Take maximum advantage of the soil's capacity to assimilate, attenuate, and detoxify pollutants: Soils possess natural abilities to assimilate, attenuate, and detoxify pollutants. In land applications, this capacity should be fully utilized. In this manner, the agronomic benefits of applying wastewater and sewage sludge may be realized and, when managed properly, accumulation of pollutants in soil can be controlled so that they will not reach levels harmful to human health. Land application guidelines based on this approach set the maximum permissible pollutant loading and provide users the flexibility to develop suitable management practices for using wastewater and sewage sludge within the boundary. However, under this scenario, pollutant levels in the soil will rise eventually to levels considerably higher than the background levels, and future land uses may be restricted. Furthermore, the technical data needed to define the pollutant transfer parameters of the exposure pathways are not always available.
Chang et al. (2002) also derived tentative health protection guidelines for common inorganic and organic pollutants by considering the food-chain transfer of pollutants (i.e., wastewater → soil → plants → people) from the consumption of grains, vegetables, root/tuber crops, and fruit (which, together, account for about 75 percent of the daily global average adult diet) (Table 3.2). The exposure scenario used assumed that (1) most exposed individuals were adult residents with a 60-kg body weight; (2) their entire consumption of grains, vegetables, root/tuber crops, and fruit were produced in wastewater-irrigated fields; and (3) their daily intake of pollutants from consumption of grain, vegetable, root/tuber, and fruit foods accounted for 50 percent of the acceptable daily intake (ADI), with the remaining 50 percent of the ADI being credited to background exposure.
Chang et al. (2002, iv) note that where there are “effective industrial wastewater pretreatment programs, the pollutant discharge into the wastewater collection and treatment systems is effectively regulated and pollutants incompatible with land application may be screened out. The reclaimed wastewater from these communities may be used for crop irrigation without undue restrictions, provided the [microbiological] quality of the water is acceptable and the

41
volume of water applied does not exceed the normal water requirement for a successful crop harvest. In this manner, the pollutant input to the receiving soil, realistically, may be balanced by the outputs through plant absorption when the reclaimed wastewater is used for irrigation.”
However, effective industrial wastewater pretreatment programs are not the norm in developing countries and therefore special attention has to be paid to chemical risks in such circumstances. Even if they do exist there is always the additional problem of household chemicals, such as soap and detergent residues, cleaning fluids, personal care products (e.g., deodorants), and pharmaceutical residues, all of which are discharged as part of the graywater into the household wastewater.
Table 3.2 Tentative guideline values for the maximum permissible concentrations of selected inorganic and organic pollutants in wastewater-irrigated soils
Maximum permissible concentrations (mg per kg soil)
Inorganic compounds
Antimony 36 Arsenic 8 Barium 302
Beryllium 0.2 Boron 1.7 Cadmium 4
Fluorine 635 Lead 84 Mercury 7
Molybdenum 0.6 Nickel 107 Selenium 6
Silver 3 Thallium 0.3 Vanadium 47
Organic compounds
Aldrin 0.48 Benzene 0.14 PAHa 16
Chlorodane 3 Chlorobenzene 211 Chloroform 0.47
Dichlorobenzene 15 2,4−D 0.25 DDT 1.54
Dieldrin 0.17 Dioxins 1.2×10⁻⁴ Heptachlor 0.18
Hexachlorobenzene 1.4 Lindane 12 Methoylchlor 4.27
Pentachlorophenol 14 PCBs 0.89 Pyrene 41
Tetrachloroethane 1.25 Toluene 12 Toxophene 0.0013
2,4,5−T 3.82 Trichloroethane 0.68 Phthalate 13,733
Styrene 0.68
Source: Chang et al. 2002. a As benzo(a)pyrene.
3.5 Environmental risks and benefits
3.5.1 Environmental risks
Soil and groundwater pollution is clearly a potential disadvantage of using wastewater in agriculture. Under most conditions, wastewater irrigation does not present a microbiological threat to groundwater since it is a process similar to slow sand filtration: most of the pathogens are retained in the top few meters of the soil, and horizontal-travel distances in uniform soil conditions are normally less than 20 meters. However, in certain hydrogeological situations (for example in limestone formations) microbial pollutants can be
42
transported for much greater distances, and careful investigation is required in such cases (BGS, 2001). Chemical pollutants, among which nitrates are of principal concern in the case of domestic wastes, can travel for greater distances, and there is the potential risk that drinking-water supplies in the vicinity of wastewater irrigation projects may be affected. In general, therefore, and unless a rigorous hydrogelogical appraisal indicates otherwise, water supplies should not be located within, or close to, wastewater-irrigated fields; conversely, wastewater irrigation should not take place in areas where the groundwater is used for drinking-water supplies.
As a result of increased rates of salinization and waterlogging, soil pollution can occur through wastewater irrigation if adequate attention is not paid to leaching and draining requirements. Saline drainage waters should be used to irrigate salt-tolerant crops where possible, and crop and field rotation will generally be necessary to avoid long-term damage to the soil structure. Adherence to good irrigation practice is essential to avoid adverse environmental effects (Ayers and Westcot, 1985; Rhoades et al., 1992; Hillel, 2000; Tanji and Kielen, 2002). Often a trade-off has to be made between agricultural production and environmental protection, and this must be carefully evaluated at the project planning stage. Many of these potential disadvantages of wastewater irrigation, together with such hazards as odor, vector development, and the effects of accidental discharges of toxic substances, can be avoided by the use of properly treated wastewater. This includes adequate control of non-biodegradable and toxic industrial wastewaters, which generally require separate treatment or at least pretreatment prior to discharge to public sewers (chapter 5).
Chemical risks to plant health
Crop yields may be reduced if the physicochemical quality of the wastewater used for irrigation is unsuitable—for example by being too saline or having concentrations of boron, heavy metals and other industrial toxicants, nitrogen, and/or sodium which inhibit plant growth either directly in the case of toxicants or indirectly by reducing the plant’s ability to absorb nutrients. The principal (and still current) reference document on the physicochemical quality of water, including wastewater, used for crop irrigation is FAO’s Water Quality for Agriculture (Ayers and Westcot, 1985). This may be supplemented by two later FAO publications The Use of Saline Waters for Crop Production (Rhoades et al., 1992) and Quality Control of Wastewater for Irrigated Crop Production (Westcot, 1997), and the World Bank publication Salinity Management for Sustainable Irrigation: Integrating Science, Environment, and Economics (Hillel, 2000).
In general treated domestic wastewaters, or treated municipal wastewaters that contain little industrial effluent, present no problem; care has to be exercised as the proportion of industrial effluent in the wastewater increases. However, even for treated domestic wastewaters, there are five parameters that should be monitored during the irrigation season: 1) electrical conductivity (as a measure of total dissolved solids or “salinity hazard”), 2) the sodium

43
adsorption ratio (as a measure of the ‘sodium hazard’),14 3) the concentrations of boron, 4) the concentrations of total nitrogen, and 5) pH.15 These measurements are relatively easy to do in the case of large wastewater-use schemes, but at the smaller scale of urban/periurban agriculture they would not generally be possible. The environmental health departments of city and town councils should nonetheless be encouraged to conduct these five analyses reasonably regularly (for example, at least monthly) throughout the irrigation season.
3.5.2 Environmental benefits
If wastewater use schemes are managed well, they can have several environmental benefits (Mara and Cairncross, 1989):
Avoidance of surface water pollution, which would occur if the wastewater were not used but discharged into rivers or lakes. Major environmental pollution problems, such as dissolved oxygen depletion, eutrophication, foaming, and fish kills, can thereby be avoided.
Conservation or more rational use of freshwater resources, especially in arid and semi-arid areas—i.e. fresh water for urban demand, wastewater for agricultural use.
Reduced requirements for artificial fertilizers, with a concomitant reduction in energy expenditure and industrial pollution elsewhere.
Soil conservation through humus build-up and through the prevention of land erosion.
Desertification control and desert reclamation, through irrigation and fertilization of tree belts.
3.6 Agricultural and water resources management benefits
In addition to potential environmental benefits, there is a range of other benefits from reusing wastewater in agriculture. The most important benefits accrue to the agricultural and water management sectors. For agriculture these include:
Reliable, and possibly less costly irrigation water supply
Increased crop yields, often with larger increases than with freshwater due to the wastewater’s nutrient content
More secure and higher urban agricultural production, and contribution to food security
Income and employment generation in urban areas
14 The sodium absorption ratio is [Na] ÷ {0.5([Mg] + [Ca])}½ where [Na], [Mg] and [Ca] are the concentrations of sodium, magnesium and calcium, respectively, in milli-equivalents per liter. 15 The FAO Guidelines (Ayers and Westcot, 1985) should be consulted for details of these parameters, crop sensitivities to boron, total nitrogen and pH, and how electrical conductivity and the sodium absorption ratio interact.

44
Improved livelihoods for urban agriculturalists, many of whom are poor subsistence farmers, including a large share of women
In terms of water resources management, the benefits include:
Additional drought-proof water supply, often with lower cost than expanding supplies through storage, transfers, or desalinization
More local sourcing of water
Inclusion of wastewater in the broader water resources management context
More integrated urban water resources management
3.7 Objectives for improving wastewater irrigation
Faced with these risks and benefits, countries seeking to improve wastewater use in agriculture should pursue the following key objectives:
Objective 1: Minimize risk to public health
Objective 2: Minimize risk to the environment
Objective 3: Improve livelihoods for urban agriculturalists
Objective 4: Integrate wastewater into the broader water resources management context.
Depending on the level of economic development, a country may seek to achieve one or a combination of objectives. Given the strong association between a country’s income and the way it handles wastewater as presented in Chapter 2, low-income countries are likely to put the highest priority on minimizing the risk to public health while improving the livelihoods of urban agriculturalists. High-income countries, on the other hand, are more likely to emphasize environmental risk reduction and, especially when they are water-stressed or water scarce, a fuller integration of wastewater into their water resources management system (for more details, see Table 6.1).

45
Chapter 4. Assessing and Managing Microbial Risk to Public Health
4.1 Risk assessment and management framework of the 2006 WHO Guidelines
The assessment and management of the microbial risks to human health caused by wastewater use in agriculture is essential to avoid any excessive additional burden of disease for those who work in wastewater-irrigated fields or consume wastewater-irrigated foods.
The excreta-related pathogens and related diseases most commonly associated with wastewater are detailed in Box 3.1 and Table 3.1. However, a list of these pathogens and diseases says nothing about the risks they may pose to human health. Epidemiological studies of the types reviewed by Shuval et al. (1986) and Blumenthal and Peasey (2002) (section 3.1.1) provide good information on “actual” rather than “potential” risks (Box 3.2), but they are complicated and expensive to perform and are unlikely to be done, especially in low- and middle-income countries, on the scale required to provide information on local risks.
The 2006 WHO Guidelines for the Safe Use of Wastewater, Excreta and Greywater (WHO 2006a) have taken a radically different approach to those used in the 1973 and 1989 WHO Guidelines (WHO 1973, 1989). The 2006 guidelines are based on a risk assessment and management approach that follows the Stockholm Framework (Fewtrell and Bartram, 2001)—the same risk management framework that is now applied to all decisions about drinking-water and sanitation interventions—rather than specifying the required quality of treated wastewater, as was done in the 1973 and 1989 guidelines (section A13 of Annex A).
The 2006 WHO approach for microbial risks, which is largely based on the Australian National Guidelines for Water Recycling: Managing Health and Environmental Risks (EPHC/ NRMMC/AHMC 2006) and the quantitative microbial risk analysis (QMRA) procedures used by Mara et al. (2007), is (i) to define a tolerable maximum additional burden of disease, from which it is possible (ii) to derive tolerable risks of disease and infection, (iii) to determine the required pathogen reduction(s) to ensure that the tolerable disease and infection risks, and hence a tolerable maximum additional burden of disease, are not exceeded, (iv) to determine how the required pathogen reductions can be achieved, and (v) to put in place a system for verification monitoring (Table 4.1). This approach became possible only after the DALY (disability-adjusted life years) metric was developed and introduced by WHO and the World Bank in 1993 (World Bank 1993; see also Murray and Lopez 1996), allowing for the definition of a tolerable additional burden of disease and for the comparison of disease burdens resulting from different health risks (Box 4.1).16
16 A fuller explanation of DALYs is given in WHO (2010).
46
The required degree of pathogen reduction (step iii above) can only be determined by QMRA (see Box 4.2) 17 which was first applied to wastewater use in agriculture by Shuval et al. (1997) and Tanaka et al. (1998). QMRA is the keystone of a rational management framework for microbial risk assessment and control in wastewater irrigation based on a ‘multiple-barrier’ approach to risk management (Figure 4.1). This approach includes both wastewater treatment and post-treatment health-protection control measures (Table 4.2 and section 4.3.1) and non-treatment options to be used in circumstances where, for one reason or another, wastewater treatment does not exist and is unlikely to exist for the immediate future (Table 4.2 and section 4.3.2).
QMRA determines numerical values for the health risks which result from particular sets of conditions relating to local practices in using wastewater in agriculture. As illustrated in Parts 2 and 3 of Annex A, it is relatively straightforward to use the results from QMRA to select the most cost-effective set of conditions—i.e., the combination of health protection control measures detailed in Table 4.2, including wastewater treatment where it exists or is feasible— that does not cause any excessive additional burden of disease in those who work in wastewater-irrigated fields or consume wastewater-irrigated foods. In a few cases the risks determined by epidemiological studies and those estimated by QMRA have been compared and the agreement between them was found to be good (Mara et al. 2007).
17 A more detailed description is given in section A2.1 of Annex A.
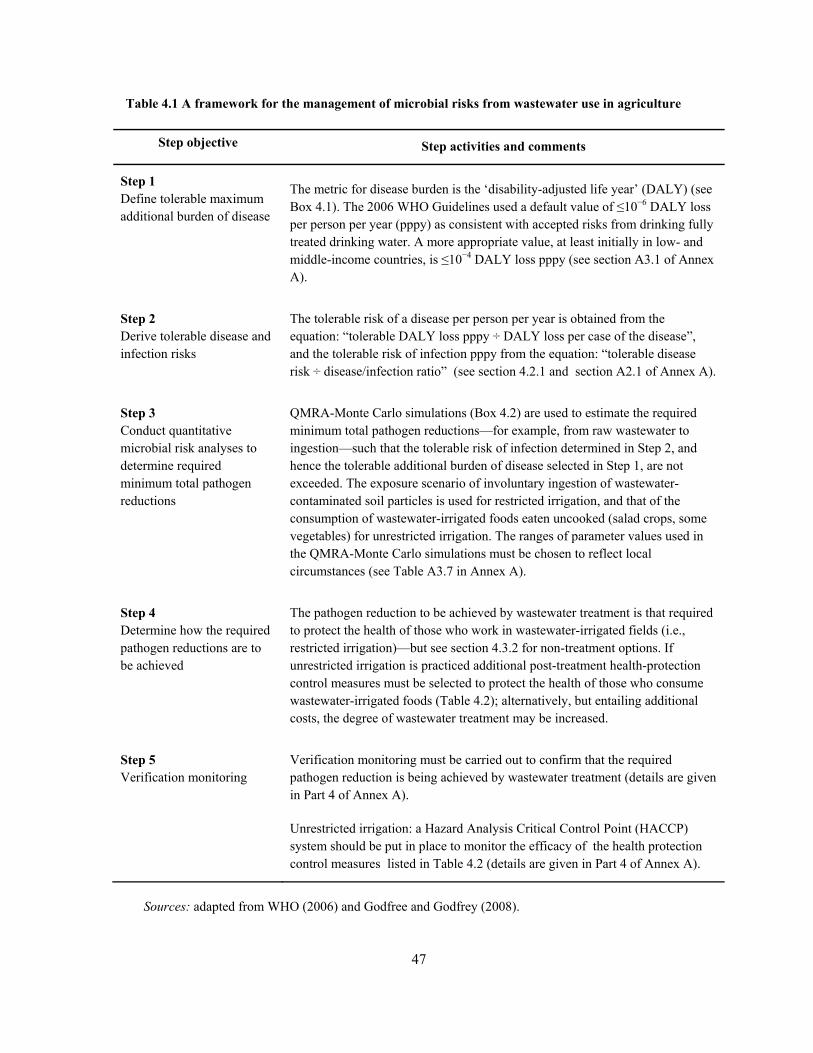
47
Table 4.1 A framework for the management of microbial risks from wastewater use in agriculture
Step objective Step activities and comments
Step 1 Define tolerable maximum additional burden of disease
The metric for disease burden is the ‘disability-adjusted life year’ (DALY) (see Box 4.1). The 2006 WHO Guidelines used a default value of ≤10−6 DALY loss per person per year (pppy) as consistent with accepted risks from drinking fully treated drinking water. A more appropriate value, at least initially in low- and middle-income countries, is ≤10−4 DALY loss pppy (see section A3.1 of Annex A).
Step 2 Derive tolerable disease and infection risks
The tolerable risk of a disease per person per year is obtained from the equation: “tolerable DALY loss pppy ÷ DALY loss per case of the disease”, and the tolerable risk of infection pppy from the equation: “tolerable disease risk ÷ disease/infection ratio” (see section 4.2.1 and section A2.1 of Annex A).
Step 3 Conduct quantitative microbial risk analyses to determine required minimum total pathogen reductions
QMRA-Monte Carlo simulations (Box 4.2) are used to estimate the required minimum total pathogen reductions—for example, from raw wastewater to ingestion—such that the tolerable risk of infection determined in Step 2, and hence the tolerable additional burden of disease selected in Step 1, are not exceeded. The exposure scenario of involuntary ingestion of wastewater-contaminated soil particles is used for restricted irrigation, and that of the consumption of wastewater-irrigated foods eaten uncooked (salad crops, some vegetables) for unrestricted irrigation. The ranges of parameter values used in the QMRA-Monte Carlo simulations must be chosen to reflect local circumstances (see Table A3.7 in Annex A).
Step 4 Determine how the required pathogen reductions are to be achieved
The pathogen reduction to be achieved by wastewater treatment is that required to protect the health of those who work in wastewater-irrigated fields (i.e., restricted irrigation)—but see section 4.3.2 for non-treatment options. If unrestricted irrigation is practiced additional post-treatment health-protection control measures must be selected to protect the health of those who consume wastewater-irrigated foods (Table 4.2); alternatively, but entailing additional costs, the degree of wastewater treatment may be increased.
Step 5 Verification monitoring
Verification monitoring must be carried out to confirm that the required pathogen reduction is being achieved by wastewater treatment (details are given in Part 4 of Annex A).
Unrestricted irrigation: a Hazard Analysis Critical Control Point (HACCP) system should be put in place to monitor the efficacy of the health protection control measures listed in Table 4.2 (details are given in Part 4 of Annex A).
Sources: adapted from WHO (2006) and Godfree and Godfrey (2008).

48
Box 4.1 Disability-adjusted Life Years (DALYs)
DALYs are a measure of the health of a population or burden of disease due to a specific disease or risk factor. DALYs attempt to measure the time lost because of disability or death from the disease compared with a long life free of disability in the absence of the disease. DALYs are calculated by adding the years of life lost due to premature death (YLL) to the years lived with a disability (YLD). Years of life lost are calculated from age-specific mortality rates and the standard life expectancies of a given population. YLD are calculated from the number of cases of the disease multiplied by its average duration and a severity factor ranging from 1 (death) to 0 (perfect health) based on the disease—for example, watery diarrhea has a severity factor from 0.09 to 0.12, depending on the age group.
DALYs are an important tool for comparing health outcomes because they account for not only acute health effects but also for delayed and chronic effects—i.e., they include both morbidity and mortality. When risk is described in DALYs, different health outcomes (e.g., fatal cancers and non-fatal diarrheal diseases) can be compared and risk management decisions prioritized.
Source: WHO 2006b.
49
Box 4.2 Quantitative microbial risk analysis
Quantitative microbial risk analysis (QMRA) determines a numerical value of the risk (i.e., probability) of disease and/or infection as a result of a person or a community being exposed to a specified number of a specified pathogen as a result of some activity—in this case the relevant activities are consuming wastewater-irrigated foods and working in wastewater-irrigated fields. QMRA can be used to estimate disease and infection risks for any pathogen as long as there are dose-response data available for it. The disease and/or infection risks can then be estimated by a dose-response equation (as shown in section A2.1 of Annex A).
Interpreting values of risk: values of risk (probability) are in the range 0−1 and are expressed per person per exposure event or, more commonly in relation to wastewater use in agriculture, per person per year (pppy). For example, an infection risk of 0.01 (i.e., 1 × 10⁻²) pppy means that each year an exposed individual has a 1% chance of becoming infected as a result of a given number of exposure events per year. Alternative ways of interpreting this infection risk of 0.01 pppy are (a) that the exposed individual will become infected once every 100 years (i.e., essentially once in his or her lifetime), or (b) that, for a community, an infection risk of 0.01 pppy means that every year 1% of the community will become infected.
Note that there is no such thing as a ‘zero risk’. A risk can be very small—for example, 1 × 10−x pppy, where x is very large—but it is not zero.
Monte Carlo risk simulations: many of the parameters used in QMRA risk determinations have ‘uncertain’ values—for example, it might be assumed that 10 mL of wastewater remains on 100 g of lettuce after irrigation, but this ‘fixed’ value of exactly 10 mL may not always occur: the value could be anywhere in the range of 5−15 mL, for example. To overcome, at least partially, the uncertainty of many of the parameters used in QMRA risk determinations, Monte Carlo risk simulations are used in which a range of values is assigned to each parameter used in the calculations, rather than a single fixed value, although a fixed value can be assigned to any given parameter if so desired. A computer program then selects at random a value for each parameter from the range of values specified for it and then determines the resulting annual risk.a The program repeats this process a large number of times (generally for a total of 1000 or 10,000 times) and determines the median and 95-percentile risks. This large number of repetitions removes some of the uncertainty associated with the parameter values and makes the results generated by multi-simulation QMRA-Monte Carlo risk analyses much more robust than those determined by simple QMRA calculations which use only ‘fixed’ parameter values, although of course they are still only as good as the assumptions made. Sections A2.3 and A3.2−A3.6 of Annex A illustrate the use of this ‘QMRA-MC’ approach to risk determination.
a See the Note at the end of Part 3 of Annex A concerning the availability of QMRA-MC computer programs.
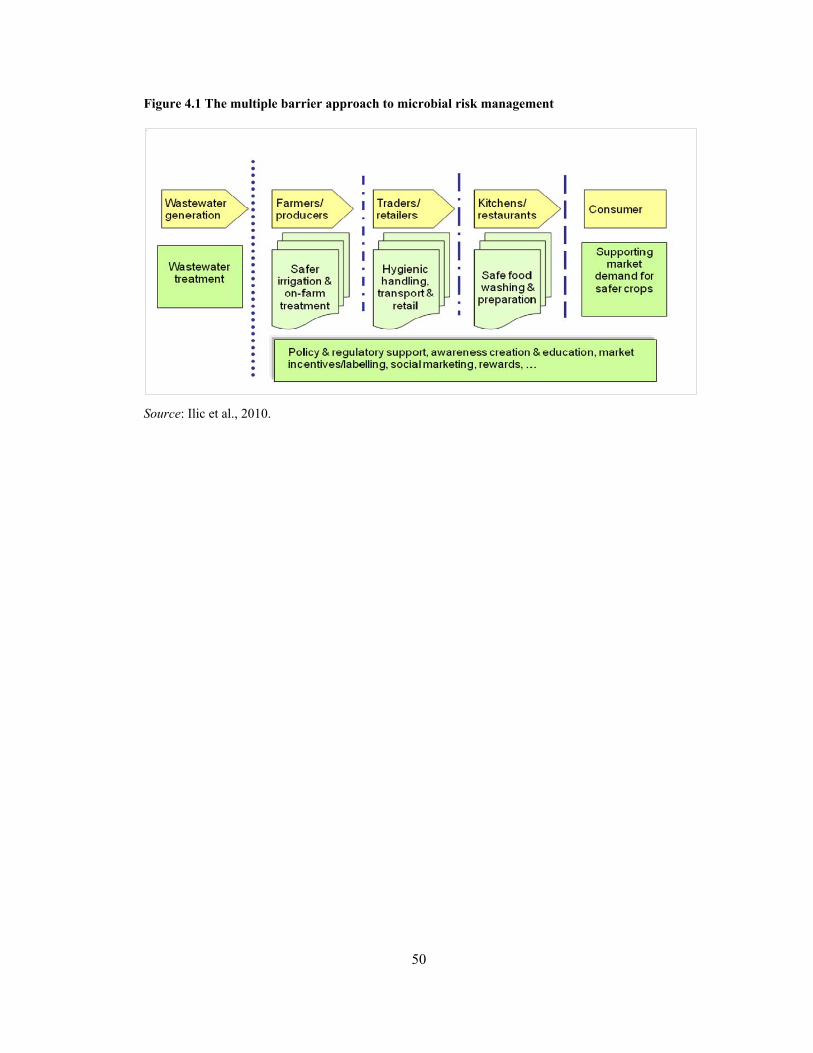
50
Figure 4.1 The multiple barrier approach to microbial risk management
Source: Ilic et al., 2010.
The image cannot be displayed. Your computer may not have enough memory to open the image, or the image may have been corrupted. Restart your computer, and then open the file again. If the red x still appears, you may have to delete the image and then insert it again.
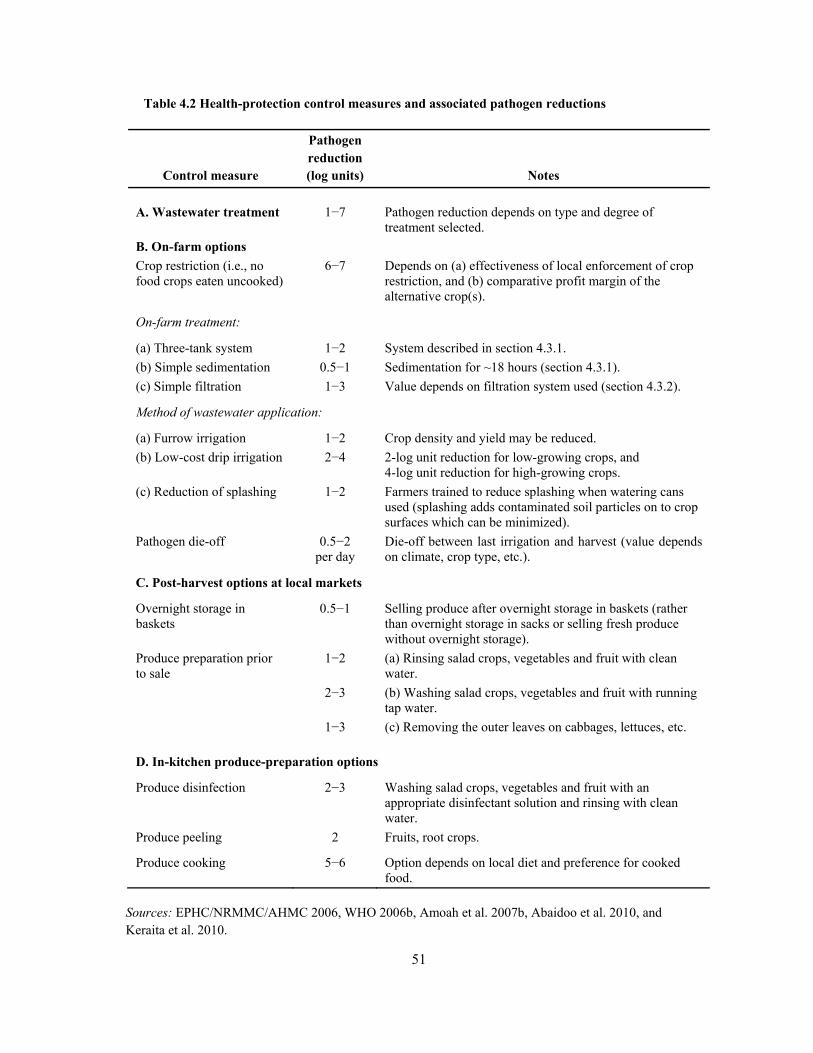
51
Table 4.2 Health-protection control measures and associated pathogen reductions
Control measure
Pathogen reduction (log units) Notes
A. Wastewater treatment
1−7
Pathogen reduction depends on type and degree of treatment selected.
B. On-farm options
Crop restriction (i.e., no food crops eaten uncooked)
6−7 Depends on (a) effectiveness of local enforcement of crop restriction, and (b) comparative profit margin of the alternative crop(s).
On-farm treatment:
(a) Three-tank system 1−2 System described in section 4.3.1.
(b) Simple sedimentation 0.5−1 Sedimentation for ~18 hours (section 4.3.1).
(c) Simple filtration 1−3 Value depends on filtration system used (section 4.3.2).
Method of wastewater application:
(a) Furrow irrigation 1−2 Crop density and yield may be reduced.
(b) Low-cost drip irrigation 2−4 2-log unit reduction for low-growing crops, and 4-log unit reduction for high-growing crops.
(c) Reduction of splashing 1−2 Farmers trained to reduce splashing when watering cans used (splashing adds contaminated soil particles on to crop surfaces which can be minimized).
Pathogen die-off 0.5−2 per day
Die-off between last irrigation and harvest (value depends on climate, crop type, etc.).
C. Post-harvest options at local markets
Overnight storage in baskets
0.5−1 Selling produce after overnight storage in baskets (rather than overnight storage in sacks or selling fresh produce without overnight storage).
Produce preparation prior to sale
1−2 (a) Rinsing salad crops, vegetables and fruit with clean water.
2−3 (b) Washing salad crops, vegetables and fruit with running tap water.
1−3 (c) Removing the outer leaves on cabbages, lettuces, etc.
D. In-kitchen produce-preparation options
Produce disinfection 2−3 Washing salad crops, vegetables and fruit with an appropriate disinfectant solution and rinsing with clean water.
Produce peeling 2 Fruits, root crops.
Produce cooking 5−6 Option depends on local diet and preference for cooked food.
Sources: EPHC/NRMMC/AHMC 2006, WHO 2006b, Amoah et al. 2007b, Abaidoo et al. 2010, and Keraita et al. 2010.

52
4.2 Currently recommended microbial risks assessment and management framework
4.2.1 Viral, bacterial and protozoan risks
The currently recommended management framework for the control of the viral, bacterial and protozoan risks resulting from wastewater use in agriculture includes five steps (Table 4.1):
Step 1: Define the tolerable maximum additional burden of disease
A tolerable maximum additional burden of disease resulting either from working in wastewater-irrigated fields or from consuming wastewater-irrigated food must be selected. Burdens of disease are now expressed as ‘DALY losses’ per person per year (pppy). The DALY loss associated with a case of a disease can be considered as the ‘health cost’ of one episode of that disease. Tolerable DALY losses are small—for example, 1 × 10−n pppy, where n is in the range 1−10 (in order of magnitude terms).
The Australian National Guidelines and the 2006 WHO Guidelines both adopt a tolerable maximum additional burden of disease of 10−6 DALY loss pppy.18 However, the 2006 Guidelines state:19
Wastewater treatment may be considered to be of a low priority if the local incidence of diarrheal disease is high and other water-supply, sanitation and hygiene-promotion interventions are more cost-effective in controlling transmission. In such circumstances, it is recommended that, initially, a national standard is established for a locally appropriate level of tolerable additional burden of disease based on the local incidence of diarrheal disease—for
example, ≤10−5 or ≤10−4 DALY [loss] per person per year (emphasis added) (WHO 2006a, volume 2, section 4.5).
Given the high global incidence of diarrheal disease, which in order-of-magnitude terms is 0.1−1 pppy (Mathers et al., 2002; Kosek et al., 2003; cf. Table A3.1 in Annex A), a tolerable maximum additional burden of disease of 10−4 DALY loss pppy is a more appropriate choice, or at least a more appropriate initial choice in low- and middle-income countries. As detailed in section A3.1 of Annex A, this results in an increase in diarrheal-disease incidence of only 1 percent.
Step 2: Derive tolerable disease and infection risks
18 For the reasons for this choice see A2.3 of Annex A.
19 This is also stated in WHO 2007, 2008a and 2010; see also Haas 1996.

53
The tolerable maximum additional burden of disease established in Step 1 must be ‘translated’ into tolerable disease and infection risks pppy, for one or more ‘reference’ pathogens, as follows:
diseaseofcaseperlossDALY
pppylossDALYTolerable=pppyriskdiseaseTolerable
ratiofection Disease/in
pppyrisk diseaseTolerable=pppyriskinfectionTolerable
Choice of ‘reference’ pathogen
Both the Australian National Guidelines and the 2006 WHO Guidelines applied QMRA to determine infection risks for three ‘reference’ pathogens:
rotavirus (a viral pathogen),
Campylobacter (a bacterial pathogen), and
Cryptosporidium (a protozoan pathogen).
These pathogens were chosen as ‘reference’ pathogens because (a) their DALY loss per case of disease was known, and (b) the dose-response data needed for QMRA were available for them. The 2006 WHO Guidelines showed that, for both restricted and unrestricted, irrigation the risk of rotavirus infection was higher than those of Campylobacter and Cryptosporidium infection, and thus rotavirus infection risks could be used on their own to assess the safety of wastewater-irrigation practices.
However, dose-response data for norovirus (formerly called Norwalk virus or Norwalk-like virus) are now available (Teunis et al., 2008). Norovirus is a better reference viral pathogen than rotavirus as it has a very high infectivity and causes diarrheal disease in both adults and children (whereas rotavirus causes diarrhea mainly in very young children). Thus norovirus is now considered the reference viral pathogen of choice for wastewater-use QMRA.
As shown in section A3.3 of Annex A, the tolerable maximum norovirus infection risk, corresponding to a tolerable maximum additional burden of disease of 10−4 DALY loss pppy, is 0.14 pppy, which means that an individual will become infected with norovirus once every seven years.
Step 3: Conduct QMRA-MC risk simulations to determine required minimum total norovirus reductions for both restricted and unrestricted irrigation
The current state-of-the-art for conducting QMRA risk simulations comprises:
1. Use of norovirus as the reference viral pathogen.
2. Use of an improved method for calculating annual infection risks by QMRA-MC (Karavarsamis and Hamilton, 2010), which is explained in section A3.2 of Annex A.

54
3. Exposure scenarios:
Unrestricted irrigation: consumption of wastewater-irrigated salad crops (typically lettuce as a non-root crop and onions as a root crop).
Restricted irrigation: involuntary ingestion of wastewater-saturated soil particles. This is a likely scenario as wastewater-saturated soil would contaminate the fieldworkers’ fingers and some pathogens could be transmitted to their mouths and hence ingested. Two sub-scenarios are used: labor-intensive agriculture (typical of low-income countries) and highly mechanized agriculture (middle- and high-income countries).
4. Selection of a locally appropriate range of values for each parameter in the QMRA risk simulation—see Table A3.7 of Annex A.
5. The QMRA-MC norovirus program for restricted irrigation is now run with the locally appropriate parameter ranges, 20 and then the QMRA-MC norovirus program for un-restricted irrigation is run.21 The QMRA-MC results show the required log unit norovirus reductions which ensure that the tolerable maximum norovirus infection risk of 0.14 pppy is not exceeded.22
Step 4: Determine how the required pathogen reductions are to be achieved
The log-unit pathogen reductions for restricted and unrestricted irrigation determined in Step 3 are used as follows:
Restricted irrigation: the required pathogen reduction has to be achieved solely by wastewater treatment (section 4.3.1) in order to protect the health of the fieldworkers —but see section 4.3.2 for non-treatment options.
Unrestricted irrigation: using the same wastewater treatment as for restricted irrigation (since even with unrestricted irrigation there are fieldworkers whose health needs protection), the balance of the required pathogen reduction has to be achieved by a locally appropriate selection of the post-treatment health-protection control measures shown in Table 4.2—i.e., if wastewater treatment has to achieve an x-log
20 See the Note at the end of Part 3 of Annex A concerning the availability of these QMRA-MC computer programs.
21 See Mara and Sleigh (2010d) for practical details on running QMRA-MC programs. Tables A3.5, A3.6 and A3.9 in Annex A show typical simulated norovirus infection risks.
22 Log unit reductions are log10 unit reductions. Thus a 1-log unit reduction = a 90% reduction, a 2-log unit reduction = a 99% reduction, a 3-log unit reduction = a reduction of 99.9%, and so on.
55
unit reduction to protect the fieldworkers and if a total reduction of y log units is required to protect the consumers, then (y – x) log units have to be achieved by a selection of post-treatment health-protection control measures. For example, if norovirus reductions of 1 log unit and 3 log units are required for restricted and unrestricted irrigation, respectively (see sections A3.3 and A3.5 of Annex A), then for unrestricted irrigation there is a 2-log unit reduction that has to be achieved by post-treatment health-protection control measures—for example, 1 log unit by die-off and 1 log unit by produce washing in clean water, or 2 log units by drip-irrigating low-growing crops such as lettuce.
Step 5: Verification monitoring
Wastewater treatment plants (WWTP) need to perform at or above their design performance —i.e., they must achieve at least their design pathogen removals. However, due to the difficulty and expense of monitoring WWTP effluents for pathogens (here, noroviruses), especially in low- and middle-income countries, recourse must be made to assessing WWTP performance by the removal of fecal coliforms.23
In the case of unrestricted irrigation, in order to ensure continuous protection of consumer health, a Hazard Analysis Critical Control Point (HACCP) system should be put in place to monitor the efficacy of post-treatment or non-treatment health-protection control measures.8.
4.2.2 Helminthic risks
The 2006 WHO Guidelines treat helminthic risks differently from viral, bacterial and protozoan risks. They make the same recommendation for human intestinal nematode eggs as was made in the 1989 WHO Guidelines (≤1 egg per liter of treated wastewater), with the proviso that, if children under the age of 15 are exposed, additional protective measures (e.g., regular deworming at home or at school) be put into place. The only difference between the 1989 and 2006 Guidelines was that the recommendation for ≤1 egg per liter of treated wastewater was based on expert opinion in the 1989 Guidelines, but on epidemiological evidence in the 2006 Guidelines.
However, dose-response data for Ascaris lumbricoides have recently become available (Navarro et al. 2009) and thus it is now possible to conduct QMRA-MC risk simulations for Ascaris, which can therefore be considered as the ‘reference’ helminthic pathogen. It is very suitable for this role as it is generally the commonest helminth and its eggs are able to survive for very long periods of time (months−years) in the environment. Log unit reductions of Ascaris can now be determined by QMRA and these can be split between wastewater
23 Further details are given in Part 4 of Annex A.

56
treatment and post-treatment health-protection control measures, as is done for viral, bacterial and protozoan pathogens since this allows for a lower level of wastewater treatment.
The 5-step management framework for the control of Ascaris risks is as follows:
Step 1: Define the tolerable maximum additional burden of disease
This is taken as 10−4 DALY loss pppy, as for viral, bacterial and protozoan pathogens. The current global DALY loss due to ascariasis is 1.8 × 10⁻³ pppy, so accepting a tolerable additional burden of ascariasis from wastewater use in agriculture of 10−4 DALY loss pppy means that the burden of ascariasis would increase from 0.0018 to 0.0019 DALY loss pppy, which is not epidemiologically significant (Mara and Sleigh 2010c).
Step 2: Derive tolerable disease and infection risks
As determined in section A3.4 of Annex A, and using an Ascaris disease/infection ratio of 1 (i.e., all those infected with Ascaris develop ascariasis), the tolerable Ascaris infection risk is 1.2 × 10⁻² pppy.
Step 3: Conduct QMRA-MC risk simulations to determine required minimum total Ascaris reductions for both restricted and unrestricted irrigation
This step is broadly the same as Step 3 for viral, bacterial and protozoan pathogens (section 4.2.1), but the QMRA-MC Ascaris programs for restricted and unrestricted irrigation are now run, with locally appropriate parameter ranges, for ranges of Ascaris egg numbers (rather than assuming pathogen numbers per 105 E. coli) —for example, 100−1000 eggs per liter of wastewater (unrestricted irrigation) or per kg of soil (restricted irrigation), 10−100 eggs per liter or kg, and 1−10 eggs per liter or kg. Then the QMRA-MC Ascaris program for un- restricted irrigation is run.24 These QMRA-MC results then show the log unit Ascaris reductions which ensure that the tolerable maximum Ascaris infection risk of 1.2 ×10⁻² pppy is not exceeded.
Step 4: Determine how the required pathogen reduction is to be achieved
Step 5: Verification monitoring
Steps 4 and 5 are the same as Steps 4 and 5 for viral, bacterial and protozoan pathogens (section 4.2.1).
24 See Mara and Sleigh (2010d) for practical details on running QMRA-MC programs; Tables A3.8 and A3.10 in Annex A show typical simulated Ascaris infection risks.

57
4.3 Options for reducing microbial risks
4.3.1 Wastewater treatment
As detailed in sections A3.3 and A3.4 of Annex A, norovirus and Ascaris reductions of 3−4 log units are required to not exceed a maximum additional burden of disease of 10−4 DALY loss pppy. Thus wastewater treatment could be required to achieve only a 1−2 log-unit reduction, with the remaining 1−3 log units being achieved by post-treatment health-protection control measures.
Viruses, bacteria, protozoa
2-log unit reduction: wastewater treatment to produce a 2-log unit reduction can be achieved by simple treatment processes, such as an anaerobic pond (or equivalent anaerobic reactor) followed by either a facultative pond or a subsurface horizontal-flow constructed wetland.25
1-log unit reduction: wastewater treatment to produce a 1-log unit reduction can be readily achieved by very simple treatment processes, such as an anaerobic pond, a three-tank or three-pond system, or overnight settling. The three-tank (or three-pond) system is operated as a sequential batch-fed process: on any one day one tank (or pond) is filled with wastewater, the contents of another are settling, and the contents of the third are used for irrigation; this is a very reliable, almost foolproof, system. In small-scale urban agriculture, as opposed to large-farm agriculture, a single tank is generally sufficient (and more affordable): on any day in the morning the tank contents are used for crop watering, and the tank is then refilled and its contents allowed to settle until the following morning.
Helminth eggs
If it is assumed that in areas where ascariasis is hyperendemic untreated wastewater contains 1000 Ascaris eggs per liter (see Table A3.8 in Annex A), a 3-log unit egg reduction is required to achieve ≤1 egg per liter. For root vegetables eaten raw, and assuming that a 2-log unit reduction occurs through produce peeling prior to consumption (Table 4.2), wastewater treatment is required to effect a reduction of only 1 log unit from 1000 to 100 eggs per liter. This reduction is also achieved by an anaerobic pond, a three-tank or three-pond system, or overnight settling.
4.3.2 Non-treatment options
Most wastewater used for crop irrigation is untreated and this causes disease in both fieldworkers and consumers (Shuval et al. 1986, WHO 2006, Scott et al. 2010). However, in many parts of the world it would be counter-productive, as well as unenforceable in practice, for governments to ban the use of untreated wastewater for irrigation, given the often
25 See Mara (2004) for design details.
58
informal character of this sector. However, the current situation in many low-income countries in which wastewater irrigation is unrecognized, or where the authorities choose in practice to ignore it, is not sustainable (Drechsel et al. 2002, Ensink and van der Hoek 2009).
Clear policies are needed to balance the agricultural benefits and the associated risks to human health of wastewater use. Ensink and van der Hoek (2009) recommend a set of practical and easily enforceable measures to minimize the health risks associated with the use of untreated domestic wastewater:
only produce that is cooked before being eaten can be grown with untreated wastewater
root crops, such as potatoes, onions, and carrots, cannot be grown with untreated wastewater
vegetables should be cultivated and irrigated using the ridge-and-furrow method
biannual treatment of fieldworkers and their families with antihelminthic drugs
general improvements in water supply and sanitation, including in local produce markets, in order to improve post-harvest practices and thus produce quality.
Improving hygiene in local markets can be very important: Ensink et al. (2007) found that vegetable contamination due to poor hygiene in local markets in Pakistan was more important than the quality of irrigation water. Nguyen et al. (2007) came to the same conclusion for fish grown in periurban wastewater-fed fishponds in Hanoi. However, in urban Ghana, where the irrigation water is more severely polluted, Amoah et al. (2007a, 455) concluded the opposite:
Despite poor sanitary conditions in markets, post-harvest handling and marketing did not further increase the farm-gate contamination levels. To reduce the health risk associated with the consumption of contaminated lettuce safer farming and irrigation practices are required, while the remaining risk could best be addressed where lettuce is prepared for consumption.
The variability found in these studies confirms the need to evaluate contamination levels and practices at the local level.
Many health-protection control measures can be applied on-farm, at local produce markets, in street-food/fast-food outlets and restaurants, as well as domestic kitchens or food preparation areas (Table 4.2).26
Simple on-farm filtration practices suitable for use in urban agriculture include sand filters made from oil drums or buckets filled with fine-grained sand, soil filtration by digging an infiltration well adjacent to a wastewater canal, and covering the outlet of watering cans with mosquito netting to reduce pathogen-containing debris being applied to the crop. Debris can also be avoided by training urban farmers to collect their irrigation wastewater from well above the sludge layer in shallow sedimentation ponds.
26 Further details are given in Ilic et al. (2010) and Keraita et al. (2010).

59
Urban farmers often use watering cans to apply wastewater to their crops (Figure 4.2). This can be highly contaminating, but the farmers can be trained to use their watering cans in a less contaminating way by slightly changing their customary practice: capping the can outlet with a perforated shower rose, and irrigating from a height of less than 0.5 m, showed a combined average reduction of 2.5 log units of faecal coliforms and more than 2 helminth eggs per 100 g lettuce compared to the practice of uncapped spouts lifted more than 1 m high for irrigating (Drechsel et al. 2008). The pathogen reductions achieved were ascribed to reduced wastewater splashing which minimizes crop contamination by soil-based pathogens which are present from manure application and previous applications of wastewater.
Figure 4.2 An urban farmer in Accra, Ghana, watering his crops with wastewater from a watering can, working barefoot and thus potentially at risk of hookworm infection
Source: Mara (personal)
4.4 Applying quantitative microbial risk analysis
4.4.1 Recommendations for current practice
QMRA combined with Monte Carlo risk simulations (QMRA-MC) is a powerful tool to use when assessing the safety of local practices for wastewater use in both large-farm agriculture and small-scale urban agriculture. It is also very easy and fast to use (Mara and Sleigh, 2010d).
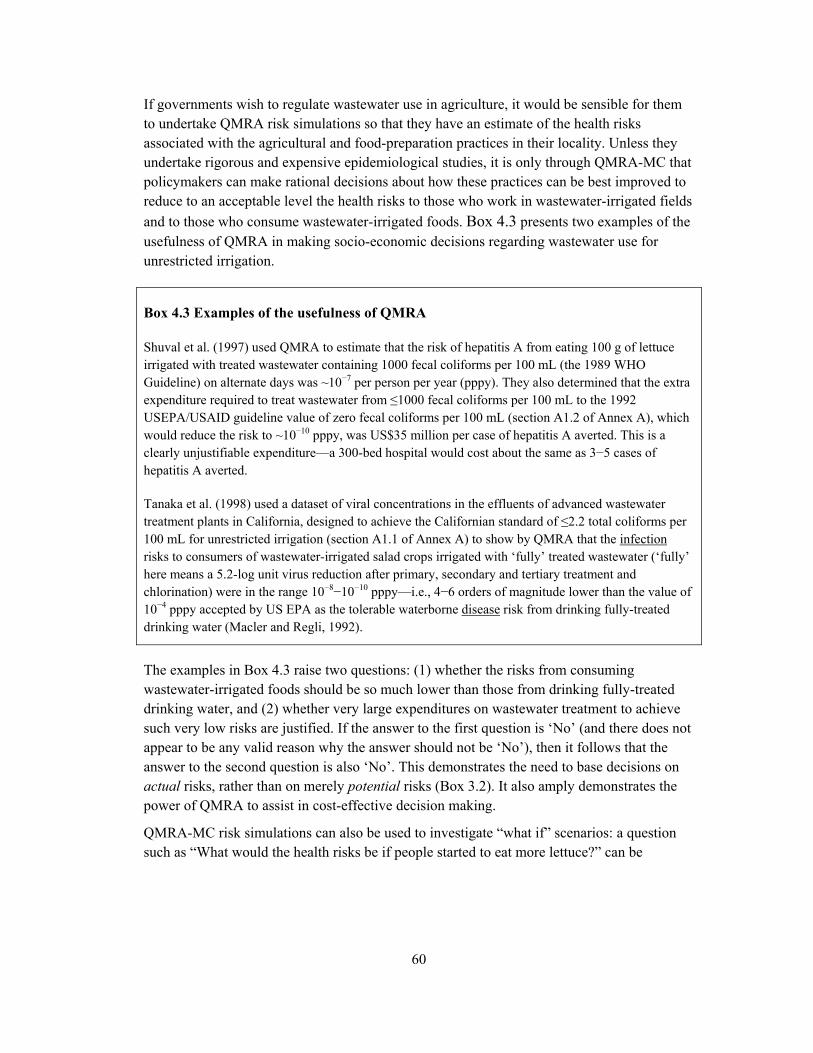
60
If governments wish to regulate wastewater use in agriculture, it would be sensible for them to undertake QMRA risk simulations so that they have an estimate of the health risks associated with the agricultural and food-preparation practices in their locality. Unless they undertake rigorous and expensive epidemiological studies, it is only through QMRA-MC that policymakers can make rational decisions about how these practices can be best improved to reduce to an acceptable level the health risks to those who work in wastewater-irrigated fields
and to those who consume wastewater-irrigated foods. Box 4.3 presents two examples of the usefulness of QMRA in making socio-economic decisions regarding wastewater use for unrestricted irrigation.
Box 4.3 Examples of the usefulness of QMRA
Shuval et al. (1997) used QMRA to estimate that the risk of hepatitis A from eating 100 g of lettuce irrigated with treated wastewater containing 1000 fecal coliforms per 100 mL (the 1989 WHO Guideline) on alternate days was ~10−7 per person per year (pppy). They also determined that the extra expenditure required to treat wastewater from ≤1000 fecal coliforms per 100 mL to the 1992 USEPA/USAID guideline value of zero fecal coliforms per 100 mL (section A1.2 of Annex A), which would reduce the risk to ~10−10 pppy, was US$35 million per case of hepatitis A averted. This is a clearly unjustifiable expenditure—a 300-bed hospital would cost about the same as 3−5 cases of hepatitis A averted.
Tanaka et al. (1998) used a dataset of viral concentrations in the effluents of advanced wastewater treatment plants in California, designed to achieve the Californian standard of ≤2.2 total coliforms per 100 mL for unrestricted irrigation (section A1.1 of Annex A) to show by QMRA that the infection risks to consumers of wastewater-irrigated salad crops irrigated with ‘fully’ treated wastewater (‘fully’ here means a 5.2-log unit virus reduction after primary, secondary and tertiary treatment and chlorination) were in the range 10−8−10−10 pppy—i.e., 4−6 orders of magnitude lower than the value of 10−4 pppy accepted by US EPA as the tolerable waterborne disease risk from drinking fully-treated drinking water (Macler and Regli, 1992).
The examples in Box 4.3 raise two questions: (1) whether the risks from consuming wastewater-irrigated foods should be so much lower than those from drinking fully-treated drinking water, and (2) whether very large expenditures on wastewater treatment to achieve such very low risks are justified. If the answer to the first question is ‘No’ (and there does not appear to be any valid reason why the answer should not be ‘No’), then it follows that the answer to the second question is also ‘No’. This demonstrates the need to base decisions on actual risks, rather than on merely potential risks (Box 3.2). It also amply demonstrates the power of QMRA to assist in cost-effective decision making.
QMRA-MC risk simulations can also be used to investigate “what if” scenarios: a question such as “What would the health risks be if people started to eat more lettuce?” can be
61
answered simply by using the appropriate ranges of lettuce consumption in the QMRA-MC computer programs to reflect the anticipated increases in lettuce consumption.27
Moreover Table 4.2 can be used to answer questions such as “If a campaign to improve the food-hygiene practices of street-food vendors were successful, what effect would this have on the required level of wastewater treatment?”
Box 4.4 details the successful QMRA investigations in urban Ghana where there was concern about the adverse health effects resulting from the consumption of wastewater-irrigated lettuce.
4.4.2 Current challenges
QMRA combined with Monte Carlo risk simulations (QMRA-MC) is a powerful tool for assessing the safety of local practices for wastewater use in agriculture. However, there are several challenges that will need to be met if QMRA is to be adopted in countries where wastewater is used in agriculture. These challenges will be particularly acute in low- and middle-income countries.
1. Regional training courses in QMRA need to be established so that local sanitary/environmental and agricultural engineers and water-resource planners become competent in its use and application to local conditions.
2. Local regulators need to be trained in QMRA so that they can establish locally appropriate regulations for wastewater use in agriculture that reflect the local epidemiology of excreta-related diseases and that are both cost-effective and effective in protecting the health of those who work in wastewater-irrigated fields and consume wastewater-irrigated foods.
3. Government officials and extension workers need to understand the rationale of QMRA-based approaches to controlling the health risks posed by wastewater use in agriculture, in order for them to: (a) endorse the approach, (b) work with local farmers, including local urban farmers, to introduce or improve on-farm practices to minimize the health risks, and (c) to communicate the safety of wastewater-irrigated foods to those who consume them. In addition local environmental health officials need to be trained in the basics of HACCP so that they can establish locally appropriate HACCP procedures to ensure the safety of wastewater-irrigated foods.
This will enable QMRA to be implemented and used correctly so that the most appropriate cost-effective and health-protective practices for the agricultural use of wastewater can be selected, implemented, and monitored.
27 Lettuce consumption might well increase if the Ministry of Health were to encourage people to eat more fresh fruit and vegetables (see the ‘Five a Day’ campaign by the UK government at http://www.5aday.nhs.uk).
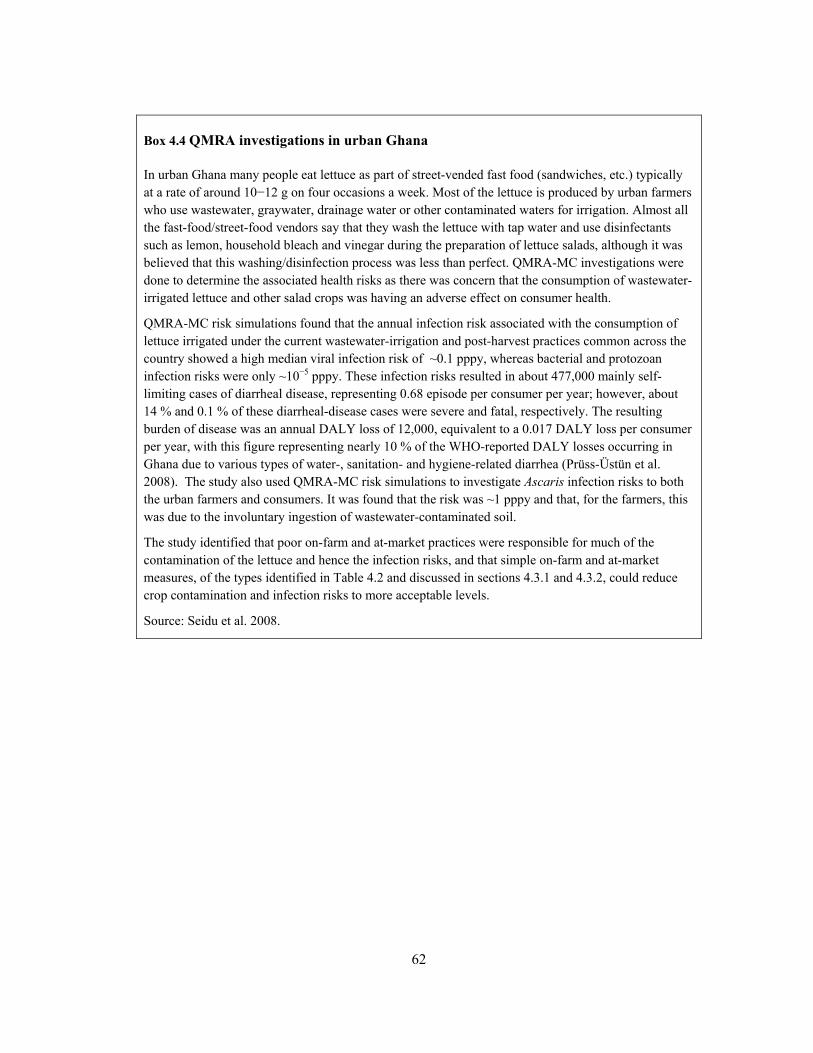
62
Box 4.4 QMRA investigations in urban Ghana
In urban Ghana many people eat lettuce as part of street-vended fast food (sandwiches, etc.) typically at a rate of around 10−12 g on four occasions a week. Most of the lettuce is produced by urban farmers who use wastewater, graywater, drainage water or other contaminated waters for irrigation. Almost all the fast-food/street-food vendors say that they wash the lettuce with tap water and use disinfectants such as lemon, household bleach and vinegar during the preparation of lettuce salads, although it was believed that this washing/disinfection process was less than perfect. QMRA-MC investigations were done to determine the associated health risks as there was concern that the consumption of wastewater-irrigated lettuce and other salad crops was having an adverse effect on consumer health.
QMRA-MC risk simulations found that the annual infection risk associated with the consumption of lettuce irrigated under the current wastewater-irrigation and post-harvest practices common across the country showed a high median viral infection risk of ~0.1 pppy, whereas bacterial and protozoan infection risks were only ~10−5 pppy. These infection risks resulted in about 477,000 mainly self-limiting cases of diarrheal disease, representing 0.68 episode per consumer per year; however, about 14 % and 0.1 % of these diarrheal-disease cases were severe and fatal, respectively. The resulting burden of disease was an annual DALY loss of 12,000, equivalent to a 0.017 DALY loss per consumer per year, with this figure representing nearly 10 % of the WHO-reported DALY losses occurring in Ghana due to various types of water-, sanitation- and hygiene-related diarrhea (Prüss-Üstün et al. 2008). The study also used QMRA-MC risk simulations to investigate Ascaris infection risks to both the urban farmers and consumers. It was found that the risk was ~1 pppy and that, for the farmers, this was due to the involuntary ingestion of wastewater-contaminated soil.
The study identified that poor on-farm and at-market practices were responsible for much of the contamination of the lettuce and hence the infection risks, and that simple on-farm and at-market measures, of the types identified in Table 4.2 and discussed in sections 4.3.1 and 4.3.2, could reduce crop contamination and infection risks to more acceptable levels.
Source: Seidu et al. 2008.
63
Chapter 5. Toward an Agenda for Improving Wastewater Use in Agriculture
5.1 Implementing measures for reducing public health risks
5.1.1 Progressing from unplanned to planned wastewater irrigation
Countries will need to implement the comprehensive and progressive measures for reducing public health risks associated with wastewater irrigation described in Chapters 3 and 4 while responding to their health priorities. This response will be different for each country and will depend on what path it takes ultimately to reach the desired goal of planned wastewater irrigation that meets internationally-accepted health-based targets—such as those established by the 2006 WHO Guidelines for wastewater use in agriculture described in Chapter 4.
Much will depend upon the starting point of a particular country (see Table 2.4). For low-income countries facing water scarcity and seeking food security, there is not enough money or capacity to immediately build and operate the needed wastewater treatment systems that would ensure minimal health risks from wastewater irrigation. It is necessary to determine what steps countries can take today in order to reach the health-based targets of the 2006 WHO guidelines in the future, and to commit to working toward the targets within a realistic timeframe through stepwise implementation of a plan that leads to steady improvement in the quality of water and wastewater (von Sperling and Fattal, 2001). In the first stage, when environmental conditions are poor and local capacities reduced, countries will have to rely on non-treatment options as outlined Chapter 4. Subsequently, a large benefit can usually be achieved at a comparatively low cost by focusing on rudimentary engineering solutions coupled with policy reforms and non-structural interventions. The experience gained in the first stage should lay the foundation for subsequent stages. Ideally, a timetable for progressive implementation should be defined, and adequate lead time should be allowed for achieving strategic goals.
Middle-income countries will normally have a different starting point, having already established some of the policies, legislation, institutions, and regulations needed for a more comprehensive water resources planning framework, and introduced some degree of wastewater management. But they may not have adequately addressed wastewater use in agriculture, or considered wastewater as part of local water resources. Experience gained in setting up the required infrastructure and institutional capacity for regulation and enforcement of wastewater management will improve progressively, assuming appropriate monitoring is in place, and should provide a solid foundation for moving on to subsequent stages. Affordability is still a critical issue, and attention should be focused on improved financial management and identification of opportunities for mobilizing needed investments for maintaining the systems in place, and then on step-wise upgrading of treatment systems and improving overall operations.
High-income countries generally have undergone an implicit stepwise implementation of standards as regulations for water and wastewater quality and use for irrigation have become

64
progressively more stringent. But some of these countries have not yet fully addressed wastewater use in agriculture.
Many developing and industrialized countries are now faced with trying to achieve more stringent standards, but are far from meeting them. For this reason, the concepts of strategic planning and stepwise implementation should be taken up and adapted to their specific needs. The challenge is not to copy the 100+ years experience of the industrialized countries, but to learn from it and jumpstart a process to develop a multi-phased strategic plan that can be achieved in time intervals of 15 to 20 years.
At each stage of the process, countries should seek to implement those measures that provide the maximum net benefits, or, in the absence of sufficient information for a cost-benefit analysis, choose the most cost-effective measures for achieving a desired level of risk reduction (WHO, 2006). How to reach this first step is illustrated below by an example from Ghana, a low-income country, and what can be done further on is illustrated through two examples from Chile and Israel, the first an upper-middle-income country and the second a high-income country today that began its efforts while it was still developing.
Phased improvements in wastewater treatment
To progress from unplanned to planned wastewater use for agriculture, the introduction of wastewater treatment is an essential strategic goal. Low-income countries should seek to introduce non-treatment options and simpler low-cost treatment options as a first step, and progressively move toward expanded sewerage systems and costlier treatment technologies as financial and operational capacity grows. An important part of this first step is to clearly define responsibilities for household, community, and public sanitation service provision, and to put in place the capabilities to monitor operations and verify that treatment targets are met (for example, by implementing the HACCP system described in Chapter 4). A progressive array of treatment options is shown in Table 5.1, along with possible pathways to expand sewerage and treatment as development occurs.
When planning for appropriate treatment systems, particularly those that can positively impact food safety, scale is an important factor (Table 5.1). Taking into account the common characteristics of cities in developing countries, four levels of scale are of interest:
On-site wastewater treatment and use: A wastewater management system used at the site of wastewater generation. On-site systems may handle greywater and blackwater separately or combined. Typical non-sewered sanitation options can range from simple pit latrines, VIP latrines, and dry (composting) toilets, to septic tanks with gravity-fed leachfield, horizontal flow filter or natural treatment system. Ideally, only greywater from household storage tanks will be used for household gardens, or wastewater that has been processed by soil infiltration, and only composted human waste for adding nutrients.
Communal wastewater treatment and use: Systems where wastewater from a cluster of homes is collected and diverted for treatment close to the point of use on small agricultural plots. Communal systems might include unconventional collections systems like small-bore sewers or condominial sewers, and the recovered wastewater
65
used for irrigation of communal plots. Appropriate treatment options can include septic tanks, Imhoff tanks, anaerobic ponds, storage ponds, or three tank systems.
Decentralized wastewater treatment and use: Collection, treatment and use of wastewater from isolated medium-size communities, as well as from portions of larger urban areas contained within a minor watershed, at or near the point of wastewater generation, generally to irrigate larger urban or peri-urban plots. Appropriate low-cost decentralized treatment options can include waste stabilization pond systems (e.g., Lima’s San Augustín project described in Box 2.8), upflow anaerobic sludge blanket reactors (UASB), wastewater treatment storage reservoirs (WTSR), or chemically enhanced primary treatment.
Centralized wastewater treatment and use: The collection and drainage of wastewater, and sometimes stormwater, from a large urban area using an extensive network of pumps and piping for transport to a central location for treatment and reclamation, usually near the point for convenient irrigation use. While waste stabilization pond or WTSR systems may be feasible for larger cities, due to land constraints large city systems will often be based on conventional treatment options. Membrane technologies are emerging as preferred technologies in high-income countries (Bixio et al, 2006). Within a large river basin encompassing multiple urban areas, many centralized facilities may be required..

66
Table 5.1 Progressive wastewater treatment options by level of economic development
Characteristics by level of economic
development
Low-income countries (43 countries)
<$975 GNI/cap
Lower-middle-income countries
(55 countries) $976-3,855 GNI/cap
Upper-middle-income countries
(46 countries) $3,586-11,905
GNI/cap
High-income countries (66 countries,
27 OECD) >$11,906 GNI/cap
Scale of interventions Household gardens; Small-scale communal plots; Large urban or peri-urban plots with decentralized simplified sewerage systems; Large peri-urban plots with city-wide sewerage systems
Small-scale communal plots; Large urban or peri-urban plots with decentralized treatment systems; Large peri-urban plots with city-wide treatment systems
Large urban or peri-urban plots with decentralized treatment systems; Large peri-urban plots with city-wide treatment systems; Watershed level water management systems
Municipal reclamation and reuse projects for crop and landscape irrigation; Basin-wide water management systems
Evolution of typical treatment technology options (see WHO, 2006 for description of basic treatment options)
Household gardens: On-site latrine alternatives Septic tank Greywater collection Communal plots:28 Imhoff tank Storage ponds Three tank system Large plots or medium-size city:29 Waste stabilization ponds (WSP) Upflow Anaerobic Sludge Blanket Reactors (UASB)
Large plots or medium-size city: WSP systems30 UASB Wastewater Treatment and Storage Reservoirs (WSTR) Chemically enhanced primary treatment Large city centralized system: Conventional treatment31 + polishing ponds
Large plots or medium-size city: WSP systems UASB WSTR Chemically enhanced primary treatment Large city centralized system: WSTR Chemically enhanced primary treatment Conventional treatment + polishing ponds Soil aquifer treatment (SAT) systems
Conventional treatment + tertiary treatment Membrane technologies (MBR, MF, UF, RO)32 SAT systems
Sources: WHO (2006); Bixio et al (2006); Income data from World Bank (2010). WSP = waste stabilization ponds; UASB = upflow anaerobic sludge blanket reactors; WSTR = wastewater treatment and storage reservoirs; SAT = soil aquifer treatment system; MBR = membrane bio-reactors; MF = microfiltration; UF = ultrafiltration; NF = nanofiltration; RO = reverse osmosis
28 Assumes communal drains or sewerage system available (e.g., small-bore sewers, condominial sewers, conventional sewers) with localized treatment plant. 29 Assumes sewerage networks, interceptors, and decentralized treatment plants. 30 Waste stabilization pond (WSP) systems typically include anaerobic + facultative + maturation ponds. 31 Conventional treatment, for the purposes of this report, normally includes primary treatment (e.g., primary sedimentation) followed by secondary treatment process such as activated sludge and its variants (e.g., aerated lagoons and oxidation ditches, and trickling filters). Note that conventional systems do not meet microbiological quality requirements for unrestricted irrigation use without additional tertiary treatment processes (e.g., filtration, disinfection, or a polishing pond). 32 Membrane technologies applicable to wastewater treatment and use include membrane bio-reactors (MBR), microfiltration (MF), ultrafiltration (UF), and reverse osmosis (RO).
67
Planning for control of industrial wastewater
In cities where industries contribute a significant amount of wastewater, the enforcement of industrial pretreatment programs is essential for the successful operation of any treatment plant. The importance of such programs cannot be overemphasized in cities with large wastewater treatment facilities.
Quality standards are usually set up for industrial wastewater discharged into municipal sewerage systems, in order to ensure that heavy metals or other contaminants generated by industrial activity do not reach levels that may damage pipes, inhibit the biological treatment processes, remain in the effluent in higher concentrations than permitted, or accumulate in the sludge and limit or even prevent its disposal or reuse. Industrial discharges that cannot meet quality standards should be prohibited from discharging into municipal sewers. The establishment of industrial discharge standards is important in order to promote industrial pretreatment programs and control certain industrial discharges that may be critical to the operation of wastewater treatment plants and the quality of treated effluents and sludge byproducts.
The main elements of a successful industrial pretreatment program are the following (Idelovitch and Ringskog, 1997):
A discharge inventory and information system An industrial discharge permit system establishing limits for discharging into sewers
and requirements for presenting a compliance plan
Self-reporting requirements that involve the use of certified laboratories
Inspection and monitoring by the wastewater authority
Sanctions for noncompliance
Sewer use tariffs based on both the volume discharged and the organic load
Industrial participation, for example, through a joint water quality council, in all phases of the program, including design, the setting of standards, and implementation
Some form of technical and financial assistance for industries, particularly small and medium enterprises
A training and institutional development program to help the wastewater authority prepare itself in this new area of responsibility
Close and well-defined coordination between the wastewater authority and the environmental regulator to ensure that industrial wastes are not improperly discharged into sewers, as well as for the correct disposal of effluent and sludge
5.1.2 Developing a strategic plan
A strategic plan (comprising a long-term strategy and a phased action plan to meet the strategic goals, along with needed policy reforms) is needed that will ultimately lead to the desired goal of moving from unplanned to planned wastewater irrigation and that meets internationally-accepted health-based targets, for example, pathogen reduction targets established by applying the WHO Guidelines for the Safe Use of Wastewater, Excreta and

68
Greywater (2006) as described in Chapter 4. Recognizing that this goal cannot be achieved overnight or even in one phase, the action plan should be multi-phased and aim at steady and measurable progress toward the ultimate goal within an agreed and realistic timeframe (e.g., 15–20 years).
Development of a strategic plan for wastewater use in agriculture should take place within a broader multisectoral planning framework for integrated water resources management, seeking the maximum economic yield from the use of an increasingly scarce resource. The incorporation of protocols for safe wastewater use into national water plans is important, especially when water and financial resources are scarce, not only to protect water quality but also to minimize wastewater treatment costs, to safeguard public health, and to obtain the maximum possible agricultural benefit from nutrients and organic matter contained in wastewater (Mara and Cairncross, 1989).
Possible steps to help develop a strategic plan for implementing health risk reduction measures are (adapted from Carr et al, 2004):
1. Design and conduct a survey of wastewater and excreta use practices throughout the country or in specific districts. The survey could contain questions concerning: The availability, types and status of wastewater treatment available The types of crops grown in the area (whether they are eaten cooked or
raw)
Techniques for wastewater and excreta application, e.g. bucket, furrow, sprinkler, drip, other
Options for protecting or controlling quality along the food supply chain from farm to fork
An assessment of human exposure to wastewater and excreta during agricultural practices, e.g. Do fieldworkers wear protective clothing? Do they practice good hygiene?
2. Evaluate and prioritize health risks, in the context of the national burden of disease,
associated with the use of wastewater and excreta in agriculture.
Conduct interviews with health staff (doctors, nurses, pharmacists), farmers, families, community workers, teachers, consumer advocate groups, etc.
Review scientific studies of disease, clinical data, outbreak information, prevalence data, etc.
Conduct, if possible, a QMRA-MC risk simulation (see Chapter 4 and Annex A) to assess the safety of local practices for wastewater use in irrigation, and recommend appropriate pathogen reduction targets. If a QMRA is not possible then semi-quantitative risk ranking can be done, or if crops irrigated with severely polluted water are eaten raw the maximum risk reduction level can be targeted, as in the Ghana case (Box 5.2).
3. Based on steps 1 and 2, conduct national or district-level workshops to formulate appropriate (realistic) strategies for mitigating health impacts that include relevant stakeholders, e.g. farmers, traders, and consumer advocate groups
69
4. Develop national or other action plan and policies for the safe use of wastewater and excreta in agriculture considering cost-effectiveness of possible interventions that include both treatment and multiple barrier options. The plan should include time-bound interim health targets for the steady improvement in health outcomes over the medium and long term.
5. Strengthen institutional capacities – designate a responsible authority (or authorities) to monitor and enforce safe wastewater and excreta use practices.
6. Review and revise national strategy, action plan, and policies as needed.
A sample strategy and an action plan for the incremental application of the 2006 WHO guidelines is presented in Box 5.1.
When developing a strategic plan it is important always to consider the alternative to this step-wise approach, which may be inaction if standards are set too high and cannot be achieved in a reasonable period of time. In Ouagadougou, for example, crop restrictions for using treated wastewater on a demarcated farming site near the treatment plant are so severe that food crop farmers returned to their informal sites using untreated wastewater (Drechsel, personal communication). The step-wise approach includes the acceptance of wastewater irrigation at a standard much lower than required in developed countries given that post-treatment options for reducing risk can be added through a multi-barrier approach.

70
Box 5.1 Sample strategy and action plan for incremental application of WHO guidelines
Pathogen reduction targets: Phase in pathogen reduction targets over suitable period of time (e.g., 15−20 years) according to treatment capabilities and other feasible barriers. For example, for a large irrigation scheme in a low-income country, and assuming that the 2006 WHO risk assessment and management framework has been applied as shown in Annex A, interim log unit pathogen reduction targets could be set as follows for the reference pathogens norovirus and Ascaris:
Implementation Phase: DALY loss pppy:
Phase I 1 × 10⁻⁴
Phase II 1 × 10⁻⁵
Phase III 1 × 10⁻⁶
Norovirus: Restricted irrigation 1 log unit 2 log units 3 log units
Unrestricted irrigation 4 log units 5 log units 6 log units
Ascaris eggs: Restricted irrigation 1 log unit 2 log units 3 log units
Unrestricted irrigation 3 log units 3 log units 4 log units
Treatment: Introduce or upgrade treatment at strategic locations where wastewater irrigation is taking place or could be encouraged, phased in over the plan time period. For example, treatment options to be considered could include:
First stage of treatment: natural purification processes (e.g., abstraction suitable distance downstream from discharge); irrigation storage ponds or reservoirs designed for pathogen removal, waste stabilization ponds, upflow anaerobic sludge blanket reactors, primary treatment plus additional treatment (e.g., storage reservoir, chemically enhanced coagulation, coagulation + rapid sand filtration). Second stage of treatment: waste stabilization ponds, wastewater treatment and storage reservoirs, conventional secondary treatment (e.g. activated sludge, trickling filter, etc.), aeration ponds, etc. Third stage of treatment: waste stabilization ponds, conventional secondary treatment + storage reservoirs or disinfection, advanced tertiary processes (e.g., membrane filtration, disinfection), soil aquifer treatment system.
Strengthen local capacity: Assemble a team of health and agricultural outreach workers who can work with farmers and villagers to improve health and agricultural practices and develop feasible crop restriction strategies and other interventions as necessary.
Health and hygiene education: Expand existing hygiene and sanitation outreach programs to include information on potential health effects of wastewater use; educate farmers, produce vendors and consumers about food safety and hygiene.
Crop restriction: Work with farmers to develop feasible and health protective crop restrictions, especially in the areas of highest risk (e.g., where undiluted raw wastewater is used).
Wastewater application: Determine the safety level of current practices. As resources/technologies permit, shift over time to safer wastewater/excreta application practices where there is less human contact (e.g., drip and bubbler irrigation).
Human exposure control: Expand hygiene and health education programs in affected communities.
71
Require protective clothing at larger wastewater/excreta use projects and where feasible. Provide clean water at markets for ‘freshening produce.’ Inspect general hygiene at food markets.
Other health interventions: Initiate or expand vaccination campaigns in affected areas (e.g. typhoid, hepatitis A). Complement hygiene and sanitation programs with periodic antihelminthic drug campaigns; this works well where antihelminthic drugs are widely available at low cost and where wastewater and excreta use is limited to distinct areas in a country as, for example, in Pakistan (Feenstra et al. 2000). Mass antihelminthic drug campaigns against intestinal nematode infection may need to be considered at least once per year in areas where 50−70% of the school-aged children have soil-transmitted helminthic infections. Where the prevalence of these infections exceeds 70% in school-aged children and more than 10% of the individuals are moderately or heavily infected, then the children should be treated 2−3 times a year (Montresor et al. 2002).
Industrial effluents: Initial efforts should be made to identify sources of industrial discharges. Phase in an approach that first requires the largest polluters to clean up their waste or divert them from the municipal sewers, and eventually requires all industrial discharges to be pretreated up to defined standards or diverted. Establish a charging mechanism for the remaining industrial effluent loads that can safely be treated at the municipal WWTP—for example, organic wastes (BOD or COD), suspended solids, nutrients.
Source: Adapted from Carr et al. 2004, WHO 2006b, Mara 2009, and Mara and Sleigh 2010c.
5.1.3 Examples of phased implementation plans
Several specific examples of how a phased strategic plan can be developed are shown below. In the case of a low-income country, Ghana, it required several steps before a cost-effectiveness analysis could be utilized to choose among possible multiple barriers to disease transmission (Box 5.2). In Chile, an upper-middle-income country, an emergency control program based on multiple barriers forestalled a cholera outbreak and the subsequent implementation of a sanitation plan allowed the country to go from virtually no treatment up to full wastewater treatment in the span of two decades (Box 5.3). Finally, the example of Israel, a high-income country facing extreme water scarcity, illustrates a mature wastewater irrigation program developed over more than four decades, that today reclaims 75 percent of all municipal sewage for agriculture and provides half of all irrigation water in the country, thus liberating significant freshwater sources for other higher-valued urban and industrial uses (Box 5.4).
These examples demonstrate that three countries at different levels of development, in very different circumstances, and following different implementation pathways, have been able to confront the health hazards associated with untreated wastewater use for agriculture and, in the incipient case of Ghana, have the possibility of continuing to work steadily toward the needed health risk reductions.
Two other partially described examples for water-scarce lower-middle-income countries include Jordan (Box 2.9) and Tunisia (Box 2.10), both of which have also made impressive progress over a few decades.
72
Box 5.2 Ghana: From scratch, through the application of QMRA, to a national strategy
Food safety is an important topic in Ghana which is addressed by various national and district entities under the leadership of the Food and Drug Board of the Ministry of Health. As is common in similar countries in Sub-Saharan Africa, there are multiple hazards affecting food safety in Ghana, from the sale of date-expired food items to non-compliance with the most basic rules of hygiene in markets and restaurants. The reasons for this range from poor educational levels and low risk awareness to the inability to invest in electricity (for cool storage) or access to water to maintain an appropriate level of hygiene.
Urban farmers who specialize in exotic ‘salad’ vegetables for the urban market have received significant negative media attention over the past few years due to the use of highly polluted water from drains and wastewater streams, so the authorities are well aware of this particular risk factor and are under public pressure to address the issue. Although cholera outbreaks are a common feature in Ghanaian cities, there had been no means to analyse its transmission pathways and the contribution of any particular hazard (see Box 5.3). The authorities did not know where to invest their limited resources. In this situation the better known risk factors, such as personal hygiene and safe drinking water, usually get priority. However, in an attempt to address the ‘obvious’ risks from wastewater use, the Ministry of Local Government asked the Environmental Protection Agency in 2002 to arrest farmers using polluted irrigation water. The subsequent action proved unrealistic given the fact that in Accra alone there are some 1,000 farmers whose livelihoods depend on this practice. This was the background situation when the Ministry of Food and Agriculture (MoFA) asked IWMI for research assistance. Following the decentralization MoFA has directorates in every Ghanaian city and was therefore directly concerned by the arrests of ‘its’ farmers, while it lacked the capacity to address the urban wastewater problem that its traditionally rural-oriented extension staff did not have the experience or knowledge to address.
To apply the 1989 WHO guidelines—i.e., to treat the wastewaters the urban farmers were using to an acceptable level—or to ask them to change the cash crops they were growing appeared unrealistic, and the focus shifted to safety options that could be realized on the urban farms, in markets and in kitchens (Drechsel et al. 2002). Given the extremely high fecal coliform counts in the irrigation water (106−108 per 100 mL) and the fact that the crops grown are usually eaten raw, the target was to minimize as far as possible the fecal coliform count at the point of consumption. This has been the target of a number of interlinked projects since 2004 which could be considered as an early local adaptation of the 2006 WHO Guidelines.
The projects analyzed the pathways of vegetable contamination from farm to fork and determined the number of farmers and consumers in all major cities. This allowed QMRA to be run and for the DALYs lost to be calculated. The projects then tested with farmers, traders and food caterers various non-treatment options as described in section 4.3.2. The most promising with the highest adoption potentials were selected to be part of a national strategy for health-risk reduction targeting two main entry points: various safer irrigation practices depending on the site, and improved vegetable washing in the street-food sector. The implementation of the strategy, which is not yet funded but is at the proposal stage, would be based on four pillars—significant awareness creation, social marketing, incentives, and regulations—to achieve the best possible adoption of recommended practices (Karg et al. 2010). Based on the related implementation costs and the QMRA results it was possible to calculate the cost-effectiveness of various combinations of safety practices— i.e., how much it would cost to avert a DALY. This analysis was carried out to understand in particular a) how non-treatment options compare with wastewater treatment, and b) how different adoption rates of non-treatment options affect their cost-effectiveness (Seidu and Drechsel 2010).
The cost-effectiveness analysis also showed that it would increase the implementation costs of the health
73
strategy only marginally if other principles of basic hygiene could be included (e.g., vegetable washing and hand washing) while the number of averted DALYs could significantly increase. This would make a great deal of sense but would complicate cause-effect monitoring.
Even though the recommendations in the case of Ghana focus on non-treatment options, the studies also concluded that wastewater treatment could be cost-effective in combination with non-treatment options, if certain (currently partially broken down) treatment plants with farm sites in the vicinity could be rehabilitated and farmers agreed to move to those dedicated areas. In this case the value addition through farming (including aquaculture) could support the cost of maintaining the plants (Murray and Buckley 2010). Such a system has been earmarked by the African Water Facility for testing on a pilot scale in Accra and Kumasi. In general, however, planned reuse and intersectoral collaboration are likely to be the exception as local institutions are overstretched by more basic problems.
74
Box 5.3 Santiago, Chile—From fear of cholera to full wastewater treatment in two decades
In 1991, after suffering endemic typhoid over several decades, and facing the beginning of a cholera outbreak, both diseases being linked to indirect wastewater irrigation (see Box 2.7), the Government of Chile took decisive action aimed at eliminating the hazard of using untreated wastewater and bringing these diseases under control. As a first step, the government created a National Commission to Avoid Cholera, which involved several ministries (Agriculture, Health, and Public Affairs), and put in place an emergency control program of public health interventions and sanitary education. The emergency program comprised interventions on three broad fronts:
Improving irrigation and drinking water quality
Changing the irrigation practices of farmers
Changing the consumption behavior of the population
Measures to improve irrigation included the immediate construction of interceptors along some of the most polluted reaches of rivers serving as irrigation channels, and chlorination of others. Loans were offered farmers to encourage them to drill wells and provide clean water for irrigating their fields. Also, to induce famers to change their irrigation practices, the GoC banned the sale of wastewater-irrigated produce, removed this produce from the markets, and banned transportation of the produce outside Santiago metropolitan area. Banned crops included all vegetables normally consumed raw. This ban was accompanied by intensified sanitary inspection of irrigated areas, and the destruction of any banned crops that were encountered.
The most significant intervention was a Ministry of Health campaign to educate the public about the health risks of eating raw vegetables, augmented by growing press coverage about cholera and typhoid. Finally, the sale and consumption of raw vegetables and salads in restaurants was banned throughout the metropolitan area—a ban that continued for several years. For the first time, the government, the public, and the farmers worked together on a broad front to raise awareness of and resolve the problems and risks associated with using polluted rivers as a source of irrigation water.
The emergency control program was successful not only in preventing the spread of cholera into Chile, but also in controlling and reducing the rate of typhoid in the Santiago metropolitan area to unprecedented levels. Typhoid cases dropped from 3,558 average cases per year in the pre-intervention period from 1985-90 to 454 cases post-intervention in 1992. Since then, the incidence rate of typhoid in all of Chile has steadily declined from high annual rates in excess of 50 cases per 100,000 population from 1950 to 1990, to 12 cases per 100,000 population in 1993, and down to 2.2 cases per 100,000 population in 2006.
However, because the emergency program was not targeted at structural measures to control pollution from urban wastewater—but rather was aimed primarily at behavior—the sustainability and longer-term effect of these interventions was difficult to predict. Accordingly, the GoC also embarked on investing in engineering solutions. The first step was the completion of the construction of two major wastewater interceptors being financed by an existing World Bank project for Santiago Water Supply and Sewerage II. In addition, the project financed the construction of a pilot wastewater treatment plant —the first for Santiago—along with the preparation of a definitive feasibility study of wastewater treatment options for the greater Santiago metropolitan area. Early estimates of the full cost of treatment were on the order of US$78 per year, or about US$0.14 per m3, to be added to the water and sewerage tariff.
As part of an economic study of environmental issues in Chile, a policy cost-benefit analysis was carried out of the cholera emergency program implemented in 1991, and of the proposed option of full
75
wastewater treatment. The study confirmed that compared to the risk of inaction, the emergency program yielded health benefits in excess of corresponding costs, and avoided potentially costly export losses due to inaction. Regarding wastewater treatment and indirect irrigation use, the study found that combined annual benefits of reduced or avoided mortality and morbidity due to typhoid and cholera, avoided export losses, expanded farm output, and reduced consumer costs, when added together, amounted to between $23.7 to $76.6 million annually. These benefits alone would significantly offset the annual cost of full treatment ($78 million) without considering additional benefits such as reduced mortality and morbidity due to hepatitis and diarrheal diseases beyond typhoid and cholera (estimated at between $33.4 to $166.9 million annually), amenity and other environmental values, or the value of the water use rights of treated effluent. Thus, after decades of inaction, policymakers came to view wastewater treatment as a necessary and viable environmental infrastructure investment.
During and following the completion of the World Bank-supported project, the Chilean water and sanitation sector was phasing in major reforms so that the private sector could finance the huge investments needed to achieve universal water and sewerage services including wastewater treatment. The reforms were completed in 1998 and a 30-year concession was awarded to the private consortium AguasAndinas in 1999 to provide water and sewage services to the Santiago metropolitan area, which has now resulted in universal treatment for the city (see Box 2,7).
The completion of the Sanitation Plan guarantees that 130,000 hectares of agricultural land will be irrigated with clean water, so that the authorities can lift restrictions on growing vegetables. Also, health risks to farm workers who currently are in direct contact with polluted water will be fully controlled.
Sources: Bartone 1994; Ferreccio 1995; Laval and Ferreccio 2007; Bitrán and Arellano 2005; Larrain 2009; Yayur 2009
76
Box 5.4: Israel’s experience with wastewater reclamation and use for irrigation as part of integrated water resources management
Since the early 1970s, Israel has carried out significant efforts to achieve massive use of wastewater for agricultural purposes, and is presently using almost 72% of all the sewage produced in the country for irrigation – amounting to half of all irrigation water (Mekorot, 2007). As a result, in 2000 agriculture used less than 40% of the freshwater resources, down from almost 70% in 1985. During drought years, freshwater supply to agriculture is severely cut off, while farmers connected to reclaimed wastewater systems continue to receive a full quota (Juanicó, 2008).
Wastewater irrigation emerged as an unavoidable response to severe water scarcity, a concentrated population with high levels of water consumption and sewage production, and the pollution of limited water resources. In 1959, parliament passed a Water Law which defined sewage as a “water resource.” However, wastewater irrigation was only practiced in isolated uncontrolled projects, and it was not until the 1970 cholera outbreak in Jerusalem that strict wastewater irrigation regulations were introduced, and the Ministry of Health was assigned regulatory responsibility.
An early stimulus for wastewater treatment and use was the World Bank Israel Sewerage Project, the first sewerage loan to be financed by the Bank. Approved in 1972, the Sewerage Project provided support to Israel’s National Sewerage Program designed to improve and modernize the country’s sewerage facilities, in order to protect and preserve water resources and to improve public health (Streit, 1986; Bartone, 1991). An ex post evaluation concluded that it was a successful project incorporating appropriate least-cost technology, and that the provision of sewage treatment and reuse facilities constituted a major environmental improvement and a significant supplementary source of water for irrigation. The project also pioneered the use of long-detention storage reservoirs for treatment. Other important features of this project were the provisions for cost-sharing and division of responsibility between municipalities wanting to dispose of wastewater and farmers wanting to use it.
Over the intervening decades, a regulatory structure evolved to protect public health and promote sustainable agriculture (Juanicó, 2008). In 1977, the Shelef Commission set different water quality standards for the irrigation of different crops, including unrestricted irrigation. The Public Health Law of 1981 restricted wastewater irrigation to a list of allowed crops, and all reuse projects required a permit; and the Public Health Law of 1995 imposed treatment requirements for all towns with population greater than 10,000 (BOD < 20 mg/l and SS < 30 mg/l). The Halprin Commission in 1999 set public health requirements for wastewater irrigation following the California school. Finally, the Inbar Commission recommendations of 2003, approved in April 2010, sets stricter environmental requirements for wastewater irrigation including nutrients, salts, metals and other pollutants.
While the initial effluent quality requirements were aimed at the protection of public health, the Inbar Commission requirements address the protection of the environment through sustainable reuse. A particular threat to sustainability linked to effluent irrigation is the salination of soils and aquifers, since salts are added during domestic and industrial use and are recycled together with the wastewater. Over the past two decades, there has been a steady decrease in salts and boron in sewage as a result of the prohibition of brine discharges to sewers, modifications to domestic and industrial detergents, water softening and neutralization systems, and disinfection processes (Juanicó, 2008). In some instances, the desalination of reclaimed wastewater is also practiced.
Today, the use of treated effluent is an integral part of the national water demand management strategy in Israel (Arlosoroff, 2006). Regulations are in place to maximize wastewater use potential, minimize

77
health and environmental risks, and enhance the potential to exchange reclaimed effluents for freshwater allocations. Since the 1990s irrigation allocation policy has concentrated on reducing freshwater use, replacing it with treated wastewater effluents. The cities pay for the sewerage treatment costs, while the water sector (i.e., Mekorot) pays for the extra treatment costs that may be needed for irrigation purposes and for the conveyance to irrigation sites. These additional costs were estimated at $0.21/m3. Farmers, however, only pay between $0.13/m3 and $0.19/m3 for reclaimed water based on water quality – the balance is covered by the government as a subsidy (Zhou et al, 2006).
Of some 470 Mm3 per year of urban and industrial wastewater generated in Israel, about 90% is treated and 72% is used in agriculture. About 110 Mm3 per year of non-used effluent is disposed to the environment (Mekorot, 2006). One of the main goals for the coming decade is the treatment and reuse of all the wastewater in Israel for agriculture, thereby eliminating all environmental discharges. The new policy calls for secondary and tertiary treatment, and the delivery of the reclaimed effluent to farmers in exchange for their existing freshwater allocations (Arlosoroff, 2006, Bucknall, 2007). In addition, regulations, which came into effect at the beginning of 2005, require wastewater treatment plants to stabilize and treat the sludge they generate to make it suitable for agricultural use and avoid soil deterioration. (Zhou et al, 2006).
Effluent irrigation is accomplished through a range of projects of different size and characteristics (Juanicó, 2008). At one extreme are the large-scale projects managed by Mekorot, Israel’s national water company. An example is the Dan Region project that utilizes activated sludge treatment followed by soil aquifer treatment (SAT) and storage; the reclaimed wastewater is then pumped from the storage aquifer and utilized for unrestricted irrigation. At the other extreme are small projects that produce effluents of lower quality only suitable for restricted irrigation, but which in total have a total effect comparable to that of the large projects. The national policy is to promote all sizes.
5.2 Promoting an integrated approach to planned wastewater use for irrigation
Previous sections have presented the risk assessment and management framework that allows for setting achievable public health targets for reducing risks associated with wastewater irrigation, and have discussed how to choose the needed combination of treatment and multi-barrier options to achieve the pathogen reduction targets. However, there are still a number of other common issues that require attention if planned wastewater irrigation is to be implemented successfully on a broader scale. These issues revolve around the need to embed wastewater use in the broader water resources management context. Before identifying these issues and examining them in detail, it is useful to consider how wastewater use for agriculture can be integrated in the broader context of water resources management.
5.2.1 Integrated water resources management and wastewater use for agriculture
Integrated water resources management (IWRM) has been the accepted international paradigm for efficient, equitable, and sustainable management of water resources since the early 1990s when the Dublin Conference on Water and the Environment and the Earth Summit at Rio de Janeiro set out the foundations of IWRM. The World Bank Group adopted IWRM as its policy in the 1993 Water Resources Management Policy Paper, and also emphasized that as water scarcity and wastewater disposal problems become more acute, it

78
will become increasingly important to adopt and improve water conservation practices, desalinization and wastewater use systems, and overall pollution-reduction approaches (World Bank, 1993).
There is no unambiguous definition of IWRM (GWP, 2000). Instead, it consists of a number of principles that have been agreed, and can be expanded, extended, and adopted to local circumstances (Hirji and Davis, 2008), namely:
Adopting a multisectoral approach to water management in association with river basin management;
Encouraging stakeholder participation and devolution of responsibility;
Promoting private sector involvement; and
Employing economic instruments.
How each of these principles applies in the case of wastewater use for agriculture is discussed below. An example of the application of these principles in the European Union is given in Box 5.4. The EU example illustrates a growing recognition of the importance of wastewater use in confronting problems of water scarcity, public safety, and environmental protection. It also shows that in spite of being an emerging priority in the water-scarce EU countries, wastewater use policies and practice – and its contribution to IWRM – are still underdeveloped (Brissaud, 2008).
79
Box 5.5 EU Water Framework Directive and wastewater use
The Water Framework Directive (WFD), adopted by the European Parliament in 2000. It contains many of the principles of IWRM, including managing water quantity and quality for surface and groundwater, treating water as having an economic value, and enhancing consultation and participation. Its key requirement is the production of river basin management plans by all EU countries.
With regard to the WFD and wastewater treatment and use, a number of activities have been and are being carried out. First of all, the 1991 Urban Wastewater Treatment Directive (UWWTD) establishes the principle “Treated wastewater shall be reused whenever appropriate.” In 2004, the third UWWTD implementation report concluded by stating that the challenges to implementing the WFD include: “… wastewater treatment, as well as wastewater reuse in order to ensure human health and protect the environment will receive further importance due to increased floods and droughts as a consequence of climate change.”
The European Commission (EC) launched the AQUAREC project Integrated Concepts for Reuse of Upgraded Wastewater to investigate strategies, technologies and management practices for local, safe, publicly acceptable, economically feasible and sustainable use of treated wastewater for urban, peri-urban and agricultural use. The project found a growing acceptance of wastewater use practices, with more than 200 municipal wastewater use projects in Europe. However, the project found that only a limited fraction of the wastewater use potential is actually exploited. The results of the AQUAREC project provide a comprehensive overview of wastewater use concepts together with valuable knowledge and guidance to a whole range of stakeholders on their practical implementation, based on European, Israeli and Australian full-scale experiences.
The AQUAREC project found that EU financial institutions play a key role in favoring wastewater use schemes through existing subsidy programs that cover a number of areas, including planning, technical assistance and research, construction costs, actions contributing to regional objectives that are not locally cost-effective, and pay-for-performance incentives. Subsidies do not cover operation and maintenance costs.
In 2007, the European Commission (EC) carried out an in-depth assessment of water scarcity and droughts in the European Union. Following this assessment, in 2008 the EC launched a study “Assessment of alternative water supply options” to assess four alternative water supply options in Europe, namely desalination, wastewater use, ground water recharge, and rainwater harvesting. The study found that alternative water supply options can be successfully used to solve water management problems, both related to droughts, storm water management and water quality issues. For some of the regions studied, alternative water supplies are becoming the largest contributors to meeting water demand.
According to the EU Water Scarcity and Drought working group, the overall economic impact of drought events in the last 30 years at the EU level was around €100 billion. If the EU had achieved a 20% wastewater use target to reduce water scarcity in Europe this could have reduced the economic impact of drought in the EU by €20 billion in the last 30 years.
Finally, the EC also provides grants for research on wastewater use for agriculture. One example includes the AQUATEC project for southern Italy that evaluated the effectiveness of membrane filtration, simplified treatments (skipping nutrient removal processes), storage reservoirs, and
80
constructed wetlands technologies to produce safe treated effluent for irrigation.
Sources: EU, 2000; EC, 2004; AQUAREC, 2006; Lopez et al, 2006; Bixio and Witgens, 2006; MED-EUWI, 2007; Campling et al, 2008.
5.2.2 Adopting an integrated multisectoral approach to wastewater management
Wastewater use for agriculture requires coordinated decision-making across multiple sectors as it involves consideration of urban sanitation and land use policies, public health and environmental impacts, agricultural productivity, economic feasibility, and sociocultural aspects – all linked through a broader water resources management framework. This multisectoral nature of wastewater use requires the proper identification of the many interested stakeholders and institutions that are typically involved (Khouri et al, 1994).
Safe wastewater disposal is a major concern of public and semipublic sewerage and disposal authorities: national, state, and municipal water and sanitation agencies; organizations charged with safeguarding public health and the environment, such as national ministries of health and of the environment; and state or local health authorities responsible for monitoring effluent contaminant levels.
Irrigation is the responsibility of still other organizations, such as authorities, cooperatives and communes operating under the jurisdiction of agriculture or water resources ministries. These organizations are interested in the use of water and its timely provision and quality.
Urban agriculture introduces further local considerations of land use policies that fall under the aegis of urban and/or agriculture ministries, as well as regional or local planning bodies.
Finally, there may be an organization such as a national or regional planning body or river basin authority concerned with water resource allocation and the enforcement of water laws specifying water use rights and/or water quality standards.
These varying sectoral interests and responsibilities must be considered and reconciled if a wastewater use is to succeed. As an ideal, wastewater use for irrigation and strategies for its implementation should be part of national water resources planning, and there should be a better integration of wastewater use issues into sectoral policies. At the local level, individual wastewater use projects should be part of the overall river basin planning effort – at the very least at the level of local urban watersheds. Multisectoral planning with due consideration of wastewater use for agricultural remains a major challenge, however, not only at national level but also in donor agencies – many of whom do not have clearly stated policies regarding wastewater reclamation and use or how to involve other sectors in such sanitation projects.
For the developing countries engaged in effluent irrigation for urban agriculture, the following cross-sectoral issues often arise, among others: wastewater use is undervalued due to the failure to quantify economic benefits accruing across sectors; water and land use policies are poorly coordinated across sectors; and wastewater treatment decision are too often made based on limited water quality criteria for disposal (such as removal of organic

81
matter and nutrients) rather than integrated agricultural, public health, and ecosystem criteria that view wastewater as an asset.
Economic costs and benefits of wastewater irrigation
The decision to promote wastewater use should depend on a full accounting of the economic costs and benefits of projects. Most economic assessments, however, rarely encompass all relevant aspects of reuse and rarely go beyond financial feasibility analysis (Kfouri et al, 2009).
Wastewater use projects are often undervalued when compared to other water projects because benefits such as watershed protection, local economic development, and improvement of public health are not properly quantified (Miller, 2006). Externalities are seldom included in the economic analysis for new wastewater irrigation projects. For example, the scarcity of water and the marginal cost of new sources (where existing sources are at or beyond their sustainable limit) are often ignored when considering the new wastewater treatment and use projects (Bixio et al, 2006).
Similarly, the financial, social, and pollution burdens of effluent disposal to the environment are rarely considered in the economic analysis. Nor are the public health consequences of unplanned irrigation with wastewater that often takes place out of necessity in developing countries. Also, urban agriculture may have important economic impacts on employment, nutrition and poverty alleviation. Faruqui (2000) has argued that if the real and significant benefits of environmental and public health protection were correctly factored into economic analyses, wastewater collection, treatment and use should be among the top priorities for scarce public and development funds. However, the reality is that proponents usually only present vague economic estimates on the benefits and costs of wastewater use for urban and peri-urban agriculture, leaving donors and policy-makers unaware of the significance of effluent irrigation to the economy (Faruqui et al, 2004).
A few examples can be found to partially illustrate the economic importance of wastewater irrigation. For instance, in Pakistan, 26% of the vegetables produced nationally are grown using urban wastewater (Ensink et al, 2004a). The value of wastewater in Pakistan is reflected in the land rents. In Haroonabad, land rents were on average 3.5 times higher for wastewater fields than for canal-water fields (Hussain et al, 2001). In Quetta, land rents were double and in some cases up to six times higher for land with access to wastewater compared to land without access, and farmers paid 2.5 times more for the right to use wastewater than for regular irrigation water (Ensink et al, 2004b). Higher land rents for wastewater farms on average result in higher income for the landowners but relatively less net profit for lessees. A proper economic analysis would have included all benefits and costs accruing to all stakeholders, including, for example, the opportunity costs of family labour, and environmental, health, and social impacts (Hussain et al, 2001).
In another example from the public health sector, an economic analysis of cholera and typhoid prevention in Chile (Box 5.3) showed that the observed health benefits significantly offset the cost of providing wastewater treatment (Bartone, 1994).
82
An environmental valuation example from China (Xie et al, 2009) found that the indirect irrigation of 4.05 million ha of agricultural land with polluted water lead to reduced harvests, poor quality crops, and degraded soils. The economic loss attributed to these impacts was estimated at 61.3 billion yaun, equivalent to about 0.46 percent of GDP in 2003.
Many studies have pointed out the potential economic value of the nutrients contained in wastewater. The economic value of nitrogen contributions by reclaimed water in the City of Castell Platja d’Aro in Spain has been evaluated as €350 per hectare per year (MED-UEWI, 2007). Clearly, the nutrients in wastewater are beneficial and may reduce the amount of commercial fertilizers used by farmers. Whether the benefits justify the cost depends not only on agricultural productivity, but also on the costs that would be incurred for wastewater disposal without irrigation. These normally beneficial nutrients could, however, reach levels that are toxic to plants, cause lodging (excess leaf growth) in plants, or pollute underlying groundwater resources if applied excessively. Again, a proper economic analysis should account for all of the positive and negative factors.
Without focusing specifically on wastewater irrigation, a review was conducted on the economic dimensions of urban agriculture and its contribution to urban poverty reduction strategies (ODI, 2009), and found that urban agriculture contributes significantly to sustainable livelihood and development, mainly through income-generation from sale of produce and employment. The same study, however, points out that the economic dimension of urban agriculture has rarely been rigorously or comprehensively assessed, making it difficult to estimate how and the extent to which urban agriculture contributes to reducing urban poverty, and an international research agenda is proposed to address this shortcoming.
Water and land use policies and planning
Access to wastewater and land is a prerequisite for wastewater irrigation projects, yet in many cases of existing wastewater use neither resource is guaranteed.
Many poor farmers use wastewater without formal water rights, and if wastewater is withheld they will lose their livelihoods. In some cases, as in Mexico, customary water rights may be recognized and these rights can conflict with future planned wastewater use projects. For example, the city of Guanajuato began operating a wastewater treatment plant in 2002 – providing an option of selling treated effluent for industrial use (Silva-Ochoa and Scott, 2004). Only about 30% of traditional wastewater farmers have a water concession title (linked to the land) issued by federal authorities. The rest of the farmers are faced with uncertainty about their future share of irrigation water, although no commercial transaction with industrial users had as yet taken place at the time of reporting. In another example in Pakistan, local water and sanitation utilities brought suit against local farmers, challenging their rights to use wastewater (Ensink et al, 2004a). The outcome was that farmers were forced to either pay for wastewater or abandon its use. However, in Faisalabad, farmers successfully appealed the outcome once they proved that they did not have access to another suitable water source.
Legislation may be required to define the rights of wastewater users to access, and the powers of those responsible for allocating those rights. To ensure safe effluent irrigation, access to
83
wastewater can be made contingent on farmer compliance with health guidelines. In Mexico, for example, authorities have the power to withhold wastewater from farmers who do not comply with crop restrictions, and this has been a major factor in the success of the restrictions (Bahri, 2009).
Access to land and secure land rights are important for preserving the livelihoods of urban farmers. Maldonado (2009) and Arce et al (2009) describe the land tenure situation of farmers in the peri-urban community of Carapongo on the outskirts of Lima, Peru (Box 5.5), and illustrates the precariousness of their situation – typical of many such communities in developing countries. Land rights are also important for commercial farming, which involves substantial investments in fertilizer, pesticides and water. Without secure tenure, farmers have difficulty accessing needed credit.
Box 5.6 Land issues and urban agriculture in the peri-urban community of Carapongo
Carapongo is a community of 3,200 inhabitants in the periphery of Lima, Peru where urban agriculture is commonplace. It covers some 464 ha, of which 46 per cent is cultivated land mainly under vegetable production, with indirect irrigation using polluted water from the Rimac River. About 60% of the population is involved in agriculture.
A recent study found that 37 percent of the producers in Carapongo occupy land that they own, although less than half held legal title. About 19 percent occupy rented land. Seven percent of farmers access land through informal squatting (posecionarios) on land located on the bank of the Rimac River. Seventeen percent of producers occupy land with a combination of ownership and rental. The rest have some other form of occupancy such as guardianship or share-cropping.
Even though farmers who were interviewed during the study generally declared that urban agriculture is not profitable, the majority obtain some income from the sale of crops or animals which makes it possible for them to make a subsistence living. Those farmers who have secure access to the land (either owned or rented) generally have more opportunities to earn a higher income and attain a better quality of life.
In recent years some 30 per cent of the agricultural land in Carapongo has been lost to urban sprawl. Agricultural lands are being converted into small residential plots, while in other places individual farm plots are being used wholly or partially for extraction of earth for brick-making or as construction material. The local government does not recognize urban agriculture as an important activity within the city development plan, and has designated the land use as urban residential, a classification which naturally conflicts with the perspective of the farmers.
To maintain the livelihoods of urban farmers, the study recommends the redesign of municipal land-use policies, encouraging co-operation between the Housing and Agricultural Associations, individual landowners and cultivators of the plots, and participation of all stakeholders in urban land-use planning, in order to increase security of land tenure for producers.
Source: Arce et al 2009; Maldonado 2009
84
Any agricultural activity that uses treated wastewater should have sufficient land area to take full advantage of the available effluent (Egocheaga and Moscoso, 2004). Moreover, future increases in wastewater flows should be considered so at to ensure both treatment capacity and land resources will remain sufficient. When planning for wastewater use, wastewater treatment plants should be located near to existing or potential irrigation sites where effluent irrigation can be carried out on an economically appropriate scale. Conversely, land areas suitable for effluent irrigation should be identified and/or preserved in the vicinity of existing or planned treatment plants. The model provided by the Mendoza ACRE project (Box 5.6) and Melbourne’s Werribee Farms (Box 2.1) both illustrate how this can be done in a practical and productive way for a centralized treatment plant.
Even within urban areas it may be possible to find sufficient land areas that can be irrigated with effluent from decentralized wastewater treatment plants. An example is the Agricultural Zone of San Augustín (ZASA) in the periphery of Lima, Peru where a waste stabilization pond system was planned to service the farmers with safe irrigation water (see earlier Box 2.8).
Box 5.7, Mendoza, Argentina—creating a special area for direct wastewater irrigation
The greater Mendoza metropolitan area has one million inhabitants, with 75% of the population connected to sewers in 1997, and coverage projected to increase to 95 percent by 2010. Mendoza is located in an arid region in the foothills of the Andes in the western part of Argentina. The city's wastewaters have traditionally been used indirectly for irrigation. The Campo Espejo treatment plant was built in 1976 and upgraded in 1993 (see Box 5.7) and provides 1.7 m3/s of effluent for direct irrigation.
The treated effluent from the Campo Espejo treatment plant is conveyed to a special 1,900 ha restricted irrigation area, Area de Cultivos Restringidos Especiales (ACRE). Farmers with properties within the special area receive treated effluent free of charge and are obliged to follow the irrigation regulations established for ACRE. About one quarter of the irrigated area is devoted to the production of grapes, another quarter to the cultivation of tomatoes and squash, and the remaining area to the cultivation of alfalfa, artichokes, garlic, peaches, pears, and poplar biomass. The quality of the agricultural produce and the health of the agricultural workers are monitored by a special office of the Departamento General de Irrigación. An agreement of cooperation was recently signed between OSM and the ACRE farmers to study concerns of mutual interest, including the possibility of building effluent storage reservoirs that would optimize wastewater use during the dry season without requiring changes in the treatment plant operations, as well as the possibility of charging farmers part of the cost of treatment.
Sources: Idelovitch and Ringskog (1997); Kotlis (1998); Barbeito (2001); Egocheaga and Moscoso (2004)
A new paradigm for wastewater treatment decision-making
Technical standards for the design of municipal wastewater treatment systems often derive from environmental legislation that calls for the removal of organic matter and nutrients, and
85
is focused primarily on pollution control and protecting the receiving water body (river, lake, wetland, groundwater, coastal zone). The resulting plants are built and operated for the downstream control of physical (temperature, pH, total solids, suspended solids), chemical (metals, oils, polymers, anions, and cations), and biological (biochemical oxygen demand (BOD5) and in-stream dissolved oxygen) parameters (Egocheaga and Moscoso, 2004). In developing countries, these sanitation solutions are often viewed as costly means of preparing wastewater for unproductive disposal, and as a result resource-constrained governments seldom rank wastewater treatment high on their agendas (Murray and Buckley, 2010).
There is a need to shift the paradigm so as to see wastewater as an asset, and to manage water, wastewater, pollution control, and effluent irrigation in an integrated way while ensuring public health protection (Bahri, 2009). In this paradigm shift, treatment facilities are not designed for waste disposal but to conserve resources in wastewater and reduce pathogen risks (Murray and Buckley, 2010). Such solutions are cheaper than conventional WWTPS designed purely for disposal.
To minimize wastewater treatment costs, to safeguard public health, and to obtain the maximum possible agricultural benefit from nutrients and organic matter contained in wastewater, treatment plant design for irrigation use should focus primarily on reducing priority pathogens – particularly helminth eggs that threaten farmers’ health – while preserving nutrients. Conventional secondary treatment systems are generally ineffective in removing helminth eggs and the bacteria or viruses of concern in developing countries, and are beyond the financial and operational capacity of most low-income countries (Bahri, 2009). In these countries, the focus should be on designing and building simple, low-cost treatment systems that guarantee significant removal of helminth eggs, which in combination with the application of multiple barriers can help achieve an acceptable level of risk reduction (as defined by the application of the risk assessment and management framework). As countries develop and progress up the treatment ladder (Table 5.1), and improve capacity for monitoring and enforcement of water and food safety standards, barriers addressing post-harvest contamination are still recommended (Keraita et al, 2010).
This paradigm shift will require the development of new technical standards for wastewater treatment, including the proper management of health risks through the removal of microbial pathogens. For example, most Latin American countries have no technical standards for the determination and removal of helminth eggs (Egocheaga and Moscoso, 2004). Also, technical standards for the use of wastewater in agriculture are needed that take into account the characteristics of wastewater. Such standards should consider, for example, public health criteria (to protect farmers), suspended particulates (to prevent clogging of irrigation systems), nutrients (to rationalize the application of agrochemicals), and pathogens (for irrigation management).
Wastewater stabilization pond systems have long been recognized as an appropriate treatment technology for effluent irrigation and aquaculture schemes (Arthur, 1983; Bartone and Arlosoroff, 1987; Mara and Cairncross, 1989), especially for small and medium-size cities and for decentralized treatment around larger cities if land is available. Pond systems require less investment and have lower operation costs than many other conventional treatment
86
systems (Arthur, 1983). More importantly, effluents from well-designed and operated pond systems achieve high levels of pathogen removal – typically 99.99% removal of fecal coliforms and complete removal of helminth eggs (Bartone and Arlosoroff, 1987; Mara and Cairncross, 1989). Waste stabilization ponds also transform organic wastes into algal biomass that, when applied to land, acts as a slow-release fertilizer.
While wastewater stabilization ponds are an attractive option from an economic, environmental, and effluent irrigation perspective, for centralized systems that treat the sewage flows from large cities the land requirements can be prohibitive unless inexpensive land can be found (Arthur, 1983). In such circumstances, conventional treatment systems may be needed. This is the case in China, where activated sludge systems are becoming the norm for medium- to large-scale centralized treatment plants (Murray and Buckley, 2010). The same authors point out, however, that for conventional systems treating wastewater for irrigation, designs are modified to minimize nutrient removal, thus lowering the cost when compared to plants designed for disposal. Furthermore, adding anaerobic sludge digestion and capturing biogas for on-site use can lead to long-term cost savings and reductions in carbon emissions. For more information of emerging wastewater treatment and irrigation use in China refer to Box 5.8.
Biogas can also be recovered from low-cost anaerobic processes like covered anaerobic ponds, UASBs, and anaerobic filters, and the recovered gas used to produce energy for on-site use or for sale, thus contributing to financial viability (M. Libhaber, personal communication). This is a further example of the new paradigm for managing wastewater as an asset.

87
Box 5.8 Emergence of wastewater treatment for irrigation use in China
In 2003, about 4.05 million ha of agricultural land was irrigated with polluted water in China, almost triple the area found in 1982. About two-thirds of this land is in northern China, which is already a water-scarce region. The impacts of this indirect wastewater irrigation are significant, leading to reduced harvests, poor quality crops, and degraded soils. The economic loss attributed to these impacts has been estimated at 61.3 billion yaun (US$7.4 billion*), equivalent to about 0.46 percent of GDP in 2003.
The government has acknowledged the seriousness of water pollution and since the mid-1990s and embarked on a major program to install wastewater treatment in cities. Progress, however, has been uneven and large differences exist in installed sewage treatment capacity by province and city. Of some 660 cities in China, wastewater treatment rates in mid- and small-sized cities are badly lagging (by half or more) behind those of cities with populations exceeding 1 million. It is reported officially that 56 percent of municipal sewage is treated in some form, although the treatment rate may reflect the installed wastewater treatment capacity rather than actual treatment, which is likely lower due to the lack of sewerage networks and funds for operation and maintenance in many cities.
Centralized Sewage Treatment Rates in China by City Size in 2003 (%)
Source: China Urban Development Statistics Yearbook, 2004. Note: Super city = more than 2 million population; mega city = 1 to 2 million population; big city = 0.5 to 1 million population; mid-sized city = 0.2 to 0.5 million population; small city = less than 0.2 million population.
Activated sludge systems are becoming the norm for medium- to large-scale centralized treatment plants. However, for conventional systems treating wastewater for irrigation, designs are modified to minimize nutrient removal, thus lowering the cost when compared to plants designed for disposal. Furthermore, adding anaerobic sludge digestion and capturing biogas for on-site use can lead to long-term cost savings and reductions in carbon emissions.
Attention is shifting to the rising water pollution from 19,000 small towns and rural areas that have been developing rapidly in recent years, but most of which have no wastewater treatment plant. Untreated water pollution from these small towns has particularly severe impacts because it more directly affects ecological systems and agricultural production. Sewage treatment in small towns can be promoted through the introduction of cost recovery policies, selection of low-cost appropriate technologies, and the promotion of treated wastewater use for agriculture.
Sources: Xie et al, 2009; Murray and Buckley, 2010. *Exchange rate in 2003: 8.2770 yuan per US$
88
5.2.3 Promoting stakeholder participation and social acceptance
Given the multi-sectoral nature of wastewater irrigation projects, the varying interests and responsibilities of stakeholders must be considered and reconciled if a project is to succeed. Khouri et al. (1994) suggest that practical steps to encourage and ensure stakeholder involvement would include the following:
Identify all agencies and user organizations that would have an interest in the project, and list their responsibilities.
Identify, after appropriate consultation, the lead agency for project planning and implementation.
Develop and install consultative mechanisms giving all interested parties an opportunity to participate in the planning process and define their roles/responsibilities in project implementation.
Ensure opportunities for irrigation water users to participate in project development so they are aware of the benefits and requirements of wastewater irrigation.
Evaluate the organization and management of implementing agencies and propose changes as necessary.
Identify and develop monitoring programs and legal measures for their implementation to ensure adherence to public health regulations.
Numerous benefits of stakeholder participation in integrated water management projects such as wastewater irrigation include improving public acceptance of decision, improving the quality of alternatives because to the wider range of expertise available, reduce the risk that opposition from disaffected groups will delay implementation of decisions, and increasing the likelihood of compliance with agreements reached during negotiations (Hirji and Davis, 2008).
Three key issues need attention when considering stakeholder participation: first, roles and responsibilities need to be clearly set; second, in order to promote wastewater use in agriculture it is essential to build trust, credibility and confidence among public officials and the general population; and third, when implementing multiple-barrier approaches, farmers and consumers must become active participants.
Clarifying stakeholder roles and responsibilities
An important lesson from the long and successful Israeli experience with wastewater irrigation is that there should be a clear separation of responsibilities between the urban and the rural sector regarding the treatment and application of wastewater (Juanicó, 2008). The evolution of the wastewater treatment and storage reservoirs is a case in point. During the eighties and early nineties the roles and responsibilities were not clearly defined and the regulators found enforcement difficult because the municipalities and farmers accused each other of being at fault for pollution. Open wastewater reservoirs can be excellent treatment units if operated correctly. However, if the reservoirs belong to farmers, they operate the reservoirs to meet irrigation needs and not treatment needs. The reservoirs should be under the control of whoever is responsible for sewage treatment and operated as treatment units (Juanicó, 2008). This situation was resolved in 1995 when the public health regulations assigned municipalities (as the producer of polluting wastewater) the whole responsibility of

89
treatment and disposal, and this responsibility cannot be transferred to the rural sector or other parties. Now, where farmers run wastewater treatment, storage and use facilities, it acts as a subcontractor of the municipality (as any other private operator) while final responsibility before the regulatory agency remains with the municipality. At the national level, the costs of any additional treatment that may be needed for agricultural applications, storage, and conveyance to irrigation sites is borne by the state water agency, Mekorot, and part of the cost is recovered from farmers (Arlosoroff, 2006). While there are many different wastewater irrigation schemes in Israel, and all seem to work properly when responsibilities are clearly set (Juanicó, 2008).
Involving farmers and consumers in health protection measures
Without the general acceptance and involvement of the stakeholders – including regulatory authorities, water and sanitation companies, farmers, and consumers alike – wastewater treatment and irrigation projects are unlikely to succeed. The active participation of farmers and consumers is of particular importance. Farmers need to be educated on safe irrigation and post-harvest practices. Consumers need to be informed about the safe handling and preparation of food crops irrigated with wastewater.
In countries lower on the treatment ladder where a multi-barrier approach is essential, simple incentives to farmers and produce-sellers could accelerate risk reduction significantly, such as training in safer production and food handling practices (Keraita et al, 2010). Also, recent work in Bangladesh shows the importance of multi-stakeholder processes in planning and implementing multi-barrier approaches (Robinson et al, 2010). A learning alliance approach was adopted whereby local stakeholders were brought together to analyze the issues, and implement a participatory action plan to deal effectively with the raw wastewater irrigation problem. The process resulted in negotiation between parties that rarely communicated previously and led to demand-driven actions including engineering solutions, policy review and community awareness programs.
A higher willingness to pay for safer produce could be one of the best incentives for behavior change where regulations alone are not sufficient to support the adoption of safer food production and marketing (Keraita et al, 2010). This was demonstrated during the cholera emergency in Chile (Box 5.3), where farmers moved to safer irrigation water supplies and consumers paid more for vegetables certified to irrigated with safe water (Bartone, 1994). Yet in low-income countries risk awareness is often not high enough to result in a higher willingness to pay. In such situations, social marketing strategies may be a way to increase consumers’ risk awareness (Karg et al., 2010).
Building trust, credibility and confidence
The perception of some public officials and of the population is that treated wastewater still remains basically sewage. Nor is it widely known that in urbanized catchments the water cycle actually includes indirect, unplanned and uncontrolled use of – sometimes untreated – wastewater. This can be a major impediment to advancing effluent irrigation projects, and there are few more pressing and critical goals than to produce a change in the underlying stakeholders’ perception of the water cycle (Bixio et al, 2006).
90
An example of the need for strong farmer and public support comes from Tunisia where, despite strong institutional support, including the 2002 consolidation of the Ministry of Agriculture, Environment, and Water Resources to oversee integrated water management and water reuse, only 18 percent of reclaimed water is currently used. A major constraint has been social acceptance (Scott, 2005). The distrust of farmers is evidenced by their reluctance to irrigate with treated wastewater although it is priced below conventional irrigation water sources, and well below the cost of treatment (Kfouri et al, 2009).
The professional water community should strive to convey the value and safety of planned wastewater through whatever means available including education of the public and elected officials. Sustained, long-term public awareness campaigns aimed at target groups such as farmers and consumers are needed to foster acceptance of wastewater use (Miller, 2006). Public outreach and education programs, including school curricula, are essential for general public support of wastewater use programs.
Transparency, information sharing and involvement of users and local communities in the decision making process will also ensure greater acceptance of projects (Bahri, 2009). Involvement of local NGOs and environmental groups can help build up credibility, trust and confidence. As a basis for building trust between stakeholders, there is a need to convey simple, clear and reliable information. The establishment of a best management practice framework, as described earlier in this report, and transparency in the management and decision process is very much needed (Bixio et al, 2006). Water quality data must be widely available and freely shared with users and the general public. Communities need to be able to express their needs and suggestions in open multi-stakeholder platforms.
Cultural values may also play an important part in the acceptability of wastewater use, particularly where religious views on ritual purity are highly articulated, for example in Islam and Hinduism (World Bank, 2005). In order to address concerns in Islamic countries, Fatwas (i.e., legal statements issued by religious scholars) have been issued in Saudi Arabia and the United Arab Emirates stating that wastewater may be used for irrigation provided that the impurities present in raw wastewater are removed. This has succeeded in overcoming the religious concerns of authorities, farmers and the public (Bahri, 2008a).
5.2.4 Involving the private sector in financing and managing wastewater treatment
Given the very low initial levels of wastewater treatment in developing countries, and the vital importance of reducing health risks in wastewater irrigation projects, an approach is needed that simultaneously makes the best use of available investment resources to upgrade existing treatment plants and to build new facilities, and generates sufficient additional financial flows to ensure the sustainable operation of treatment facilities and provide for future expansions.
Wastewater treatment is capital intensive. Until recently, major treatment works in developing countries were financed by governments or public utilities, often with the help of loans from international or bilateral agencies accompanied by central government guarantees against commercial and political risk. Given the general lack of experience in wastewater treatment plant design and operation, major projects were typically contacted out piecemeal – preliminary

91
studies and design with a specialized engineering firm, construction with a private contractor, equipment with one or more suppliers, and supervision with an engineering firm. As a result of government guarantees against commercial risk and public project management, many of the treatment plants built in developing countries were plagued by cost overruns, implementation delays, and operations and maintenance difficulties. In such cases WWTPs were on the road to failure as soon as they were commissioned (Murray and Drechsel, 2010).
In order to overcome these difficulties, some middle- and high-income countries have turned to the private sector to help operate and even finance treatment investments in large cities. Two models have been successful for wastewater treatment in general and wastewater irrigation in particular. The first model is the Design-Build-Operate (DBO) contract in which a firm or consortium of firms is responsible for building and subsequently operating the plant for a specified period of time. Payment is usually on a price per m3 basis, and is tied to the successful operation of the plant and meeting effluent quality standards. In this case, the government or public utility owns the plant and still undertakes to finance the investment, but the commercial risk for operation is assigned to the private partner.
An improvement is to allocate the commercial risk for both investment and operation to a private consortium through a Build-Own-Operate-Transfer (BOOT) agreement. This model requires that the private partner builds, owns and operates the treatment plant for a defined period of time – usually 20 to 30 years – and transfers ownership to the public partner at the end of that time frame free of charge and in good operating condition. A variant of this model is the Build-Own-Operate (BOO) agreement in which private ownership is retained indefinitely. The private partner normally recovers its investment and operating costs through a price per m3 payment over the life of the agreement.
The main objectives for introducing BOOT contracts in wastewater treatment are to make the operation and management of the plant more efficient, to attract new ideas and technologies, which could lower costs, and to finance the investment without public guarantees in any form. A detailed description of the BOOT model is given by Idelovitch and Ringskog (1997), along with ways of sharing risks between the public and private partners. In general, risks should be shared between the private and public sectors following the principle that whoever can control or manage the risk best should assume it and receive adequate compensation for doing so. The private sector is better able to assume the commercial risk, and also the technical risk deriving from design shortcomings.
Many examples now exist of DBO and BOOT/BOO agreements for wastewater treatment and use for irrigation. Table 5.2 provides information on seven such examples, including investment costs, form of private sector participation, and sources of financing. Specific details of how the wastewater treatment DBO and BOOT schemes were structured in Mendoza (Argentina), Santiago (Chile), Monterrey (Mexico), Amman and Zarqua (Jordan), and Tehran (Iran) are described in Box 5.9, along with descriptions of how treated wastewater is utilized for irrigation in Monterrey and Tehran. This experience with private sector participation cuts across lower-middle-income countries (Iran and Jordan), upper-middle-income countries (Argentina, Chile, and Mexico), and high-income countries (Kuwait and Qatar). While most of the plants

92
described include conventional technologies such as activated sludge, and tertiary treatment options, waste stabilization ponds have also been utilized (Mendoza).
These examples show that it is possible through private sector participation to introduce wastewater treatment in countries with little prior experience (such as Argentina, Iran, and Jordan), to mobilize private sector investment, and to design and operate the treatment plants so as to meet water quality standards for wastewater irrigation.
The importance of the private sector participation in wastewater treatment has also been confirmed in a low-income country. A recent survey of about 70 mostly decentralized wastewater treatment plants in Ghana highlighted the relative success of plants built and operated by the private sector, while plants operated by or handed over to the public sector failed (Murray and Drechsel, 2010).

93
Table 5.2 Private sector participation in wastewater treatment for irrigation use and sources of financing
Wastewater treatment plant (capacity)
Cost (US$ millions)
Form of private sector involvement Sources of financing
Mendoza, Argentina 1996 -Campo Espejo (1.7 m3/s)
15
20 yr concession (BOOT); Union Transitoria de Empresas
Private investment
Santiago, Chile 2009 -El Trebal (4.4 m3/s) -La Farfana (8.8 m3/s) -Mapocho (1.8 m3/s) in 2012
115 240 140
30 yr concession (BOO); AguasAndinas ; 50% AGBAR (Spain), 50% Suez (France)
Private bond market (AA+)
Monterrey, Mexico 1995 -Noroeste (0.5 m3/s) -Norte (2.5 m3/s) -Dulces Nombres (5.0 m3/s)
325 (Total
Investment)
Design, build, 3 yr operation (DBO); Separate consortia for each plant
OECF Loan ($110 M) Federal grant ($110 M) Self-financing ($115 M)
Qatar 2010 -Doha West (1.6 m3/s)
260
10 yr DBO; Joint venture of Degrémont (France) and Marubeni Corp. (Japan)
Public Works Authority (Ashgal) of Qatar
Kuwait 2005 -Sulaibiya I (4.3 m3/s) -Sulaubiya II (2.6 m3/s planned)
430
N/A
30 yr concession (BOOT); UDC joint venture: 75% Kharafi Group (Kuwait), 25% Ionics (USA)
Private investment (loans from National Bank of Kuwait, Gulf Bank, and The Bank of Kuwait)
Jordan 2008 -As Samra (3.1 m3/s)
169
25 yr BOOT As Samra Consortium: Suez Environnement (France), Infilco Degremont (USA) ,and Morganti Group (USA)
USAID ($78 M) Bank consortium lead by Arab Bank ($60 M) Gov’t grant ($14 M) As Samra Consortium ($17 M) MIGA guarantee ($4.1 M)
Tehran, Iran 2009 - Southern WWPT (5.2 m3/s)
121
Design, build, 2 yr operation (DBO); Joint venture of iLF (Austria), KEO (Kuwait), Parsconsult (Iran)
World Bank Loan ($54.4 M) Self-financing ($36.6 M) Government Grant ($30 M)
Sources: Mendoza (Idelovitch and Ringskog, 1997); Santiago (Larrain, 2009); Monterrey (Bartone, 2000); Qatar (http://www.degremont.com/en/nos-realisations/municipal-wastewater-and-reuse/doha-west--qatar/doha-west--qatar/); Kuwait (http://www.water-technology.net/projects/sulaibiya/); Jordan (http://www.miga.org/projects/index_sv.cfm?pid=656&pv=$); Tehran (World Bank, 2009; http://www.ilf.com/index.php?id=111&type=98&L=1&L=1)
94
Box 5.9 Private sector financing of wastewater treatment plants for irrigation use in Argentina, Chile, Mexico, Jordan and Iran
Mendoza, Argentina – planned direct wastewater irrigation: The Campo Espejo primary treatment plant was built in 1976 to treat an average flow of 1.7 m3/s. It was operated by the public water company, Obras Sanitarias de Mendoza (OSM), and the effluent was discharged to irrigation canals and used for indirect irrigation. To upgrade the quality of the effluent, in 1993 OSM awarded a 20-year BOOT contract to build and operate a waste stabilization pond system required to meet the 1989 WHO guidelines for unrestricted irrigation The winning consortium, Unión Transitoria de Empresas (UTE), inaugurated the new Campo Espejo plant in 1996, consisting of 12 series of three ponds each (facultative + aerobic + polishing). The waste stabilization pond system occupies 320 ha and it is one of the largest such lagoon systems in Latin America.
The bidding process was straightforward. The bidding documents specified criteria for the quality of effluent, such as a meeting the 1989 WHO microbial guidelines (<1,000 FC/100ml and <1 helminth egg/liter), plus removal of at least 30% of BOD and 70% of suspended solids. The bidding documents also defined a certain level of fines for failure to produce an effluent of the standard specified. OSM guaranteed a minimum wastewater flow of 3 Mm3/month. The selection criterion used was the wastewater treatment charge per m3 proposed by the BOOT bidders. Five contractors submitted bids with proposed treatment charges varying from a 5¢/m3 (UTE’s winning bid) to 11¢/m3 plus value added tax. Based on the winning bid price and the average treated effluent flow, UTE’s initial investment of $15 million had an expected payback period of 7 years. (See also Box 5.6.)
Sources: Idelovitch and Ringskog (1997); Kotlis (1998); Barbeito (2001)
Santiago, Chile – planned indirect wastewater irrigation: In 1999, following a decade of water sector reform, a 30-year concession was awarded to the private consortium AguasAndinas to provide water and sewage services to the Santiago metropolitan area. The new company immediately began implementing a Sanitation Plan for wastewater treatment plant construction, inaugurating the El Trebal plant (4.4 m3/s) in 2001 and the La Farfana plant (8.8 m3/s) in 2003. Currently 82% of the Santiago’s wastewater is treated, and with the scheduled startup of the Mapocho plant (1.8 m3/s) in 2012 the treatment level will reach 100%.
Upon completion of the Sanitation Plan in 2012, AguasAndinas will have invested a projected total of 654 Euro (US$896) in wastewater treatment – an achievement far beyond the resources of the GoC. This addition of wastewater treatment as a new service has led to a significant increase in the water tariff to recover this investment, but corresponds to applying the “polluter pays” principle to households and businesses that discharge wastewater. To protect poor households and ensure their access to water and sanitation services, the GoC provides a means-tested subsidy. The magnitude of these investments and the corresponding tariffs increases would be unlikely to survive politically if not accompanied by vigorous and sustained economic growth, which has helped make it possible for households to pay their share of the cost. (See also box 5.3.)
Sources: Larrain (2009); Yayur (2009)
Monterrey, Mexico – planned indirect wastewater irrigation: Monterrey, a city of 3.5 million people with over 10,500 industries, is located in a region of severe water scarcity. To secure needed additional water supply in the early 1990s, Monterrey petitioned the Federal Government for the right

95
to construct a reservoir and divert flow from the San Juan River to reach a total of 10 m3/s. The water rights belonged to farmers in the downstream State of Tamaulipas. In return, Monterrey committed to treating all of its municipal and industrial wastewater (8 m3/s) before discharging it back to the San Juan River for protection of irrigation use in Tamaulipas.
To meet this commitment, three wastewater treatment plants were inaugurated in 1995 – Dulces Nombres (5.0 m3/s), Norte (2.5 m3/s), and Noroeste (0.5 m3/s). All three WWTPs have sludge conditioning and dewatering, and a permit was being sought for land application in agriculture.
Each WWTP was built under a DBO arrangement with a three year operating requirement, by a separate consortia made up of design firm, a supplier firm, and a construction firm. The total cost of the project was $325 million. Financing came from an OECF loan ($110 million), a Federal grant ($110.), and self-financing by the Monterrey water and sewerage utility ($115 million). In 2000, the average cost of treatment was 13¢/ m3 including debt repayment.
Cost recovery for sewerage and treatment is achieved through a 25% surcharge on metered domestic and industrial water consumption. Industry pays an additional ‘decontamination charge’ when effluent BOD5 exceeds 450 mg/l, at a rate of 13¢/kg of BOD5. With these tariffs, the Monterrey Water and Sewerage Service (SADM) covers costs and generates reserve funds for future expansions. By the year 2000, through a combination of 50% self-financing and 50% federal subsidy, and with the experience gained by managing the DBO contracts and taking over the operations of the three existing WWTPs after three years, SADM was able to build a 250 lps WWTP and was preparing to double the capacity of the Norte WWTP.
As a result of this project, in 1995 Monterrey became the first major city in Latin America to achieve universal sewerage and wastewater treatment, and safeguarded the downstream utilization of its wastewater for irrigation.
Source: Bartone (2000)
Jordan – planned indirect wastewater irrigation: The original As Samra plant was built in 1985 and consisted of 32 ponds occupying 200 ha. It was designed to treat 0.8 m3/s of wastewater, but almost from the beginning of operations it was severely overloaded, eventually handling almost 2.2 m3/s, leading to concerns about the quality of treated effluents and raising concerns about the safety of wastewater use. In response, the As Samra plant was replaced in 2008 by a new conventional treatment plant with capacity to treat 3 m3/s of wastewater from Amman and Zarqa (with a combined population of approximately 2.3 million people) with eventual expansion in 2015 to 6 m3/s. This has been accomplished under a 25-year Build-Own-Operate-Transfer (BOOT) agreement signed in 2000 with a private consortium, and a total investment of $169 million. (See Box 2.9 for a broader description of the Jordan wastewater irrigation project.)
Sources: http://www.miga.org/projects/index_sv.cfm?pid=656
Greater Tehran Southern WWTP – planned indirect wastewater irrigation: The Southern Wastewater Treatment Plant, inaugurated in 2009, reclaims 5.2 m3/s of Tehran’s wastewater for use in irrigation. It is an activated sludge plant with tertiary nitrification, chlorine disinfection, sludge digestion, energy recovery and utilization, and sufficient area to store sludge for one year. The plant was financed by the World Bank and tendered by the Tehran Sewerage Company as a DBO project with a two-year operating requirement, and built at a cost of US$121million. The plant – designed to meet the 1989 WHO guidelines – produces an effluent suitable for unrestricted irrigation and digested

96
sludge suitable for land application.
The effluent is discharged to a nearby irrigation channel where it is mixed with other water sources, and goes to irrigate an additional 15,000 ha in the Varamin Plains irrigation scheme bringing the total to 50,000 ha and increasing the size of the irrigation project by 43%, making it one of the largest in the world. Digested sludge, after one year of storage, is applied to agricultural parcels at a rate of once every four years. Crops grown include wheat, cotton, cantaloupes, sunflowers and alfalfa. During the non-irrigation season the effluent is used for groundwater recharge.
Source: World Bank (2000; 2009)
5.2.4 Using economic instruments
Since the international acceptance of the 1992 Dublin Principles, water has been viewed as an economic good (Principle 4). The commonly accepted application of this principle for financing wastewater collection, treatment and disposal is that the “polluter pays.” This is analogous to the “user pays principle” for water abstraction, and assumes that wastewater fees should be used to recover the full costs or full values of wastewater treatment and disposal.33 This means that, in principle, the fees paid by producers and dischargers of wastewater should achieve “full cost recovery,” reflecting the operation and maintenance costs and the capital costs for renewing and expanding sewerage and treatment systems, and ultimately the opportunity costs (water scarcity) and externality costs (economic and environmental) of wastewater use.
In addition to cost recovery, other economic instruments may also be effective in mobilizing financing for wastewater treatment and use projects and reducing pollution loads. These may include pricing of treated wastewater, the use of subsidies for wastewater investments, implementing effluent taxes and creating environmental funds to encourage treatment, use of abstraction taxes, and designing wastewater fees for industry based on a combination of wastewater volume charges and waste loading charges.
Sustainable cost recovery
The principle of full cost recovery has been invoked in a number of country water policy frameworks and, for example, in the EU Water Framework Directive (Box 5.4). In practice, however, the reality is that few countries practice full cost recovery through wastewater charges. Recognizing the difficulties of achieving full cost recovery, the Camdessus Panel (Winpenny, 2003) formulated the concept of “sustainable cost recovery,” which has subsequently been endorsed by the OECD (2009).
33 For a more complete discussion of the full cost and full value of water, see Rogers et al (1998) and OECD (2009).

97
The Camdessus Panel’s report identified three main characteristics of sustainable cost recovery:
An appropriate mix of tariffs, taxes and transfers (the 3Ts) to finance recurrent and capital costs, and to leverage other forms of financing;
Predictability of public subsidies to facilitate investment (planning); and
Tariff policies that are affordable to all, including the poorest, while ensuring the financial sustainability of service providers.
Each country must find its own balance among the three basic sources of finance (the 3Ts) for renewing and expanding wastewater management systems, but should seek to rely on wastewater fees to cover operation and maintenance costs for sewerage, treatment and disposal services and increasingly to recover a portion of capital costs. However, public budgets based on taxes often continue to play a role in covering at least part of the capital costs of wastewater infrastructure through subsidies.
In the developing countries, the path to improved cost recovery should involve a phased approach, with wastewater charges increasing in stages to cover operation and maintenance costs, and eventually depreciation of assets and some new investments. In high-income countries, it may be possible to recover some of the opportunity and externality costs. Where a phased approach is adopted, the process for setting wastewater charges should be part of general water tariff reform, and a realistic balance of central-local obligations and responsibilities should be set out.
Pricing treated wastewater
Setting appropriate fees for treated wastewater provides an important incentive mechanism to encourage wastewater use. This may include:
No charging: Treated wastewater price is set to zero so as to increase its demand and thus reduce or avoid wastewater discharge into sensitive aquatic environments;
Defined percentage of freshwater price: Treated wastewater use is often offered at a lower price than freshwater, thus stimulating wastewater use by farmers and increasing its acceptance.
Price set at willingness to pay of users: The price of treated wastewater is based on what the market will bear, without taking into account the costs required. Farmers’ willingness to pay varies depending on the expected economic returns.
Of course, if the price to farmers is less than treatment, storage, and conveyance costs, they become the beneficiaries of transfers (subsidies) from the operators or taxpayers in general. In view of the actual low cost recovery from farmers for freshwater irrigation, the price of treated wastewater will have to be kept low to remain competitive and subsidies will persist.
Use of subsidies for investment
Public budgets have historically played a major role in financing initial investments in wastewater treatment through capital grants. This was the case in the USA, Europe, and Japan (Bartone, 1997) where grants were provided for wastewater treatment in general. Some

98
developing countries are following this policy. Mexico, for example, provides a Federal grant of 50 percent of the WWTP investments.
Specifically for wastewater reclamation and use projects, the EU provides up to 50% grants for capital costs (AQUAREC, 2006), and other incentives (see Box 5.4). Similarly in the US, California provides up to 50% grants for water recycling facility planning and up to 25% capital grants for water recycling facility construction (SWRCB, 2008), and Florida is expanding grants and low-interest loans for municipal wastewater reclamation and use projects through the Regional Water Management Boards – analogous to water basin agencies (FDEP, 2003).
While there is a role for national grants (subsidies) and incentives for wastewater treatment investments in response to national environmental and agricultural priorities, care must be taken, however, to ensure that the mere existence of such grants does not distort investment decisions and promote the use of overly capital-intensive technologies when simpler, lower-cost technologies may be adequate to meet water quality objectives. In the positive examples presented in Table 5.2, a blend of private, international, and public financing was utilized in the case of Jordan, and a blend of local utility self-financing, international loan, and national grant was utilized in the cases of Monterrey and Tehran.
Effluent taxes and abstraction taxes
Several countries have introduced effluent taxes to encourage wastewater treatment and discourage discharge into natural waterways. This is an implementation of the “polluter pays principle,” whereby users of water are charged for the pollution load they discharge. This tax can be utilized to create an environmental fund to encourage investment in wastewater treatment, as has been done on a river basin basis in countries like Germany, France, Brazil, China, Colombia, and Mexico. In addition, certain investments for the improvements in wastewater treatment and use can be offset against the effluent charge.
Abstraction taxes can be applied to pumped groundwater or diverted surface water so that farmers or other uses do not perceive freshwater as free, and may be more disposed to pay for treated wastewater.
Cost recovery from industry
To operate efficiently, wastewater treatment plants require competent operators and a steady flow of funds for current expenditures such as labor, materials, spare parts, chemicals, and energy. Improperly operated plants cannot ensure a high-quality effluent and a sludge that can be disposed or reused without representing a risk to public health or the environment. Only if high quality effluent and sludge are produced can the wastewater plant be considered successful and the capital used for its construction well invested.
The key to achieving sustainable operations and debt repayment is to charge for the wastewater volume and load discharged to municipal sewers for treatment (again, the

99
‘polluter pays principle”). Households normally pay only a volumetric tariff for the wastewater they discharge, as the per capita pollution load varies only slightly,34 and the volume is easily estimated as proportional to metered water consumption. Industrial discharges to municipal sewers, however, vary greatly both in volume and pollution load that they exert on a wastewater treatment plant (Bartone, 1995). Thus, large industrial dischargers will generally be charged for metered wastewater volumes, and for pollution loads in terms of the mass of organic waste (BOD5 or COD), suspended solids (SS), nutrients (N, P) and/or other specific contaminants such as heavy metals, depending on the established treated effluent standards. This reflects the fact that the design of wastewater treatment plants is dictated in part by discharge volume (e.g., piping and hydraulic retention times for tanks), organic loading (e.g., energy requirements to supply oxygen for stabilization of organic pollutants), and SS loading (design of primary and secondary sedimentation units and digestors). If nutrient removal is required (not always the case for wastewater irrigation projects), advanced treatment processes may also have to be added and repaid by the principal contributors of nutrients. Finally, if metals or other contaminants are present in industrial wastewater, special conditioning of sludge may be required and should be charged to the source industries. Any pretreatment requirements should be met at industry expense prior to discharge into municipal sewers.
The coordination of national effluent taxes with municipal sewer use fees is essential so that a consistent message is sent to industrial dischargers. Also, it is essential to implement industrial discharge pretreatment and control programs as described in section 5.1.1, paid for by industry, so as to protect the operation of the wastewater treatment plant and guarantee the quality of effluent and sludge for subsequent agricultural use.
34 Per capita contributions to pollution loads have so little variance that concept of “Population Equivalent” (PE) is used in many European countries. A Population Equivalent (in waste-water monitoring and treatment) refers to the amount of oxygen-demanding substances whose oxygen consumption during biodegradation equals the average oxygen demand of the waste water produced by one person. For practical calculations, it is assumed that one unit equals 54 grams of BOD5 per 24 hours.

100
Chapter 6. Moving Forward
6.1 Toward a strategy for planned wastewater use in agriculture
Wastewater use in agriculture is an emerging priority in countries facing water scarcity and in many low-income countries. The relatively limited data that are available in the literature indicates that wastewater irrigation is growing, and is likely to continue to grow. Four powerful drivers are responsible for this: increasing water stress in many parts of both highly developed and less developed countries; increasing urbanization in the developing world; ever growing wastewater flows associated with the expansion of water supply and sewerage; and more urban households engaging in agricultural activities, especially when food prices continue to rise. However, the unplanned use of untreated wastewater in developing countries gives rise to increasing risks to people, plants, and the environment.
In these circumstances, governments are increasingly concerned with making wastewater use for agriculture a positive force for development as part of their overall water resources management strategies, and it is becoming an important key area for reform and investment. The following key messages seek to guide governments, water professionals, practitioners, and stakeholders wishing to build and/or strengthen national and local capacities for safe wastewater irrigation.
Learn from the experiences of countries in similar circumstances
Every country is unique, but can learn from the successes and failures of other countries in similar circumstances. This report provides an analysis of key issues related to wastewater irrigation by grouping countries into four categories by level of economic development, characterizes how issues vary across countries in different stages of development, and outlines likely trends and future priorities for improving wastewater treatment and use in agriculture (Tables 2.2, 2.3, 2.4, and 5.1). It also documents the experiences of numerous cities and countries that have progressed towards safer wastewater irrigation. Countries and practitioners can gain considerable insight into how they might develop wastewater irrigation policies and practices by analyzing their position on the treatment ladder, and the global experience summarized in this report.
Prioritize risks of wastewater irrigation
As unplanned wastewater irrigation with untreated wastewater around the world appears to be an order of magnitude greater than planned wastewater use, more attention needs to be paid to addressing and reducing the risks to the environment and especially to public health. The microbial health risks are especially severe in low- and lower-middle-income countries and disproportionately affect urban farmers and consumers, and should be given priority attention. In upper-middle income and high-income countries, urban industrialization gives rise to chemical risks that must be addressed with increasing urgency, along with increasing water pollution from concentrated domestic and industrial discharges.
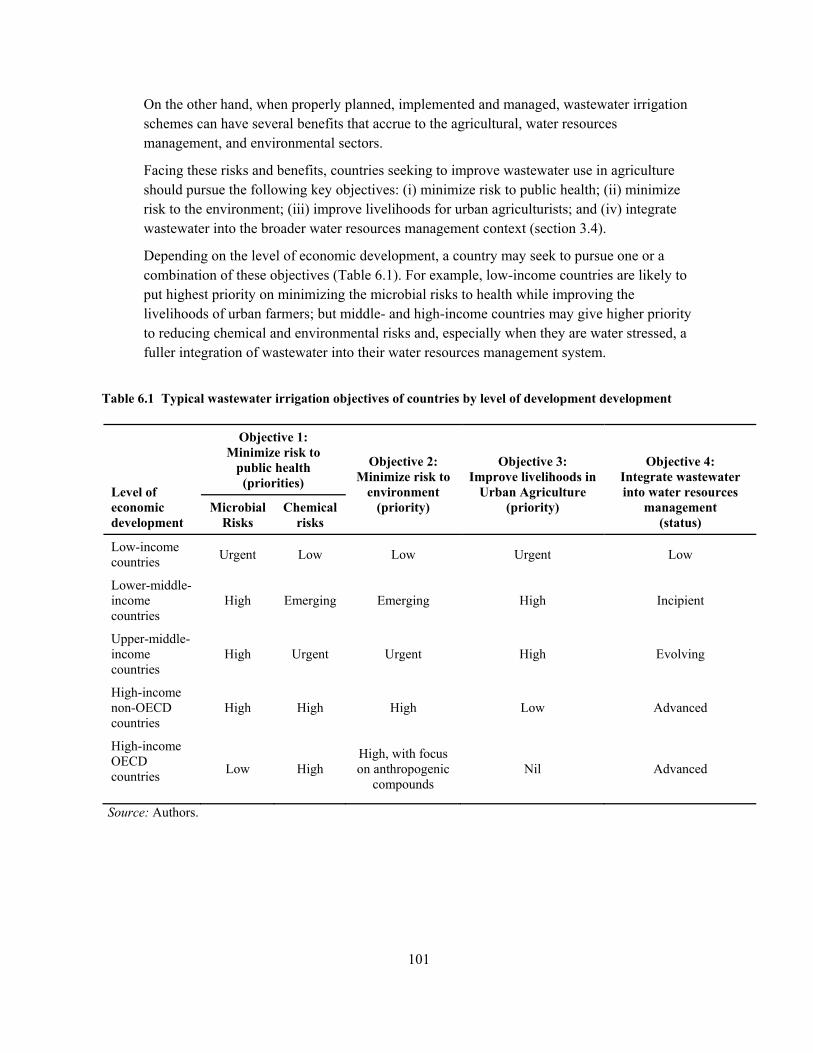
101
On the other hand, when properly planned, implemented and managed, wastewater irrigation schemes can have several benefits that accrue to the agricultural, water resources management, and environmental sectors.
Facing these risks and benefits, countries seeking to improve wastewater use in agriculture should pursue the following key objectives: (i) minimize risk to public health; (ii) minimize risk to the environment; (iii) improve livelihoods for urban agriculturists; and (iv) integrate wastewater into the broader water resources management context (section 3.4).
Depending on the level of economic development, a country may seek to pursue one or a combination of these objectives (Table 6.1). For example, low-income countries are likely to put highest priority on minimizing the microbial risks to health while improving the livelihoods of urban farmers; but middle- and high-income countries may give higher priority to reducing chemical and environmental risks and, especially when they are water stressed, a fuller integration of wastewater into their water resources management system.
Table 6.1 Typical wastewater irrigation objectives of countries by level of development development
Level of economic development
Objective 1: Minimize risk to
public health (priorities)
Objective 2: Minimize risk to
environment (priority)
Objective 3: Improve livelihoods in
Urban Agriculture (priority)
Objective 4: Integrate wastewater into water resources
management (status)
Microbial Risks
Chemical risks
Low-income countries
Urgent Low Low Urgent Low
Lower-middle-income countries
High Emerging Emerging High Incipient
Upper-middle-income countries
High Urgent Urgent High Evolving
High-income non-OECD countries
High High High Low Advanced
High-income OECD countries
Low High High, with focus on anthropogenic
compounds Nil Advanced
Source: Authors.
102
Assess microbial risks and set pathogen reduction targets
The 2006 WHO “Guidelines on Wastewater Use in Agriculture” are based on a risk assessment and management approach that follows the Stockholm Framework – the same risk management framework that is now applied to all decisions about drinking water and sanitation interventions. The approach for microbial risks is (i) to define a tolerable maximum additional burden of disease; (ii) based on that, to derive tolerable risks of disease and infection; (iii) to set health-based targets for pathogen reductions; (iv) to determine how the required pathogen reductions can be achieved; and (v) to put in place a system for verification monitoring.
For the first time, the 2006 Guidelines provide countries at any level of development with the means to rationally take targeted steps to reduce health risks. Even when full wastewater treatment is not (yet) an option, they present a multi-barrier approach to protecting the health of farmers and consumers. This report highlights the basic principles of the risk assessment and management framework in an effort to ensure wider dissemination and application (Chapter 4 and Annex A).
Progressively implement industrial pretreatment and control
Where industries contribute a significant amount of wastewater, the control of industrial wastewater discharges is essential for the minimization of chemical risks and the successful operation of any treatment plant or effluent irrigation scheme. Quality standards and discharge restrictions should be set up for industrial wastewater discharged into municipal sewerage systems, in order to ensure that heavy metals, organic toxins, salts, or other harmful contaminants generated by industrial activity do not reach levels that may damage pipes, inhibit the biological treatment processes, remain in the effluent in higher concentrations than permitted for irrigation use or environmental discharge, or accumulate in the sludge and limit or even prevent its disposal or reuse.
The increasing industrialization of urban areas in developing countries requires that chemical risks of wastewater irrigation be addressed, primarily through the introduction, progressive implementation, and enforcement of industrial wastewater pretreatment and control programs. This report describes the main elements of successful industrial pretreatment and control programs (Section 5.1).
Planning for wastewater use in agriculture
As water scarcity grows, investment in wastewater treatment and irrigation systems will become more viable. To encourage such investments, governments should determine enabling wastewater use policy, establish a clear regulatory framework (based on the 2006 WHO Guidelines), and develop a strategy for moving from unplanned to planned wastewater use for irrigation.
Key elements of a strategic plan include the development of health-based targets, phased improvements in wastewater treatment, establishment of multi-barrier options comprising post-treatment health-protection control measures, and progressive implementation industrial pretreatment and control programs (Section 5.1). Recognizing that targets cannot be met
103
overnight or even in one phase, the strategic plan should be multi-phased and aim at steady and measurable progress toward the medium- and long-term goals, within an agreed and realistic timeframe. Progress in achieving safe wastewater irrigation may be measured over decades as has been demonstrated in the successful examples of Chile (Box 5.3) and Israel (Box 5.4).
Manage wastewater as a resource
The definition of wastewater use policy, establishment of the corresponding regulatory framework, and the successful implementation of planned wastewater irrigation all require that agricultural wastewater use be embedded in the broader water resources management context. A number of integrated water resources management principles should be applied, namely: adopt a multi-sectoral approach to water management in association with river basin management; encourage stakeholder participation and devolution of responsibility; promote private sector involvement; and employ economic instruments.
Guidance on how to apply these principles, and address the institutional/planning, economic/financial, technological, and social issues arising in wastewater use in agriculture, is provided in this report (Section 5.2).
6.2 Concluding Remarks
Tailoring a national strategy to local circumstances
Many countries are facing major challenges in managing the risks associated with uncontrolled wastewater irrigation, particularly water-scarce countries and low-income countries. Many have also begun to address those challenges and progressed toward some degree of planned wastewater use in agriculture – some with nascent approaches and others with well-defined strategies. The most successful countries have labored for decades to achieve safe wastewater use. While each country is unique, the experiences of other countries can provide some lessons as to how to improve wastewater irrigation practices. Countries can adapt techniques and policies developed elsewhere to suit their own circumstances.
This report has sought to analyze a number of national experiences and understand how a country’s level of development may influence pragmatic and practicable solutions for managing risks. Table 6.2 suggests the types of interventions (planning approaches, policies, and investment) that may be most useful for developing countries, grouped by level of development. While not pretending to be exhaustive or to provide a clear-cut set of interventions for each grouping, the table suggests how the elements of a strategy may evolve over time as development occurs. Countries are encouraged to study how such interventions may serve their individual purposes.

104
Table 6.1 Typical interventions for planned wastewater use for agriculture, by level of development
Level of economic
development
Low-income
countries
Lower-middle-income
countries
Upper-middle-income
countries
Typical planning approaches
Strategic sanitation plans Slum upgrading plans Urban agriculture plans Multi-barrier wastewater
irrigation plans
Sewerage master plans Municipal wastewater
treatment plans Urban catchment plans Urban agriculture plans Multi-sectoral
wastewater irrigation plan
Wastewater reclamation and use plans
Water pollution control plans (municipal and industrial)
River basin plans Emergency control plans
Key policy instruments
Water rights and land tenure security
Farmer and consumer training in safe food production and preparation practices
Sanitation subsidies for the poor
Sustainable cost recovery Sewer use charges for
industry Pricing irrigation water Creation of dedicated
wastewater irrigation areas
Clarification of stakeholder roles and responsbilities
Public outreach and education
Sustainable cost recovery Pricing treated
wastewater Effluent and abstraction
taxes Private sector
involvement Subsidies for WWTP
planning and construction
Potential areas for investments
Urban sanitation projects Urban agriculture
projects Urban livelihood projects Microcredit programs Slum-upgrading projects Municipal management
projects
Water supply and sanitation projects
Wastewater treatment and reuse projects
Urban management and slum-upgrading projects
Irrigation projects Industrial pollution
control projects Integrated water
resources management projects
Wastewater treatment and reuse projects;
Irrigation projects Industrial pollution
control projects Integrated water
resources management projects
Source: Authors
Support from development partners
Countries are also encouraged to seek support for developing and implementing their own strategies from international financial institutions, bilateral and multilateral development agencies, international NGOs, and other development partners. Over the past four decades, the international donor community has made a number of contributions to our improved understanding of the risks of unplanned wastewater irrigation and of promising solutions for safe wastewater use in agriculture. In addition to seminal work on epidemiology supported by the World Bank, WHO, and the United Nations Development Program (UNDP), and the

105
international guidelines prepared by WHO (risk assessment and management framework) and FAO (HACCP), many other development partners have worked diligently with countries and cities in support of safe wastewater irrigation and for promoting wastewater use in urban and peri-urban agriculture—among them the International Development and Research Centre (IDRC), the International Water Management Institute (IWMI), the Resource Center for Urban Agriculture and Forestry (RUAF), and the Water Partnership Propgram (WPP), to name a few.
At the same time, donors are encouraged to give greater attention to this emerging priority and provide increasing support to those countries working to convert wastewater to a valuable irrigation source without endangering farmers or consumers. The World Bank, for its part, should assess its past role in this field (summarized in Annex B) and update its assistance strategy in accord with the priority that water-scarce and low-income countries are giving to safe wastewater use in agriculture.

106
Annex A: Development of Guidelines for Wastewater Use in Agriculture 1918-2010
Part A1: Standards and Guidelines 1918−1989
A1.1 State of California
The Californian ‘Title 22’ regulations for the quality of treated wastewater to be used for crop irrigation were first promulgated in 1918 (Asano and Levine 1996). Currently the regulations are (State of California 2001):
for restricted irrigation: ≤23 total coliforms per 100 mL, and
for unrestricted irrigation: ≤2.2 total coliforms per 100 mL.
These regulations are very strict and are based on potential, rather than actual, risks to health − i.e., they are not based on any epidemiological evidence, but only on the possibility that pathogens may be present and that therefore there may be a risk to human health (see Box A1.1).
Box A1.1 Actual and potential health risks in wastewater irrigation
An actual risk to public health occurs as a result of wastewater irrigation when all of the following four conditions are satisfied:
(1) either an infective dose of the pathogen reaches the wastewater-irrigated field or the pathogen multiples in the field to form an infective dose, (2) the infective dose reaches a human host, (3) the host becomes infected, and (4) the infection causes disease or further transmission.
Actual risks can thus only be determined from epidemiological studies.
If conditions 1−3 are satisfied but not condition 4, then the risk is only a potential risk.
Source: WHO 1989. Note: this Box is the same as Box 3.2 and is reproduced here for ease of reference.

107
A1.2 United States of America
The US Environmental Protection Agency recommended that river waters used for unrestricted irrigation should contain ≤1000 fecal coliforms per 100 mL (USEPA 1973). However, the US EPA and the United States Agency for International Development have jointly published much stricter guidelines35 for wastewater use in agriculture (USEPA/USAID 1992, 2004), as follows:
for the irrigation of “food crops not commercially processed − surface or spray irrigation of any food crop, including crops eaten raw” (i.e., unrestricted irrigation): no detectable fecal coliforms per 100 mL; and
for the irrigation of “food crops commercially processed − surface irrigation of orchards and vineyards”, and “non-food crops − pasture for milking animals, fodder, fiber, and seed crops” (i.e., restricted irrigation): ≤200 fecal coliforms per 100 mL.
The guideline for unrestricted irrigation is stricter than the corresponding Californian standard (and, it may be noted, is the same as that required for drinking water), but that for restricted irrigation is less strict by an order of magnitude. The rationale for these guidelines was not given, but it is clear that they were based on only potential health risks.
A1.3 World Health Organization
The World Health Organization has published three editions of its Guidelines for the safe use of wastewater in agriculture: in 1973, 1989, and 2006. The salient points of the 1973 and 1989 editions are discussed below [the 2006 edition is discussed in Part 2 of this Annex].
►The 1973 WHO Guidelines
The 1973 Guidelines (WHO 1973) “recognized that the extremely strict Californian standards were not justified by the available epidemiological evidence”, and made the following recommendations:
for both restricted and unrestricted irrigation: “no chemicals which lead to undesirable residues in crops or fish”,
additionally for unrestricted irrigation (“crops eaten raw”): ≤100 total coliforms per 100 mL, and
additionally for restricted irrigation − (a) for “crops not for direct human consumption”: “freedom from gross solids, [and] significant removal of parasite eggs”; and (b) either ≤100 total coliforms per 100 mL or “significant removal of bacteria”.
35 In the USA it is the states that have the jurisdiction to establish legally enforceable standards. Federal agencies (like US EPA and USAID) can only make recommendations in the form of guidelines.

108
The ‘undesirable residues’ and ‘significant removals’ were not defined and the Guidelines were simply interpreted as requiring ≤100 total coliforms per 100 mL for unrestricted irrigation.
The 1989 WHO Guidelines
The recommendations in the 1989 Guidelines (WHO 1989), based largely on the epidem-iological evidence reviewed by Shuval et al. (1986) and the recommendations made in the Engelberg Report (Shuval and Mara 1985), are as follows:
Restricted irrigation: ≤1 human intestinal nematode egg per liter; and
Unrestricted irrigation: ≤1 human intestinal nematode egg per liter and ≤1000 fecal coliforms per 100 mL.
The 1989 Guidelines incorporated the distinction between actual and potential risks (Box A1.1) and introduced ‘health-protection control measures’ (crop restriction, drip irrigation and human exposure control) which could be used, either singly or in combination, when wastewater treatment does not, or is unable to, achieve ≤1 egg per liter and ≤1000 fecal coliforms per 100 mL (Figures A1.1 and A1.2).
The 1989 Guidelines were not without their critics. Some considered that the fecal coliform guideline value of ≤1000 per 100 ml far too lax (for example: Shelef 1991) or that it was too difficult to measure a helminth egg concentration as low as 1 per liter (but see Part 4 of this Annex). However, most of the criticism was centered on the requirement for wastewater treatment to achieve ≤1000 fecal coliforms per 100 mL, especially in low- and middle-income countries where little wastewater is effectively treated or not treated.
This dissatisfaction with the apparent lack of applicability of the 1989 WHO Guidelines in the ‘real world’, where most wastewater used for large-farm irrigation and in urban agriculture is untreated, gave rise to the ‘Hyderabad Declaration’ (IWMI 2002), which called for the “development and application of guidelines for untreated wastewater use that safeguard livelihoods, public health and the environment” [emphasis added]. This, in turn, has led to work on ‘non-treatment options’ (cf. section 4.3.2).
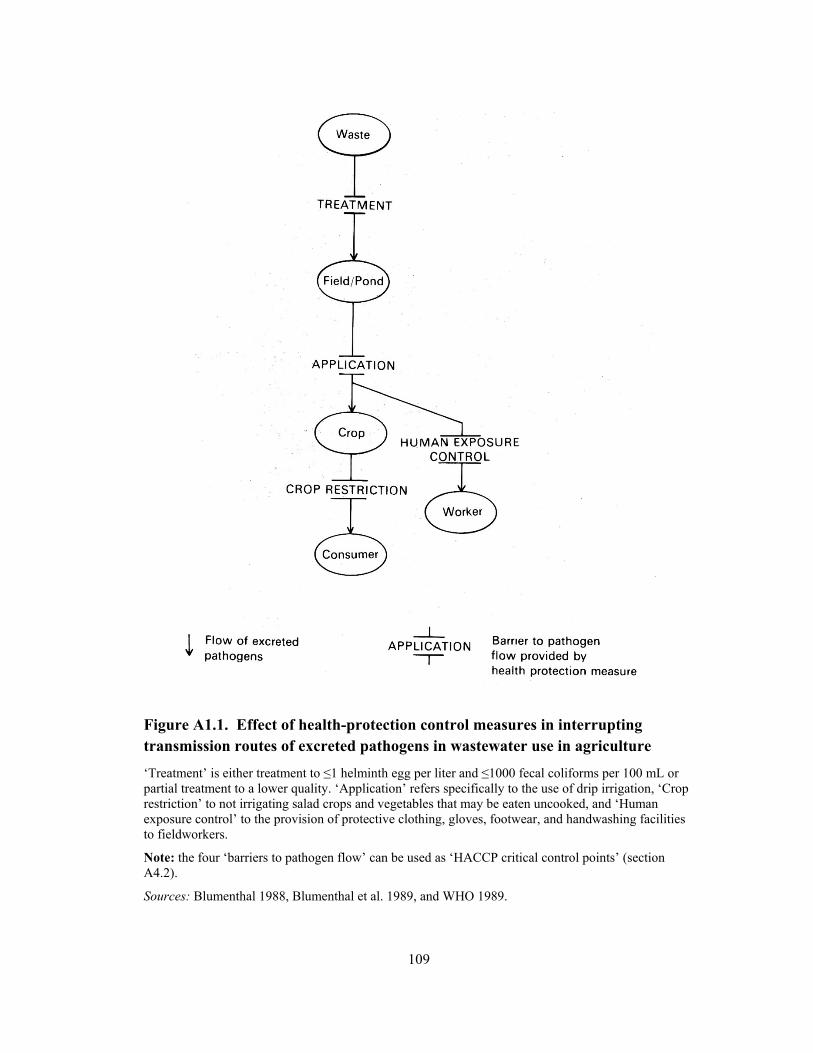
109
Figure A1.1. Effect of health-protection control measures in interrupting transmission routes of excreted pathogens in wastewater use in agriculture
‘Treatment’ is either treatment to ≤1 helminth egg per liter and ≤1000 fecal coliforms per 100 mL or partial treatment to a lower quality. ‘Application’ refers specifically to the use of drip irrigation, ‘Crop restriction’ to not irrigating salad crops and vegetables that may be eaten uncooked, and ‘Human exposure control’ to the provision of protective clothing, gloves, footwear, and handwashing facilities to fieldworkers.
Note: the four ‘barriers to pathogen flow’ can be used as ‘HACCP critical control points’ (section A4.2).
Sources: Blumenthal 1988, Blumenthal et al. 1989, and WHO 1989.

110
Figure A1.2. Generalized model showing the level of risk to human health associated with different combinations of health-protection control measures for wastewater use in agriculture.
‘Full treatment’ is treatment to ≤1 helminth egg per liter and ≤1000 fecal coliforms per 100 mL. ‘Crop restriction’ refers to not irrigating salad crops and vegetables that may be eaten uncooked, ‘Application measures’ to the use of drip irrigation, and ‘Human exposure control’ to the provision of protective clothing, gloves, footwear, and handwashing facilities, to fieldworkers.
Sources: Blumenthal 1988, Blumenthal et al. 1989, and WHO 1989.
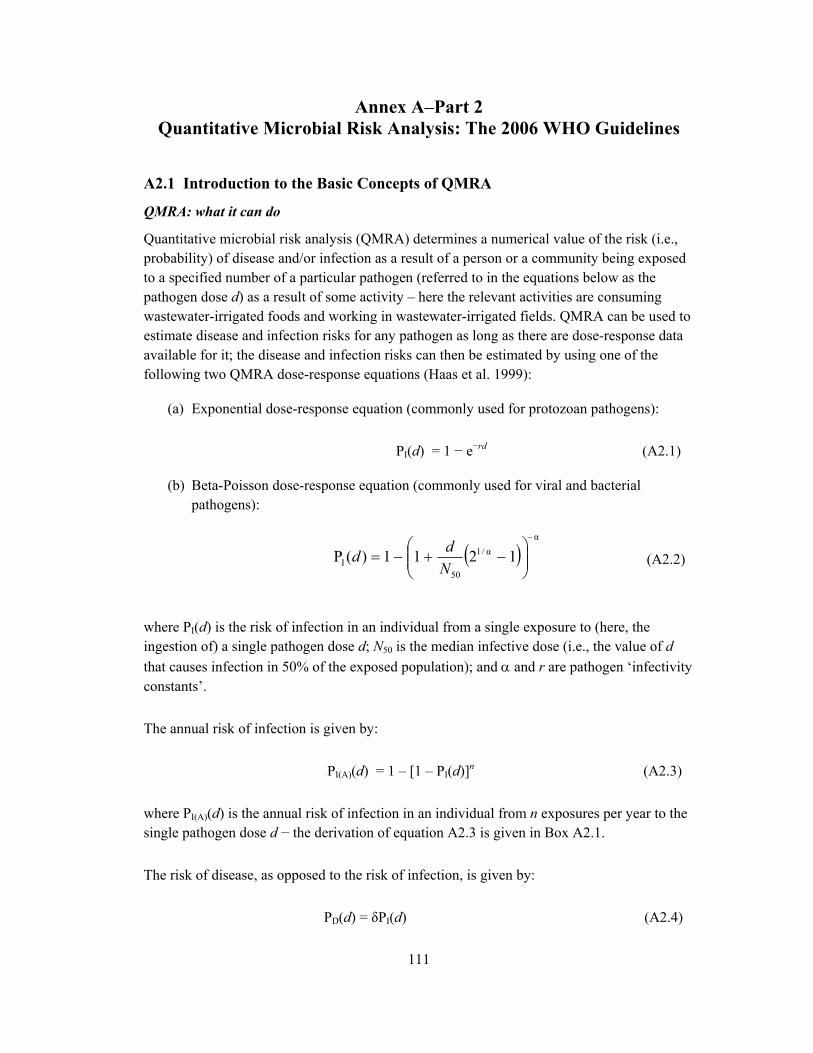
111
Annex A–Part 2 Quantitative Microbial Risk Analysis: The 2006 WHO Guidelines
A2.1 Introduction to the Basic Concepts of QMRA
QMRA: what it can do
Quantitative microbial risk analysis (QMRA) determines a numerical value of the risk (i.e., probability) of disease and/or infection as a result of a person or a community being exposed to a specified number of a particular pathogen (referred to in the equations below as the pathogen dose d) as a result of some activity – here the relevant activities are consuming wastewater-irrigated foods and working in wastewater-irrigated fields. QMRA can be used to estimate disease and infection risks for any pathogen as long as there are dose-response data available for it; the disease and infection risks can then be estimated by using one of the following two QMRA dose-response equations (Haas et al. 1999):
(a) Exponential dose-response equation (commonly used for protozoan pathogens):
PI(d) = 1 − e−rd (A2.1)
(b) Beta-Poisson dose-response equation (commonly used for viral and bacterial pathogens):
(A2.2)
where PI(d) is the risk of infection in an individual from a single exposure to (here, the ingestion of) a single pathogen dose d; N50 is the median infective dose (i.e., the value of d
that causes infection in 50% of the exposed population); and and r are pathogen ‘infectivity constants’.
The annual risk of infection is given by:
PI(A)(d) = 1 – [1 – PI(d)]n (A2.3)
where PI(A)(d) is the annual risk of infection in an individual from n exposures per year to the single pathogen dose d − the derivation of equation A2.3 is given in Box A2.1.
The risk of disease, as opposed to the risk of infection, is given by:
PD(d) = δPI(d) (A2.4)
α
α/1
50I 1211)(P
N
dd

112
where PD(d) is the risk of disease in an individual from a single exposure to the single pathogen dose d; and δ is the disease/infection ratio (i.e., the proportion of the infected population that becomes clinically ill; thus the value of δ is in the range 0−1).
The use of equations A2.2 and A2.3 is illustrated in Box A2.2.
Box A2.1: Derivation of Equation A2.3
As noted above, PI(d) is the risk (i.e., probability) of infection per person per single exposure to a pathogen dose d.
►Therefore the risk of a person not becoming infected from a single exposure to this pathogen dose d is [1 − PI(d)], as the risk of becoming infected and the risk of not becoming infected must add up to 1.
►Therefore the risk of a person not becoming infected following n exposures per year to the pathogen dose d is [1 − PI(d)]n.
►Therefore the risk of a person becoming infected following n exposures per year to the patho-gen dose d [this is PI(A)(d)] is 1 − [1 − PI(d)]n.
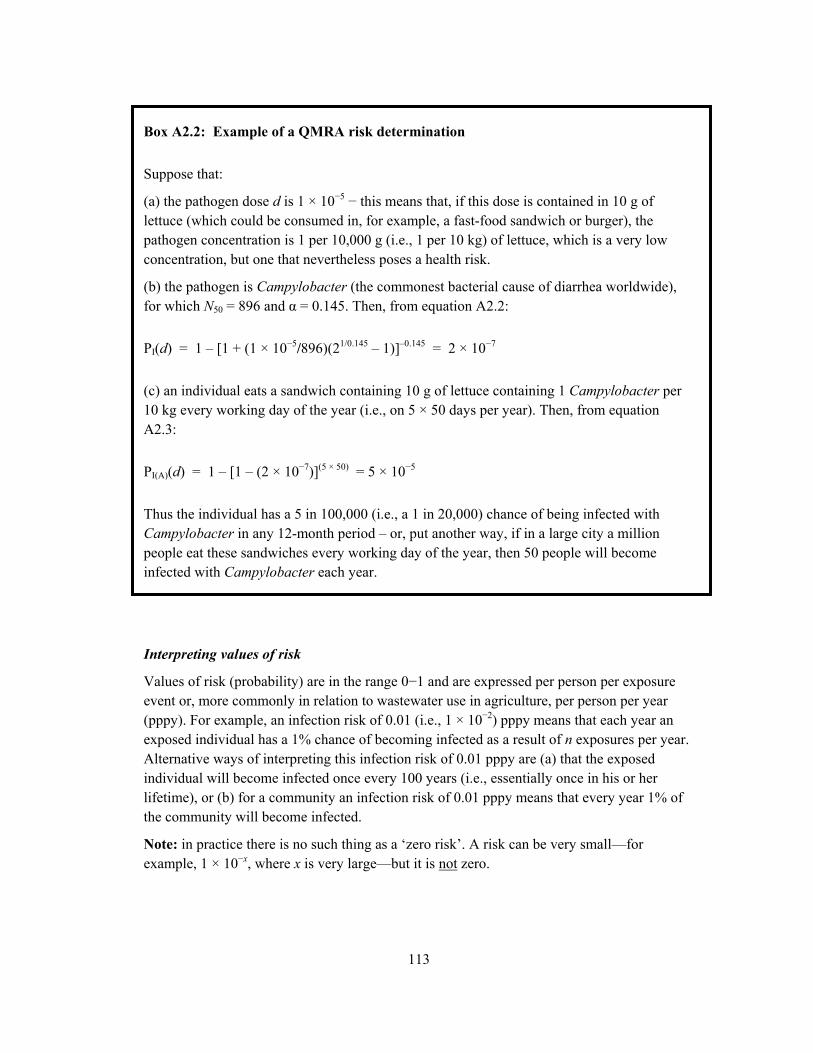
113
Box A2.2: Example of a QMRA risk determination
Suppose that:
(a) the pathogen dose d is 1 × 10⁻⁵ − this means that, if this dose is contained in 10 g of lettuce (which could be consumed in, for example, a fast-food sandwich or burger), the pathogen concentration is 1 per 10,000 g (i.e., 1 per 10 kg) of lettuce, which is a very low concentration, but one that nevertheless poses a health risk.
(b) the pathogen is Campylobacter (the commonest bacterial cause of diarrhea worldwide), for which N50 = 896 and α = 0.145. Then, from equation A2.2:
PI(d) = 1 – [1 + (1 × 10⁻⁵/896)(21/0.145 – 1)]–0.145 = 2 × 10⁻⁷
(c) an individual eats a sandwich containing 10 g of lettuce containing 1 Campylobacter per 10 kg every working day of the year (i.e., on 5 × 50 days per year). Then, from equation A2.3:
PI(A)(d) = 1 – [1 – (2 × 10⁻⁷)](5 × 50) = 5 × 10⁻⁵
Thus the individual has a 5 in 100,000 (i.e., a 1 in 20,000) chance of being infected with Campylobacter in any 12-month period – or, put another way, if in a large city a million people eat these sandwiches every working day of the year, then 50 people will become infected with Campylobacter each year.
Interpreting values of risk
Values of risk (probability) are in the range 0−1 and are expressed per person per exposure event or, more commonly in relation to wastewater use in agriculture, per person per year (pppy). For example, an infection risk of 0.01 (i.e., 1 × 10⁻²) pppy means that each year an exposed individual has a 1% chance of becoming infected as a result of n exposures per year. Alternative ways of interpreting this infection risk of 0.01 pppy are (a) that the exposed individual will become infected once every 100 years (i.e., essentially once in his or her lifetime), or (b) for a community an infection risk of 0.01 pppy means that every year 1% of the community will become infected.
Note: in practice there is no such thing as a ‘zero risk’. A risk can be very small—for example, 1 × 10−x, where x is very large—but it is not zero.

114
Monte Carlo risk simulations
In the example QMRA risk determination in Box A2.2 ‘fixed’ values of the parameters are used – for example, N50 and α are taken to be exactly 896 and 0.145, respectively. However, these values are subject to some uncertainty and it is possible that the value of N50, for example, could be anywhere in the range 800−1000 or even 700−1100. To overcome, at least partially, the uncertainty of many of the parameters used in QMRA risk determinations, Monte Carlo risk simulations are used in which a range of values is assigned to each parameter used in the calculations, rather than a single fixed value, although a fixed value can be assigned to any given parameter if so desired. A computer program then selects at random a value for each parameter from the range of values specified for it and then determines the resulting annual risk. The program then repeats this process a large number of times (generally for a total of 1000 or 10,000 times) and determines the median and 95-percentile risks. This large number of repetitions removes some of the uncertainty associated with the parameter values and makes the results generated by multi-simulation QMRA-Monte Carlo risk analyses much more robust than those determined by simple QMRA calculations of the type shown in Box A2.2 (and also in Box A2.3), although of course they are only as good as the assumptions made. Section A2.3 illustrates the use of this ‘QMRA-MC’ approach to risk determination.
A2.2 Tolerable Maximum Additional Burden of Disease and Resulting Tolerable Maximum Disease and Infection Risks
A tolerable maximum additional burden of disease resulting from exposure to a particular activity (for example, the consumption of wastewater-irrigated food) has to be selected. Burdens of disease are now expressed as ‘DALY losses’ – disability-adjusted life years lost (see Box 4.1 for a description of DALYs) – per person per year (pppy). The DALY loss associated with a case of a disease can be considered as the ‘health cost’ of one episode of that disease.
Tolerable DALY losses are small – for example, 1 × 10−n pppy, where n is in the range 1−10 (in order of magnitude terms). Once the tolerable additional burden of disease resulting from exposure to a specified activity has been selected, then this tolerable DALY loss pppy has to be ‘translated’ into tolerable disease and infection risks pppy, as follows:
diseaseofcaseperlossDALY
pppylossDALYTolerable=pppyriskdiseaseTolerable
ratiofection Disease/in
pppyrisk diseaseTolerable=pppyriskinfectionTolerable
A2.3 QMRA in the 2006 WHO Guidelines
Tolerable maximum DALY loss
The tolerable maximum additional burden of disease resulting from working in wastewater-irrigated fields and consuming wastewater-irrigated food used in the 2006 WHO Guidelines
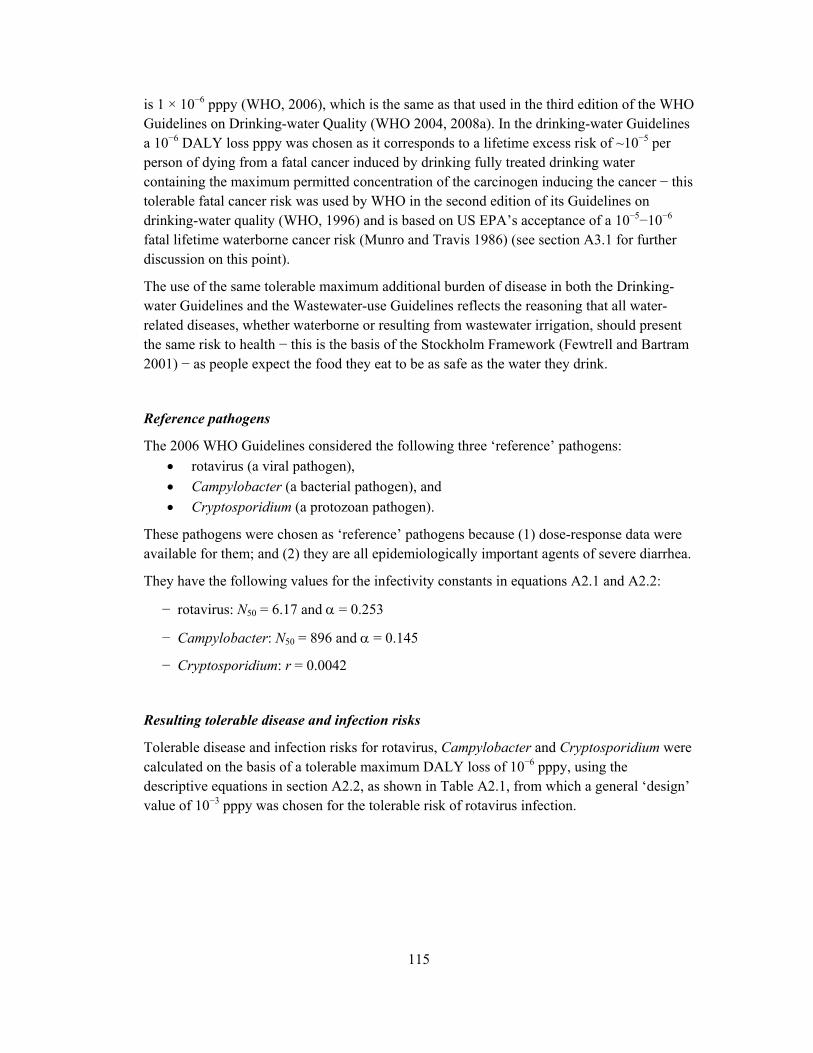
115
is 1 × 10⁻⁶ pppy (WHO, 2006), which is the same as that used in the third edition of the WHO Guidelines on Drinking-water Quality (WHO 2004, 2008a). In the drinking-water Guidelines a 10−6 DALY loss pppy was chosen as it corresponds to a lifetime excess risk of ~10−5 per person of dying from a fatal cancer induced by drinking fully treated drinking water containing the maximum permitted concentration of the carcinogen inducing the cancer − this tolerable fatal cancer risk was used by WHO in the second edition of its Guidelines on drinking-water quality (WHO, 1996) and is based on US EPA’s acceptance of a 10−5−10−6 fatal lifetime waterborne cancer risk (Munro and Travis 1986) (see section A3.1 for further discussion on this point).
The use of the same tolerable maximum additional burden of disease in both the Drinking-water Guidelines and the Wastewater-use Guidelines reflects the reasoning that all water-related diseases, whether waterborne or resulting from wastewater irrigation, should present the same risk to health − this is the basis of the Stockholm Framework (Fewtrell and Bartram 2001) − as people expect the food they eat to be as safe as the water they drink.
Reference pathogens
The 2006 WHO Guidelines considered the following three ‘reference’ pathogens:
rotavirus (a viral pathogen),
Campylobacter (a bacterial pathogen), and
Cryptosporidium (a protozoan pathogen).
These pathogens were chosen as ‘reference’ pathogens because (1) dose-response data were available for them; and (2) they are all epidemiologically important agents of severe diarrhea.
They have the following values for the infectivity constants in equations A2.1 and A2.2:
− rotavirus: N50 = 6.17 and = 0.253
− Campylobacter: N50 = 896 and = 0.145
− Cryptosporidium: r = 0.0042
Resulting tolerable disease and infection risks
Tolerable disease and infection risks for rotavirus, Campylobacter and Cryptosporidium were calculated on the basis of a tolerable maximum DALY loss of 10−6 pppy, using the descriptive equations in section A2.2, as shown in Table A2.1, from which a general ‘design’ value of 10−3 pppy was chosen for the tolerable risk of rotavirus infection.
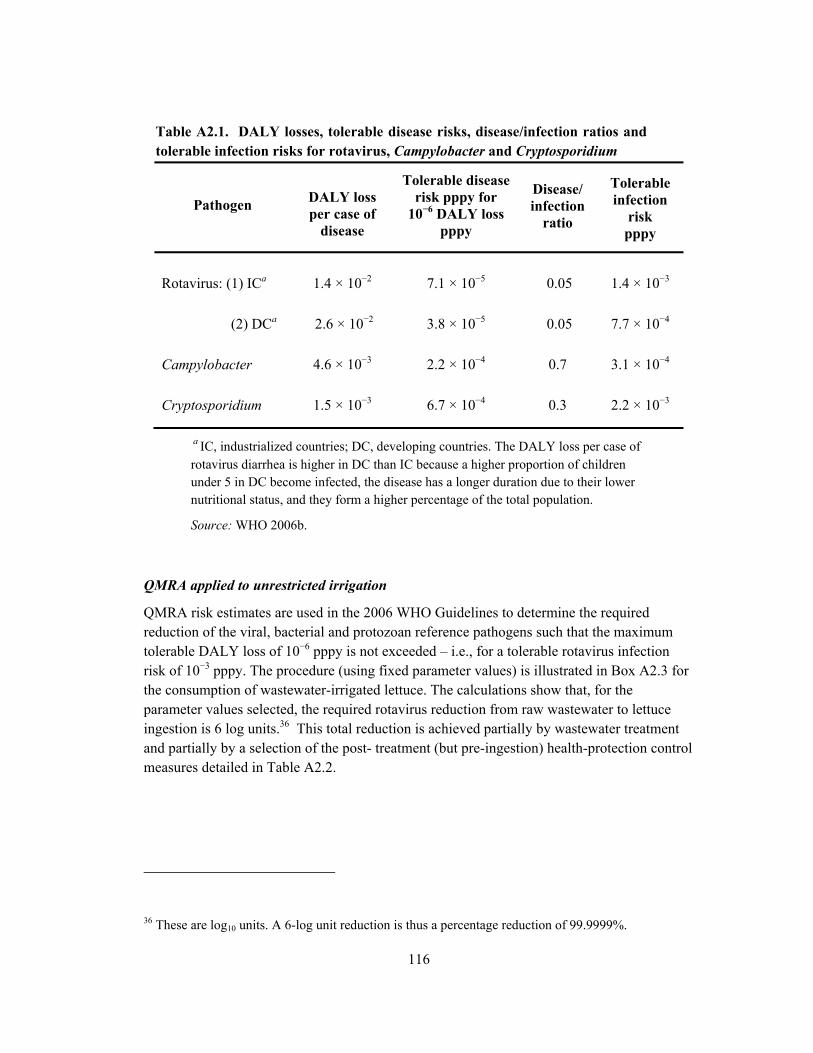
116
Table A2.1. DALY losses, tolerable disease risks, disease/infection ratios and tolerable infection risks for rotavirus, Campylobacter and Cryptosporidium
Pathogen
DALY loss per case of
disease
Tolerable disease risk pppy for
10−6 DALY loss pppy
Disease/ infection
ratio
Tolerable infection
risk pppy
Rotavirus: (1) ICa 1.4 × 10⁻² 7.1 × 10⁻⁵ 0.05 1.4 × 10⁻³
(2) DCa 2.6 × 10⁻² 3.8 × 10⁻⁵ 0.05 7.7 × 10⁻⁴
Campylobacter 4.6 × 10⁻³ 2.2 × 10⁻⁴ 0.7 3.1 × 10⁻⁴
Cryptosporidium 1.5 × 10⁻³ 6.7 × 10⁻⁴ 0.3 2.2 × 10⁻³
a IC, industrialized countries; DC, developing countries. The DALY loss per case of rotavirus diarrhea is higher in DC than IC because a higher proportion of children under 5 in DC become infected, the disease has a longer duration due to their lower nutritional status, and they form a higher percentage of the total population.
Source: WHO 2006b.
QMRA applied to unrestricted irrigation
QMRA risk estimates are used in the 2006 WHO Guidelines to determine the required reduction of the viral, bacterial and protozoan reference pathogens such that the maximum tolerable DALY loss of 10−6 pppy is not exceeded – i.e., for a tolerable rotavirus infection risk of 10−3 pppy. The procedure (using fixed parameter values) is illustrated in Box A2.3 for the consumption of wastewater-irrigated lettuce. The calculations show that, for the parameter values selected, the required rotavirus reduction from raw wastewater to lettuce ingestion is 6 log units.36 This total reduction is achieved partially by wastewater treatment and partially by a selection of the post- treatment (but pre-ingestion) health-protection control measures detailed in Table A2.2.
36 These are log10 units. A 6-log unit reduction is thus a percentage reduction of 99.9999%.
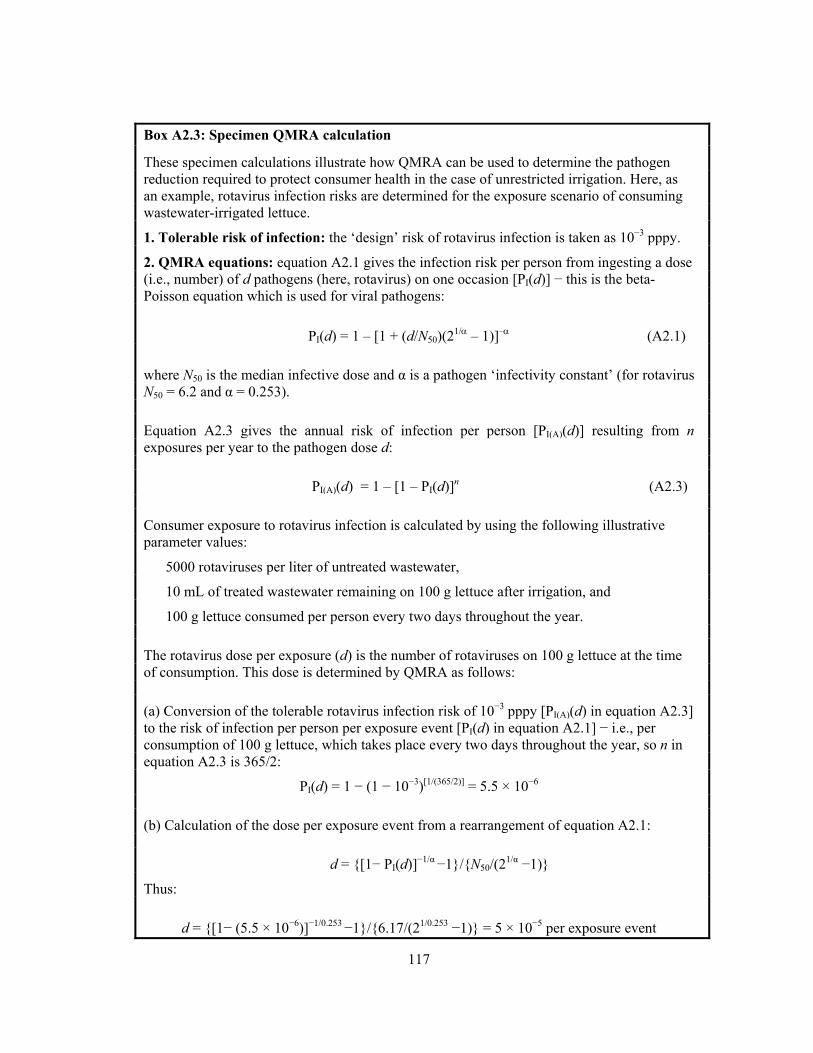
117
Box A2.3: Specimen QMRA calculation
These specimen calculations illustrate how QMRA can be used to determine the pathogen reduction required to protect consumer health in the case of unrestricted irrigation. Here, as an example, rotavirus infection risks are determined for the exposure scenario of consuming wastewater-irrigated lettuce.
1. Tolerable risk of infection: the ‘design’ risk of rotavirus infection is taken as 10−3 pppy.
2. QMRA equations: equation A2.1 gives the infection risk per person from ingesting a dose (i.e., number) of d pathogens (here, rotavirus) on one occasion [PI(d)] − this is the beta-Poisson equation which is used for viral pathogens:
PI(d) = 1 – [1 + (d/N50)(21/ – 1)]– (A2.1)
where N50 is the median infective dose and α is a pathogen ‘infectivity constant’ (for rotavirus N50 = 6.2 and α = 0.253).
Equation A2.3 gives the annual risk of infection per person [PI(A)(d)] resulting from n exposures per year to the pathogen dose d:
PI(A)(d) = 1 – [1 – PI(d)]n (A2.3)
Consumer exposure to rotavirus infection is calculated by using the following illustrative parameter values:
5000 rotaviruses per liter of untreated wastewater,
10 mL of treated wastewater remaining on 100 g lettuce after irrigation, and
100 g lettuce consumed per person every two days throughout the year.
The rotavirus dose per exposure (d) is the number of rotaviruses on 100 g lettuce at the time of consumption. This dose is determined by QMRA as follows:
(a) Conversion of the tolerable rotavirus infection risk of 10−3 pppy [PI(A)(d) in equation A2.3] to the risk of infection per person per exposure event [PI(d) in equation A2.1] − i.e., per consumption of 100 g lettuce, which takes place every two days throughout the year, so n in equation A2.3 is 365/2:
PI(d) = 1 − (1 − 10−3)[1/(365/2)] = 5.5 × 10⁻⁶
(b) Calculation of the dose per exposure event from a rearrangement of equation A2.1:
d = {[1− PI(d)]−1/α −1}/{N50/(21/α −1)}
Thus:
d = {[1− (5.5 × 10⁻⁶)]−1/0.253 −1}/{6.17/(21/0.253 −1)} = 5 × 10⁻⁵ per exposure event
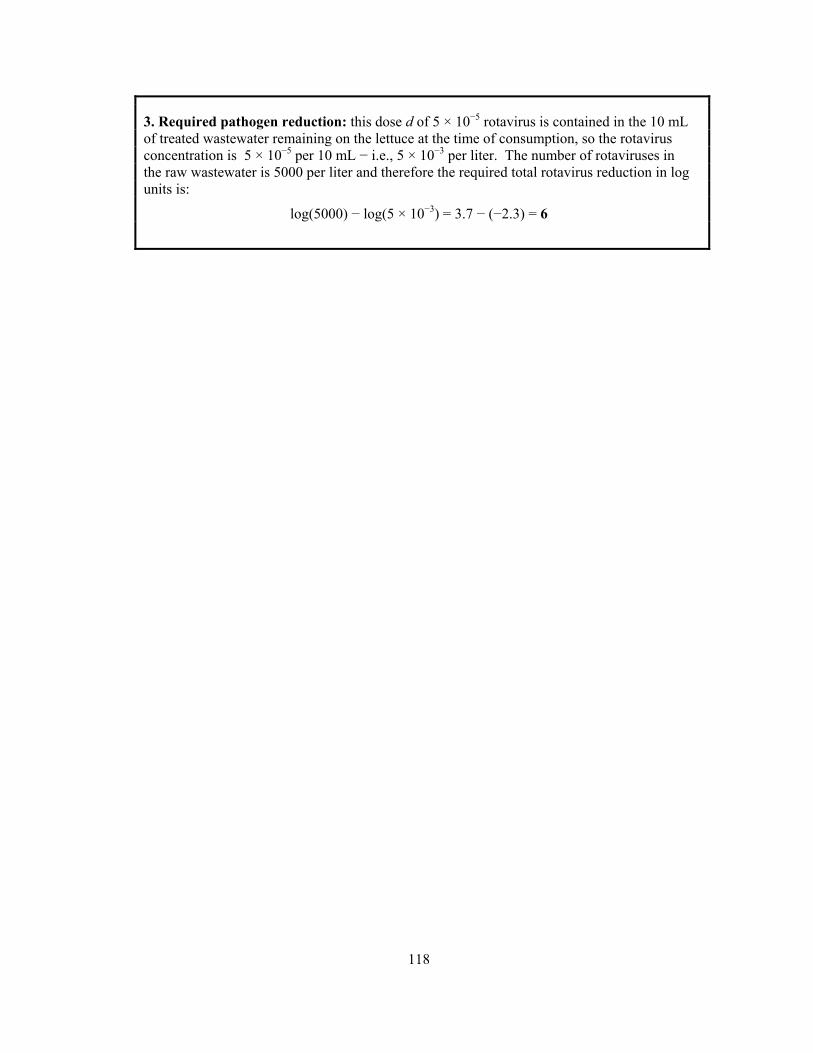
118
3. Required pathogen reduction: this dose d of 5 × 10⁻⁵ rotavirus is contained in the 10 mL of treated wastewater remaining on the lettuce at the time of consumption, so the rotavirus concentration is 5 × 10⁻⁵ per 10 mL − i.e., 5 × 10⁻³ per liter. The number of rotaviruses in the raw wastewater is 5000 per liter and therefore the required total rotavirus reduction in log units is:
log(5000) − log(5 × 10⁻³) = 3.7 − (−2.3) = 6
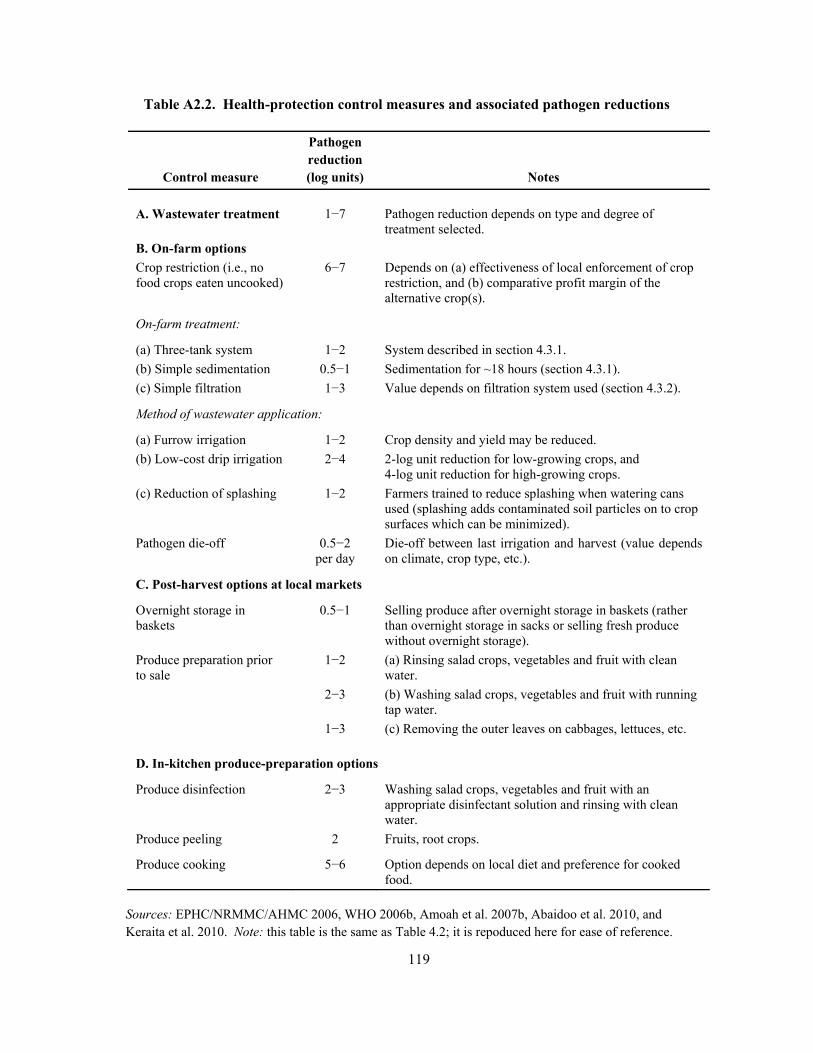
119
Table A2.2. Health-protection control measures and associated pathogen reductions
Control measure
Pathogen reduction (log units) Notes
A. Wastewater treatment
1−7
Pathogen reduction depends on type and degree of treatment selected.
B. On-farm options
Crop restriction (i.e., no food crops eaten uncooked)
6−7 Depends on (a) effectiveness of local enforcement of crop restriction, and (b) comparative profit margin of the alternative crop(s).
On-farm treatment:
(a) Three-tank system 1−2 System described in section 4.3.1.
(b) Simple sedimentation 0.5−1 Sedimentation for ~18 hours (section 4.3.1).
(c) Simple filtration 1−3 Value depends on filtration system used (section 4.3.2).
Method of wastewater application:
(a) Furrow irrigation 1−2 Crop density and yield may be reduced.
(b) Low-cost drip irrigation 2−4 2-log unit reduction for low-growing crops, and 4-log unit reduction for high-growing crops.
(c) Reduction of splashing 1−2 Farmers trained to reduce splashing when watering cans used (splashing adds contaminated soil particles on to crop surfaces which can be minimized).
Pathogen die-off 0.5−2 per day
Die-off between last irrigation and harvest (value depends on climate, crop type, etc.).
C. Post-harvest options at local markets
Overnight storage in baskets
0.5−1 Selling produce after overnight storage in baskets (rather than overnight storage in sacks or selling fresh produce without overnight storage).
Produce preparation prior to sale
1−2 (a) Rinsing salad crops, vegetables and fruit with clean water.
2−3 (b) Washing salad crops, vegetables and fruit with running tap water.
1−3 (c) Removing the outer leaves on cabbages, lettuces, etc.
D. In-kitchen produce-preparation options
Produce disinfection 2−3 Washing salad crops, vegetables and fruit with an appropriate disinfectant solution and rinsing with clean water.
Produce peeling 2 Fruits, root crops.
Produce cooking 5−6 Option depends on local diet and preference for cooked food.
Sources: EPHC/NRMMC/AHMC 2006, WHO 2006b, Amoah et al. 2007b, Abaidoo et al. 2010, and Keraita et al. 2010. Note: this table is the same as Table 4.2; it is repoduced here for ease of reference.
120
Table A2.3 shows the QMRA-MC risk simulations given in the Guidelines for the consumption of wastewater-irrigated lettuce − but with one important difference: no pathogen die-off is assumed, so that the required total pathogen reduction is determined (i.e., from raw wastewater to ingestion). This was done since die-off is a post-treatment health-protection control measure which is more usefully determined separately, rather than being part of the risk analysis (as was done in the 2006 WHO Guidelines), so that an appropriate local selection of treatment and post-treatment control measures can be consciously made from Table A2.2.
In these risk simulations, as in those in the Guidelines, wastewater quality is expressed as a single-log range of E. coli per 100 mL − i.e., 10x−10x+1 [thus 107−108 per 100 mL represents raw wastewater, and 1−10 per 100 mL represents ‘Californian’ treated wastewater – i.e., ≤2.2 total coliforms per 100 mL (section A1.1)]. The risk simulations also incorporate a range of pathogen numbers per 105 E. coli (see section 4.2; cf. Shuval et al. 1997).
Table A2.3 shows that the tolerable rotavirus infection risk of 10−3 pppy is achieved when the wastewater quality has been reduced from 107−108 per 100 mL to 1−10 per 100 mL—i.e., a total pathogen reduction of 6 log units. This could be achieved, for example, by wastewater treatment (4 log units – as required for restricted irrigation, see below) and pathogen die-off (2 log units) (cf. Table A2.2). In Table A2.3 it is noteworthy that in all cases the Campylobacter and Cryptosporidium infection risks are lower than those for rotavirus.
The Guidelines also include a ‘reverse’ QMRA-MC method to determine the log unit pathogen reduction required for a given rotavirus infection risk (rather than determining the infection risk for a given wastewater quality), as shown in Table A2.4.

121
Table A2.3. Unrestricted irrigation: median infection risks from the consumption of wastewater-irrigated lettuce estimated by 10,000 Monte Carlo simulationsa
Wastewater quality
(E. coli per 100 mL)
Infection risk per person per year
Rotavirus Campylobacter Cryptosporidium
107−108 1 1 0.91
…
103−104 0.30 1.1 × 10⁻² 2.4 × 10⁻⁴
100−1000 3.4 × 10⁻² 1.1 × 10⁻³ 2.3 × 10⁻⁵
10−100 3.5 × 10⁻³ 1.1 × 10⁻⁴ 2.3 × 10⁻⁶
1−10 3.5 × 10⁻⁴ 1.1 × 10⁻⁵ 2.3 × 10⁻⁷
aAssumptions: 100 g lettuce eaten per person per 2 days; 10−15 mL wastewater remaining on 100 g lettuce after irrigation; 0.1−1 rotavirus and Campylobacter, and 0.01−0.1 Cryptosporidium oocyst, per 105 E. coli; no pathogen die-off; N50 = 6.7 ± 25% and α = 0.253 ± 25% for rotavirus; N50 = 896 ± 25% and α = 0.145 ± 25% for Campylobacter; r = 0.0042 ± 25% for Cryptosporidium.
Source: adapted from WHO 2006b.
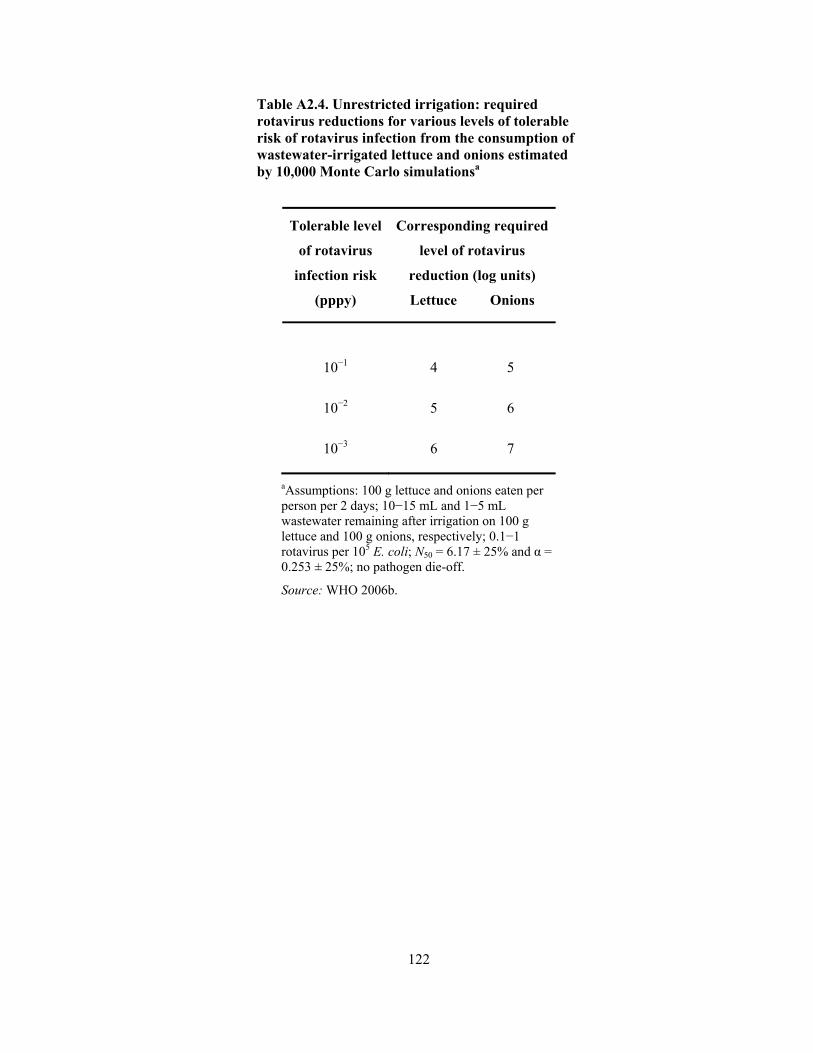
122
Table A2.4. Unrestricted irrigation: required rotavirus reductions for various levels of tolerable risk of rotavirus infection from the consumption of wastewater-irrigated lettuce and onions estimated by 10,000 Monte Carlo simulationsa
Tolerable level
of rotavirus
infection risk
(pppy)
Corresponding required
level of rotavirus
reduction (log units)
Lettuce Onions
10−1
4 5
10−2
5 6
10−3
6 7
aAssumptions: 100 g lettuce and onions eaten per person per 2 days; 10−15 mL and 1−5 mL wastewater remaining after irrigation on 100 g lettuce and 100 g onions, respectively; 0.1−1 rotavirus per 105 E. coli; N50 = 6.17 ± 25% and α = 0.253 ± 25%; no pathogen die-off.
Source: WHO 2006b.

123
QMRA applied to restricted irrigation
The exposure scenario for restricted irrigation used in the 2006 WHO Guidelines is the involuntary ingestion of soil particles by those working in wastewater-irrigated fields. This is a likely scenario as wastewater-saturated soil would contaminate the workers’ fingers and some pathogens could be transmitted to their mouths and hence ingested. The quantity of soil involuntarily ingested in this way has been reported (but not specifically for this restricted-irrigation scenario) as up to 100 mg per person per day of exposure (Haas et al. 1999, WHO 2001). Two ‘sub-scenarios’ were investigated: (a) highly mechanized agriculture and (b) labor-intensive agriculture – the former to represent exposure in industrialized countries where farm workers typically plough, sow and harvest using tractors and associated equipment and could be expected to wear gloves when working in wastewater-irrigated fields; and the latter to be representative of farming practices in developing countries in situations where tractors are not (or only rarely) used and gloves not worn. Table A2.5 gives the QMRA-MC risk determinations for labor-intensive agriculture, from which it can be seen that the tolerable rotavirus infection risk of 10−3 pppy is achieved by a 4-log unit pathogen reduction (from 107−108 E. coli per 100 g of soil to 103−104 per 100 g). This pathogen reduction has to be achieved by treatment as there is no other way of protecting the fieldworkers (and therefore this level of treatment, supplemented by some of the post-treatment health protection control measures detailed in Table A2.2, is also used for unrestricted irrigation).
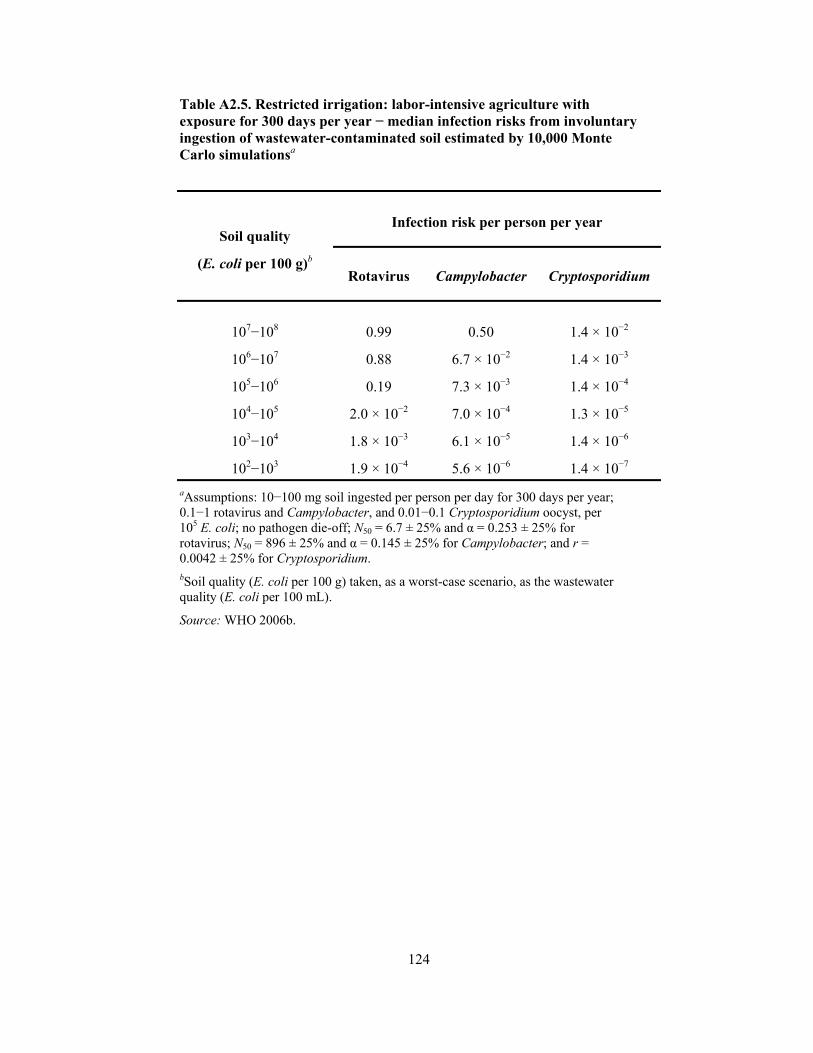
124
Table A2.5. Restricted irrigation: labor-intensive agriculture with exposure for 300 days per year − median infection risks from involuntary ingestion of wastewater-contaminated soil estimated by 10,000 Monte Carlo simulationsa
Soil quality
(E. coli per 100 g)b
Infection risk per person per year
Rotavirus Campylobacter Cryptosporidium
107−108 0.99 0.50 1.4 × 10⁻²
106−107 0.88 6.7 × 10⁻² 1.4 × 10⁻³
105−106 0.19 7.3 × 10⁻³ 1.4 × 10⁻⁴
104−105 2.0 × 10⁻² 7.0 × 10⁻⁴ 1.3 × 10⁻⁵
103−104 1.8 × 10⁻³ 6.1 × 10⁻⁵ 1.4 × 10⁻⁶
102−103 1.9 × 10⁻⁴ 5.6 × 10⁻⁶ 1.4 × 10⁻⁷
aAssumptions: 10−100 mg soil ingested per person per day for 300 days per year; 0.1−1 rotavirus and Campylobacter, and 0.01−0.1 Cryptosporidium oocyst, per 105 E. coli; no pathogen die-off; N50 = 6.7 ± 25% and α = 0.253 ± 25% for rotavirus; N50 = 896 ± 25% and α = 0.145 ± 25% for Campylobacter; and r = 0.0042 ± 25% for Cryptosporidium. bSoil quality (E. coli per 100 g) taken, as a worst-case scenario, as the wastewater quality (E. coli per 100 mL).
Source: WHO 2006b.
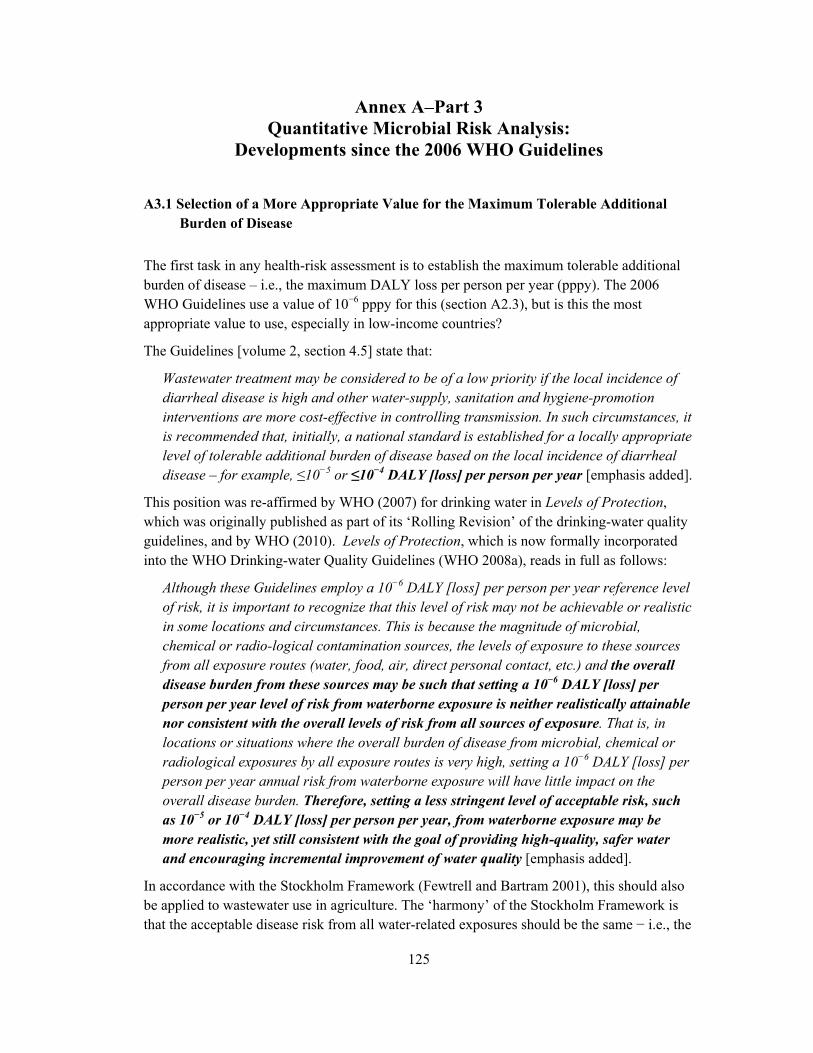
125
Annex A–Part 3 Quantitative Microbial Risk Analysis:
Developments since the 2006 WHO Guidelines
A3.1 Selection of a More Appropriate Value for the Maximum Tolerable Additional Burden of Disease
The first task in any health-risk assessment is to establish the maximum tolerable additional burden of disease – i.e., the maximum DALY loss per person per year (pppy). The 2006 WHO Guidelines use a value of 10−6 pppy for this (section A2.3), but is this the most appropriate value to use, especially in low-income countries?
The Guidelines [volume 2, section 4.5] state that:
Wastewater treatment may be considered to be of a low priority if the local incidence of diarrheal disease is high and other water-supply, sanitation and hygiene-promotion interventions are more cost-effective in controlling transmission. In such circumstances, it is recommended that, initially, a national standard is established for a locally appropriate level of tolerable additional burden of disease based on the local incidence of diarrheal disease – for example, ≤10−5 or ≤10−4 DALY [loss] per person per year [emphasis added].
This position was re-affirmed by WHO (2007) for drinking water in Levels of Protection, which was originally published as part of its ‘Rolling Revision’ of the drinking-water quality guidelines, and by WHO (2010). Levels of Protection, which is now formally incorporated into the WHO Drinking-water Quality Guidelines (WHO 2008a), reads in full as follows:
Although these Guidelines employ a 10−6 DALY [loss] per person per year reference level of risk, it is important to recognize that this level of risk may not be achievable or realistic in some locations and circumstances. This is because the magnitude of microbial, chemical or radio-logical contamination sources, the levels of exposure to these sources from all exposure routes (water, food, air, direct personal contact, etc.) and the overall disease burden from these sources may be such that setting a 10−6 DALY [loss] per person per year level of risk from waterborne exposure is neither realistically attainable nor consistent with the overall levels of risk from all sources of exposure. That is, in locations or situations where the overall burden of disease from microbial, chemical or radiological exposures by all exposure routes is very high, setting a 10−6 DALY [loss] per person per year annual risk from waterborne exposure will have little impact on the overall disease burden. Therefore, setting a less stringent level of acceptable risk, such as 10−5 or 10−4 DALY [loss] per person per year, from waterborne exposure may be more realistic, yet still consistent with the goal of providing high-quality, safer water and encouraging incremental improvement of water quality [emphasis added].
In accordance with the Stockholm Framework (Fewtrell and Bartram 2001), this should also be applied to wastewater use in agriculture. The ‘harmony’ of the Stockholm Framework is that the acceptable disease risk from all water-related exposures should be the same − i.e., the

126
tolerable additional burdens of disease from, for example, drinking fully-treated drinking water, from working in wastewater-irrigated fields, and from consuming wastewater-irrigated crops. Therefore, if a DALY loss of ≤10−x pppy is acceptable for drinking fully-treated drinking water, then it is also acceptable for working in wastewater-irrigated fields and consuming wastewater-irrigated foods eaten uncooked.
This is really the key to the adoption of the 2006 Guidelines in developing countries since setting a tolerable maximum additional burden of disease of 10−4 DALY loss pppy, for example, means that the design disease risk and the design infection risk are both 2-log units higher, and the required pathogen reductions 2 log units lower, than for the 10−6 DALY loss pppy adopted as the ‘default’ value in the 2006 WHO Guidelines. However, it has to be decided whether a maximum tolerable additional DALY loss of 10−4 pppy acceptable or not.
Reasons in favor of a maximum tolerable additional DALY loss of 10−4 pppy
1. The reason why the 2006 Guidelines use this value of 10−6 DALY loss pppy is because, as noted in section A2.3, it is used in the third edition of the WHO Drinking-water Quality Guidelines (WHO, 2004, 2008a) since it corresponds very closely to the fatal waterborne 70-year lifetime cancer risk of 10−5 per person accepted by US EPA (Munro and Travis 1986). This 70-year risk of 10−5 per person is equivalent to an annual risk of 1.4 × 10⁻⁷ per person. Whether this is a reasonable level of acceptable risk can only be judged by knowing how many Americans die each year from cancer. Horner et al. (2009, Table 2.5) give the 2006 age•adjusted mortality rate from all causes of cancer for both sexes and all races as 181.07 per 100,000 population – i.e., an incidence of 1.8 × 10⁻³ pppy. Thus the fatal waterborne‐cancer risk of 1.4 × 10⁻⁷ pppy is four orders of magnitude lower than the actual fatal all•cancer incidence of 1.8 × 10⁻³ pppy.
A DALY loss of 10−4 pppy would be equivalent to a fatal waterborne lifetime cancer risk of 10−3 per person and thus to an annual risk of ~10−5 per person. This is two orders of magnitude lower than the actual fatal all•cancer incidence of ~10−3 pppy – i.e., an additional DALY loss of 10−4 pppy would increase this by only ~1%.
2. The current global incidence of diarrheal disease is extremely high: in order-of-magnitude terms it is 0.1−1 pppy (Table A3.1; see also Kosek et al. 2003). A tolerable diarrheal disease risk of 10−2 pppy, equivalent to a 10−4 DALY loss pppy, is 1−2 orders of magnitude lower than the current diarrheal-disease incidence. For an individual it is equivalent to an additional episode of diarrheal disease once every 100 years (essentially once per lifetime), which is hardly a matter of significant public health concern − see also Haas (1996, 8) who comments on US EPA’s use of a waterborne-disease risk of 10−4 pppy as follows:
It is becoming apparent that some key factors used for computing the 1:10,000 level of acceptable risk may not be correct. … the total burden of waterborne illness associated with current water treatment practice in the Ubnited States may be as high as several million cases per year. This would translate to an annual illness rate of perhaps 1:100, suggesting that the current benchmark [of 1:10,000] may be far too stringent.
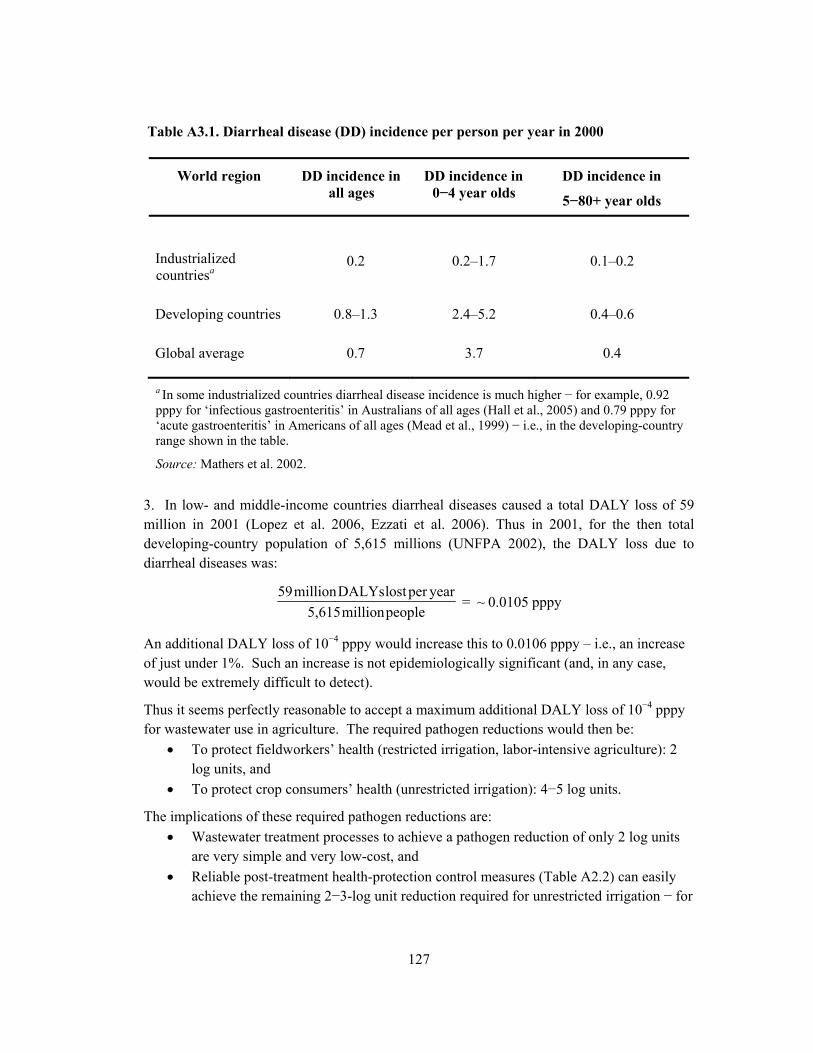
127
Table A3.1. Diarrheal disease (DD) incidence per person per year in 2000
World region DD incidence in all ages
DD incidence in 0−4 year olds
DD incidence in
5−80+ year olds
Industrialized countriesa
0.2
0.2–1.7
0.1–0.2
Developing countries
0.8–1.3 2.4–5.2 0.4–0.6
Global average
0.7 3.7 0.4
a In some industrialized countries diarrheal disease incidence is much higher − for example, 0.92 pppy for ‘infectious gastroenteritis’ in Australians of all ages (Hall et al., 2005) and 0.79 pppy for ‘acute gastroenteritis’ in Americans of all ages (Mead et al., 1999) − i.e., in the developing-country range shown in the table.
Source: Mathers et al. 2002.
3. In low- and middle-income countries diarrheal diseases caused a total DALY loss of 59 million in 2001 (Lopez et al. 2006, Ezzati et al. 2006). Thus in 2001, for the then total developing-country population of 5,615 millions (UNFPA 2002), the DALY loss due to diarrheal diseases was:
pppy0105.0~=peoplemillion5,615
yearperlostDALYsmillion59
An additional DALY loss of 10−4 pppy would increase this to 0.0106 pppy – i.e., an increase of just under 1%. Such an increase is not epidemiologically significant (and, in any case, would be extremely difficult to detect).
Thus it seems perfectly reasonable to accept a maximum additional DALY loss of 10−4 pppy for wastewater use in agriculture. The required pathogen reductions would then be:
To protect fieldworkers’ health (restricted irrigation, labor-intensive agriculture): 2 log units, and
To protect crop consumers’ health (unrestricted irrigation): 4−5 log units.
The implications of these required pathogen reductions are:
Wastewater treatment processes to achieve a pathogen reduction of only 2 log units are very simple and very low-cost, and
Reliable post-treatment health-protection control measures (Table A2.2) can easily achieve the remaining 2−3-log unit reduction required for unrestricted irrigation − for
128
example, pathogen die-off (which can be expected to achieve a reduction of at least 2 log units in warm climates) and produce washing in clean water (1 log unit).
A3.2 Improved Method for Estimating Annual Infection Risks
Since the publication of the Guidelines, an improved method of estimating annual infection risks from QMRA-MC simulations has been developed by Karavarsamis and Hamilton (2010), as follows:
1. Using the appropriate dose-response equation (section A2.1) in an appropriate QMRA-Monte Carlo computer program, an estimate of median annual infection risk is determined by a Monte Carlo simulation in which the number of iterations is set equal to the number of days of exposure per year.
2. This is repeated 9,999 times, so that there are 10,000 estimates of median annual infection risk.
3. The median and 95-percentile values of these 10,000 estimates are then calculated in order to provide a much more robust estimate of median and 95-percentile annual infection risks.
Thus the program determines 10,000 estimates of median annual risk based on what happens in any one year of exposure (i.e., n exposures to a pathogen dose d), rather than (as in the procedure used in the Guidelines) a much less robust estimate of median annual risk determined from 10,000 estimates of annual risk based on what happens on any one day of exposure. This approach results in similar values for estimates of median annual risks, but much lower estimates for 95-percentile annual risks, and there is less ‘spread’ of results (Table A3.2).

129
Table A3.2. Unrestricted irrigation: comparison of the Karavarsamis-Hamilton method and the method used in the WHO Guidelines for estimating annual rotavirus infection risks from the consumption of wastewater-irrigated lettuce by 10,000 Monte Carlo simulations a
Wastewater quality
(E. coli numbers per 100 mL)
Rotavirus infection risk pppy estimated by
the method of Karavarsamis and Hamilton (2010)
Rotavirus infection risk pppy estimated by
the method used in the 2006 WHO
Guidelines
103−104 Median risk: 0.36 0.30
95%-ile risk: 0.39 0.71
Minimum:b 0.30 1.1 × 10⁻²
Maximum:b
0.44 0.97
100−1000 Median risk: 4.5 × 10⁻² 3.5 × 10⁻²
95%-ile risk: 4.9 × 10⁻² 0.11
Minimum: 3.5 × 10⁻² 1.0 × 10⁻³
Maximum:
5.5 × 10⁻² 0.27
10−100 Median risk: 4.6 × 10⁻³ 3.5 × 10⁻³
95%-ile risk: 5.0 × 10⁻³ 1.2 × 10⁻²
Minimum: 3.5 × 10⁻³ 9.5 × 10⁻⁵
Maximum:
5.7 × 10⁻³ 3.0 × 10⁻²
aAssumptions: 100 g lettuce eaten per person per 2 days; 10−15 mL wastewater remaining on 100 g lettuce after irrigation; 0.1−1 rotavirus per 105 E. coli; no pathogen die-off; N50 = 6.7 ± 25% and α = 0.253 ± 25%. bThe lowest and highest values of the 10,000 risk simulations.
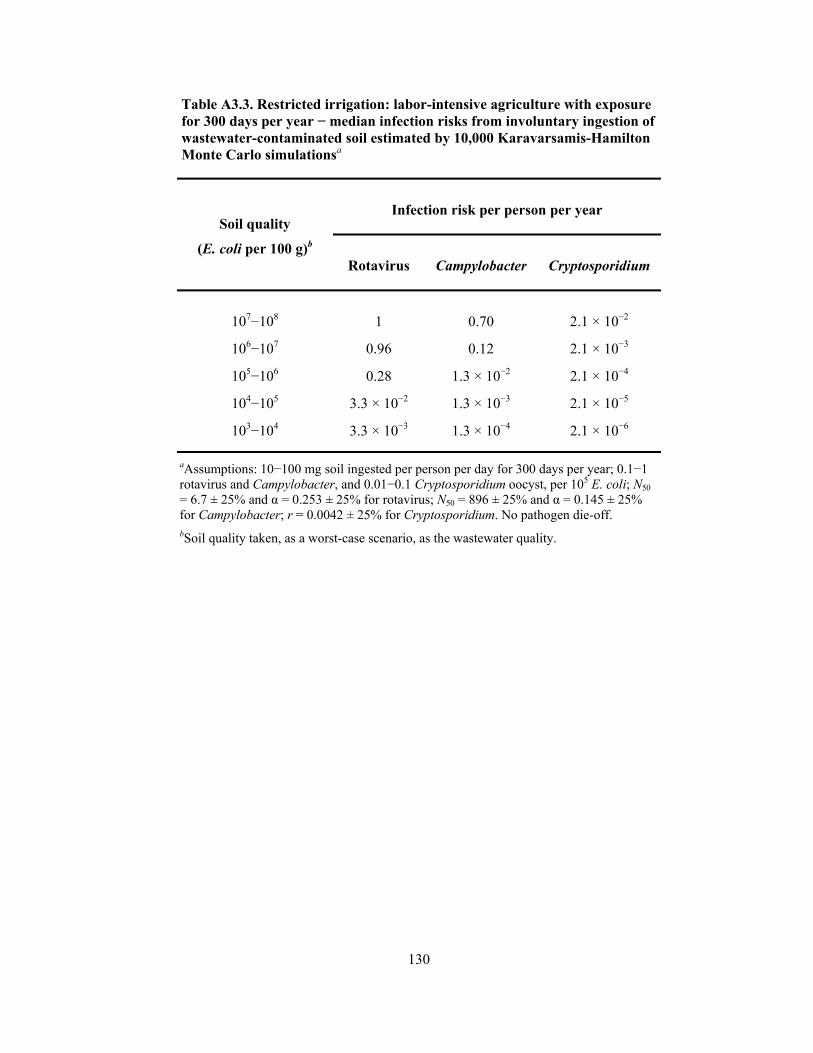
130
Table A3.3. Restricted irrigation: labor-intensive agriculture with exposure for 300 days per year − median infection risks from involuntary ingestion of wastewater-contaminated soil estimated by 10,000 Karavarsamis-Hamilton Monte Carlo simulationsa
Soil quality
(E. coli per 100 g)b
Infection risk per person per year
Rotavirus Campylobacter Cryptosporidium
107−108 1 0.70 2.1 × 10⁻²
106−107 0.96 0.12 2.1 × 10⁻³
105−106 0.28 1.3 × 10⁻² 2.1 × 10⁻⁴
104−105 3.3 × 10⁻² 1.3 × 10⁻³ 2.1 × 10⁻⁵
103−104
3.3 × 10⁻³ 1.3 × 10⁻⁴ 2.1 × 10⁻⁶
aAssumptions: 10−100 mg soil ingested per person per day for 300 days per year; 0.1−1 rotavirus and Campylobacter, and 0.01−0.1 Cryptosporidium oocyst, per 105 E. coli; N50 = 6.7 ± 25% and α = 0.253 ± 25% for rotavirus; N50 = 896 ± 25% and α = 0.145 ± 25% for Campylobacter; r = 0.0042 ± 25% for Cryptosporidium. No pathogen die-off. bSoil quality taken, as a worst-case scenario, as the wastewater quality.
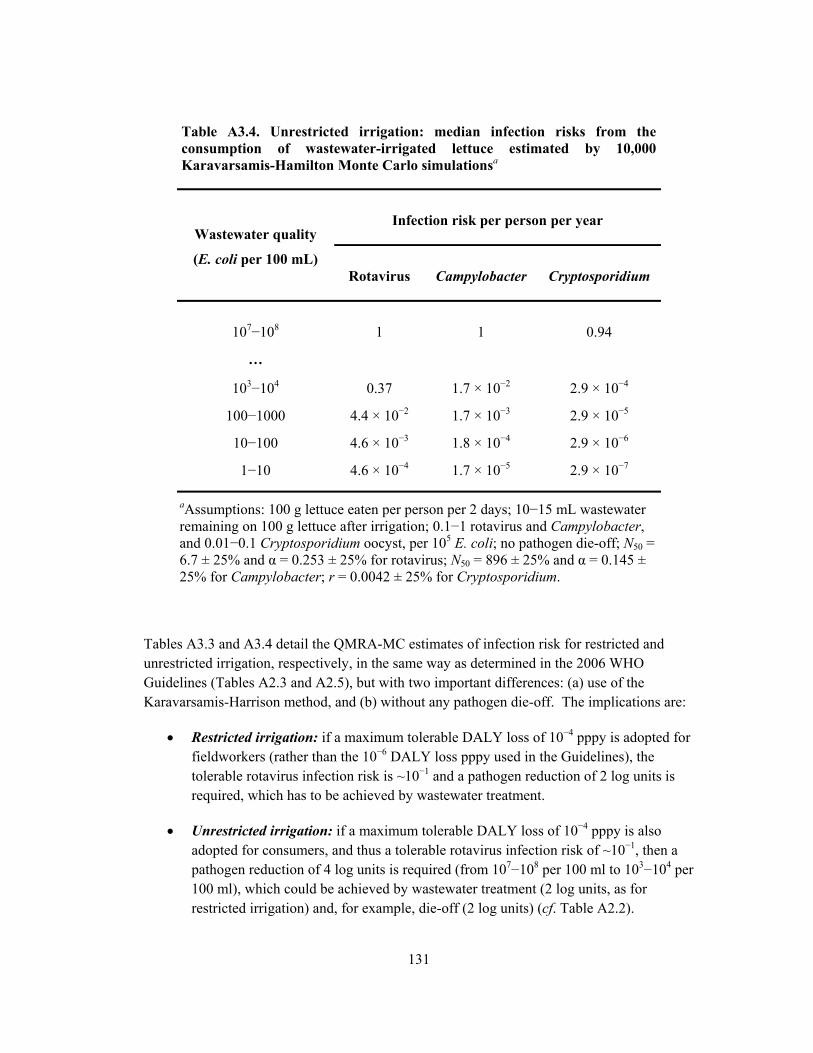
131
Table A3.4. Unrestricted irrigation: median infection risks from the consumption of wastewater-irrigated lettuce estimated by 10,000 Karavarsamis-Hamilton Monte Carlo simulationsa
Wastewater quality
(E. coli per 100 mL)
Infection risk per person per year
Rotavirus Campylobacter Cryptosporidium
107−108 1 1 0.94
…
103−104 0.37 1.7 × 10⁻² 2.9 × 10⁻⁴
100−1000 4.4 × 10⁻² 1.7 × 10⁻³ 2.9 × 10⁻⁵
10−100 4.6 × 10⁻³ 1.8 × 10⁻⁴ 2.9 × 10⁻⁶
1−10
4.6 × 10⁻⁴ 1.7 × 10⁻⁵ 2.9 × 10⁻⁷
aAssumptions: 100 g lettuce eaten per person per 2 days; 10−15 mL wastewater remaining on 100 g lettuce after irrigation; 0.1−1 rotavirus and Campylobacter, and 0.01−0.1 Cryptosporidium oocyst, per 105 E. coli; no pathogen die-off; N50 = 6.7 ± 25% and α = 0.253 ± 25% for rotavirus; N50 = 896 ± 25% and α = 0.145 ± 25% for Campylobacter; r = 0.0042 ± 25% for Cryptosporidium.
Tables A3.3 and A3.4 detail the QMRA-MC estimates of infection risk for restricted and unrestricted irrigation, respectively, in the same way as determined in the 2006 WHO Guidelines (Tables A2.3 and A2.5), but with two important differences: (a) use of the Karavarsamis-Harrison method, and (b) without any pathogen die-off. The implications are:
Restricted irrigation: if a maximum tolerable DALY loss of 10−4 pppy is adopted for fieldworkers (rather than the 10−6 DALY loss pppy used in the Guidelines), the tolerable rotavirus infection risk is ~10−1 and a pathogen reduction of 2 log units is required, which has to be achieved by wastewater treatment.
Unrestricted irrigation: if a maximum tolerable DALY loss of 10−4 pppy is also adopted for consumers, and thus a tolerable rotavirus infection risk of ~10−1, then a pathogen reduction of 4 log units is required (from 107−108 per 100 ml to 103−104 per 100 ml), which could be achieved by wastewater treatment (2 log units, as for restricted irrigation) and, for example, die-off (2 log units) (cf. Table A2.2).
132
A3.3. Unrestricted Irrigation: Norovirus Infection Risks
Recently it has become possible to use QMRA-Monte Carlo techniques to estimate norovirus infection risks (Mara and Sleigh 2010a,c). The dose-response data needed to do this were only published in 2008 (Teunis et al. 2008), so it was not possible for norovirus to have been considered in the 2006 WHO Guidelines.
Norovirus (NV, formerly called Norwalk or Norwalk-like virus) is the major viral pathogen causing diarrheal disease in adults − in contrast rotavirus mainly affects children under 5, and commonly under 2, years of age, although NV does cause diarrhea in children (Patel et al. 2008). It is therefore a better reference viral pathogen than rotavirus for wastewater-use studies as young children are less exposed than adults, either as field-workers (although they may play in wastewater-irrigated fields while their mothers work in them) or as consumers (children under 2, especially, eat little wastewater-irrigated foods). That norovirus is a more suitable reference viral pathogen than rotavirus is illustrated by the fact that in the USA during 1998−2007 there were 1,773 confirmed foodborne norovirus outbreaks, but only 4 confirmed foodborne rotavirus outbreaks (CDC 2009).
Using a DALY loss per case of 9 × 10⁻⁴ per case of NV disease (Kemmeren et al. 2006) and an NV disease/infection ratio of 0.8 (Moe 2009), the tolerable NV disease and infection risks corresponding to a tolerable DALY loss of 10−4 pppy are:
pppy11.0=10×9
10=
diseaseNVofcaseperlossDALY
pppylossDALYTolerable=riskdiseaseNVTolerable 4-
4-
pppy14.0=8.0
11.0=
ratioection isease/infdNV
pppyriskdiseaseNVTolerable=riskinfectionNVTolerable
The NV dose-response dataset of Teunis et al. (2008) was used in place of the beta-Poisson equation in the QMRA-MC computer program developed to determine median NV infection risks pppy. The resulting estimates of median risk obtained, using the same assumptions as for the index pathogens in Table A3.4, are given in Table A3.5, which shows that a reduction of 4 log units results in an NV infection risk of 0.25 pppy, which is only marginally higher than the tolerable NV infection risk of 0.14 pppy determined above. Table A3.5 also includes, for comparison, rotavirus infection risks – these are broadly similar to the norovirus infection risks.
133
Lettuce consumption in urban Ghana: norovirus infection risks
Exposure to wastewater pathogens present in wastewater-irrigated foods varies with differences in consumption patterns which need to be accounted for in the risk calculations. For example, Seidu et al. (2008) reported that people in urban Ghana commonly consume ~10−12 g of lettuce in ready-to-eat street-vended food on each of four days per week.37 NV infection risks for a DALY loss of 10−4 pppy and for this Ghanaian consumption of lettuce were determined by 10,000 Karavarsamis-Hamilton Monte Carlo simulations for various wastewater qualities (Table A3.6). A 3-log unit NV reduction achieves an NV infection risk of 0.3 pppy, which is a little higher than the tolerable NV infection risk of 0.13 pppy. However, a 4-log unit reduction is feasible as it could be simply achieved by treatment (1 log unit) and produce disinfection (3 log unit) (cf. Table A2.2).
Parameters used in QMRA risk simulations
Table A3.7 lists the parameters used in QMRA risk simulations and gives recommendations for the ranges to be used for each.
37 This refers to a specific situation in one developing country and may or may not be representative of what happens elsewhere; however, it is much less than the 100 g of lettuce consumed on alternate days used by Shuval et al. (1997) to reflect the situation in Israel (this value of 100 g per 2 days was also used in the 2006 WHO Guidelines).
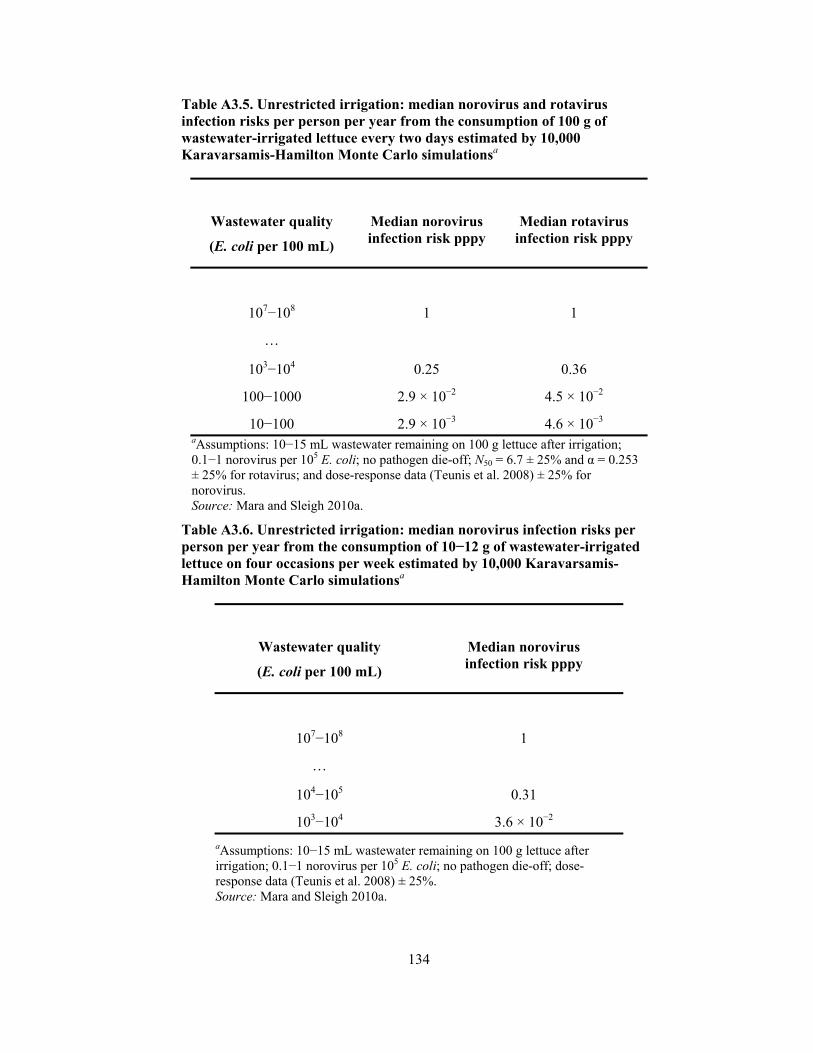
134
Table A3.5. Unrestricted irrigation: median norovirus and rotavirus infection risks per person per year from the consumption of 100 g of wastewater-irrigated lettuce every two days estimated by 10,000 Karavarsamis-Hamilton Monte Carlo simulationsa
Wastewater quality
(E. coli per 100 mL)
Median norovirus infection risk pppy
Median rotavirus infection risk pppy
107−108
1
1
…
103−104 0.25 0.36
100−1000 2.9 × 10⁻² 4.5 × 10⁻²
10−100 2.9 × 10⁻³ 4.6 × 10⁻³ aAssumptions: 10−15 mL wastewater remaining on 100 g lettuce after irrigation; 0.1−1 norovirus per 105 E. coli; no pathogen die-off; N50 = 6.7 ± 25% and α = 0.253 ± 25% for rotavirus; and dose-response data (Teunis et al. 2008) ± 25% for norovirus. Source: Mara and Sleigh 2010a.
Table A3.6. Unrestricted irrigation: median norovirus infection risks per person per year from the consumption of 10−12 g of wastewater-irrigated lettuce on four occasions per week estimated by 10,000 Karavarsamis-Hamilton Monte Carlo simulationsa
Wastewater quality
(E. coli per 100 mL)
Median norovirus infection risk pppy
107−108
1
…
104−105 0.31
103−104 3.6 × 10⁻²
aAssumptions: 10−15 mL wastewater remaining on 100 g lettuce after irrigation; 0.1−1 norovirus per 105 E. coli; no pathogen die-off; dose-response data (Teunis et al. 2008) ± 25%. Source: Mara and Sleigh 2010a.

135
Table A3.7. Parameters used in QMRA-MC risk simulations
Parameter Units Notes
E. coli (or fecal coliform) count in wastewater (unrestricted irrigation) or in soil (restricted irrigation)
per 100 mL or per 100 g
Run the QMRA-MC program for single-log ranges (10x−10x+1)—e.g., for unrestricted irrigation, from 107−108 (raw wastewater) to 1−10 (“Californian” treated wastewater)
Number of noroviruses per 105 E. coli
n.a. Typical range: 0.1−1.
Wastewater remaining on 100 g crop after irrigation (unrestricted irrigation)
mL Value depends on crop – e.g., 10−15 mL for lettuce, 1−5 mL for onionsa
Quantity of crop consumed per person (unrestricted irrigation)
g per exposure
event
Use local valuesb
Quantity of soil ingested per person (restricted irrigation)
mg per day Use, for example, 10−100 mg per day for labor-intensive agriculture, and 1−10 mg per day for highly mechanized agriculture
Exposure (every n days for unrestricted irrigation, or n days per year for restricted irrigation)
n.a. For unrestricted irrigation this could be a fixed value—e.g., 2 days, as used by Shuval et al. (1997), or a range—e.g., 3−5 days for someone who eats a sandwich on 3−5 days per week.
Pathogen reduction factor [die-off]
log units Set range to 0−0 for die-off to be excluded from QMRA-MC risk simulations.
Disease/infection ratio n.a Set range to 1−1 for infection risk to equal disease risk (i.e., to determine norovirus infection risks).
Variation of dose-response data from value in dataset
±% Commonly ±25%. This allows for some uncertainty in the dose-response dataset.
Number of simulations in each QMRA-MC run
n.a. Usually 10,000 or 1000.
aShuval et al. 1997 found mean values of 10.8 mL per 100 g lettuce and 0.4 mL per 100 g cucumbers. Hamilton 2005 (quoted in EPHC/NRMMC/AHMC 2006) reported mean values of 3.3–8.9 mL per 100 g cabbages (three types) and 1.9 mL per 100 g broccoli. bShuval et al. 1997 used a fixed value of 100 g in Israel; Seidu et al. 2008 used a range of 10−12 g in Ghana.

136
A3.4. Unrestricted Irrigation: Ascaris Infection Risks
Ascaris lumbricoides parasitizes ~1.2 billion people in developing countries (de Silva et al. 2003). Female Ascaris worms produce ~200,000 eggs per day and, although most Ascaris eggs only survive for a few weeks on crop surfaces, some remain viable for several months and so represent a risk to health when they are ingested with wastewater-irrigated foods eaten uncooked (Strauss 1985). It would be very useful to be able to quantify Ascaris risks as its properties (pathogenicity, development and survival in the environment) are very different from those of viral and bacterial pathogens, despite it having an overall feco-oral environmental transmission route.
Ascaris dose-response data were published only in 2009 (Navarro et al. 2009), so it was not possible to have used Ascaris as a reference helminthic pathogen in the 2006 WHO Guidelines. Even though the 2006 WHO guideline value for helminth eggs of ≤1 egg per liter of treated wastewater is based on epidemiological data, it is nevertheless very useful to be able to determine required log unit reductions of Ascaris (which is generally the commonest helminth and the eggs of which are able to survive for very long periods of time in the environment) by QMRA and thus to split these between wastewater treatment and post-treatment health-protection control measures (Table A2.2), as is done for viral, bacterial and protozoan pathogens, since this allows a lower level of wastewater treatment.
For a tolerable DALY loss of 10–4 pppy, a DALY loss per case of ascariasis of 8.25 × 10⁻³ (Chan 1997) and, as a worst-case scenario, an Ascaris disease/infection ratio of 1 (i.e., all those infected with Ascaris develop ascariasis), the tolerable Ascaris infection risk is given by:
pppy102.11025.8
10
ascariasisofcaseperlossDALY
pppylossDALYTolerable 23
4
Median Ascaris infection risks pppy from the consumption by children under 15 of raw carrots irrigated with wastewaters containing specified numbers of Ascaris eggs were determined by a QMRA-Monte Carlo computer program based on the Karavarsamis-Hamilton method and using the values of N50 and α determined by Navarro et al. (2009) for the beta-Poisson equation (these authors found that the beta-Poisson equation was better for Ascaris than the exponential equation). The resulting estimates of median Ascaris infection risk are given in Table A3.8, which shows that 1 egg per litre results in an Ascaris infection risk of ~6 × 10⁻³ pppy, which is just below the tolerable Ascaris infection risk of ~10−2 pppy determined above. Thus, in ascariasis-hyperendemic areas (~1000 eggs per litre of raw wastewater) a 3-log unit reduction of Ascaris eggs is required. This could be achieved, for example, by a 1-log unit reduction by treatment and a 2-log unit reduction by produce peeling (cf. Table A2.2).
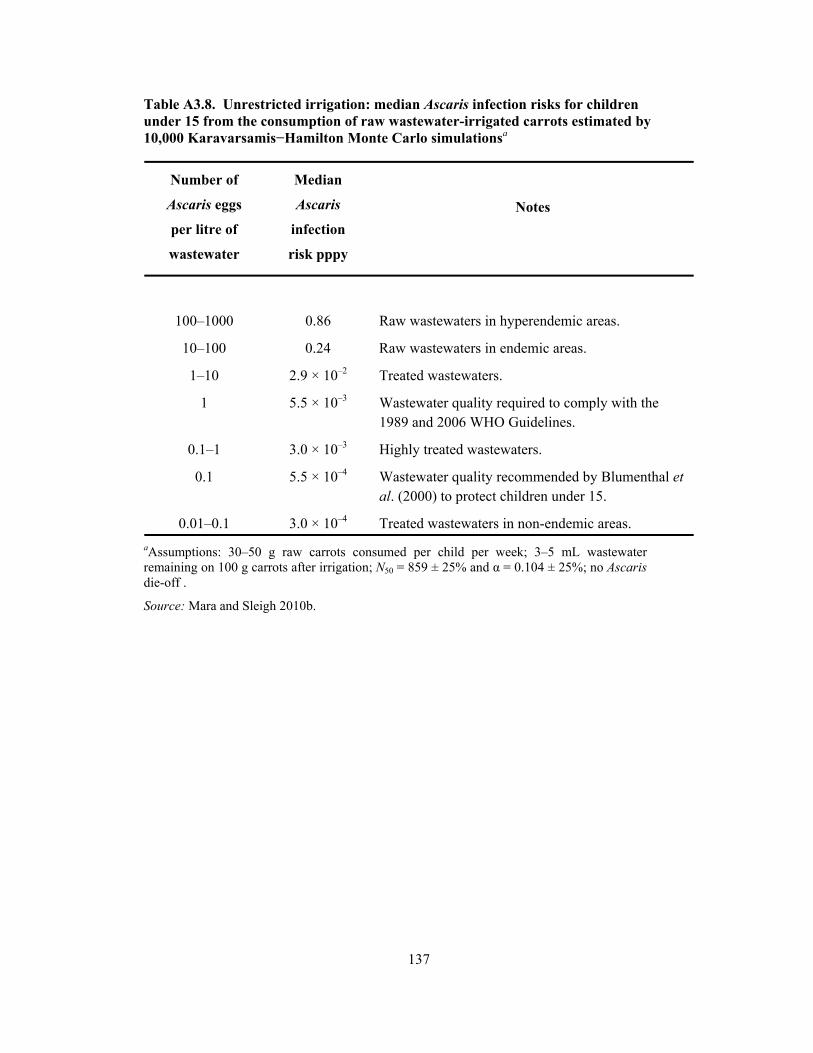
137
Table A3.8. Unrestricted irrigation: median Ascaris infection risks for children under 15 from the consumption of raw wastewater-irrigated carrots estimated by 10,000 Karavarsamis−Hamilton Monte Carlo simulationsa
Number of
Ascaris eggs
per litre of
wastewater
Median
Ascaris
infection
risk pppy
Notes
100–1000
0.86
Raw wastewaters in hyperendemic areas.
10–100 0.24 Raw wastewaters in endemic areas.
1–10 2.9 × 10⁻² Treated wastewaters.
1 5.5 × 10⁻³ Wastewater quality required to comply with the 1989 and 2006 WHO Guidelines.
0.1–1 3.0 × 10⁻³ Highly treated wastewaters.
0.1 5.5 × 10⁻⁴ Wastewater quality recommended by Blumenthal et al. (2000) to protect children under 15.
0.01–0.1 3.0 × 10⁻⁴ Treated wastewaters in non-endemic areas.
aAssumptions: 30–50 g raw carrots consumed per child per week; 3–5 mL wastewater remaining on 100 g carrots after irrigation; N50 = 859 ± 25% and α = 0.104 ± 25%; no Ascaris die-off .
Source: Mara and Sleigh 2010b.
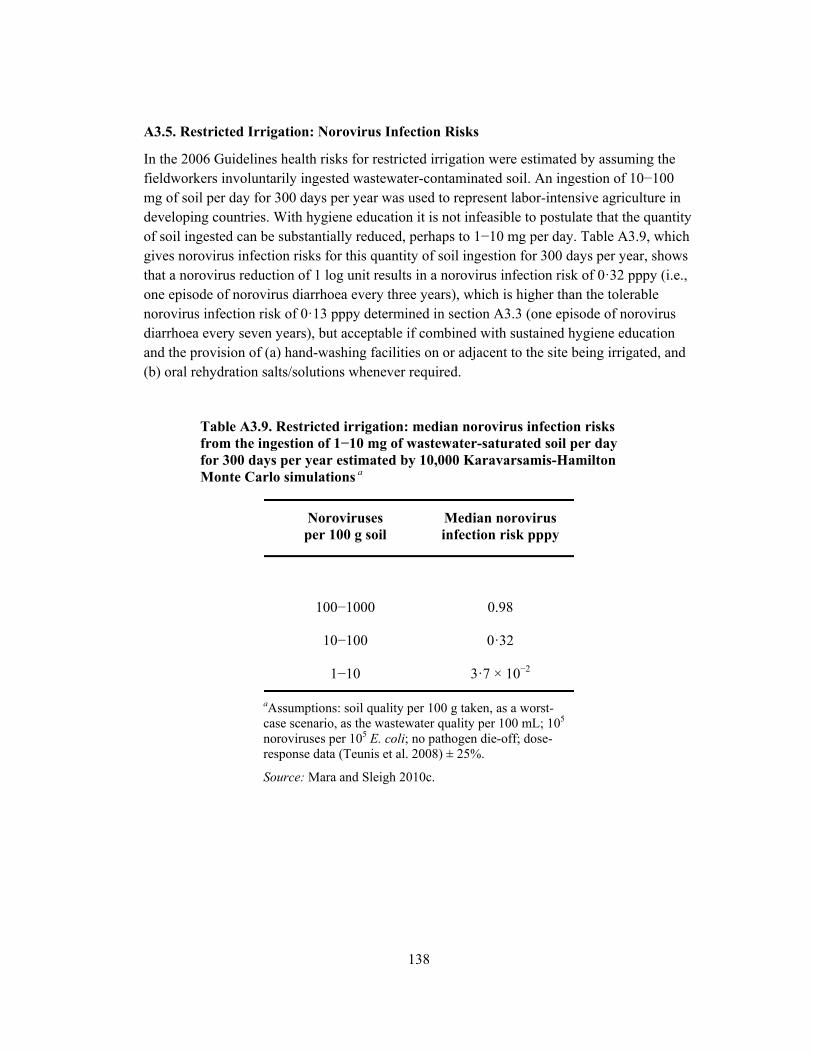
138
A3.5. Restricted Irrigation: Norovirus Infection Risks
In the 2006 Guidelines health risks for restricted irrigation were estimated by assuming the fieldworkers involuntarily ingested wastewater-contaminated soil. An ingestion of 10−100 mg of soil per day for 300 days per year was used to represent labor-intensive agriculture in developing countries. With hygiene education it is not infeasible to postulate that the quantity of soil ingested can be substantially reduced, perhaps to 1−10 mg per day. Table A3.9, which gives norovirus infection risks for this quantity of soil ingestion for 300 days per year, shows that a norovirus reduction of 1 log unit results in a norovirus infection risk of 0·32 pppy (i.e., one episode of norovirus diarrhoea every three years), which is higher than the tolerable norovirus infection risk of 0·13 pppy determined in section A3.3 (one episode of norovirus diarrhoea every seven years), but acceptable if combined with sustained hygiene education and the provision of (a) hand-washing facilities on or adjacent to the site being irrigated, and (b) oral rehydration salts/solutions whenever required.
Table A3.9. Restricted irrigation: median norovirus infection risks from the ingestion of 1−10 mg of wastewater-saturated soil per day for 300 days per year estimated by 10,000 Karavarsamis-Hamilton Monte Carlo simulations a
Noroviruses per 100 g soil
Median norovirus infection risk pppy
100−1000
0.98
10−100 0·32
1−10 3·7 × 10−2
aAssumptions: soil quality per 100 g taken, as a worst-case scenario, as the wastewater quality per 100 mL; 105 noroviruses per 105 E. coli; no pathogen die-off; dose-response data (Teunis et al. 2008) ± 25%.
Source: Mara and Sleigh 2010c.
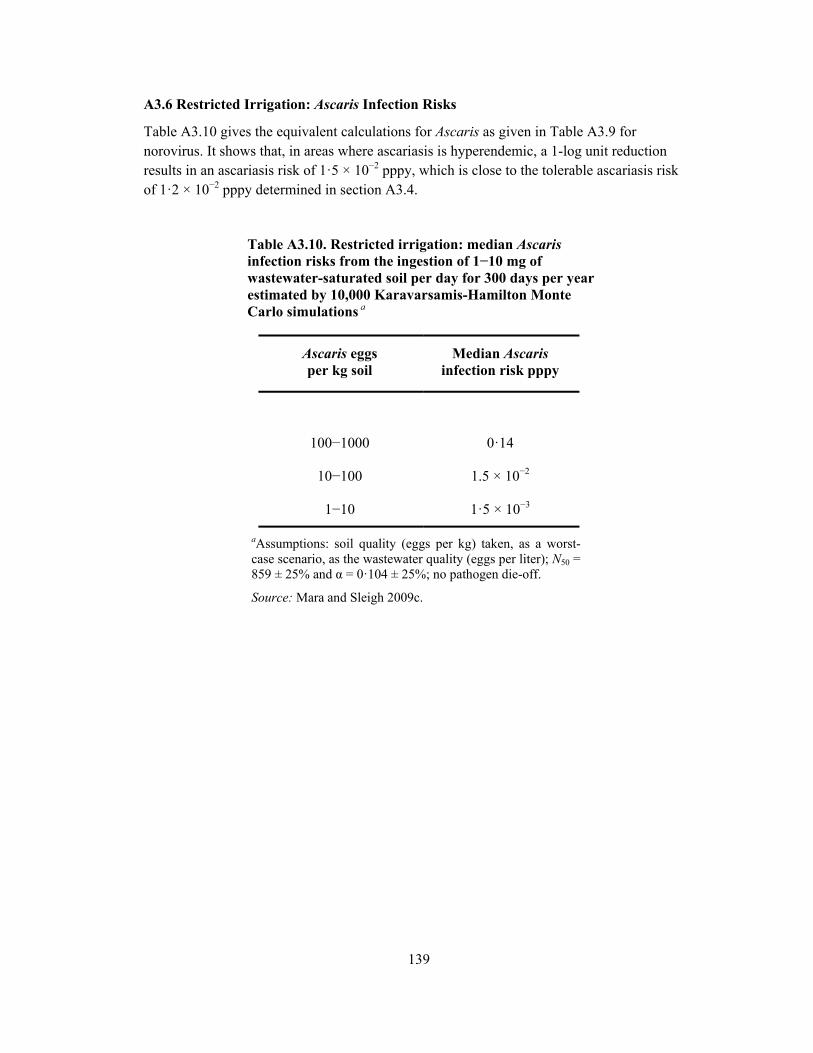
139
A3.6 Restricted Irrigation: Ascaris Infection Risks
Table A3.10 gives the equivalent calculations for Ascaris as given in Table A3.9 for norovirus. It shows that, in areas where ascariasis is hyperendemic, a 1-log unit reduction results in an ascariasis risk of 1·5 × 10−2 pppy, which is close to the tolerable ascariasis risk of 1·2 × 10−2 pppy determined in section A3.4.
Table A3.10. Restricted irrigation: median Ascaris infection risks from the ingestion of 1−10 mg of wastewater-saturated soil per day for 300 days per year estimated by 10,000 Karavarsamis-Hamilton Monte Carlo simulations a
Ascaris eggs per kg soil
Median Ascaris infection risk pppy
100−1000
0·14
10−100 1.5 × 10⁻²
1−10 1·5 × 10−3
aAssumptions: soil quality (eggs per kg) taken, as a worst-case scenario, as the wastewater quality (eggs per liter); N50 = 859 ± 25% and α = 0·104 ± 25%; no pathogen die-off.
Source: Mara and Sleigh 2009c.
140
Availability of QMRA-MC computer programs
All the QMRA-Monte Carlo computer programs referred to in this Annex are freely available, together with User Guides, at:
http://www.personal.leeds.ac.uk/~cen6ddm/QMRA.html
All these programs, with the exception of the one for Ascaris, use a range of pathogen-to-E. coli numbers − for example, 0.1−1 pathogen per 105 E. coli. This approach was taken by Shuval et al. (1997) and adopted in the 2006 WHO Guidelines, as there are very few, and in many situations no, data on pathogen numbers in developing-country wastewaters, whereas E. coli (or fecal coliform) numbers are available or, if not available, are easy to obtain. However, setting the range of pathogen numbers to 105−105 per 105 E. coli in the QMRA-MC programs (i.e., equating pathogen and E. coli numbers) means that the programs would determine pathogen risks directly (as done, in Table A3.9 for norovirus), rather than as a range of E. coli numbers per 100 mL.
A “QMRA Beginner’s Guide” is available at:
http://www.personal.leeds.ac.uk/~cen6ddm/QMRAbeginners.html

141
Annex A–Part 4 Verification Monitoring of Pathogen Reductions Achieved by
Wastewater Treatment and Health-protection Control Measures
A4.1 Wastewater Treatment
It is not generally possible in developing countries, nor in most non-research situations in industrialized countries, to undertake routine monitoring of viral, bacterial and protozoan pathogens in treatment-plant effluents. Recourse has to be made to the use of indicator bacteria, typically fecal coliforms (section A4.2).
Helminth eggs can be counted in raw and treated wastewaters, although the enumeration technique is not straightforward. If waste stabilization ponds are used for wastewater treatment, then the mean hydraulic retention time in the ponds can be used to calculate egg removal efficiencies (section A4.3).
A4.1.1 Indicator bacteria
Fecal coliforms are the most commonly used indicator bacteria, and they are very easy to count using a very simple 5-tube most-probable-number (MPN) technique – full details of how to conduct this test are given in Ayres and Mara (1996).
If the QMRA-MC risk simulations show that wastewater treatment should achieve a 2-log unit pathogen reduction (see section A3.2), then the fecal coliform count has to be reduced from 107−108 per 100 mL to 105−106 per 100 mL, although a prudent designer might design the treatment plant to achieve a 3-log unit reduction of fecal coliforms (i.e., from 107−108 per 100 mL to 104−105 per 100 mL), given the uncertainty of the relationship between pathogen and fecal coliform numbers and how this might change through the treatment plant. Regular (perhaps weekly or fortnightly, but certainly monthly) monitoring would be required to show whether or not the effluent from the treatment plant contained ≤105 (or ≤104) fecal coliforms per 100 mL.
A4.1.2 Helminth egg removal in waste stabilization ponds
Waste stabilization ponds (WSP) (Mara 2004, Shilton 2006) are currently the only wastewater treatment process that can be reliably designed for helminth egg removal (Ayres et al. 1992). The design equation is:
R = 100[1 − 0.41exp(−0.49θ + 0.0085θ2)] (A4.1)
where R is the percentage egg removal in a WSP which has a mean hydraulic retention time of θ days. Thus, if the number of eggs in the raw wastewater (Ei eggs per liter) and θ are known, the number of eggs in the pond effluent (Ee eggs per liter) can be determined.
For a series of WSP comprising an anaerobic pond, a facultative pond and n equally-sized maturation ponds Ee is given by:
142
Ee = Ei(1 – ra)(1 – rf)(1 – rm)n (A4.2)
where r = R/100 and the subscripts a, f and m refer to the anaerobic, facultative and maturation ponds, respectively – see ‘Worked Example A’ below.
Equation A4.2 can be rearranged as follows:
nrrr
EE
)-1)(-1)(-1(=
mfa
ei (A4.3)
Equation A4.3 is useful because it permits the WSP operator to determine the maximum number of eggs in the raw wastewater that the ponds can remove down to any required level of Ee eggs per liter − see ‘Worked Example B’ below.
Worked Example A: Known number of eggs per liter of raw wastewater
Suppose (a) the raw wastewater to be used for unrestricted irrigation contains 1000 eggs per liter; (b) QMRA-MC risk simulations have shown that a total Ascaris egg reduction of 3 log units is required for unrestricted irrigation (cf. Table A3.8); and (c) it has been decided that this is to be achieved by (i) wastewater treatment in a WSP system comprising a 1-day anaerobic pond and a 5-day facultative pond, and (ii) produce washing in clean water, which achieves a 1-log unit Ascaris reduction (cf. Table A2.2). Thus wastewater treatment in the WSP has to achieve a 2-log unit Ascaris reduction and therefore the effluent from the facultative pond has to contain ≤10 eggs per liter. From equation A4.1 ra (=Ra/100) = 0.75 and rf = 0.96 [rm = 0 as there are no maturation ponds], and therefore from equation A4.2:
Ee = Ei(1 – ra)(1 – rf) = 1000(1 – 0.75)(1 – 0.96) = 10 − satisfactory.
Verification monitoring can thus simply be based on measurements of helminth eggs in the raw wastewater (see Ayres and Mara 1996) and the values of the WSP retention times in the irrigation season (these are given by V/Q, where V is the pond volume in m3 and Q is the wastewater flow in m3/day). This is very advantageous as counting the number of eggs per liter of raw wastewater is much easier than counting egg numbers of ~10 per liter and below.
Worked Example B: Unknown number of eggs per liter of raw wastewater
Suppose that the exact number (or range of numbers) of eggs per liter of the raw wastewater is unknown, but that it is known that local raw wastewaters ‘never’ contain more than around 200−500 eggs per liter. Then, from equation A4.3, for the 1-day anaerobic pond and the 5-day facultative pond to produce an effluent with ≤10 eggs per liter:
0.96)-0.75)(1-(1
10=
)r-1)(r-1(
EE
fa
ei = = 1000 eggs per liter
Thus there would be little need for verification monitoring – perhaps only once or twice during the irrigation season – as the number of eggs in the raw wastewater that the WSP system can cope with (i.e., without exceeding the required effluent quality) is much higher than the numbers of eggs commonly encountered in the raw wastewater.

143
A4.2 Health-protection control measures
To assess the efficacy of the health-protection control meaures listed in Table A2.2 a Hazard Analysis Critical Control Point (HACCP) system should be established. HACCP systems consist of the following seven principles (FAO, 2003):
1. Conduct a hazard analysis. 2. Determine the Critical Control Points (CCPs). 3. Establish critical limit(s). 4. Establish a system to monitor control of the CCP. 5. Establish the corrective action to be taken when monitoring indicates that a particular
CCP is not under control. 6. Establish procedures for verification to confirm that the HACCP system is working
effectively. 7. Establish documentation concerning all procedures and records appropriate to these
principles and their application.
Principles 1−4 for unrestricted irrigation:
Principle 1: HACCP is applied to both the wastewater treatment plant and each of the post-treatment health-protection control measures in operation since if one of them performs sub-optimally or fails completely, it becomes a health hazard.
Principle 2: The number of CCPs corresponds to the wastewater treatment plant effluent and each post-treatment health-protection control measures in operation.
Principle 3: The critical limit of each CCP is the number of E. coli (or fecal coliforms) which shows unequivocally that the design removal for the CCP is being achieved. In the case of pathogen die-off (x log units per day) it is not possible to determine the time interval between the last irrigation and consumption (as the food may be kept refrigerated at home for a few days before it is consumed), but it is possible to monitor the time interval between the last irrigation and the appearance of the food in local shops and supermarkets.38
Principle 4: The system to monitor control of the CCP comprises sampling and microbiological analysis at an established frequency (e.g., weekly or fortnightly, certainly not less than monthly).
Since HACCP for unrestricted irrigation is solely concerned with the safety of wastewater-irrigated foods, principally those eaten uncooked, it is worth noting that ready-to-eat foods (such as prepared sandwiches and salads on sale in local shops and supermarkets) are deemed to be of ‘acceptable’ quality in the United Kingdom if they contain <104 E. coli per 100 g (Gilbert et al. 2000).39 Thus if lettuce, which is a common constituent of many ready-to-eat
38 This is routinely done, for example, in Australia (EPHC/NRMMC/AHMC 2006). 39 This guideline value is used in many other countries, including Australia, Canada and New Zealand (Institute of Medicine 2003).
144
foods, can contain up to 104 E. coli per 100 g, then it is clearly not necessary to irrigate it with a treated wastewater containing <104 E. coli per 100 mL, especially as post-treatment die-off always occurs. This illustrates the inherent problem with the 1989 WHO Guidelines which require ≤1000 fecal coliforms per 100 mL for unrestricted irrigation, and the inherent advantage of the Australian National and the 2006 WHO Guidelines which permit the inclusion of pathogen reductions that occur post-treatment.
145
Annex B: Involvement of the World Bank
B.1.1 Analytical Involvement
During the 1980s and early 1990s, the World Bank in collaboration with many other international and bilateral partners had an important role in defining an evolving strategy for promoting safe and productive wastewater use for irrigation. The involvement in the work on wastewater irrigation and health started in the early 1970s when the World Bank provided lending for the first time for a sewerage project. Approved in 1972, the Sewerage Project provided support to Israel’s National Sewerage Program designed to improve and modernize the country’s sewerage facilities, in order to protect and preserve water resources and to improve public health. An ex post evaluation concluded that it was a successful project incorporating appropriate least-cost technology, and that the provision of sewage disposal and reuse facilities constituted a major environmental improvement and a significant supplementary source of water for irrigation. The project also pioneered the use of long-detention storage reservoirs for treatment. Other important features of this project were the provisions for cost-sharing and division of responsibility between municipalities wanting to dispose of wastewater and farmers wanting to use it (Streit, 1986; Bartone, 1991).40
Prompted by the success of the Israeli project and others, the World Bank in 1981 commissioned an evaluation of 30 waste stabilization pond systems it had financed around the world. The findings were published in a groundbreaking report that covered the topics of waste stabilization pond performance and design, established the cost-effectiveness of ponds compared to conventional treatment, and reviewed the Israeli experience with effluent irrigation (Arthur, 1983).
In 1981, the World Bank initiated a global research and development project on Integrated Resource Recovery, Waste Recycling and Reuse, financed by the United Nations Development Program (UNDP) and a group of bilateral donors (Bartone, 1986). It was managed by the Water and Sanitation Program (WSP), a multi-donor partnership founded in 1979 by UNDP and the World Bank to support the poor in obtaining affordable, safe and sustainable access to water and sanitation services. The project focused on the public health aspects of wastewater use for agriculture and aquaculture, and the sanitary control measures required for public health protection. For wastewater irrigation a comprehensive review of available epidemiological data was carried out, and a risk model formulated to evaluate sanitary control options for effluent irrigation (Shuval et al., 1986). Similarly for aquaculture, the project supported a scientific review of the available epidemiological evidence and sanitary control measures (Edwards, 1985;
40 Since the early 1970s, Israel has carried out large efforts to use wastewater for agricultural purposes, and is presently reusing almost 75% of all the sewage produced in the country. In 2000 agriculture used less than 40% of the freshwater resources, down from almost 70% in 1985. During drought years, freshwater supply to agriculture is severely cut off, while farmers connected to reclaimed wastewater systems continue to receive a full quota (Juanicó, 2008).
146
Edwards, 1992), and a scientific consultation workshop held in Calcutta in 1988 (Edwards and Pullin, 1990).
The Integrated Resource Recovery, Waste Recycling and Reuse Project also supported an applied research and demonstration project at the San Juan Stabilization Ponds serving the peri-urban community of San Juan de Miraflores, a peri-urban community of Lima, Peru, with the aim of optimizing pond design for pathogen removal, improving existing effluent use for irrigation, and incorporating fish production in polishing ponds (Bartone, 1985; Bartone et al, 1985). The final product of the project was the publication of a planning guide on reuse of wastewater in agriculture (Khouri et al, 1994).
The seminal 1986 epidemiologal study by Shuval and colleagues entitled “Wastewater Irrigation in Developing Countries: Health Effects and Technical Solutions” suggested a guideline for unrestricted wastewater irrigation based on an effluent with less than one helminth egg per liter and a geometric mean fecal coliform concentration of 1,000 per 100 ml (Shuval et al., 1986). This recommended guideline was endorsed by a group of experts convened in Engelberg, Switzerland by the World Bank, UNDP, WHO, and the International Reference Centre for Waste Disposal, and was subsequently incorporated into the 1989 WHO Guidelines on the Safe Use of Wastewater and Excreta in Agriculture and Aquaculture: Measures for Public Health Protection which then formed the basis of many countries’ regulatory framework (Mara and Cairncross, 1989; Annex A).
Another important scientific work that was supported by the World Bank in the early 1980s was the publication “Sanitation and Disease: Health Aspects of Excreta and Wastewater Management” by Feachem et al. (1983). Its review of the interactions between excreta and health has greatly contributed to the knowledge of the public health aspects of wastewater management, and remains a “bible” for professionals working in the field of water, sanitation, and reuse.
During the preparation of the 1993 World Development Report “Investing in Health”, the World Bank and WHO collaborated on the development of the concept of Disability-Adjusted Life Year (DALY) as a measure of the global burden of disease (Murray and Lopez, 1986; see Box 4.1). This advance finally made it possible to make a comparative assessment of the relative importance of different causes of morbidity and mortality, and to be able rank the effectiveness of different public health interventions in reducing the burden of disease as measured in DALYs (World Bank, 1993). The development of this tool facilitated the application of risk assessment and management approaches, and made possible the development of the 2004 WHO Guidelines for Drinking-Water Quality (WHO, 2004), and the 2006 WHO Guidelines on Wastewater Use in Agriculture which replaced the 1989 WHO Guidelines mentioned above (WHO, 2006; see Chapter 4).
In recent years, World Bank’s analytical work has been less concerned with wastewater use in agriculture. The World Bank’s 1993 Policy Paper on Water Resources Management emphasized the importance of wastewater use as a water conservation measure, and pointed out the high economic and environmental cost that currently occur in developing countries when “large amounts of new water are brought into urban areas, which creates large amounts of untreated, polluted wastewater that is often used by the urban poor” (World Bank, 1993, p. 33). The 2004

147
Water Resources Sector Strategy, however, does not mention wastewater use even in passing (World Bank, 2004).
Wastewater use in agriculture is included in the Sourcebook for Investment in Agricultural Water Management “Shaping the Future of Water for Agriculture” with a section on investing in the reuse of treated wastewater (World Bank, 2005). Wastewater irrigation is also emphasized in the World Bank publication on “Reengaging in Agricultural Water Management (World Bank, 2006). It identifies wastewater use for irrigation, particularly for small- and medium-scale irrigation projects, as a major new water source and a key area for investment, and also recommends that basin plans should factor in a policy for non-conventional water sources such as reuse of wastewater. Other noteworthy recent World Bank publications on the subject include a note on water reuse applications (van Gool, 2003), and a review of the water reuse experience in the Middle East and North Africa (Kfouri, 2009).
In 2008 the World Bank’s Water Anchor initiated this study, and initial insights were presented and discussed during a session on “Scaling Up Wastewater Use in Agriculture” during SDN Week 20008, and a session on “Urban Wastewater Reuse in Agriculture” during Water Week 2009.
B.1.2 Operational Involvement
The World Bank’s operational involvement in sanitation, wastewater treatment, and agricultural wastewater use projects is evolving, as three portfolio reviews indicate.
Water supply and sewerage projects (1967-1989): The 1993 Policy Paper on Water Resources Management (World Bank, 1993a) cited a portfolio review of water supply and sanitation projects which found that, out of 120 projects, 104 projects funded water supply, and only 58 included a sanitation component (World Bank, 1993b). Also sanitation components within projects were often eliminated because of cost overruns. It further noted: “In only a few of the cities with Bank-financed water supply projects was adequate sewer or sanitation provided to handle the increased wastewater created by the project. The review concluded that the Bank and its borrowers have not adequately invested in the removal and treatment of disease. Diseases will continue to spread among the poor, and the economic and environmental deterioration will continue until adequate wastewater disposal accompanies the provision of water. Improved low-cost and more appropriate technologies are now available to mitigate the high costs of conventional sewerage and sewage disposal systems.”
Wastewater and sewerage projects (1997-2007). A review of the World Bank’s wastewater and sewerage lending portfolio in both urban and rural areas, carried out in connection with an evaluation of World Bank support to the water sector (IEG, 2009a), identified 182 projects that were approved between fiscal year 1997 and 2007 and deal with either wastewater treatment or sewerage activities, or a combination of the two (IEG, 2009b). More than 90 percent of the projects targeted urban areas. The total lending for these projects was US$13.46 billion, which represent about 6 percent of total Bank lending for that period. The Bank’s involvement in wastewater treatment and sewerage has steadily increased over time. More than a third of the

148
projects in the portfolio were implemented in the East Asia and Pacific region, and more than half of these in China. Other top borrowers were middle-income countries such as Brazil, India, and Turkey. The review found that the achievements with regard to health or environmental impacts were often suboptimal, as well as their evaluation. Furthermore, projects often focused on restoring or constructing physical assets, while institutional development and tariff reforms happened less often.
Wastewater irrigation projects (1999-2009). In connection with this study a portfolio review was carried out on the World Bank’s operational involvement in improving wastewater use in agriculture between fiscal year 1999 and 2009. The review was based on an analysis of the Project Appraisal Documents (PADs). It identified 26 projects with relevant text on wastewater use (reuse) and (urban) agriculture in the PADs. More than half of these projects were implemented in the Middle East and North Africa region. China, followed by Yemen, Tunisia and Iran accounted for almost 60 percent of the projects (Table 6.1).
Of the 26 projects, only one project in Indonesia focused on urban agriculture development (as part of one component), but did not mention wastewater use. The remaining 25 projects addressed wastewater treatment and (possible) use in agriculture. Of the PADs for the 25 projects, all except one (for a project in Thailand) mention that water resources are considered scarce. Ten PADs mention that (untreated) wastewater is already used in agriculture (projects in China, Iran, Mauritania, and Yemen). Some governments have a strategy for wastewater reuse in place (Cape Verde, China, Iran, Jordan, Tunisia, and Yemen), while for others a preparation of a strategy is included in the project (Brazil, India, Lebanon, Mauritania, and Morocco). The PADs for seven projects mention the 1989 WHO Guidelines as prevailing standards for wastewater reuse, while four projects (in Tunisia and China) mention the existence of national standards. While the PADs for all of the 25 projects mention (possible) wastewater use in agriculture, only 17 include wastewater reuse in agriculture under project components. Of those that do, eight projects plan the preparation of a reuse strategy, a related feasibility study, or the establishment of pilot sites; three projects provide for institutional strengthening and capacity building on effluent reuse; and six projects provide direct support for wastewater use in agriculture, including treated wastewater distribution networks and/or irrigation schemes. Within the latter six projects, four support treated wastewater being made available for use in agriculture; one the establishment of irrigation schemes for the use of existing treated wastewater; and one the improvement of wastewater treatment together with the establishment and rehabilitation of irrigation schemes.

149
Table B1.1 Projects included in the portfolio review on wastewater irrigation (approved in FY99-09)
Country Region Project TitleTotal Project Amount ($m)
Bank Commitment
($m)
Bank Commitment to Wastewater Reuse*
($m)
Wastewater Reuse as a
Share of Bank Commitment
(% )
FY of Approval
Status as of Sept 09
Product Line
Cape Verde Africa Energy and Water Project 50 17.5 1.20 7% 1999 Closed IBRD/IDA
Mauritania Africa Urban Development Program 100 70 0.00 0% 2002 Active IBRD/IDA
China East Asia and Pacific Second Beijing Environment Project 1255 367.9 0.00 0% 2000 Closed IBRD/IDA and GEF#
China East Asia and Pacific Hebei Urban Environment Project 293 150 0.00 0% 2000 Closed IBRD/IDA
China East Asia and Pacific Second Tianjin Urban Development Project 336 150 10.40 7% 2003 Active IBRD/IDA
China East Asia and Pacific Hai Basin Integrated Water and Environmental Management Project 33 17 0.29 2% 2004 Active GEF
China East Asia and Pacific Ningbo Water and Environment Project 292 130 0.00 0% 2005 Active IBRD/IDA
Indonesia East Asia and Pacific Municipal Innovations Project 7.2 5 0.10 2% 1999 Closed IBRD/IDA
Thailand East Asia and Pacific Sapthip Wastewater Biogas and Renewable Energy Project 5 6.5 1.36 33% 2009 Active Carbon Offset
Brazil Latin America and Caribbean Rio Grande Do Norte Integrated Water Resources Management Project 59.8 35.9 0.30** 1% 2008 Active IBRD/IDA
Egypt Middle East and North Africa Alexandria Development Project 110 100 0.00 0% 2008 Closed IBRD/IDA
Iran Middle East and North Africa Tehran Sewerage Project 340 145 0.47 0.32% 2000 Closed IBRD/IDA
Iran Middle East and North Africa Ahwaz and Shiraz Water Supply and Sanitation Project 470 279 2.28 1% 2004 Closed IBRD/IDA
Iran Middle East and North Africa Northern Cities Water Supply and Sanitation Project 344 224 0.00 0% 2005 Active IBRD/IDA
Jordan Middle East and North Africa Amman Water and Sanitation Management Project 136 55 0.00 0% 1999 Closed IBRD/IDA
Jordan Middle East and North Africa Conservation of Medicinal and Herbal Plants Project 14 5 0.20** 4% 2003 Active GEF
Lebanon Middle East and North Africa Ba'Albeck Water and Wastewater Project 50 43.53 0.39 1% 2002 Active IBRD/IDA
Morocco Middle East and North Africa First Water Sector Development Policy Loan 100 100 0.00 0% 2007 Closed IBRD/IDA
Tunisia Middle East and North Africa Water Sector Investment Project 258 103 3.62 4% 2000 Closed IBRD/IDA
Tunisia Middle East and North Africa Tunis West Sewerage Project 72 66.8 9.10 14% 2007 Active IBRD/IDA
Tunisia Middle East and North Africa Second Water Sector Investment Project 163 30.6 6.96 23% 2009 Active IBRD/IDA
Yemen Middle East and North Africa Sana'a Water Supply and Sanitation Project 28 25 0.00 0% 1999 Closed IBRD/IDA
Yemen Middle East and North Africa Rural Water Supply and Sanitation Project 29 20 0.20** 1% 2001 Active IBRD/IDA
Yemen Middle East and North Africa Urban Water Supply and Sanitation Project 150 130 0.10** 0.08% 2003 Active IBRD/IDA
Yemen Middle East and North Africa Sana'a Basin Water Management Project 30 24 0.00 0% 2003 Active IBRD/IDA
India South Asia Rajasthan Water Sector Reconstructing Project 180 140 0.10** 0.07% 2002 Active IBRD/IDA
* Estimations based on data provided in the project appraisal documents
**Estimations were not available in the project appraisal documents. Costs of studies and strategy preparation were assumed to be $ 0.1 million and costs of pilot sites were assumed to be $ 0.2 million.
# GEF grant accounts for $18.6m
Source: Authors
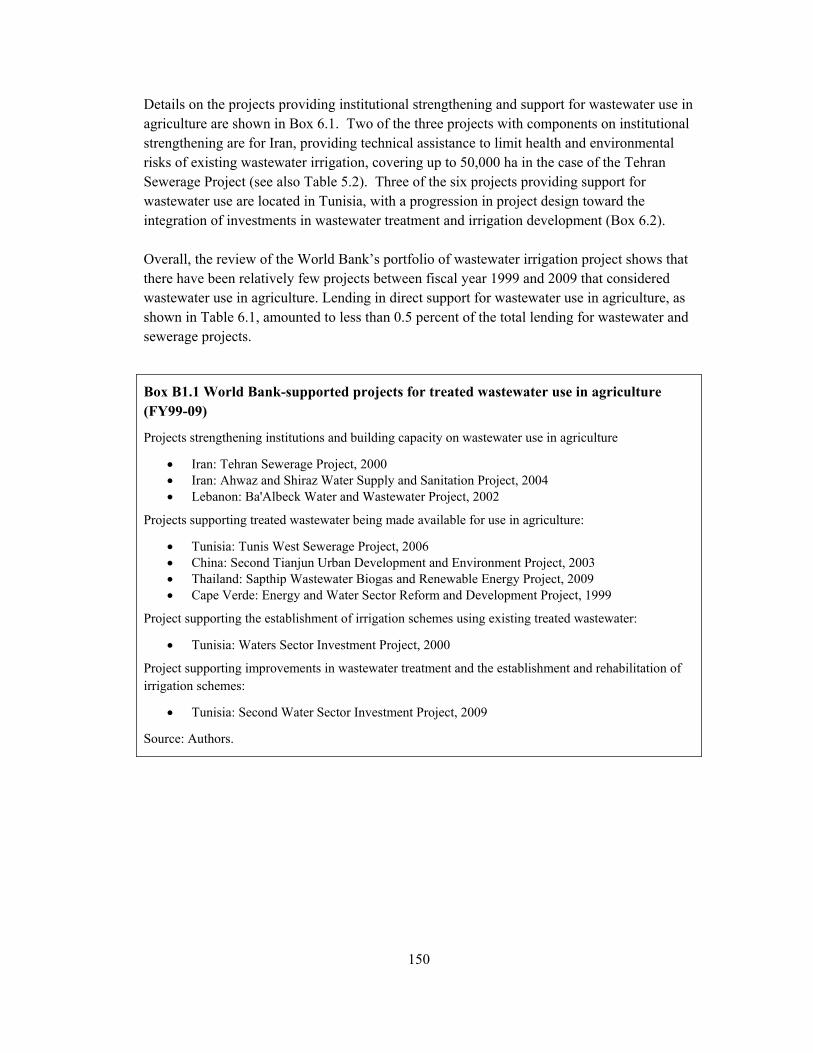
150
Details on the projects providing institutional strengthening and support for wastewater use in agriculture are shown in Box 6.1. Two of the three projects with components on institutional strengthening are for Iran, providing technical assistance to limit health and environmental risks of existing wastewater irrigation, covering up to 50,000 ha in the case of the Tehran Sewerage Project (see also Table 5.2). Three of the six projects providing support for wastewater use are located in Tunisia, with a progression in project design toward the integration of investments in wastewater treatment and irrigation development (Box 6.2). Overall, the review of the World Bank’s portfolio of wastewater irrigation project shows that there have been relatively few projects between fiscal year 1999 and 2009 that considered wastewater use in agriculture. Lending in direct support for wastewater use in agriculture, as shown in Table 6.1, amounted to less than 0.5 percent of the total lending for wastewater and sewerage projects.
Box B1.1 World Bank-supported projects for treated wastewater use in agriculture (FY99-09)
Projects strengthening institutions and building capacity on wastewater use in agriculture
Iran: Tehran Sewerage Project, 2000 Iran: Ahwaz and Shiraz Water Supply and Sanitation Project, 2004 Lebanon: Ba'Albeck Water and Wastewater Project, 2002
Projects supporting treated wastewater being made available for use in agriculture:
Tunisia: Tunis West Sewerage Project, 2006 China: Second Tianjun Urban Development and Environment Project, 2003 Thailand: Sapthip Wastewater Biogas and Renewable Energy Project, 2009 Cape Verde: Energy and Water Sector Reform and Development Project, 1999
Project supporting the establishment of irrigation schemes using existing treated wastewater:
Tunisia: Waters Sector Investment Project, 2000
Project supporting improvements in wastewater treatment and the establishment and rehabilitation of irrigation schemes:
Tunisia: Second Water Sector Investment Project, 2009
Source: Authors.
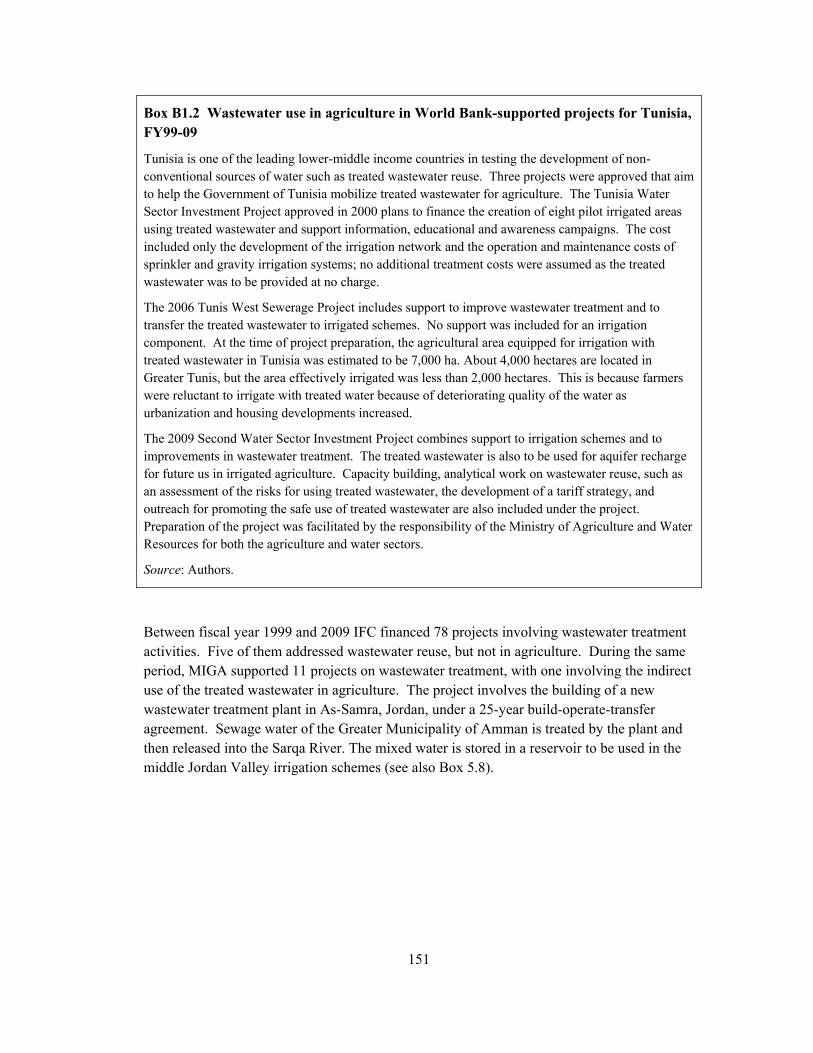
151
Box B1.2 Wastewater use in agriculture in World Bank-supported projects for Tunisia, FY99-09
Tunisia is one of the leading lower-middle income countries in testing the development of non-conventional sources of water such as treated wastewater reuse. Three projects were approved that aim to help the Government of Tunisia mobilize treated wastewater for agriculture. The Tunisia Water Sector Investment Project approved in 2000 plans to finance the creation of eight pilot irrigated areas using treated wastewater and support information, educational and awareness campaigns. The cost included only the development of the irrigation network and the operation and maintenance costs of sprinkler and gravity irrigation systems; no additional treatment costs were assumed as the treated wastewater was to be provided at no charge.
The 2006 Tunis West Sewerage Project includes support to improve wastewater treatment and to transfer the treated wastewater to irrigated schemes. No support was included for an irrigation component. At the time of project preparation, the agricultural area equipped for irrigation with treated wastewater in Tunisia was estimated to be 7,000 ha. About 4,000 hectares are located in Greater Tunis, but the area effectively irrigated was less than 2,000 hectares. This is because farmers were reluctant to irrigate with treated water because of deteriorating quality of the water as urbanization and housing developments increased.
The 2009 Second Water Sector Investment Project combines support to irrigation schemes and to improvements in wastewater treatment. The treated wastewater is also to be used for aquifer recharge for future us in irrigated agriculture. Capacity building, analytical work on wastewater reuse, such as an assessment of the risks for using treated wastewater, the development of a tariff strategy, and outreach for promoting the safe use of treated wastewater are also included under the project. Preparation of the project was facilitated by the responsibility of the Ministry of Agriculture and Water Resources for both the agriculture and water sectors.
Source: Authors.
Between fiscal year 1999 and 2009 IFC financed 78 projects involving wastewater treatment activities. Five of them addressed wastewater reuse, but not in agriculture. During the same period, MIGA supported 11 projects on wastewater treatment, with one involving the indirect use of the treated wastewater in agriculture. The project involves the building of a new wastewater treatment plant in As-Samra, Jordan, under a 25-year build-operate-transfer agreement. Sewage water of the Greater Municipality of Amman is treated by the plant and then released into the Sarqa River. The mixed water is stored in a reservoir to be used in the middle Jordan Valley irrigation schemes (see also Box 5.8).
152
References
Abaidoo, R. C., J.A. Bakang, P. Drechsel, B. Keraita, M. Kinane and I. Beernaerts. 2010. Final Report of the KNUST/FAO/WHO/IDRC Project on Evaluation of Non-treatment Options for Maximizing Public Health Benefits of WHO Guidelines Governing the Use of Wastewater in Urban Vegetable Production in Ghana. Kumasi: Kwame Nkrumah University of Science and Technology.
Amoah, P., P. Drechsel, M. Henseler and R. C. Abaidoo. 2007a. “Irrigated urban vegetable production in Ghana: microbiological contamination in farms and markets and associated consumer risk groups.” Journal of Water and Health 5(3): 455–466.
Amoah, P., P. Drechsel, R.C. Abaidoo and A. Klutse. 2007b. “Effectiveness of common and improved sanitary washing methods in West Africa for the reduction of coli bacteria and helminth eggs on vegetables”. Tropical Medicine & International Health 12(s2): 40–50.
Angelakis, A.N., D. Koutsoyiannis, and G. Tchobanoglous. 2005. “Urban wastewater and stormwater technologies in ancient Greece.’ Water Research 39, 210–220.
AQUAREC. 2006. Integrated Concepts for Reuse of Upgraded Wastewater. EVK1-CT-2002-00130. http://www.aquarec.org/
Arlosoroff, S. 2006. “Overcoming Water Scarcity in Israel.” Water & Wastewater International 21(5): 27-29.
Arce, B., G. Prain, and L. Maldonado. 2009. “Urban agriculture and gender in Carapongo, Lima, Peru.” In: Hovorka, A., H. de Zeeuw, and M. Njenga (eds). Women Feeding Cities: Mainstreaming Gender in Urban Agriculture and Food Security. Warwickshire, UK: PAP-RUAF Foundation-Urban Harvest. pp 199-218.
Arthur, J. P. 1983. Notes on the Design and Operation of Waste Stabilization Ponds in Warm Climates of Developing Countries. World Bank Technical Paper No. 7. Washington, DC: World Bank.
Asano, T. and A. D. Levine. 1996. “Wastewater reclamation, recycling and reuse: past, present, and future.” Water Science and Technology 33(10−11): 1–14.
Asano, T., F.L. Burton, H. Leverenz, R. Tsuchihashi, and G. Tchobanoglous. 2007. Water Reuse: Issues, Technologies, and Applications. New York, NY: McGraw Hill.
Ayers, R. S. and D. W. Westcot. 1989. Water Quality for Agriculture. FAO Irrigation and Drainage Paper No. 29, rev. 1. Rome: Food and Agriculture Organization.
Ayres, R. M., G. P. Alabaster, D. D. Mara and D. L. Lee. 1992. “A design equation for human intestinal nematode egg removal in waste stabilization ponds.” Water Research 26(6): 863−865.

153
Ayres, R. M. and D. D. Mara. 1996. Analysis of Wastewater for Use in Agriculture: A Laboratory Manual of Parasitological and Bacteriological Techniques. Geneva: World Health Organization.
Barbeito, E. 2001. General Case Study: Campo Espejo of the Grand Mendoza Agglomeration, Republic of Argentina. Regional Project “Integrated Systems for the Treatment and Recycling of Waste Water in Latin America: Reality and Potential.” IDRC-PAHO/CEPIS Agreement 2000-2002. Lima, Peru: CEPIS. http://www.cepis.ops-oms.org/bvsaar/e/proyecto/generales/casos/mendoza.pdf
Bahri, A. 2008a. Water Reuse in Middle Eastern and North African Countries. In: Jimenez, B. and T. Asano, editors. “Water Reuse: An International Survey of Current Practice, Issues and Needs.” London: IWA Publishing. pp 27-47.
Bahri, A. 2008b. “Case Studies in Middle Eastern and North African Countries.” In: Jimenez, B. and T. Asano (eds.) Water Reuse: An International Survey of Current Practice, Issues and Needs. London: IWA Publishing, pp 558-591.
Bahri, A. 2009. Managing the Other Side of the Water Cycle: Making Wastewater an Asset. Technical Committee (TEC) Background Papers No. 13. Stockholm: Global Water Partnership.
Bartone, C. 1985. “Reuse of Wastewater at the San Juan de Miraflores Stabilization Ponds: Public Health, Environmental, and Socioeconomic Implications.” Bulletin of the Pan American Health Organization, 19(2), 147-163.
Bartone, C. 1986. “Recycling Waste: The World Bank Project on Resource Recovery.“ J. Society for International Development 4, 35-39.
Bartone, C. 1990. “Water Quality and Urbanization in Latin America.” Water International, 15, 3-14.
Bartone, C. 1991. “International Perspective on Water Resources Management and Wastewater Rese – Apppropriate Technologies.” Water Science & Technology, 23, 2039-47.
Bartone, C. 1994. “Water Pollution in Santiago: Health Impacts and Policy Alternatives.” In: von Amsberg (ed.) Chile – Managing Environmental Problems: Economic Analysis of Selected Issues. Latin American and Caribbean Region Report No. 13061-CH, December 19, 1994. Washington, DC: The World Bank. pp 39-90.
Bartone, C. 1995. Financing Municipal Wastewater Treatment: Who should pay? Can and will they pay? Powerpoint presentation at the World Bank Workshop on River Basin Management and Water Quality Control, Campinas, Brazil.
Bartone, C. 1997. “Financing Wastewater Management.” In: Helmer, R. and I. Hespanhol (eds.) Water Pollution Control: A Guide to the Use of Water Quality Management Principles. London: E&FN SPON, pp 191-218.

154
Bartone, C. 2000. Financing Wastewater Treatment in Monterrey. Powerpoint presentation at the World Bank Water and Sanitation Forum, Washington, DC.
Bartone, C., M.L. Esparza, C. Mayo, O. Rojas, and T. Vitko. 1985. Monitoring and Maintenance of Treated Water Quality in the San Juan Lagoons Supporting Aquaculture: Final Report of Phases I-II. Lima, Peru: Pan American Center for Sanitary Engineering and Environmental Sciences (CEPIS).
Bartone, C. and S. Arlosoroff. 1987. “Irrigation Reuse of Pond Effluents in Developing Countries.” Water Science & Technology, 19(12): 289-297.
BGS 2001. Guidelines for Assessing the Risk to Groundwater from On-site Sanitation. Nottingham: British Geological Survey.
Bhandari, A., R.Y. Surampalli, C.D. Adams, P. Champagne, S.K. Ong, R.D. Tyagi, and T. Zhang. 2009. Contaminants of Emerging Environmental Concern. Reston, VA: ASCE Press.
Bitrán, G. and G. Arellano. 2005. Regulating Water Services: Sending the Right Signals to Utilities in Chile. Public Policy Journal, Viewpoint Note No. 286. Washington, DC: The World Bank.
Bixio, D. and T. Wintgens (eds.) 2006. Water Reuse System Management Manual. Directorate General for Research, Global Change and Ecosystems. Brussels: European Commission.
Bixio, D., C. Thoeye, J. DeKoning, D. Joksimiovic, D. Savic, T. Wintgens and T. Melin. 2006. “Wastewater Reuse in Europe.” Desalination, 187, 89-101.
Blumenthal, U.J. 1988. “Generalised model of the reduction of health risk associated with different control measures for the use of human wastes.” IRCWD News No. 24/25, pp. 13−17. Dübendorf: International Reference Centre on Wastes Disposal.
Blumenthal, U.J., M. Strauss, D.D. Mara, and S. Cairncross. 1989. “Generalised model of the effect of different control measures in reducing health risks from waste reuse.” Water Science and Technology 21(Brighton): 567−577.
Blumenthal, U.J. and A. Peasey. 2002. Critical Review of Epidemiological Evidence of Health Effects of Wastewater and Excreta in Agriculture (Background paper for the WHO Guidelines for the safe use of wastewater and excreta in agriculture). Geneva: World Health Organization.
Brissaud, F. 2008. “Technologies for Water Regeneration and Integrated Management of Water Resources.” Paper presented at the Conference Water Scarcity and Management under Mediterranean Climate, Girona, Spain, November 24-25, 2008. http://www.icra.cat/wsmmc_posters/pdf/oral25/abstract-francois-brissaud.pdf
Bucknall, J. 2007. Making the Most of Scarcity: Accountability for Better Water Management Results in the Middle East and North Africa. MENA Development Report Series No. 5. Washington, DC: World Bank.
155
Buechler, S., W. Hertog, and R. van Veenhuizen. 2002. "Wastewater Use for Urban Agriculture." Urban Agriculture Magazine 8(2): 1-4.
Campling, P., L. De Nocker, W. Schiettecatte, A.I. Iacovides, I. Iacovides, T. Dworak, E. Kampa, M. Berglund, M. Álvarez-Arenas, C. Cuevas-Pozo, O. Le Mat, V. Mattheiß, F. Kervarec. 2008. Conditions for the Sustainable Development of Alternative Water Supply Options. Study undertaken for the European Commission – DG Environment. Flemish Institute for Technological Research. http://ec.europa.eu/environment/water/quantity/pdf/task%203%20report.pdf
Carr, R.M., U.J. Blumenthal and D.D. Mara. 2004. “Health guidelines for the use of wastewater in agriculture: developing realistic guidelines.” In Wastewater Use in Irrigated Agriculture: Confronting the Livelihood and Environmental Realities, eds. C. A. Scott, N.I. Faruqui and L. Raschid-Sally, pp. 41−58. Wallingford: CAB International.
CDC. 2009. ‘OutbreakNet’ − Foodborne Outbreak Online Database. Atlanta, GA: Centers for Disease Control and Prevention. Available online at: http://wwwn.cdc.gov/foodborneoutbreaks/Default.aspx.
Chan, M-S. 1997. “The global burden of intestinal nematode infections – fifty years on.” Parasitology Today 13(11): 438–43.
Chang, A.C., G. Pan, A.L. Page and T. Asano. 2002. Developing Human Health-related Chemical Guidelines for Reclaimed Wastewater and Sewage Sludge Applications in Agriculture (Background paper for the WHO Guidelines for the safe use of wastewater and excreta in agriculture). Geneva: World Health Organization.
Cifuentes E., et al. 2000. “The risk of Giardia intestinalis infection in agricultural villages practicing wastewater irrigation in Mexico.” American Journal of Tropical Medicine and Hygiene 62(3): 388-392.
Comprehensive Assessment of Water Management in Agriculture. 2007. Water for Food, Water for Life: A Comprehensive Assessment of Water Management in Agriculture. London: Earthscan, and Colombo: International Water Management Institute.
de Silva, N.R., S. Brooker, P.J. Hotez, A. Montresor, D. Engels and L. Savioli. 2003. “Soil-transmitted helminth infections: updating the global picture.” Trends in Parasitology 19(12): 547−51.
Drechsel, P., U.J. Blumenthal, and B. Keraita. 2002. “Balancing health and livelihoods: adjusting wastewater irrigation guidelines for resource-poor countries.” Urban Agriculture Magazine No. 8, pp. 7−9.
Drechsel, P., S. Graefe, M. Sonou, and O.O. Cofie. 2006. Informal Irrigation in Urban West Africa: An Overview. Research Report 102. Colombo: International Water Management Institute.
Drechsel, P., B. Keraita, P. Amoah, R. C. Abaidoo, L. Raschid Sally and A. Bahri. 2008. “Reducing health risks from wastewater use in urban and peri-urban sub-Saharan
156
Africa: applying the 2006 WHO guidelines.” Water Science and Technology 57(9): 1461−66.
Drechsel, P., C.A. Scott, L. Raschid-Sally, M. Redwood, and A. Bahri. 2010. Wastewater Irrigation and Health: Assessing and Mitigating Risks in Low-income Countries. London: Earthscan.
Edwards, P. 1985. Aquaculture: A Component of Low Cost Sanitation Technology. World Bank Technical Paper 36. Washington, DC: World Bank.
Edwards, P. 1992. Reuse of Human Wastes in Aquaculture: A Technical Review. UNDP/World Bank Water and Sanitation Program Technical Paper. Washington, DC: World Bank.
Edwards, P. and R.S.V. Pullin. 1990. Wastweater-Fed Aquaculture. Proceedings of the International Seminar on Wastewater Reclamation and Reuse for Aquaculture, Calcutta, India, 609 December, 1988. Bangkok, Thailand: Asian Institute of Technology.
Egocheaga, L. and J. Moscoso. 2004. A Management Strategy for Domestic Wastewater: Toward Sustainable Health Protection in Latin America and Other Developing Regions (in Spanish). Lima: Pan-American Center for Sanitary Engineering and Environmental Sciences. Available at: http://www.bvsde.paho.org/bvsaar/fulltext/gestion/gestion.html
Ensink, J. H. J., van der Hoek, W., Matsuno, Y., Munir, S. and Rizwan Aslam, M. 2002. Use of Untreated Wastewater in Peri-Urban Agriculture in Pakistan: Risks and Opportunities (Research Report No. 64). Colombo: International Water Management Institute.
Ensink, J., T. Mahmood, W. Vvan der Hoek, L. Raschid-Sally, and P. Amerasinghe. 2004a. “A nationwide assessment of wastewater use in Pakistan: an obscure activity or a vitally important one?” Water Policy 6: 197−206.
Ensink, J., R.W. Simmons, and W. van der Hoek. 2004b. “Wastewater use in Pakistan: The cases of Haroonabad and Faisalabad.” In: Scott, C.A., N.I. Faruqui and L. Raschid-Sally, editors. Wastewater Use in Irrigated Agriculture: Confronting the Livelihood and Environmental Realities. Wallingford: CAB International, pp 91-99.
Ensink, J. H. J., T. Mahmood and A. Dalsgaard. 2007. “Wastewater-irrigated vegetables: market handling versus irrigation water quality.” Tropical Medicine and International Health 12(2): 2–7.
Ensink, J. H. J. and W. van der Hoek. 2009. “Implementation of the WHO guidelines for the safe use of wastewater in Pakistan: balancing risks and benefits.” Journal of Water and Health 7(3): 464−68.
EPHC/NRMMC/AHMC. 2006. National Guidelines for Water Recycling: Managing Health and Environmental Risks. Canberra, ACT: Environment Protection and Heritage

157
Council, the Natural Resource Management Ministerial Council and the Australian Health Ministers’ Conference.
European Union. 2000. Directive 2000/60/EC of the European Parliament and of the Council of 23 October 2000 establishing a framework for Community action in the field of water policy. Brussels: European Parliament. http://eur-lex.europa.eu/LexUriServ/LexUriServ.do?uri=CELEX:32000L0060:EN:NOT
European Commission. 2004. Report from the Commission to the Council, the European Parliament, the European Economic and Social Committee and the Committee of the Regions - Implementation of Council Directive 91/271/EEC of 21 May 1991 concerning urban waste water treatment, as amended by Commission Directive 98/15/EC of 27 February 1998. Report No. COM(2004) 248 final. Brussels: Commission of the European Communities.
Ezzati, M., S. van der Hoorn, A.D. Lopez, G. Danaei, A. Rodgers, C.D. Mathers, and C.J.L. Murray. 2006. “Comparative quantification of mortality and burden of disease attributable to selected risk factors.” In Global Burden of Disease and Risk Factors, eds. A.D. Lopez, C.D. Mathers, M. Ezzati, D.T. Jamison, and C.J. L. Murray, pp. 241−396. New York, NY: Oxford University Press.
Falkenmark, M., and G. Lindh. 1993. “Water and Economic Development.” In: Gleick, P.H. (ed.) Water in Crisis: A Guide to the World’s Fresh Water Resources. New York: Oxford University Press, pp. 80-91.
FAO. 2003. “Hazard analysis and critical control point (HACCP) system and guidelines for its application.” In Recommended International Code of Practice: General Principles of Food Hygiene (CAC/RCP 1-1969, rev. 4-2003), pp. 21−31. Rome: Food and Agriculture Organization.
Faruqui, N.I. 2000. A Brief on Wastewater Treatment and Reuse for Food and Water Security. Ottawa: IDRC. http://www.idrc.ca/en/ev-44041-201-1-DO_TOPIC.html
Faruqui, N., S. Niang, and M. Redwood. 2004. ‘Untreated wastewater reuse in market gardens: a case study of Dakar, Senegal.” In Wastewater Use in Irrigated Agriculture: Confronting the Livelihood and Environmental Realities, eds. C. Scott, N. Faruqui, and L. Raschid- Sally. CABI Publication, Wallingford, UK.
Faruqui, N.I., C.A. Scott, and L. Raschid-Sally. 2004. "Confronting the Realities of Wastewater Use in Irrigated Agriculture: Lessons Learned and Recommendations." Chapter 16 in C.A. Scott, N.I. Faruqui, and L. Raschid-Sally (eds.). Wastewater Use in Irrigated Agriculture: Confronting the Livelihood and Environmental Realities. Wallingford: CABI.
Feachem, R.G., D.J. Bradley, H. Garelick, and D.D. Mara. 1983. Sanitation and Disease: Health Aspects of Excreta and Wastewater Management. Chichester: John Wiley & Sons.
158
Feenstra, S., R. Hussain, W. van der Hoek. 2000. Health risks of irrigation with untreated urban wastewater in the Southern Punjab, Pakistan. IWMI Pakistan Report R-107. Lahore, Pakistan: International Water Management Institute (IWMI).
Ferreccio, C. 1995. “Santiago, Chile: Avoiding an Epidemic.” In: Serageldin, I., M.A. Cohen and K.C. Sivaramakrishnan, eds.. The Human Face of the Urban Environment. Environmentally Sustainable Development Proceedings Series No. 6, The World Bank, Washington, DC. pp. 160-162.
Fewtrell, L. and J. Bartram. 2001. Water Quality: Guidelines, Standards and Health Assessment of Risk and Risk Management for Water-related Infectious Disease. London: IWA Publishing.
Fewtrell L, A. Prüss-Üstün, R. Bos, F. Gore, aand J. Bartram. 2007. Water, sanitation and hygiene: quantifying the health impact at national and local levels in countries with incomplete water supply and sanitation coverage. WHO Environmental Burden of Disease Series No. 15. World Health Organization, Geneva. http://whqlibdoc.who.int/publications/2007/9789241595759_eng.pdf
Florida Department of Environmental Protection (FDEP). 2003. Water Reuse for Florida Strategies for Effective Use of Reclaimed Water. Tallahasee, Florida: Water Reuse Program, FDEP. http://www.dep.state.fl.us/water/reuse/docs/valued_resource_FinalReport.pdf
Gerba, C.P., and J.B. Rose. 2003. “International guidelines for water recycling: Microbiological considerations.” Water Supply 3, 311–316.
Ghijsen, R., and W. Hoogenboezem. 2000. Endocrine disrupting compounds in the Rhine and Meuse basin. Occurrence in surface, process and drinking water. Amsterdam, RIWA, Vereniging van Rivierwaterbedrijven, Netherland.
Gilbert, R. J., J. de Louvois, T. Donovan, C. Little, K. Nye, et al. 2000. “Guidelines for the microbiological quality of some ready-to-eat foods sampled at the point of sale.” Communicable Disease and Public Health, 3(3): 163–167.
Global Water Partnership. 2000. Integrated Water Resources Management. Technical Advisory Committee (TAC) Background Paper No. 4. Stockholm: Global Water Partnership.
Godfree, A. and S. Godfrey. 2008. Water use criteria: Environmental and health risk based standards and guidelines. In Water Reuse: An International Survey of Current Practice, Issues and Needs, eds. B. Jiménez and T. Asano, pp. 351−369. London: IWA Publishing.
Haas, C. N. 1996. “Acceptable health risk.” Journal of the American Water Works Association 88(12): 8.
Haas, C. N., J.B. Rose and C.P. Gerba. 1999. Quantitative Microbial Risk Assessment. New York, NY: John Wiley & Sons.

159
Hall, G., M.D. Kirk, N. Becke, J.E. Gregory, and L. Unicomb. 2005. “Estimating foodborne gastroenteritis, Australia.” Emerging Infectious Diseases 11(8), 1257−64.
Hillel, D. 2000. Salinity Management for Sustainable Irrigation: Integrating Science, Environment, and Economics. Washington, DC: World Bank.
Hirji, R., and R. Davis. 2008. Strategic Environmental Assessment: Improving Water Resources Governance and Decision Making. Water Sector Board Discussion Paper Series No. 12. Washington, DC: World Bank.
Hope, L., P. Drechsel, and B. Keraita. 2009. Empowering women or empowering men? Gender roles in urban vegetable production and marketing in Ghana. LEISA.
Horner, M.J., L. A.G. Ries, M. Krapcho, N. Neyman, R. Aminou, et al. 2009. SEER Cancer Statistics Review, 1975 2006. Bethesda, MD: National Cancer Institute.
Hussain, I., L. Raschid, M.A. Hanjra; F. Marikar, and W. van der Hoek. 2001. A Framework for Analyzing Socioeconomic, Health and Environmental Impacts of Wastewater Use in Agriculture in Developing Countries. Working Paper No. 26. Colombo: International Water Management Institute.
Idelovitch, E. and K. Ringskog. 1997. Wastewater Treatment in Latin America: Old and New Options. New Directions in Development Series. Washington, DC: World Bank.
Ilic, S., P. Drechsel, P. Amoah and J. LeJeune. 2010. Applying the multiple-barrier approach for microbial risk reduction in the post-harvest sector of wastewater irrigated vegetables. In Wastewater Irrigation and Health: Assessing and Mitigating Risks in Low-income Countries, eds. P. Drechsel, C.A. Scott, L. Raschid-Sally, M. Redwood and A. Bahri), pp. 239−259. London: Earthscan.
Independent Evaluation Group (IEG). 2009a. Water and Development: An Evaluation of World Bank Support 1997-2008. Washington, DC: World Bank.
Independent Evaluation Group (IEG). 2009b. Issues Paper: Wastewater Treatment and Sewerage. Washington, DC: World Bank.
Institute of Medicine. 2003. Scientific Criteria to Ensure Safe Food. Washington, DC: National Academies Press.
Intergovernmental Panel on Climate Change, 2007. Climate Change 2007: Synthesis Report. Geneva, Switzerland: IPCC.
Israel Ministry of Environmental Protection. 2010. “Effluent Quality Standards and Wastewater Treatment Rules.” Reshumot (Official Gazette), April 25. http://www.sviva.gov.il/bin/en.jsp?enPage=e_BlankPage&enDisplay=view&enDispWhat=Object&enDispWho=Articals%5El2092&enZone=Wastewater_Treatment
IWMI. 2002. The Hyderabad Declaration on Wastewater Use in Agriculture, 14 November 2002, Hyderabad, India. Colombo: International Water Management Institute. Available at: http://www.iwmi.cgiar.org/health/wastew/hyderabad_declaration.htm.

160
Jacobi, P., J. Amend, and S. Kiango. 2000. "Urban Agriculture in Dar es Salaam: Providing for an Indespensable Part of the Diet" In N. Bakker, M. Dubbeling, S. Gundel, U. Sabel-Koschella, and H. de Zeeuw (eds.). Growing Cities Growing Food: Urban Agriculture on the Policy Agenda. A Reader on Urban Agriculture, 257-85. Feldafing: German Foundation for International Development (DSE) Publishers.
Jacobi, P., A.W. Drescher, and J. Amend. 2000. Urban Agriculture—Justification and Planning Guidelines. Urban Vegetable Promotion Project (UVPP). Ministry of Agriculture and Co-operatives and Deutsche Gesellschaft für Technische Zusammenarbeit (GTZ), Dar es Salaam: UVPP.
Jiménez, B. 2008. “Wastewater Reuse in Latin America and the Caribbean.” In: Jiménez, B. and T. Asano, eds. “Water Reuse: An International Survey of Current Practice, Issues and Needs.” London: IWA Publishing, pp 177-95.
Jiménez, B. and T. Asano (eds.) 2008a. Water Reuse: An International Survey of Current Practice, Issues and Needs. London: IWA Publishing.
Jiménez, B., and Asano, T. 2008b. “Water reclamation and reuse around the World.” Chapter 1 in Water Reuse: An International Survey of Current Practice, Issues and Needs, Jiménez, B and T. Asano (eds), IWA Publishing, London, p. 648.
Jiménez, B., P. Drechsel, D. Kone, A. Bahri, L. Raschid-Sally and M. Qadar. 2010. Wastewater Sludge and Excreta Use in Developing Countries: An Overview. In: Drechsel, P., C. Scott, L. Rashid-Sally, M. Redwood and A. Bahri (eds.) Wastewater Irrigation and Health: Assessing and Mitigating Risk in Low-Income Countries. London: Earthscan, IDRC, IWMI. pp 3-27.
Juanicó, M. 2008. “Israel as a Case Study.” In: Jiménez, B. and T. Asano (eds.) Water Reuse: An International Survey of Current Practice, Issues and Needs. London: IWA Publishing, pp 483-502.
Karavarsamis, N. and A. J. Hamilton. 2010. “Estimators of annual probability of infection for quantitative microbial risk assessment.” Journal of Water and Health 8(2): 365−373.
Karg, H., P. Drechsel, P. Amoah, R. Jeitler. 2010. “Facilitating the adoption of food safety interventions in the street food sector and on farm.” In Wastewater Irrigation and Health: Assessing and Mitigating Risks in Low-income Countries, eds. P. Drechsel, C. A. Scott, L. Raschid-Sally, M. Redwood and A. Bahri, pp. 319−36. London: Earthscan.
Kemmeren, J. M., M-J. J. Mangen, Y. T. H. P. van Duynhoven and A. H. Havelaar. 2006. Priority Setting of Foodborne Pathogens: Disease Burden and Costs of Selected Enteric Pathogens. RIVM Report 330080001/2006. Bilthoven: National Institute for Public Health and the Environment.
Keraita, B., P. Drechsel and F. Konradsen. 2010. “Up and down the sanitation ladder: Harmonizing the treatment and multiple-barrier perspectives on risk reduction in wastewater irrigated agriculture.” Irrigation and Drainage Systems 24(1−2): 23−35.
161
Kfouri, C., P. Mantovani and M. Jeuland. 2009. Water Reuse in the MNA Region: Constraints, Experiences, and Policy Recommendations. In: Jaganathan, V.J., A.S. Mohamed and A. Kremer (eds.) Water in the Arab World: Management Perspectives and Innovations. Washington, DC: Middle East and North Africa Region, World Bank. pp. 447-77.
Khouri, N., J.M. Kalbermatten, and C.R. Bartone. 1994. Reuse of Wastewater in Agriculture: A Guide for Planners. UNDP-World Bank Water and Sanitation Program Series Report No. 6. Washington, DC: World Bank.
King, F. 1911. Farmers of Forty Centuries, or Permanent Agriculture in China, Korea, and Japan. Madison, WI: Mrs F. H. King; available at http://www.gutenberg.org.
Kosek, M., C. Bern, and R.L. Guerrant. 2003. “The global burden of diarrhoeal disease, as estimated from studies published between 1992 and 2000.” Bulletin of the World Health Organization 81(3): 197−204.
Kotlis, L. 1998. “Water reuse in Argentina.” Water Supply, 16(1/2): 293-94.
Larrain, F. 2009. Aguas Andinas: Efficiency and Good Practices in Santiago de Chile. Powerpoint Presentation to the 4th World Water Forum, Istanbul, March, 2009. http://icerik.worldwaterforum5.org/files/ThematicDocuments/SessionDocuments/18_03_2009/AynalikavakII/Estambul_AA_2009_english.pps
Laval, E., and C. Ferreccio. 2007. “Typhoid Fever: Rise, Peak and Fall of an Infectious Disease in Chile (in Spanish).” Revista Chilena de Infectología, 24(6): 435-40.
Lopez, A. D., C.D. Mathers, M. Ezzati, D. T. Jamison, and C.J.L. Murray. 2006. “Measuring the global burden of disease and risk factors, 1990–2001.” In Global Burden of Disease and Risk Factors, eds. A.D. Lopez, C.D. Mathers, M. Ezzati, D.T. Jamison, and C.J.L. Murray, pp. 1−13. New York, NY: Oxford University Press.
Louati, M.H., and J. Bucknall. 2009. “Tunisia’s Experience in Water Resource Mobilization and Management.” In: Jaganathan, V.J., A.S. Mohamed and A. Kremer, eds. Water in the Arab World: Management Perspectives and Innovations. Washington, DC: Middle East and North Africa Region, World Bank, pp 157-80.
Macler, B. A. and S. Regli. 1992. Use of Microbial Risk Assessment in Setting U.S. Drinking Water Standards. Report No. EPA 814/S-92-001. Washington, DC: Office of Water, U.S. Environmental Protection Agency.
Maldonado, L. 2009. “Urban Agriculture as a Livelihood Strategy in Lima, Peru.” In: M. Redwood, ed.. Agriculture in Urban Planning Generating Livelihoods and Food Security. London: Earthscan-IDRC.
Mara, D.D. 2004. Domestic Wastewater Treatment in Developing Countries. London: Earthscan.
Mara, D.D. 2009. Health Risks from Wastewater Use in Agriculture: A Review. Prepared for World Bank Water Anchor (mimeo).

162
Mara, D.D., and S. Cairncross. 1989. Guidelines for the Safe Use of Wastewater and Excreta in Agriculture and Aquaculture: Measures for Public Health Protection. Geneva: World Health Organization.
Mara, D.D., P.A. Sleigh, U.J. Blumenthal, and R.M Carr. 2007. “Health risks in wastewater irrigation: comparing estimates from quantitative microbial risk analyses and epidemiological studies.” Journal of Water and Health 5(1): 39−50.
Mara, D.D., and A. Sleigh. 2010a. “Estimation of norovirus infection risks to consumers of waste- water-irrigated food crops eaten raw.” Journal of Water and Health 8(1): 39−43.
Mara, D.D., and A. Sleigh. 2010b. “Estimation of Ascaris infection risks in children under 15 from the consumption of wastewater-irrigated carrots.” Journal of Water and Health 8(1): 35−38.
Mara, D.D., and A. Sleigh. 2010c. “Estimation of norovirus and Ascaris infection risks to urban farmers in developing countries using wastewater for crop irrigation.” Journal of Water and Health 8(3): 572−576.
Mara, D. D., and A. Sleigh. 2010d. Quantitative Microbial Risk Analysis: The 2006 WHO Guidelines and Beyond − How to Use the QMRA-Monte Carlo Computer Programs in Wastewater-use Planning. Leeds: School of Civil Engineering, University of Leeds. Available at: http://www.personal.leeds.ac.uk/~cen6ddm/QMRAzip/QMRA_How-to-use-the-programs.pdf.
Mathers, C. D., C. Stein, D. Ma Fat, C. Rao, M. Inoue, N. Tomijima, C. Bernard, A.D. Lopez and C.J.L. Murray. 2002. Global Burden of Disease 2000 − Version 2: Methods and Results. Geneva: World Health Organization.
McCornick, P.M., A. Hijazi and B. Sheikh. 2004. “From Wastewater Reuse to Water Reclamation: Progression of Water Reuse Standards in Jordan.” In: Scott, C.A., N.I. Faruqui, and L. Raschid-Sally (eds.). Wastewater Use in Irrigated Agriculture: Confronting the Livelihood and Environmental Realities. Oxfordshire, UK: CAB International, pp 153-62.
Mead, P. S., L. Slutsker, V. Dietz, L.F. McCaig, J.S. Bresee, et al. 1999. “Food-related illness and death in the United States.” Emerging Infectious Diseases 5(5): 607−625.
MED-UEWI. 2007. Mediterranean Wastewater Reuse Report. MED-EUWI Wastewater Reuse Working Group. http://www.emwis.net/topics/WaterReuse/Final_report.doc
Meehl, G.A., T.F. Stocker, W.D. Collins, P. Friedlingstein, A.T. Gaye, J.M. Gregory, A. Kitoh, R. Knutti, J.M. Murphy, A. Noda, S.C.B. Raper, I.G. Watterson, A.J. Weaver and Z.-C. Zhao. 2007. “Global Climate Projections.” In: Solomon, S., D. Qin, M. Manning, Z. Chen, M. Marquis, K.B. Averyt, M. Tignor and H.L. Miller (eds.) Climate Change 2007: The Physical Science Basis. Contribution of Working Group I to the Fourth Assessment Report of the Intergovernmental Panel on Climate Change. Cambridge, UK: Cambridge University Press.

163
Mekorot (Israel National Water Company). 2006. Wastewater Treatment and Effluent Reuse. Tel Aviv: Mekorot.
Mekorot (Israel National Water Company). 2007. Wastewater Treatment and Reclamation. Tel Aviv: Mekorot.
Moe, C. L. 2009. “Preventing norovirus transmission: how should we handle food handlers?” Clinical Infectious Diseases 48(1): 38–40.
Montresor, A., D.W.T. Crompton, T.W. Gyorkos, and L. Savioli. 2002. Helminth Control in School-age Children: A Guide for Managers of Control Programs. Geneva: World Health Organization.
Mougeot, L.J.A. 2000. "Urban Agriculture: Definition, Presence, Potentials and Risks." Thematic Paper 1. In N. Bakker, M. Dubbeling, S. Gundel, U. Sabel-Koschella, and H. de Zeeuw (eds.). Growing Cities Growing Food: Urban Agriculture on the Policy Agenda. A Reader on Urban Agriculture. Feldafing: German Foundation for International Development (DSE) Publishers.
Mougeot, L.J.A. ed. 2005. AGROPOLIS: The social, political and environmental dimensions of urban Agriculture. London, Earthscan for the International Development Research Centre.
Munro, N. B., and C.C. Travis. 1986. “Drinking•water standards: Risks for chemicals and radionuclides.” Environmental Science and Technology 20(8): 768−69.
Murray, C.J.L., and A.D. Lopez. 1996. The Global Burden of Disease: A Comprehensive Assessment of Mortality and Disability from Diseases, Injuries, and Risk Factors in 1990 and Projected to 2020. Cambridge, MA: Harvard University Press.
Murray, A., and C. Buckley. 2010. “Designing reuse-oriented sanitation infrastructure: the design for service planning approach.” In Wastewater Irrigation and Health: Assessing and Mitigating Risks in Low-income Countries, eds. P. Drechsel, C.A. Scott, L. Raschid-Sally, M. Redwood and A. Bahri, pp. 303−18. London: Earthscan.
Murray, A., and P. Drechsel. 2010. “Positive deviance in the sanitation sector in Ghana: Why do some wastewater treatment facilities work when the majority fail?” Waterlines (submitted).
Navarro, I., B. Jiménez, E. Cifuentes, and S. Lucario. 2009. “Application of helminth ova infection dose curve to estimate the risks associated with biosolid application on soil.” Journal of Water and Health 7(1): 31−44.
Nguyen, T. P. L., A. Dalsgaard, D.C. Phung, and D.D. Mara. 2007. “Microbiological quality of fish grown in wastewater-fed and non-wastewater-fed fishponds in Hanoi, Vietnam: influence of hygiene practices in local retail markets.” Journal of Water and Health 5(2): 209−218.
Obuobie, E., B. Keraita, G. Danso, P. Amoah, O.O. Cofie, L. Raschid-Sally, and P. Drechsel. 2006. Irrigated Urban Vegetable Production in Ghana: Characteristics, Benefits and Risks. IWMI-RUAF-CPWF. Accra: International Water Management Institute.

164
OECD. 2009. Managing Water for All: An OECD Perspective on Pricing and Financing. Paris: OECD.
Overseas Development Institute (ODI). 2009. Economic Dimensions of Urban Agriculture in the Context of Urban Poverty Reduction Strategies. Final Scoping Study prepared for IDRC. Ottawa: IDRC.
Parry, M.L., O.F. Canziani, J.P. Palutikof, P.J. van der Linden, and C.E. Hanson (eds.) 2007. Contribution of Working Group II to the Fourth Assessment Report of the Intergovernmental Panel on Climate Change. Cambridge, UK: Cambridge University Press.
Patel, M. M., M.-A. Widdowson, R. I. Glass, K. Akazawa, J. Vinjé, and U.D. Parashar. 2008. “Systematic literature review of role of noroviruses in sporadic gastroenteritis.” Emerging Infectious Diseases 14(8): 1224−31.
Pearce, F. 2004. “Sewage waters a tenth of world's irrigated crops.” New Scientist, available at: http://www.newscientist.com/article/dn6297.
Penrose, H. 2001. Werribee Farm: A History 1982−2000. Melbourne: Melbourne Water.
Prüss-Üstün A., R. Bos, F. Gore, and J. Bartram. 2008. Safer Water, Better Health: Costs, Benefits and Sustainability of Interventions to Protect and Promote Health. Geneva: World Health Organization.
Rhoades, J. D., A. Kandiah, and A.M. Mashali. 1992. The Use of Saline Waters for Crop Production. Irrigation & Drainage Paper No. 48. Rome: Food and Agriculture Organization.
Robinson, C., A. Evans, and A. Rizwan. 2010. “Improving Management of Urban Wastewater Use in Agriculture, Rajshahi, Bangladesh.” Waterlines 29 (2): 124-46.
Rogers, P., R. Bhatia, and A. Huber. 1998. Water as a Social and Economic Good: How to Put the Principle into Practice. TAC Background Papers No. 2. Stockholm, Sweden: Global Water Partnership. www.gwpforum.org/gwp/library/TAC2.PDF
Sadoff, C., and M. Muller. 2009. Water Management, Water Security and Climate Change Adaptation: Early Impacts and Essential Responses. Global Water Partnership Technical Committee (TEC) Background Paper No. 14. Stockholm, Sweden: Global Water Partnership.
Scott, C.A. 2005. “Investing in the Reuse of Treated Wastewater.” In: Shaping the Future of Water for Agriculture: A Sourcebook for Investment in Agricultural Water Management. Agriculture and Rural Development. Washington, DC: The World Bank. pp 185-189.
Scott, C.A., N.I. Faruqui, and L. Raschid-Sally. 2004. Wastewater use in irrigated agriculture: Management challenges in developing countries. In: Scott, C.A., N.I. Faruqui, and L. Raschid-Sally (eds.) Wastewater Use in Irrigated Agriculture: Confronting the Livelihoods and Environmental Realities. CABI Publishing, UK.

165
Scott, C., P. Drechsel, L. Raschid-Sally, A. Bahri, D. Mara, M. Redwood and B. Jiménez. 2010. “Wastewater irrigation and health: challenges and outlook for mitigating risks in low-income countries.” In: Drechsel, P., C. Scott, L. Rashid-Sally, M. Redwood and A. Bahri (eds.) Wastewater Irrigation and Health: Assessing and Mitigating Risk in Low-Income Countries. London: Earthscan, pp 381−94.
Seidu, R., A. Heistad, P. Amoah, P. Drechsel, P. D. Jenssen and T-A. Strenström. 2008. “Quantification of the health risk associated with wastewater reuse in Accra, Ghana: A contribution toward local guidelines.” Journal of Water and Health 6(4): 641−671.
Seidu, R., and P. Drechsel. 2010. “Cost-effectiveness of interventions for diarrhoeal disease reduction among consumers of wastewater-irrigated lettuce in Ghana.” In Wastewater Irrigation and Health: Assessing and Mitigating Risks in Low-income Countries, eds. P. Drechsel, C.A. Scott, L. Raschid-Sally, M. Redwood and A. Bahri, pp. 261−83. London: Earthscan.
Shelef, G. 1991. “Wastewater reclamation and water resources management.” Water Science and Technology 24(9): 251−265.
Shetty, S. 2004. Treated Wastewater Use in Tunisia: Lessons Learned and the Road Ahead. In: Scott, C.A., N.I. Faruqui and L. Raschid-Sally, eds. Wastewater Use in Irrigated Agriculture: Confronting the Livelihood and Environmental Realities. Wallingford: CAB International, pp 163-71.
Shilton, A.N. 2006. Pond Treatment Technology. London: IWA Publishing.
Shuval, H.I., and D.D. Mara. 1985. “Health aspects of wastewater and excreta use in agriculture and aquaculture: The Engelberg Report.” IRCWD News No. 23, pp. 11−18. Dübendorf: International Reference Centre on Wastes Disposal.
Shuval H.I., A. Adin, B. Fattal, E. Rawitz, and P. Yekutiel. 1986. Wastewater Irrigation in Developing Countries: Health Effects and Technical Solutions. Technical Paper No. 51. Washington, DC: World Bank.
Shuval, H., Y. Lampert and B. Fattal. 1997. “Development of a risk assessment approach for evaluating wastewater reuse standards for agriculture.” Water Science and Technology, 35(11−12): 15−20.
Silva-Ochoa, P., and C.A. Scott. 2004. Treatment Plant Effects on Wastewater Irrigation Benefits: Revisiting a Case Study in the Guanajuato River Basin, Mexico. In: Scott, C.A., N.I. Faruqui and L. Raschid-Sally (eds.). Wastewater Use in Irrigated Agriculture: Confronting the Livelihood and Environmental Realities. Wallingford: UK: CAB International. pp 145-152.
Smit, J., A. Ratta, and J. Bernstein. 1996. Urban Agriculture: An Opportunity for Environmentally Sustainable Development in Sub-Saharan Africa. Post-UNCED Series: Towards Environmentally Sustainable Development in Sub-Saharan Africa, Paper No. 11. Washington, DC: World Bank Africa Technical Department.

166
Smith, T. 1895. “Notes on Bacillus coli commune and related forms, together with some suggestions concerning the bacteriological examination of drinking water.” American Journal of Medical Science 110: 283–302.
State of California. 2001. California Health Laws Related to Recycled Water −“The Purple Book”: Excerpts from the Health and Safety Code, Water Code, and Titles 22 and 17 of the California Code of Regulations. Available at: http://www.cdph.ca.gov/certlic/drinkingwater/Documents/Recharge/Purplebook update6-01.pdf.
State Water Resources Control Board (SWRCB). 2008. Water Recycling Funding Program Guidelines. Sacramento, California: SWRCB. http://www.waterboards.ca.gov/water_issues/programs/water_recycling_policy/docs/final_wrfpguidelines071508.pdf
Streit, S. 1986. Municipal Sewage Treatment Combined with Deep Long Detention Storage and Irrigation in Israel. World Bank Water and Urban Development Seminar, October 1986, Washington, DC.
Tanaka, H., T. Asano, E. D. Schroeder, and G. Tchobanoglous. 1998. “Estimating the safety of wastewater reclamation and reuse using enteric virus monitoring data.” Water Environment Research 70(1): 39−51.
Tanji, K.K., and N.C. Kielen. 2002. Agricultural Drainage Water Management in Arid and Semi-arid Areas. Irrigation and Drainage Paper No. 61. Rome: Food and Agriculture Organization.
Tchobanoglous, G., and Schroeder, D. 1985. Water Quality. Davis, CA: University of California, Davis.
Teunis, P.F.M., C.L. Moe, P. Liu, S. Miller, L. Lindesmith, R.S. Baric, J. LePendu, and R.L. Calderon. 2008. “Norwalk virus: How infectious is it?” Journal of Medical Virology 80(8): 1468-76.
UNDP (United Nations Development Program). 1996. Urban Agriculture: Food, Jobs and Sustainable Cities. UNDP Publication Series for Habitat II, Volume One. New York: UNDP.
UNFPA (United Nations Population Fund). 2002. The State of World Population 2001: Demographic, Social and Economic Indicators. New York, NY: United Nations Population Fund. Available at: http://www.unfpa.org/swp/2001/english/indicators/indicators2.html
UN-HABITAT. 2008. Global Atlas of Excreta, Wastewater Sludge, and Biosolids Management: Moving Forward the Sustainable and Welcome Uses of a Global Resource. Nairobi: United Nations Human Settlements Programme.
U.S. EPA. 1973. Water Quality Criteria 1972. Report No. EPA-R3-73-003. Washington, DC: U.S. Environmental Protection Agency.

167
U.S. EPA. 1992. Guidelines for Water Reuse. Report No. EPA-600/8-80-036. Cincinnati, OH: Center for Environmental Research Information, U.S. Environmental Protection Agency.
U.S. EPA and USAID. 2004. Guidelines for Water Reuse (Report No. EPA/625/R-04/108). Washington, DC: U.S. Environmental Protection Agency and U.S. Agency for International Development.
Van der Hoek. 2004. “A Framework for a Global Assessment of the Extent of Wastewater Irrigation: The Need for a Common Typology. “Chapter 2 in C.A. Scott, N.I. Faruqui, and L. Raschid-Sally (eds.). Wastewater Use in Irrigated Agriculture: Confronting the Livelihood and Environmental Realities. Wallingford: CABI.
Van Gool, H. 2003. Wastewater Reuse. Water Resources and Environment Technical Note F.3. Washington, DC: World Bank.
Veenhuizen, R. van, and G. Danso. 2007. Profitability and Sustainability of Urban and Peri-Urban Agriculture. Agricultural Management, Marketing and Finance Occasional Paper 19. Rome: Food and Agriculture Organization of the United Nations.
Von Sperling, M. and B. Fattal. 2001. Implementation of Guidelines: Some Practical Aspects. In: Fewtrell, L. and J. Bartram, editors. Water Quality: Guidelines, Standards and Health. London, UK: IWA Publishing, pp 361-76.
Westcot, D.W. 1997. Quality Control of Wastewater for Irrigated Crop Production. Water Reports No. 10. Rome: Food and Agriculture Organization.
WHO. 1973. Reuse of Effluents: Methods of Wastewater Treatment and Health Safeguards. Technical Report Series No. 517. Geneva: World Health Organization.
WHO. 1989. Health Guidelines for the Use of Wastewater in Agriculture and Aquaculture. Technical Report Series No. 778. Geneva: World Health Organization.
WHO. 1996. Guidelines for Drinking-water Quality, 2nd edition. Geneva: World Health Organization.
WHO. 2001. Depleted Uranium: Sources, Exposure and Health Effects. Report No. WHO/ SDE/ PHE/01.1). Geneva: World Health Organization.
WHO. 2004. Guidelines for Drinking-water Quality. 3rd edition. Geneva: World Health Organization.
WHO. 2006. WHO Guidelines for the Safe Use of Wastewater, Excreta and Greywater. Vol. I: Policy and Regulatory Aspects. Vol. II: Wastewater Use in Agriculture. Vol. III: Watewater and Excreta Use in Aquaculture. Vol. IV: Excreta and Greywater Use in Agriculture. Geneva: World Health Organization.
WHO. 2007. Levels of Protection. Geneva: World Health Organization – available online at: http://www.who.int/water_sanitation_health/gdwqrevision/levelsofprotection/en/index.html.

168
WHO. 2008a. Guidelines for Drinking-water Quality, Third Edition Incorporating the First and Second Addenda – Volume 1: Recommendations. Geneva: World Health Organization.
WHO. 2008b. “Microbial fact sheets.” In Guidelines for Drinking-water Quality, Third Edition Incorporating the First and Second Addenda – Volume 1: Recommendations, pp. 221–95. Geneva: World Health Organization.
WHO. 2008c. “Chemical fact sheets.” In Guidelines for Drinking-water Quality, Third Edition Incorporating the First and Second Addenda – Volume 1: Recommendations, pp. 296–460. Geneva: World Health Organization.
WHO. 2010. Health-based Targets. Geneva: World Health Organization. Available online at: http://www.who.int/water_sanitation_health/WHS_WWD2010_health_targets_2010_8_en.pdf.
WHO/UNICEF Joint Monitoring Programme for Water Supply and Sanitation. 2000. Global Water Supply and Sanitation Assessment 2000 Report. Geneva: World Health Organization.
WHO/UNICEF Joint Monitoring Programme for Water Supply and Sanitation. 2008. Progress on Drinking Water and Sanitation: Special Focus on Sanitation. New York: World Health Organization and United Nations Children’s Fund.
WHO/UNICEF Joint Monitoring Programme for Water Supply and Sanitation. 2010. Progress on Sanitation and Drinking Water: 2010 Update. New York: World Health Organization and United Nations Children’s Fund.
Winpenny, J. 2003. Financing Water for All. Report of the World Panel on Financing Water Infrastructure, chaired by Michel Camdessus. http://www.financingwaterforall.org/fileadmin/wwc/Library/Publications_and_reports/CamdessusReport.pdf
World Bank. 1993a. World Development Report 1993: Investing in Health. New York, NY: Oxford University Press.
World Bank. 1993b. Water Resources Management. Washington, DC: World Bank.
World Bank. 1993c. Water Supply and Sewerage Projects: The Bank’s Experience, 1967-1989. Operations Evaluation Department, Washington, DC.
World Bank. 2000. Project Appraisal Document: Tehran Sewerage Project. Report No. 20154 IRN. Washington, DC: World Bank.
World Bank. 2004. Water Resources Sector Strategy: Strategic Direction for World Bank Engagement. Washington, DC: World Bank.
World Bank. 2005a. Shaping the Future of Water for Agriculture: A Sourcebook for Investment in Agricultural Water Management. Washington, DC: World Bank.

169
World Bank. 2005b. Managing the Livestock Revolution: Policy and Technology to Address the Negative Impacts of a Fast-Growing Sector. Washington, DC: World Bank Agriculture and Rural Development Department.
World Bank. 2005c. “Urban and Periurban Agriculture.” Agriculture Investment Note in Agriculture Investment Sourcebook. Washington, DC: World Bank Agriculture and Rural Development Department.
World Bank. 2005d. Meeting the Challenges of Africa's Development: A World Bank Group Action Plan. Washington, DC: World Bank.
World Bank. 2006. Reengaging in Agricultural Water Management: Challenges and Opportunities. Directions in Development. Washington, DC: World Bank.
World Bank. 2009. Implementation Completion Report: Tehran Sewerage Project Phase 1. Report No. ICR00001028. Washington, DC: World Bank.
Xianjun, C., G. Zhanyi, N. Jayawardane, J. Blackwell, and T. Biswas. 2003. “Filter Technology: Integrated Wastewater Irrigation and Treatment, a Way of Water Scarcity Alleviation, Pollution Elimination and Health Risk Prevention.” UNESCAP Water Resources Journal, December, 79-87.
Xie, J., A. Liebenthal, J.J. Warford, J.A. Dixon, M. Wang, S. Gao, S. Wang, Y. Jian, and Z. Ma. 2009. Addressing China’s Water Scarcity: Recommendations for Selected Water Resources Management Issues. Washington, DC: World Bank
Yarur, I. 2009. The Financial Crisis and Its Implication for Infrastructure in Water Production and Sanitation, the Case of Chile. Powerpoint Presentation to the Pacific Economic Cooperation Council General Assembly, May 13, 2009, Washington, DC. http://www.pecc.org/resources/doc_download/812
Zhou, G., J. Warford, and X. Liu. 2006. Water Resources Management in an Arid Environment: The Case of Israel. World Bank Analytical and Advisory Assistance (AAA) Program for China: Addressing Water Scarcity Background Paper No. 3. Washington, DC: The World Bank.