Embed Size (px)
Citation preview
Improving the use of breastmilk in the neonatal unit: a care bundle approach
UNICEF Baby Friendly InitiativeAnnual Conference 2013
Michele Upton
Working together to reduce NEC and improve outcomes
The NEC care bundle
• Background to the project• What is NEC?• Developing the pathway (care bundle)• Elements• Practical application in care • Findings
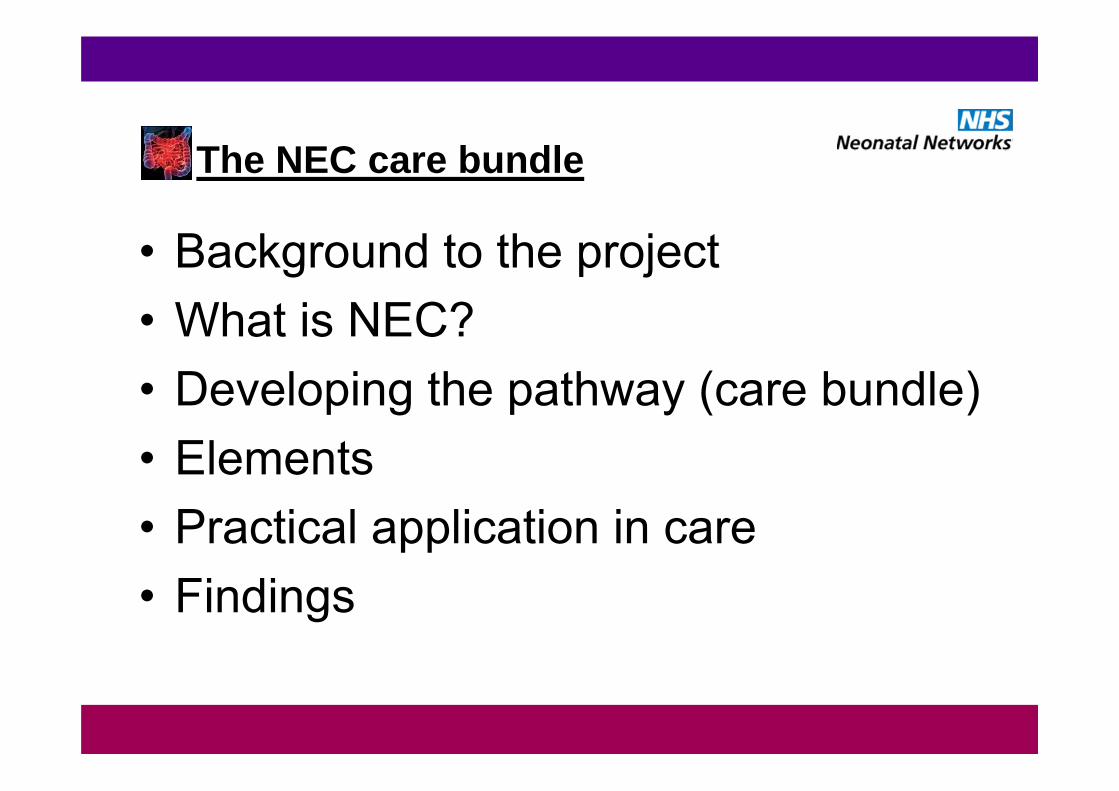
The east of England ODN
• 2 networks (NSC+Essex and B&H)18 neonatal units (17)
• Delivery population 70 000
• Admissions 9750 (2012)
• 10% England

Background
• Developed to reduce NEC rates
• Clinical concern in EoE re ↑ NEC (2009)
• Care bundle approach – QI - notresearch
Background“A group of evidence based interventions
related to a disease or care process that, when executed together, result in better outcomes than when implemented individually” (IHI, 2005)
• Encourage collaborative working, new insights into care; behavioural changes
Care Bundles
• Interventions (4 – 5 elements) evidence based, simple to implement – day to day
• Must fit in with local practice
• Already regarded as best practice
• Improve both clinical and organisational outcomes (regional / national)
What is NEC?• Inflammatory disease of the bowel
• Prevalent in preterm and LBW babies
• Management – medical and/or surgery
• Long term morbidity, burden on the NHS.

What is NEC?
• Aetiology unknown – feeds, GA, BW, infection, gut flora.
• No national definition–incidence unknown. No national database
• Significant impact on families and staff. Important issue!
Background• Regional representation of a MDT• Scoped practices: variations in mgt
NEC; feeding, milk kitchen standards
• Literature review – 16 contributory and preventative factors
• Case note reviews – 2009 NEC cases
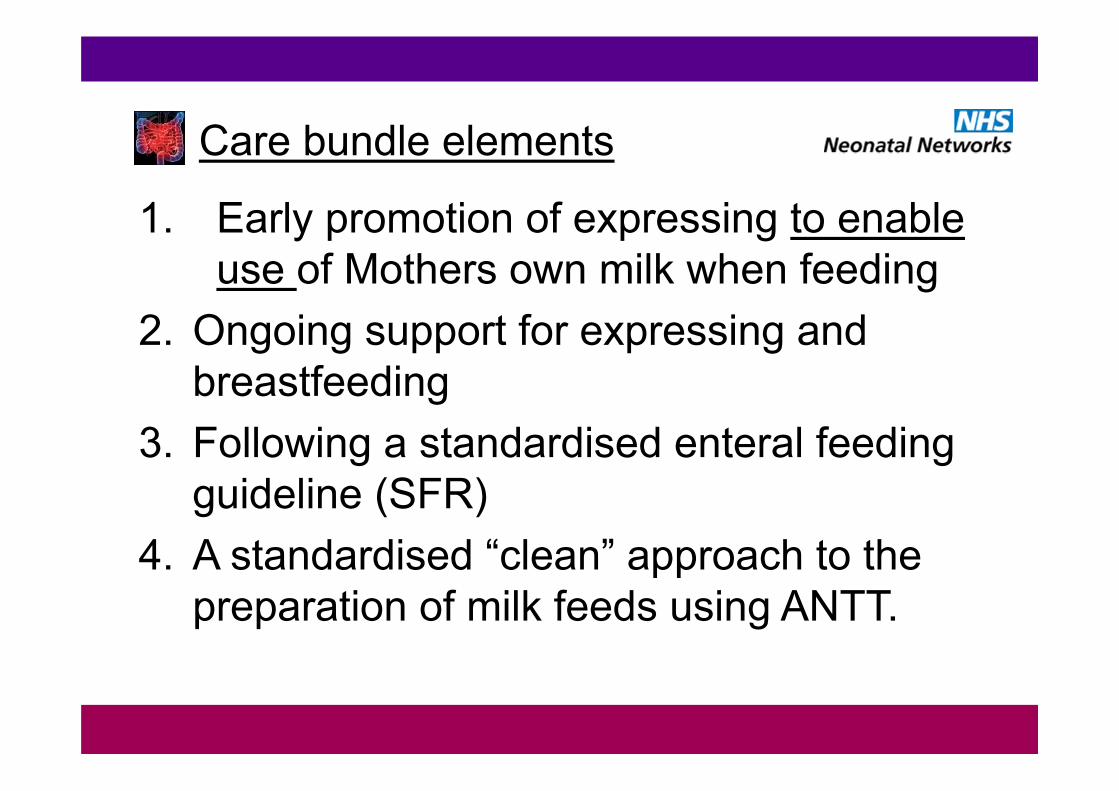
Care bundle elements
1. Early promotion of expressing to enable use of Mothers own milk when feeding
2. Ongoing support for expressing and breastfeeding
3. Following a standardised enteral feeding guideline (SFR)
4. A standardised “clean” approach to the preparation of milk feeds using ANTT.
Implementation
• Implemented Jan 2011• Local champions• Monthly audit cycle of compliance• Feeding practices (SFR)• Results and updates published

AnalysisNDAU expertise sought March 2011• Objective analysis of findings• Comparator group
May 2011: UKNC-NEC study:Validation studies – improved data collection
and completeness

Early promotion of expressing and use of Mothers own milk when feeding. Day 0 – 9.Care plan which prompted:
• The “Crucial Conversation” + excluding medication • Information pack with: EoE breastfeeding leaflet Bliss booklet – Breastfeeding your premature baby Bliss leaflet – Comfort holding and Kangaroo care Expressing log, Local information, SW DVD, Poster Syringes (small), labels, collecting bottle
• Support to express within 4-6 hours of delivery• Top Tips – consistent advice on expressing• Pump hire
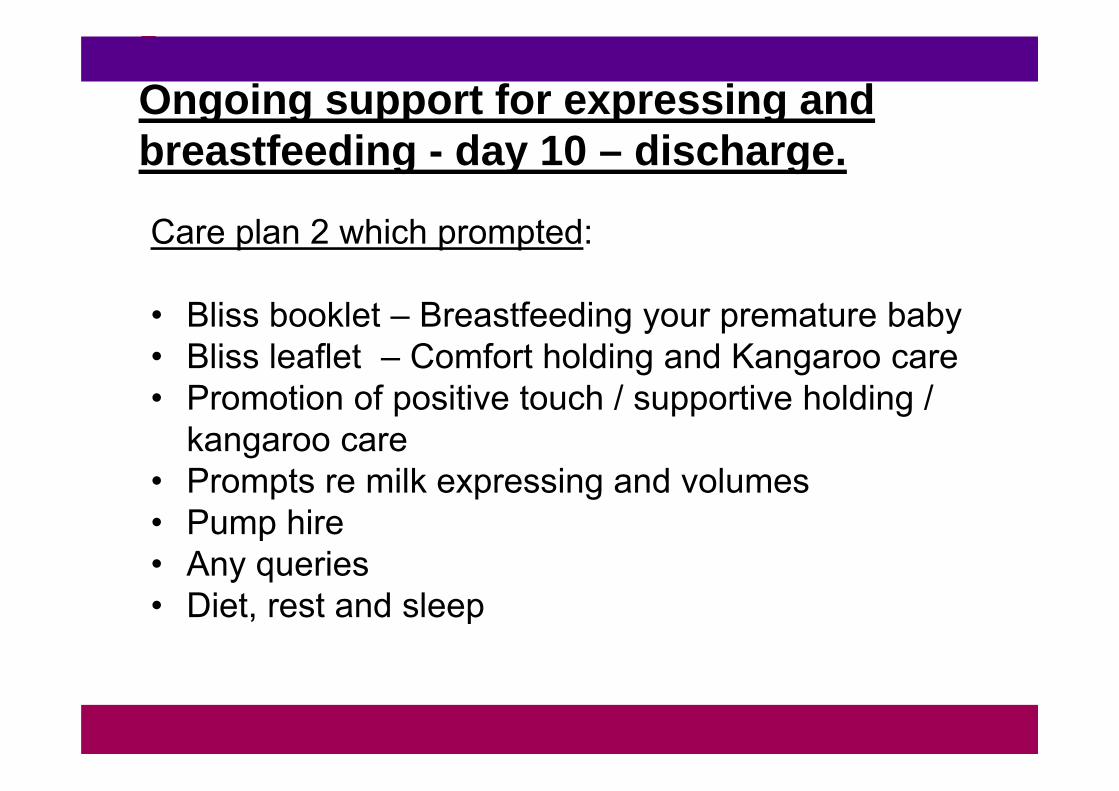
2. Ongoing support for expressing and breastfeeding - day 10 – discharge.
Care plan 2 which prompted:
• Bliss booklet – Breastfeeding your premature baby• Bliss leaflet – Comfort holding and Kangaroo care• Promotion of positive touch / supportive holding /
kangaroo care• Prompts re milk expressing and volumes • Pump hire• Any queries• Diet, rest and sleep

Algorithm 1 Initiating and advancing enteral feeds.
This algorithm is to be used in conjunction with Algorithm 2 – choice of milk High risk Moderate risk Standard risk 28+1 – 31+6 wk >32 wk Step 1: First day of Feeding maintain trophic feeds in high risk infants Step 2: Advance as indicated Step 3 Commence feeding as close to birth as possible following individual clinical assessment. Maintain trophic feeds in high risk infants as long as clinically indicated. Infants can move between risk categories following individual clinical assessment. High risk defined as: <28 weeks gestation < 1000g birth weight Preterm SGA infant (<2nd percentile and <34 weeks gestation) Absent or reversed end diastolic flow in infants <34 weeks Unstable /hypotensive ventilated neonates Re-establishment of feeds following NEC Perinatal hypoxia-ischaemia with significant organ dysfunction. Congenital gut malformations (eg gastroschisis) Caution should be taken initiating feeds in the following subgroups. The decision to manage as “high risk” is at clinician's discretion. Severe SGA infants (<0.4th percentile and >34 weeks gestation) Indomethecin or Ibuprofen for PDA Complex congenital cardiac disease Dexamethasone treatment Polycythaemic infants
10-20ml/kg/day 2 hourly trophic
feeds
20ml/kg/day 2 hourly feeds*
30-60ml/kg/day 3 hourly feeds *
15ml/kg twice in 24 hours as 2 hourly feeds
30ml/kg/day
3 hourly feeds
Continue to increase by 10/ml/kg twice in 24 hrs
until 180ml/kg as 1-2 hourly feeds.
Increase beyond 180ml/kg only after assessment of
growth.
Continue increasing at this rate until full enteral volume
achieved
10ml/kg twice in 24 hours as 1-2
hourly feeds
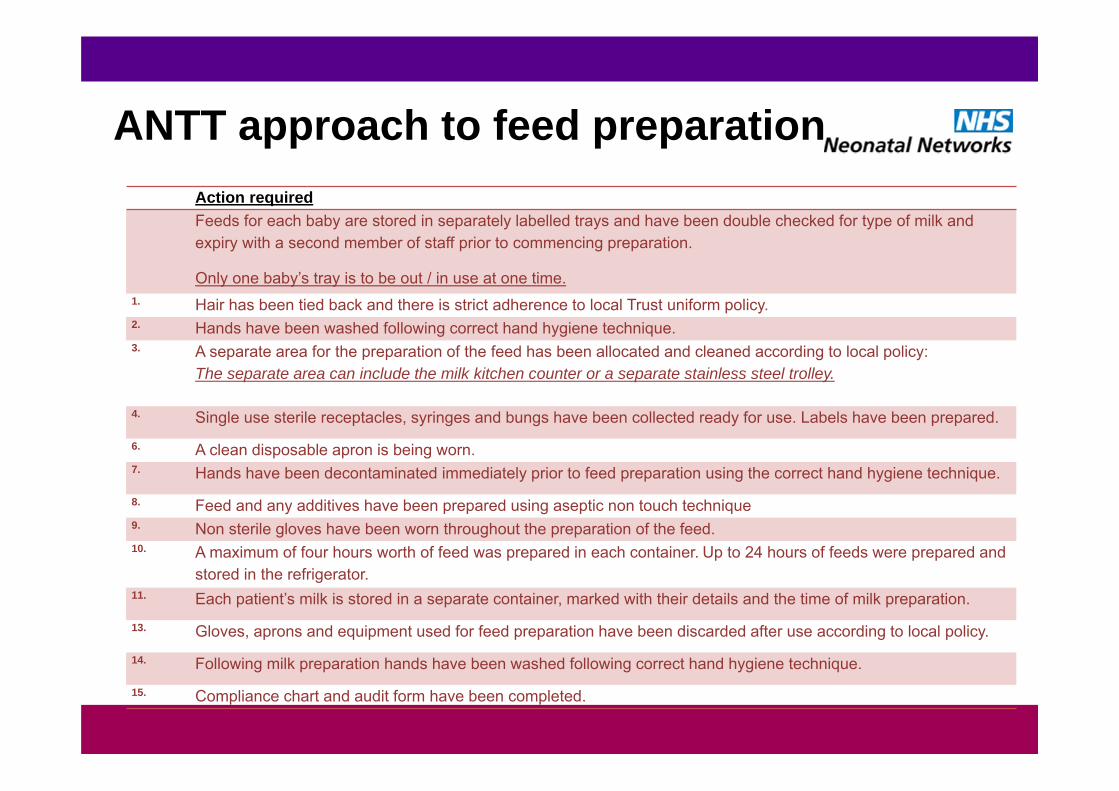
ANTT approach to feed preparationAction requiredFeeds for each baby are stored in separately labelled trays and have been double checked for type of milk and expiry with a second member of staff prior to commencing preparation.
Only one baby’s tray is to be out / in use at one time. 1. Hair has been tied back and there is strict adherence to local Trust uniform policy.2. Hands have been washed following correct hand hygiene technique.3. A separate area for the preparation of the feed has been allocated and cleaned according to local policy:
The separate area can include the milk kitchen counter or a separate stainless steel trolley.
4. Single use sterile receptacles, syringes and bungs have been collected ready for use. Labels have been prepared.
6. A clean disposable apron is being worn.7. Hands have been decontaminated immediately prior to feed preparation using the correct hand hygiene technique.
8. Feed and any additives have been prepared using aseptic non touch technique9. Non sterile gloves have been worn throughout the preparation of the feed.10. A maximum of four hours worth of feed was prepared in each container. Up to 24 hours of feeds were prepared and
stored in the refrigerator.11. Each patient’s milk is stored in a separate container, marked with their details and the time of milk preparation.
13. Gloves, aprons and equipment used for feed preparation have been discarded after use according to local policy.
14. Following milk preparation hands have been washed following correct hand hygiene technique.
15. Compliance chart and audit form have been completed.

Antenatalperiod
Midwives, Neonatologists, Neonatal nurses
Breastfeeding leaflet
Discussion re feeding
Neonatal nurses Lactation specialists
Comm MW
Breastfeeding leafletDiscussion re feeding
Care plan day 0 – 9
Element 1 Element 1
Discharge home
Neonatologists, ANNP’s, neonatal nurses
Follow a standardised
feeding regimen (SFR)
Element 3 Element 4
Neonatal nurses who prepare feeds
Follow a double checking prompt when preparing
milk feeds
DELIVERYCare plan day 10 to
dischargeKC
BF support
Element 2
Neonatal nursesMidwives on PNW
Lactation specialistsNeonatologists
Aims - regional
Primary aim: To reduce the incidence of NEC –
(statistical challenge)
Association between bundle and NEC
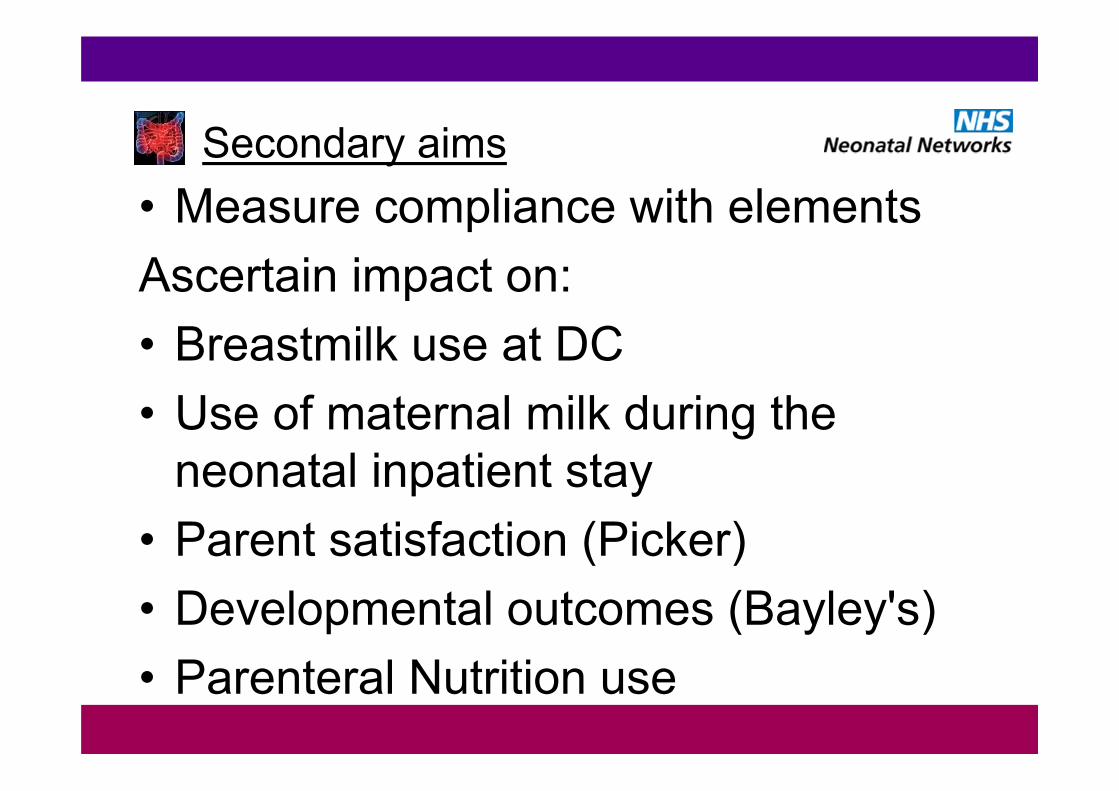
Secondary aims • Measure compliance with elementsAscertain impact on: • Breastmilk use at DC• Use of maternal milk during the
neonatal inpatient stay• Parent satisfaction (Picker)• Developmental outcomes (Bayley's)• Parenteral Nutrition use
Delivering High Quality Neonatal Care for the east of England Preterm and Sick Baby
Evaluating outcomesQuality Improvement : Research
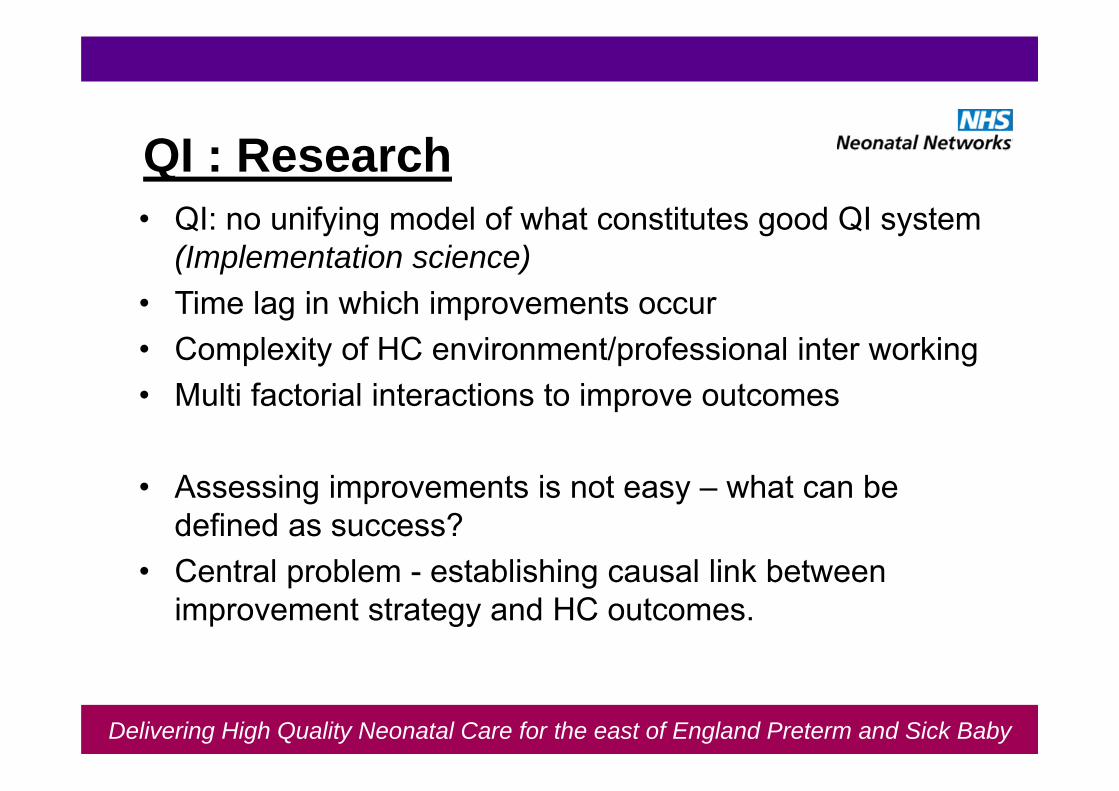
QI : Research• QI: no unifying model of what constitutes good QI system
(Implementation science)• Time lag in which improvements occur• Complexity of HC environment/professional inter working • Multi factorial interactions to improve outcomes
• Assessing improvements is not easy – what can be defined as success?
• Central problem - establishing causal link between improvement strategy and HC outcomes.
Delivering High Quality Neonatal Care for the east of England Preterm and Sick Baby
Delivering High Quality Neonatal Care for the east of England Preterm and Sick Baby
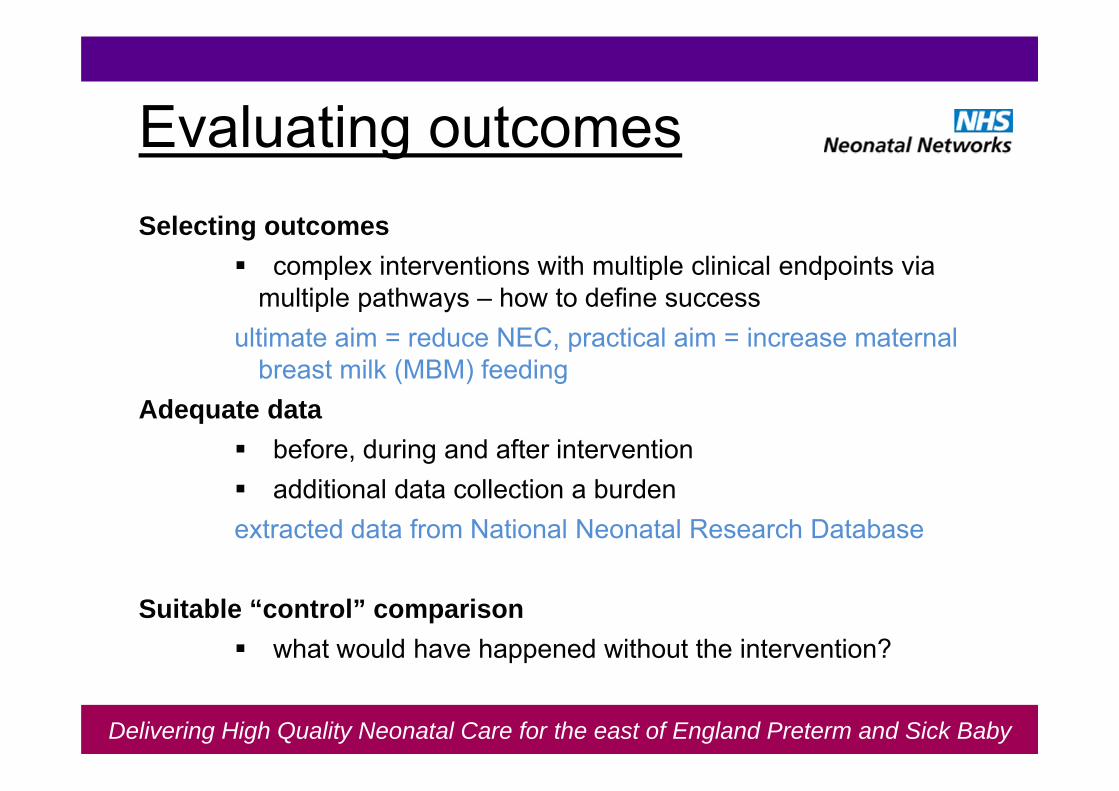
Evaluating outcomesSelecting outcomes
complex interventions with multiple clinical endpoints via multiple pathways – how to define success
ultimate aim = reduce NEC, practical aim = increase maternal breast milk (MBM) feeding
Adequate data before, during and after intervention additional data collection a burdenextracted data from National Neonatal Research Database
Suitable “control” comparison what would have happened without the intervention?
Regional Findings
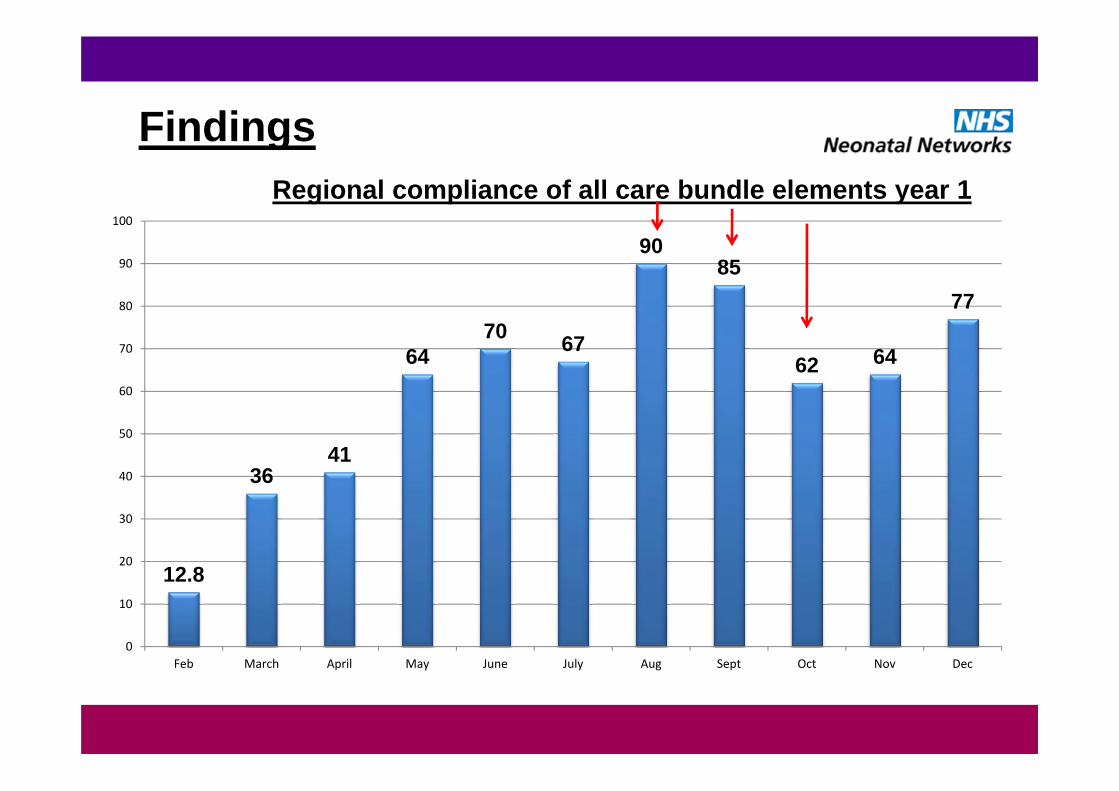
Findings
12.8
3641
6470 67
9085
62 64
77
0
10
20
30
40
50
60
70
80
90
100
Feb March April May June July Aug Sept Oct Nov Dec
Regional compliance of all care bundle elements year 1
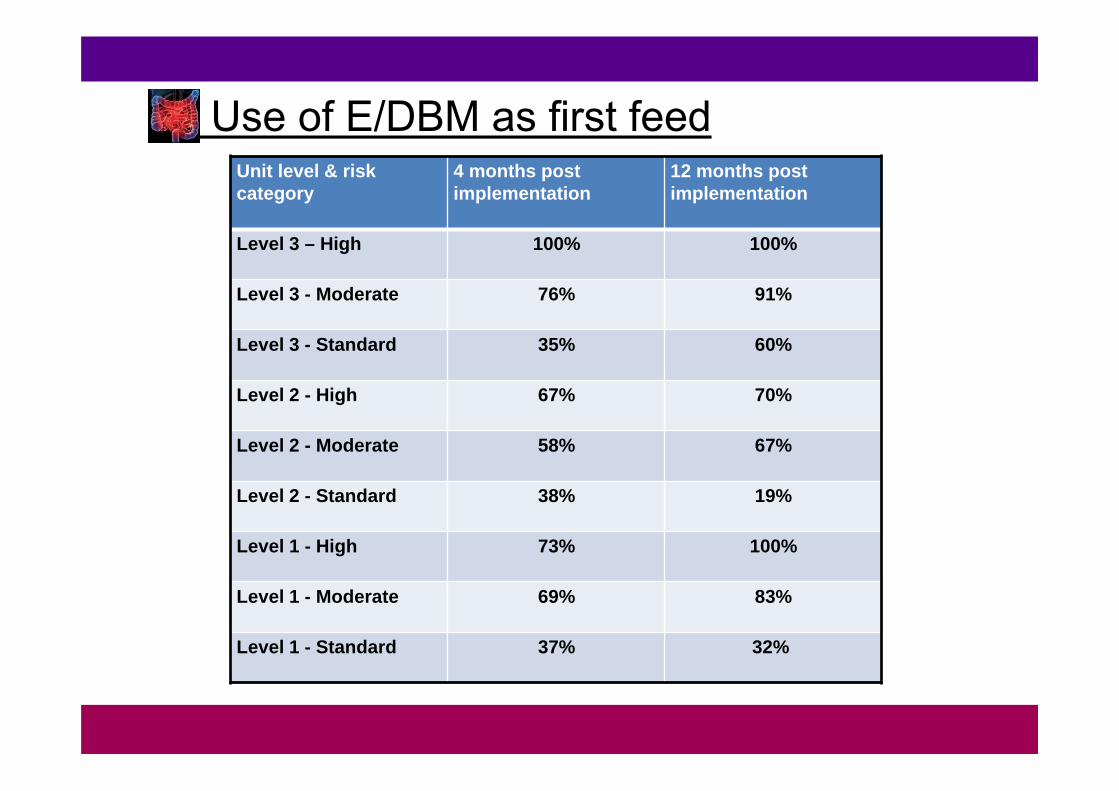
Use of E/DBM as first feedUnit level & risk category
4 months post implementation
12 months post implementation
Level 3 – High 100% 100%
Level 3 - Moderate 76% 91%
Level 3 - Standard 35% 60%
Level 2 - High 67% 70%
Level 2 - Moderate 58% 67%
Level 2 - Standard 38% 19%
Level 1 - High 73% 100%
Level 1 - Moderate 69% 83%
Level 1 - Standard 37% 32%
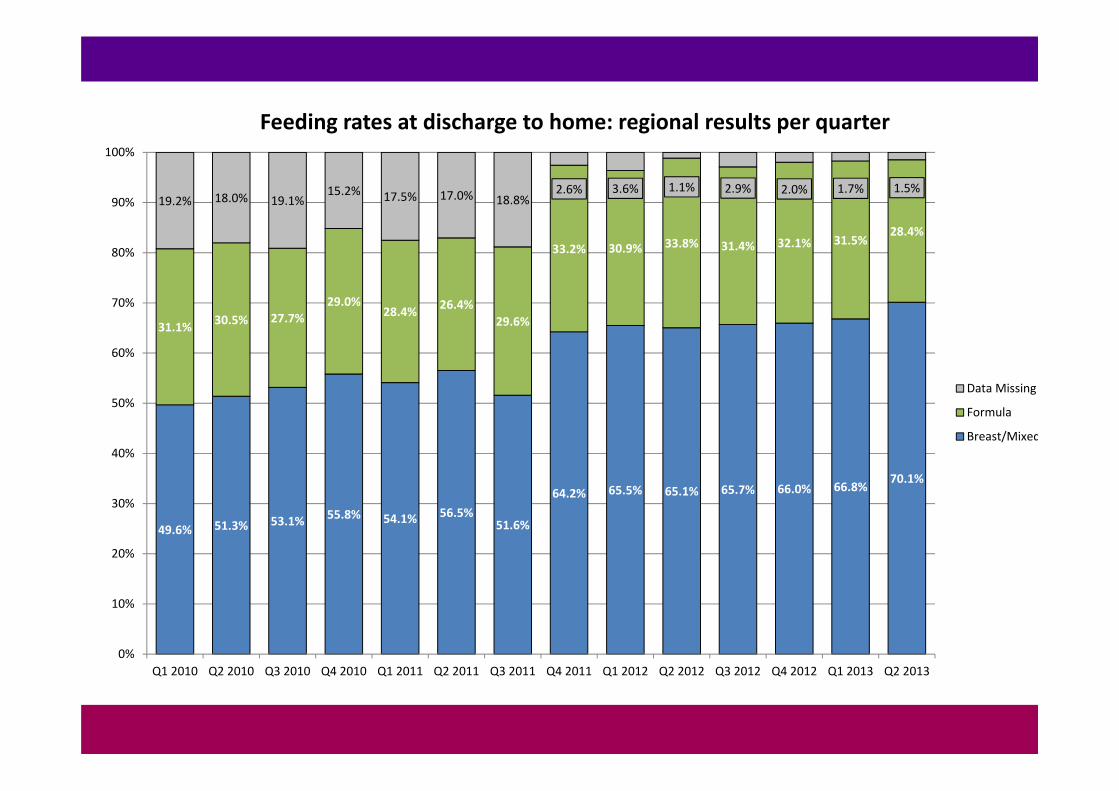
49.6% 51.3% 53.1% 55.8% 54.1% 56.5%51.6%
64.2% 65.5% 65.1% 65.7% 66.0% 66.8% 70.1%
31.1% 30.5% 27.7%29.0%
28.4% 26.4%29.6%
33.2% 30.9% 33.8% 31.4% 32.1% 31.5%28.4%
19.2% 18.0% 19.1%15.2% 17.5% 17.0% 18.8%
2.6% 3.6% 1.1% 2.9% 2.0% 1.7% 1.5%
0%
10%
20%
30%
40%
50%
60%
70%
80%
90%
100%
Q1 2010 Q2 2010 Q3 2010 Q4 2010 Q1 2011 Q2 2011 Q3 2011 Q4 2011 Q1 2012 Q2 2012 Q3 2012 Q4 2012 Q1 2013 Q2 2013
Feeding rates at discharge to home: regional results per quarter
Data Missing
Formula
Breast/Mixed
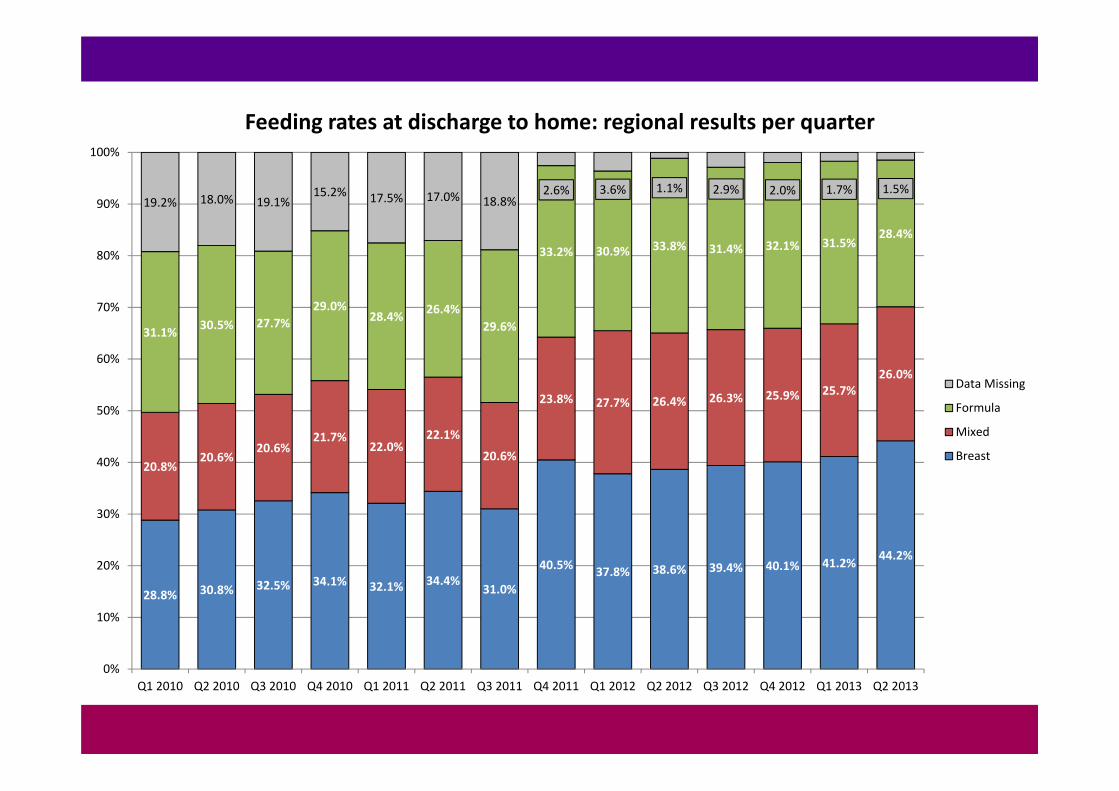
28.8% 30.8% 32.5% 34.1% 32.1% 34.4%31.0%
40.5% 37.8% 38.6% 39.4% 40.1% 41.2% 44.2%
20.8%20.6%
20.6%21.7%
22.0%22.1%
20.6%
23.8% 27.7% 26.4% 26.3% 25.9% 25.7%26.0%
31.1% 30.5% 27.7%29.0%
28.4% 26.4%29.6%
33.2% 30.9% 33.8% 31.4% 32.1% 31.5%28.4%
19.2% 18.0% 19.1%15.2% 17.5% 17.0% 18.8%
2.6% 3.6% 1.1% 2.9% 2.0% 1.7% 1.5%
0%
10%
20%
30%
40%
50%
60%
70%
80%
90%
100%
Q1 2010 Q2 2010 Q3 2010 Q4 2010 Q1 2011 Q2 2011 Q3 2011 Q4 2011 Q1 2012 Q2 2012 Q3 2012 Q4 2012 Q1 2013 Q2 2013
Feeding rates at discharge to home: regional results per quarter
Data Missing
Formula
Mixed
Breast
Findings - NDAU
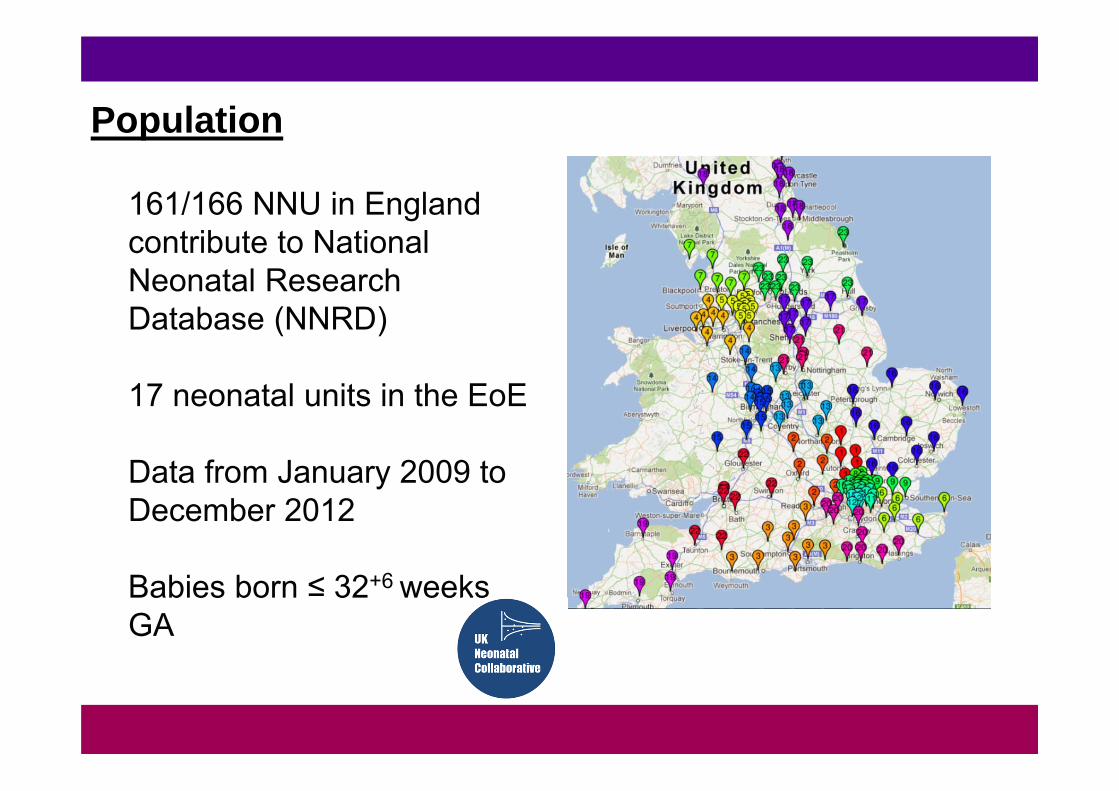
Population
161/166 NNU in England contribute to National Neonatal Research Database (NNRD)
17 neonatal units in the EoE
Data from January 2009 to December 2012
Babies born ≤ 32+6 weeks GA
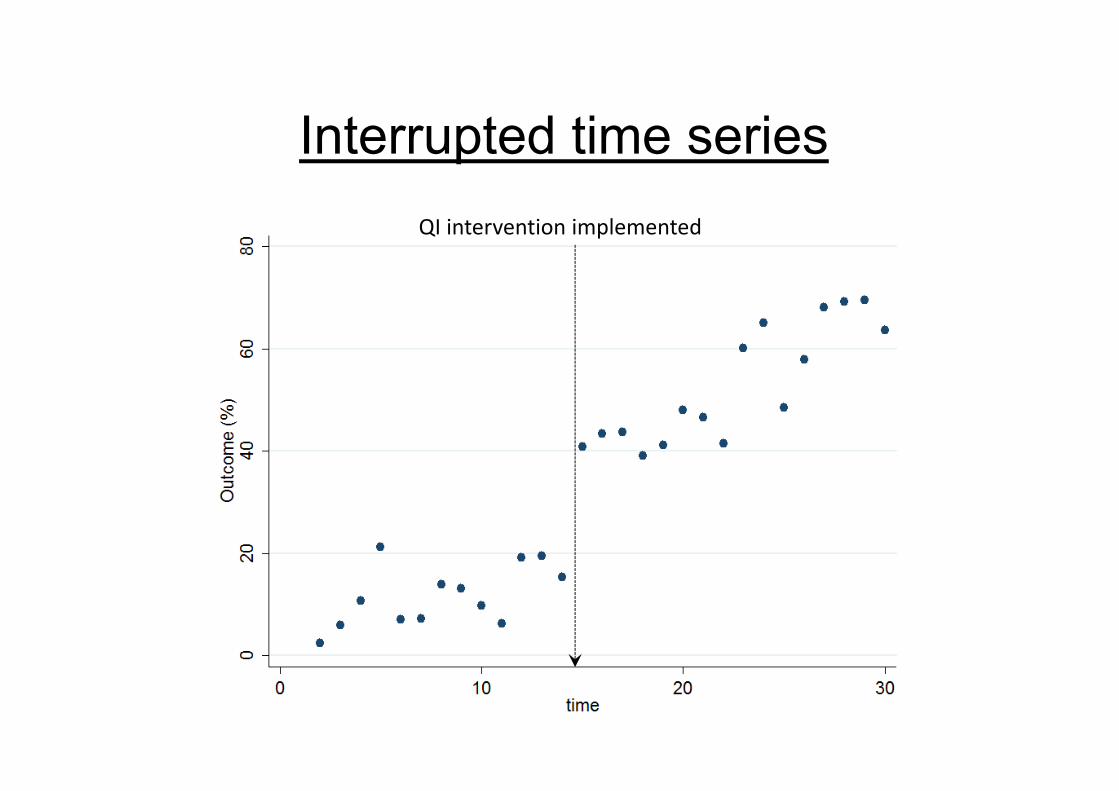
Interrupted time seriesQI intervention implemented
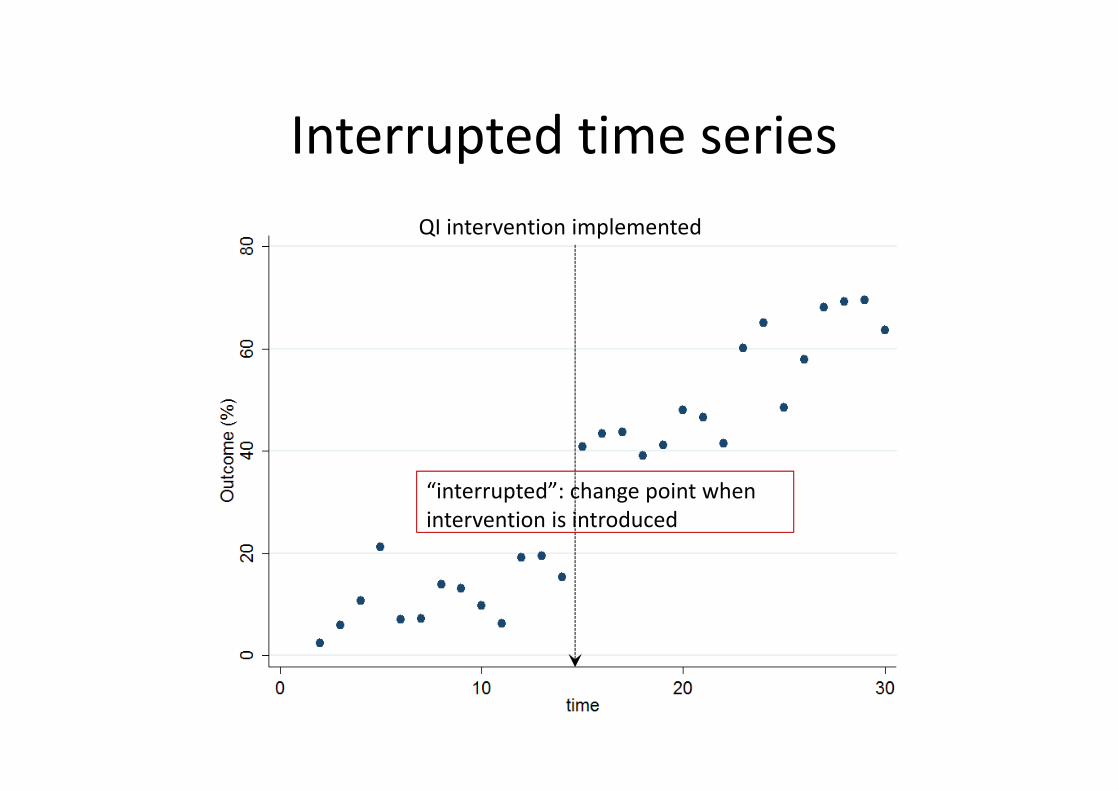
Interrupted time seriesQI intervention implemented
“interrupted”: change point when intervention is introduced
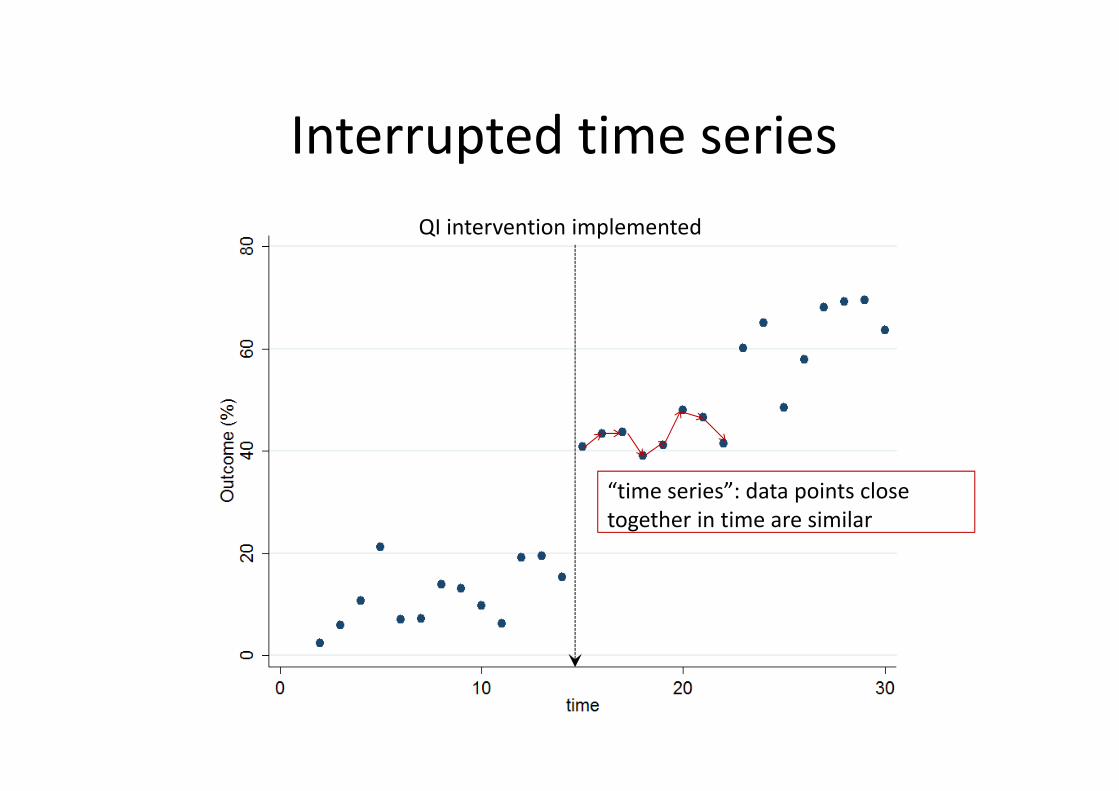
Interrupted time seriesQI intervention implemented
“time series”: data points close together in time are similar
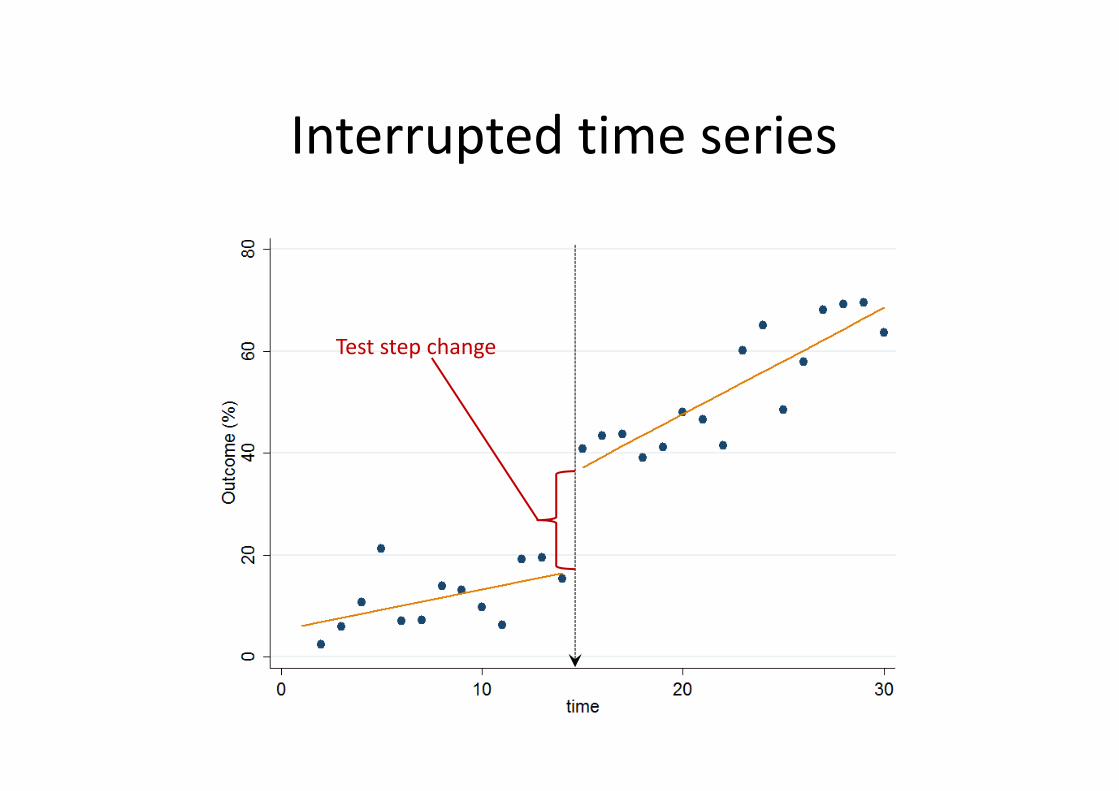
Interrupted time series
Test step change
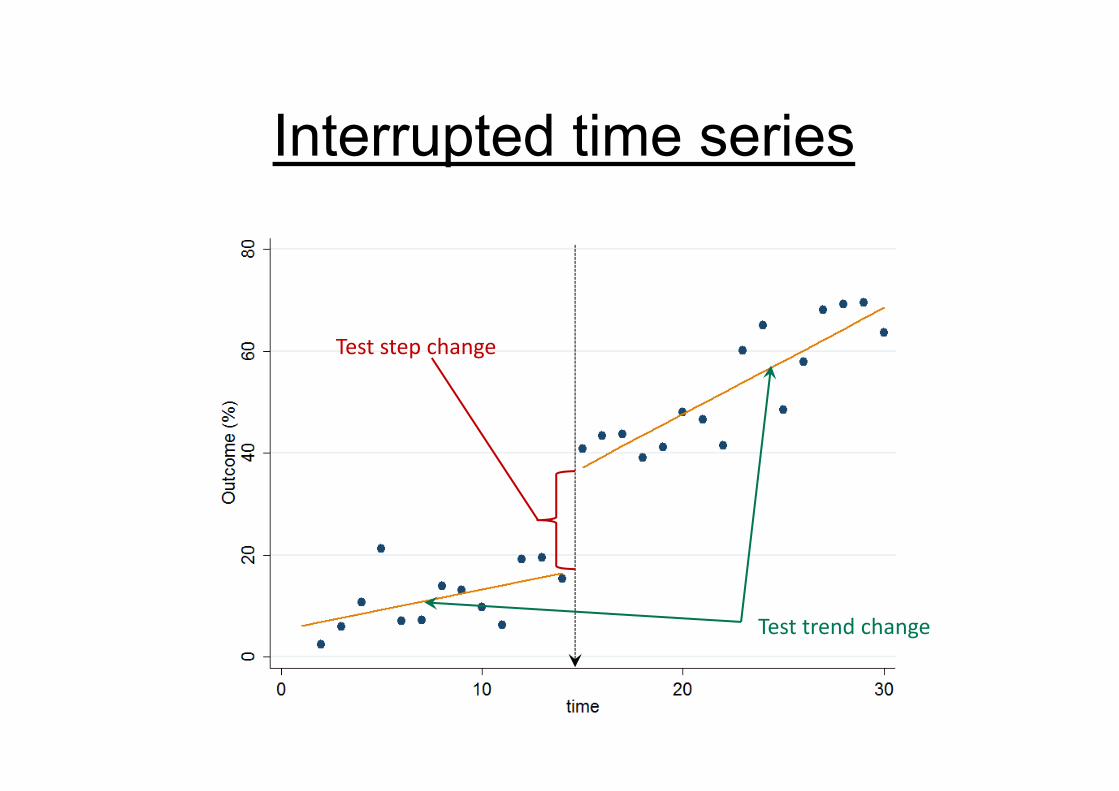
Interrupted time series
Test trend change
Test step change
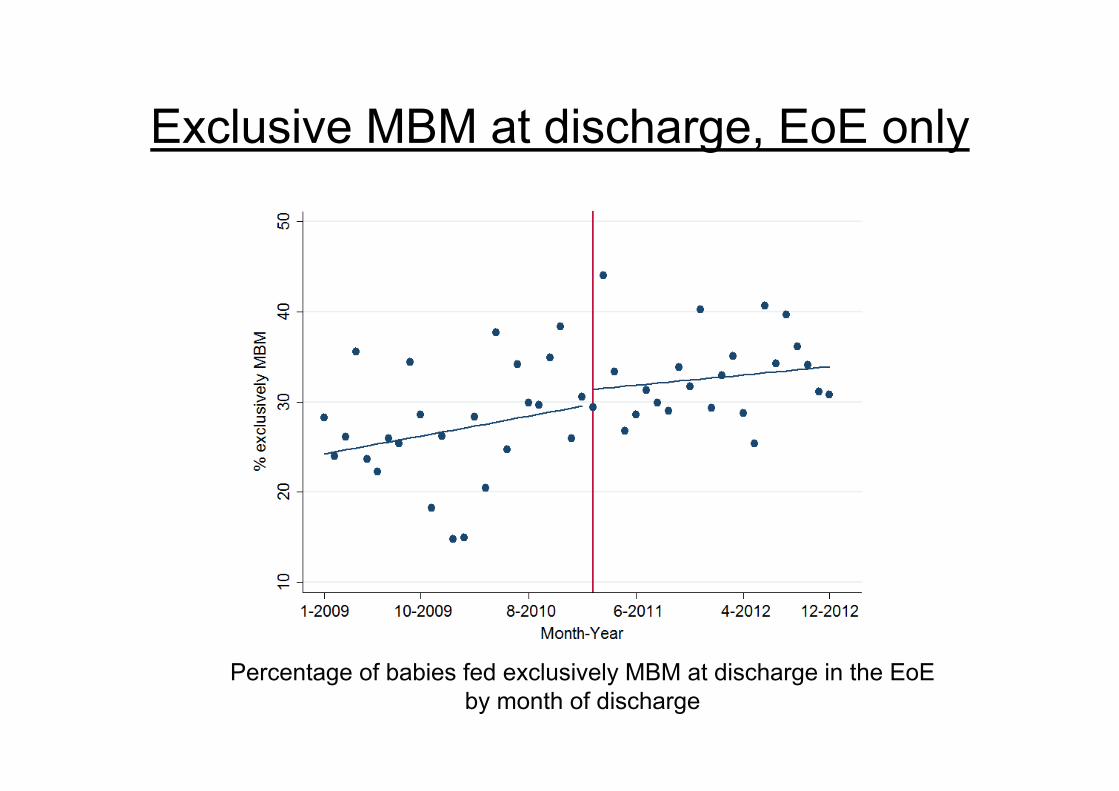
Exclusive MBM at discharge, EoE only
Percentage of babies fed exclusively MBM at discharge in the EoEby month of discharge
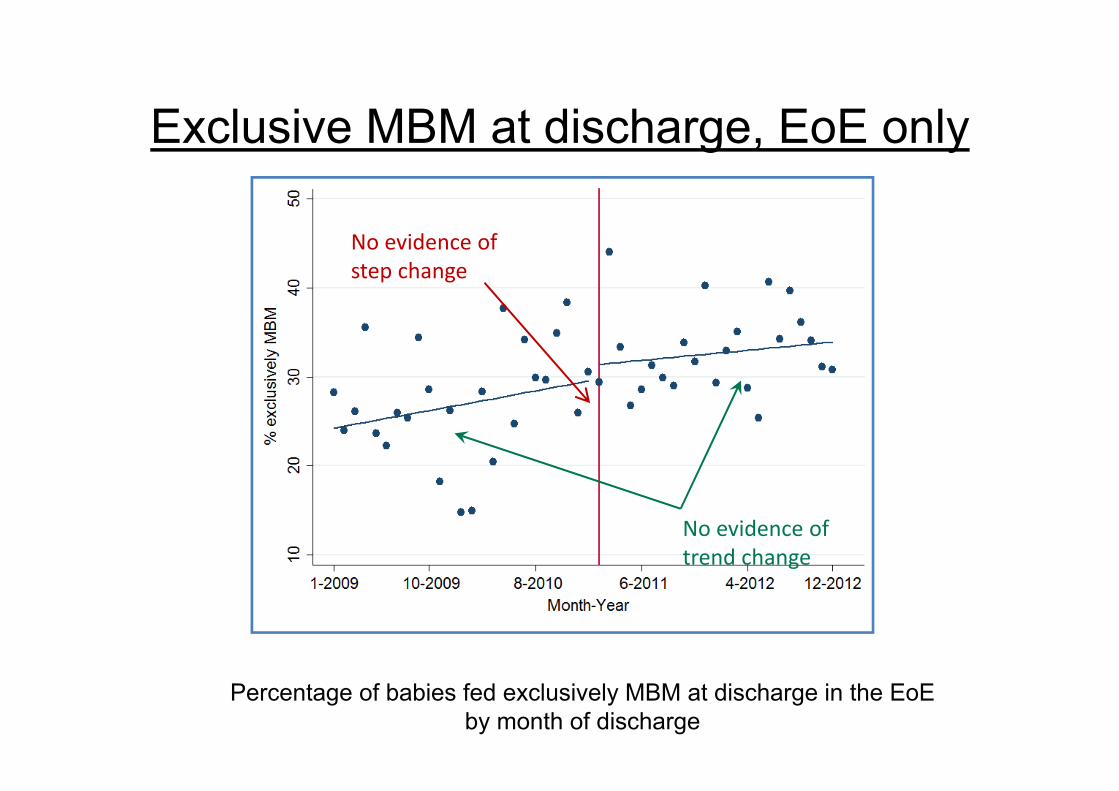
Exclusive MBM at discharge, EoE only
No evidence of trend change
No evidence of step change
Percentage of babies fed exclusively MBM at discharge in the EoE by month of discharge

Exclusive MBM at discharge, EoE only ‘09 –’12
Already a pattern of improvement in the EoE! No statistical evidence that rates of MBM at discharge in EoE improved faster
following introduction of the care bundle beyond the pre-existing pattern of improvement
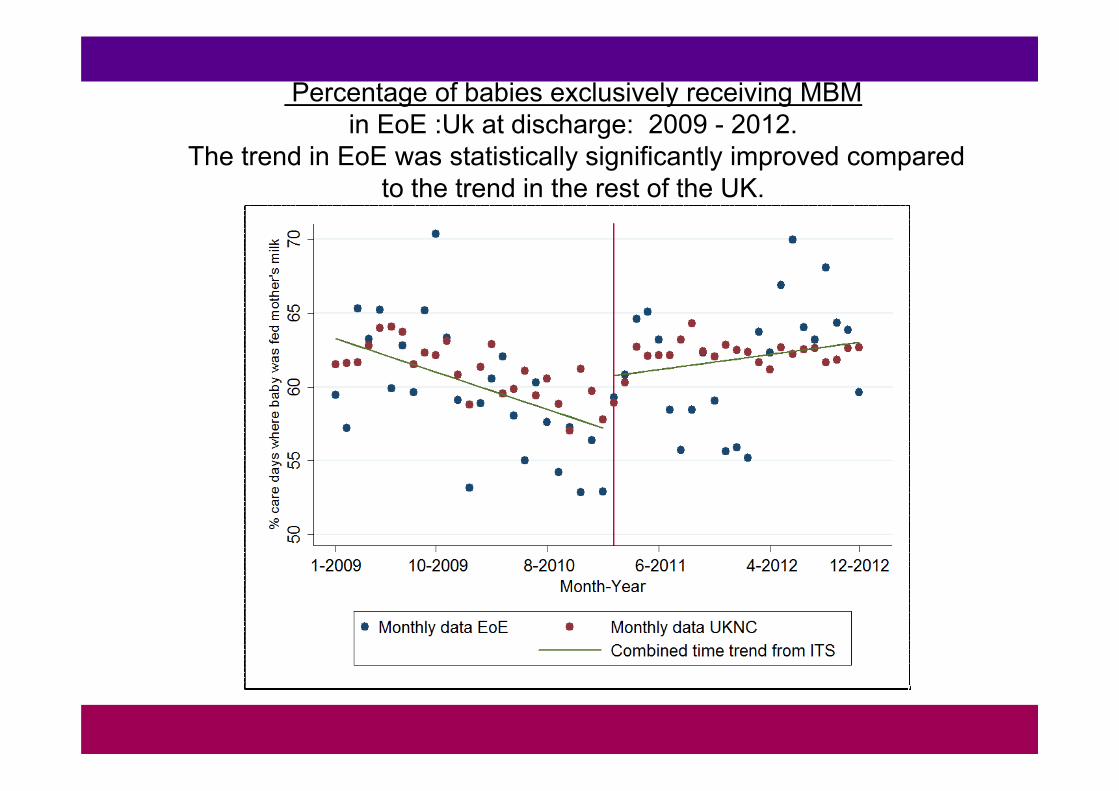
Percentage of babies exclusively receiving MBM in EoE :Uk at discharge: 2009 - 2012.
The trend in EoE was statistically significantly improved compared to the trend in the rest of the UK.

Exclusive MBM at discharge, EoE compared to UKNC 4 yr
UKNC increase 0.05% per month(95% CI 0.01, 0.09)
EoE increase 0.22% per month(95% CI 0.11, 0.34)
p‐value for difference = 0.007
The trend in EoE was statistically significantly improved compared to the trend in the rest of the UK.
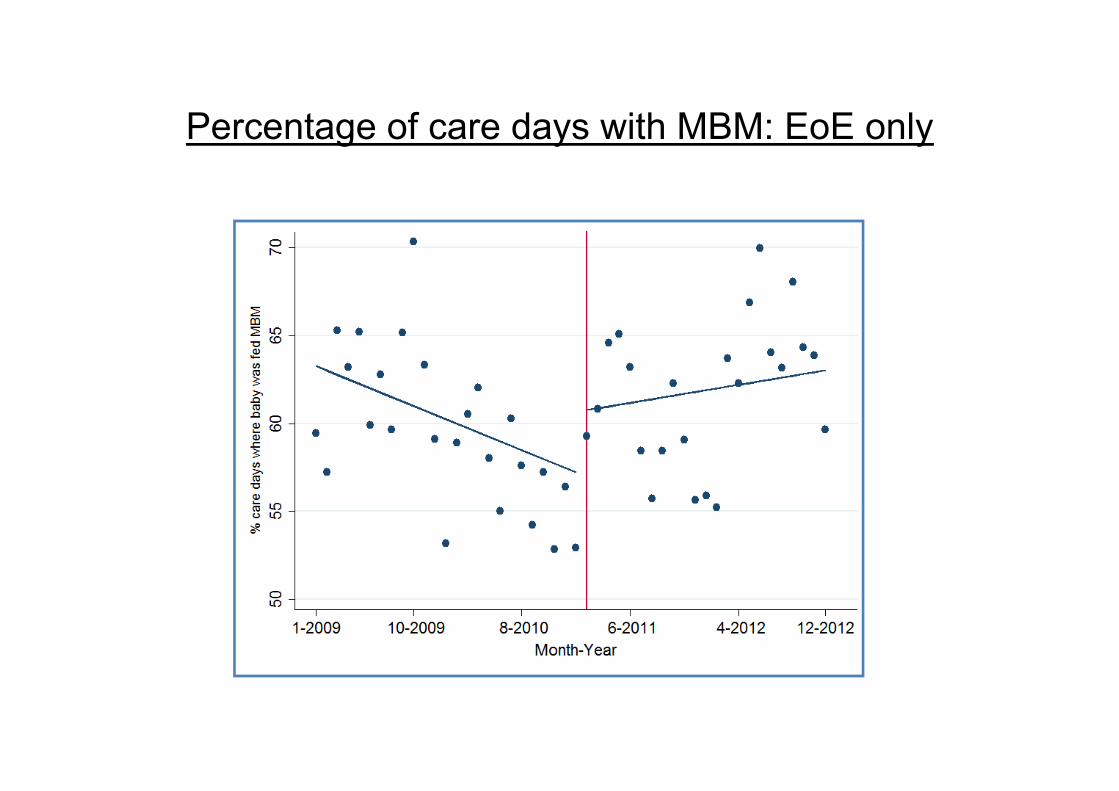
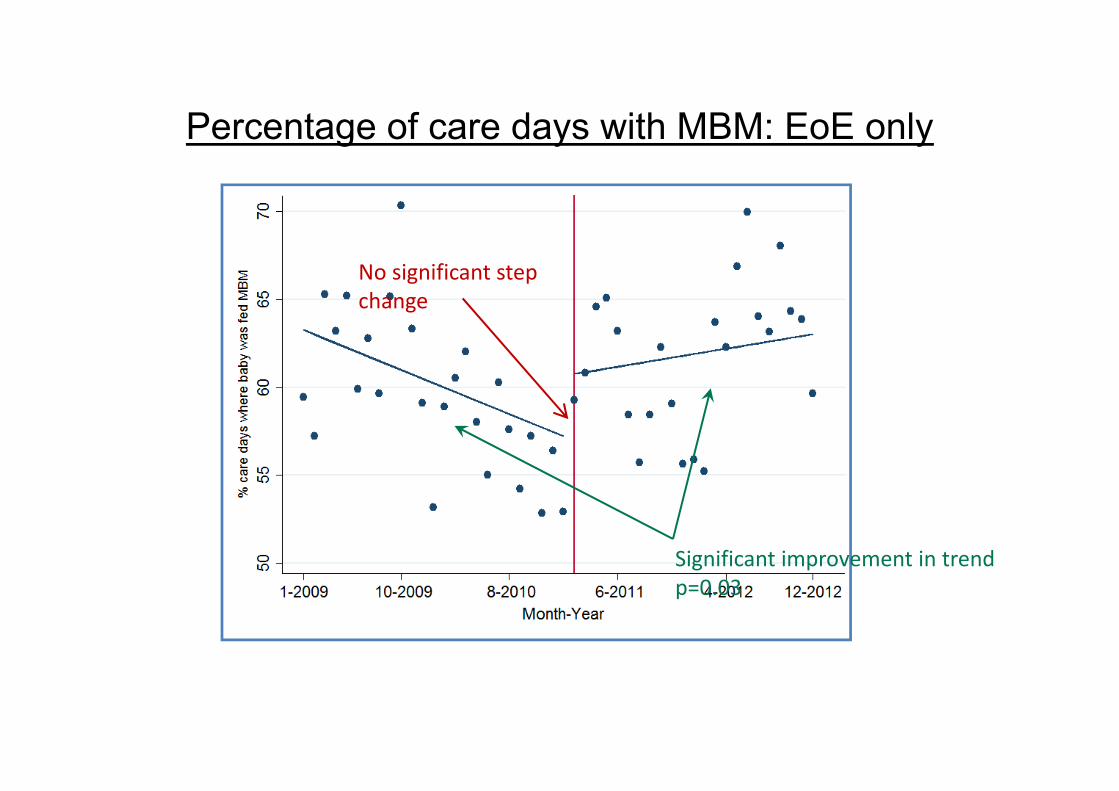
Percentage of care days with MBM: EoE only
Percentage of care days with MBM: EoE only
Significant improvement in trend p=0.03
No significant step change

% of care days where the infant was fed some mother’s milk.Both regions showed a significant trend change after introduction of the
care bundle in Feb 2011!
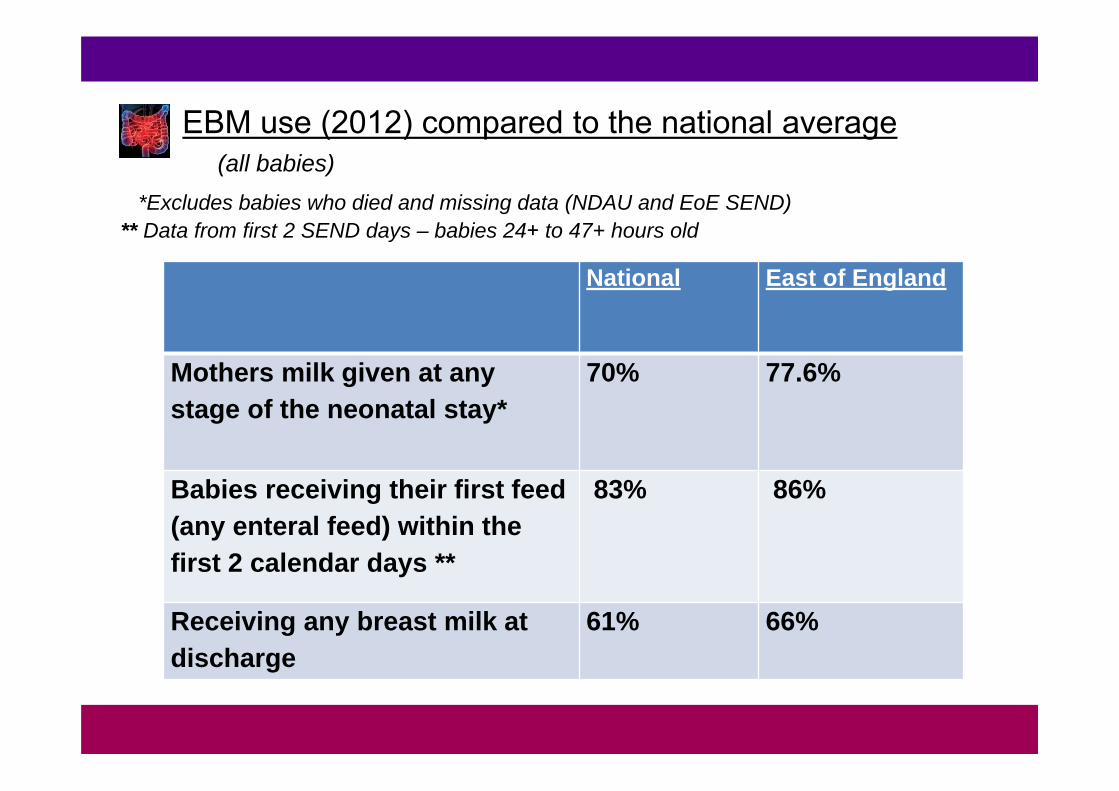
National East of England
Mothers milk given at any stage of the neonatal stay*
70% 77.6%
Babies receiving their first feed (any enteral feed) within the first 2 calendar days **
83% 86%
Receiving any breast milk at discharge
61% 66%
EBM use (2012) compared to the national average(all babies)
*Excludes babies who died and missing data (NDAU and EoE SEND)** Data from first 2 SEND days – babies 24+ to 47+ hours old

Key messages from NDAU analysisBreastmilk at discharge• Prior to care bundle implementation – already
a pattern of improvement (regardless of exclusive or mixed feeding at DC)
• No evidence that rates of breastfeeding at discharge in East of England (EoE) improved following introduction of the care bundle beyond the pre-existing pattern of improvement

Key messages from NDAU analysisDaily feeding of mother’s own milk
• Following introduction of the care bundle, there was a significant improvement in the trend for monthly % of care days where the infant was fed mother’s milk
• However the same pattern was observed in the rest of the UKNC (with no statistically significant difference between the two regions) so the improvement cannot be solely attributable to the bundle.
Key messages from NDAU analysis
• Exclusive breastfeeding rates in the EoE region improved significantly faster than the rest of the UK Neonatal Collaborative (UKNC) which remained after adjustment for confounders.
• Exclusive breast feeding can be held to represent the most stringent marker of success.
Delivering High Quality Neonatal Care for the east of England Preterm and Sick Baby

Delivering High Quality Neonatal Care for the east of England Preterm and Sick Baby
Annual surgical NEC cases in the EoE as a % of annual admissions (1st only), by GA for infants born ≤32+6 weeks gestation. (95% confidence intervals).
There was a significant reduction in surgical NEC from 2009 to 2010 (p=0.006) but no subsequent year-on-year change.
A more detailed trend analysis was not possible due to low numbers.
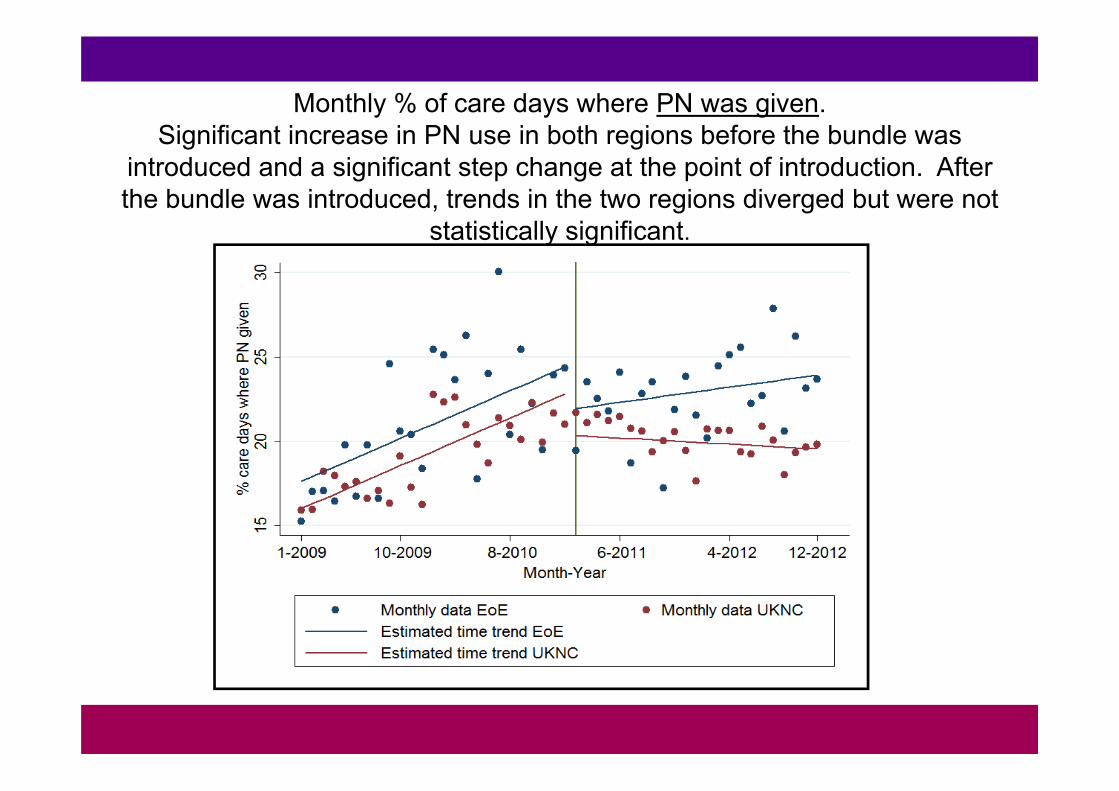
Monthly % of care days where PN was given. Significant increase in PN use in both regions before the bundle was
introduced and a significant step change at the point of introduction. After the bundle was introduced, trends in the two regions diverged but were not
statistically significant.
Conclusions
Notable improvements in MBM outcomes in the East of England over whole study period
Exclusive MBM at discharge increased faster in the EoE compared to the rest of the UKNC
Significant improvements in MBM use during stay after bundle was introduced
Other breastfeeding initiatives underway during this time may play a role
Conclusions
↑ data collection ↑compliance with feeding guideline↑ consistency of advice ↑ milk preparation standards ↑ KC ↑ Culture of change ↑team / MDT working
Delivering High Quality Neonatal Care for the east of England Preterm and Sick Baby

Acknowledgements:
Clinicians across the East of England
Lynne RadboneProfessor Neena ModiShalini SanthakumaranDr. Cheryl BattersbyDaniel GrayIan LongDr Jennifer Birch