Embed Size (px)
Citation preview
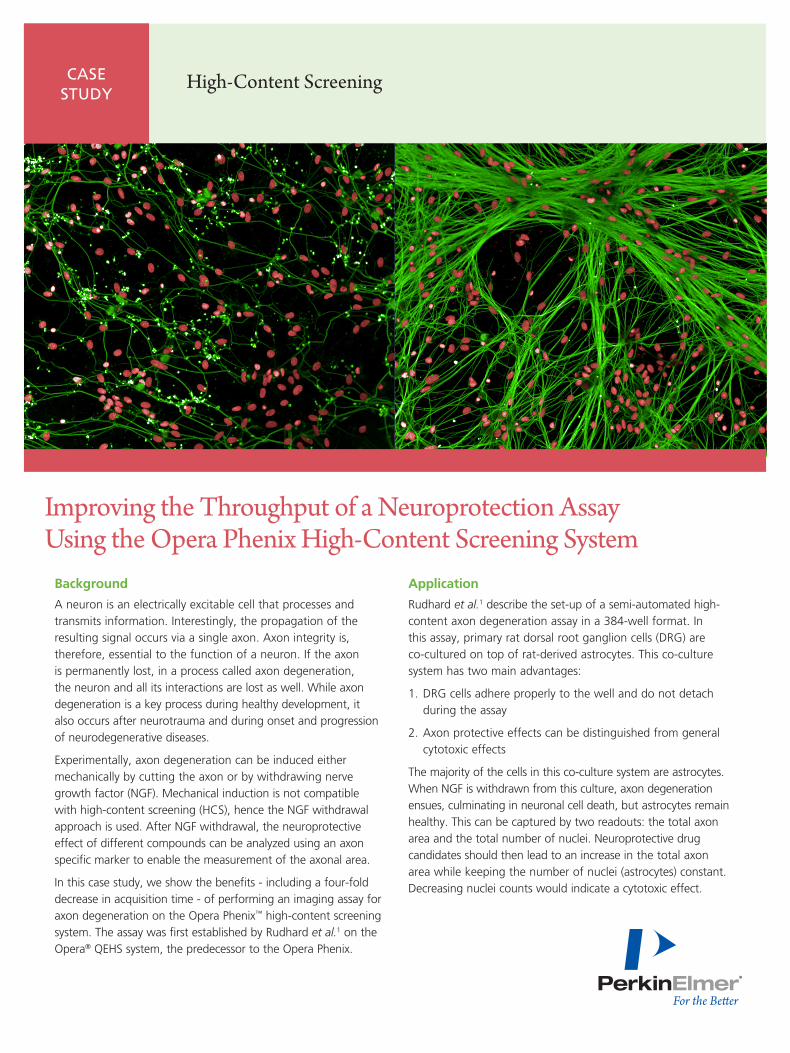
Improving the Throughput of a Neuroprotection Assay Using the Opera Phenix High-Content Screening System
Background
A neuron is an electrically excitable cell that processes and transmits information. Interestingly, the propagation of the resulting signal occurs via a single axon. Axon integrity is, therefore, essential to the function of a neuron. If the axon is permanently lost, in a process called axon degeneration, the neuron and all its interactions are lost as well. While axon degeneration is a key process during healthy development, it also occurs after neurotrauma and during onset and progression of neurodegenerative diseases.
Experimentally, axon degeneration can be induced either mechanically by cutting the axon or by withdrawing nerve growth factor (NGF). Mechanical induction is not compatible with high-content screening (HCS), hence the NGF withdrawal approach is used. After NGF withdrawal, the neuroprotective effect of different compounds can be analyzed using an axon specific marker to enable the measurement of the axonal area.
In this case study, we show the benefits - including a four-fold decrease in acquisition time - of performing an imaging assay for axon degeneration on the Opera Phenix™ high-content screening system. The assay was first established by Rudhard et al.1 on the Opera® QEHS system, the predecessor to the Opera Phenix.
Application
Rudhard et al.1 describe the set-up of a semi-automated high- content axon degeneration assay in a 384-well format. In this assay, primary rat dorsal root ganglion cells (DRG) are co-cultured on top of rat-derived astrocytes. This co-culture system has two main advantages:
1. DRG cells adhere properly to the well and do not detach during the assay
2. Axon protective effects can be distinguished from general cytotoxic effects
The majority of the cells in this co-culture system are astrocytes. When NGF is withdrawn from this culture, axon degeneration ensues, culminating in neuronal cell death, but astrocytes remain healthy. This can be captured by two readouts: the total axon area and the total number of nuclei. Neuroprotective drug candidates should then lead to an increase in the total axon area while keeping the number of nuclei (astrocytes) constant. Decreasing nuclei counts would indicate a cytotoxic effect.
CASE STUDY
High-Content Screening
2
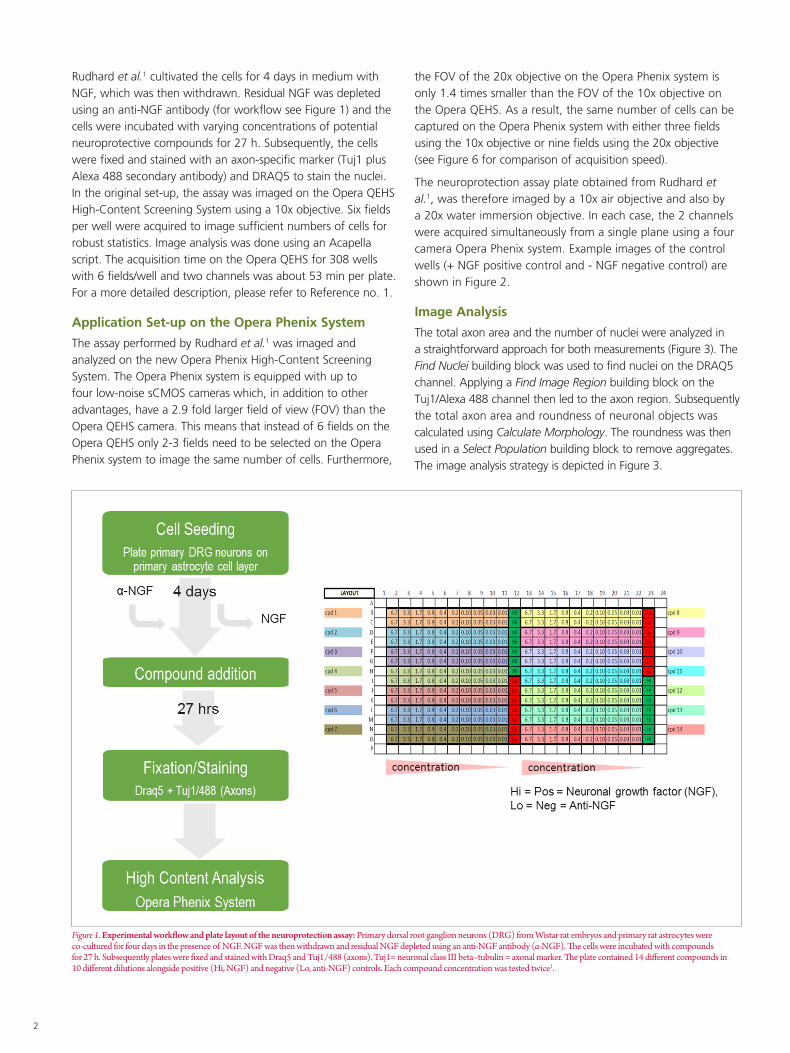
Rudhard et al.1 cultivated the cells for 4 days in medium with NGF, which was then withdrawn. Residual NGF was depleted using an anti-NGF antibody (for workflow see Figure 1) and the cells were incubated with varying concentrations of potential neuroprotective compounds for 27 h. Subsequently, the cells were fixed and stained with an axon-specific marker (Tuj1 plus Alexa 488 secondary antibody) and DRAQ5 to stain the nuclei. In the original set-up, the assay was imaged on the Opera QEHS High-Content Screening System using a 10x objective. Six fields per well were acquired to image sufficient numbers of cells for robust statistics. Image analysis was done using an Acapella script. The acquisition time on the Opera QEHS for 308 wells with 6 fields/well and two channels was about 53 min per plate. For a more detailed description, please refer to Reference no. 1.
Application Set-up on the Opera Phenix System
The assay performed by Rudhard et al.1 was imaged and analyzed on the new Opera Phenix High-Content Screening System. The Opera Phenix system is equipped with up to four low-noise sCMOS cameras which, in addition to other advantages, have a 2.9 fold larger field of view (FOV) than the Opera QEHS camera. This means that instead of 6 fields on the Opera QEHS only 2-3 fields need to be selected on the Opera Phenix system to image the same number of cells. Furthermore,
the FOV of the 20x objective on the Opera Phenix system is only 1.4 times smaller than the FOV of the 10x objective on the Opera QEHS. As a result, the same number of cells can be captured on the Opera Phenix system with either three fields using the 10x objective or nine fields using the 20x objective (see Figure 6 for comparison of acquisition speed).
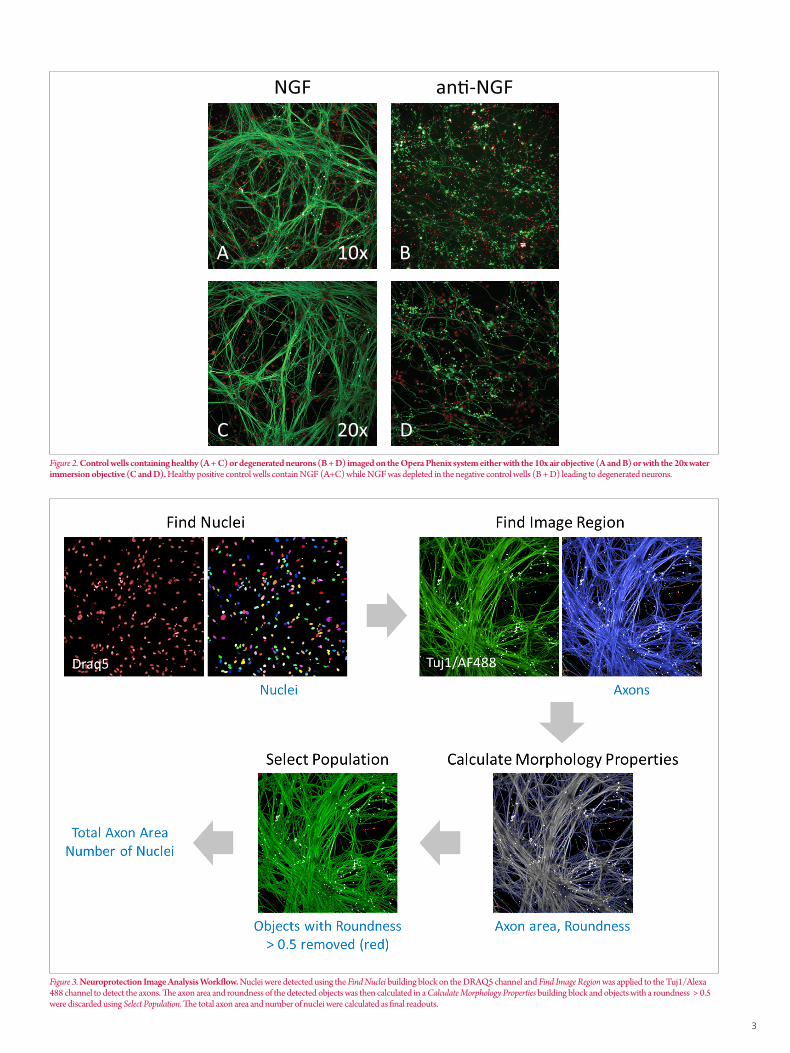
The neuroprotection assay plate obtained from Rudhard et al.1, was therefore imaged by a 10x air objective and also by a 20x water immersion objective. In each case, the 2 channels were acquired simultaneously from a single plane using a four camera Opera Phenix system. Example images of the control wells (+ NGF positive control and - NGF negative control) are shown in Figure 2.
Image Analysis
The total axon area and the number of nuclei were analyzed in a straightforward approach for both measurements (Figure 3). The Find Nuclei building block was used to find nuclei on the DRAQ5 channel. Applying a Find Image Region building block on the Tuj1/Alexa 488 channel then led to the axon region. Subsequently the total axon area and roundness of neuronal objects was calculated using Calculate Morphology. The roundness was then used in a Select Population building block to remove aggregates. The image analysis strategy is depicted in Figure 3.
Further indication of successful library preparation is:Figure 1. Experimental workflow and plate layout of the neuroprotection assay: Primary dorsal root ganglion neurons (DRG) from Wistar rat embryos and primary rat astrocytes were co-cultured for four days in the presence of NGF. NGF was then withdrawn and residual NGF depleted using an anti-NGF antibody (α-NGF). The cells were incubated with compounds for 27 h. Subsequently plates were fixed and stained with Draq5 and Tuj1/488 (axons). Tuj1= neuronal class III beta–tubulin = axonal marker. The plate contained 14 different compounds in 10 different dilutions alongside positive (Hi, NGF) and negative (Lo, anti-NGF) controls. Each compound concentration was tested twice1.
HIGH SPECIFICITY FOR EXPRESSED SEQUENCES (CODING + UTR REGIONS)
3
Figure 3. Neuroprotection Image Analysis Workflow. Nuclei were detected using the Find Nuclei building block on the DRAQ5 channel and Find Image Region was applied to the Tuj1/Alexa 488 channel to detect the axons. The axon area and roundness of the detected objects was then calculated in a Calculate Morphology Properties building block and objects with a roundness > 0.5 were discarded using Select Population. The total axon area and number of nuclei were calculated as final readouts.
Figure 2. Control wells containing healthy (A + C) or degenerated neurons (B + D) imaged on the Opera Phenix system either with the 10x air objective (A and B) or with the 20x water immersion objective (C and D). Healthy positive control wells contain NGF (A+C) while NGF was depleted in the negative control wells (B + D) leading to degenerated neurons.

4
Figure 4. Neuroprotection assay performed on the Opera Phenix system using the 20x water immersion objective. An overview of the center field of each well on the plate is shown. All compounds on this plate have a concentration-dependent neuroprotective effect and do not show cytotoxicity. Green = Tuj1, Red = nuclei, Hi = positive control with NGF, Lo = negative control, NGF withdrawal.
Performance of a Neuroprotection Assay on the Opera Phenix System
The analysis sequence was then applied to the whole plate and dose response curves and EC50 values were calculated for the different compounds. Figure 4 shows an overview of the whole plate (20x water immersion objective, center field only). In total, 9 fields per well were analyzed for the 20x water immersion
objective and 3 fields per well for the 10x objective. To test the robustness of the assay, Z’ values were calculated. The assay is robust when imaged with both objectives (20xW: Z’ = 0.67, 10xA: Z’ = 0.63). These values are consistent with the previously reported Z’ of 0.611.
5
10X
AIR
OBJ
ECTI
VE20
X W
OBJ
ECTI
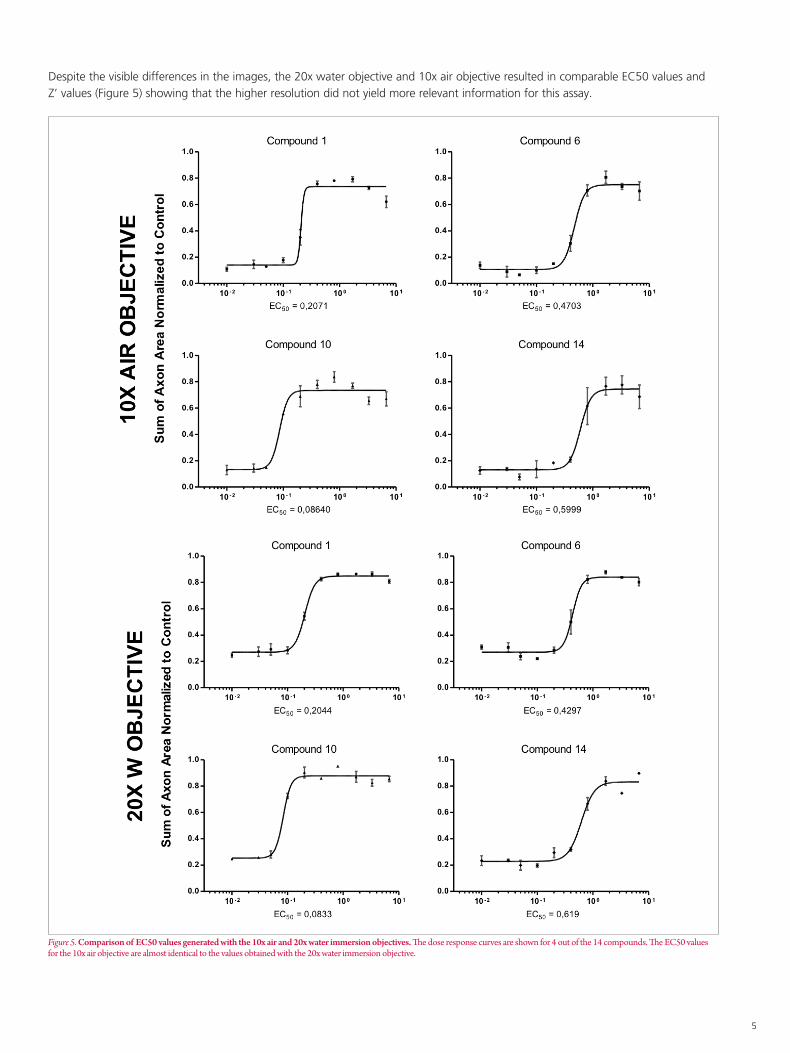
VEDespite the visible differences in the images, the 20x water objective and 10x air objective resulted in comparable EC50 values and Z’ values (Figure 5) showing that the higher resolution did not yield more relevant information for this assay.
Figure 5. Comparison of EC50 values generated with the 10x air and 20x water immersion objectives. The dose response curves are shown for 4 out of the 14 compounds. The EC50 values for the 10x air objective are almost identical to the values obtained with the 20x water immersion objective.
For a complete listing of our global offices, visit www.perkinelmer.com/ContactUs
Copyright ©2016-2017, PerkinElmer, Inc. All rights reserved. PerkinElmer® is a registered trademark of PerkinElmer, Inc. All other trademarks are the property of their respective owners. 013175_01 PKI
PerkinElmer, Inc. 940 Winter Street Waltham, MA 02451 USA P: (800) 762-4000 or (+1) 203-925-4602www.perkinelmer.com
Conclusion
In this case study we have demonstrated how the neuroprotection assay described in the paper by Rudhard et al.1 can be easily and directly transferred to the Opera Phenix high-content screening system. The comparison of the data obtained with a 10x air or 20x water immersion objective shows that for this assay, there is no need to increase image resolution. The readouts axonal area and number of nuclei can be calculated with sufficient accuracy from the 10x objective data. Here, we analyzed three fields of view from the 10x objective and nine fields of view from the 20x water immersion objective. We have shown that the critical assay parameter Z’ and EC50 values are not affected by the choice of objective. However, using a 10x objective decreases the acquisition time by a factor of two and the amount of data generated by a factor of 3. This shows how careful optimization of an assay can increase throughput and minimize the data burden without compromising assay performance.
When compared to its predecessor, the Opera Phenix system is 4 times faster when using the same 10x magnification. This is in part a result of the larger FOV of the sCMOS camera but also because of the improved mechanics and overall sensitivity of the system. The improved performance even allows an assay to be run with the 20x instead of the 10x objective and still be approximately twice as fast as the Opera QEHS. Finally, setting up an image analysis sequence in Harmony is very straightforward and does not require expert scripting knowledge. Therefore, both assay set-up and analysis can be completed much faster than before. As a result, the Opera Phenix system can accommodate many more users and assays than its predecessor and help improve the productivity of the lab.
Acknowledgement
Many thanks to Dr. York Rudhard from Evotec AG for providing the neuroprotection assay plate and his further input to this manuscript.
References
1. Rudhard, Y., Sengupta Ghosh, A., Lippert, B., Boecker, A., Pedaran, M., Kraemer, J., Ngu, H., Foreman, O., Liu, Y., Lewcock, J.W. (2015): Identification of 12/15-Lipoxygenase as a Regulator of Axon Degeneration through High-Content Screening. The Journal of Neuroscience, 35(7):2927–2941.
Authors
Angelika Foitzik, Mandy Malle, Karin Boettcher, Alexander Schreiner PerkinElmer Hamburg, DE
Shorter Acquisition Time
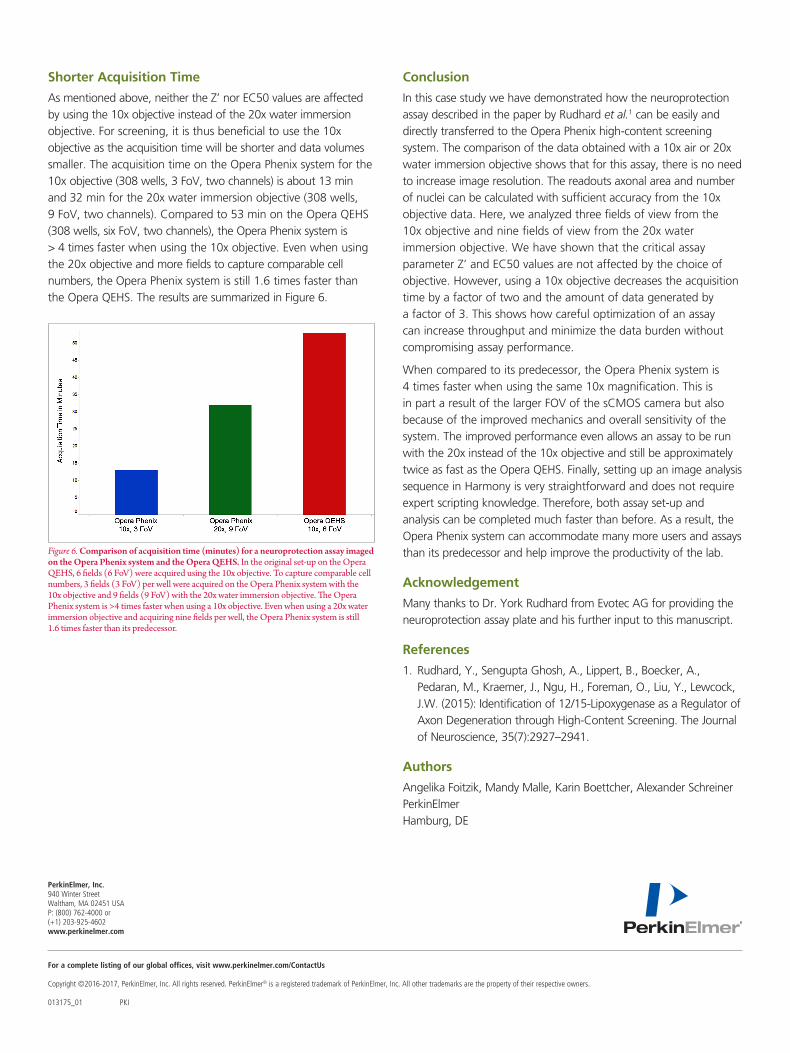
As mentioned above, neither the Z’ nor EC50 values are affected by using the 10x objective instead of the 20x water immersion objective. For screening, it is thus beneficial to use the 10x objective as the acquisition time will be shorter and data volumes smaller. The acquisition time on the Opera Phenix system for the 10x objective (308 wells, 3 FoV, two channels) is about 13 min and 32 min for the 20x water immersion objective (308 wells, 9 FoV, two channels). Compared to 53 min on the Opera QEHS (308 wells, six FoV, two channels), the Opera Phenix system is > 4 times faster when using the 10x objective. Even when using the 20x objective and more fields to capture comparable cell numbers, the Opera Phenix system is still 1.6 times faster than the Opera QEHS. The results are summarized in Figure 6.
Figure 6. Comparison of acquisition time (minutes) for a neuroprotection assay imaged on the Opera Phenix system and the Opera QEHS. In the original set-up on the Opera QEHS, 6 fields (6 FoV) were acquired using the 10x objective. To capture comparable cell numbers, 3 fields (3 FoV) per well were acquired on the Opera Phenix system with the 10x objective and 9 fields (9 FoV) with the 20x water immersion objective. The Opera Phenix system is >4 times faster when using a 10x objective. Even when using a 20x water immersion objective and acquiring nine fields per well, the Opera Phenix system is still 1.6 times faster than its predecessor.