Embed Size (px)
Citation preview
Original Article
A New High-throughput Real-time PCR Assay for theScreening of Multiple Antimicrobial Resistance Genesin Broiler Fecal Samples from China*
CHE Jie, LU Jin Xing, LI Wen Ge, ZHANG Yun Fei, ZHAO Xiao Fei, YUAN Min,
BAI Xue Mei, CHEN Xia#, and LI Juan#
State Key Laboratory of Infectious Disease Prevention and Control, Collaborative Innovation Center for Diagnosisand Treatment of Infectious Disease, National Institute for Communicable Disease Control and Prevention, ChineseCenter for Disease Control and Prevention, Beijing 102206, China
Abstract
Objective Antimicrobial resistance (AMR) has become a global concern and is especially severe inChina. To effectively and reliably provide AMR data, we developed a new high-throughput real-time PCRassay based on microfluidic dynamic technology, and screened multiple AMR genes in broiler fecalsamples.
Methods A high-throughput real-time PCR system with an new designed integrated fluidic circuit assaywere performed AMR gene detection. A total of 273 broiler fecal samples collected from twogeographically separated farms were screened AMR genes.
Results The new assay with limits of detection ranging from 40.9 to 8,000 copies/reaction. Thesensitivity rate, specificity rate, positive predictive value, negative predictive value and correct indiceswere 99.30%, 98.08%, 95.31%, 99.79%, and 0.9755, respectively. Utilizing this assay, we demonstratethat AMR genes are widely spread, with positive detection rates ranging from 0 to 97.07% in 273 broilerfecal samples. blaCTX-M, blaTEM, mcr-1, fexA, cfr, optrA, and intI1 showed over 80% prevalence. Thedissemination of AMR genes was distinct between the two farms.
Conclusions We successfully established a new high-throughput real-time PCR assay applicable toAMR gene surveillance from fecal samples. The widespread existence of AMR genes detected in broilerfarms highlights the current and severe problem of AMR.
Key words: Antimicrobial resistance; Antimicrobial resistance gene; High-throughput real-time PCRarray; Broiler fecal sample
Biomed Environ Sci, 2019; 32(12): 881-892 doi: 10.3967/bes2019.111 ISSN: 0895-3988
www.besjournal.com (full text) CN: 11-2816/Q Copyright ©2019 by China CDC
INTRODUCTION
A ntimicrobial resistance (AMR) is a fast-growing global threat. Infectionsassociated with AMR bacteria lead to over
23,000 deaths in the United States and 25,000
deaths in Europe annually, and the number is muchhigher in Asian countries[1,2]. It is estimated that upto 300 million premature deaths could occur fromAMR by 2050, with 100 trillion U.S. dollars lost to theglobal economy, unless effective action is taken[3].AMR is particularly severe in China, which is one of
*This work was supported by the National Natural Science Foundation of China [Grant agreement 31502124]; and theNational Science and Technology Major Project of China [Grant agreement 2018ZX10733402].
#Correspondence should be addressed to CHEN Xia, Tel: 86-10-58900769-810, E-mail: [email protected]; LI Juan, Tel:86-10-58900766, E-mail: [email protected]
Biographical note of the first author: CHE Jie, Assistant Professor, Master, majoring in antimicrobial resistancedetection.
Biomed Environ Sci, 2019; 32(12): 881-892 881
the largest producers and users of antimicrobialagents[4]. Bacterial AMR is a complicated and activeprocess, whereby numerous AMR genes can berapidly selected for and transmitted in clinical,veterinary, food production and transportation, andenvironmental settings. AMR originating from theuse of antimicrobials in animals plays an importantrole in the development and spreading of antibioticresistant bacteria. The AMR genes could be widelyspread via transmission cycles, such as food orecological chains, and broiler feces was consideredas a good storage of AMR genes[5-7]. To investigateAMR genes in broiler fecal samples will giveimportant information to AMR surveillance of ‘OneHealth’ in China.
Conventional AMR surveillance often focuses onbacterial resistant phenotypes (e.g. minimuminhibitory concentration values of antimicrobialagents), and/or the screening of a limited number ofAMR genes. Such methods restrict the collection ofcomprehensive AMR data in a timely manner[8-11].Therefore, a more direct, rapid and high-throughputAMR surveillance technique is essential formonitoring and controlling the increase of AMRgenes. To address this issue, we developed a newhigh-throughput microfluidic dynamic assay andapplied it to monitor AMR gene presence.Microfluidic dynamic technology has recently beenintroduced into biological automation applicationsand widely adopted due to its advantages of rapid,high-throughput screening, with high repeatabilityand low cross reaction[12-15]. It uses microfluidics andhigh-resolution imaging to perform qPCR withfluorescence detection in nanoliter reactionvolumes. Here, we show that our microfluidicdynamic assay can be applied to perform screeningfor the detection of multiple AMR genessimultaneously. A total of 45 groups AMR genes and2 AMR gene spread related elements were screenedin the Fluidigm, selected according to previousresearch descriptions and frequency of antimicrobialagent usage in China. The AMR gene disseminationstatus in fecal samples collected from two broilerfarms was analyzed and compared.
METHODS
Sample Collection and DNA Extraction
A total of 273 broiler fecal samples werecollected from two geographically distinct farms inMarch 2017, with each farm containingapproximately 20,000 broilers simultaneously. The
farms were divided into five sampling zones (north,south, east, west, and middle). The samples wereselected randomly at a ratio of 1:150 for each farm.In total, 145 and 128 broiler fecal samples wereobtained from farm A and B, respectively. Sampleswere shipped to the laboratory at 4 °C within sixhours. The antimicrobial agent usage wasinvestigated by questionnaire during the samplecollection period. Amoxicillin, ampicillin, ceftiofursodium, enrofloxacin, florfenicol, gentamicin,kanamycin, tylosin, and terramycin were commonlyused in both farms during broiler production.
Bacterial DNA was extracted directly fromsample using Automated Nucleic Acid ExtractionSystem-96 (BioTeke, Beijing, China). The bacterialDNA was eluted into 100 μL of TE buffer and storedat −80 °C for further study.
Choose Target AMR Gene
In this study, a total of 47 gene groups,containing 688 unique variants, were included inscreening (Table 1 and Supplementary Table S1available in www.besjournal.com). The 47 genegroups were subdivided into eight classes in thisstudy, based on antimicrobial agent. Among these 47gene groups, 42 could mediate resistance to a singleclass of antimicrobial agent, 3 could mediatemultidrug resistance, and 2 were related with AMRgene transmission. All AMR gene sequences weredownloaded from the GenBank database. Genbankaccession numbers of reference gene sequences foreach AMR gene group were list in Table 1. Due to thenumerous variants existing among carbapenem-resistance, fluoroquinolone-resistance and β-lactam-resistance genes, DNAMAN version 5.0 and MEGAversion 5.0 were used to analyze and classifyvariants. The AMR gene group classification usedwas neither based on the gene variant-mediatedresistance phenotype nor order of discovery, buton gene sequence identity and evolutionaryrelationship. Therefore, the primers and probedesign for each group in this study couldpotentially target many more AMR gene variants.Gene variants with high sequence similarity wereclassified together into one AMR gene groupaccording to phylogenetic trees performed byMEGA software. The conserved sequencesintergroup were identified and analyzed byDNAMAN software, and the probes/primers wereassessed and chosen by Oligo version 6.0. Allconserved sequences identified from carbapenem-resistance, fluoroquinolone-resistance, and β-lactam-resistance genes, as well as sequences from
882 Biomed Environ Sci, 2019; 32(12): 881-892
AMR genes without variants, were used as targetsequences for primer design using Primer version6.0. All of the primers and probes were tested byBLAST analysis. In total, 688 unique AMR genevariants could be detected. The primers and minorgroove binder (MGB) probes were specificallydesigned for this study, except for the genes armA,mcr-1, intI1, and element ISCR1[9,16,17]. Additionally,the bacterial 16S rDNA locus was used as aninternal processing control.
Standard Curve Plot of Recombinant Plasmids
A unique recombinant plasmid was constructedfor each target gene. Due to high similarity of AMR
gene sequences with selectable markers encodinggenes on vectors, different types of vectors werechosen to avoid inaccurate results in this study. Thevectors T1, pUC19, pUC57 were used to generateplasmids harboring various target-specific fragments(using either the primers described in this study orisolated DNA containing AMR genes) to measure thecopy number. A total of 43 novel recombinantplasmids were generated in this study(Supplementary Table S2, available inwww.besjournal.com). Standard curves weregenerated for each recombinant plasmid byconventional real-time PCR using a LightCycler 480II(Roche Diagnostics)[9].
Table 1. Target AMR gene information used in this study
Antimicrobialagent
No.a Gene group Numberb Accession no. ofreference sequences
Antimicrobialagent No. Gene group Number Accession no. of
reference sequences
Carbapenems 1 blaOXA-48-like 14 AY236073 other β-lactams 25 blaSHV D 2 JQ029959
2 blaIMP A 13 S71932 26 blaTEM A 157 AF093512
3 blaIMP B 5 AF290912 27 blaTEM B 4 J01749
4 blaIMP C 4 AB074436 28 blaOXA 7 JN596991
5 blaIMP D 5 AY553332 29 blaPER 6 AY740681
6 blaIMP E 9 EF118171 30 blaCARB A 22 KJ934265
7 blaIMP F 2 KF148593 31 blaCARB B 4 AF313471
8 blaNDM 15 FN396876 32 blaCARB C 3 AF030945
9 blaKPC 21 AF297554 33 blaCARB D 5 AF135373
10 blaVIM 38 JN982330 Fluoroquinolones 34 qnrA 8 GU295952
11 blaIMI 5 DQ173429 35 qnrC 1 EU917444
12 blaIND A 6 AF219131 36 qnrS 4 FJ167861
13 blaIND B 2 AF099139 Colistin 37 mcr-1 1 KP347127
14 blaIND C 2 AF219127 38 mcr-3 1 KY924928
15 blaIND D 2 GU186044 Aminoglycosides 39 armA 1 [16]Other β-lactams 16 blaGES 22 AF156486 40 aac(6′)-Ie-
aph(2″)-Ia 1 HQ015159
17 blaCTX-M A 58 AF255298 Phenicols 41 fexA 1 KC222021
18 blaCTX-M B 22 AJ416344 42 fexB 1 JN201336
19 blaCTX-M C 11 FR682582 Multidrug 43 cfr 1 JF969273
20 blaCTX-M D 48 HQ833652 44 optrA 1 KP396637
21 blaCTX-M E 3 AY238472 45 aac(6′)-Ib-cr 1 GU189577
22 blaSHV A 132 AF148850 Gene spreadrelated 46 intI1 1 [17]
23 blaSHV B 4 LN515533 47 ISCR1 1 [17]
24 blaSHV C 2 JQ341060Internal
processingcontrol
48 16SrDNA 1 [9]
Note. aThe serial number for the assay arranged on 48.48 Dynamic ArrayTM IFC. bNumber of variantsincluding in this AMR gene group.
High-throughput qPCR assay in AMR gene detection 883
High-throughput Real Time PCR Assay
An integrated fluidic circuit (IFC), commonlyreferred to as a ‘chip’, was used for AMR genescreening. The BioMarkTM real-time PCR system(Fluidigm, USA) was used for high-throughputmicrofluidic real-time PCR amplification using 48.48Dynamic ArrayTM IFC kit (Fluidigm, USA). 2,304 (48target genes×48 samples) individual PCR reactionswere conducted simultaneously[14].
Amplification was performed using 6-carboxyfluorescein (FAM)- and MGB-labeled probeswith TaqMan® Gene Expression Master Mix, inaccordance with the manufacturer’s instructions(Applied Biosystems, USA). The high-throughput realtime assay chip was prepared according to Fluidigm48.48 Dynamic ArrayTM IFC kit manufacturerprotocol. The assay conditions were: 2 min at 50 °C,1 min at 95 °C, followed by 40 cycles of two-stepamplification of 15 s at 95 °C, 1 min at 60 °C. Datawere automatically collected using BiomarkTM HDData Collection Software.
Detection Limit Estimation for the High-throughputReal-time PCR Array
A detection limit estimation for the high-throughput BioMarkTM real time PCR was carried outusing a mixture of the 47 recombinant plasmidspreviously generated and harbouring different AMRtarget genes. The mixture was 10-fold serially dilutedfrom 106 to 100 order of magnitude of copies/μL.Three independent dilution mixtures containing theAMR genes mentioned above were loaded into thesample inlets of one chip simultaneously to estimatethe sensitivity and specificity of the high-throughputBioMarkTM real-time PCR array.
Validation of the High-throughput BioMarkTM Real-time PCR Array Results
In order to validate the detection sensitivity,capability, and specificity of the novel high-throughput real-time PCR assay, all recombinantplasmids harbouring AMR target genes wererandomly combined into groups, serially diluted andthen subjected to the high-throughput BioMarkTM
real-time PCR assay. Briefly, plasmids were dividedinto 8 groups each containing 6 target genes, or 4groups each containing 12 target genes, or 3 groupseach containing 16 target genes, or 2 groups eachcontaining 24 target genes, or 1 group containing alltarget genes. Starting with 108 copies/μL, eachplasmid mixture underwent a 10-fold serial dilution,as described above, followed by the high-throughput
BioMarkTM real-time PCR assay, run in triplicate. Theformulas for sensitivity rate, specificity rate, positivepredictive value, negative predictive value andcorrect indices were list in the notes of Table 2.
AMR Gene Dissemination Sreening among BroilerFecal Samples
45 groups AMR genes and 2 AMR gene spreadrelated elements were detected in a total of 273broiler fecal samples using the BioMarkTM real-timePCR system. The results were analyzed usingMicrosoft® Office Excel 2007 and IBM SPSS®Statistics version 19.0. The Chi-square test was usedto estimate the difference in AMR genedissemination between the two farms, and P < 0.05was used as the cutoff for significance. The PearsonChi-square test, correction for continuity, andFisher’s exact test were used to test for statisticalsignificance when n ≥ 5, 1 ≤ n < 5, and n < 1,respectively. The relative abundance values for AMRgenes were calculated using the ratio of AMR genecopies and 16S rDNA copies. Software R version3.6.1 was used to draw a heat-map of AMR genedissemination from the two farms.
RESULTS
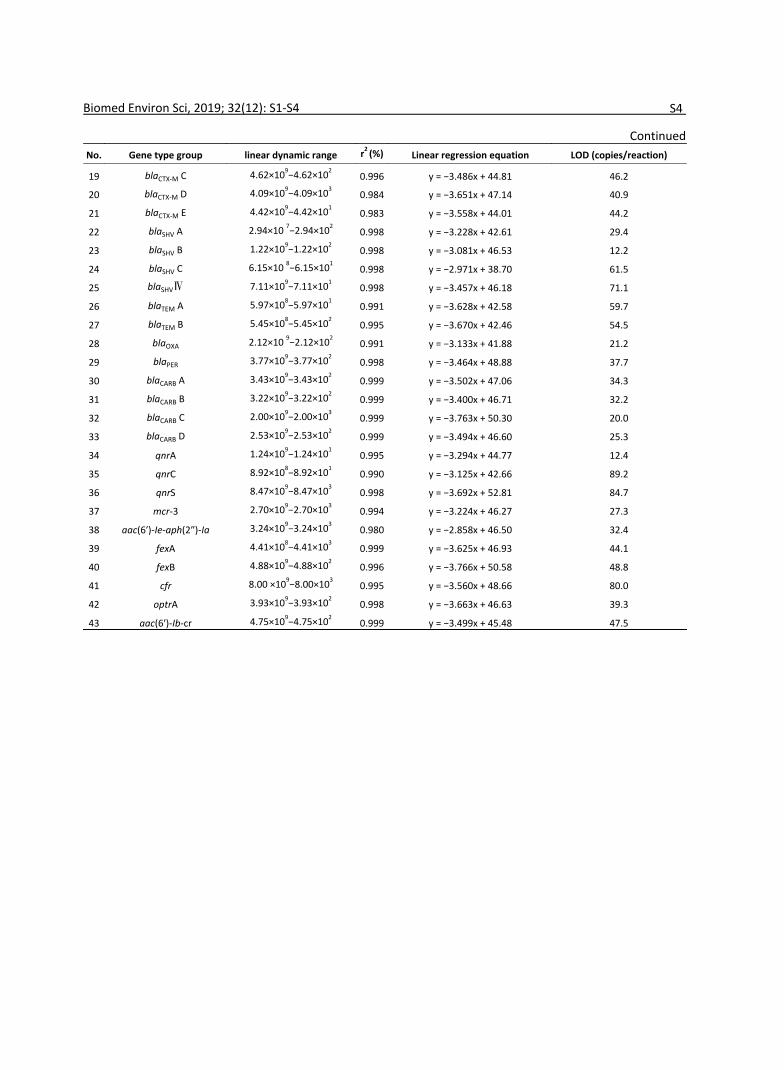
Standard Curve Parameters for AMR Genes fromConventional Real-time PCR Assays
A total of 43 new recombinant plasmidsharbouring AMR genes were constructed in thisstudy. Conventional real-time PCR assays performedon these plasmids gave a limit of detection (LOD),quantification of detection (LOQ), and the uniquelinear dynamic range for each AMR gene andstandard curve parameters were list inSupplementary Table S3, available inwww.besjournal.com. The standard curve parametershowed good relationship between logarithmic valueof recombinant plasmid diluted concentration and Ctvalue and excellent LOQs in linear dynamic range ofall the estimated plasmids. The LODs ranged from12.2 to 89.2 copies/reaction suggested gooddetectability of this study.
LODs for High-throughput Real-time PCR Assays
The LODs for the high-throughput real-time PCRassays established here were verified using a 10-foldserially diluted mixture (106–100 order of magnitudecopies/μL) of the 48 recombinant plasmidsharbouring different AMR target genes/spreadrelated elements/internal processing control gene.
884 Biomed Environ Sci, 2019; 32(12): 881-892
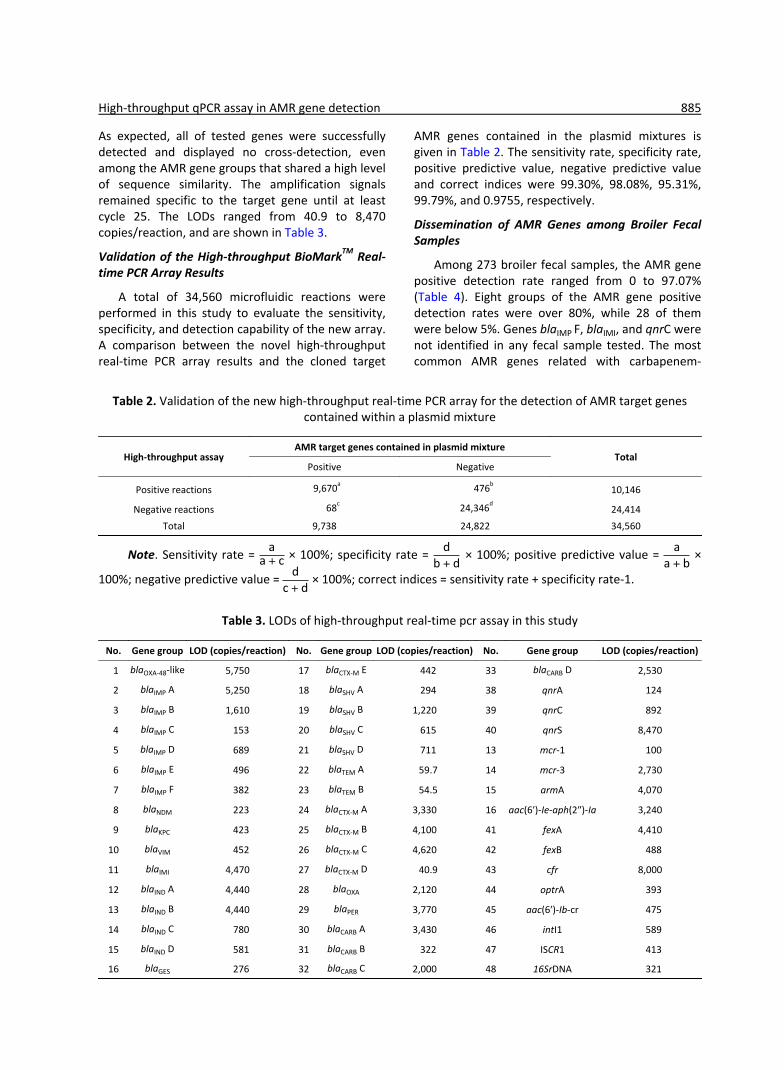
As expected, all of tested genes were successfullydetected and displayed no cross-detection, evenamong the AMR gene groups that shared a high levelof sequence similarity. The amplification signalsremained specific to the target gene until at leastcycle 25. The LODs ranged from 40.9 to 8,470copies/reaction, and are shown in Table 3.
Validation of the High-throughput BioMarkTM Real-time PCR Array Results
A total of 34,560 microfluidic reactions wereperformed in this study to evaluate the sensitivity,specificity, and detection capability of the new array.A comparison between the novel high-throughputreal-time PCR array results and the cloned target
AMR genes contained in the plasmid mixtures isgiven in Table 2. The sensitivity rate, specificity rate,positive predictive value, negative predictive valueand correct indices were 99.30%, 98.08%, 95.31%,99.79%, and 0.9755, respectively.
Dissemination of AMR Genes among Broiler FecalSamples
Among 273 broiler fecal samples, the AMR genepositive detection rate ranged from 0 to 97.07%(Table 4). Eight groups of the AMR gene positivedetection rates were over 80%, while 28 of themwere below 5%. Genes blaIMP F, blaIMI, and qnrC werenot identified in any fecal sample tested. The mostcommon AMR genes related with carbapenem-
Table 2. Validation of the new high-throughput real-time PCR array for the detection of AMR target genescontained within a plasmid mixture
High-throughput assayAMR target genes contained in plasmid mixture
TotalPositive Negative
Positive reactions 9,670a 476b10,146
Negative reactions 68c 24,346d24,414
Total 9,738 24,822 34,560
aa + c
db + d
aa + bd
c + d
Note. Sensitivity rate = × 100%; specificity rate = × 100%; positive predictive value = ×
100%; negative predictive value = × 100%; correct indices = sensitivity rate + specificity rate-1.
Table 3. LODs of high-throughput real-time pcr assay in this study
No. Gene group LOD (copies/reaction) No. Gene group LOD (copies/reaction) No. Gene group LOD (copies/reaction)
1 blaOXA-48-like 5,750 17 blaCTX-M E 442 33 blaCARB D 2,530
2 blaIMP A 5,250 18 blaSHV A 294 38 qnrA 124
3 blaIMP B 1,610 19 blaSHV B 1,220 39 qnrC 892
4 blaIMP C 153 20 blaSHV C 615 40 qnrS 8,470
5 blaIMP D 689 21 blaSHV D 711 13 mcr-1 100
6 blaIMP E 496 22 blaTEM A 59.7 14 mcr-3 2,730
7 blaIMP F 382 23 blaTEM B 54.5 15 armA 4,070
8 blaNDM 223 24 blaCTX-M A 3,330 16 aac(6′)-Ie-aph(2″)-Ia 3,240
9 blaKPC 423 25 blaCTX-M B 4,100 41 fexA 4,410
10 blaVIM 452 26 blaCTX-M C 4,620 42 fexB 488
11 blaIMI 4,470 27 blaCTX-M D 40.9 43 cfr 8,000
12 blaIND A 4,440 28 blaOXA 2,120 44 optrA 393
13 blaIND B 4,440 29 blaPER 3,770 45 aac(6′)-Ib-cr 475
14 blaIND C 780 30 blaCARB A 3,430 46 intI1 589
15 blaIND D 581 31 blaCARB B 322 47 ISCR1 413
16 blaGES 276 32 blaCARB C 2,000 48 16SrDNA 321
High-throughput qPCR assay in AMR gene detection 885
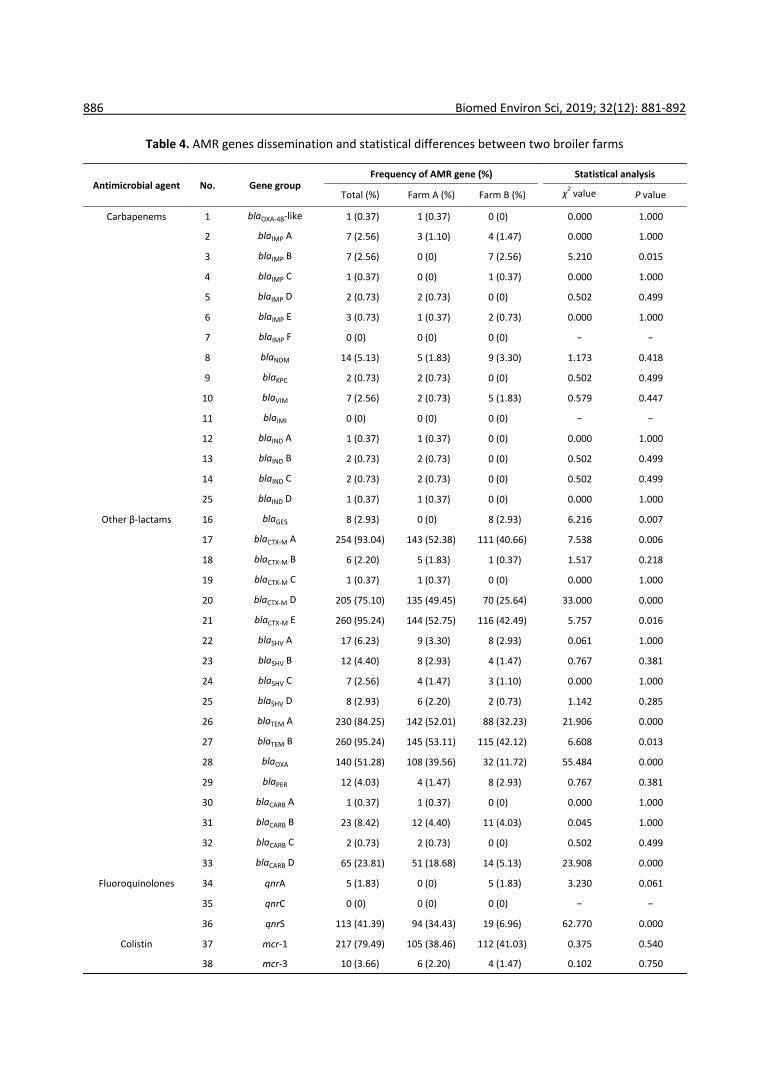
Table 4. AMR genes dissemination and statistical differences between two broiler farms
Antimicrobial agent No. Gene groupFrequency of AMR gene (%) Statistical analysis
Total (%) Farm A (%) Farm B (%) χ2 value P value
Carbapenems 1 blaOXA-48-like 1 (0.37) 1 (0.37) 0 (0) 0.000 1.000
2 blaIMP A 7 (2.56) 3 (1.10) 4 (1.47) 0.000 1.000
3 blaIMP B 7 (2.56) 0 (0) 7 (2.56) 5.210 0.015
4 blaIMP C 1 (0.37) 0 (0) 1 (0.37) 0.000 1.000
5 blaIMP D 2 (0.73) 2 (0.73) 0 (0) 0.502 0.499
6 blaIMP E 3 (0.73) 1 (0.37) 2 (0.73) 0.000 1.000
7 blaIMP F 0 (0) 0 (0) 0 (0) − −
8 blaNDM 14 (5.13) 5 (1.83) 9 (3.30) 1.173 0.418
9 blaKPC 2 (0.73) 2 (0.73) 0 (0) 0.502 0.499
10 blaVIM 7 (2.56) 2 (0.73) 5 (1.83) 0.579 0.447
11 blaIMI 0 (0) 0 (0) 0 (0) − −
12 blaIND A 1 (0.37) 1 (0.37) 0 (0) 0.000 1.000
13 blaIND B 2 (0.73) 2 (0.73) 0 (0) 0.502 0.499
14 blaIND C 2 (0.73) 2 (0.73) 0 (0) 0.502 0.499
25 blaIND D 1 (0.37) 1 (0.37) 0 (0) 0.000 1.000
Other β-lactams 16 blaGES 8 (2.93) 0 (0) 8 (2.93) 6.216 0.007
17 blaCTX-M A 254 (93.04) 143 (52.38) 111 (40.66) 7.538 0.006
18 blaCTX-M B 6 (2.20) 5 (1.83) 1 (0.37) 1.517 0.218
19 blaCTX-M C 1 (0.37) 1 (0.37) 0 (0) 0.000 1.000
20 blaCTX-M D 205 (75.10) 135 (49.45) 70 (25.64) 33.000 0.000
21 blaCTX-M E 260 (95.24) 144 (52.75) 116 (42.49) 5.757 0.016
22 blaSHV A 17 (6.23) 9 (3.30) 8 (2.93) 0.061 1.000
23 blaSHV B 12 (4.40) 8 (2.93) 4 (1.47) 0.767 0.381
24 blaSHV C 7 (2.56) 4 (1.47) 3 (1.10) 0.000 1.000
25 blaSHV D 8 (2.93) 6 (2.20) 2 (0.73) 1.142 0.285
26 blaTEM A 230 (84.25) 142 (52.01) 88 (32.23) 21.906 0.000
27 blaTEM B 260 (95.24) 145 (53.11) 115 (42.12) 6.608 0.013
28 blaOXA 140 (51.28) 108 (39.56) 32 (11.72) 55.484 0.000
29 blaPER 12 (4.03) 4 (1.47) 8 (2.93) 0.767 0.381
30 blaCARB A 1 (0.37) 1 (0.37) 0 (0) 0.000 1.000
31 blaCARB B 23 (8.42) 12 (4.40) 11 (4.03) 0.045 1.000
32 blaCARB C 2 (0.73) 2 (0.73) 0 (0) 0.502 0.499
33 blaCARB D 65 (23.81) 51 (18.68) 14 (5.13) 23.908 0.000
Fluoroquinolones 34 qnrA 5 (1.83) 0 (0) 5 (1.83) 3.230 0.061
35 qnrC 0 (0) 0 (0) 0 (0) − −
36 qnrS 113 (41.39) 94 (34.43) 19 (6.96) 62.770 0.000
Colistin 37 mcr-1 217 (79.49) 105 (38.46) 112 (41.03) 0.375 0.540
38 mcr-3 10 (3.66) 6 (2.20) 4 (1.47) 0.102 0.750
886 Biomed Environ Sci, 2019; 32(12): 881-892
resistance, alternative β-lactam-resistance,fluoroquinolone-resistance, colistin-resistance,aminoglycoside-resistance, phenicol andoxazolidinone-resistance, multidrug resistance, andAMR gene spread were blaNDM, blaTEM B, andblaCTX-M E, qnrS, mcr-1, aac(6′)-Ie-aph(2′′)-Ia, fexA,optrA, and intI1, respectively.
The AMR gene positive detection rates areshown in detail in Table 4. AMR genes were found tobe widely disseminated and commonly co-existed infecal samples using the high-throughput real-timePCR array. Except for 4 fecal samples in which noAMR genes were detected, 24 groups of distinctAMR genes were identified in 2 fecal samples(0.73%), 23 groups in 1 sample (0.37%), 21 groups in1 (0.37%), 20 groups in 1 (0.37%), 19 groups in 6(2.20%), 18 groups in 3 (1.10%), 17 groups in 10(3.66%), 16 groups in 28 (10.26%), 15 groups in 25(9.16%), 14 groups in 31 (11.36%), 13 groups in 33(12.09%), 12 groups in 31 (11.36%), 11 groups in 30(10.99%), 10 groups in 18 (6.59%), 9 groups in 20(7.33%), 8 groups in 12 (4.40%), 7 groups in 4(1.47%), 6 groups in 5 (1.83%), 5 groups in 4 (1.47%),4 groups in 3 (1.10%) and 1 groups in 1 (0.73%).
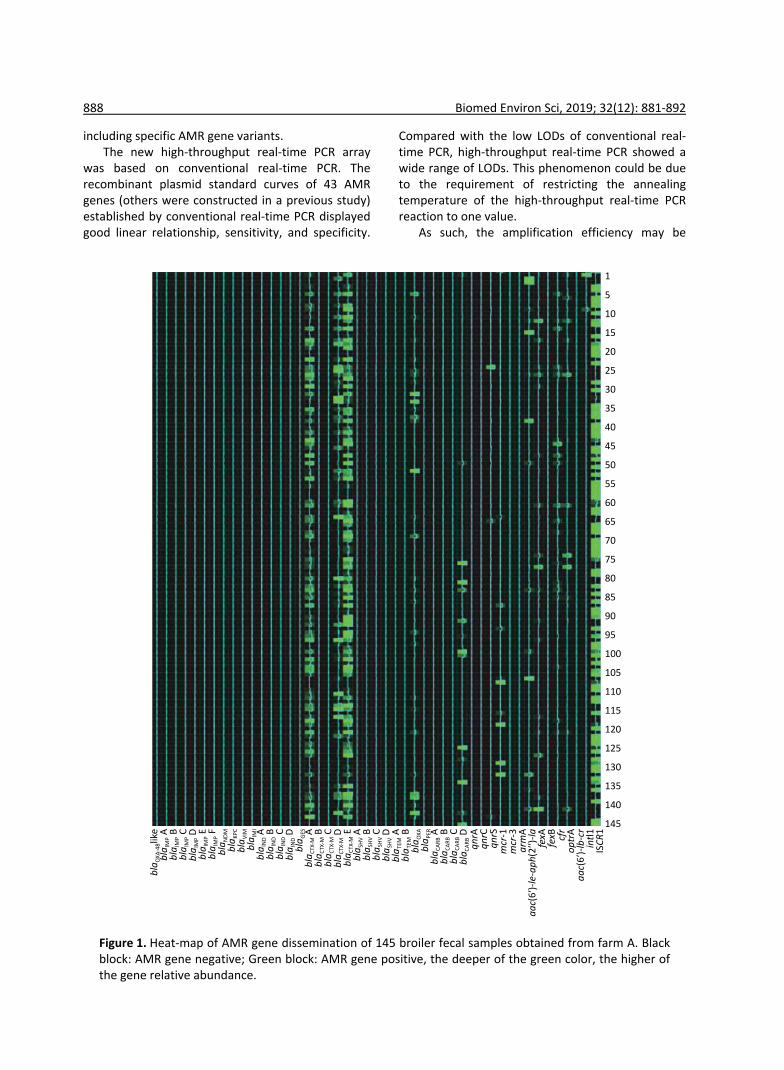
Statistical Differences in AMR Gene Disseminationbetween the Two Farms
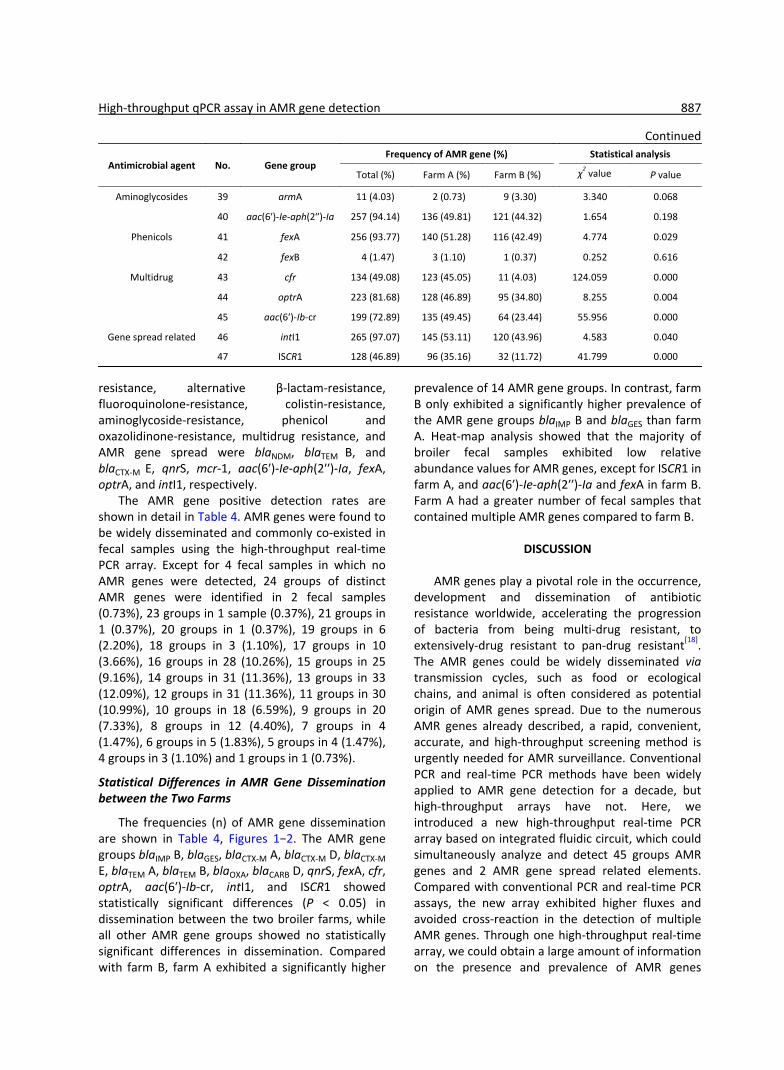
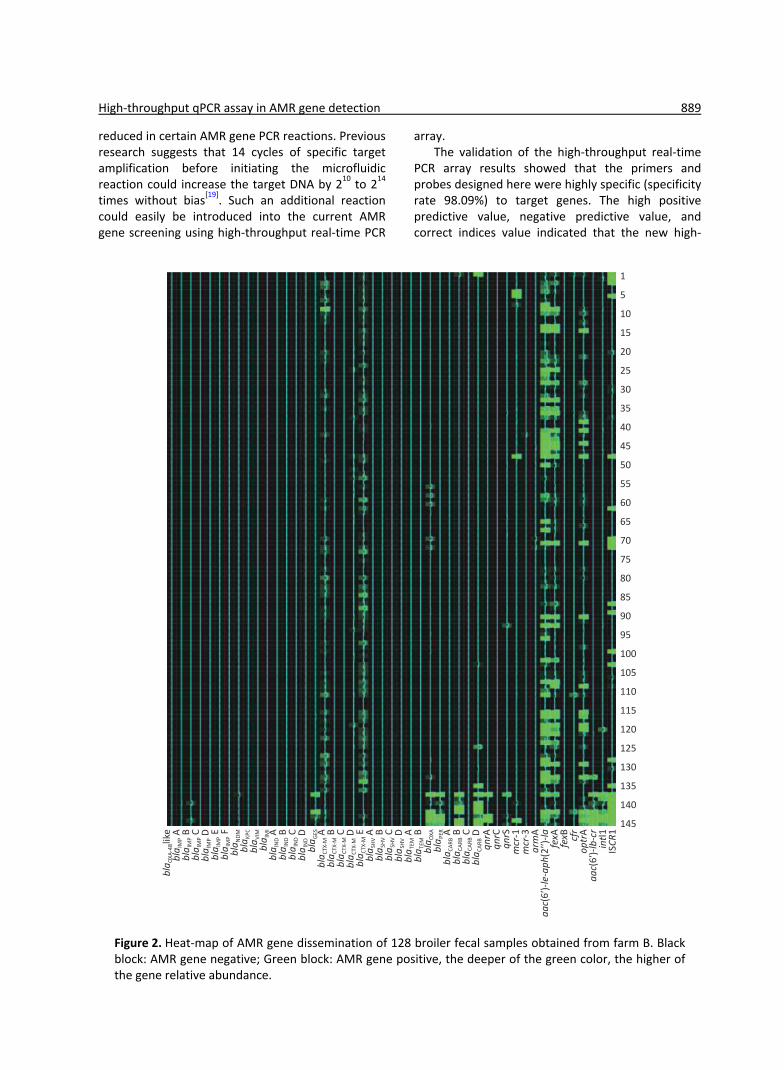
The frequencies (n) of AMR gene disseminationare shown in Table 4, Figures 1−2. The AMR genegroups blaIMP B, blaGES, blaCTX-M A, blaCTX-M D, blaCTX-ME, blaTEM A, blaTEM B, blaOXA, blaCARB D, qnrS, fexA, cfr,optrA, aac(6′)-Ib-cr, intI1, and ISCR1 showedstatistically significant differences (P < 0.05) indissemination between the two broiler farms, whileall other AMR gene groups showed no statisticallysignificant differences in dissemination. Comparedwith farm B, farm A exhibited a significantly higher
prevalence of 14 AMR gene groups. In contrast, farmB only exhibited a significantly higher prevalence ofthe AMR gene groups blaIMP B and blaGES than farmA. Heat-map analysis showed that the majority ofbroiler fecal samples exhibited low relativeabundance values for AMR genes, except for ISCR1 infarm A, and aac(6′)-Ie-aph(2′′)-Ia and fexA in farm B.Farm A had a greater number of fecal samples thatcontained multiple AMR genes compared to farm B.
DISCUSSION
AMR genes play a pivotal role in the occurrence,development and dissemination of antibioticresistance worldwide, accelerating the progressionof bacteria from being multi-drug resistant, toextensively-drug resistant to pan-drug resistant[18].The AMR genes could be widely disseminated viatransmission cycles, such as food or ecologicalchains, and animal is often considered as potentialorigin of AMR genes spread. Due to the numerousAMR genes already described, a rapid, convenient,accurate, and high-throughput screening method isurgently needed for AMR surveillance. ConventionalPCR and real-time PCR methods have been widelyapplied to AMR gene detection for a decade, buthigh-throughput arrays have not. Here, weintroduced a new high-throughput real-time PCRarray based on integrated fluidic circuit, which couldsimultaneously analyze and detect 45 groups AMRgenes and 2 AMR gene spread related elements.Compared with conventional PCR and real-time PCRassays, the new array exhibited higher fluxes andavoided cross-reaction in the detection of multipleAMR genes. Through one high-throughput real-timearray, we could obtain a large amount of informationon the presence and prevalence of AMR genes
Continued
Antimicrobial agent No. Gene groupFrequency of AMR gene (%) Statistical analysis
Total (%) Farm A (%) Farm B (%) χ2 value P value
Aminoglycosides 39 armA 11 (4.03) 2 (0.73) 9 (3.30) 3.340 0.068
40 aac(6′)-Ie-aph(2″)-Ia 257 (94.14) 136 (49.81) 121 (44.32) 1.654 0.198
Phenicols 41 fexA 256 (93.77) 140 (51.28) 116 (42.49) 4.774 0.029
42 fexB 4 (1.47) 3 (1.10) 1 (0.37) 0.252 0.616
Multidrug 43 cfr 134 (49.08) 123 (45.05) 11 (4.03) 124.059 0.000
44 optrA 223 (81.68) 128 (46.89) 95 (34.80) 8.255 0.004
45 aac(6′)-Ib-cr 199 (72.89) 135 (49.45) 64 (23.44) 55.956 0.000
Gene spread related 46 intI1 265 (97.07) 145 (53.11) 120 (43.96) 4.583 0.040
47 ISCR1 128 (46.89) 96 (35.16) 32 (11.72) 41.799 0.000
High-throughput qPCR assay in AMR gene detection 887
including specific AMR gene variants.The new high-throughput real-time PCR array
was based on conventional real-time PCR. Therecombinant plasmid standard curves of 43 AMRgenes (others were constructed in a previous study)established by conventional real-time PCR displayedgood linear relationship, sensitivity, and specificity.
Compared with the low LODs of conventional real-time PCR, high-throughput real-time PCR showed awide range of LODs. This phenomenon could be dueto the requirement of restricting the annealingtemperature of the high-throughput real-time PCRreaction to one value.
As such, the amplification efficiency may be
1
5
1
10
15
20
25
30
35
40
45
50
55
60
65
70
75
80
85
90
95
100
105
110
115
120
125
130
135
140
145
ISCR
1
intl
1
aac(6ʹ)-lb-cr
aac(6ʹ)-le-aph(2ʹʹ)-la
optr
A
cfr
fexB
fexA
arm
A
mcr-3
mcr-1
qnrS
qnrC
qnrA
bla
CA
RB D
bla
CA
RB C
bla
CA
RB B
bla
CA
RB A
bla
PE
R
bla
OX
A
bla
TE
M B
bla
TE
M A
bla
SH
V D
bla
SH
V C
bla
SH
V B
bla
SH
V A
bla
CTX-M
E
bla
CTX-M
D
bla
CTX-M
C
bla
CTX-M
B
bla
CTX-M
A
bla
GE
S
bla
lND D
bla
lND C
bla
lND B
bla
lND A
bla
lMI
bla
VIM
bla
KP
C
bla
ND
M
bla
lMP F
bla
lMP E
bla
lMP D
bla
lMP C
bla
lMP B
bla
lMP A
bla
OXA-48
like
Figure 1. Heat-map of AMR gene dissemination of 145 broiler fecal samples obtained from farm A. Blackblock: AMR gene negative; Green block: AMR gene positive, the deeper of the green color, the higher ofthe gene relative abundance.
888 Biomed Environ Sci, 2019; 32(12): 881-892
reduced in certain AMR gene PCR reactions. Previousresearch suggests that 14 cycles of specific targetamplification before initiating the microfluidicreaction could increase the target DNA by 210 to 214
times without bias[19]. Such an additional reactioncould easily be introduced into the current AMRgene screening using high-throughput real-time PCR
array.The validation of the high-throughput real-time
PCR array results showed that the primers andprobes designed here were highly specific (specificityrate 98.09%) to target genes. The high positivepredictive value, negative predictive value, andcorrect indices value indicated that the new high-
1
5
1
10
15
20
25
30
35
40
45
50
55
60
65
70
75
80
85
90
95
100
105
110
115
120
125
130
135
140
145
ISCR
1
intl
1
aac(6ʹ)-lb-cr
aac(6ʹ)-le-aph(2ʹʹ)-la
optr
A
cfr
fexB
fexA
arm
A
mcr-3
mcr-1
qnrS
qnrC
qnrA
bla
CA
RB D
bla
CA
RB C
bla
CA
RB B
bla
CA
RB A
bla
PE
R
bla
OX
A
bla
TE
M B
bla
TE
M A
bla
SH
V D
bla
SH
V C
bla
SH
V B
bla
SH
V A
bla
CTX-M
E
bla
CTX-M
D
bla
CTX-M
C
bla
CTX-M
B
bla
CTX-M
A
bla
GE
S
bla
lND D
bla
lND C
bla
lND B
bla
lND A
bla
lMI
bla
VIM
bla
KP
C
bla
ND
M
bla
lMP F
bla
lMP E
bla
lMP D
bla
lMP C
bla
lMP B
bla
lMP A
bla
OXA-48
like
Figure 2. Heat-map of AMR gene dissemination of 128 broiler fecal samples obtained from farm B. Blackblock: AMR gene negative; Green block: AMR gene positive, the deeper of the green color, the higher ofthe gene relative abundance.
High-throughput qPCR assay in AMR gene detection 889
throughput real-time PCR array was credible andvaluable in the detection of multiple AMR genes,even when up to 45 groups AMR genes and 2 AMRgene spread related elements were simultaneouslypresent in one recombinant plasmid mixture. Theresults of this study suggested that the high-throughput real-time PCR array was exactly stabledand sensitive. The novel designed assay could bewidely used in large scale screening of AMR gene,and more AMR target genes could be involved in the‘chip’ assay design in further.
The novel high-throughput method establishedin this study was applied to detect the AMR genesdisseminated in 273 broiler fecal samples. A total of45 groups AMR genes and 2 AMR gene spreadrelated elements could be detected in 47 fecalsamples simultaneously using the array, along withone internal processing control for the detectionarrays and one negative control in the sample arrays.Compared with conventional culturing andantimicrobial susceptibility tests, the novel array wassuccessfully used on broiler fecal samples to obtaingreater detail on the presence and prevalence ofAMR genes, saving both time and reagents. The AMRgene dissemination patterns identified in this studyindicated that a wide range of antimicrobialresistance existed among the 273 broiler fecalsamples. All eight groups of AMR genes weredetected, some with high prevalence. Gene intI1 iscommonly involved in the of many AMR genestransmission, and is closely associated withmultidrug resistance[20-22]. Our results showed a highpositive detection rate for intI1 indicating that thepotential for multiple AMR genes movement andwidespread in the two broiler farms studied. The β-lactam-resistance genes blaCTX-M A, blaCTX-M B,blaCTX-M E, blaTEM A, and blaTEM B also showed highprevalence in this study, which suggested thatbacteria in the collected samples may show commonresistance to cephalosporins including the thirdgeneration cephalosporins as previouslydescribed[7,9,23,24]. Although many AMR genes showedlow relative abundance values, antimicrobial agentusage strictly controlling, reduce additives usage ofantimicrobial agent rotational and mixed application,and non-pharmaceutical therapy should beperformed to enhance broiler growth and reducefeed cost in broiler production in the farm. In thisstudy, the patterns of AMR gene disseminationbetween the two broiler farms were distinct. Manyresearchers have found that these AMR genes arewidely spread in livestock and poultryhusbandry[4,6,20,24]. Our questionnaire showed that
many kinds of antimicrobial agents were commonlyused during broiler production. It suggested that thedrugs may give selection pressure for AMR genesand multidrug resistance widely dissemination. Agreater amount of information on AMR genepresence and prevalence could be collected throughexpansion of both the types of genes and numbersof primers used in AMR surveillance in further.
The prevalence of the carbapenem-resistancegene group was the lowest among the eight AMRgene groups, with blaNDM showing the highestpositive detection rate in the group (Table 4, 5.13%,assay 1 to assay 12). Although the use ofcarbapenems is forbidden in livestock and poultryhusbandry, carbapenem-resistance AMR genes arebeing increasingly identified[25-27]. It has beensuggested that plasmid-mediated AMR gene transfermight play an important role in the spread ofbacterial resistance even with a lack of antimicrobialagent selective pressure. The mcr genes have beenfound giving a big contribution to high levels ofcolistin resistance[4,9,18,25,26]. Colistin was a commonand legal antimicrobial agent used inlivestock/poultry husbandry in China until April,2017. The wide spread of mcr-1 in broiler farmsindicates that colistin perhaps cannot be usedeffectively in disease prevention and control underthese conditions.
ISCR1 is recognized as a powerful AMR genecapture and movement system element, and canwidely transmit AMR genes among different speciesof bacteria[28,29]. The existence of the intI1- ISCR1complex structure is responsible for both multidrugresistance and extensive resistance[30-32]. Our findingof over 95% prevalence for intI1 and nearly 50%prevalence for ISCR1 are suggestive of a largenumber of multidrug resistant and extensivelyresistant bacteria in broiler farms, which couldseriously reduce the effectiveness of antimicrobialagents.
In this study, two farms underwent AMR genescreening. The results showed statistically significantdifferences in the dissemination and prevalence of16 AMR gene groups between these two farms.These differences indicated that the predominantAMR gene types varied between the twogeographically distinct farms. This observation isconsistent with previous research[9,33]. Heat-mapanalysis further highlighted the different relativeabundance levels in AMR genes between farm A andfarm B. There were higher relative abundance valuesfor AMR genes in fecal samples from farm B,suggesting higher copy numbers for these AMR
890 Biomed Environ Sci, 2019; 32(12): 881-892
genes, which could contribute to a higher level ofAMR and severe multidrug resistance. Comparedwith farm B, the AMR gene prevalence rates weremore seriously in farm A, especially gene spreadrelated element intI1 and ISCR1. This observationindicated that more strictly antimicrobial agentusage controlling should be given, and antimicrobialagent rotational and mixed application strategyshould be considered urgently in farm A. From Heat-map analysis, the high relative abundance values ofaac(6′)-Ie-aph(2′′)-Ia and fexA in farm B indicatedthat aminoglycosides and phenicols agents should beused cautiously in further.
CONCLUSIONS
In conclusion, we have established a new,reliable, convenient, rapid and high-throughput real-time PCR assay for the screening and identificationof AMR genes in broiler fecal samples. Our methodcan provide a great amount of data on the presenceand abundance of 47 groups of distinct AMRgenes/AMR gene spread related elements, including688 variants, from a total of 47 different samplesdirectly and simultaneously. The new assay wassuccessfully applied to AMR gene screening in 273broiler fecal samples from two farms. Bothqualitative and quantitative information obtainedfrom this novel assay highlighted the high prevalenceof AMR gene existence in broiler farms, withdifferent AMR gene groups predominating betweenthe two farms. To our best knowledge, this is thefirst report of the simultaneous screening of up to 47groups of AMR genes/AMR gene spread relatedelements directly from broiler fecal samples using ahigh-throughput microfluidic dynamic real-timeassay. This novel assay could be popularized andapplied to AMR surveillance in situations other thanlivestock and poultry husbandry in the near future.
DECLARATIONS
The ethics approval and consent of participateisnot applicable.
Received: June 5, 2019;Accepted: September 15, 2019
REFERENCES
World Health Organization. Antimicrobial resistance globalreport on surveillance. http://apps.who.int/gb/ebwha/pdf_files/EB134/B134_R12-en.pdf. [2018-11-12]
1.
Nhung NT, Cuong NV, Thwaites G, et al. Antimicrobial usageand antimicrobial resistance in animal production in SoutheastAsia: A review. Antibiotics (Basel), 2016; 5, 37.
2.
O’Neill J. Antimicrobial Resistance: Tackling a crisis for thehealth and wealth of nations. The Review on AntimicrobialResistance. https://amr-review.org/sites/default/files/AMR%20Review%20Paper%20-%20Tackling%20a%20crisis%20for%20the%20health%20and%20wealth%20of%20nations_1.pdf. [2018-11-12]
3.
Liu YY, Wang Y, Walsh RT, et al. Emergence of plasmid-mediated colistin resistance mechanism MCR-1 in animals andhuman beings in China: a microbiological and molecularbiological study. Lancet Infect Dis, 2016; 16, 161−8.
4.
Ramírez-Castillo FY, Moreno-Flores AC, Avelar-González FJ, etal. An evaluation of multidrug-resistant Escherichia coliisolates in urinary tract infections from Aguascalientes,Mexico: cross-sectional study. Ann Clin Microbiol Antimicrob,2018; 17, 34.
5.
Dominguez JE, Redondo LM, Figueroa Espinosa RA, et al.Simultaneous carriage of mcr-1 and other antimicrobialresistance determinants in Escherichia coli from poultry. FrontMicrobiol, 2018; 9, 1679.
6.
Doi Y, lovleva A, Bonomo RA. The ecology of extended-spectrum β-lactamases (ESBLs) in the developed world. JTravel Med, 2017; 24, S44-51.
7.
Azargun R, Sadeghi MR, Soroush Barhaghi MH, et al. Theprevalence of plasmid-mediated quinolone resistance andESBL-production in Enterobacteriaceae isolated from urinarytract infections. Infect Drug Resist, 2018; 1, 1007−14.
8.
Chen X, Zhao X, Che J, et al. Detection and dissemination ofthe colistin resistance gene, mcr-1, from isolates and faecalsamples in China. J Med Microbiol, 2017; 66, 119−25.
9.
Moghnieh RA, Kanafani ZA, Tabaja HZ, et al. Epidemiology ofcommon resistant bacterial pathogens in the countries of theArab League. Lancet Infect Dis, 2018; 18, e379−84.
10.
Jousset AB, Bernabeu S, Bonnin RA, et al. Development andvalidation of a multiples PCR assay for the detection of the fivefamilies of plasmid-encoded colistin resistance. Int JAntimicrob Agents, 2019; 53, 302−9.
11.
Spurgeon SL, Jones RC, Ramakrishnan R. High throughput geneexpression measurement with real time PCR in a microfluidicdynamic array. PLoS One, 2008; 3, e1662.
12.
Dhoubhadel BG, Yasunami M, Yoshida LM, et al. A novel high-throughput method for molecular serotyping and serotype-specific quantification of Streptococcus pneumoniae using ananofluidic real-time PCR system. J Med Microbiol, 2014; 63,528−39.
13.
Michelet L, Delannoy S, Devillers E, et al. High-throughputscreening of tick-borne pathogens in Europe. Front Cell InfectMicrobiol, 2014; 4, 103.
14.
Dufour MC, Magnin N, Dumas B, et al. High-throughput gene-expression quantification of grapevine defense responses inthe field using microfluidic dynamic arrays. BMC Genomics,2016; 17, 957.
15.
Che J, Zhao X, Lu J, et al. Establishment of a duplex MGB real-time PCR assay for int1 gene and ISCR1 element detections.Dis Surveil, 2017; 32, 878−82. (In Chinese)
16.
Gong L, Yuan M, Chen X, et al. Establishment of Real-time PCRassay to detect resistance gene armA. Dis Surveil, 2014; 29,901−4. (In Chinese)
17.
O’Neill J. Tackling drug-resistant infections globally: finalreport and recommendations. https://amr-review.org/sites/default/files/160525_Final%20paper_with%20cover.pdf.[2018-11-12]
18.
Ishii S, Segawa T, Okabe S. Simultaneous quantification ofmultiple food- and waterborne pathogens by use of
19.
High-throughput qPCR assay in AMR gene detection 891
microfluidic quantitative PCR. Appl Environ Microbial, 2013;79, 2891−8.Chen X, Li GX, Zhang H, et al. Characterization of class 1integron gene cassettes among clinical bacteria isolated fromone large hospital in northern China. Biomed Environ Sci,2013; 26, 1003−7.
20.
Colello R, Krüger A, Conza JD, et al. Antimicrobial resistance inclass 1 integron-positive Shiga toxin-producing Escherichia coliisolated from cattle, pigs, food and farm environment.Microorganisms, 2018; 6, 99.
21.
Faghri J, Nouri S, Jalalifar S, et al. Investigation of antimicrobialsusceptibility, class I and II integrons among Pseudomonasaeruginosa isolates from hospitalized patients in Isfahan, Iran.BMC Res Notes, 2018; 11, 806.
22.
Ur Rahman S, Ali T, Ali I, et al. The growing genetic andfunctional diversity of extended spectrum beta-lactamases.Biomed Res Int, 2018; 95, 19718.
23.
Bidell MR, Palchak M, Mohr J, et al. Fluoroquinolone and third-generation-cephalosporin resistance among hospitalizedpatients with urinary tract infections due to Escherichia coli:Do rates vary by hospital characteristics and geographicregion? Antimicrob Agents Chemother, 2016; 60, 3170−3.
24.
Wang Y, Zhang R, Li J, et al. Comprehensive resistome analysisreveals the prevalence of NDM and MCR-1 in Chinese poultryproduction. Nat Microbiol, 2017; 2, 16260.
25.
Danadchi I, Chabou S, Daoud Z, et al. Prevalence andemergence of extended-spectrum cephalosporin-,
26.
carbapenems- and colistin-resistant gram negative bacteria ofanimal origin in the Mediterranean Basin Front Microbiol,2018; 9, 2299.Vikram A, Schmidt JW. Functional blaKPC-2 sequences arepresent in U.S. beef cattle feces regardless of antibiotic useFoodborne Pathog Dis, 2018; 15, 444-8.
27.
Dimude JU, Amyes SGB. Molecular characterisation anddiversity in Enterobacter cloacae from Edinburgh and Egyptcarrying blaCTX-M-14 and blaVIM-4 β-lactamase genes. Int JAntimicrob Agents, 2013; 41, 574−7.
28.
Lallement C, Pasternak C, Ploy M-C, et al. The role of ISCR1-borne POUT promoters in the expreesion of antibioticresistance genes. Front Microbiol, 2018; 9, 2579.
29.
Toleman MA, Bennett PM, Walsh TR. ISCR elements: novelgene-capturing systems of the 12st century? Microbiol MolBiol Rev, 2006; 70, 296−16.
30.
Bennett PM. Plasmid encoded antibiotic resistance:acquisition and transfer of antibiotic resistance genes inbacteria. Br J Pharmacol, 2008; 153, S347−57.
31.
Chen X, Che J, Zhao X, et al. Dissemination of insertionsequence common regions 1 and int1 gene and drugresistance of 483 Escherichia coli and Klebsiella pneumoniabroiler isolates. Chinese Journal of Preventive Medicine, 2017;51, 886−9. (In Chinese)
32.
Theuretzbacher U. Global antimicrobial resistance in Gram-negative pathogens and clinical need. Curr Opin Microbiol,2017; 39, 106−12.
33.
892 Biomed Environ Sci, 2019; 32(12): 881-892
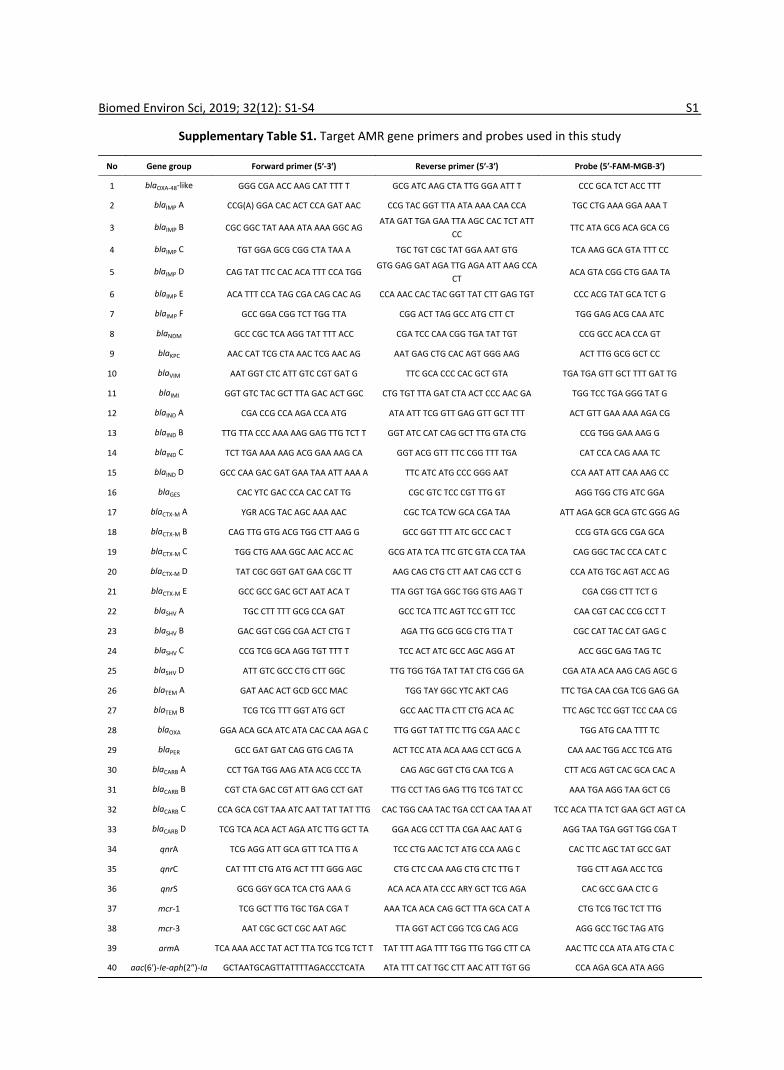
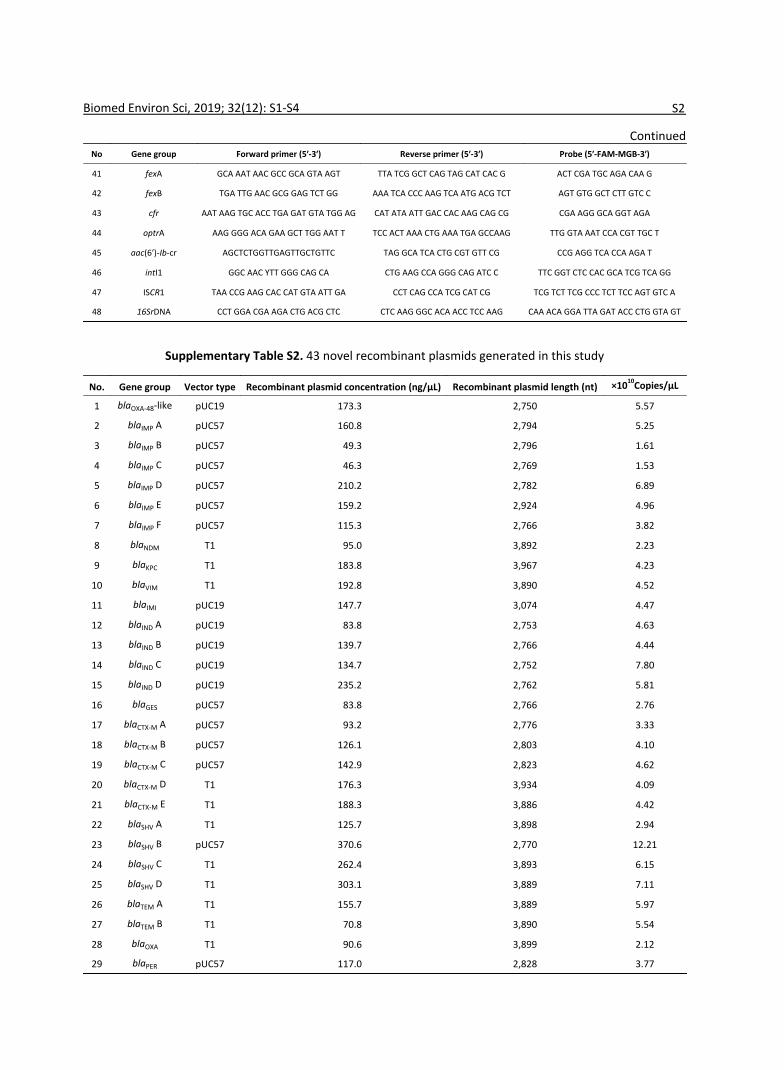
Supplementary Table S1. Target AMR gene primers and probes used in this study
No Gene group Forward primer (5′-3′) Reverse primer (5′-3′) Probe (5′-FAM-MGB-3′)
1 blaOXA-48-like GGG CGA ACC AAG CAT TTT T GCG ATC AAG CTA TTG GGA ATT T CCC GCA TCT ACC TTT
2 blaIMP A CCG(A) GGA CAC ACT CCA GAT AAC CCG TAC GGT TTA ATA AAA CAA CCA TGC CTG AAA GGA AAA T
3 blaIMP B CGC GGC TAT AAA ATA AAA GGC AGATA GAT TGA GAA TTA AGC CAC TCT ATT
CCTTC ATA GCG ACA GCA CG
4 blaIMP C TGT GGA GCG CGG CTA TAA A TGC TGT CGC TAT GGA AAT GTG TCA AAG GCA GTA TTT CC
5 blaIMP D CAG TAT TTC CAC ACA TTT CCA TGGGTG GAG GAT AGA TTG AGA ATT AAG CCA
CTACA GTA CGG CTG GAA TA
6 blaIMP E ACA TTT CCA TAG CGA CAG CAC AG CCA AAC CAC TAC GGT TAT CTT GAG TGT CCC ACG TAT GCA TCT G
7 blaIMP F GCC GGA CGG TCT TGG TTA CGG ACT TAG GCC ATG CTT CT TGG GAG ACG CAA ATC
8 blaNDM GCC CGC TCA AGG TAT TTT ACC CGA TCC CAA CGG TGA TAT TGT CCG GCC ACA CCA GT
9 blaKPC AAC CAT TCG CTA AAC TCG AAC AG AAT GAG CTG CAC AGT GGG AAG ACT TTG GCG GCT CC
10 blaVIM AAT GGT CTC ATT GTC CGT GAT G TTC GCA CCC CAC GCT GTA TGA TGA GTT GCT TTT GAT TG
11 blaIMI GGT GTC TAC GCT TTA GAC ACT GGC CTG TGT TTA GAT CTA ACT CCC AAC GA TGG TCC TGA GGG TAT G
12 blaIND A CGA CCG CCA AGA CCA ATG ATA ATT TCG GTT GAG GTT GCT TTT ACT GTT GAA AAA AGA CG
13 blaIND B TTG TTA CCC AAA AAG GAG TTG TCT T GGT ATC CAT CAG GCT TTG GTA CTG CCG TGG GAA AAG G
14 blaIND C TCT TGA AAA AAG ACG GAA AAG CA GGT ACG GTT TTC CGG TTT TGA CAT CCA CAG AAA TC
15 blaIND D GCC CAA GAC GAT GAA TAA ATT AAA A TTC ATC ATG CCC GGG AAT CCA AAT ATT CAA AAG CC
16 blaGES CAC YTC GAC CCA CAC CAT TG CGC GTC TCC CGT TTG GT AGG TGG CTG ATC GGA
17 blaCTX-M A YGR ACG TAC AGC AAA AAC CGC TCA TCW GCA CGA TAA ATT AGA GCR GCA GTC GGG AG
18 blaCTX-M B CAG TTG GTG ACG TGG CTT AAG G GCC GGT TTT ATC GCC CAC T CCG GTA GCG CGA GCA
19 blaCTX-M C TGG CTG AAA GGC AAC ACC AC GCG ATA TCA TTC GTC GTA CCA TAA CAG GGC TAC CCA CAT C
20 blaCTX-M D TAT CGC GGT GAT GAA CGC TT AAG CAG CTG CTT AAT CAG CCT G CCA ATG TGC AGT ACC AG
21 blaCTX-M E GCC GCC GAC GCT AAT ACA T TTA GGT TGA GGC TGG GTG AAG T CGA CGG CTT TCT G
22 blaSHV A TGC CTT TTT GCG CCA GAT GCC TCA TTC AGT TCC GTT TCC CAA CGT CAC CCG CCT T
23 blaSHV B GAC GGT CGG CGA ACT CTG T AGA TTG GCG GCG CTG TTA T CGC CAT TAC CAT GAG C
24 blaSHV C CCG TCG GCA AGG TGT TTT T TCC ACT ATC GCC AGC AGG AT ACC GGC GAG TAG TC
25 blaSHV D ATT GTC GCC CTG CTT GGC TTG TGG TGA TAT TAT CTG CGG GA CGA ATA ACA AAG CAG AGC G
26 blaTEM A GAT AAC ACT GCD GCC MAC TGG TAY GGC YTC AKT CAG TTC TGA CAA CGA TCG GAG GA
27 blaTEM B TCG TCG TTT GGT ATG GCT GCC AAC TTA CTT CTG ACA AC TTC AGC TCC GGT TCC CAA CG
28 blaOXA GGA ACA GCA ATC ATA CAC CAA AGA C TTG GGT TAT TTC TTG CGA AAC C TGG ATG CAA TTT TC
29 blaPER GCC GAT GAT CAG GTG CAG TA ACT TCC ATA ACA AAG CCT GCG A CAA AAC TGG ACC TCG ATG
30 blaCARB A CCT TGA TGG AAG ATA ACG CCC TA CAG AGC GGT CTG CAA TCG A CTT ACG AGT CAC GCA CAC A
31 blaCARB B CGT CTA GAC CGT ATT GAG CCT GAT TTG CCT TAG GAG TTG TCG TAT CC AAA TGA AGG TAA GCT CG
32 blaCARB C CCA GCA CGT TAA ATC AAT TAT TAT TTG CAC TGG CAA TAC TGA CCT CAA TAA AT TCC ACA TTA TCT GAA GCT AGT CA
33 blaCARB D TCG TCA ACA ACT AGA ATC TTG GCT TA GGA ACG CCT TTA CGA AAC AAT G AGG TAA TGA GGT TGG CGA T
34 qnrA TCG AGG ATT GCA GTT TCA TTG A TCC CTG AAC TCT ATG CCA AAG C CAC TTC AGC TAT GCC GAT
35 qnrC CAT TTT CTG ATG ACT TTT GGG AGC CTG CTC CAA AAG CTG CTC TTG T TGG CTT AGA ACC TCG
36 qnrS GCG GGY GCA TCA CTG AAA G ACA ACA ATA CCC ARY GCT TCG AGA CAC GCC GAA CTC G
37 mcr-1 TCG GCT TTG TGC TGA CGA T AAA TCA ACA CAG GCT TTA GCA CAT A CTG TCG TGC TCT TTG
38 mcr-3 AAT CGC GCT CGC AAT AGC TTA GGT ACT CGG TCG CAG ACG AGG GCC TGC TAG ATG
39 armA TCA AAA ACC TAT ACT TTA TCG TCG TCT T TAT TTT AGA TTT TGG TTG TGG CTT CA AAC TTC CCA ATA ATG CTA C
40 aac(6′)-Ie-aph(2″)-Ia GCTAATGCAGTTATTTTAGACCCTCATA ATA TTT CAT TGC CTT AAC ATT TGT GG CCA AGA GCA ATA AGG
Biomed Environ Sci, 2019; 32(12): S1-S4 S1
ContinuedNo Gene group Forward primer (5′-3′) Reverse primer (5′-3′) Probe (5′-FAM-MGB-3′)
41 fexA GCA AAT AAC GCC GCA GTA AGT TTA TCG GCT CAG TAG CAT CAC G ACT CGA TGC AGA CAA G
42 fexB TGA TTG AAC GCG GAG TCT GG AAA TCA CCC AAG TCA ATG ACG TCT AGT GTG GCT CTT GTC C
43 cfr AAT AAG TGC ACC TGA GAT GTA TGG AG CAT ATA ATT GAC CAC AAG CAG CG CGA AGG GCA GGT AGA
44 optrA AAG GGG ACA GAA GCT TGG AAT T TCC ACT AAA CTG AAA TGA GCCAAG TTG GTA AAT CCA CGT TGC T
45 aac(6′)-Ib-cr AGCTCTGGTTGAGTTGCTGTTC TAG GCA TCA CTG CGT GTT CG CCG AGG TCA CCA AGA T
46 intI1 GGC AAC YTT GGG CAG CA CTG AAG CCA GGG CAG ATC C TTC GGT CTC CAC GCA TCG TCA GG
47 ISCR1 TAA CCG AAG CAC CAT GTA ATT GA CCT CAG CCA TCG CAT CG TCG TCT TCG CCC TCT TCC AGT GTC A
48 16SrDNA CCT GGA CGA AGA CTG ACG CTC CTC AAG GGC ACA ACC TCC AAG CAA ACA GGA TTA GAT ACC CTG GTA GT
Supplementary Table S2. 43 novel recombinant plasmids generated in this study
No. Gene group Vector type Recombinant plasmid concentration (ng/μL) Recombinant plasmid length (nt) ×1010Copies/μL
1 blaOXA-48-like pUC19 173.3 2,750 5.57
2 blaIMP A pUC57 160.8 2,794 5.25
3 blaIMP B pUC57 49.3 2,796 1.61
4 blaIMP C pUC57 46.3 2,769 1.53
5 blaIMP D pUC57 210.2 2,782 6.89
6 blaIMP E pUC57 159.2 2,924 4.96
7 blaIMP F pUC57 115.3 2,766 3.82
8 blaNDM T1 95.0 3,892 2.23
9 blaKPC T1 183.8 3,967 4.23
10 blaVIM T1 192.8 3,890 4.52
11 blaIMI pUC19 147.7 3,074 4.47
12 blaIND A pUC19 83.8 2,753 4.63
13 blaIND B pUC19 139.7 2,766 4.44
14 blaIND C pUC19 134.7 2,752 7.80
15 blaIND D pUC19 235.2 2,762 5.81
16 blaGES pUC57 83.8 2,766 2.76
17 blaCTX-M A pUC57 93.2 2,776 3.33
18 blaCTX-M B pUC57 126.1 2,803 4.10
19 blaCTX-M C pUC57 142.9 2,823 4.62
20 blaCTX-M D T1 176.3 3,934 4.09
21 blaCTX-M E T1 188.3 3,886 4.42
22 blaSHV A T1 125.7 3,898 2.94
23 blaSHV B pUC57 370.6 2,770 12.21
24 blaSHV C T1 262.4 3,893 6.15
25 blaSHV D T1 303.1 3,889 7.11
26 blaTEM A T1 155.7 3,889 5.97
27 blaTEM B T1 70.8 3,890 5.54
28 blaOXA T1 90.6 3,899 2.12
29 blaPER pUC57 117.0 2,828 3.77
Biomed Environ Sci, 2019; 32(12): S1-S4 S2
ContinuedNo. Gene group Vector type Recombinant plasmid concentration (ng/μL) Recombinant plasmid length (nt) ×1010Copies/μL
30 blaCARB A pUC57 106.9 2,841 3.43
31 blaCARB B pUC57 98.4 2,795 3.22
32 blaCARB C pUC57 62.1 2,831 2.00
33 blaCARB D pUC57 77.2 2,778 2.53
34 qnrA pUC57 38.8 2,855 1.24
35 qnrC pUC57 27.9 2,853 0.89
36 qnrS pUC57 27.0 2,907 0.85
37 mcr-1 [9]
38 mcr-3 T1 248.0 3,942 5.74
39 armA [16]
40 aac(6′)-Ie-aph(2″)-Ia pUC57 102.9 2,896 3.24
41 fexA pUC57 138.3 2,861 4.41
42 fexB pUC57 151.2 2,827 4.88
43 cfr pUC57 25.0 2,853 0.80
44 optrA pUC57 129.7 2,963 3.93
45 aac(6′)-Ib-cr pUC57 151.3 2,908 4.75
46 intI1 [17]
47 ISCR1 [17]
48 16SrDNA [9]
Supplementary Table S3. Standard curves parameters for 43 AMR genes from conventional real-timePCR assays
No. Gene type group linear dynamic range r2 (%) Linear regression equation LOD (copies/reaction)
1 blaOXA-48-like 5.75×10 9−5.75×1020.999 y = −3.519x + 45.50 57.5
2 blaIMP A 5.25×10 9−5.25×1020.997 y = −3.551x + 46.85 52.5
3 blaIMP B 1.61×10 9−1.61×1020.993 y = −3.321x + 45.49 16.1
4 blaIMP C 1.53×10 9−1.53×1010.998 y = −3.592x + 45.09 15.3
5 blaIMP D 6.89×10 9−6.89×1010.999 y = −3.653x + 46.44 68.9
6 blaIMP E 4.96×10 9−4.96×1010.998 y = −3.568x + 45.16 49.6
7 blaIMP F 3.82×10 9−3.82×1020.998 y = −3.506x + 44.56 38.2
8 blaNDM 2.23×10 9−2.23×1010.995 y = −3.470x + 43.73 22.3
9 blaKPC 4.23×10 9−4.23×1010.997 y = −3.343x + 43.77 42.3
10 blaVIM 4.52×10 9−4.52×1020.997 y = −3.534x + 46.05 45.2
11 blaIMI 4.47×10 9−4.47×1020.999 y = −3.802x + 49.85 44.7
12 blaIND A 4.44×10⁹−4.44×1030.986 y = −3.520x + 51.11 44.4
13 blaIND B 4.44×10⁷−4.44×1020.998 y = −3.410x + 42.51 44.4
14 blaIND C 7.80×10⁹−7.80×1010.998 y = −3.568x + 43.73 78.0
15 blaIND D 5.81 ×15.81×109−5.81×1010.997 y = −3.469x + 44.63 58.1
16 blaGES 2.76×10⁹−2.76×1010.999 y = −3.477x + 44.03 27.6
17 blaCTX-M A 3.33×10⁹−3.33×1030.995 y = −3.753x + 42.96 33.3
18 blaCTX-M B 4.10×10⁹−4.10×1030.999 y = −3.748x + 47.70 41.0
Biomed Environ Sci, 2019; 32(12): S1-S4 S3
ContinuedNo. Gene type group linear dynamic range r2 (%) Linear regression equation LOD (copies/reaction)
19 blaCTX-M C 4.62×10⁹−4.62×1020.996 y = −3.486x + 44.81 46.2
20 blaCTX-M D 4.09×10⁹−4.09×1030.984 y = −3.651x + 47.14 40.9
21 blaCTX-M E 4.42×10⁹−4.42×1010.983 y = −3.558x + 44.01 44.2
22 blaSHV A 2.94×10 7−2.94×1020.998 y = −3.228x + 42.61 29.4
23 blaSHV B 1.22×10⁹−1.22×1020.998 y = −3.081x + 46.53 12.2
24 blaSHV C 6.15×10 8−6.15×1010.998 y = −2.971x + 38.70 61.5
25 blaSHVⅣ 7.11×10⁹−7.11×1010.998 y = −3.457x + 46.18 71.1
26 blaTEM A 5.97×10⁸−5.97×1010.991 y = −3.628x + 42.58 59.7
27 blaTEM B 5.45×10⁸−5.45×1020.995 y = −3.670x + 42.46 54.5
28 blaOXA 2.12×10 9−2.12×1020.991 y = −3.133x + 41.88 21.2
29 blaPER 3.77×10⁹−3.77×1020.998 y = −3.464x + 48.88 37.7
30 blaCARB A 3.43×10⁹−3.43×1020.999 y = −3.502x + 47.06 34.3
31 blaCARB B 3.22×10⁹−3.22×1020.999 y = −3.400x + 46.71 32.2
32 blaCARB C 2.00×10⁹−2.00×1030.999 y = −3.763x + 50.30 20.0
33 blaCARB D 2.53×10⁹−2.53×1020.999 y = −3.494x + 46.60 25.3
34 qnrA 1.24×10⁹−1.24×1010.995 y = −3.294x + 44.77 12.4
35 qnrC 8.92×10⁸−8.92×1010.990 y = −3.125x + 42.66 89.2
36 qnrS 8.47×10⁹−8.47×1030.998 y = −3.692x + 52.81 84.7
37 mcr-3 2.70×10⁹−2.70×1030.994 y = −3.224x + 46.27 27.3
38 aac(6′)-Ie-aph(2″)-Ia 3.24×10⁹−3.24×1030.980 y = −2.858x + 46.50 32.4
39 fexA 4.41×10⁸−4.41×1030.999 y = −3.625x + 46.93 44.1
40 fexB 4.88×10⁹−4.88×1020.996 y = −3.766x + 50.58 48.8
41 cfr 8.00 ×10⁹−8.00×1030.995 y = −3.560x + 48.66 80.0
42 optrA 3.93×10⁹−3.93×1020.998 y = −3.663x + 46.63 39.3
43 aac(6′)-Ib-cr 4.75×10⁹−4.75×1020.999 y = −3.499x + 45.48 47.5
Biomed Environ Sci, 2019; 32(12): S1-S4 S4