Embed Size (px)
Citation preview
Improving Quality, Safety and Patient Experience through a Multi-Site National
Collaborative: The QUEST for High Value in Health Care
Richard A Bankowitz, MD MBA FACP
Vice President and Medical Director, Healthcare Informatics
2
Outline
•
Overview of QUEST, Premier’s multi-site, multi- dimensional improvement collaborative
•
Tools for data exploration and collaborative learning including the role of CAHPS
•
The framework for collaborative execution•
Benefits to participants and to the nation
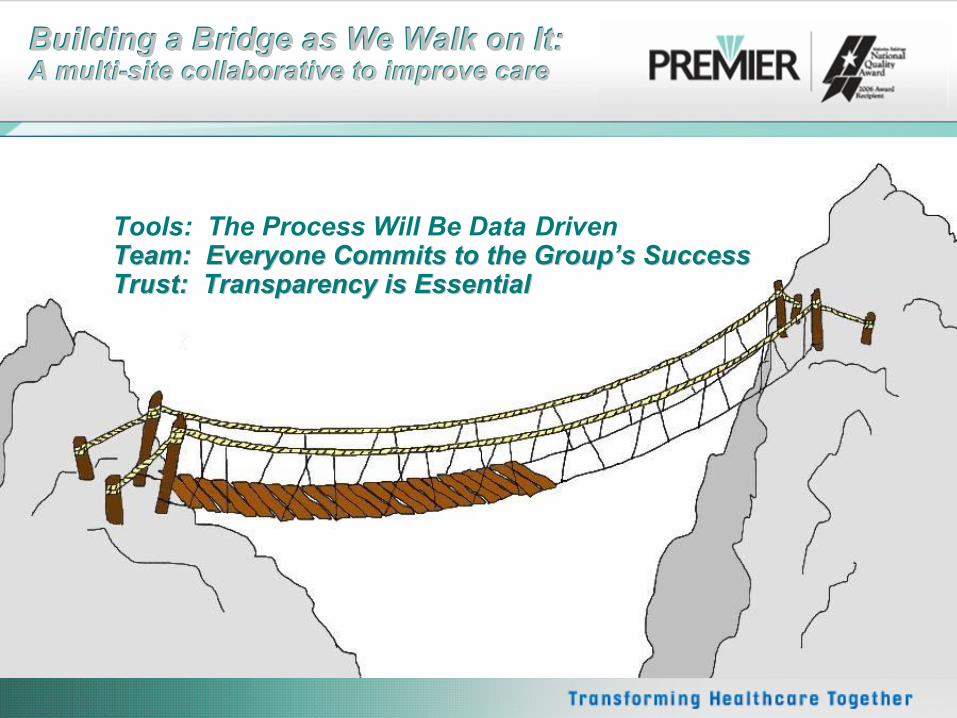
Tools: The Process Will Be Data
Building a Bridge as We Walk on It: A multi-site collaborative to improve care
--Driven Tools: The Process Will Be Data Driven Team: Everyone Commits to the GroupTeam: Everyone Commits to the Group’’s Successs Success
Trust: Transparency is EssentialTrust: Transparency is Essential
Building a Bridge as We Walk on It:A multi-site collaborative to improve care
4
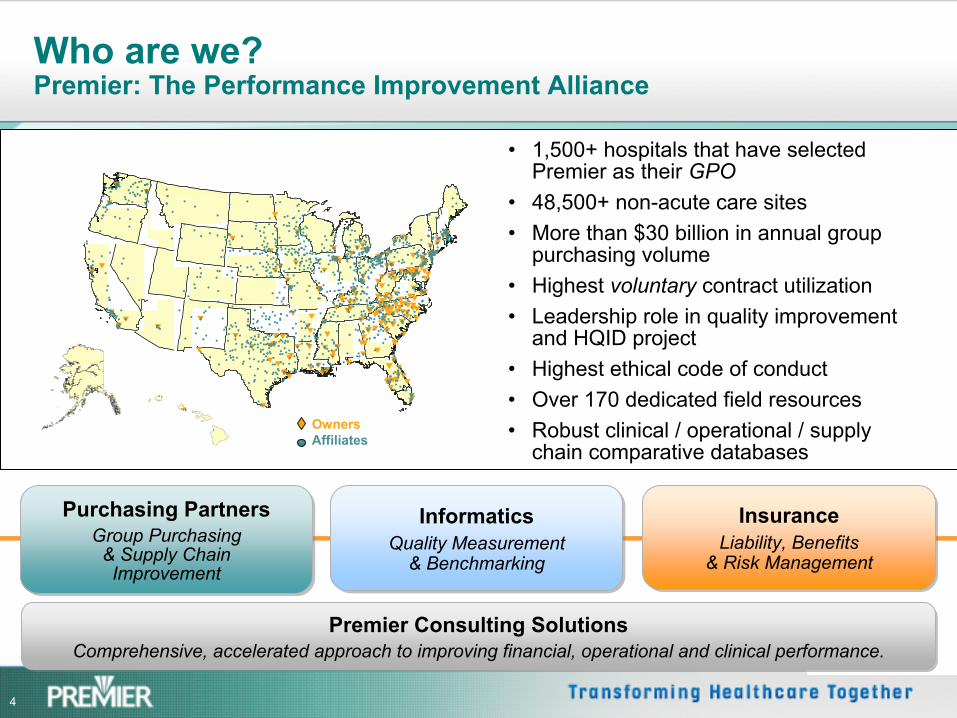
Who are we? Premier: The Performance Improvement Alliance
OwnersAffiliates
•
1,500+ hospitals that have selected Premier as their GPO
•
48,500+ non-acute care sites•
More than $30 billion in annual group purchasing volume
•
Highest voluntary
contract utilization•
Leadership role in quality improvement and HQID project
•
Highest ethical code of conduct•
Over 170 dedicated field resources•
Robust clinical / operational / supply chain comparative databases
Purchasing PartnersGroup Purchasing
& Supply ChainImprovement
Purchasing PartnersGroup Purchasing
& Supply ChainImprovement
InformaticsQuality Measurement
& Benchmarking
InformaticsQuality Measurement
& Benchmarking
InsuranceLiability, Benefits
& Risk Management
InsuranceLiability, Benefits
& Risk Management
Premier Consulting SolutionsComprehensive, accelerated approach to improving financial, operational and clinical performance.
Premier Consulting SolutionsComprehensive, accelerated approach to improving financial, operational and clinical performance.
5
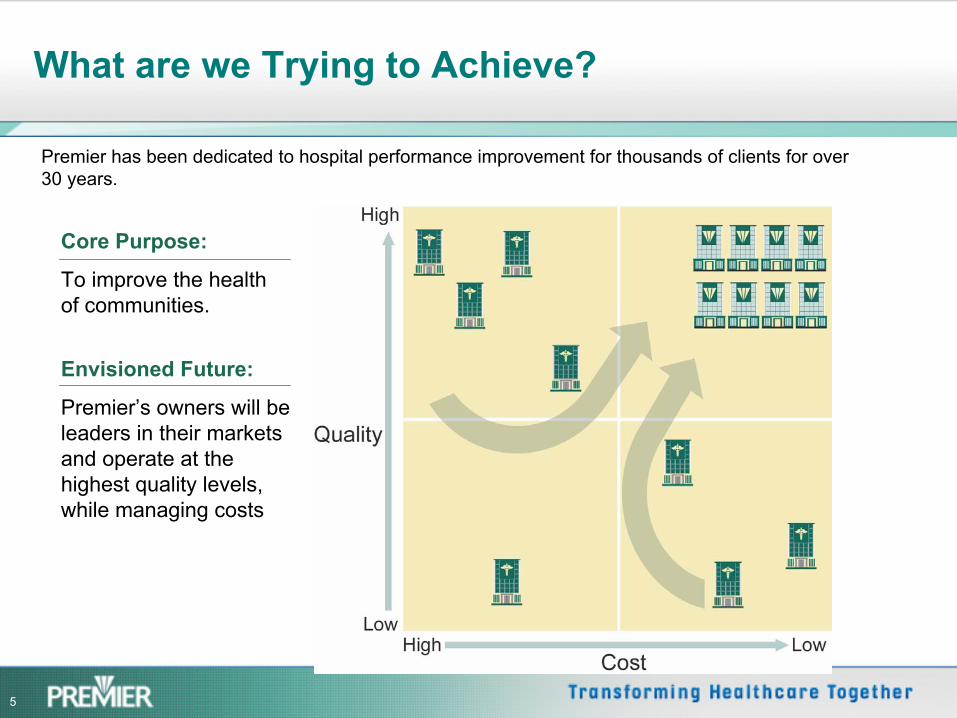
What are we Trying to Achieve?
Premier has been dedicated to hospital performance improvement for thousands of clients for over 30 years.
Core Purpose:
To improve the health of communities.
Envisioned Future:
Premier’s owners will be leaders in their markets and operate at the highest quality levels, while managing costs
6
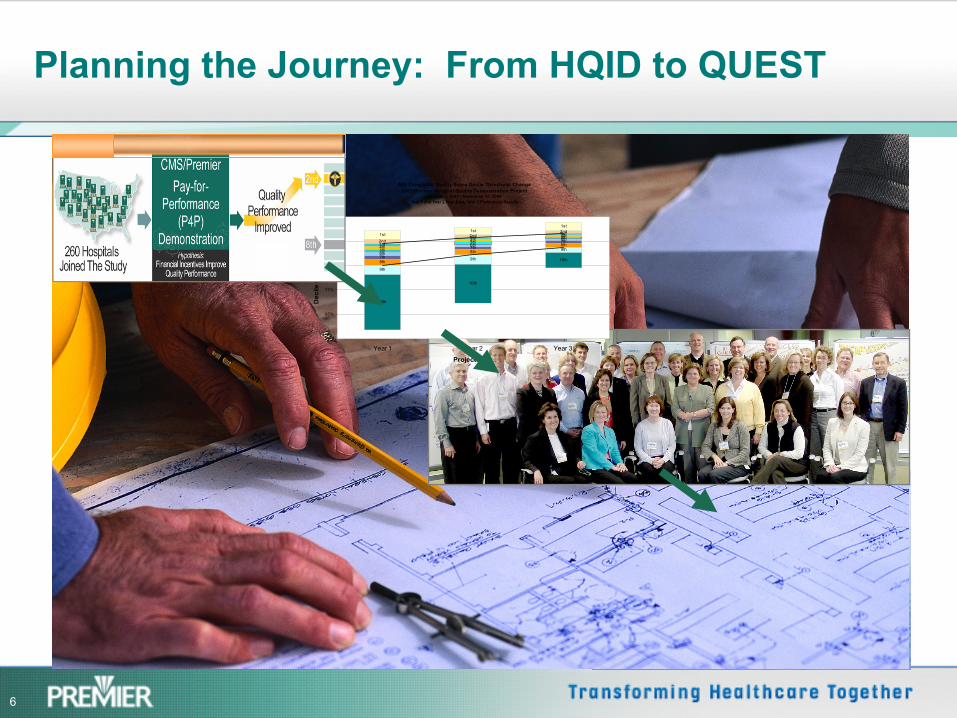
Planning the Journey: From HQID to QUEST
AMI Composite Quality Score Decile Threshold ChangeCMS/Premier Hospital Quality Demonstration Project
October 1, 2003 - September 30, 2006Year 1 and Year 2 Final Data; Year 3 Preliminary Results
10th
10th
10th
9th
9th
9th
8th
8th8th
7th
7th7th
6th
6th6th
5th
5th5th
4th
4th4th
3rd
3rd3rd
2nd2nd
2nd1st
1st1st
55%
65%
75%
85%
95%
105%
Year 1 Year 2 Year 3
Project Year
Dec
ile th
resh
old
7
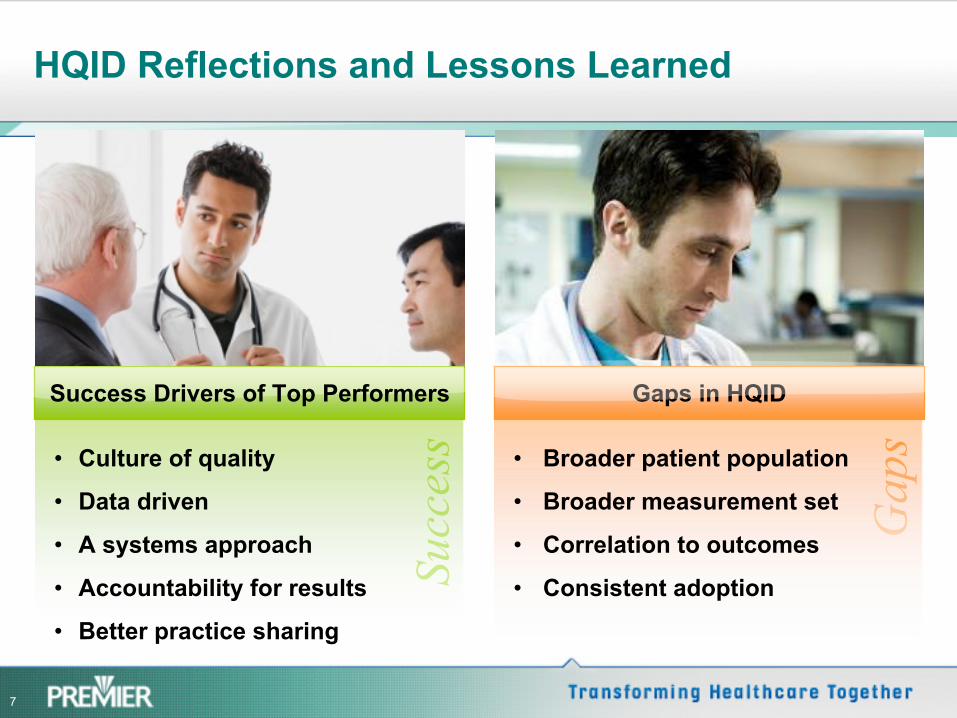
HQID Reflections and Lessons Learned
Success
Success Drivers of Top Performers
•
Culture of quality
•
Data driven
•
A systems approach
•
Accountability for results
•
Better practice sharing
Gaps
Gaps in HQID
•
Broader patient population
•
Broader measurement set
•
Correlation to outcomes
•
Consistent adoption
8
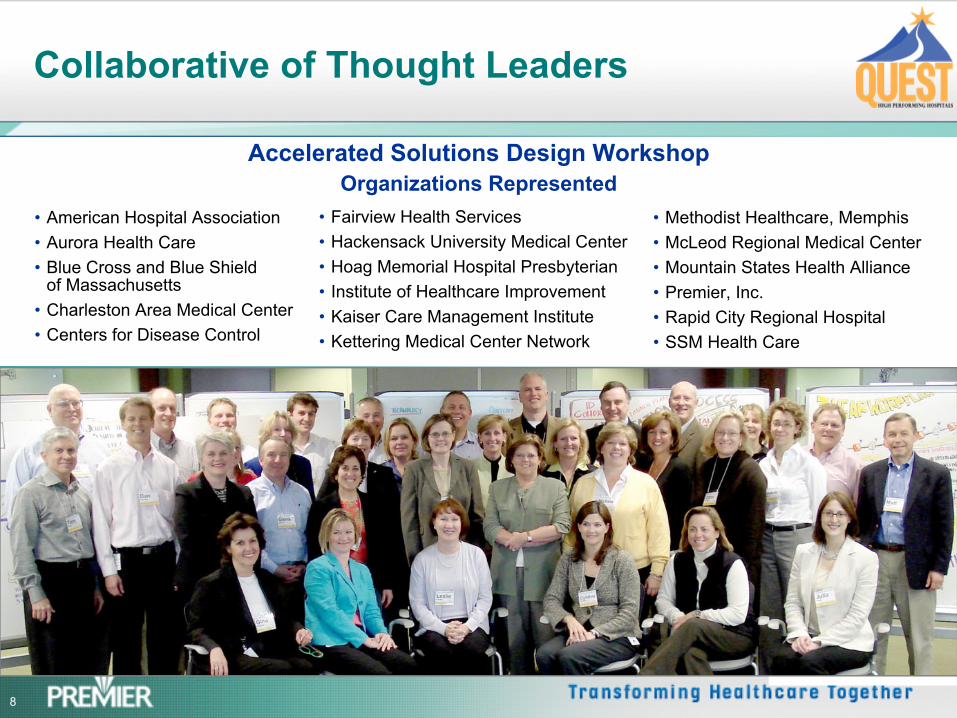
Collaborative of Thought Leaders
Accelerated Solutions Design Workshop Organizations Represented
•
American Hospital Association•
Aurora Health Care •
Blue Cross and Blue Shield of Massachusetts
•
Charleston Area Medical Center•
Centers for Disease Control
•
Methodist Healthcare, Memphis •
McLeod Regional Medical Center•
Mountain States Health Alliance•
Premier, Inc.•
Rapid City Regional Hospital•
SSM Health Care
•
Fairview Health Services•
Hackensack University Medical Center•
Hoag Memorial Hospital Presbyterian •
Institute of Healthcare Improvement•
Kaiser Care Management Institute •
Kettering Medical Center Network
9
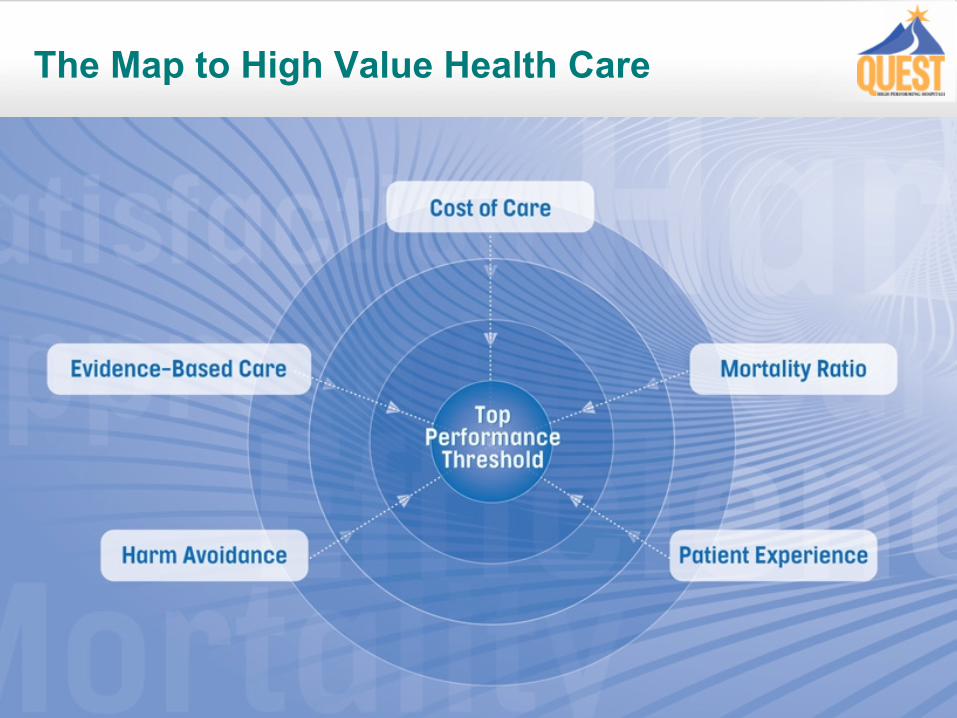
The Map to High Value Health Care
10
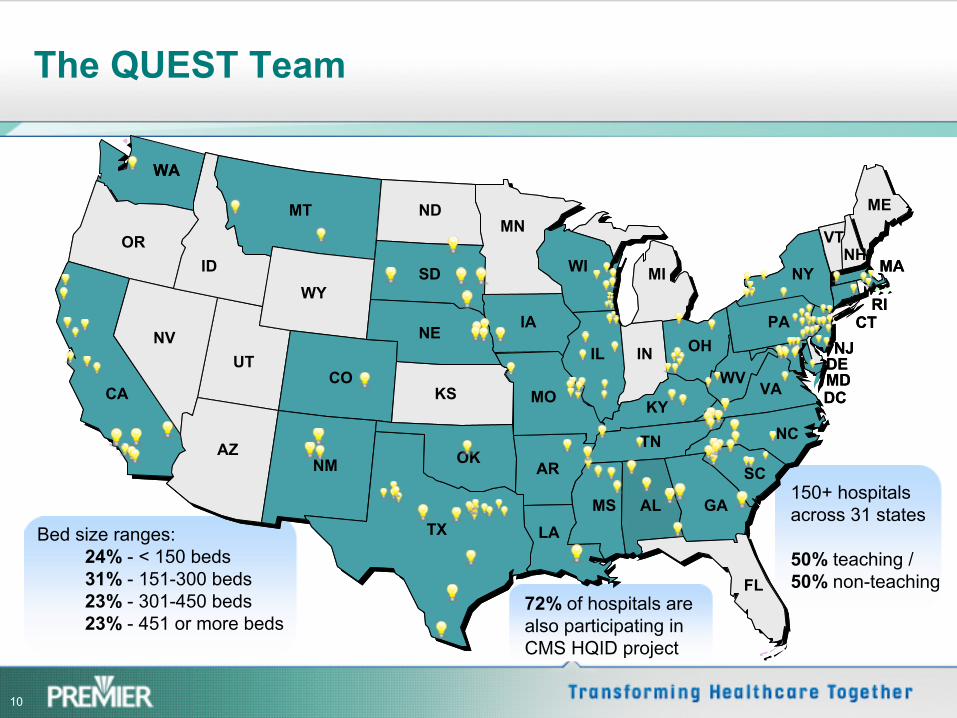
The QUEST Team
MA
RI
ME
MA
RI
ME
WA
IL
WI
LA
AR
MO
IA
MN
TX
OK
KS
NE
SD
NDMT
WY
CO
NM
ID
UT
AZ
NV
CA
OR
CTNJ
DEMD
SC
NC
VAWV
PA
VTNH
FL
GAALMS
TN
KY
MI
OHIN
DCMO
NY
WA
IL
WI
LA
AR
MO
IA
MN
TX
OK
KS
NE
SD
NDMT
WY
CO
NM
ID
UT
AZ
NV
CA
OR
CTNJ
DEMD
SC
NC
VAWV
PA
VTNH
FL
GAALMS
TN
KY
MI
OHIN
DCMO
NY
Bed size ranges:24% -
< 150 beds31% -
151-300 beds23% -
301-450 beds23% - 451 or more beds
72% of hospitals are also participating in CMS HQID project
150+ hospitals across 31 states
50% teaching / 50% non-teaching
11
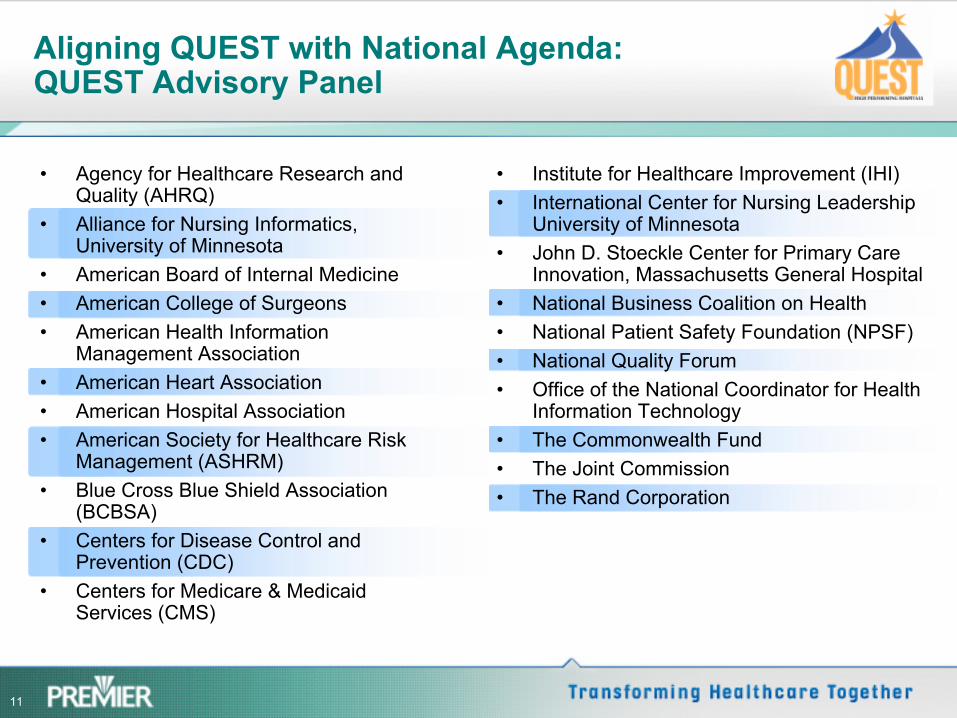
Aligning QUEST with National Agenda: QUEST Advisory Panel
•
Agency for Healthcare Research and Quality (AHRQ)
•
Alliance for Nursing Informatics, University of Minnesota
•
American Board of Internal Medicine •
American College of Surgeons •
American Health Information Management Association
•
American Heart Association•
American Hospital Association•
American Society for Healthcare Risk Management (ASHRM)
•
Blue Cross Blue Shield Association (BCBSA)
•
Centers for Disease Control and Prevention (CDC)
•
Centers for Medicare & Medicaid Services (CMS)
•
Institute for Healthcare Improvement (IHI)•
International Center for Nursing Leadership University of Minnesota
•
John D. Stoeckle Center for Primary Care Innovation, Massachusetts General Hospital
•
National Business Coalition on Health•
National Patient Safety Foundation (NPSF) •
National Quality Forum •
Office of the National Coordinator for Health Information Technology
•
The Commonwealth Fund •
The Joint Commission•
The Rand Corporation
12
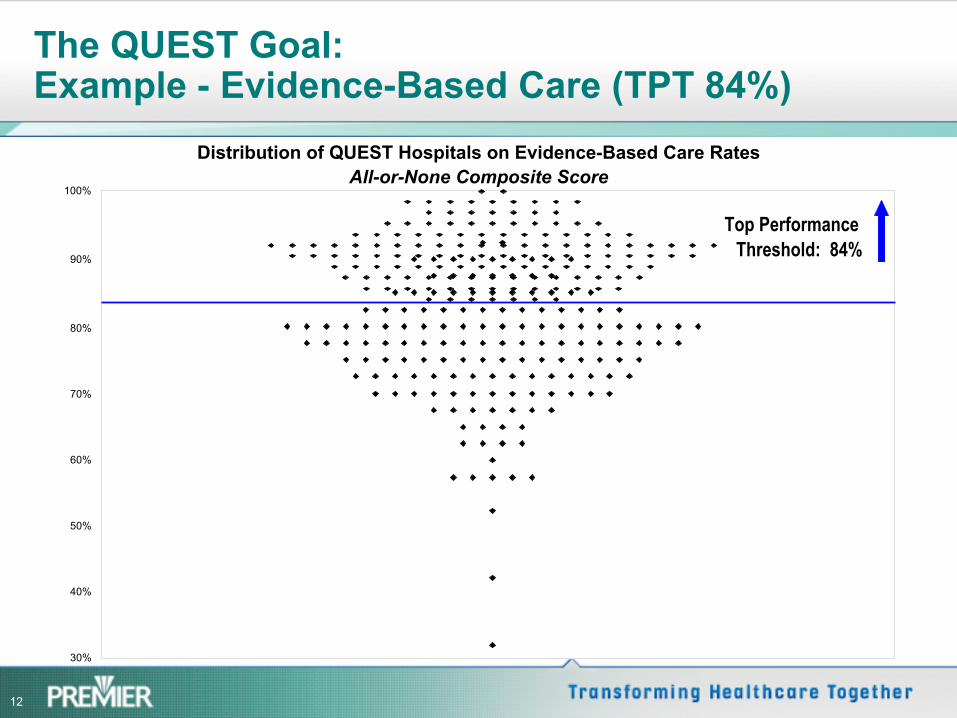
The QUEST Goal: Example -
Evidence-Based Care (TPT 84%)
Distribution of QUEST Hospitals on Evidence-Based Care RatesAll-or-None Composite Score
30%
40%
50%
60%
70%
80%
90%
100%
Top Performance Threshold: 84%
13
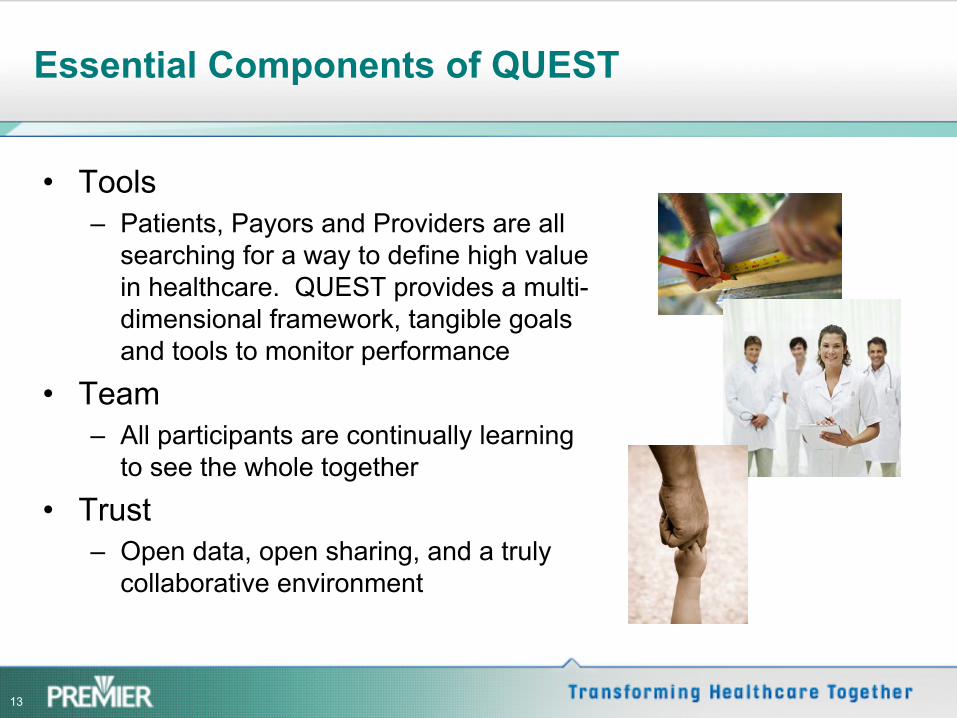
Essential Components of QUEST
•
Tools–
Patients, Payors and Providers are all searching for a way to define high value in healthcare. QUEST provides a multi-
dimensional framework, tangible goals and tools to monitor performance
•
Team –
All participants are continually learning to see the whole together
•
Trust–
Open data, open sharing, and a truly collaborative environment
14
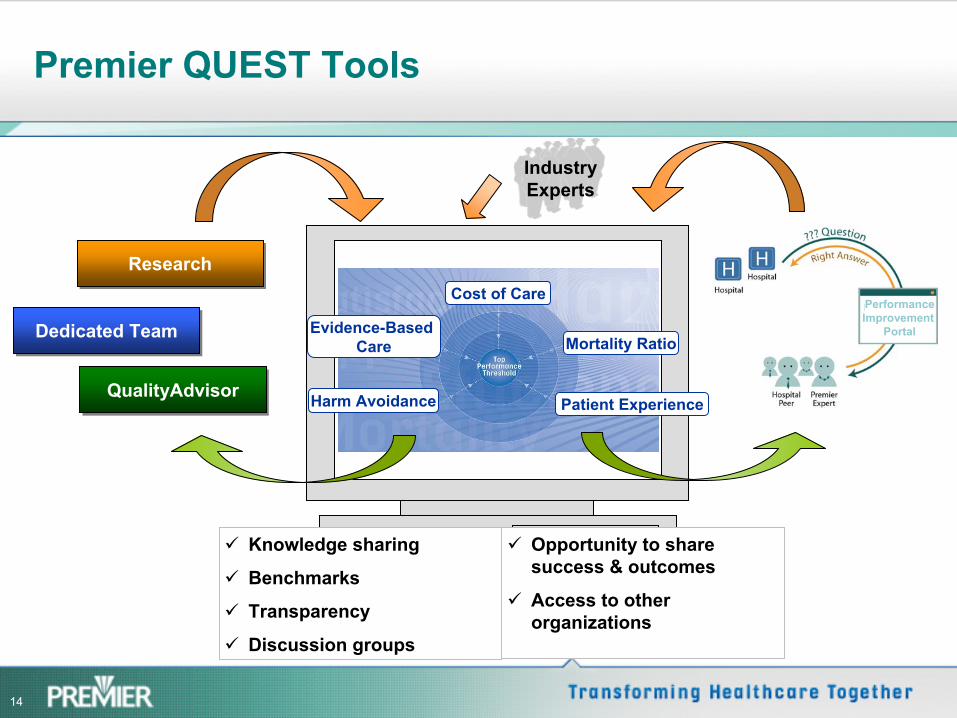
Premier QUEST Tools
Knowledge sharing
Benchmarks
Transparency
Discussion groups
Opportunity to share success & outcomes
Access to other organizations
Industry Experts
Evidence-Based Care
Cost of Care
Mortality Ratio
Patient ExperienceHarm AvoidanceQualityAdvisorQualityAdvisor
Dedicated TeamDedicated Team
ResearchResearch
PerformanceImprovement
Portal
15
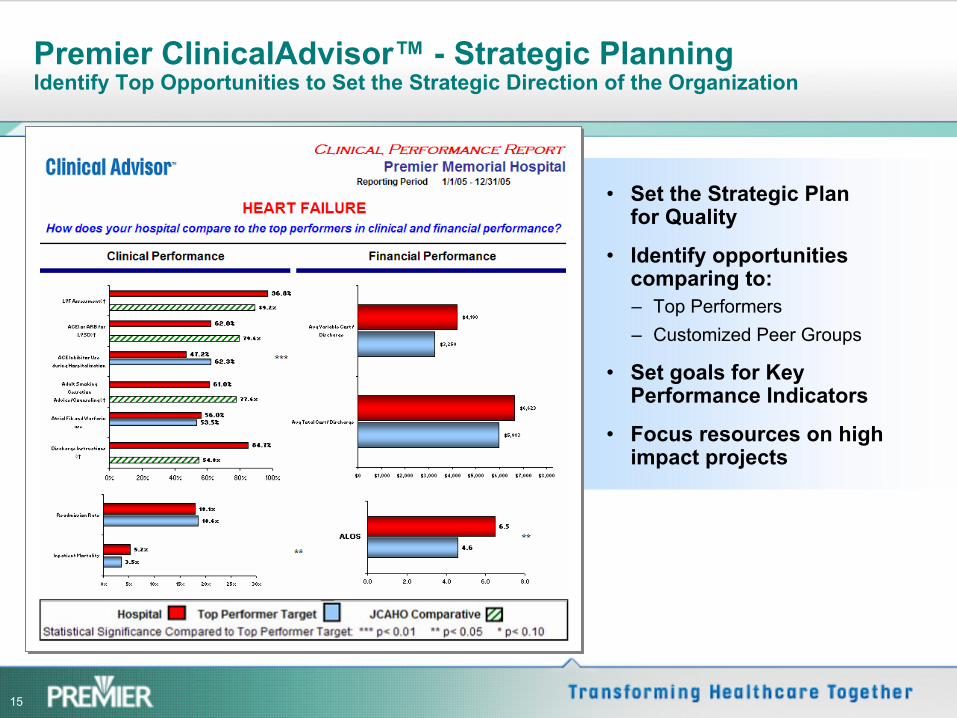
Premier ClinicalAdvisor™
-
Strategic Planning Identify Top Opportunities to Set the Strategic Direction of the
Organization
•
Set the Strategic Plan for Quality
•
Identify opportunities comparing to:–
Top Performers –
Customized Peer Groups
•
Set goals for Key Performance Indicators
•
Focus resources on high impact projects
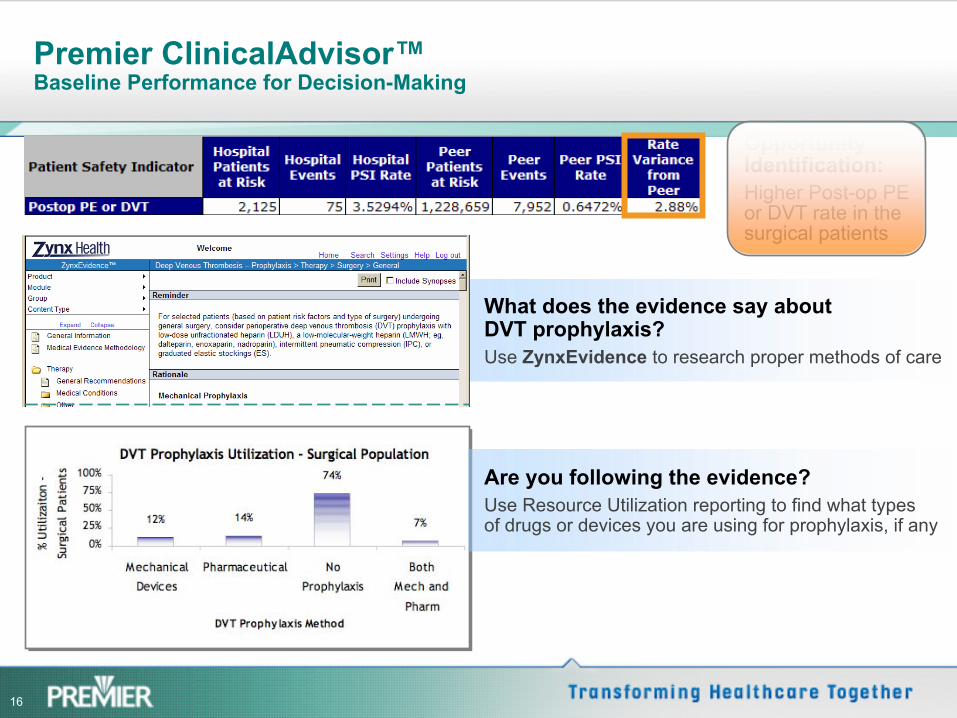
16
Are you following the evidence?Use Resource Utilization reporting to find what types of drugs or devices you are using for prophylaxis, if any
Opportunity Identification:Higher Post-op PE or DVT rate in the surgical patients
What does the evidence say about DVT prophylaxis?Use ZynxEvidence to research proper methods of care
Premier ClinicalAdvisor™
Baseline Performance for Decision-Making
17
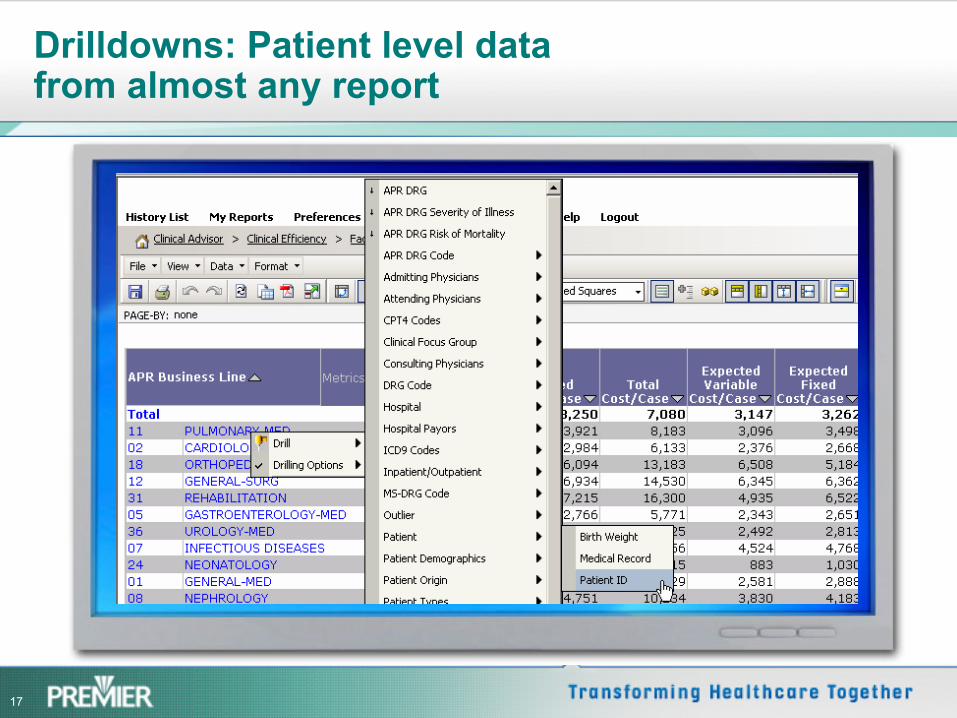
Drilldowns: Patient level data from almost any report
18
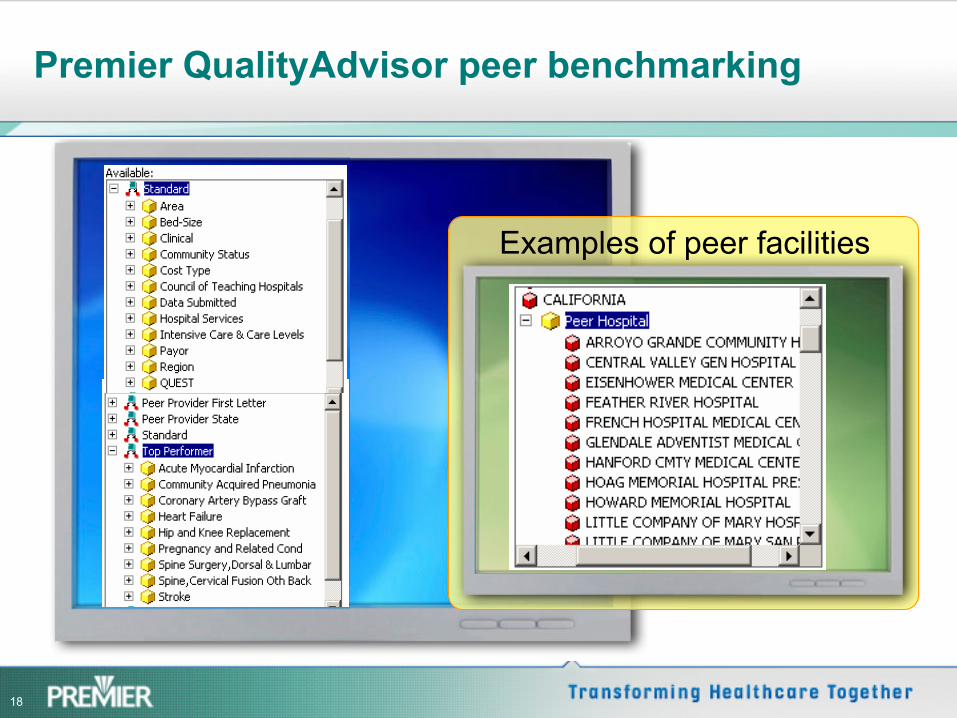
Examples of peer facilities
Premier QualityAdvisor peer benchmarking
19
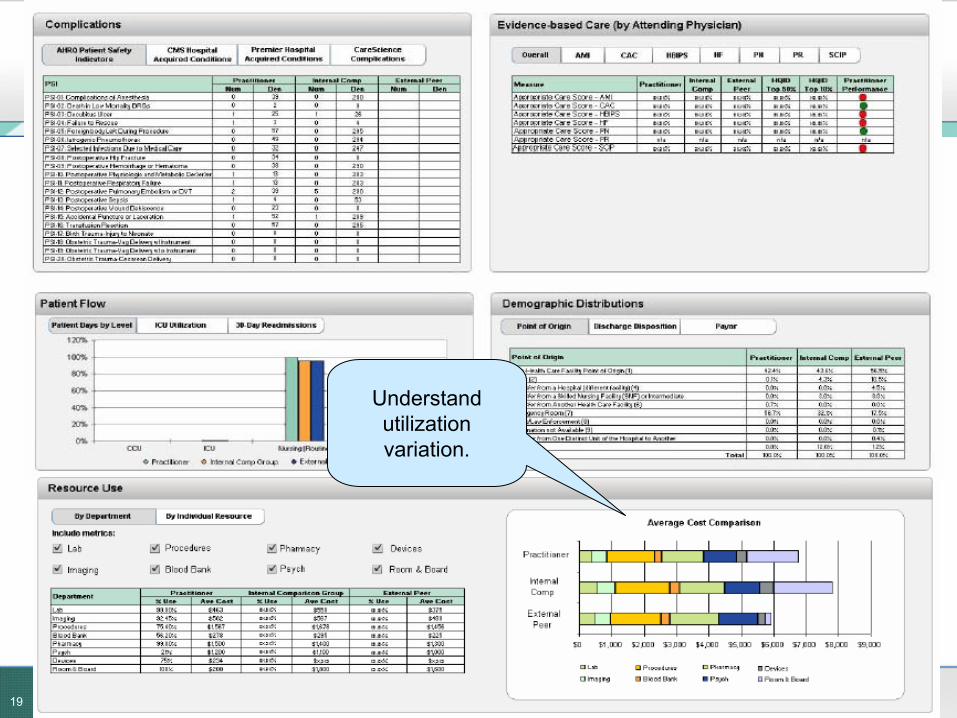
Understand utilization variation.
20
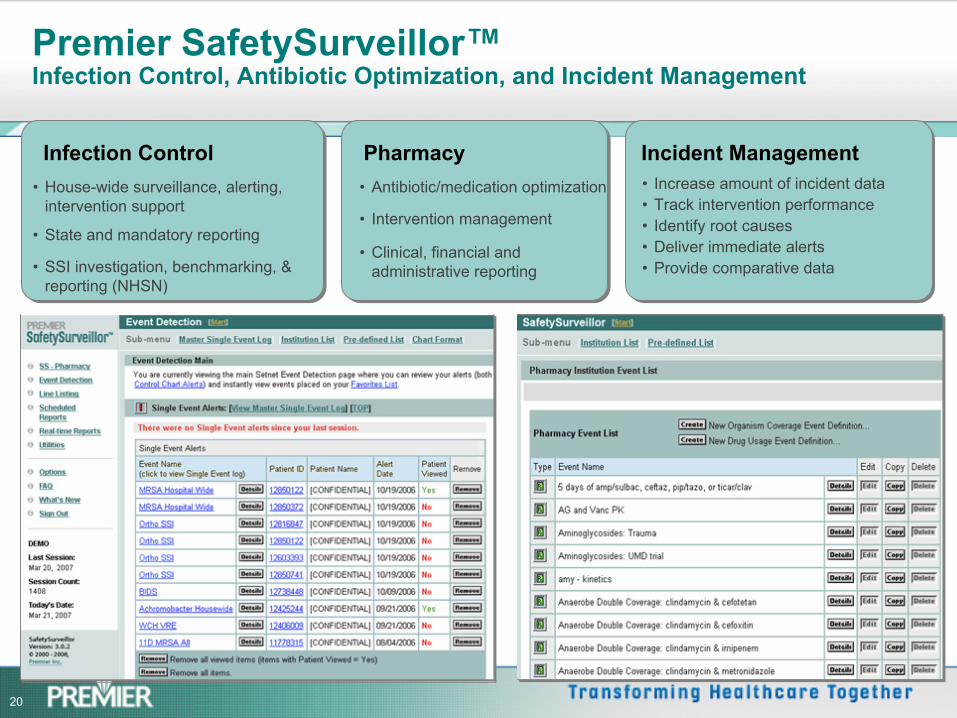
Infection Control Pharmacy Incident Management •
House-wide surveillance, alerting, intervention support
•
State and mandatory reporting
•
SSI investigation, benchmarking, & reporting (NHSN)
•
Antibiotic/medication optimization
•
Intervention management
•
Clinical, financial and administrative reporting
•
Increase amount of incident data•
Track intervention performance•
Identify root causes•
Deliver immediate alerts•
Provide comparative data
Premier SafetySurveillor™ Infection Control, Antibiotic Optimization, and Incident Management
21
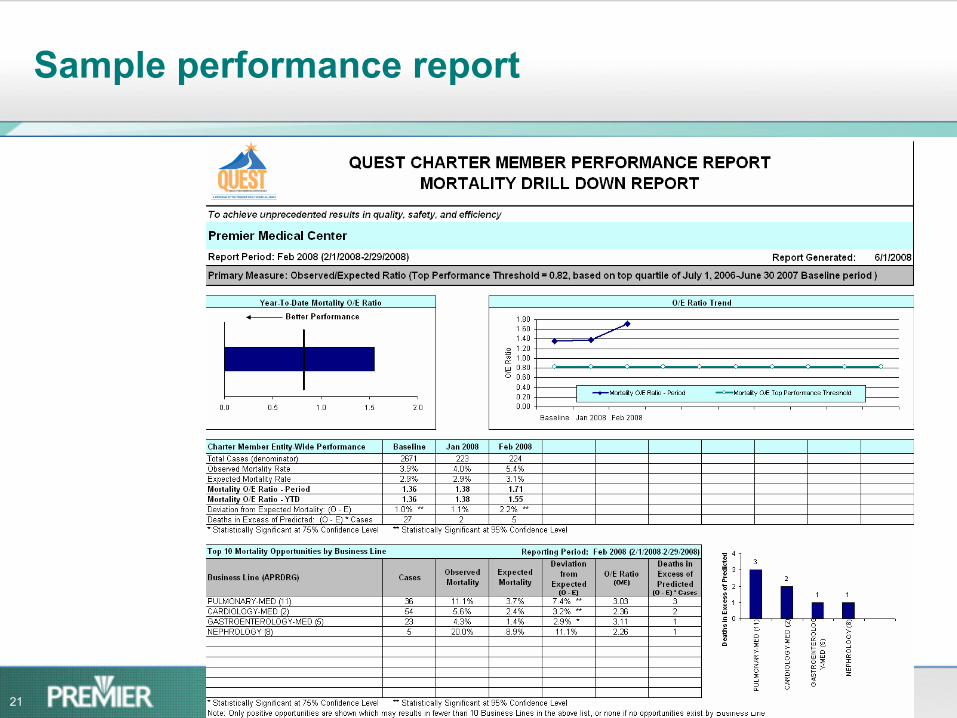
Sample performance report
22
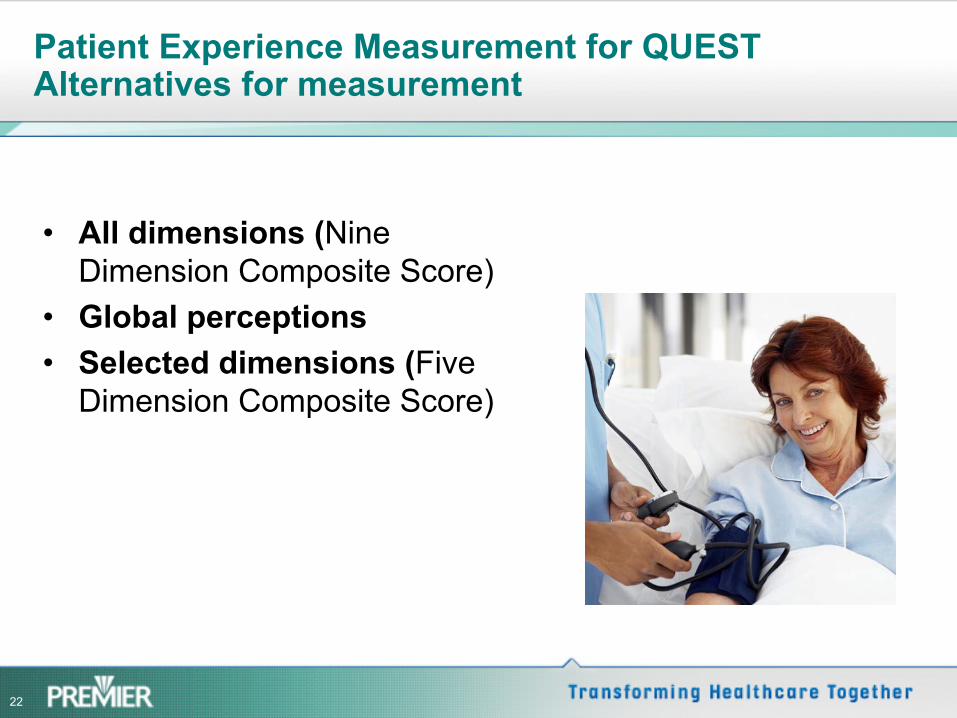
Patient Experience Measurement for QUEST Alternatives for measurement
•
All dimensions (Nine Dimension Composite Score)
•
Global perceptions•
Selected dimensions (Five Dimension Composite Score)
23
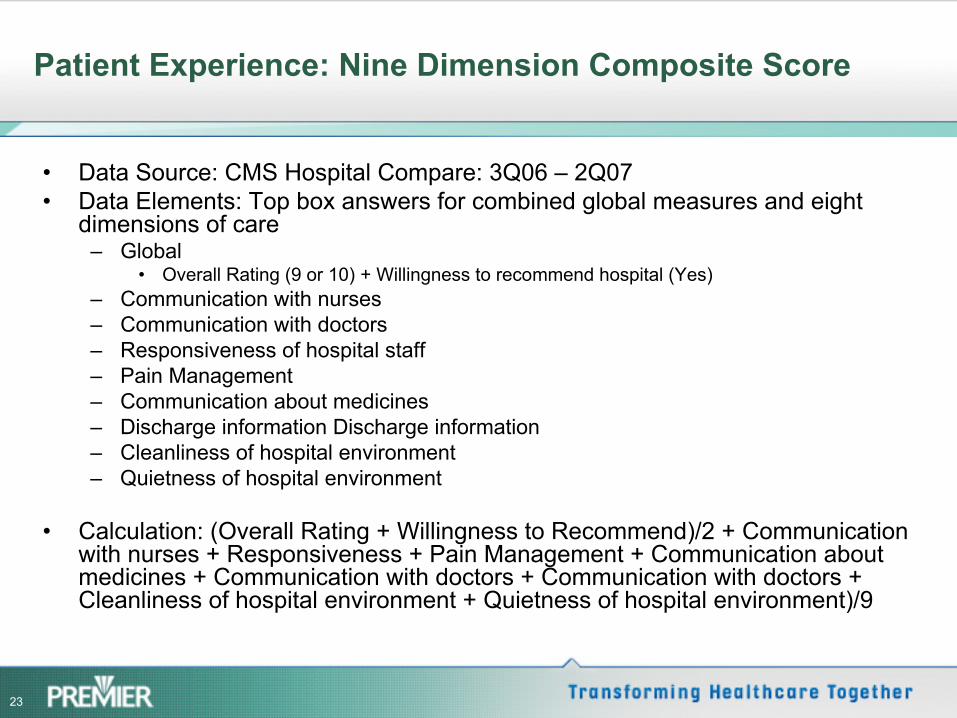
Patient Experience: Nine Dimension Composite Score
•
Data Source: CMS Hospital Compare: 3Q06 –
2Q07•
Data Elements: Top box answers for combined global measures and eight dimensions of care
–
Global•
Overall Rating (9 or 10) + Willingness to recommend hospital (Yes)–
Communication with nurses –
Communication with doctors–
Responsiveness of hospital staff–
Pain Management–
Communication about medicines–
Discharge information Discharge information–
Cleanliness of hospital environment–
Quietness of hospital environment
•
Calculation: (Overall Rating + Willingness to Recommend)/2 + Communication with nurses + Responsiveness + Pain Management + Communication about medicines + Communication with doctors + Communication with doctors + Cleanliness of hospital environment + Quietness of hospital environment)/9
24
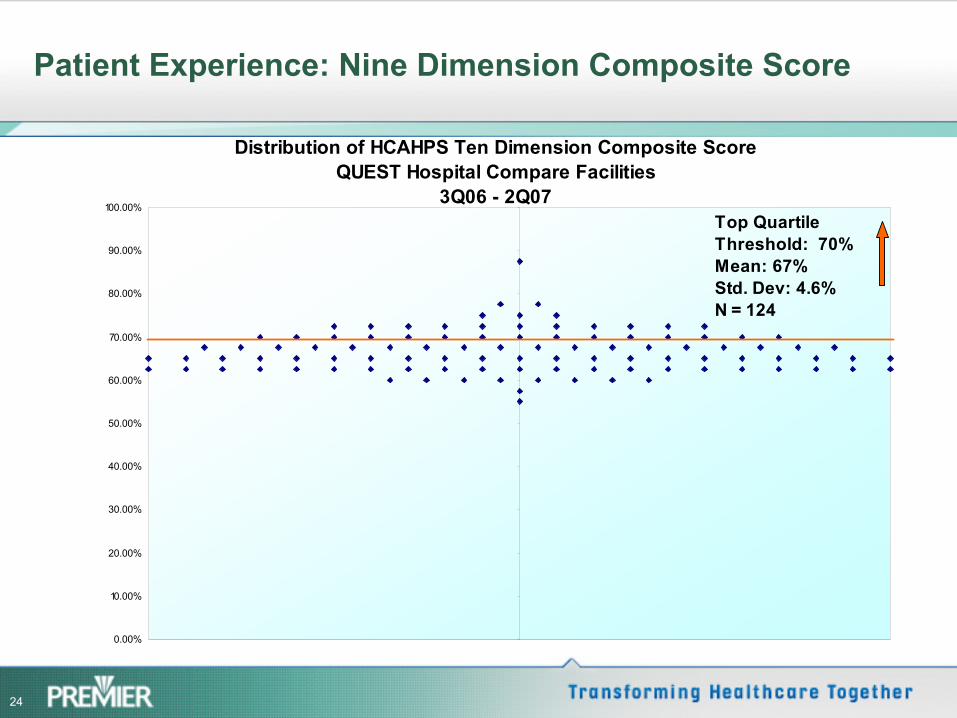
Patient Experience: Nine Dimension Composite Score
Distribution of HCAHPS Ten Dimension Composite ScoreQUEST Hospital Compare Facilities
3Q06 - 2Q07
0.00%
10.00%
20.00%
30.00%
40.00%
50.00%
60.00%
70.00%
80.00%
90.00%
100.00%
-10 -8 -6 -4 -2 0 2 4 6 8 10
Top QuartileThreshold: 70%Mean: 67%Std. Dev: 4.6%N = 124
25
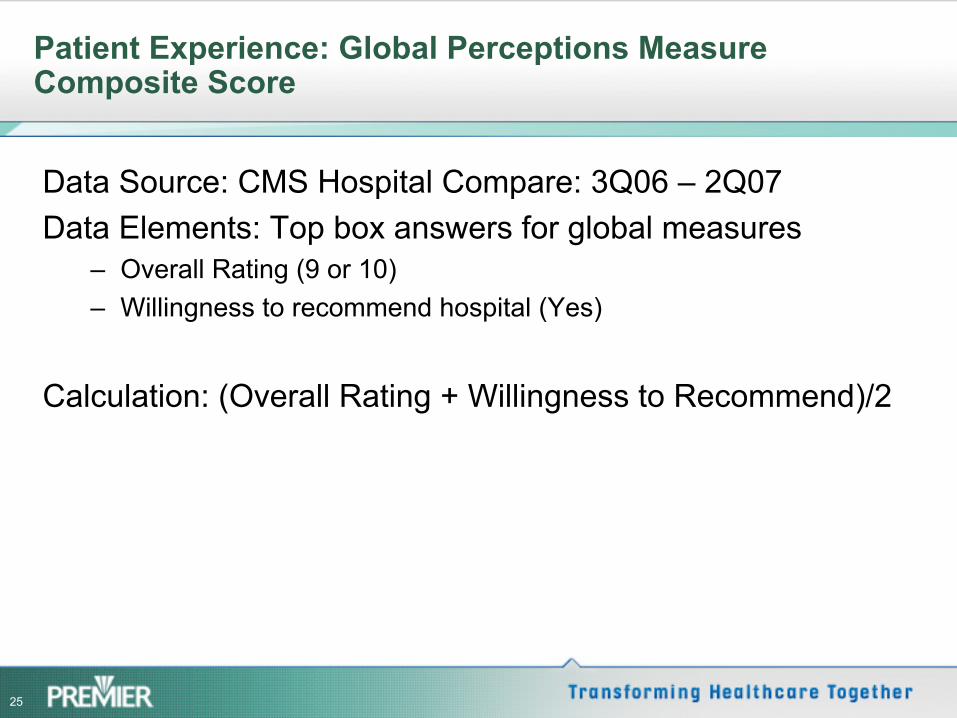
Patient Experience: Global Perceptions Measure Composite Score
Data Source: CMS Hospital Compare: 3Q06 –
2Q07Data Elements: Top box answers for global measures
–
Overall Rating (9 or 10)–
Willingness to recommend hospital (Yes)
Calculation: (Overall Rating + Willingness to Recommend)/2
26
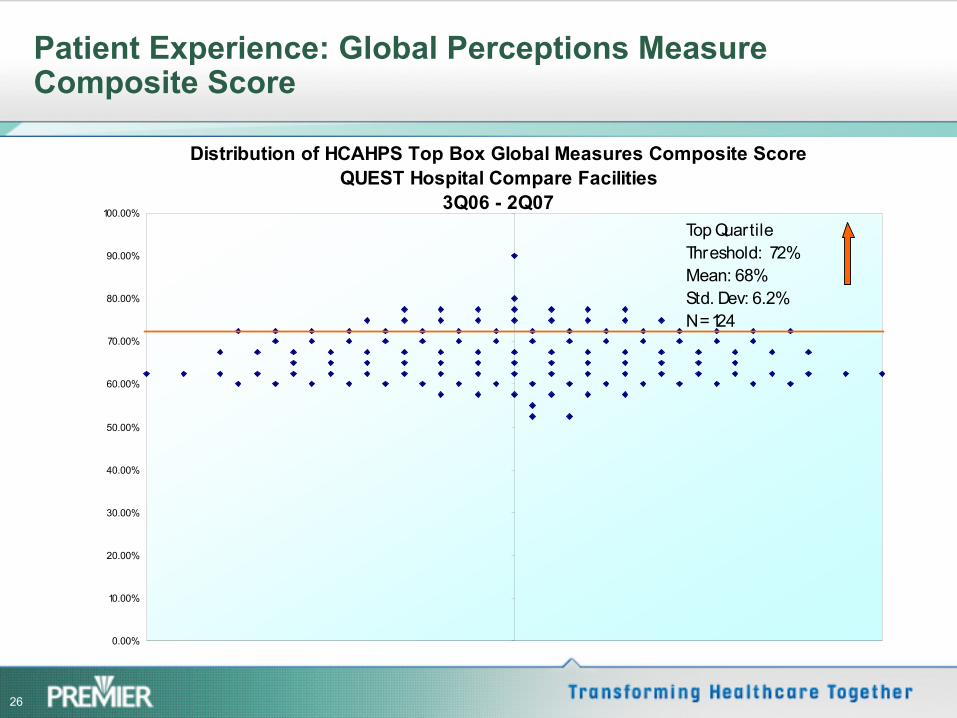
Patient Experience: Global Perceptions Measure Composite Score
Distribution of HCAHPS Top Box Global Measures Composite ScoreQUEST Hospital Compare Facilities
3Q06 - 2Q07
0.00%
10.00%
20.00%
30.00%
40.00%
50.00%
60.00%
70.00%
80.00%
90.00%
100.00%
-10 -8 -6 -4 -2 0 2 4 6 8 10
Top QuartileThreshold: 72%Mean: 68%Std. Dev: 6.2%N = 124
27
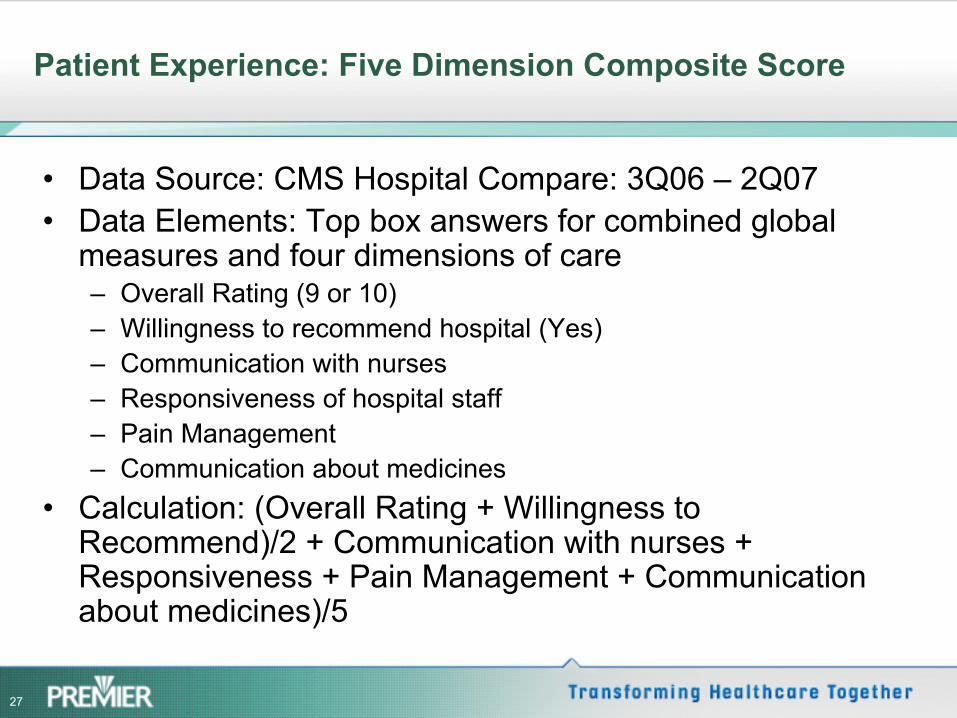
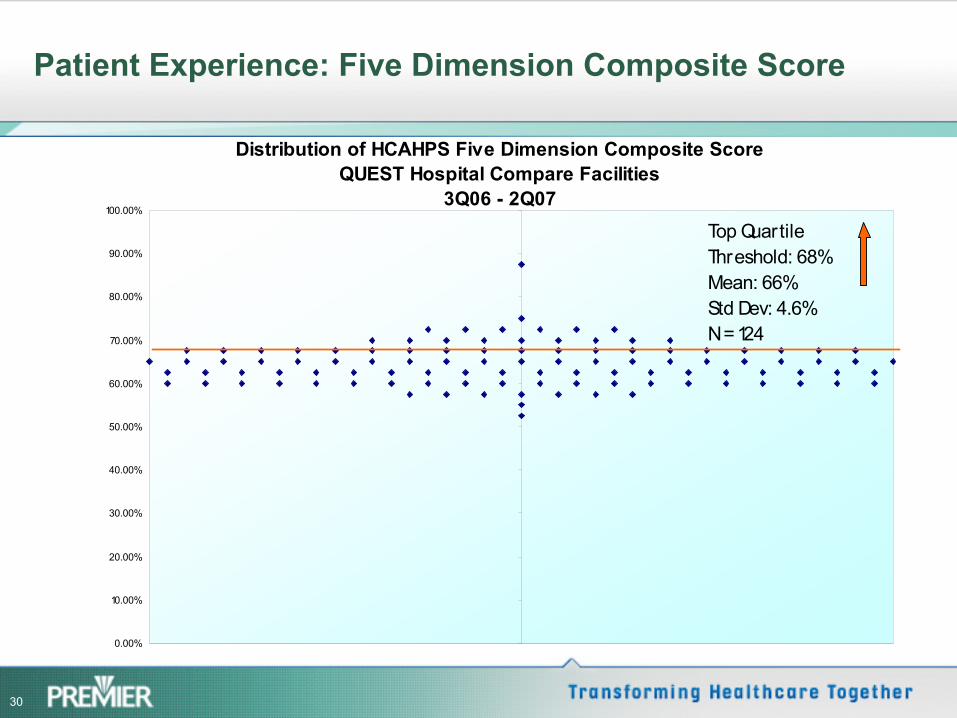
Patient Experience: Five Dimension Composite Score
•
Data Source: CMS Hospital Compare: 3Q06 –
2Q07•
Data Elements: Top box answers for combined global measures and four dimensions of care–
Overall Rating (9 or 10)–
Willingness to recommend hospital (Yes)–
Communication with nurses –
Responsiveness of hospital staff–
Pain Management–
Communication about medicines•
Calculation: (Overall Rating + Willingness to Recommend)/2 + Communication with nurses + Responsiveness + Pain Management + Communication about medicines)/5
28
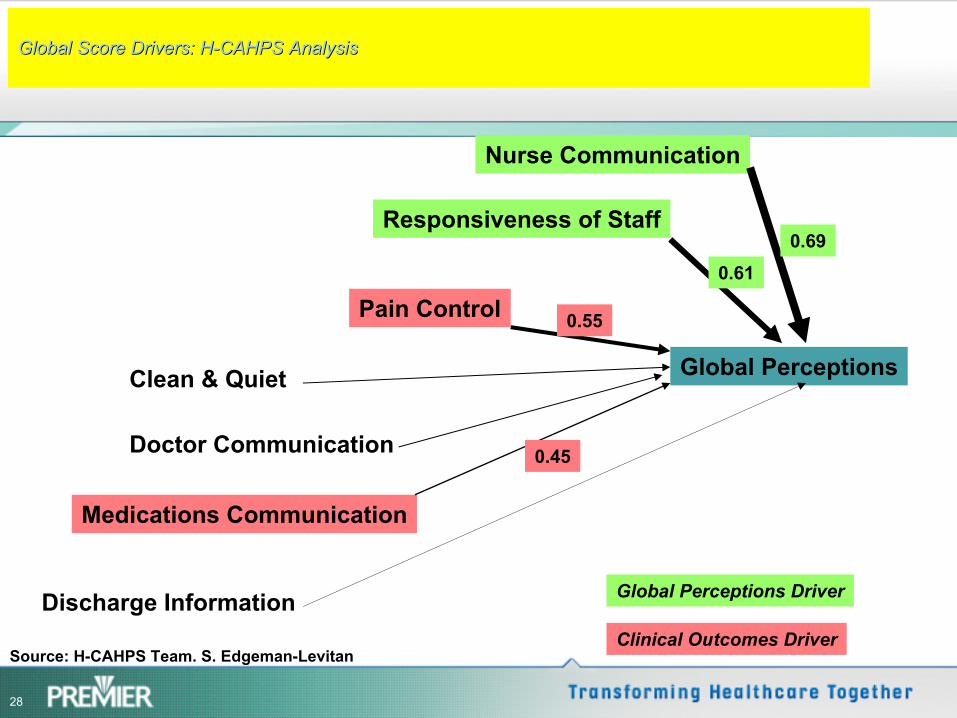
Global Score Drivers: HGlobal Score Drivers: H--CAHPS AnalysisCAHPS Analysis
Nurse Communication
Responsiveness of Staff
Pain Control
Clean & Quiet
Doctor Communication
Medications Communication
Discharge Information
Global Perceptions
0.690.61
0.55
0.45
Global Perceptions Driver
Clinical Outcomes DriverSource: H-CAHPS Team. S. Edgeman-Levitan
29
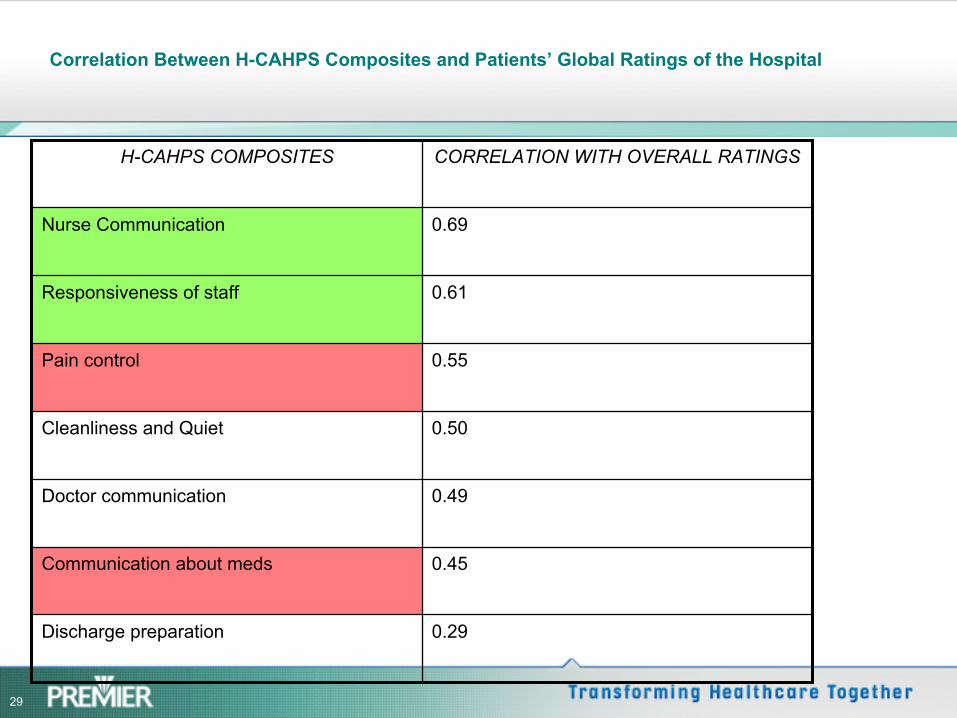
Correlation Between H-CAHPS Composites and Patients’
Global Ratings of the Hospital
H-CAHPS COMPOSITES CORRELATION WITH OVERALL RATINGS
Nurse Communication 0.69
Responsiveness of staff 0.61
Pain control 0.55
Cleanliness and Quiet 0.50
Doctor communication 0.49
Communication about meds 0.45
Discharge preparation 0.29
30
Patient Experience: Five Dimension Composite Score
Distribution of HCAHPS Five Dimension Composite ScoreQUEST Hospital Compare Facilities
3Q06 - 2Q07
0.00%
10.00%
20.00%
30.00%
40.00%
50.00%
60.00%
70.00%
80.00%
90.00%
100.00%
-10 -8 -6 -4 -2 0 2 4 6 8 10
Top Quartile Threshold: 68% Mean: 66%Std Dev: 4.6%N = 124
31
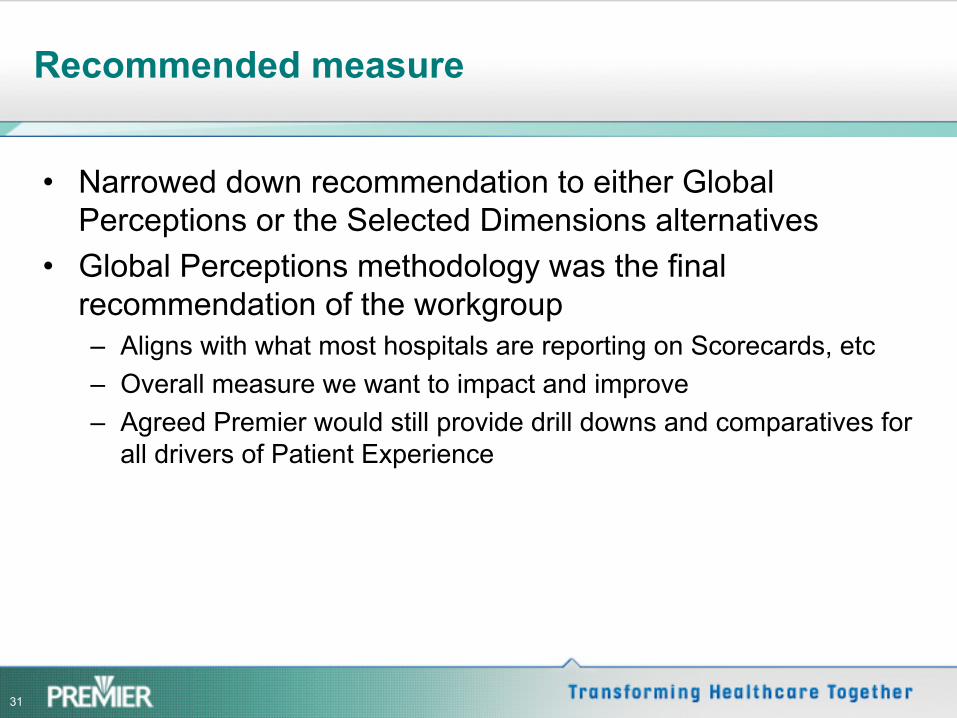
Recommended measure
•
Narrowed down recommendation to either Global Perceptions or the Selected Dimensions alternatives
•
Global Perceptions methodology was the final recommendation of the workgroup–
Aligns with what most hospitals are reporting on Scorecards, etc–
Overall measure we want to impact and improve–
Agreed Premier would still provide drill downs and comparatives for all drivers of Patient Experience
32
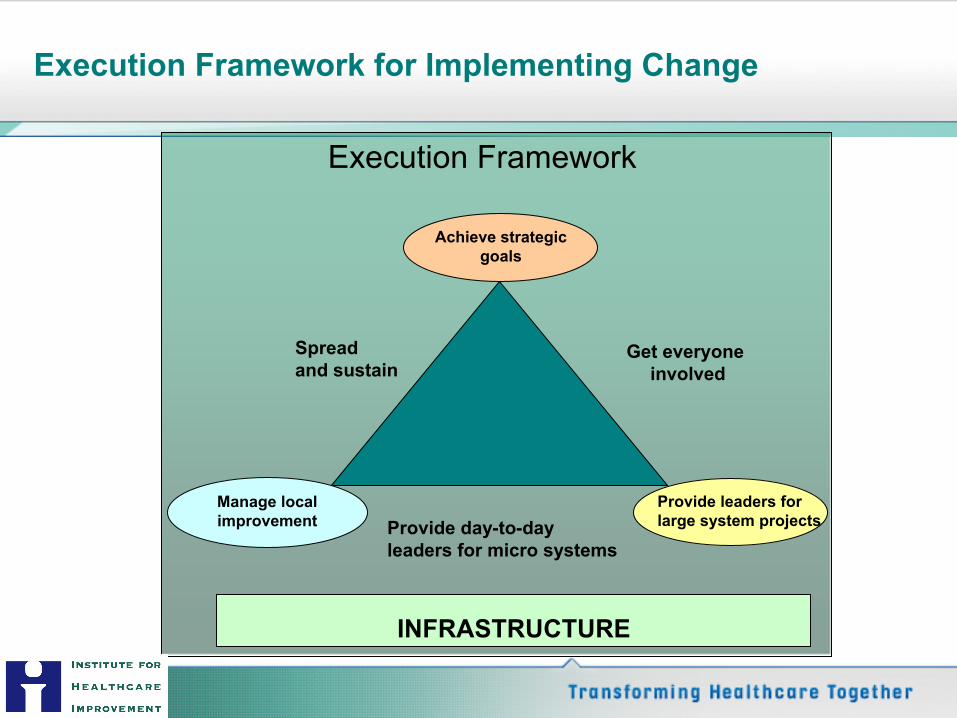
Manage local improvement
Get everyone involved
Provide day-to-day leaders for micro systems
Spread and sustain
INFRASTRUCTURE
Achieve strategic goals
Provide leaders forlarge system projects
Execution Framework
Execution Framework for Implementing Change
33
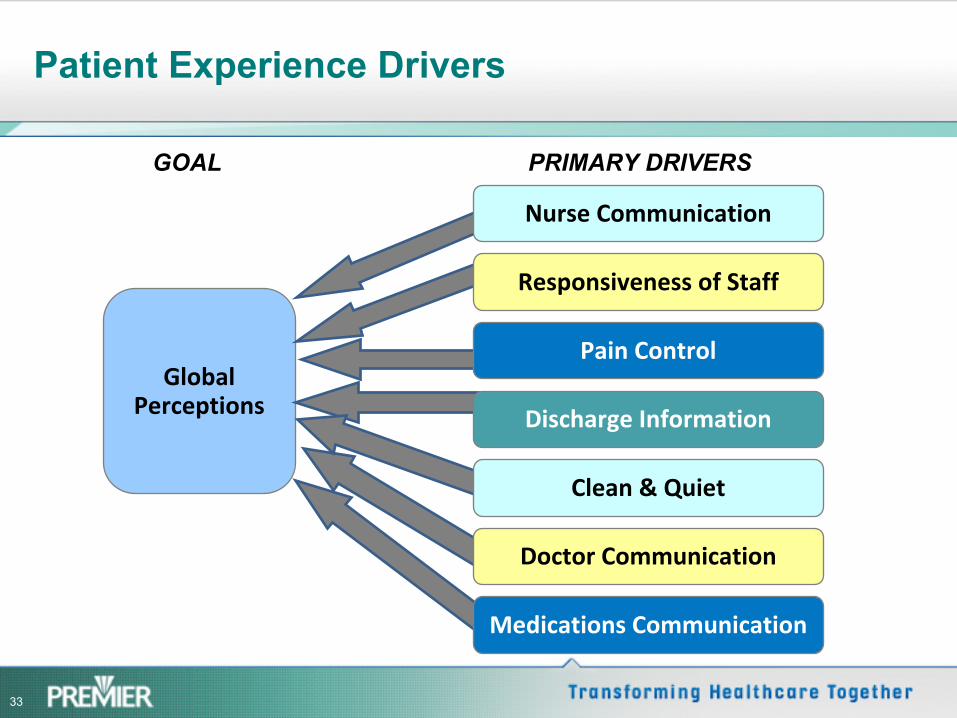
Patient Experience Drivers
Global
Perceptions
GOAL
Nurse Communication
Responsiveness of Staff
Pain Control
Discharge Information
Clean & Quiet
Doctor Communication
Medications Communication
PRIMARY DRIVERS
34
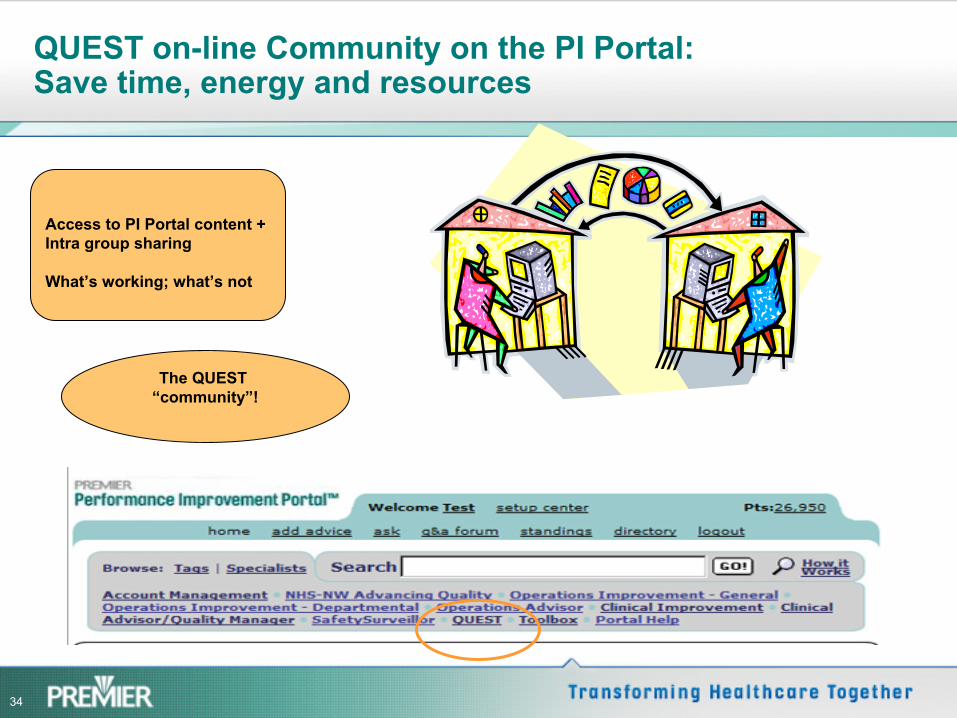
QUEST on-line Community on the PI Portal: Save time, energy and resources
Access to PI Portal content +Intra group sharing
What’s working; what’s not
The QUEST “community”!
35
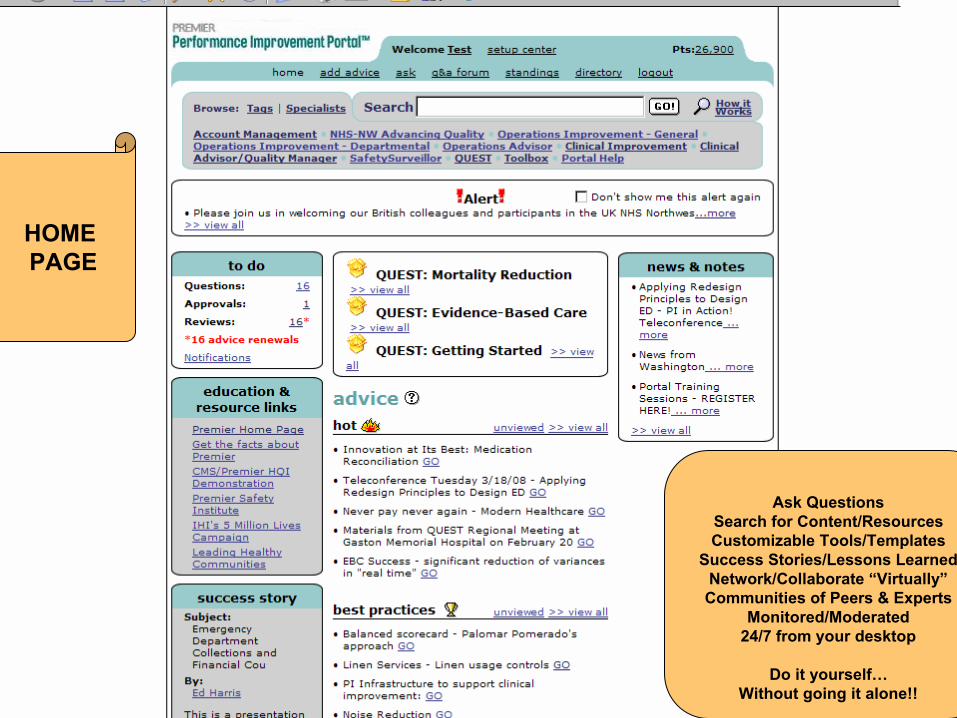
HOMEPAGE
Ask QuestionsSearch for Content/ResourcesCustomizable Tools/Templates
Success Stories/Lessons LearnedNetwork/Collaborate “Virtually”Communities of Peers & Experts
Monitored/Moderated24/7 from your desktop
Do it yourself…Without going it alone!!
36
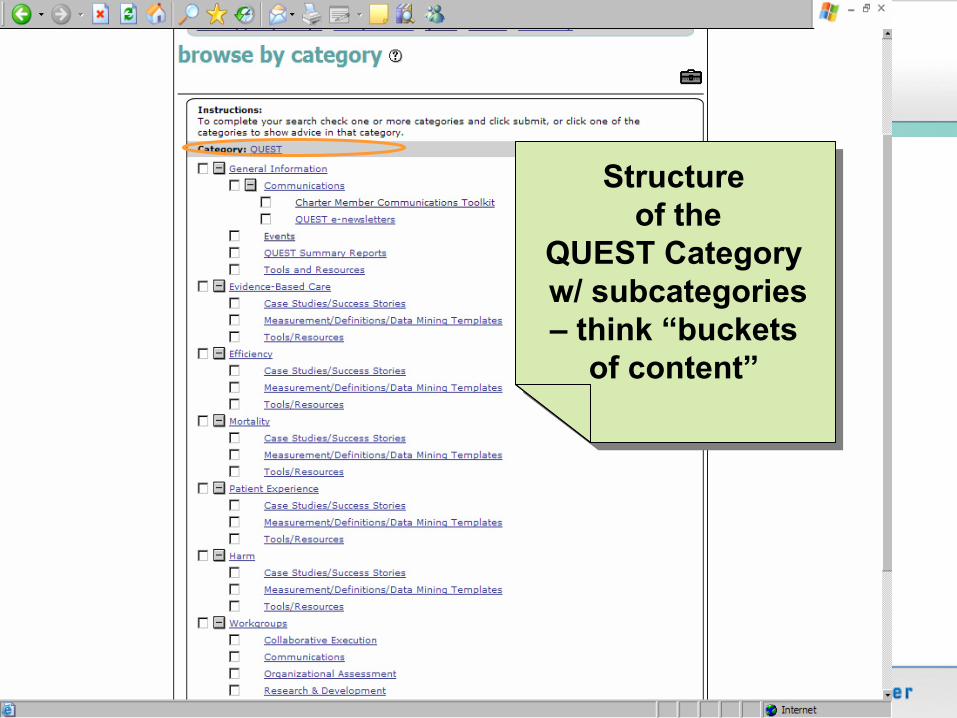
Structureof the
QUEST Categoryw/ subcategories –
think “buckets of content”
Structureof the
QUEST Categoryw/ subcategories –
think “buckets of content”
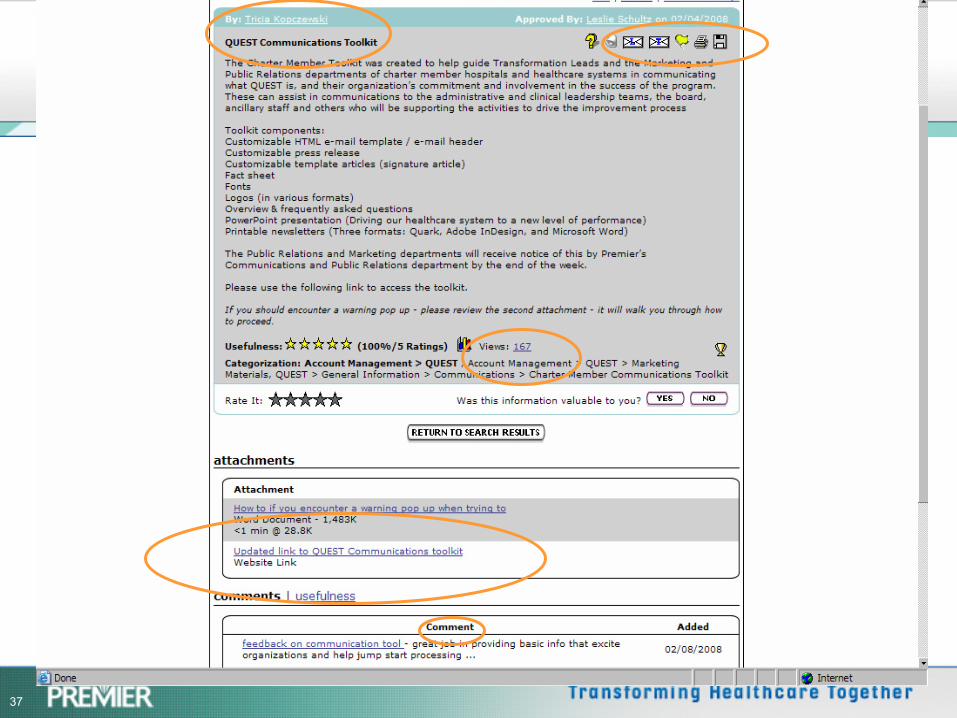
37
38
Achieving High Value Healthcare through Learning Collaboratives
ICU/CAP Collaborative
Cardiac Collaborative
Surgical Collaborative
Palliative Care Collaborative
Labor and Delivery Collaborative
Will / Ideas
Ideas / Execution
Will / Ideas Dimension can form one basis of reporting.
Execution takes place among a series of clinical collaboratives focused on specific, target populations, or along vertical dimensions focused on specific aspects of value.
Ideas and success stories from one clinical population could transfer to another, so ideas are shared among both dimensions.
Sepsis Collaborative
39
Observations on Collaborative Execution
•
Transparency and Healthy Competition is Key–
Everyone likes being held up as a best performer; no one wants to see their institution at the bottom of the list
•
Trust in each other and in a partner are critical–
Data must be credible –
not perfect–
Since the group is entirely open with results, both good and bad, there needs to be a trust that information won’t be misused
•
Focusing on a “higher purpose”
can excite and motivate and makes competitive concerns less important–
By constantly focusing on the improved health of the patient and
the community, the group engages in true collaboration
40
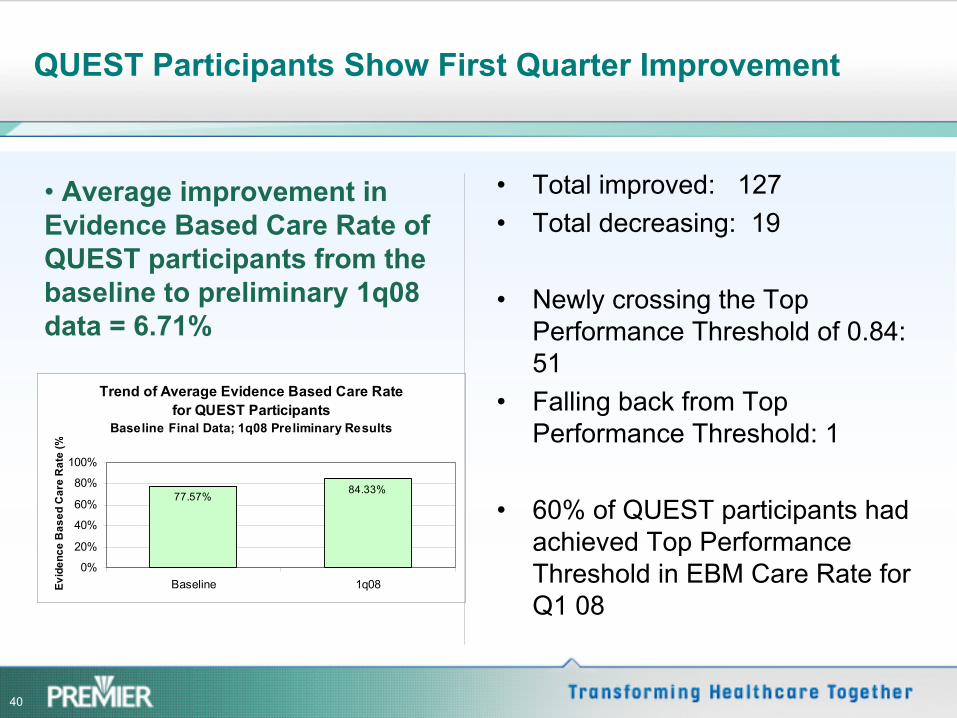
QUEST Participants Show First Quarter Improvement
•
Average improvement in Evidence Based Care Rate of QUEST participants from the baseline to preliminary 1q08 data
= 6.71%
Trend of Average Evidence Based Care Rate for QUEST Participants
Baseline Final Data; 1q08 Preliminary Results
77.57%84.33%
0%
20%
40%
60%
80%
100%
Baseline 1q08Evid
ence
Bas
ed C
are
Rat
e (%
•
Total improved: 127•
Total decreasing: 19
•
Newly crossing the Top Performance Threshold of 0.84: 51
•
Falling back from Top Performance Threshold: 1
•
60% of QUEST participants had achieved Top Performance Threshold in EBM Care Rate for Q1 08
41
What if?
•
All hospitals could deliver EBM care at the level of the QUEST goal of 0.84?–
270,000 additional
patients would receive 100% of EBM care
•
The approx 1000 hospitals closest to the QUEST mortality goal could reach the goal of 0.82?–
20,000 additional
prevented deaths
•
The approx 1000 hospitals closest to the QUEST cost goal could reach that goal?–
3,000,000 additional
dollars saved
Based on 2006 MedPar Data