Embed Size (px)
Citation preview
IMPROVING PERSONALIZED FEEDBACK AT THE WORKPLACE WITH A LEARNING ANALYTICS ENHANCED E-PORTFOLIO MARIEKE VAN DER SCHAAF, UTRECHT UNIVERSITY GERALDINE CLAREBOUT, MAASTRICHT UNIVERSITY
www.project-watchme.eu
@Project_WatchMe
This project has received funding from the European Union’s Seventh Framework Programme for research, technological development and demonstration under grant agreement no 619349
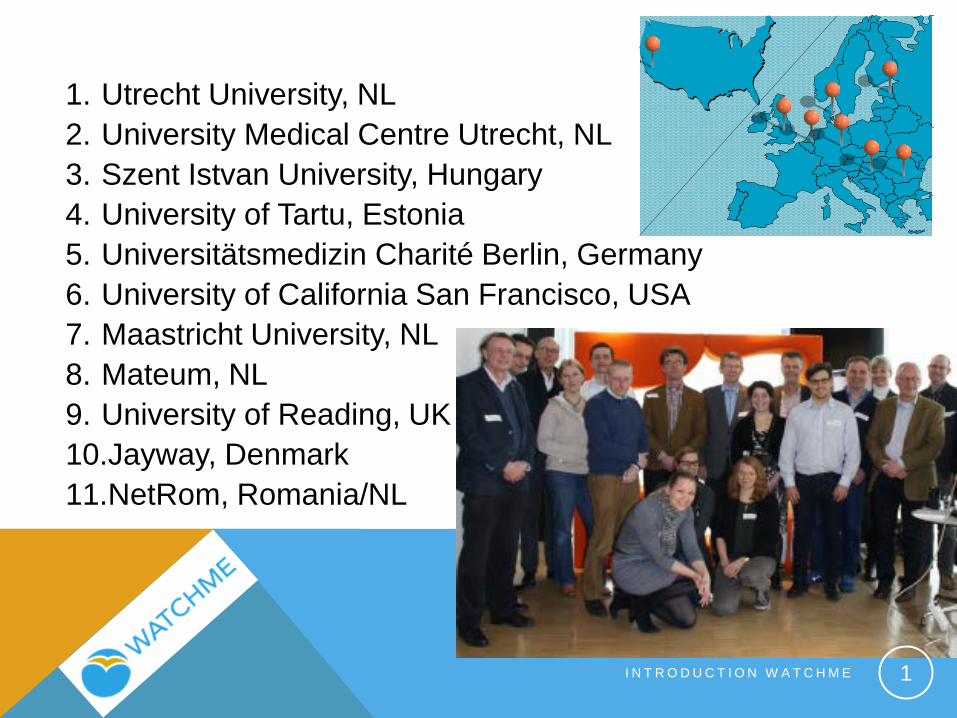
1. Utrecht University, NL 2. University Medical Centre Utrecht, NL 3. Szent Istvan University, Hungary 4. University of Tartu, Estonia 5. Universitätsmedizin Charité Berlin, Germany 6. University of California San Francisco, USA 7. Maastricht University, NL 8. Mateum, NL 9. University of Reading, UK 10.Jayway, Denmark 11.NetRom, Romania/NL
1 I N T R O D U C T I O N W A T C H M E
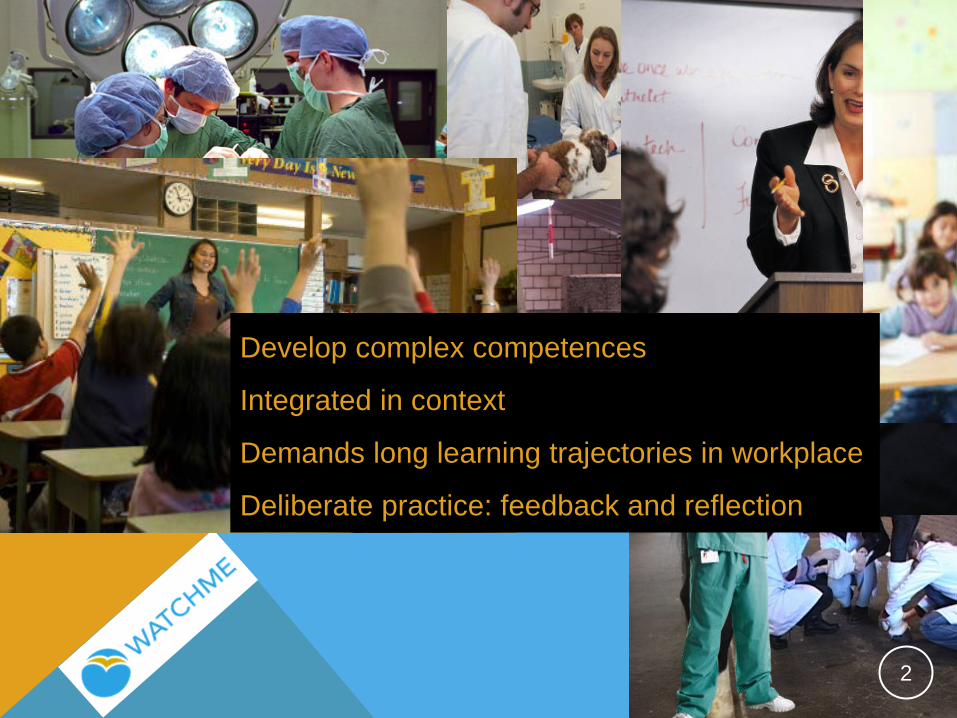
Develop complex competences
Integrated in context
Demands long learning trajectories in workplace
Deliberate practice: feedback and reflection
2
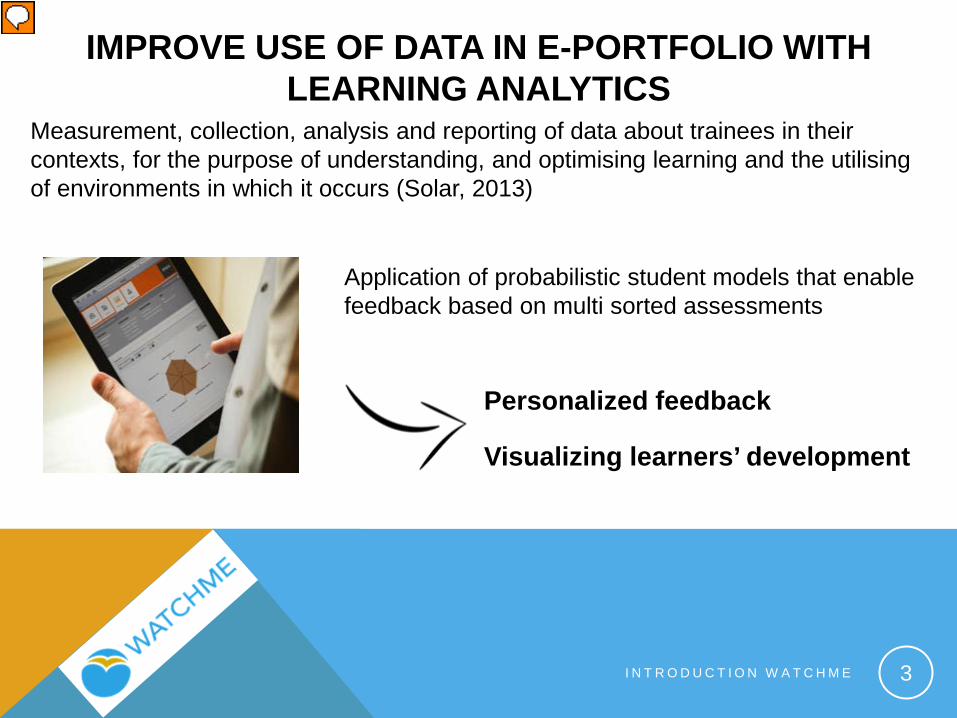
IMPROVE USE OF DATA IN E-PORTFOLIO WITH LEARNING ANALYTICS
3
Application of probabilistic student models that enable feedback based on multi sorted assessments
Measurement, collection, analysis and reporting of data about trainees in their contexts, for the purpose of understanding, and optimising learning and the utilising of environments in which it occurs (Solar, 2013)
Personalized feedback
Visualizing learners’ development
I N T R O D U C T I O N W A T C H M E
THREE WAYS OF PERSONALIZED FEEDBACK
• Regular e-portfolio feedback, e.g. assessment forms
Probabilistic, derived from data in the portfolio: • Performance estimations, based on earlier scores
or narratives • Pedagogical estimations, e.g level of a student’s
frustration, consistency
I N T R O D U C T I O N W A T C H M E
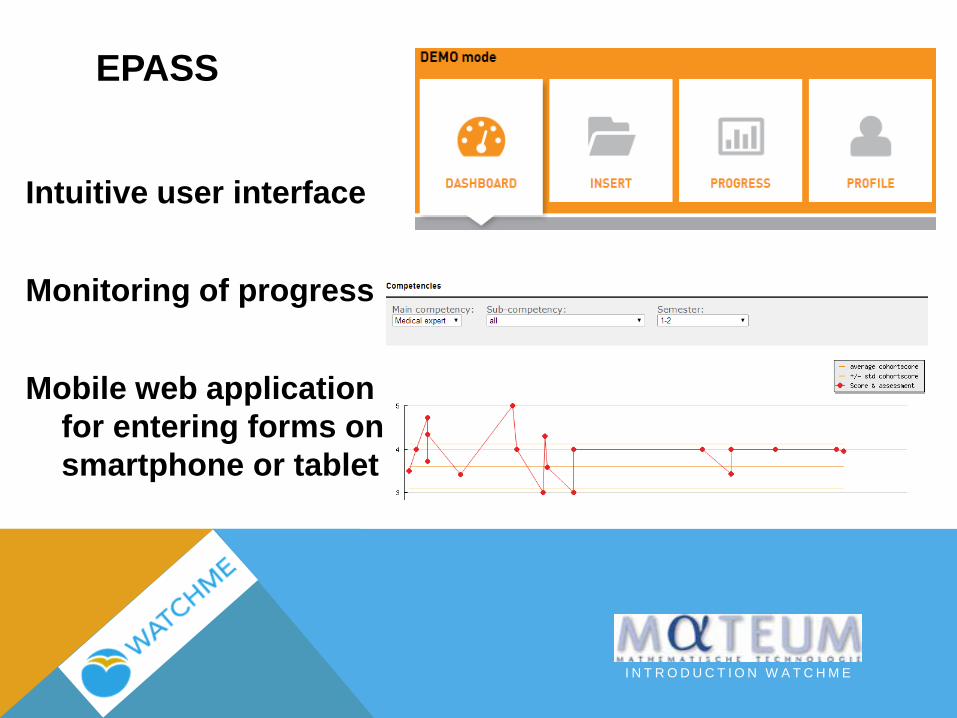
EPASS
Intuitive user interface Monitoring of progress Mobile web application
for entering forms on smartphone or tablet
I N T R O D U C T I O N W A T C H M E
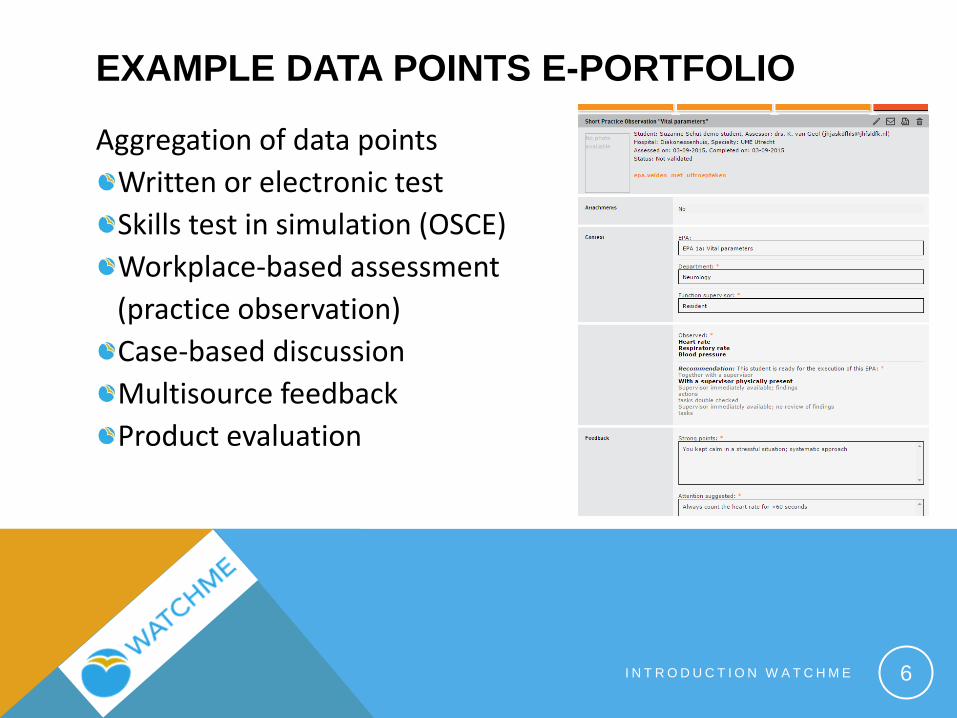
EXAMPLE DATA POINTS E-PORTFOLIO
Aggregation of data points Written or electronic test Skills test in simulation (OSCE) Workplace-based assessment
(practice observation) Case-based discussion Multisource feedback Product evaluation
6 I N T R O D U C T I O N W A T C H M E
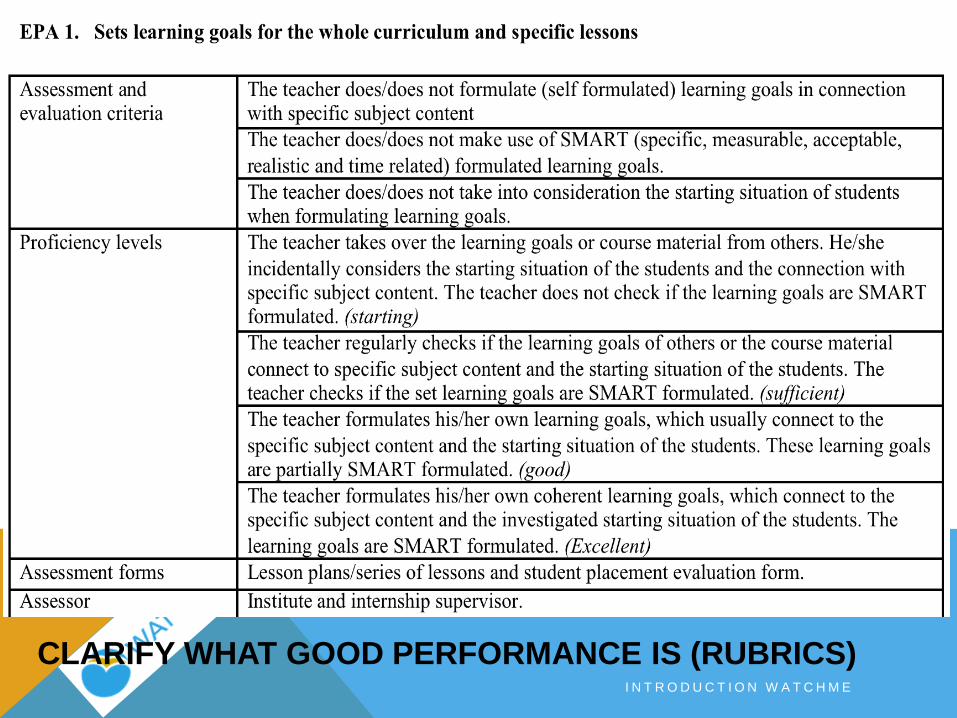
CLARIFY WHAT GOOD PERFORMANCE IS (RUBRICS) I N T R O D U C T I O N W A T C H M E
W A T C H M E – R E V I E W M E E T I N G , A P R I L 2 0 1 5 8
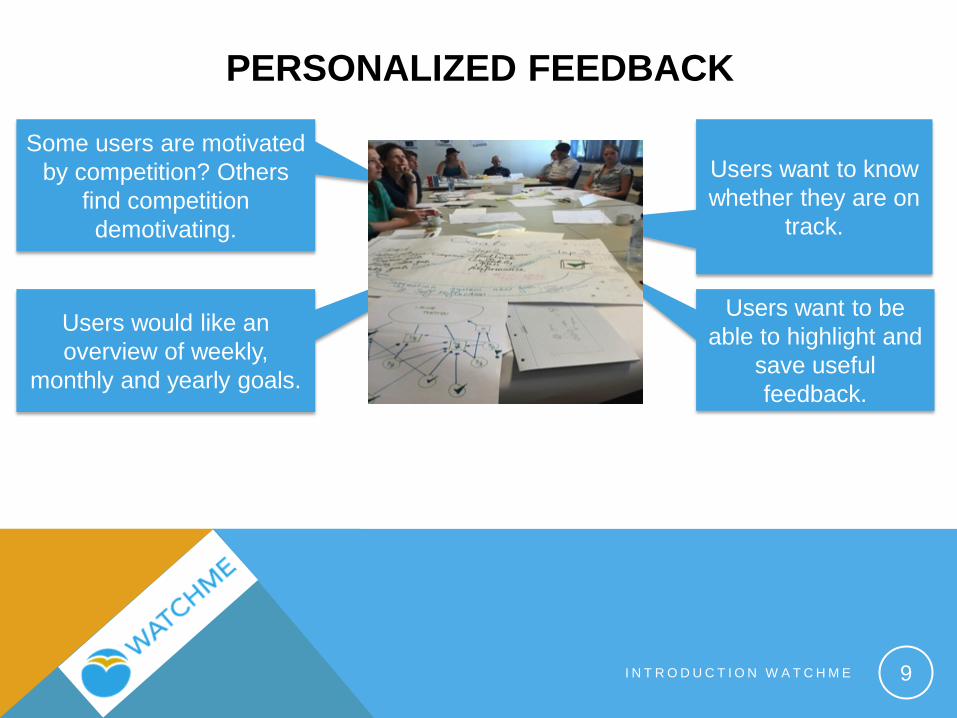
PERSONALIZED FEEDBACK
9
Some users are motivated by competition? Others
find competition demotivating.
Users want to know whether they are on
track.
Users want to be able to highlight and
save useful feedback.
Users would like an overview of weekly,
monthly and yearly goals.
I N T R O D U C T I O N W A T C H M E
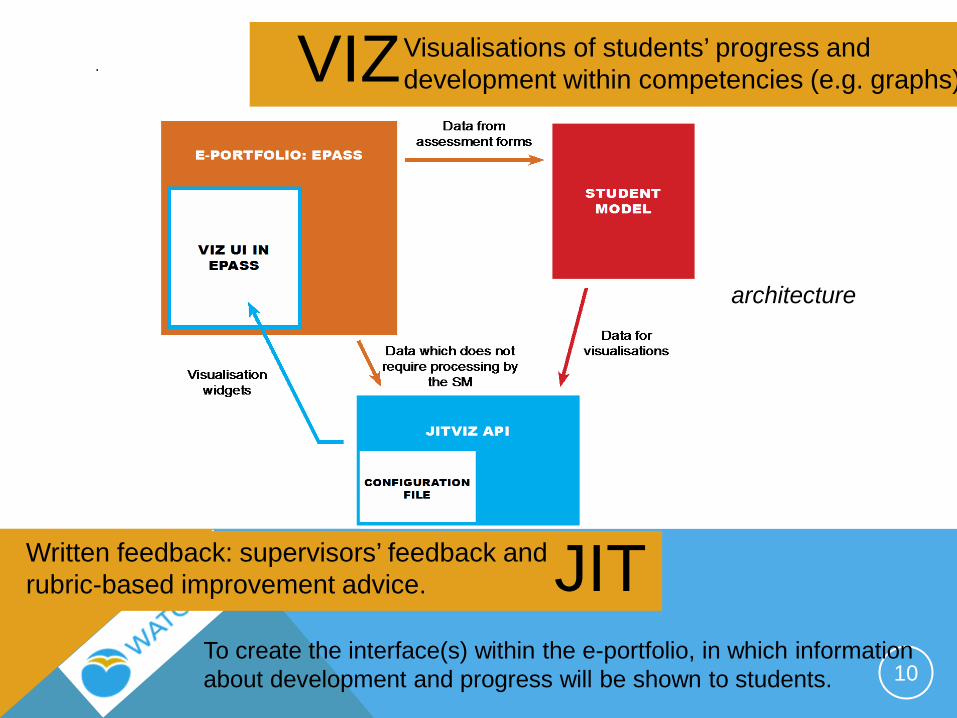
JIT Written feedback: supervisors’ feedback and rubric-based improvement advice.
Visualisations of students’ progress and development within competencies (e.g. graphs)
10 To create the interface(s) within the e-portfolio, in which information about development and progress will be shown to students.
VIZ .
architecture
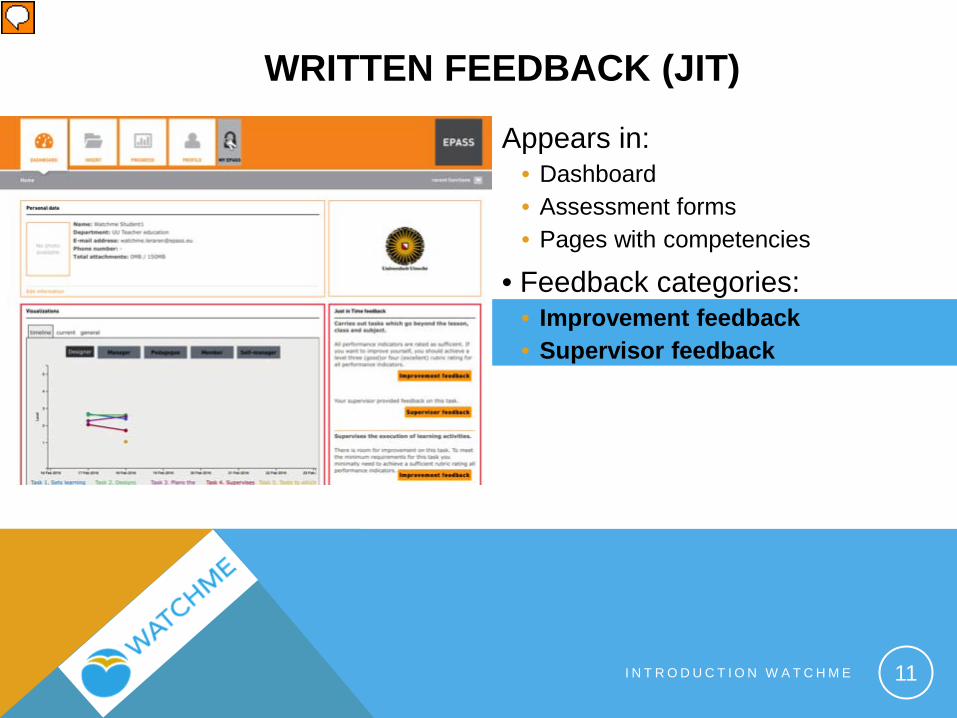
Appears in: • Dashboard • Assessment forms • Pages with competencies
• Feedback categories: • Improvement feedback • Supervisor feedback
11
WRITTEN FEEDBACK (JIT)
I N T R O D U C T I O N W A T C H M E
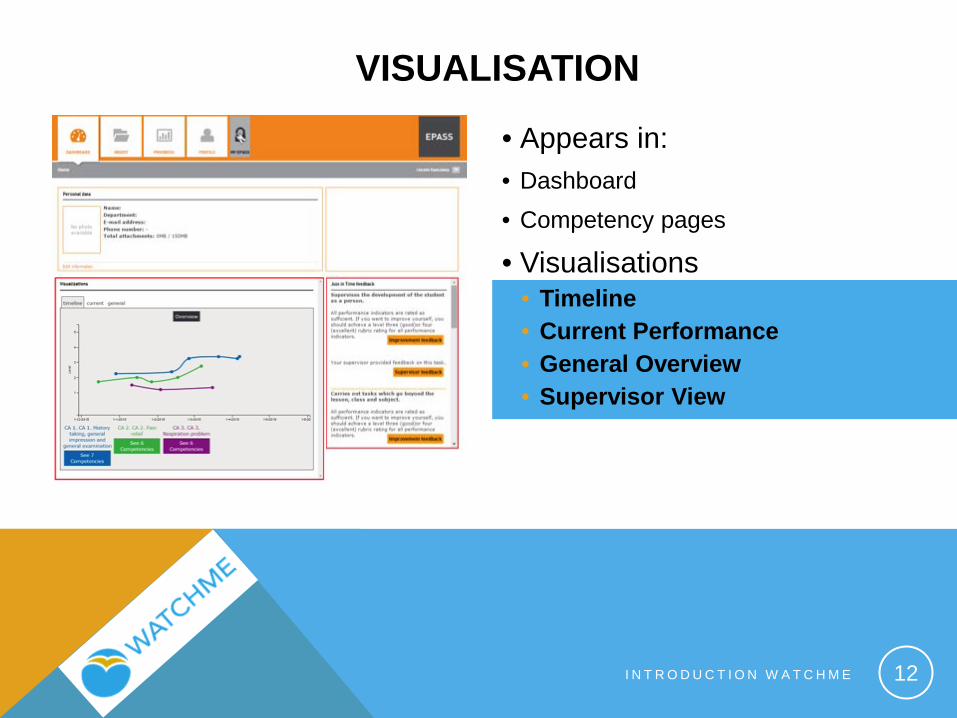
• Appears in: • Dashboard • Competency pages
• Visualisations • Timeline • Current Performance • General Overview • Supervisor View
12
VISUALISATION
I N T R O D U C T I O N W A T C H M E
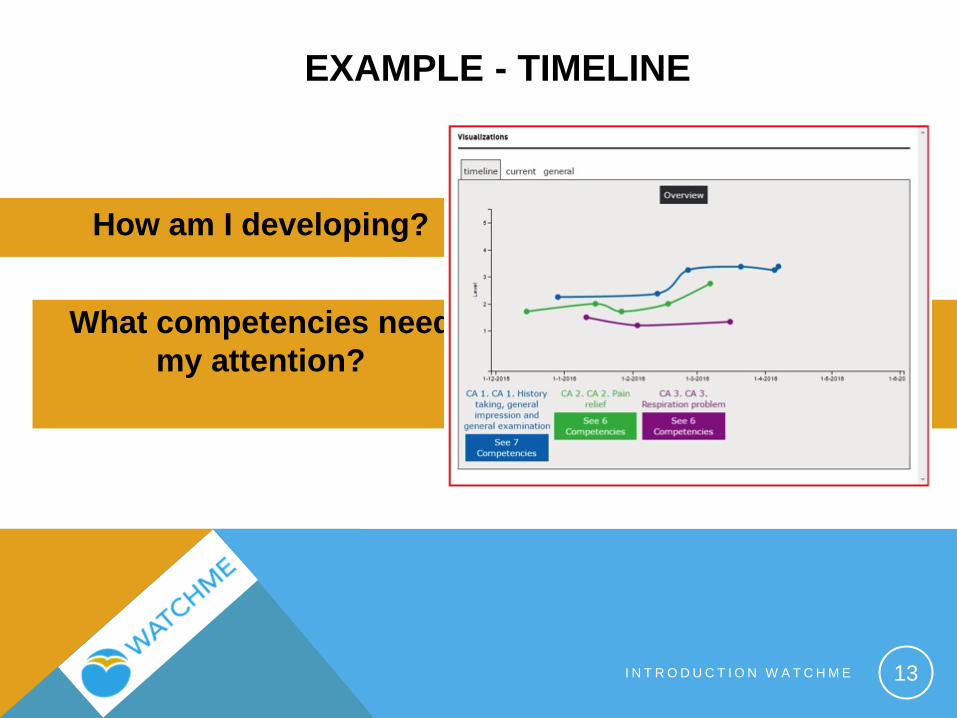
13
EXAMPLE - TIMELINE
How am I developing?
What competencies need my attention?
I N T R O D U C T I O N W A T C H M E
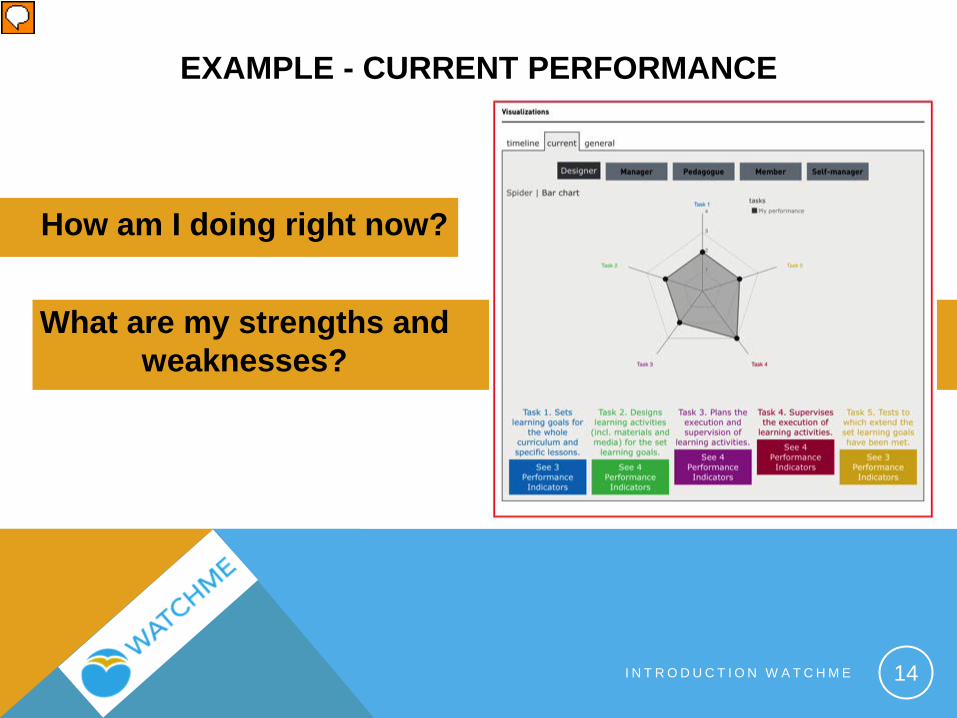
How am I doing right now?
What are my strengths and weaknesses?
14
EXAMPLE - CURRENT PERFORMANCE
I N T R O D U C T I O N W A T C H M E
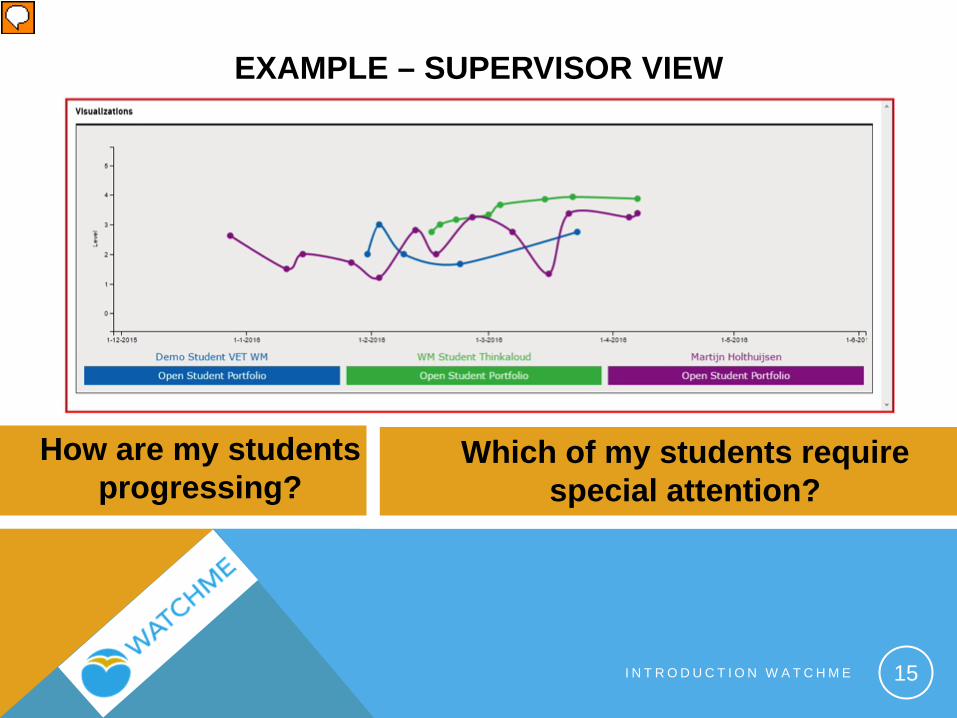
15
EXAMPLE – SUPERVISOR VIEW
How are my students progressing?
Which of my students require special attention?
I N T R O D U C T I O N W A T C H M E
DEMO
www.project-watchme.eu
@Project_WatchMe
This project has received funding from the European Union’s Seventh Framework Programme for research, technological development and demonstration under grant agreement no 619349