Embed Size (px)
Citation preview

IMPROVING PEDIATRIC EMERGENCY DEPARTMENT PATIENT THROUGHPUT AND OPERATIONAL PERFORMANCE 1
Improving Pediatric Emergency Department Patient Throughput and
Operational Performance
Rachel Weber, M.S. 2
Abbey Marquette, M.S. 2
LesleyAnn Carlson, R.N., M.S.N. 1
Paul Kurtin, M.D. 3
Lisa McDonough, B.S.N., R.N., C.E.N., C.P.E.N. 1
Marc Etkin, M.D. 1, 4
Jim Harley, M.D. 1, M.P.H. 4
From the Rady Children’s Hospital-San Diego, San Diego, CA: Emergency Department 1; Industrial Engineering Department 2; Quality Management Department 3
From the University of California San Diego, San Diego CA: Department of Pediatrics 4
IMPROVING PEDIATRIC EMERGENCY DEPARTMENT PATIENT THROUGHPUT AND OPERATIONAL PERFORMANCE 2
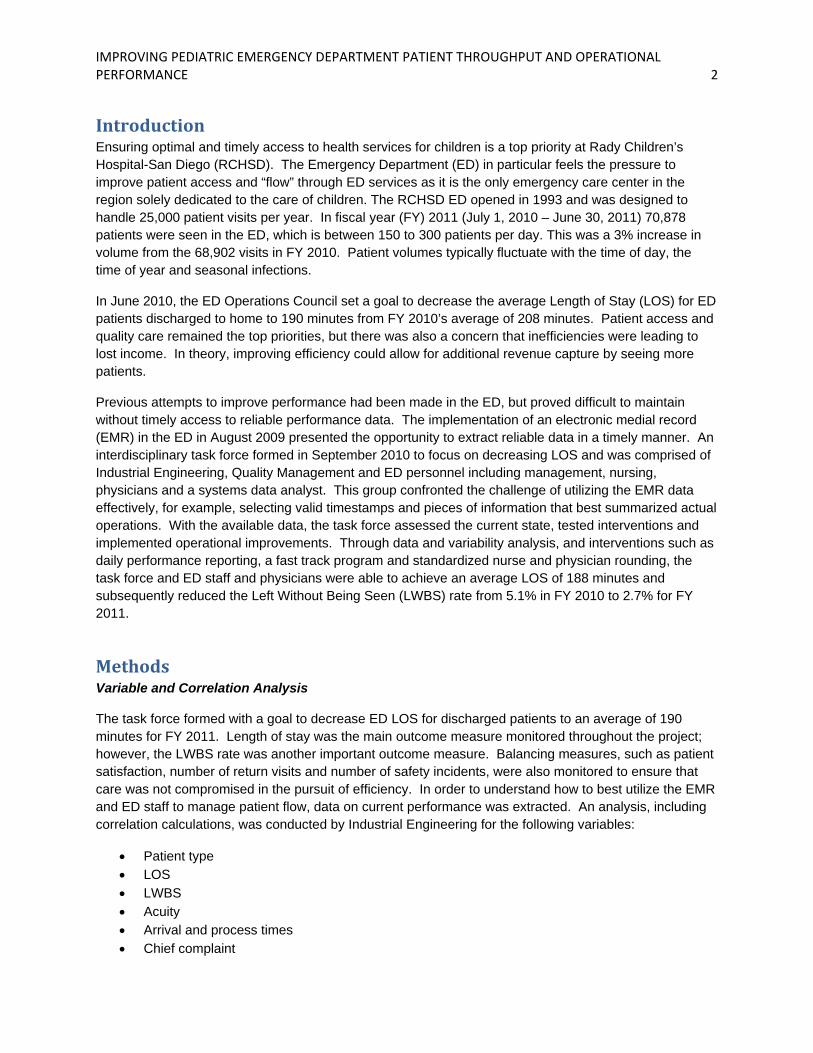
Introduction Ensuring optimal and timely access to health services for children is a top priority at Rady Children’s Hospital-San Diego (RCHSD). The Emergency Department (ED) in particular feels the pressure to improve patient access and “flow” through ED services as it is the only emergency care center in the region solely dedicated to the care of children. The RCHSD ED opened in 1993 and was designed to handle 25,000 patient visits per year. In fiscal year (FY) 2011 (July 1, 2010 – June 30, 2011) 70,878 patients were seen in the ED, which is between 150 to 300 patients per day. This was a 3% increase in volume from the 68,902 visits in FY 2010. Patient volumes typically fluctuate with the time of day, the time of year and seasonal infections.
In June 2010, the ED Operations Council set a goal to decrease the average Length of Stay (LOS) for ED patients discharged to home to 190 minutes from FY 2010’s average of 208 minutes. Patient access and quality care remained the top priorities, but there was also a concern that inefficiencies were leading to lost income. In theory, improving efficiency could allow for additional revenue capture by seeing more patients.
Previous attempts to improve performance had been made in the ED, but proved difficult to maintain without timely access to reliable performance data. The implementation of an electronic medial record (EMR) in the ED in August 2009 presented the opportunity to extract reliable data in a timely manner. An interdisciplinary task force formed in September 2010 to focus on decreasing LOS and was comprised of Industrial Engineering, Quality Management and ED personnel including management, nursing, physicians and a systems data analyst. This group confronted the challenge of utilizing the EMR data effectively, for example, selecting valid timestamps and pieces of information that best summarized actual operations. With the available data, the task force assessed the current state, tested interventions and implemented operational improvements. Through data and variability analysis, and interventions such as daily performance reporting, a fast track program and standardized nurse and physician rounding, the task force and ED staff and physicians were able to achieve an average LOS of 188 minutes and subsequently reduced the Left Without Being Seen (LWBS) rate from 5.1% in FY 2010 to 2.7% for FY 2011.
Methods Variable and Correlation Analysis
The task force formed with a goal to decrease ED LOS for discharged patients to an average of 190 minutes for FY 2011. Length of stay was the main outcome measure monitored throughout the project; however, the LWBS rate was another important outcome measure. Balancing measures, such as patient satisfaction, number of return visits and number of safety incidents, were also monitored to ensure that care was not compromised in the pursuit of efficiency. In order to understand how to best utilize the EMR and ED staff to manage patient flow, data on current performance was extracted. An analysis, including correlation calculations, was conducted by Industrial Engineering for the following variables:
• Patient type • LOS • LWBS • Acuity • Arrival and process times • Chief complaint

IMPROVING PEDIATRIC EMERGENCY DEPARTMENT PATIENT THROUGHPUT AND OPERATIONAL PERFORMANCE 3
Variability Analysis
Quality Management suggested conducting a variability analysis on the outcome variable, LOS, to identify natural and artificial variation. This helped direct subsequent analyses and interventions to manage natural variation and reduce or eliminate artificial variation. Artificial variation was present in patients with LOS greater than upper control limit set at two standard deviations above the mean. The number of patients discharged to home with a LOS greater than that limit was added as a variable to track on a daily dashboard. Industrial Engineering collected timestamps of care activities from the EMR, such as orders entered and results available, for a random selection of patients above the control limit to better understand timing of activities during their ED stay and warning signs that may help to avoid such high LOS in the future.
Daily Performance Reporting
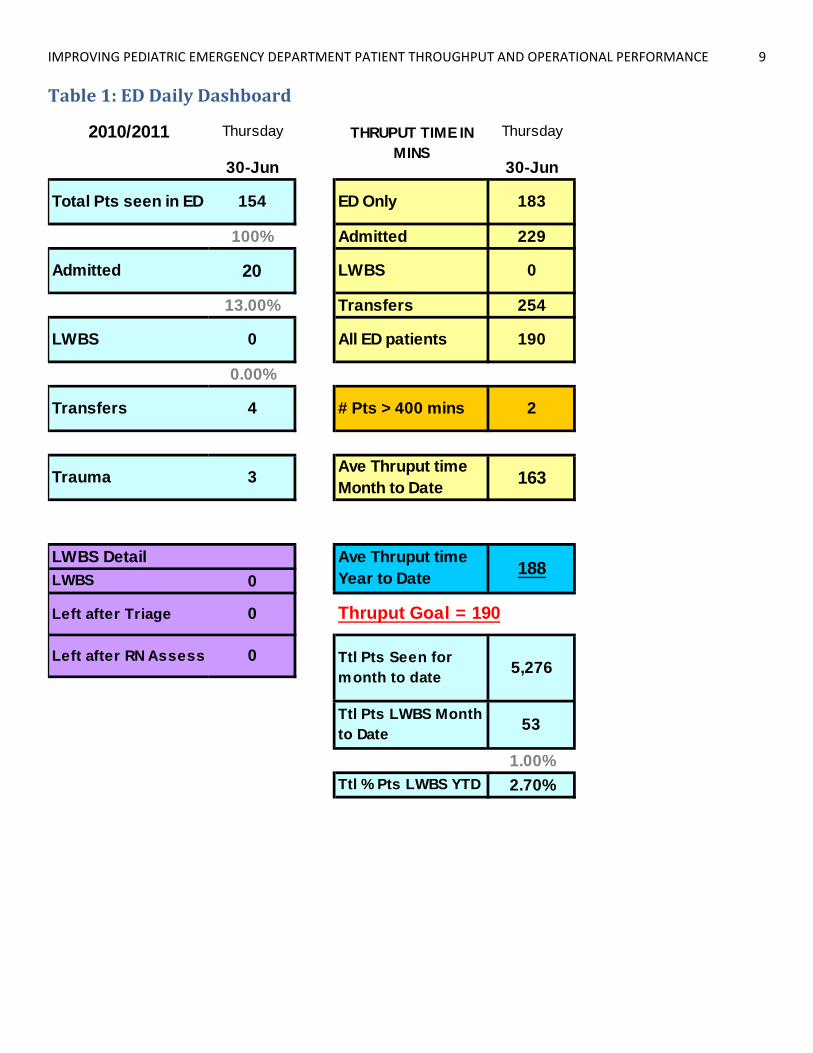
Several interventions were tested and implemented to contribute towards the improvement. Daily performance reporting, focusing on throughput, was put in place in October 2010. Table 1 shows an example of the ED Daily Dashboard posted in the staff lounge by the systems data analyst at the beginning of each day. The dashboard includes data on average LOS, LWBS, volume and throughput by patient type, as well as year to date progress towards the FY 2011 goal of 190 minutes for LOS. Several of these daily measures were also incorporated into the EMR banner to display to all staff real time. ED management discussed these numbers with staff to encourage them to regularly monitor the data and take ownership.
Fast Track
Responsibilities of the ED mid-level providers, nurse practitioners and physician assistants, were reorganized in February 2011 to include managing a standardized fast track service. During peak hours, 6:00 PM to 12:00 AM, one mid-level provider, two nurses and four rooms were allocated to low acuity patients with pre-determined chief complaints for the purpose of efficient and effective care for the patient, as well as rapid room turnover.
Standardized Nurse and Physician Rounding
Finally, standardized nurse and physician rounding began in April 2011 to increase focus on patients with potentially high LOS and foster discussions on flow issues. For each patient the “in process” time, starting when the patient is roomed in the ED and has an assigned physician, was measured and displayed in the EMR. The flow nurse, a position in place before this project dedicated to direct rooming and filling beds, became responsible for monitoring in process time. If this time for a patient reached three hours (180 minutes), the flow nurse, patient care nurse and physician met to discuss the care plan for that patient and to make a decision on next steps as soon as possible. To increase situational awareness amongst ED staff, real time auditing of all patients over 400 minutes was documented by the flow nurse with feedback from the care team. This feedback was compiled daily to identify trends in factors inhibiting efficient flow such as ancillary services, sedation and outside consults.
Results Variable and Correlation Analysis
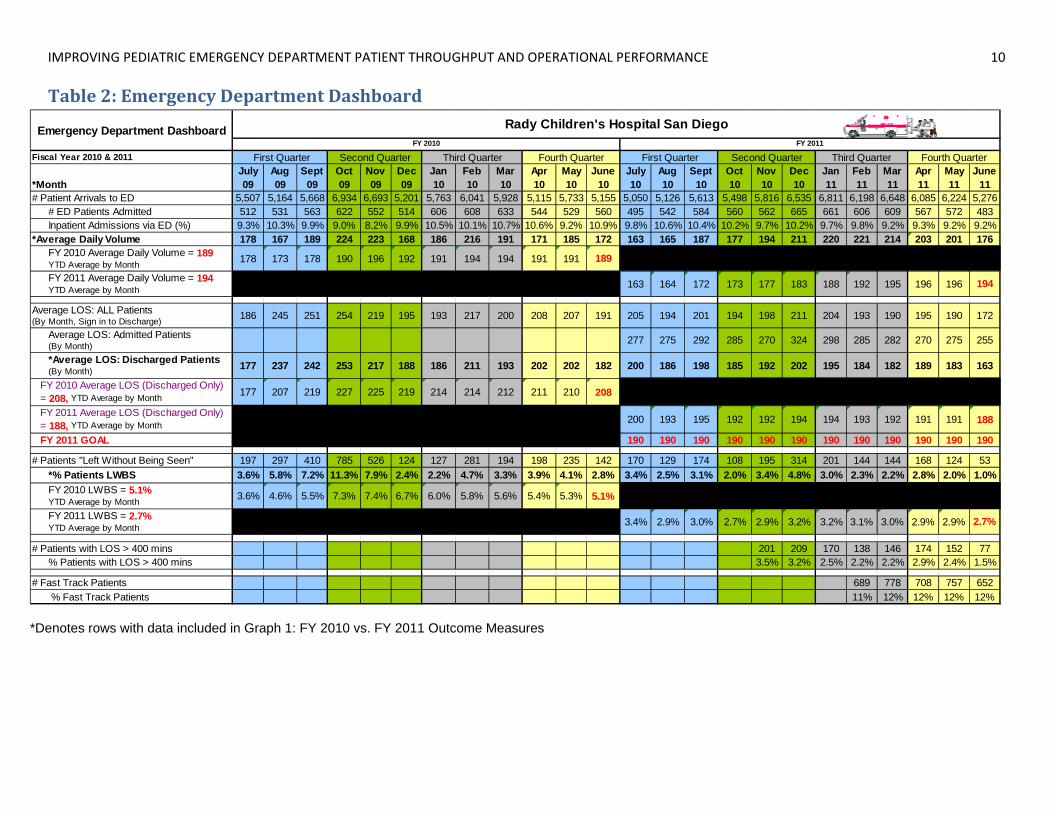
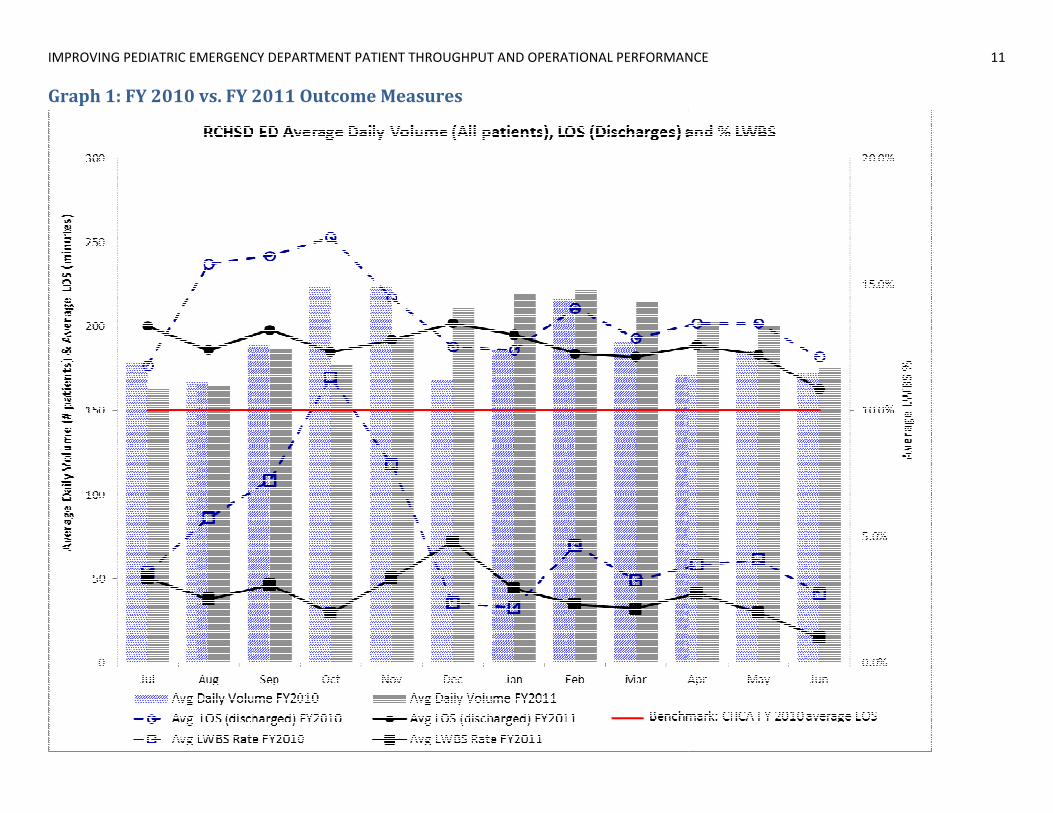
The baseline for the project and monthly statistics from FY 2010 are included in Table 2 and are graphically displayed in Graph 1. July 2009 had the lowest average LOS for discharged patients at 177 minutes, and September 2009 had the highest at 253 minutes, contributing to the annual average of 208
IMPROVING PEDIATRIC EMERGENCY DEPARTMENT PATIENT THROUGHPUT AND OPERATIONAL PERFORMANCE 4
minutes. January 2010 had the lowest LWBS rate at 2.2%, and October 2009 had the highest at 11.3%, contributing to the annual average of 5.1%. Also, there were 68,902 patient visits in the baseline time period, with an average daily volume of 189 patients.
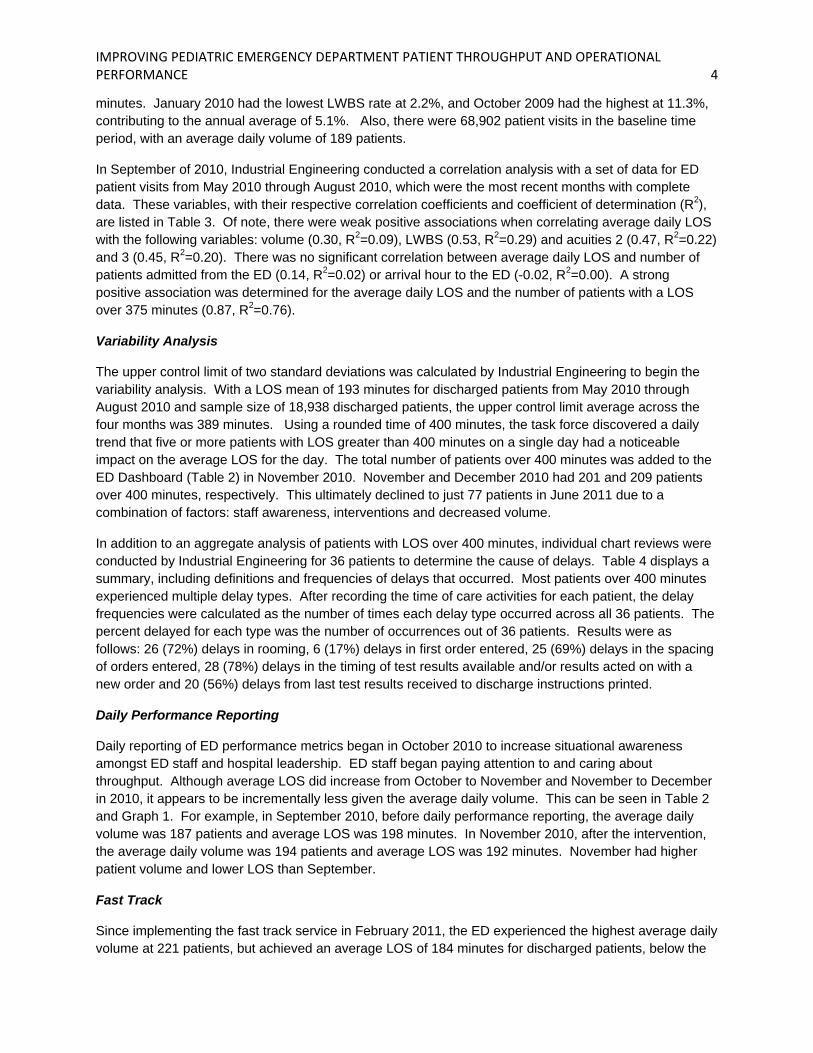
In September of 2010, Industrial Engineering conducted a correlation analysis with a set of data for ED patient visits from May 2010 through August 2010, which were the most recent months with complete data. These variables, with their respective correlation coefficients and coefficient of determination (R2), are listed in Table 3. Of note, there were weak positive associations when correlating average daily LOS with the following variables: volume (0.30, R2=0.09), LWBS (0.53, R2=0.29) and acuities 2 (0.47, R2=0.22) and 3 (0.45, R2=0.20). There was no significant correlation between average daily LOS and number of patients admitted from the ED (0.14, R2=0.02) or arrival hour to the ED (-0.02, R2=0.00). A strong positive association was determined for the average daily LOS and the number of patients with a LOS over 375 minutes (0.87, R2=0.76).
Variability Analysis
The upper control limit of two standard deviations was calculated by Industrial Engineering to begin the variability analysis. With a LOS mean of 193 minutes for discharged patients from May 2010 through August 2010 and sample size of 18,938 discharged patients, the upper control limit average across the four months was 389 minutes. Using a rounded time of 400 minutes, the task force discovered a daily trend that five or more patients with LOS greater than 400 minutes on a single day had a noticeable impact on the average LOS for the day. The total number of patients over 400 minutes was added to the ED Dashboard (Table 2) in November 2010. November and December 2010 had 201 and 209 patients over 400 minutes, respectively. This ultimately declined to just 77 patients in June 2011 due to a combination of factors: staff awareness, interventions and decreased volume.
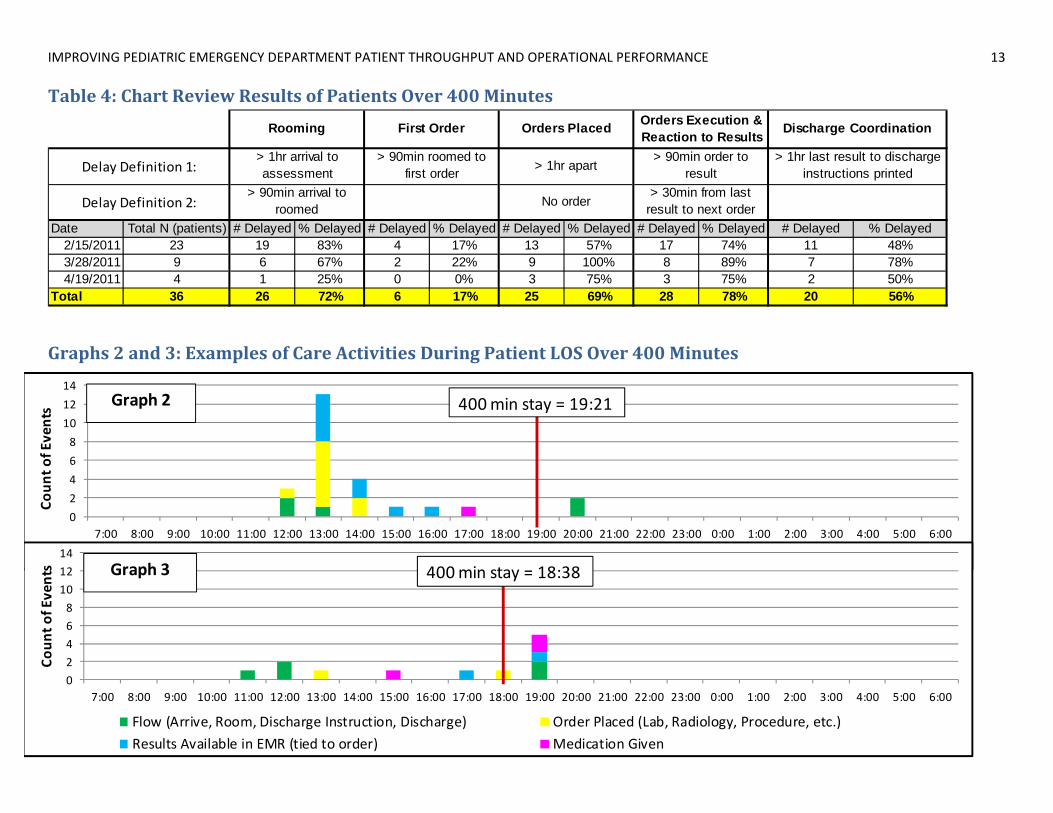
In addition to an aggregate analysis of patients with LOS over 400 minutes, individual chart reviews were conducted by Industrial Engineering for 36 patients to determine the cause of delays. Table 4 displays a summary, including definitions and frequencies of delays that occurred. Most patients over 400 minutes experienced multiple delay types. After recording the time of care activities for each patient, the delay frequencies were calculated as the number of times each delay type occurred across all 36 patients. The percent delayed for each type was the number of occurrences out of 36 patients. Results were as follows: 26 (72%) delays in rooming, 6 (17%) delays in first order entered, 25 (69%) delays in the spacing of orders entered, 28 (78%) delays in the timing of test results available and/or results acted on with a new order and 20 (56%) delays from last test results received to discharge instructions printed.
Daily Performance Reporting
Daily reporting of ED performance metrics began in October 2010 to increase situational awareness amongst ED staff and hospital leadership. ED staff began paying attention to and caring about throughput. Although average LOS did increase from October to November and November to December in 2010, it appears to be incrementally less given the average daily volume. This can be seen in Table 2 and Graph 1. For example, in September 2010, before daily performance reporting, the average daily volume was 187 patients and average LOS was 198 minutes. In November 2010, after the intervention, the average daily volume was 194 patients and average LOS was 192 minutes. November had higher patient volume and lower LOS than September.
Fast Track
Since implementing the fast track service in February 2011, the ED experienced the highest average daily volume at 221 patients, but achieved an average LOS of 184 minutes for discharged patients, below the
IMPROVING PEDIATRIC EMERGENCY DEPARTMENT PATIENT THROUGHPUT AND OPERATIONAL PERFORMANCE 5
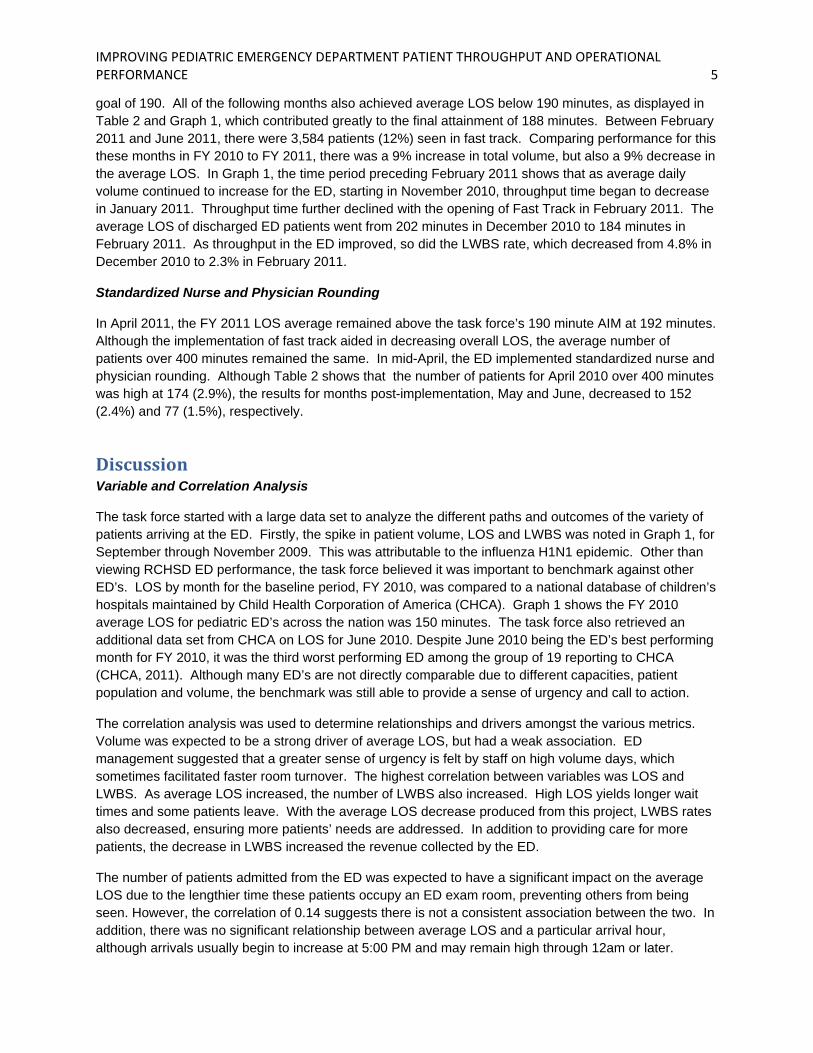
goal of 190. All of the following months also achieved average LOS below 190 minutes, as displayed in Table 2 and Graph 1, which contributed greatly to the final attainment of 188 minutes. Between February 2011 and June 2011, there were 3,584 patients (12%) seen in fast track. Comparing performance for this these months in FY 2010 to FY 2011, there was a 9% increase in total volume, but also a 9% decrease in the average LOS. In Graph 1, the time period preceding February 2011 shows that as average daily volume continued to increase for the ED, starting in November 2010, throughput time began to decrease in January 2011. Throughput time further declined with the opening of Fast Track in February 2011. The average LOS of discharged ED patients went from 202 minutes in December 2010 to 184 minutes in February 2011. As throughput in the ED improved, so did the LWBS rate, which decreased from 4.8% in December 2010 to 2.3% in February 2011.
Standardized Nurse and Physician Rounding
In April 2011, the FY 2011 LOS average remained above the task force’s 190 minute AIM at 192 minutes. Although the implementation of fast track aided in decreasing overall LOS, the average number of patients over 400 minutes remained the same. In mid-April, the ED implemented standardized nurse and physician rounding. Although Table 2 shows that the number of patients for April 2010 over 400 minutes was high at 174 (2.9%), the results for months post-implementation, May and June, decreased to 152 (2.4%) and 77 (1.5%), respectively.
Discussion Variable and Correlation Analysis
The task force started with a large data set to analyze the different paths and outcomes of the variety of patients arriving at the ED. Firstly, the spike in patient volume, LOS and LWBS was noted in Graph 1, for September through November 2009. This was attributable to the influenza H1N1 epidemic. Other than viewing RCHSD ED performance, the task force believed it was important to benchmark against other ED’s. LOS by month for the baseline period, FY 2010, was compared to a national database of children’s hospitals maintained by Child Health Corporation of America (CHCA). Graph 1 shows the FY 2010 average LOS for pediatric ED’s across the nation was 150 minutes. The task force also retrieved an additional data set from CHCA on LOS for June 2010. Despite June 2010 being the ED’s best performing month for FY 2010, it was the third worst performing ED among the group of 19 reporting to CHCA (CHCA, 2011). Although many ED’s are not directly comparable due to different capacities, patient population and volume, the benchmark was still able to provide a sense of urgency and call to action.
The correlation analysis was used to determine relationships and drivers amongst the various metrics. Volume was expected to be a strong driver of average LOS, but had a weak association. ED management suggested that a greater sense of urgency is felt by staff on high volume days, which sometimes facilitated faster room turnover. The highest correlation between variables was LOS and LWBS. As average LOS increased, the number of LWBS also increased. High LOS yields longer wait times and some patients leave. With the average LOS decrease produced from this project, LWBS rates also decreased, ensuring more patients’ needs are addressed. In addition to providing care for more patients, the decrease in LWBS increased the revenue collected by the ED.
The number of patients admitted from the ED was expected to have a significant impact on the average LOS due to the lengthier time these patients occupy an ED exam room, preventing others from being seen. However, the correlation of 0.14 suggests there is not a consistent association between the two. In addition, there was no significant relationship between average LOS and a particular arrival hour, although arrivals usually begin to increase at 5:00 PM and may remain high through 12am or later.

IMPROVING PEDIATRIC EMERGENCY DEPARTMENT PATIENT THROUGHPUT AND OPERATIONAL PERFORMANCE 6
Variability Analysis
According to Litvak, variability in performance is a main roadblock to efficient, quality delivery of health care services. In order to deal with hospital capacity issues, there are only three choices:
1. Add capacity – space and staff 2. Reduce census by limiting the number of patients 3. Reduce variability of throughput by addressing the magnitude of peaks and their frequencies
Managing variability of throughput is essential to improving patient access, quality of care and controlling costs. (Litvak, 2005). The task force focused on option three by analyzing patients with LOS greater than 400 minutes. The flow nurse monitored the number of patients reaching 400 minutes in real time to better facilitate flow for these patients with the hope to keep the total number each day under five.
From the Industrial Engineering analysis on individual patients over 400 minutes, the most common reason for delay in patient care was the timing of test results available and follow up action to results. Graphs 2 and 3 display examples of activities occurring during a patient’s stay of greater than 400 minutes which resulted in a chart review. In Graph 2, many orders and results occurred early in the stay, but then there were at least two hours between medication given and patient discharge. The flow nurse may have been able to help with discharge if monitoring patients approaching 400 minutes had been a standardized guideline at that time. In Graph 3, there were periods of time in the middle of the patient’s stay where no activity took place. Watching for periods of inactivity may also aid in ensuring the LOS is less than 400 minutes. From the data, the task force and ED staff gained understanding of which delays were most common in increasing LOS. Periods of inactivity were monitored in the future.
Daily Performance Reporting
The daily posting and emailing of performance measures on patient flow lead to a cultural change amongst ED staff. Everyone was committed to reaching the FY goal of 190 minutes. Night shift nurses and Flow Nurses in particular wanted to see the performance numbers and vocalized pride on high performing days. All ED staff took ownership of the process and celebrated days with low LOS and low LWBS. It became common for nurses to notice if the daily performance metrics update was late and to ask the systems data analyst about the performance numbers.
Fast Track
Fast track programs are often used by ED’s to aid in the throughput of low acuity patients. The RCHSD ED had a fast track program in place a few years prior to this project, but the responsibilities of the mid-level providers shifted over the years to focus on starting orders for complex patients. Analysis of the current ED patient population, based on chief complaints and acuity, lead the task force to recommend the reimplementation of fast track. Standardized practices for fast track operations were essential to proving the value of this intervention to staff, who had experienced the demise of the past fast track program.
Initially, a two week pilot of the fast track program was conducted to test the criteria for patients and treatment, after which adjustments were made based on feedback. Input from the mid-level providers was vital in re-designing the program from its existence years ago, as well as from the recent pilot. To avoid interruptions, the fast track rooms were assigned to a more secluded area in the ED than was previously used. The hours of operation, 6:00 PM to 12:00 AM, were selected to match the time period with highest patient arrivals. Change of shift and patient hand-off reporting was determined to be a delay for the fast track area, as it took place at the typically busy time of 7:00 PM for a majority of staff. To
IMPROVING PEDIATRIC EMERGENCY DEPARTMENT PATIENT THROUGHPUT AND OPERATIONAL PERFORMANCE 7
improve consistency of care providers in the fast track, only staff working shifts which encompassed the fast track hours of operation were assigned to work there. The flow nurse also became an essential component of the fast track system. They maintained the overall picture of ED flow and were responsible for assigning patients to the fast track area with the collaboration of triage nurses.
Another factor that may have contributed to the LOS decrease around the same time period as fast track was the opening of a new wing in late January 2011, which made an additional 12 inpatient beds available to the organization. However, the impact was most likely minimal as these beds were often staffed to handle only seven patients. Also, they were often utilized by the inpatient units and not frequently available for ED patients.
Standardized Nurse and Physician Rounding
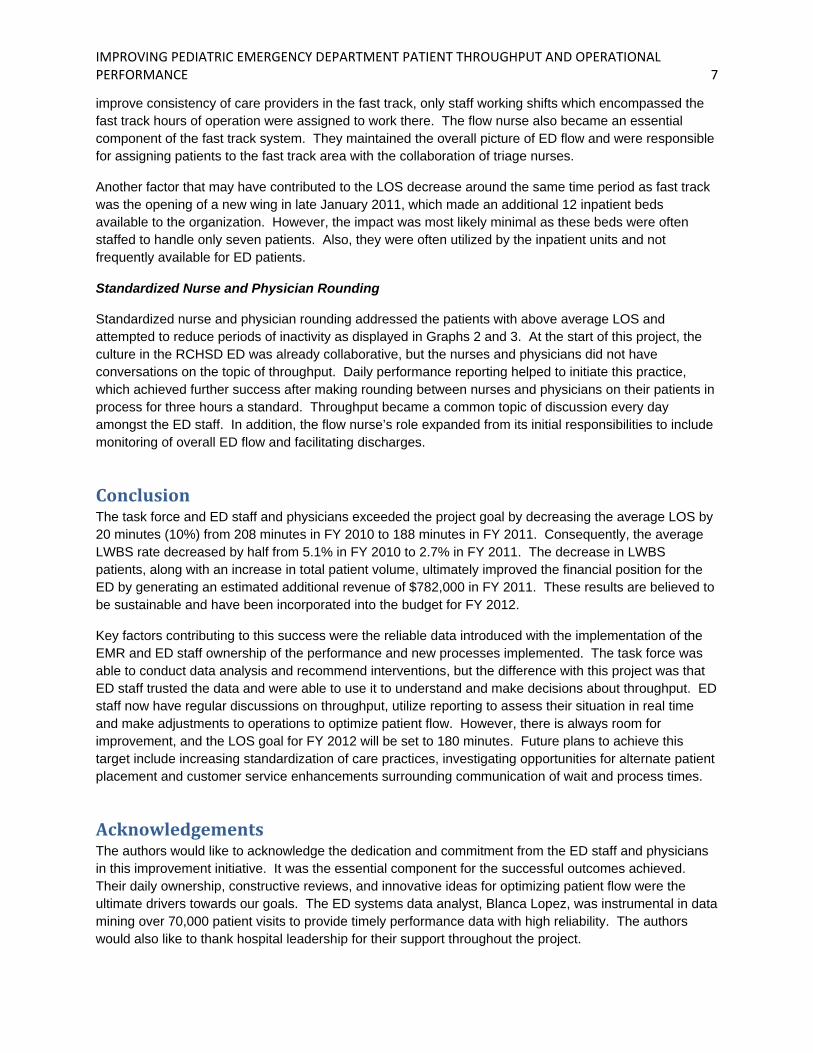
Standardized nurse and physician rounding addressed the patients with above average LOS and attempted to reduce periods of inactivity as displayed in Graphs 2 and 3. At the start of this project, the culture in the RCHSD ED was already collaborative, but the nurses and physicians did not have conversations on the topic of throughput. Daily performance reporting helped to initiate this practice, which achieved further success after making rounding between nurses and physicians on their patients in process for three hours a standard. Throughput became a common topic of discussion every day amongst the ED staff. In addition, the flow nurse’s role expanded from its initial responsibilities to include monitoring of overall ED flow and facilitating discharges.
Conclusion The task force and ED staff and physicians exceeded the project goal by decreasing the average LOS by 20 minutes (10%) from 208 minutes in FY 2010 to 188 minutes in FY 2011. Consequently, the average LWBS rate decreased by half from 5.1% in FY 2010 to 2.7% in FY 2011. The decrease in LWBS patients, along with an increase in total patient volume, ultimately improved the financial position for the ED by generating an estimated additional revenue of $782,000 in FY 2011. These results are believed to be sustainable and have been incorporated into the budget for FY 2012.
Key factors contributing to this success were the reliable data introduced with the implementation of the EMR and ED staff ownership of the performance and new processes implemented. The task force was able to conduct data analysis and recommend interventions, but the difference with this project was that ED staff trusted the data and were able to use it to understand and make decisions about throughput. ED staff now have regular discussions on throughput, utilize reporting to assess their situation in real time and make adjustments to operations to optimize patient flow. However, there is always room for improvement, and the LOS goal for FY 2012 will be set to 180 minutes. Future plans to achieve this target include increasing standardization of care practices, investigating opportunities for alternate patient placement and customer service enhancements surrounding communication of wait and process times.
Acknowledgements The authors would like to acknowledge the dedication and commitment from the ED staff and physicians in this improvement initiative. It was the essential component for the successful outcomes achieved. Their daily ownership, constructive reviews, and innovative ideas for optimizing patient flow were the ultimate drivers towards our goals. The ED systems data analyst, Blanca Lopez, was instrumental in data mining over 70,000 patient visits to provide timely performance data with high reliability. The authors would also like to thank hospital leadership for their support throughout the project.

IMPROVING PEDIATRIC EMERGENCY DEPARTMENT PATIENT THROUGHPUT AND OPERATIONAL PERFORMANCE 8
References
1. Child Health Corporation of America. (2011). Whole System Measures - Emergency Department Length of Stay (ED LOS) for Patients Discharged from the ED [Data file]. Retrieved from http://www.chca.com (password protected for subscribing organizations).
2. Litvak E. “Optimizing Patient Flow by Managing its Variability.” In Berman S. (ed.): Front Office to Front Line: Essential Issues for Health Care Leaders. Oakbrook Terrace, IL: Joint Commission Resources, 2005, pp. 91-111.
IMPROVING PEDIATRIC EMERGENCY DEPARTMENT PATIENT THROUGHPUT AND OPERATIONAL PERFORMANCE 9
Table 1: ED Daily Dashboard
2010/2011 Thursday Thursday
30-Jun 30-Jun
Total Pts seen in ED 154 ED Only 183
100% Admitted 229
Admitted 20 LWBS 0
13.00% Transfers 254
LWBS 0 All ED patients 190
0.00%
Transfers 4 # Pts > 400 mins 2
Trauma 3 Ave Thruput time Month to Date 163
LWBS DetailLWBS 0
Left after Triage 0
Left after RN Assess 0
1.00%Ttl % Pts LWBS YTD 2.70%
Thruput Goal = 190
Ttl Pts Seen for month to date 5,276
Ttl Pts LWBS Month to Date 53
THRUPUT TIME IN MINS
Ave Thruput time Year to Date 188
IMPROVING PEDIATRIC EMERGENCY DEPARTMENT PATIENT THROUGHPUT AND OPERATIONAL PERFORMANCE 10
Table 2: Emergency Department Dashboard
*Denotes rows with data included in Graph 1: FY 2010 vs. FY 2011 Outcome Measures
Fiscal Year 2010 & 2011
*MonthJuly 09
Aug 09
Sept 09
Oct 09
Nov 09
Dec 09
Jan 10
Feb 10
Mar 10
Apr 10
May 10
June 10
July 10
Aug 10
Sept 10
Oct 10
Nov 10
Dec 10
Jan 11
Feb 11
Mar 11
Apr 11
May 11
June 11
# Patient Arrivals to ED 5,507 5,164 5,668 6,934 6,693 5,201 5,763 6,041 5,928 5,115 5,733 5,155 5,050 5,126 5,613 5,498 5,816 6,535 6,811 6,198 6,648 6,085 6,224 5,276# ED Patients Admitted 512 531 563 622 552 514 606 608 633 544 529 560 495 542 584 560 562 665 661 606 609 567 572 483Inpatient Admissions via ED (%) 9.3% 10.3% 9.9% 9.0% 8.2% 9.9% 10.5% 10.1% 10.7% 10.6% 9.2% 10.9% 9.8% 10.6% 10.4% 10.2% 9.7% 10.2% 9.7% 9.8% 9.2% 9.3% 9.2% 9.2%
*Average Daily Volume 178 167 189 224 223 168 186 216 191 171 185 172 163 165 187 177 194 211 220 221 214 203 201 176FY 2010 Average Daily Volume = 189YTD Average by Month 178 173 178 190 196 192 191 194 194 191 191 189
FY 2011 Average Daily Volume = 194YTD Average by Month 163 164 172 173 177 183 188 192 195 196 196 194
Average LOS: ALL Patients(By Month, Sign in to Discharge) 186 245 251 254 219 195 193 217 200 208 207 191 205 194 201 194 198 211 204 193 190 195 190 172
Average LOS: Admitted Patients(By Month) 277 275 292 285 270 324 298 285 282 270 275 255
*Average LOS: Discharged Patients(By Month) 177 237 242 253 217 188 186 211 193 202 202 182 200 186 198 185 192 202 195 184 182 189 183 163
FY 2010 Average LOS (Discharged Only) = 208, YTD Average by Month 177 207 219 227 225 219 214 214 212 211 210 208
FY 2011 Average LOS (Discharged Only) = 188, YTD Average by Month 200 193 195 192 192 194 194 193 192 191 191 188
FY 2011 GOAL 190 190 190 190 190 190 190 190 190 190 190 190
# Patients "Left Without Being Seen" 197 297 410 785 526 124 127 281 194 198 235 142 170 129 174 108 195 314 201 144 144 168 124 53*% Patients LWBS 3.6% 5.8% 7.2% 11.3% 7.9% 2.4% 2.2% 4.7% 3.3% 3.9% 4.1% 2.8% 3.4% 2.5% 3.1% 2.0% 3.4% 4.8% 3.0% 2.3% 2.2% 2.8% 2.0% 1.0%FY 2010 LWBS = 5.1%YTD Average by Month 3.6% 4.6% 5.5% 7.3% 7.4% 6.7% 6.0% 5.8% 5.6% 5.4% 5.3% 5.1%
FY 2011 LWBS = 2.7%YTD Average by Month 3.4% 2.9% 3.0% 2.7% 2.9% 3.2% 3.2% 3.1% 3.0% 2.9% 2.9% 2.7%
# Patients with LOS > 400 mins 201 209 170 138 146 174 152 77% Patients with LOS > 400 mins 3.5% 3.2% 2.5% 2.2% 2.2% 2.9% 2.4% 1.5%
# Fast Track Patients 689 778 708 757 652 % Fast Track Patients 11% 12% 12% 12% 12%
Fourth Quarter First Quarter Second Quarter Third QuarterFY 2010 FY 2011
Rady Children's Hospital San DiegoEmergency Department Dashboard
Second QuarterFourth Quarter First Quarter Third Quarter
IMPROV
Graph
ING PEDIATRIC E
h 1: FY 2010
MERGENCY DEPA
vs. FY 2011
ARTMENT PATIEN
Outcome M
NT THROUGHPUT
Measures
T AND OPERATIONNAL PERFORMANNCE
11

IMPROVING PEDIATRIC EMERGENCY DEPARTMENT PATIENT THROUGHPUT AND OPERATIONAL PERFORMANCE 12
Table 3: Variable Correlations (May 2010August 2010)
Daily Volume 0.3Weak positive association. As Census increases, LOS increases.
9%
# Admits from ED 0.14 2%
# LWBS 0.53Weak positive association. As LOS increases, # LWBS increases.
29%
# Discharges 0.12 2%
# Patients > 375 minutes 0.87Strong positive association. As LOS increase, # Patients > 375 minutes increases.
76%
# Acuity 1 (high) 0.1 1%
# Acuity 2 0.47Weak positive association. As # Acuity 2 increases, LOS increases.
22%
# Acuity 3 0.45Weak positive association. As # Acuity 3 increases, LOS increases.
20%
# Acuity 4 -0.07 1%# Acuity 5 (low) -0.08 1%
Weekday vs. Weekend -0.33Weak negative association. Weekends have lower length of stay than weekdays.
11%
Arrival Hour -0.02 0%
Daily
V
olum
e
# LWBS 0.35Weak positive association. As Census increases, # LWBS increases
12%
# LWBS -0.03 0%# Acuity 1 (high) 0.26 7%
# Acuity 2 0.3Weak positive association. As # Acuity 2s increases, # admissions increases
9%
# Acuity 3 0.22 5%# Acuity 4 0.12 2%# Acuity 5 (low) 0.05 0%
Variable2
Variable 1
Correlation Coefficient Interpretation Coefficient of
Determination
Ave
rage
Dai
ly L
OS
# Ad
mis
sion
s
IMPROVING PEDIATRIC EMERGENCY DEPARTMENT PATIENT THROUGHPUT AND OPERATIONAL PERFORMANCE 13
Table 4: Chart Review Results of Patients Over 400 Minutes
Graphs 2 and 3: Examples of Care Activities During Patient LOS Over 400 Minutes
Date Total N (patients) # Delayed % Delayed # Delayed % Delayed # Delayed % Delayed # Delayed % Delayed # Delayed % Delayed2/15/2011 23 19 83% 4 17% 13 57% 17 74% 11 48%3/28/2011 9 6 67% 2 22% 9 100% 8 89% 7 78%4/19/2011 4 1 25% 0 0% 3 75% 3 75% 2 50%
Total 36 26 72% 6 17% 25 69% 28 78% 20 56%
> 30min from last result to next order
Rooming
> 1hr arrival to assessment
> 90min arrival to roomed
First Order
> 90min roomed to first order
Discharge Coordination
> 1hr last result to discharge instructions printedDelay Definition 1:
Delay Definition 2:
Orders Placed
> 1hr apart
No order
Orders Execution & Reaction to Results
> 90min order to result
0
2
4
6
8
10
12
14
7:00 8:00 9:00 10:00 11:00 12:00 13:00 14:00 15:00 16:00 17:00 18:00 19:00 20:00 21:00 22:00 23:00 0:00 1:00 2:00 3:00 4:00 5:00 6:00
Coun
t of Events
Flow (Arrive, Room, Discharge Instruction, Discharge) Order Placed (Lab, Radiology, Procedure, etc.) Results Available in EMR (tied to order) Medication Given
400 min stay = 19:21Graph 2
0
2
4
6
8
10
12
14
7:00 8:00 9:00 10:00 11:00 12:00 13:00 14:00 15:00 16:00 17:00 18:00 19:00 20:00 21:00 22:00 23:00 0:00 1:00 2:00 3:00 4:00 5:00 6:00
Coun
t of Events
Flow (Arrive, Room, Discharge Instruction, Discharge) Order Placed (Lab, Radiology, Procedure, etc.)
Results Available in EMR (tied to order) Medication Given
400 min stay = 18:38Graph 3