Embed Size (px)
Citation preview

Improving Patient Flow with Lean Methodology: A Case Study at the
Montreal General Hospital Colorectal Department
Jonathan Rodriguez
A Thesis
In
The Department
Of
Mechanical and Industrial Engineering
Presented in Partial Fulfillment of the Requirements
for the Degree of Master of Applied Science (Industrial Engineering) at
Concordia University
Montreal, Quebec, Canada
February 2013
© Jonathan Rodriguez, 2013
ii
iii
Abstract
Improving Patient Flow with Lean Methodology: A Case Study at the Montreal General
Hospital Colorectal Department
Jonathan Rodriguez
Quebec healthcare institutions are facing an increase in patients’ request and asked to do
more with less, impacting the healthcare staff by working harder and longer shifts.
Despite efforts, waiting lists keep growing in number resulting in patients waiting long
periods of time for a specific treatment. Lean methodologies, originally developed in the
manufacturing industry, offer an alternative to do more with less. Lean focuses efforts on
eliminating activities that do not add value from the patient perspective and builds more
efficient processes to perform an activity. This thesis proposes the use of Lean
methodologies to improve the patient flow throughout the colorectal department at the
Montreal General Hospital located in Montreal Quebec. A detail examination of the
current processes of the department is analyzed and a proposed system is discussed with
the use of value stream mapping and Lean principles. After rigorous data collection and
analysis, initial improvements in the capacity of the department will increase in the
common flow and colonoscopy loop by 20 patients per week and 60 patients per week
respectively. In addition, Lead time will significantly decrease; up to 25% in short
procedures, 20% in colonoscopies and 10% in surgeries.
Keywords: Lean Healthcare, Value Stream Mapping, Patient Flow, Care Delivery.

iv
“What we have done for ourselves alone dies with us; what we have done for others and
the world remains and is immortal”
Albert Pike

v
Acknowledgements
I would like to dedicate this Master’s thesis to my family. There is no doubt in my mind
that without their constant care and support I could not have completed this process.
I am privileged to highlight the inspirational guidance and counsel received from Dr.
Kudret Demirli. He has given me the opportunity to understand the importance of Lean
Healthcare methodologies and inspire me to continue improving our healthcare delivery.
I would also like to acknowledge the support and assistance given to me by the colorectal
department at the Montreal General Hospital and my mentors there. Finally, I would like
to thank my wife, Tina, for her support and encouragement. I could not have completed
this journey without her comprehension, tolerance, and enthusiasm.

vi
Table of Contents
List of Figures ..................................................................................................................... x
List of Tables ..................................................................................................................... xi
List of Charts...................................................................................................................... xi
1 Introduction ................................................................................................................. 1
1.1 Background of Lean Manufacturing .................................................................... 1
1.2 “Waste” in Lean ................................................................................................... 3
1.3 Background of Montreal General Hospital .......................................................... 5
1.4 Background of Colorectal Department ................................................................ 6
1.5 Why Quebec needs Lean in healthcare ................................................................ 8
1.6 Objectives ........................................................................................................... 12
2 Literature Review...................................................................................................... 13
2.1 Supporting Literature ......................................................................................... 13
3 Methodology ............................................................................................................. 19
3.1 Lean Principles ................................................................................................... 19
3.1.1 Define Value ............................................................................................... 20
3.1.2 Map the Value Stream ................................................................................ 20
3.1.3 Create Continuous Flow ............................................................................. 22
3.1.4 Establish Pull .............................................................................................. 23
3.1.5 Pursue Perfection ........................................................................................ 23

vii
3.2 A3 Methodology ................................................................................................ 24
3.2.1 Title of the Project ...................................................................................... 24
3.2.2 Identify the Problem ................................................................................... 24
3.2.3 Current Condition ....................................................................................... 24
3.2.4 Target Condition ......................................................................................... 25
3.2.5 Root Cause Analysis ................................................................................... 25
3.2.6 Proposed Countermeasures ......................................................................... 25
3.2.7 Plan and Follow-up ..................................................................................... 27
4 Case Analysis ............................................................................................................ 29
4.1 Problem Definition ............................................................................................. 30
4.2 Current Condition ............................................................................................... 32
4.2.1 Current Short Procedures Value Stream ..................................................... 34
4.2.2 Current Surgery Value Stream .................................................................... 39
4.2.3 Current Colonoscopy Value Stream ........................................................... 44
4.2.4 Current Calling Centre Value Stream ......................................................... 49
4.3 Target Condition ................................................................................................ 52
4.4 Root Cause Analysis .......................................................................................... 52
4.3.1 Lead Time ................................................................................................... 53
4.3.2 Cycle Times ................................................................................................ 55
4.3.3 Over-Processing .......................................................................................... 56

viii
4.3.4 Scheduling Practices ................................................................................... 56
4.3.5 Unnecessary Motions .................................................................................. 57
4.3.6 Physical Layout ........................................................................................... 58
4.3.7 Calling Centre Over-Processing ................................................................. 60
4.3.8 High Turnover ............................................................................................. 60
4.3.9 Culture of “Change” ................................................................................... 60
4.4 Potential Areas of Improvement ........................................................................ 61
5 Proposed System ....................................................................................................... 62
5.1 Proposed Countermeasures ................................................................................ 62
5.1.1 Proposed Short Procedures Value Stream .................................................. 64
5.1.2 Proposed Surgery Value Stream ................................................................. 69
5.1.3 Proposed Colonoscopy Value Stream ......................................................... 74
5.1.4 Proposed Calling Centre Value Stream ...................................................... 78
6 Summary, Conclusions and Future Research ........................................................... 80
6.1 Summary ............................................................................................................ 80
6.2 Conclusions ........................................................................................................ 82
6.3 Future Research Directions ................................................................................ 84
Bibliography ..................................................................................................................... 86
Appendix A: Lean sources of waste ................................................................................. 91
Appendix B: Processing time observation sheet template ................................................ 92

ix
Appendix C: Technician versus Assistant walking distance template .............................. 93
Appendix D: A3 Template ................................................................................................ 94

x
List of Figures
FIGURE 1: (A) MONTREAL GENERAL HOSPITAL IN 1874 (UNKNOWN); (B) MONTREAL GENERAL HOSPITAL TODAY (MCGILL
UNIVERSITY, 2011) .................................................................................................................................... 5
FIGURE 2: COLORECTAL MAIN FLOOR. (1) CHECK-IN OFFICE; (2) EXAMINATION ROOM; (3) STERILIZATION ROOM. .............. 7
FIGURE 3: QUEBEC'S BUDGET PLAN 2012-13 (INSTITUT DE LA STATISTIQUE DU QUEBEC, 2012) ......................................... 9
FIGURE 4: NATIONAL HEALTH EXPENDITURE TRENDS, 1975 TO 2011 (CANADIAN INSTITUTE FOR HEALTH INFORMATION
(CIHI), 2011) ........................................................................................................................................... 9
FIGURE 5: AGE PYRAMIDS (IN NUMBER) OF THE CANADIAN POPULATION, 2009, 2036 AND 2061 (SCENARIO M1) (STATISTICS
CANADA, 2010) ....................................................................................................................................... 10
FIGURE 6: DEATHS PYRAMIDS (IN RELATIVE VALUE) OF THE CANADIAN POPULATION, 2009/2010, 2035/2036 AND
2060/2061 (SCENARIO M1) (STATISTICS CANADA, 2010) ............................................................................. 11
FIGURE 7: THROUGHPUT PLUS LEAD TIME IMPACT ON UNIT COST ............................................................................... 12
FIGURE 8: LEAN PRINCIPLES ................................................................................................................................. 19
FIGURE 9: THESIS METHODOLOGY MAP ................................................................................................................. 28
FIGURE 10: COLORECTAL CURRENT VALUE STREAM MAP .......................................................................................... 33
FIGURE 11: CURRENT SHORT PROCEDURE VALUE STREAM SECTION............................................................................. 35
FIGURE 12: CURRENT SURGERY VALUE STREAM SECTION .......................................................................................... 40
FIGURE 13: CURRENT COLONOSCOPY VALUE STREAM SECTION ................................................................................... 45
FIGURE 14: CALLING CENTRE VALUE STREAM MAP .................................................................................................. 50
FIGURE 15: COLONOSCOPY WAITING TIMES ........................................................................................................... 54
FIGURE 16: COLONOSCOPY PROCESSING TIMES ....................................................................................................... 55
FIGURE 17: TECHNICIAN WALKING PATTERNS PER DAY. .............................................................................................. 59
FIGURE 18: SYSTEM EFFICIENCY VERSUS INDIVIDUAL EFFICIENCY (MARTIN, 2009) ......................................................... 61
FIGURE 19: PROPOSED COLORECTAL VALUE STREAM MAP ........................................................................................ 63
FIGURE 20: PROPOSED SHORT PROCEDURES VALUE STREAM...................................................................................... 66
FIGURE 21: VISUAL INVENTORY CONTROL TOOL (GLOBAL EQUIPMENT COMPANY INC., 2012) ........................................ 68

xi
FIGURE 22: PROPOSED SURGERY VALUE STREAM MAP ............................................................................................. 72
FIGURE 23: HOSPITAL’S MAIL CART CONFIGURATION (GOVGROUP, 2011) ................................................................... 73
FIGURE 24: PROPOSED COLONOSCOPY VALUE STREAM MAP ..................................................................................... 76
FIGURE 25: PROPOSED CALLING CENTRE VALUE STREAM MAP ................................................................................... 79
List of Tables
TABLE 1: TRADITIONAL CULTURE VERSUS LEAN CULTURE (MILLER, 2005) ...................................................................... 2
TABLE 2: 8 TYPES OF WASTE .................................................................................................................................. 4
TABLE 3: SHORT PROCEDURES PROCESSES DESCRIPTION ............................................................................................ 39
TABLE 4: SURGERY PROCESSES DESCRIPTION ........................................................................................................... 44
TABLE 5: COLONOSCOPY PROCESSES DESCRIPTION ................................................................................................... 49
TABLE 6: CALLING CENTRE PROCESSES DESCRIPTION ................................................................................................. 52
TABLE 7: VALUE ADDED TIME VERSUS LEAD TIME .................................................................................................... 53
TABLE 8: SHORT PROCEDURES TAKT TIME CALCULATION ........................................................................................... 64
TABLE 9: SURGERY TAKT TIME CALCULATION ........................................................................................................... 70
TABLE 10: COLONOSCOPY TAKT TIME CALCULATION ................................................................................................. 74
TABLE 11: LEAD TIME COMPARISON ...................................................................................................................... 82
List of Charts
CHART 1: SHORT PROCEDURE BALANCE CHART ........................................................................................................ 64
CHART 2: SURGERY BALANCE CHART ..................................................................................................................... 70
CHART 3: COLONOSCOPY BALANCE CHART .............................................................................................................. 75

1
1 Introduction
Healthcare institutions’ success is determined by quality, cost and efficiency of care
delivery. Hospitals around the world are concentrating efforts and developing new
systems in order to improve patient flow through their premises and lower costs all
around. Healthcare delivery institutions are facing an increase in patient population;
Therefore, it is very important to develop flexible, efficient and responsive systems to
operate at an acceptable service level. Consequently, institutions that do not adopt change
will struggle to keep waiting lists at acceptable standards and deliver care at a slower rate.
Lean provides a culture of change that enables systems to operate according to current
demand and develop self-learning processes to increase efficiency in care delivery at a
lower unit cost (Baker, Taylor, & Mitchell, 2009). By adopting a Lean system approach,
healthcare institutions will be able to benefit from improving patient care while saving
time and resources (Fine, Golden, Hannam, & Morra, 2009). Therefore, Lean healthcare
systems are proposed to effectively change Canadian Healthcare delivery.
1.1 Background of Lean Manufacturing
Lean Manufacturing is a model and collection of tools that has the main objective of
reduce cost, time and improve quality by eliminating waste (activities that do not add
value to the customer experience). This model is more than a set of steps to follow or
tools to implement. In 1945, Toyota automobile company set out to improve quality
while increasing their productivity at the same time. They were forced to think originally
and create flexible systems that allow them to be responsive to the market needs at that
time. It was until 1980s that Toyota officially documented the details of their system and
it was at this time when Norman Bodek, currently president of PCS press, started to

2
translate the work of Taiichi Ohno and Shingeo Shingo, founders of the Toyota
production system (Graban, 2008). In essence, this system shifted the approach of the
manufacturing engineer from single machines and their role, to the flow of the product
through the system. Toyota concluded that by having the right size machine for the
volume needed to process, self-monitoring quality, lining machines in process sequence,
quick setups and clear communication between processes, it would be possible to
produce products at low cost, high variety, high quality, and rapid throughput times to
respond to customer demands (Womack, Jones, & Ross, The Machine That Changed the
World, 1991). Table 1 shows the difference between organizations that have
implemented a Lean culture versus a Traditional culture.
Traditional Culture Lean Culture
Functional Silos Interdisciplinary Teams
Managers direct Managers teach
Blame staff Blame process
Rewards individuals Rewards group sharing
Internal focus Customer focus
Expert driven Process driven
Volume lowers cost Removing waste lowers cost
Guard information Share information
Supplier is enemy Supplier is ally
Table 1: Traditional Culture versus Lean Culture (Miller, 2005)

3
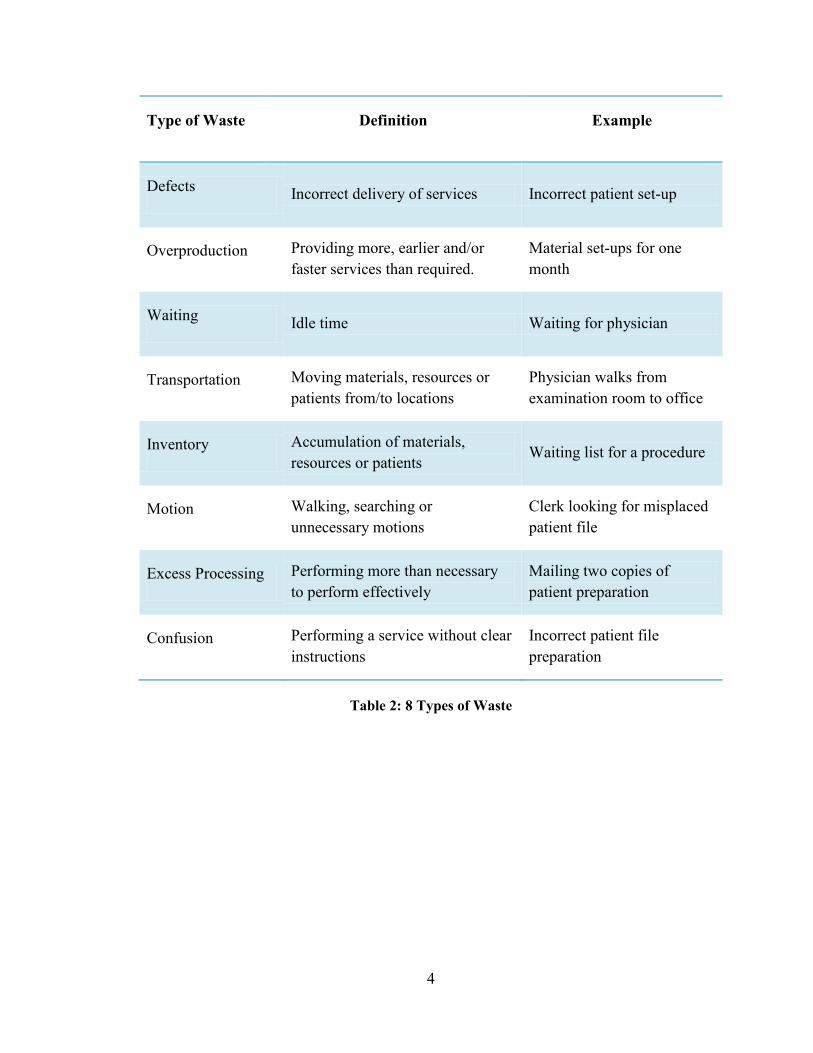
1.2 “Waste” in Lean
According to Lean methodology there are three types of activities: value added activities,
necessary non-value added activities and unnecessary non-value added activities. Value
added activities bring additional value to a procedure or a service; Patients consider these
as the activities that change the form, fit or function of a product or service. Necessary
non-value added activities are those ones that do not change or add anything to the
product or service but they are absolutely necessary in the system, for example, waiting
after a short scope procedure to assure there are no complications. Finally, unnecessary
non-value added activities are those ones that do not change or add anything to the
product or service and can be eliminated without affecting the health and safety of the
patient. Both the necessary and unnecessary non-value added activities are considered
“waste” in Lean methodology; efforts to reduce or eliminate non-value added activities
are the key to improve the system’s flow.
Table 2 represents the 8 types of waste according to Lean Healthcare.
4
Type of Waste Definition Example
Defects Incorrect delivery of services Incorrect patient set-up
Overproduction Providing more, earlier and/or
faster services than required.
Material set-ups for one
month
Waiting Idle time Waiting for physician
Transportation Moving materials, resources or
patients from/to locations
Physician walks from
examination room to office
Inventory Accumulation of materials,
resources or patients Waiting list for a procedure
Motion Walking, searching or
unnecessary motions
Clerk looking for misplaced
patient file
Excess Processing Performing more than necessary
to perform effectively
Mailing two copies of
patient preparation
Confusion Performing a service without clear
instructions
Incorrect patient file
preparation
Table 2: 8 Types of Waste

5
1.3 Background of Montreal General Hospital
The McGill University Health Centre (MUHC), located in Montreal, comprises of five
teaching hospitals united with the Faculty of Medicine of McGill University, and
consistently involves clinical and research specialists from around the world to create
new knowledge and prepare the next generation of medical professionals.
The Montreal General Hospital (MGH), part of the MUHC, was established due to a
rapid climb in population in the early 19th
century in Montreal. As the population grew by
5,000 people in 1816, it motivated stakeholders that the previous existing “Hôtel Dieu”
and “Hôpital Général de Montréal” were not prepared nor equipped to accommodate this
increase change in population. With this in mind, the Montreal General Hospital was
founded and as the time passed, it grew in both size and scope. The MGH soon expanded
by acquiring nearby buildings and lots until it reached its present size becoming one of
the most important hospitals in the province of Quebec (About our hospital, 2009).
Figure 1 illustrates the Montreal General Hospital site in 1874 and as of today.
Figure 1: (a) Montreal General Hospital in 1874 (Unknown); (b) Montreal General Hospital
today (McGill University, 2011)

6
Currently, the Montreal General Hospital consists of more than 180 departments and
clinics. It consists of 417 beds, 275 resident staff and 925 volunteers. There are
approximately 15,000 admissions and 350,000 consultations per year in the emergency
and outpatient departments (McGuill University Health Centre, 2012). In addition, a
research center was opened on the hospital grounds in 1973 and has been expanding
throughout the years.
1.4 Background of Colorectal Department
In April 2011, the head specialist of the colorectal department at the Montreal General
Hospital placed a request to evaluate the current conditions of the department. This
request was the result of a series of observations and complaints from patients and staff
about the long waiting times to accept any type of care. Furthermore, waiting lists were
growing despite the efforts to reduce no show patients, book appointments faster and
develop better ways to process documentation.
Currently, the department consists of three colorectal specialists, one technician, one
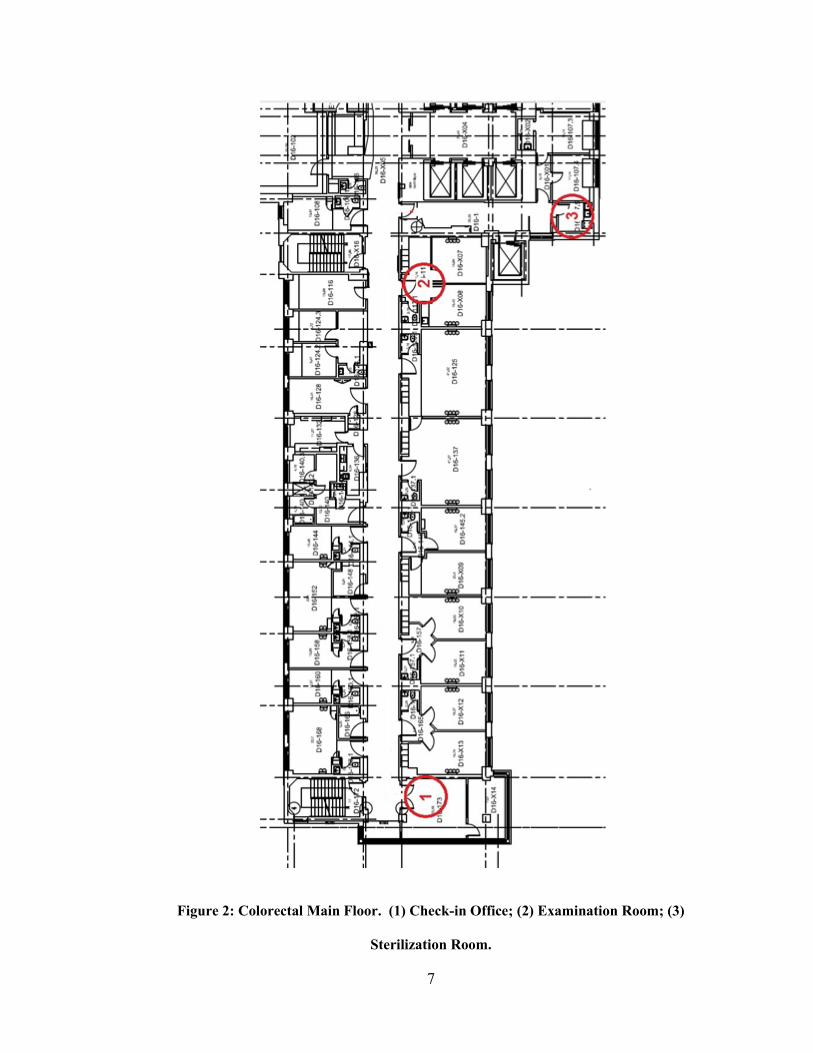
assistant technician, two clerks and one medical secretary. In terms of facilities, the
department operates in different locations spread over two floors of the hospital. The
check-in office, sterilization room and the examination room are located in the same floor
but not next to each other (See Figure 2). The colonoscopy room is on another floor
isolated from the rest of the department and it is shared two out of five days of the
business week with the gastroenterology department.
7
Figure 2: Colorectal Main Floor. (1) Check-in Office; (2) Examination Room; (3)
Sterilization Room.

8
Formerly, the department tried to relocate the premises in a location where every office
could be next to each other, however, due to economic difficulties and the priority in
other projects this could not be possible. In another attempt to improve current
conditions, the department also applied for the allocation of a full time worker to alleviate
some of the workload of the clerks, this was not possible due to the lack of budget in the
department for the coming years. On the positive side, the department will soon benefit
from the acquisition of a fourth colorectal specialist that will absorb a great number of
patients placed in the waiting list. However, this translates into an increase of
appointments to book, calls to be done and potentially an increase of every administrative
task performed in the department. Therefore, the department is facing a big challenge in
the near future and the system is currently not prepared to cope with it.
1.5 Why Quebec needs Lean in healthcare
In 2012-13, Quebec’s healthcare sector represents 42.5% of the total spending budget
(Figure 3), an increase of 3.4% from last year. This should represent the urgency to
improve every healthcare system in the province and the priority to do so. For example,
by managing more efficiently the amount of patients that go through a department and
utilizing fewer resources per patient, we can reduce the unit cost per patient and process
more patients per unit time (Kim, Spahlinger, Jeanne, & Billi, 2006). This will potentially
benefit the utilization of government’s budget allocated to healthcare.

9
Figure 3: Quebec's budget plan 2012-13 (Institut de la statistique du quebec, 2012)
Cost escalation is not only at a provincial level, the Canadian Institute for Health
Information published the national health expenditure trends from 1975 to 2011 (Figure
4) where it shows a positive trend since 1996. Therefore, efforts to increase efficiency is
not an option, it is a necessity that will determine the future of healthcare delivery.
Figure 4: National Health Expenditure Trends, 1975 to 2011 (Canadian Institute for Health
Information (CIHI), 2011)
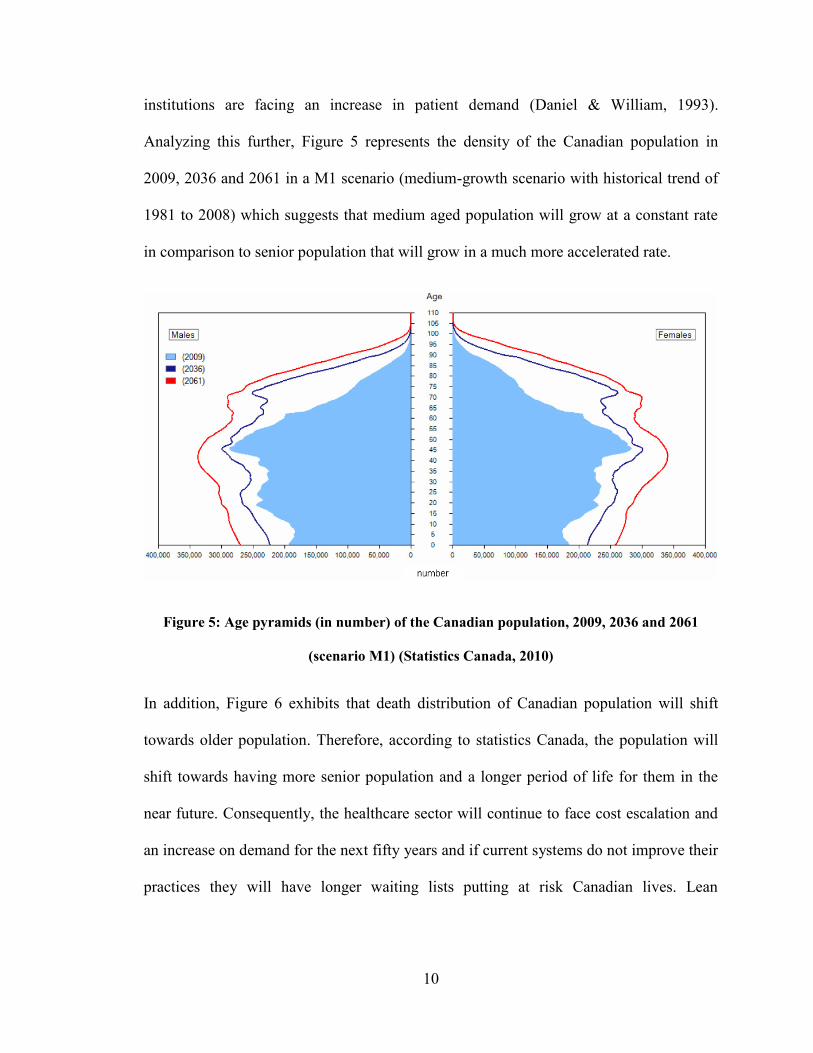
As well, the healthcare industry in Canada is facing another major problem, an increase
in patient requests for care. As patient population gets older, the need for healthcare
services increases, doing so, the demand for services in hospitals, clinics and other
10
institutions are facing an increase in patient demand (Daniel & William, 1993).
Analyzing this further, Figure 5 represents the density of the Canadian population in
2009, 2036 and 2061 in a M1 scenario (medium-growth scenario with historical trend of
1981 to 2008) which suggests that medium aged population will grow at a constant rate
in comparison to senior population that will grow in a much more accelerated rate.
Figure 5: Age pyramids (in number) of the Canadian population, 2009, 2036 and 2061
(scenario M1) (Statistics Canada, 2010)
In addition, Figure 6 exhibits that death distribution of Canadian population will shift
towards older population. Therefore, according to statistics Canada, the population will
shift towards having more senior population and a longer period of life for them in the
near future. Consequently, the healthcare sector will continue to face cost escalation and
an increase on demand for the next fifty years and if current systems do not improve their
practices they will have longer waiting lists putting at risk Canadian lives. Lean

11
healthcare has the capabilities to create efficient and flexible systems to adapt to this new
situation and provide Canadian society with a better healthcare system experience.
Figure 6: Deaths pyramids (in relative value) of the Canadian population, 2009/2010,
2035/2036 and 2060/2061 (scenario M1) (Statistics Canada, 2010)
Lean healthcare has proven that it can work and can improve the way care is delivered.
For example, a chain of pilot projects have been deployed to test the effects of lean at a
community medical center in Missoula, Montana. Early results show a reduction of
turnaround time for pathology reports from the anatomical pathology lab from five to two
days and a reduction of medication order to treatment initiation from 4 hours to 12
minutes (Jimmerson, Weber, & Sobek, 2005). Also, in Pittsburgh, Pennsylvania, a group
of hospitals have implemented lean concepts and methodologies to minimize the risk of
developing central catheter-related bloodstream infections. Several of these hospitals
have been able to cut the incidence of central line infections by 50%-90% through
implementation of lean production methods (Spear, 2005). As has been noted, Lean

12
healthcare is capable to improve care delivery and it is applied throughout this research as
the principles to follow.
1.6 Objectives
The purpose of this research is to develop an improved colorectal department service
operation for the Montreal General Hospital addressing the specific problems and
challenges in this particular case. The proposed system focuses efforts on reducing
different sources of waste (Section 1.2), increasing capacity, reducing rework, improving
staff workloads and reducing the lead time of the services provided by the department.
Like Bill Douglas, CFO of Riverside Medical Center, said: “Lean is a quality initiative,
isn’t a cost cutting initiative. But the end result is, if you improve your quality, costs will
go down”. Therefore, by implementing the proposed system, the unit cost for a specific
service can be reduced substantially (Figure 7).
Figure 7: Throughput plus Lead Time impact on Unit Cost
The department is a critical part of a much greater plan for this hospital. If the department
adopts this methodology and implements the proposed system, it could impact many
other departments to start this journey towards a more efficient delivery of care.
Therefore, it is a main objective of this research to influence other departments and
motivate them to start their journey to achieve a Lean system.
13
2 Literature Review
Lean methodology literature is abundant in the engineering field, from manufacturing to
healthcare systems. Organizations have implemented this methodology due to the great
flexibility of adaptation and the results obtained by large corporations, therefore,
attracting others to join in the same journey. However, as with any methodology there are
papers suggesting potential disadvantages of this methodology that need to be considered
before adopting in any environment.
The supporting literature is a collection of recent published papers that define powerful
concepts that aided the analysis and solution generation of this research. Finally, the last
section summarizes and links the literature considered to form part of the body of
knowledge to carry out the project.
The objective of this chapter is to highlight recent research when implementing these
manufacturing concepts in the healthcare industry. In addition, this literature has been
referred to compare similarities and differences between previous work done in other
institutions and what type of adaptation can be performed to apply certain tools and
techniques to improve the quality of this research paper.
2.1 Supporting Literature
Piggott et al. (2011) described the journey taken in Manitoba to achieve excellent
emergency cardiac care with Lean principles. The team challenged the misconception
that Lean methodology would not address the problems in the emergency department for
this specific diagnosis due to the complexity of the condition. However, with the
application of workloads analysis, waste elimination efforts and a medical support team

14
on-site, the project achieved an increase of 37.4% completed triaged patients within ten
minutes and an increase of 12.1% on patients seen within 60 minutes by a physician.
These results were achieved by implementing only a few modules of Lean methodology
and currently are working on expanding this project into an institution level approach.
Kim et al. (2006) stated that Lean principles deliver high quality level of care and with
the proper adaptation to the healthcare environment; this can provide a more efficient
delivery system that will adapt to the present operation requirements to satisfy patient
demand. In addition, value stream mapping techniques are referred as the tools to analyse
the system’s flow of patients in order to increase throughput with the same amount of
resources. However, the author makes note that the healthcare industry is formed by a
scientific community and more research should be performed in this field before adopting
this model at a large scale.
Heenan and Higgins (2009) talk about the importance of getting physician leaders
involved in improvement projects. They stated that engaging physicians provide a
valuable input when generating improvement scenarios. The key for success of a
healthcare project lays on the engagement of the staff, in specific physicians, since the
beginning of the project. This theory also proposes the involvement of highly trained staff
due to their insights on the processes and their capability to create new scenarios without
jeopardizing potential constraints an outsider can neglect.
Mann (2005) refers to Lean as a combination of twenty percent tools implementation and
eighty percent changing leaders’ practices and behaviors. He states that senior
management has the control to enable the success of a project by involving themselves in
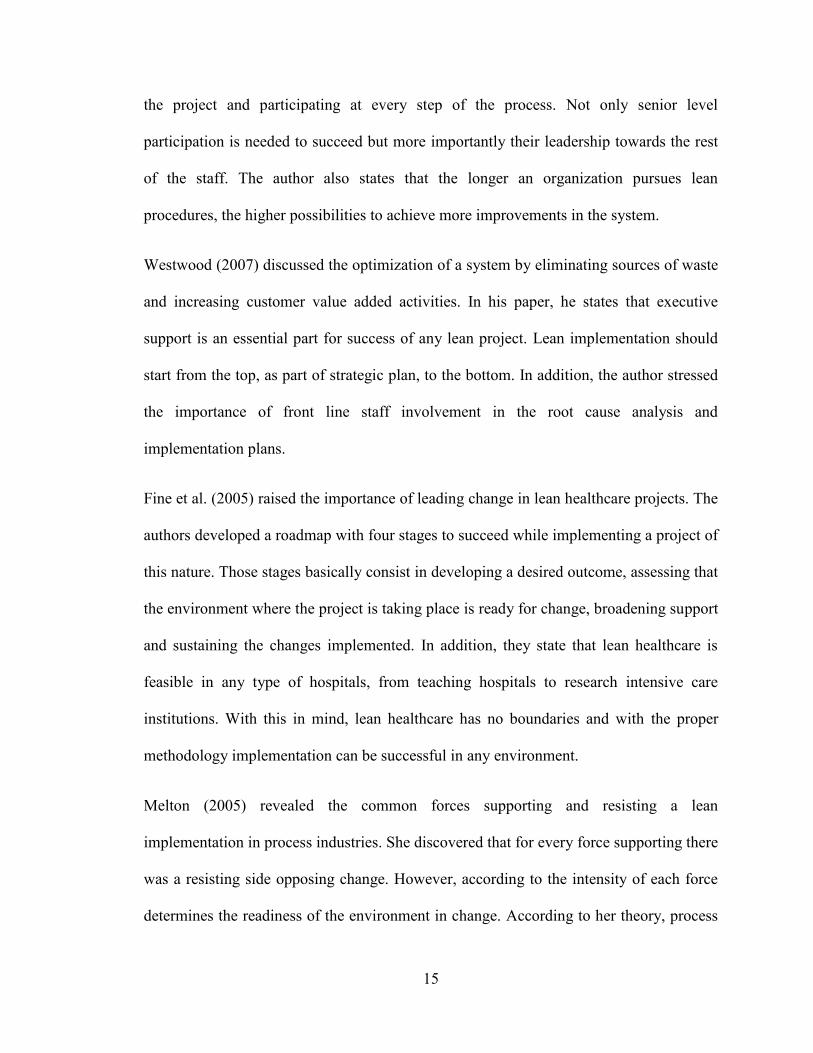
15
the project and participating at every step of the process. Not only senior level
participation is needed to succeed but more importantly their leadership towards the rest
of the staff. The author also states that the longer an organization pursues lean
procedures, the higher possibilities to achieve more improvements in the system.
Westwood (2007) discussed the optimization of a system by eliminating sources of waste
and increasing customer value added activities. In his paper, he states that executive
support is an essential part for success of any lean project. Lean implementation should
start from the top, as part of strategic plan, to the bottom. In addition, the author stressed
the importance of front line staff involvement in the root cause analysis and
implementation plans.
Fine et al. (2005) raised the importance of leading change in lean healthcare projects. The
authors developed a roadmap with four stages to succeed while implementing a project of
this nature. Those stages basically consist in developing a desired outcome, assessing that
the environment where the project is taking place is ready for change, broadening support
and sustaining the changes implemented. In addition, they state that lean healthcare is
feasible in any type of hospitals, from teaching hospitals to research intensive care
institutions. With this in mind, lean healthcare has no boundaries and with the proper
methodology implementation can be successful in any environment.
Melton (2005) revealed the common forces supporting and resisting a lean
implementation in process industries. She discovered that for every force supporting there
was a resisting side opposing change. However, according to the intensity of each force
determines the readiness of the environment in change. According to her theory, process
16
industries future success relies in the adoption of flexible and responsive systems. For
healthcare, this statement not only determines the success of the hospital in question but
the delivery of care throughout a country.
Erenay (2010) recognized the importance of process improvement in the colorectal
departments in the healthcare industry. He states that colorectal cancer is the second
deadliest and the fourth most common cancer, and the risk can be significantly reduced
by periodic colonoscopy procedures. However, her paper focuses on optimizing the
screening procedures in order to triage colorectal patients more efficiently. This paper
assumes that the screening procedure is the number one priority in order to improve the
system, but this has not been proved in the study. Nevertheless, the Markov decision
process recommended in Erenay’s paper is promising and can be adapted to any other
institution.
Kamma (2010), presents in a paper the importance of lean techniques in the healthcare
environment. The paper states that there is a lack of implementation documentation and
the methodology to analyse a specific department in healthcare with value stream
mapping tools. Therefore, there is the need to provide a case study that implements a
strong methodology from beginning to end using value stream mapping tools and
producing improvement efforts based on Lean principles.
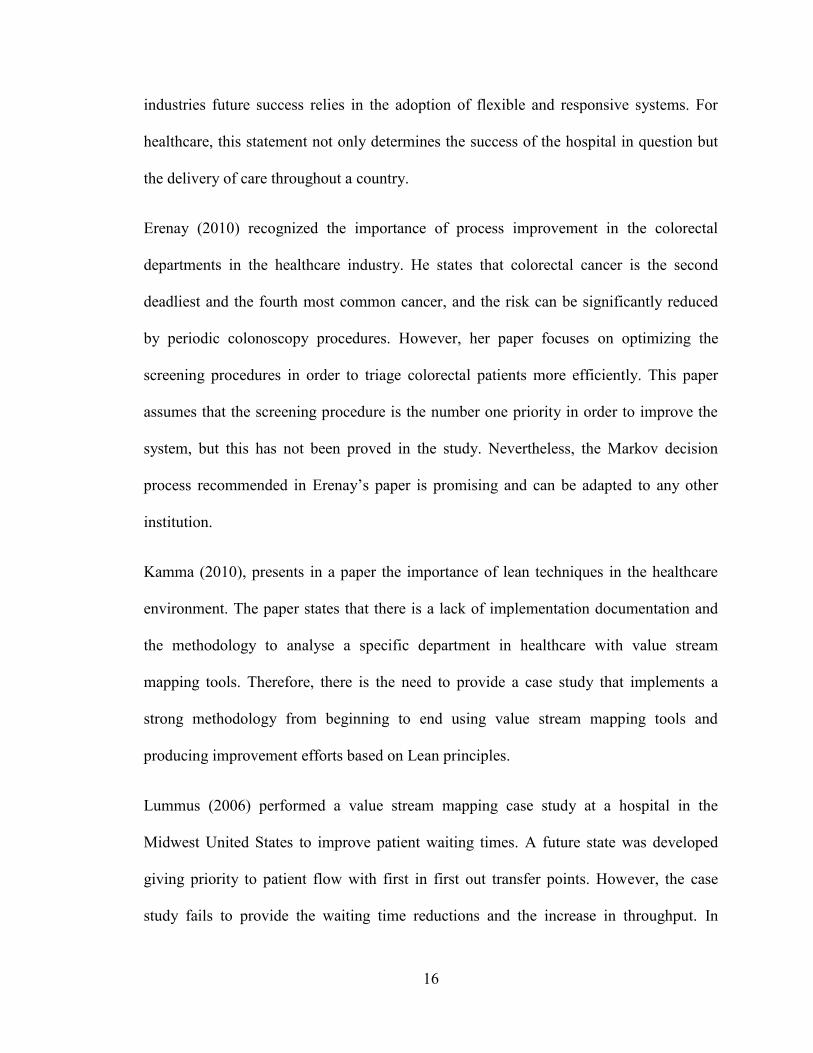
Lummus (2006) performed a value stream mapping case study at a hospital in the
Midwest United States to improve patient waiting times. A future state was developed
giving priority to patient flow with first in first out transfer points. However, the case
study fails to provide the waiting time reductions and the increase in throughput. In
17
addition, the study suggests the importance of educating the staff involved in patient flow
and improvement techniques to have a successful implementation.
Brideau (2004) suggests: “In order that caregivers vary intelligently from one patient to
another, first the unwanted variation should be removed from the process”. This
publication states the importance of patient flow in the healthcare environment and the
challenge that represents due to the nature of the work perform in a healthcare facility.
Brideau establishes that by improving patient flow and reducing the variation of personal
procedures, the system can greatly benefit. He proposes to standardize practices within
procedures to reduce processing time variations and be able to better predict and plan
according to patient demand.
Winch (2009) discusses the adoption of manufacturing practices, in specific lean
principles, into the everyday tasks and processes in hospitals. The author findings show
that re-engineering health care delivery with lean concepts has a significant increase in
performance, efficiency and quality. However, it is stated that there are potential harms
on patient’s safety that researchers have not explored due to the lack of historical data.
Lean research in healthcare is considered fairly new and the need for additional case
studies and research in this area is needed. Therefore, this thesis contributes to the lack of
structured studies performed in the healthcare industry and provides detail information
about different stages of the implementation process.
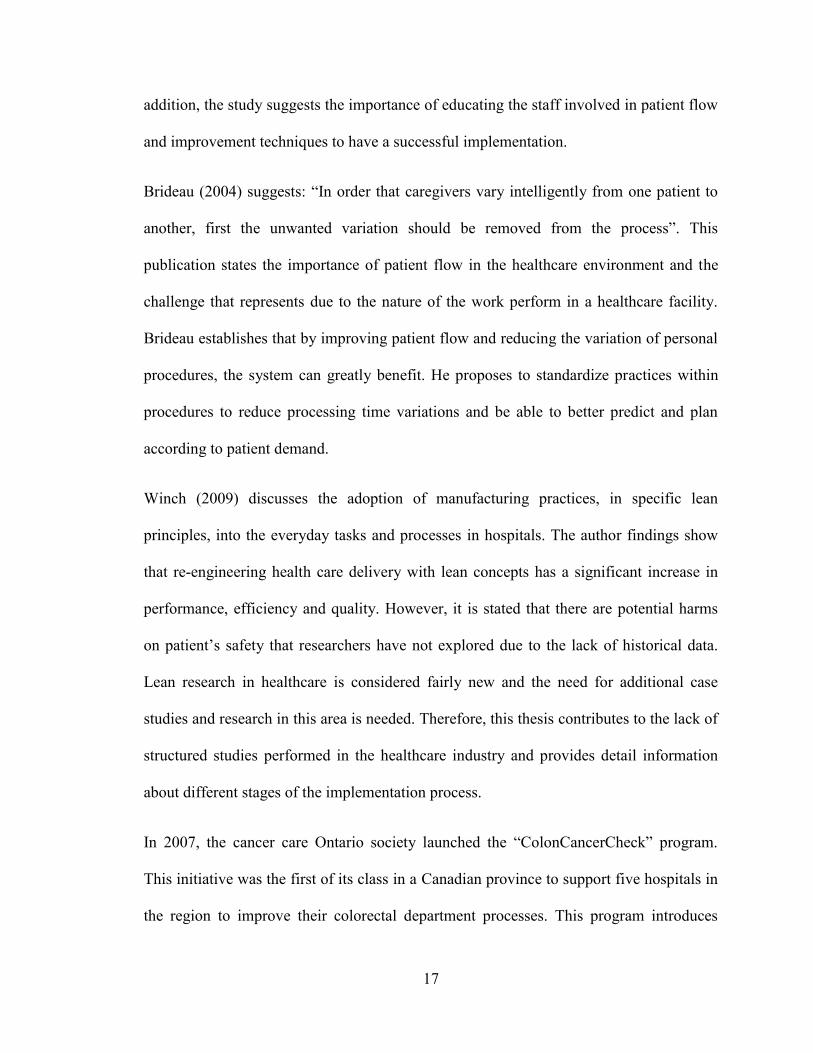
In 2007, the cancer care Ontario society launched the “ColonCancerCheck” program.
This initiative was the first of its class in a Canadian province to support five hospitals in
the region to improve their colorectal department processes. This program introduces

18
Lean concepts to evaluate the performance of each of the five hospitals involved. These
tools are described in detail and forms are provided to document the milestones, data
collection and performance metrics. In contrast, Quebec healthcare associations have not
adopted any of these methodologies and efforts for processes improvements have not
been published nor rewarded (Ontarion Ministry of Health and Long-Term Care, 2007).
As reviewed, there is an abundant amount of literature that has documented the success
of Lean methodology and its tools. However, there is not enough documentation that
outlines how to perform value stream analysis and implementation of optimization
techniques in the healthcare environment in great detail. For the purposes of this thesis, a
collection of different tools and approaches have been adopted. This specific combination
of concepts has not yet been implemented in any colorectal department in Canada. These
concepts include the involvement of physicians in the project, leading change techniques
for success implementation, recognition of the supporting and opposing forces in the
implementation environment, identifying sources of waste in a healthcare scenario, A3
methodology and Lean principles. Recognizing the importance of this project could
impact the second most deadly type of cancer in North America. Therefore, the
methodology provided by this thesis is considered could potentially become a standard to
follow in the healthcare industry to carry continuous improvement projects.

19
3 Methodology
The project was carried according to Lean principles and A3 methodology. Lean
principles (Womack & Jones, Lean Thinking: Banish Waste and Create Wealth in your
Corporation, 2003) were used to map the course of action to follow and potential areas of
improvement. However, the A3 methodology (Baker, Taylor, & Mitchell, 2009) defined
the skeleton of this project; the colorectal department staff participated in the completion
of the template shown in Appendix D with the researcher guidance and leadership. Both
Lean principles and A3 methodology are explained in further detail in the following
sections.
3.1 Lean Principles
Lean principles were used throughout the A3 methodology implementation to develop
the analysis of the department and create the proposed system. The five principles are:
Define value, map value stream, create flow, establish pull, and pursuit perfection (See
Figure 8).
Figure 8: Lean Principles
Define Value
Map Value Stream
Create Flow Establish Pull
Pursuit Perfection
20
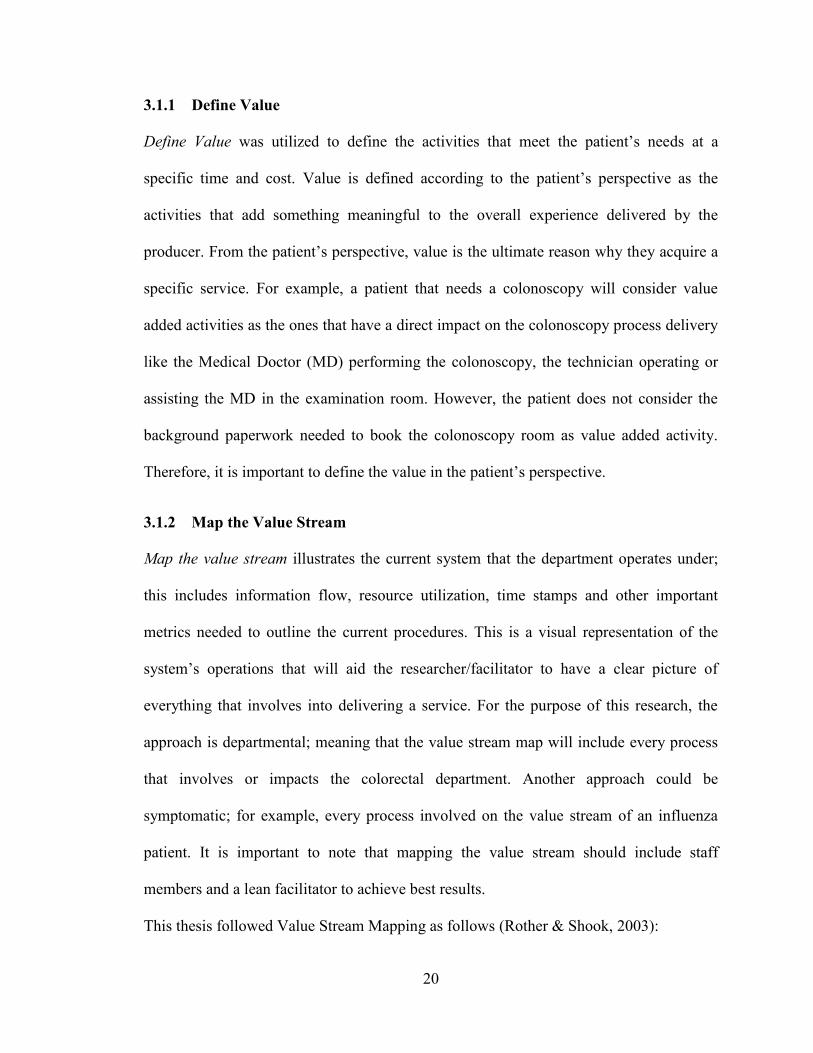
3.1.1 Define Value
Define Value was utilized to define the activities that meet the patient’s needs at a
specific time and cost. Value is defined according to the patient’s perspective as the
activities that add something meaningful to the overall experience delivered by the
producer. From the patient’s perspective, value is the ultimate reason why they acquire a
specific service. For example, a patient that needs a colonoscopy will consider value
added activities as the ones that have a direct impact on the colonoscopy process delivery
like the Medical Doctor (MD) performing the colonoscopy, the technician operating or
assisting the MD in the examination room. However, the patient does not consider the
background paperwork needed to book the colonoscopy room as value added activity.
Therefore, it is important to define the value in the patient’s perspective.
3.1.2 Map the Value Stream
Map the value stream illustrates the current system that the department operates under;
this includes information flow, resource utilization, time stamps and other important
metrics needed to outline the current procedures. This is a visual representation of the
system’s operations that will aid the researcher/facilitator to have a clear picture of
everything that involves into delivering a service. For the purpose of this research, the
approach is departmental; meaning that the value stream map will include every process
that involves or impacts the colorectal department. Another approach could be
symptomatic; for example, every process involved on the value stream of an influenza
patient. It is important to note that mapping the value stream should include staff
members and a lean facilitator to achieve best results.
This thesis followed Value Stream Mapping as follows (Rother & Shook, 2003):
21
1. Identify the “patient family” to analyze; a “patient family” is a group of a specific
type of patients that go through similar processing steps in the value stream.
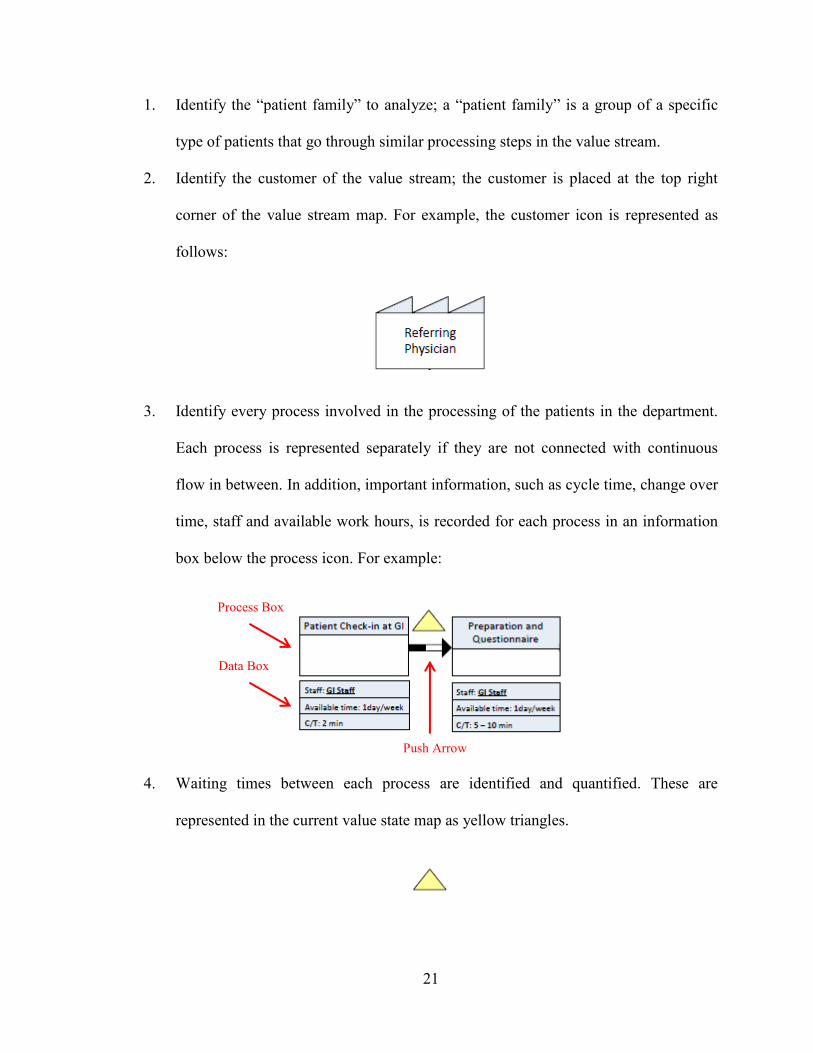
2. Identify the customer of the value stream; the customer is placed at the top right
corner of the value stream map. For example, the customer icon is represented as
follows:
3. Identify every process involved in the processing of the patients in the department.
Each process is represented separately if they are not connected with continuous
flow in between. In addition, important information, such as cycle time, change over
time, staff and available work hours, is recorded for each process in an information
box below the process icon. For example:
4. Waiting times between each process are identified and quantified. These are
represented in the current value state map as yellow triangles.
Process Box
Push Arrow
Data Box

22
5. The source of demand is identified and placed in the top left corner of the map. This
determines where the specific demand of the value stream services comes from. The
icon is the same as for the customer, for example:
6. The next step is to add the information and patient flow to the map. The method of
communication between each process and the type of patient transfers between
processes; for example first in first out, last in last out, push or pull. For example:
7. The last part of the map is the timeline. At the bottom of the map, a timeline is
placed containing two types of information, waiting times (represented in a higher
step) and lead time for each process (represented in a lower step of the timeline).
Note that “LT” is total lead time and “VA” is value added time. For example:
3.1.3 Create Continuous Flow
Create continuous flow focused in the customization of a proposed system where patient
flow interruptions were eliminated without jeopardizing the health and safety of patients
and considering the restrictions and constraints of the project. Flow is considered a major

23
part of lean principles, in an ideal situation the patient will go through the department’s
operations without stopping in between, however, in a realistic scenario this cannot be
achieved 100%. Several factors affect flow in a value stream: resources available, sharing
of resources, facility layout, necessary waiting times due to health and safety and many
others. However, whenever continuous flow can be achieved, efforts to attain this
scenario should be implemented.
3.1.4 Establish Pull
Establish pull, developed different techniques to have a controlled inventory levels
(patient waiting times) on those activities where continuous flow of patients in the system
could not be achieved. For example, if the department has only two resources available
and there is a demand of three patients, one patient has no choice but to wait until one of
the resources is available to process him/her.
In addition, the pull principle states that in cases where continuous flow is not achievable,
a controlled queue can be developed and the interaction between processes should be
controlled by the following process. For example, consider that the resource one and two
are one after another and that resource one is faster than resource two, resource one
should not start processing a patient until resource two calls for one. This prevents an
uncontrollable accumulation of patients between processes.
3.1.5 Pursue Perfection
Pursue perfection is an ongoing activity that reinforces the importance of continuous
reiteration of efforts to improve the operations of the department. Hence, these principles
are considered the antidote for systems where different sources of waste, or activities that
do not add value to the service being provided, prevent the department from operating

24
efficiently (Womack & Jones, Lean Thinking: Banish Waste and Create Wealth in your
Corporation, 2003).
3.2 A3 Methodology
The A3 methodology consists of seven different sections: Develop title of the project,
Identify the problem, current condition, target condition, root cause analysis, proposed
countermeasures, plan and follow-up. In complement, this thesis methodology utilizes the
five Lean principles mentioned previously throughout the process.
3.2.1 Title of the Project
Developing the title of the project focuses on the problem and not on the particular
solution, for example, “Rework in CT-Scans resulting in longer patient waiting times”
instead of “Requests calls produced due to lack of technology system update”.
3.2.2 Identify the Problem
Identifying the problem consists of a consolidated effort form the department’s staff to
identify the true problem currently faced. The key to identify the true problem is to
determine the issue that causes other ones. This is a very important phase that points to
the direction to follow.
3.2.3 Current Condition
The current condition section is the most important part of this methodology. In this
section, a current value stream map of the department was generated including processes,
information channels and staff allocation; the process mapping was developed according
to best practices in Value Stream Mapping previously discussed in section 3.1.2.

25
3.2.4 Target Condition
The next section of the A3 methodology, the target condition, includes certain metrics to
concentrate and targets to try to achieve after the study is implemented (managerial and
floor staff were included in this section of the methodology).
3.2.5 Root Cause Analysis
Next, the root cause analysis section consists of the understanding of the problem that
was causing several effects in the system. This result was obtained through a series of
one-to-one interviews with the department’s staff to successfully complete this stage and
the analysis of the current value stream map previously developed and by identifying
different sources of waste according to Lean methodology.
3.2.6 Proposed Countermeasures
The next section proposes countermeasures by developing a future value stream map
according to lean best practices to improve the system’s efficiency and achieve the target
condition previously set. To develop the future value stream map, the following steps
were followed:
1. Identify and eliminate sources of waste in the current operations. For each loop of
the system flow, different sources of waste need to be identified and have their
impact measured in the department’s performance. These sources of waste fall
under the categories previously discussed and provided in Appendix A. Once they
are identified, the department needs to propose solutions to eliminate or reduce
these waste activities in order to achieve the proposed future value stream map.

26
2. Create continuous flow where possible. Identify the opportunity to combine
and/or eliminate a process box in the system’s flow. This will avoid the
accumulation of patients in between processes, improve the flow and lower the
lead time.
3. Create pull when continuous flow is not possible. If a process box cannot be
eliminated or combined with another one, create pull. Pull is when the subsequent
process box pulls patients from the previous process box. There are different
reasons for continuous flow to be infeasible, the process box represents a task that
takes place in a different physical location than the previous one, the resources
involved in the processing of a patient are shared, available hours are different in
each process, and many other particular reasons that can apply to a specific
situation.
4. Calculate takt time (Time per unit to process a patient in order to meet demand).
For each loop, takt time is calculated and will determine the “heartbeat” of the
system. In an ideal scenario, every process box will have a cycle time of value
equal to takt time. To achieve takt time, resources need to be allocated to the
correct process box. For example, if there is two clerks available for a process “x”
that takes half the value of takt time, we can relocate one resource to process “y”
that is performing above takt value and meet takt value with one resource only in
process “x”.
It is important to note that the future value stream map was developed with the same
format as the current value stream map and illustrates the potential system according to
lean principles.
27
3.2.7 Plan and Follow-up
The last section developed a plan with the necessary changes in detail in order to achieve
the proposed system. These changes were developed as a result of the previous sections
of the A3 methodology in order to optimize efforts and have a greater impact on the
performance indicators that benefit the colorectal department the most.
In addition, a set of future follow-ups is suggested to keep improving the current
practices and achieve better process performance. It is important to note that Lean
transformations are iterative and the cooperation of the staff to develop new solutions and
improve current operations is the key to their success. An example of an A3 template is
provided in Appendix D.
The following table shows a graphical summary of the methodology followed with A3
and Lean principles together.

28
Figure 9: Thesis Methodology Map
Title
Problem Definition
Define Value
Current Condition Map the Value
Stream
Target Condition
Root Cause Analysis
Identify Waste
Proposed Countermeasures
Create Continuous
Flow Establish Pull
Future Value Stream Map
Plan Necessary
Improvements
Follow up Pursue
Perfection

29
4 Case Analysis
The study took place in the Montreal General Hospital at the colorectal department from
the time the patient places a request until the patient is discharged from the department
with a complete diagnosis and/or the subsequent stage. Furthermore, the department staff
consisted of three colorectal specialists, one technician, one assistant technician, two
clerks and one medical secretary. This team participated in the process analysis and
contributed as an expert consultant in the medical field aspect of this thesis.
The analysis was organized by splitting the department’s operations in three sections:
short procedures, surgery and colonoscopy patient flow. The first section, short procedure
patient flow, consists of those activities related to the short procedures offered in the
department, from the time the request is place until the final instructions are given to the
referring physician. It is important to note that this is also considered the common flow
stream. The second section, surgery patient flow, includes the common flow stream and
the flow of the patient from the time a surgery appointment is requested until the patient
is released from recuperation ward. The last section, colonoscopy patient flow, includes
the common flow stream and the flow of a patient from the time a colonoscopy
appointment is needed until the final results are released to the corresponding physician.
In addition, a complete current and future state map with all three flows are provided and
compared to account for the benefits of the proposed system in KPIs.
In terms of data collection, three sources were utilized; interviews, field data and
hospital’s databases. Interviews were conducted with every member of the department in
both one-to-one and group format. The objective of these interviews was to acquire

30
general knowledge of operation procedures and to consult medical experts to determine
limitations and restrictions of the study. Field data was collected live for a period of four
consecutive months; this data includes processing times, waiting times, staff workloads
and other key performance indicators (KPIs) that will be discussed in the following
sections. The last source of data collection were the two hospital’s databases; demand
history and other booking information were extracted out of these locations. In addition,
it is essential to highlight that quantitative information in this thesis was acquired only
from field data and hospital’s database in order to maintain objectivity and reduce the
alteration of behaviour by the subjects being observed (Hawthorne effect).
In this section, the colorectal department system is mapped and analyzed to further
understand the complete operations for any service provided to any patient. The scope of
the analysis starts at the time any patient places a request for a service, until the final
results are delivered to the corresponding physician or the patient needs to follow up in
which case it would return to the system. The analysis is separated in five sections,
problem definition, current condition, target condition, root cause analysis and potential
areas of improvement.
4.1 Problem Definition
The colorectal department is facing several challenges and with a constant increase of
request for services, operations have become more complicated. There are patients in the
waiting lists for over a year, work in progress has increased to a point where the staff
cannot keep up with the organization and frustration is taken over the department’s staff.
Therefore, a complete analysis of the department’s operation was needed and lean
analysis was selected as the methodology to follow.

31
There are several challenges that were considered for this project. First, the system is
very complex due to the fact that it is a speciality department. Second, the workforce is
not flexible, there is only a certain amount of physicians that can work at this location
and the acquisition or transfer of specialists is not an option. Third, colonoscopy
equipment and resources are shared with the GI department and they are located in
another floor of the hospital. Fourth, the facilities are scattered among the hospital so it
creates problem when booking appointments. Fifth, there is a professional zone that has
to be respected and specialist’s personal procedures cannot be tampered. Last, personnel
are not accustomed to change.
In addition, this research considers the following constraints for analysis and
recommendations:
Physical location of the department cannot be modified.
Patient health and safety is a priority in the healthcare environment. Any
recommendation that jeopardizes this will not be considered feasible.
Cancer patients have priority over others.
MD professional procedures cannot be modified. Improvements in this area have
to come from another MD.
Department is looking for cost effective solutions.
Patient and staff personal information cannot be disclosed in this research.
Key tasks of each staff level cannot be shifted to another member.
MD professionals are not available for overtime.
The addition of one MD specialists needs to be considered in countermeasures.
32
4.2 Current Condition
The colorectal department has been running operations at their best of their capabilities
with their current resources. The medical procedures and clerk organization standards are
considered one of the best in the province and are currently considered as a template to
follow for other healthcare institutions in their respective field. However, there have not
been any efforts for a complete system’s analysis where the department can learn to
improve their care delivery and resource utilization.
According to the A3 methodology and utilization of lean techniques, the current state
map was developed (Figure 10) according to the steps described in the methodology
section of this thesis. The purpose of this stage is to account for every process of the
system, information flow, resources and KPIs. This process involved the whole
department staff, representatives of departments that communicate with the colorectal
department and the support of managerial staff.
For analysis purposes, the department was divided in four different flow loops: Short
procedures or common flow (1), surgery flow (2), colonoscopy flow (3) and calling
centre flow (4). In the following subsections, each loop activities are described and KPIs
are accounted for each of the processes. However, improvements are proposed
considering that the department operates as a system and not every loop in isolation. In
addition, the proposed system is compared to the current one and a gap analysis was
performed to determine the necessary changes needed to accomplish the proposed
solution.

33
Figure 10: Colorectal Current Value Stream Map

34
4.2.1 Current Short Procedures Value Stream
The short procedures flow is the common stream for every patient that enters the system,
except those whose request is redirected to the corresponding department. A short
procedure is an activity performed to the patient that is considered a minor treatment and
do not require general anesthesia; for example, rubber band ligatures, colon biopsies and
Flexible Sigmoidoscopy (referred to as a short scope).
In this value stream, short procedure patients and colonoscopy or surgery patients have
the same processes to go through except in the middle of the stream. Short procedure
patients have an examination stage where the MD performs the necessary treatment while
the colonoscopy or surgery patients go through a “talk” where a short screening and
personal medical history are performed. The common flow CVSM (Current Value
Stream Map) is shown in Figure 11.
In order to better understand the system operations, an example is provided for short
procedures. To begin, a patient faxes a referral form with his physician notes and
requested procedures. Twice a day, one of the clerks reviews the referral form to look if it
is a cancer patient, in this case it is a patient that requires a short scope, hence the referral
is sent for triage. Once a week the medical secretary triages the referral and determines
whether it is an emergency case and the patient can be catalogued regular priority. After
six months, the patient receives a call from the colorectal department’s clerk to book an
appointment within one week to two months, for this example the appointment is booked
two weeks in advance. When the clerk books the appointment, he/she prints and mails
important information for the patient to follow and prepare for their procedure in a pre-
designed package and mails it to the patient’s address.

35
Figure 11: Current Short Procedure Value Stream Section

36
Two weeks after, the patient check-ins into the department, the clerk confirms patient’s
personal information, hospital card and updates the hospital and clinic chart. Then, the
patient waits in the waiting area between five to twenty minutes until they are called into
one of the two examination rooms for setup by the technician. After, the MD briefs the
patient about the procedure that he will perform; the technician needs to be present at the
time of a short scope to aid the MD according to current procedures. Once the procedure
is done, the technician brings the short scope to the sterilization room and loads the
machine to start the cleaning; these machines sterilize two short scopes at once so the
technician starts the washing cycle every two short scopes. At this point the patient is
released from the department and follow-up instructions are given by the clerk. The
patient will be contacted if another appointment is needed, in this case he will enter the
system again as a follow up. Meanwhile, the MD dictates the results obtained from the
procedure and important observations for further review are noted. This dictation is
transfer into a pre-design form two times a week and then it is sent to the referring
physician of the respective patient. In the end, the goal of the MD is to suggest a protocol
to follow and educate the patient to prevent complications or potential reoccurrence of
the problem.
A list of each process with resources available, cycle time, change over time and
available time to performed each type of activity for any short procedure is described as
follow (Each process box is extracted from Figure 12 and it is in the same order):

37
Process Description of activities
A referral form is submitted to the
department with the referring physician’s
signature and specific notes about the case.
Clerk sorts through them and extracts
emergency cases for fast processing.
Medical secretary receives the referrals and
determines the priority of each one of them
according to severity, type and specialist
requested by the referring physician.
A clerk calls the patient to schedule an
appointment for their respective request and
gives an overview of the steps to come.
An appointment confirmation form is sent
to the patient with specific instructions on
the needed preparation at home and
documentation needed for their appointment
day.

38
Patient’s hospital card is stamped in their
personal clinical and hospital chart and
missing information is given for record
keeping. Clinical charts are utilized in this
process.
The corresponding treatment is performed
and additional information is given for
follow ups. Clinical charts are utilized in
this process.
Results are dictated using a hand recording
device. The dictation includes patient
number, observations and course of action
given to the patient.
Transcription is performed by listening to
the recording with a headset and typing it in
a computer. Templates and shortcuts are
used to speed up transcription. This is an
outsourced staff process.
39
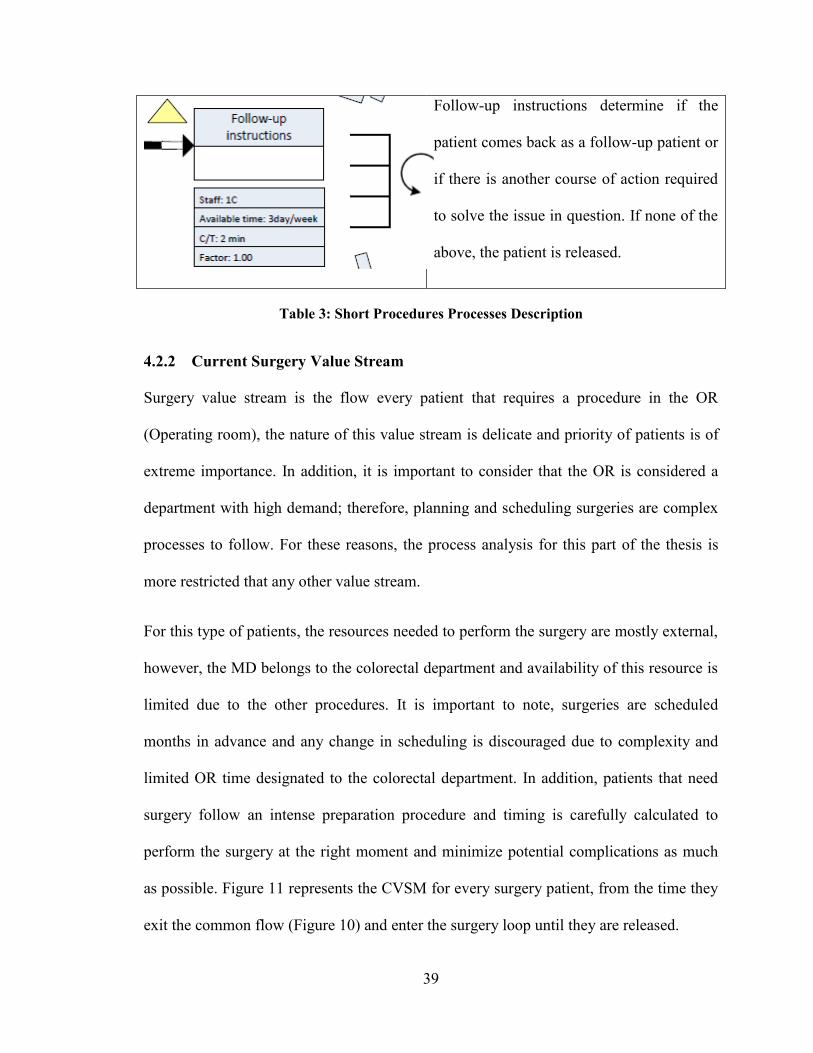
Follow-up instructions determine if the
patient comes back as a follow-up patient or
if there is another course of action required
to solve the issue in question. If none of the
above, the patient is released.
Table 3: Short Procedures Processes Description
4.2.2 Current Surgery Value Stream
Surgery value stream is the flow every patient that requires a procedure in the OR
(Operating room), the nature of this value stream is delicate and priority of patients is of
extreme importance. In addition, it is important to consider that the OR is considered a
department with high demand; therefore, planning and scheduling surgeries are complex
processes to follow. For these reasons, the process analysis for this part of the thesis is
more restricted that any other value stream.
For this type of patients, the resources needed to perform the surgery are mostly external,
however, the MD belongs to the colorectal department and availability of this resource is
limited due to the other procedures. It is important to note, surgeries are scheduled
months in advance and any change in scheduling is discouraged due to complexity and
limited OR time designated to the colorectal department. In addition, patients that need
surgery follow an intense preparation procedure and timing is carefully calculated to
perform the surgery at the right moment and minimize potential complications as much
as possible. Figure 11 represents the CVSM for every surgery patient, from the time they
exit the common flow (Figure 10) and enter the surgery loop until they are released.

40
Figure 12: Current Surgery Value Stream Section

41
In order to better understand the system operations, an example is provided for surgery
patients after they exit the common flow. First, the patient gets a consent form and a
questionnaire about their personal medical history, the clerk aids with potential questions
about filling in the form and if the questions are out of her reach the medical secretary
helps the patient clarify any confusion. Once the forms are filled, the medical secretary
brings it to the admissions department located in the first floor of the hospital. Third, the
medical secretary schedules and coordinates the pre-operation procedures needed for the
patient to prepare for their surgery; this could be blood tests, X-rays, CT-scans and many
others, which depends on each case. Between scheduling the necessary preparations and
booking an appointment, the patient can wait up to a year. Fourth, assuming the patient is
eligible for surgery, the medical secretary books an appointment with the patient through
the phone two weeks in advance. Fifth, surgery is performed by a colorectal MD surgeon
and external resources at the OR. At this point, the MD sends samples to the pathology
lab for further testing. Last, the patient receives post-surgery instructions and becomes
automatically a follow-up patient to the colorectal department. In the end, the patient will
fully recover at home with a special diet and set of medications. If any complications are
encountered during their recovery, the patient is admitted back to the hospital to
investigate the root of the problem.
A list of the processes with resources available, cycle time, change over time and
available time to performed each type of activity for any surgery is described below
(Each process box is extracted from Figure 12 and it is in the same order):
42
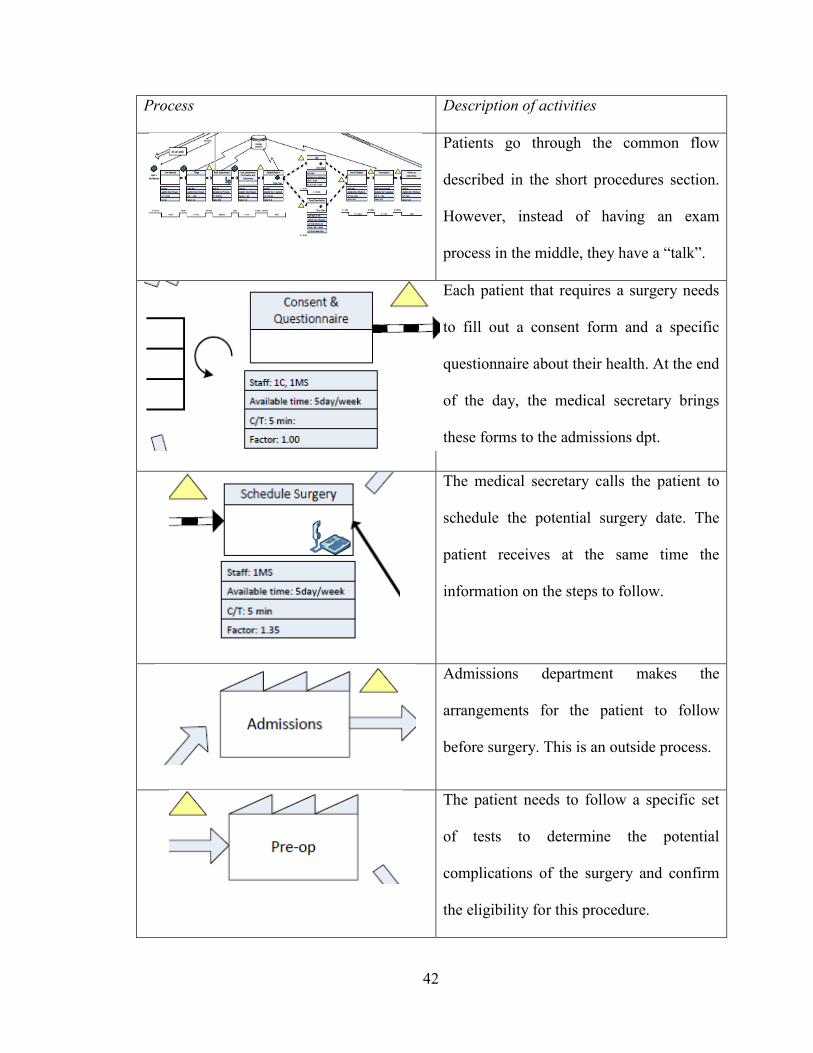
Process Description of activities
Patients go through the common flow
described in the short procedures section.
However, instead of having an exam
process in the middle, they have a “talk”.
Each patient that requires a surgery needs
to fill out a consent form and a specific
questionnaire about their health. At the end
of the day, the medical secretary brings
these forms to the admissions dpt.
The medical secretary calls the patient to
schedule the potential surgery date. The
patient receives at the same time the
information on the steps to follow.
Admissions department makes the
arrangements for the patient to follow
before surgery. This is an outside process.
The patient needs to follow a specific set
of tests to determine the potential
complications of the surgery and confirm
the eligibility for this procedure.

43
The medical secretary books a specific day
with the patient and the location of the
surgery. Final information is given to
assure the patient is fully aware of the
steps to come.
Surgery is performed at this stage.
External staff is utilized from other
departments and the only internal resource
used is the MD.
Samples from the surgery are sent to
pathology for analysis. This department is
external to the colorectal department.
The patient is given a program to follow
for recuperation and specific instructions
to book follow ups in the future.
The patient recuperates in the hospital
installations after the surgery until the MD
agrees to release him/her.

44
Every patient after the surgery flow
becomes a follow-up patient. Each patient
is unique and follow-up procedures vary
each case.
Table 4: Surgery Processes Description
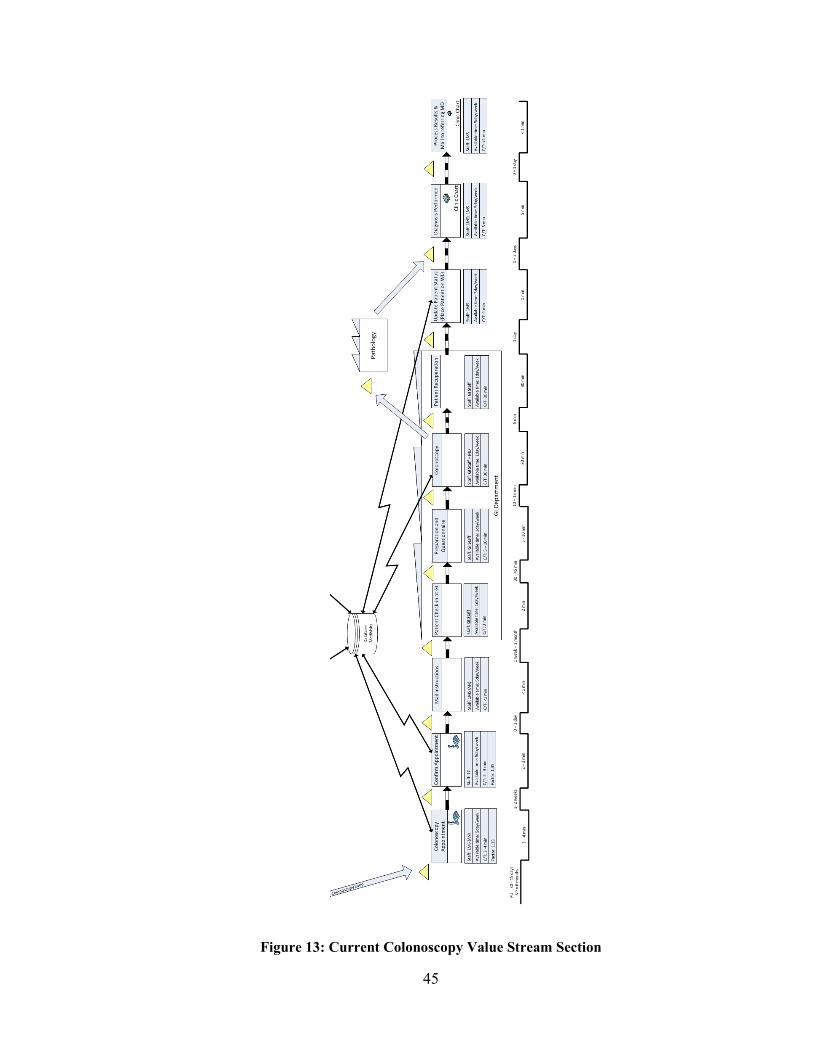
4.2.3 Current Colonoscopy Value Stream
The colonoscopy exam enables visual inspection of the entire large intestine. Compared
to other imaging procedures, colonoscopy’s main advantage is that it allows for
intervention, it allows to specialist to perform biopsies, remove polyps or cauterize
bleeding (Stein & Bonheur, 2012). This technique is widely used in colorectal cancer
patients, which constitute the second leading cause of cancer related deaths in Quebec
(Sante et Services sociaux Quebec, 2012). Therefore, efforts to improve this system flow
are a priority to the hospital and the province.
For the colonoscopy procedures, the GI department provides the staff to support the MD,
necessary equipment, supplies, physical location and clerks to check-in and check-out the
patient. However, the scheduling for each patient is done at the colorectal department.
Currently, MD specialists are working towards improving screening techniques to reduce
the amount of patients that are accepted for colonoscopy procedures. By doing this, the
waiting lists are expected to decrease and patients will be redirected to the appropriate
flow to follow. Figure 13 represents the CVSM for every colonoscopy patient, from the
time they exit the common flow (Figure 10) and enter the colonoscopy loop until they are
released.
45
Figure 13: Current Colonoscopy Value Stream Section

46
As in the previous patient types, an example is provided for colonoscopy patients to
clarify the process flow. Initially, the patient goes through the common flow section of
the system and waits approximately six months until the medical secretary contacts
him/her to book a colonoscopy appointment. Two weeks after, the patient receives
another call to confirm the appointment date and time. When the medical secretary
confirms the appointment, a package with all the instructions and medications needed for
preparation is mailed to the patient by regular mail. Two weeks later, the patient checks-
in at the GI department on the day of the colonoscopy. An average waiting time of 40
minutes is needed before a nurse admits the patient into a setup room. Then, the nurse
prepares the patient and goes through a series of questions to assure that the patient
performed the proper preparation and is eligible to go through a colonoscopy. Once this
is complete, the patient is admitted to the colonoscopy room where an MD spends 30
minutes performing the procedure. Afterwards, the patient is sent to a recuperation room
in the GI department for an hour, at which point the MD sends a sample from the
procedure to pathology for further testing and an initial assessment is printed in the
examination room. Finally, the patient is release with the signature of a family member
that assumes responsibility for transportation. The colorectal department then updates the
file of the patient for follow-up procedures and a final decision on the case is determined
and sent to the referring physician to collaborate and approve the protocol to follow.
A list of the processes with resources available, cycle time, change over time and
available time to perform each type of activity for any colonoscopy is shown as follow
(Each process box is extracted from Figure 13 and it is in the same order):
47
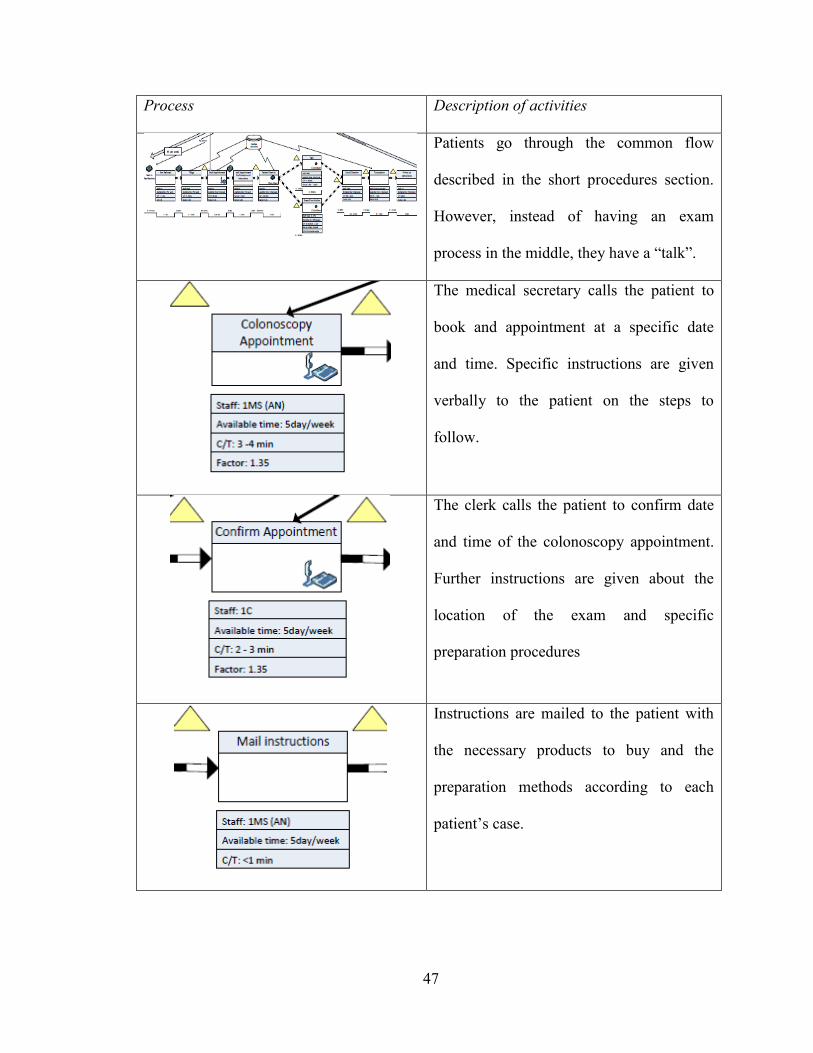
Process Description of activities
Patients go through the common flow
described in the short procedures section.
However, instead of having an exam
process in the middle, they have a “talk”.
The medical secretary calls the patient to
book and appointment at a specific date
and time. Specific instructions are given
verbally to the patient on the steps to
follow.
The clerk calls the patient to confirm date
and time of the colonoscopy appointment.
Further instructions are given about the
location of the exam and specific
preparation procedures
Instructions are mailed to the patient with
the necessary products to buy and the
preparation methods according to each
patient’s case.

48
Patient is admitted into the
gastroenterology department (GI). One GI
clerk is utilized in this process. In this
process, every resource is external to the
colorectal department.
The patient goes through a series of
questions and preparation for the
colonoscopy is performed by a GI nurse. In
this process, every resource is external to
the colorectal department.
Samples from the colonoscopy are sent to
pathology for analysis. This department is
external to the colorectal department.
Patient recuperates after the colonoscopy in
a recuperation area at the GI department.
The patient cannot be released until a
family member assumes responsibility for
transportation to their home.
The patient is placed in a waiting list by the
medical secretary in order to get a follow-
up appointment in a specific period of time.
Each case has a different timeline.

49
When pathology results are obtained, the
MD performs a diagnosis and course of
action to follow. Specific instructions are
given to the medical secretary to make the
necessary arrangements to deliver the
results to the patient or referring physician.
The medical secretary process the results
obtained from the MD and the findings and
course of action are mailed to the referring
physician for further review. Clinical charts
are utilized in this process.
Every patient after the colonoscopy flow
becomes a follow-up patient. Each patient
is unique and follow-up procedures vary
each the case.
Table 5: Colonoscopy Processes Description
4.2.4 Current Calling Centre Value Stream
This process flow is a representation of any type of calls while a patient is in the system,
calls range from “How do I send my referral form?” to “What are the results of my
colonoscopy?” Figure 14 represents this flow in the system.

50
Figure 14: Calling Centre Value Stream Map

51
A simple example of a patient going through every box of this stream is the following: A
patient calls the colorectal department but both phone lines are busy; therefore he leaves a
message for the clerk to answer; the clerk checks the answering machine on average
twice a day. Afterwards, the clerk listens to the message and determines whether the
question asked requires the MD experience to answer. To minimize the utilization of the
MD; the clerk submits the question and waits for the answer. Once the clerk receives the
answer, he/she proceeds to call the patient and give the appropriate response. Finally, the
patient is released from the calling centre loop.
A list of all the process with resources available, cycle time, change over time and
available time for performing each type of activity for any call is shown below (Each
process box is extracted from Figure 14 and it is in the same order):
Process Description of activities
Patient calls are received at any stage of the
system flow. Due to the nature of the
system, quick and accurate responses are
needed.
The patient is required to leave a message
in the answering machine outside work
hours and when the two phone lines are in
use. Personal information and nature of
their call is needed.
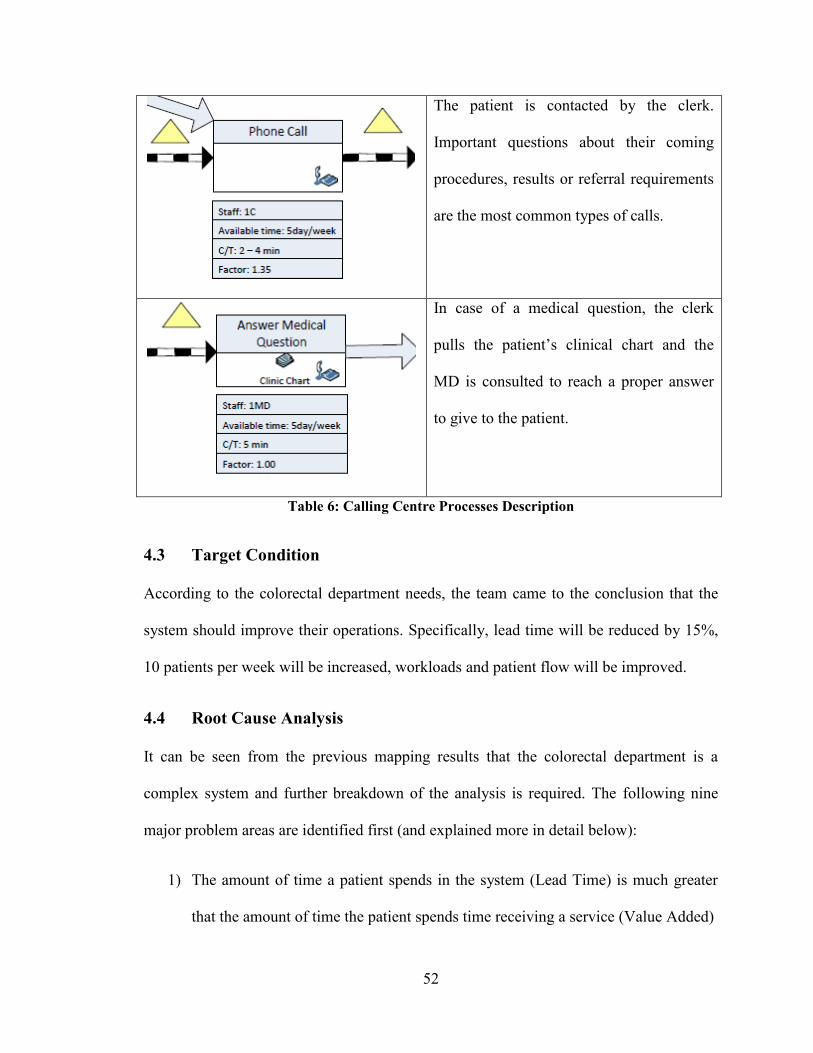
52
The patient is contacted by the clerk.
Important questions about their coming
procedures, results or referral requirements
are the most common types of calls.
In case of a medical question, the clerk
pulls the patient’s clinical chart and the
MD is consulted to reach a proper answer
to give to the patient.
Table 6: Calling Centre Processes Description
4.3 Target Condition
According to the colorectal department needs, the team came to the conclusion that the
system should improve their operations. Specifically, lead time will be reduced by 15%,
10 patients per week will be increased, workloads and patient flow will be improved.
4.4 Root Cause Analysis
It can be seen from the previous mapping results that the colorectal department is a
complex system and further breakdown of the analysis is required. The following nine
major problem areas are identified first (and explained more in detail below):
1) The amount of time a patient spends in the system (Lead Time) is much greater
that the amount of time the patient spends time receiving a service (Value Added)

53
2) The colonoscopy and surgery processing times are much greater that the
necessary time to keep up with demand and cause waiting lists to grow
3) There are tasks performed more than one time
4) Scheduling techniques for short scopes do not consider impact on the system
5) There are unnecessary tasks and motions
6) The colorectal department has different physical locations
7) Staff turnover is high
8) There is unnecessary rework at the call centre
9) Culture of “Change” is not in place
Each of these problems is considered a source of waste and was investigated in further
detail in order to improve the system; considering the restrictions previously specified.
4.3.1 Lead Time
Patient lead time is much greater that the value added time. Table 7 shows the lead times
versus value added activities for each type of patient.
Patient Type Minimum Maximum
Short Procedures 21.39 min vs 31.05 days 30.91 min vs 169.07 days
Colonoscopy 102.31 min vs 63.4 days 136.81 min vs 324.7 days
Surgery 248.31 min vs 67.6 days 277.81 min vs 458.9 days
Table 7: Value Added Time versus Lead Time

54
In order to identify the areas where improvement can reduce the lead time and increase
the value added time; further understanding of the processes in the colorectal department
is needed. The graph shown in Figure 15 identifies the waiting times between each
process in the system for a colonoscopy patient. In this case the two main waiting times
are just before booking an appointment for a talk and booking an appointment for a
colonoscopy.
Figure 15: Colonoscopy Waiting Times
With the same logic, the two bigger waiting times for surgery patients are just before
booking an appointment (up to 6 months) for a talk and before booking an appointment
for a surgery (up to1 year). For short procedures, it is before booking an appointment for
an examination (up to6 months) and before checking in at the department (up to 2
0
100
200
300
400
500
600
700
800
900
Ho
urs
Colonoscopy Waiting Times
Maximum
Minimum

55
months). Last, the calling centre main waiting time is just before returning the call to the
patient (Up to 4 hours).
4.3.2 Cycle Times
The processing time to perform a colonoscopy, talk or surgery are long compared to the
other processes in the system; Colonoscopies takes 30 minutes each, a talk takes 30
minutes and a surgery takes on average 3.5 hours. This long cycle times impact the
system as a whole preventing the continuous flow of patients. For example, Figure 16
shows the processing times of each step for a colonoscopy patient, three types of columns
can be identified as bottlenecks in this flow: “talk (at maximum)”, “colonoscopy” and
“recuperation”. Note that the recuperation process has several parallel resources for our
disposal; therefore, the recuperation processing time will match the colonoscopy time, if
colonoscopy time is reduced by 50%, the recuperation cycle time will be 50% lower.
.
Figure 16: Colonoscopy Processing Times
Takt Time
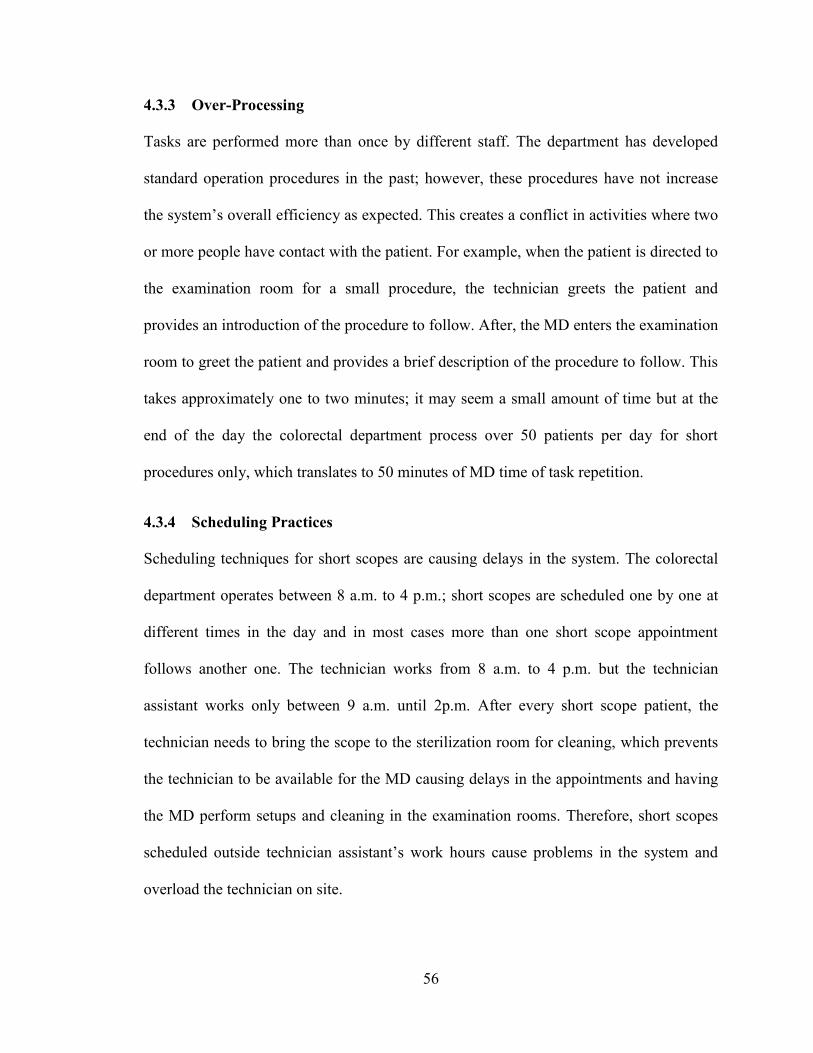
56
4.3.3 Over-Processing
Tasks are performed more than once by different staff. The department has developed
standard operation procedures in the past; however, these procedures have not increase
the system’s overall efficiency as expected. This creates a conflict in activities where two
or more people have contact with the patient. For example, when the patient is directed to
the examination room for a small procedure, the technician greets the patient and
provides an introduction of the procedure to follow. After, the MD enters the examination
room to greet the patient and provides a brief description of the procedure to follow. This
takes approximately one to two minutes; it may seem a small amount of time but at the
end of the day the colorectal department process over 50 patients per day for short
procedures only, which translates to 50 minutes of MD time of task repetition.
4.3.4 Scheduling Practices
Scheduling techniques for short scopes are causing delays in the system. The colorectal
department operates between 8 a.m. to 4 p.m.; short scopes are scheduled one by one at
different times in the day and in most cases more than one short scope appointment
follows another one. The technician works from 8 a.m. to 4 p.m. but the technician
assistant works only between 9 a.m. until 2p.m. After every short scope patient, the
technician needs to bring the scope to the sterilization room for cleaning, which prevents
the technician to be available for the MD causing delays in the appointments and having
the MD perform setups and cleaning in the examination rooms. Therefore, short scopes
scheduled outside technician assistant’s work hours cause problems in the system and
overload the technician on site.

57
4.3.5 Unnecessary Motions
Another problem is that there are unnecessary tasks performed in the department. Any
task that is not adding value to the patient’s experience is considered undesirable and
efforts to eliminate it should be a priority to improve the system. For example, the
colorectal department updates and manages the hospital charts for every patient at the
time of examination; this is set under government regulations and is considered standard
practice. However, the department also creates a “clinic chart” for every first time patient
in the department and it is updated every time the patient is admitted to the department.
For both chart types the updates are manual and both charts are stored in the hospital, one
in the archives department and the clinical chart in the colorectal department; for clinic
charts older than 5 years, the colorectal department stores them in an outside location
where storing and recovering fees are applied by a third party company. The following
calculation shows the time spent updating each clinical chart:
(Update time + Pull and Put away time) x Throughput = Total time for maintenance
(0.46 min + 0.80 min) x (50 to 60 patients) = 60 to 75 min/day
The clerk can spend more than one hour per day performing another task instead of
updating a record that is already in another location. This time is considered non-value
added and should be identified as a point of potential improvement.
It is important to note that the hospital charts contain all the information included in the
clinical chart; the value stream maps in this thesis show what processes use the clinic
chart with an icon on the process box..

58
4.3.6 Physical Layout
The colorectal department has different locations and walking times have not been
measured. Key staff in the department walks between rooms every day creating a non-
value added activity. The medical secretary brings consent forms and questionnaires for
surgery patients to the admissions office three times per week; this takes approximately
30 minutes each time making a total of 1.5 hours of wasted time due to walking. In
addition, the technician and technician assistant walk several times between three
locations: the examination room, sterilization room and check-in office. This activity is
considered transportation waste. Figure 17 shows the total walking time in one day for
the technician only.
On average, the technician spends 33 minutes of a 7 hour workday walking between
locations. For example, the technician walks to the check-in office to obtain the patient
file that needs to be stamped by the clerk at the time the patient is admitted to the
department. Then, the technician walks to the sterilization room to load and unload short
scopes for cleaning. These tasks are lost time for the technician, ideally he/she should be
at the examination room at all times. In addition, the technician spends one full day every
week doing physical counts of inventory and placing the necessary orders for the
following week.
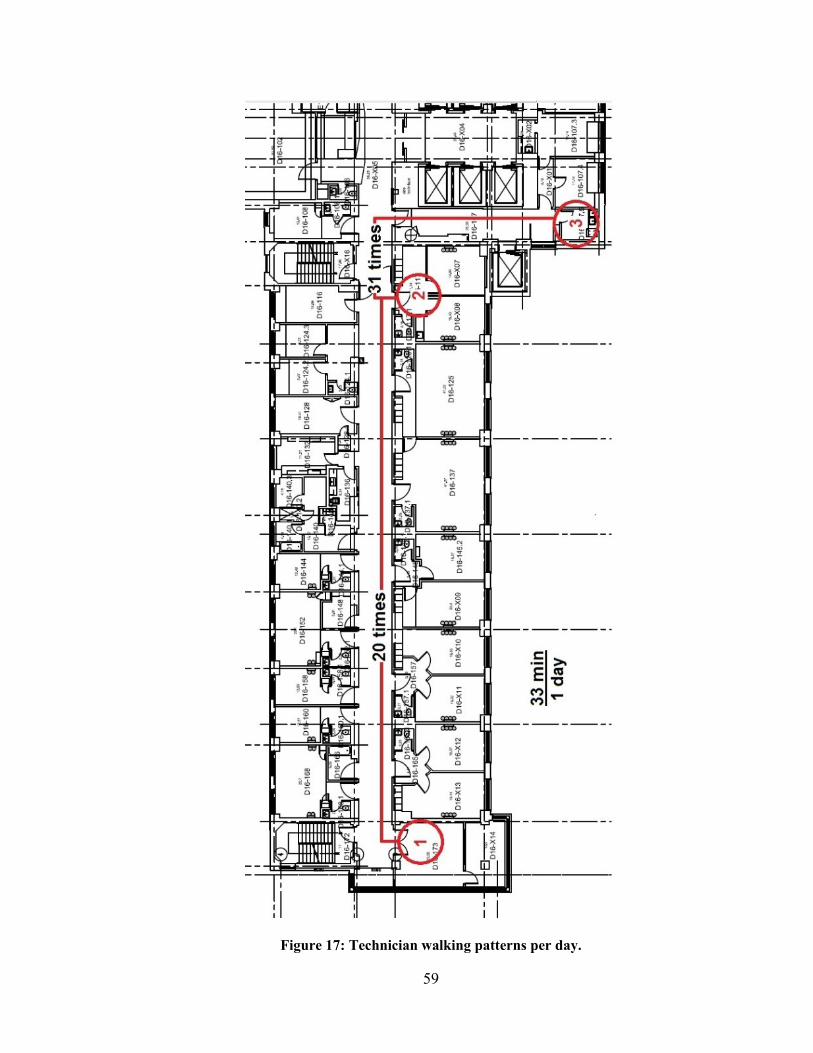
59
Figure 17: Technician walking patterns per day.

60
4.3.7 Calling Centre Over-Processing
Another issue, there is unnecessary rework at the call centre. There is on average a 35%
rework at the work centre in the form of second calls. This means that the clerk spends
time calling patients and 35% of the time, the clerk needs to call back the same patient
because of different reasons. In addition, every booking and confirmation of
appointments is done by a telephone call, causing the department to allocate a full time
clerk to handle the telephone station every day of the week.
4.3.8 High Turnover
In addition to the previous concerns, the staff turnover is high in some positions. Tasks
such as the technician walking to every location for materials or equipment, clerks
spending time placing second calls to the same patient, updating clinic charts, walking to
admissions office to submit specific forms, all these tasks avoid the utilization of staff in
value added activities and discourage them to stay in the department. These activities
create workloads that are unnecessarily large for each staff member, creating an
uncomfortable environment to work in.
4.3.9 Culture of “Change”
The last problem is that the culture of “Change” is not in place. The colorectal
department has been functioning according to trial and error efforts from the staff. There
has not been any studies performed in this department and change is not a common
practice. There are many advantages of having staff with a lot of experience, but there are
many disadvantages too. Therefore, the staff is in an idle status in terms of continuous
improvements. Implementation of this methodology will be challenging if the culture of
change is not adopted.

61
4.4 Potential Areas of Improvement
Having considered the underlying problems, in the colorectal department, potential areas
of improvement need to be identified. Lean methodologies were used to identify areas of
improvement; this avoids the common misconception of concentrating efforts in the
wrong process and focus in reducing the lead time. The goal is to improve the system’s
efficiency as identified by lead time and not the single process efficiency. Figure 18
shows the difference between each type of efficiency; on the top left corner a canoe has
been optimized in a way to advance the further distance with the least amount of effort
while in the bottom right corner the canoe system optimized the rowing of one person,
causing the canoe as a whole to deviate from their purpose.
Figure 18: System Efficiency versus Individual Efficiency (Martin, 2009)

62
5 Proposed System
After creating a clear picture of the colorectal department current operations and
outlining the main problems, the next sections will describe the necessary changes
needed to improve the flow of patients in the system according to lean principles in the
proposed countermeasure phase of A3 methodology (Figure 9). It is important to note,
the medical staff was considered during the generation of improvements and the
constraints previously described are still being respected.
The proposed system focuses efforts on reducing different sources of waste (Section 1.2),
increasing capacity, reducing rework, improving staff workloads and reducing the lead
time of the services provided by the department.
5.1 Proposed Countermeasures
The colorectal department has room for improvement at every flow loop and focusing in
improving the right processes is the key to impact the entire system. As in chapter four,
the department is divided into four different flow loops (Figure 19): (1) Short procedures
or common flow, (2) surgery flow, (3) colonoscopy flow and (4) calling centre flow. In
the following subsections, recommendations and changes needed to improve the system
are described for each loop and a future value stream map is provided for each one to
facilitate visualization of the proposed system.
The proposed operations are described for each subsection in the following order:
problems in this flow loop, changes to adopt continuous flow and/or pull, challenges to
be considered for future research and proposed future value stream map.

63
Figure 19: Proposed Colorectal Value Stream Map
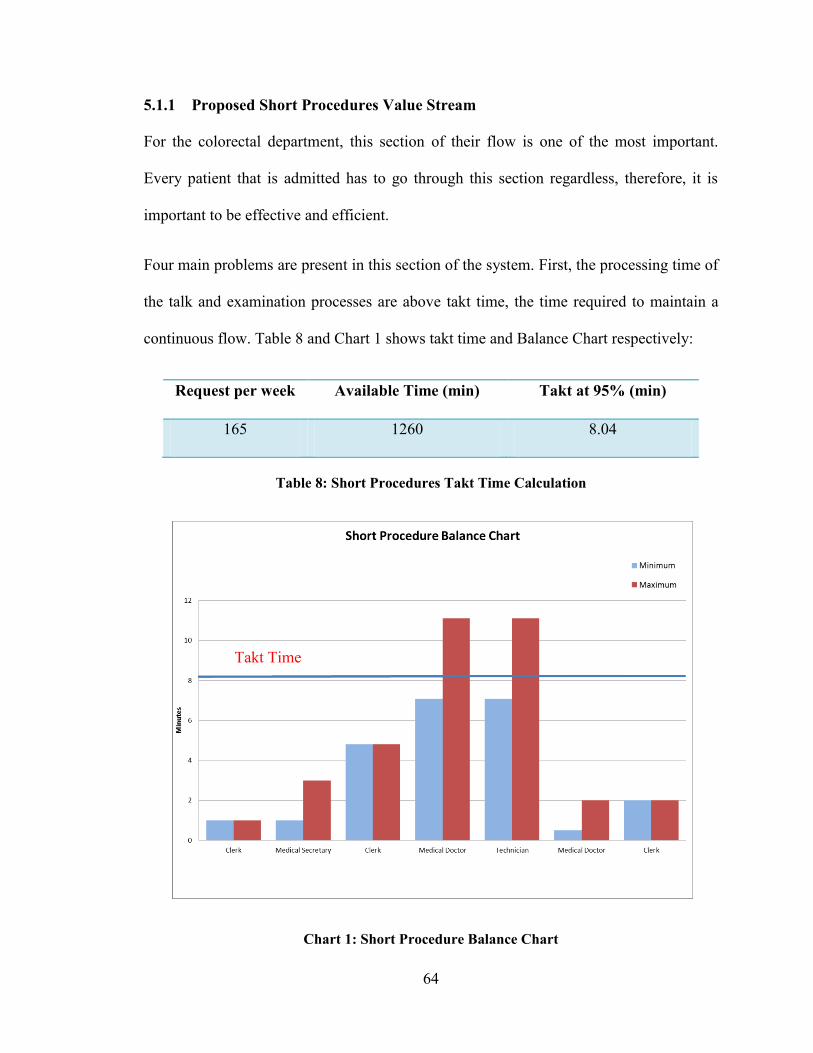
64
5.1.1 Proposed Short Procedures Value Stream
For the colorectal department, this section of their flow is one of the most important.
Every patient that is admitted has to go through this section regardless, therefore, it is
important to be effective and efficient.
Four main problems are present in this section of the system. First, the processing time of
the talk and examination processes are above takt time, the time required to maintain a
continuous flow. Table 8 and Chart 1 shows takt time and Balance Chart respectively:
Request per week Available Time (min) Takt at 95% (min)
165 1260 8.04
Table 8: Short Procedures Takt Time Calculation
Chart 1: Short Procedure Balance Chart
Takt Time

65
The other three problems affecting this part of the system are: tasks are performed twice
during the procedure process, scheduling techniques for short scopes do not consider
impact on the system and walking time of the technician is above desired. These
problems have been explained in detail in the analysis section.
Knowing the problems of the department allows concentrating efforts in the important
processes and determining what activities are necessary and unnecessary. Figure 20
represents the proposed system for short procedures. There are six necessary changes to
achieve this proposed system: Book follow-up and first-time patients as a mix, change
short scopes scheduling techniques, eliminate double charting, remove transcription
process, eliminate weekly inventory physical count and reduce cycle time in the short
procedure and exam processes. Details are provided below.

66
Figure 20: Proposed Short Procedures Value Stream

67
First, follow-up patients have been booked in different days than first-time patients. This
causes an inconsistency in the system in a day-to-day basis. Follow-up patients generally
take less time to process because there is previous history in the department and the MD
knows the case already. In contrast, first-time patients take longer amount of time in each
process because the lack of history and the MD knows less about their condition.
Currently, the department receives 100 follow-up patient requests for every 65 first-time
patient requests per week. Therefore, the department should schedule a ratio of 2:1
follow-ups to first-time patients. This will not only level operations in a day to day basis
but it will create a continuous flow within the day’s operations.
Second, short scopes should be scheduled within 9am to 2 pm, while the technician
assistant is at work, to allow the technician to be available for the MD at all times. In
addition, short scopes should not be carried to the sterilization room one by one; instead
the technician assistant will collect two short scopes at the time in a predetermined
container and bring them as a set. This is done to reduce the amount of trips to the
sterilization room by half. This can be accomplished due to the sterilization machines
configuration of washing two scopes at the time, therefore, eliminating the need to make
a trip every short scope patient. This change will reduce the technician walking time by
2.5 kilometers or 38 minutes per day.
Third, the department needs to eliminate double charting. The information contained in
the departments chart is all included in the hospital chart, which is the official one. By
eliminating this extra procedure, the clerks will recover 60-75 minutes per day, making
them available to concentrate in key tasks. In addition, by eliminating department’s
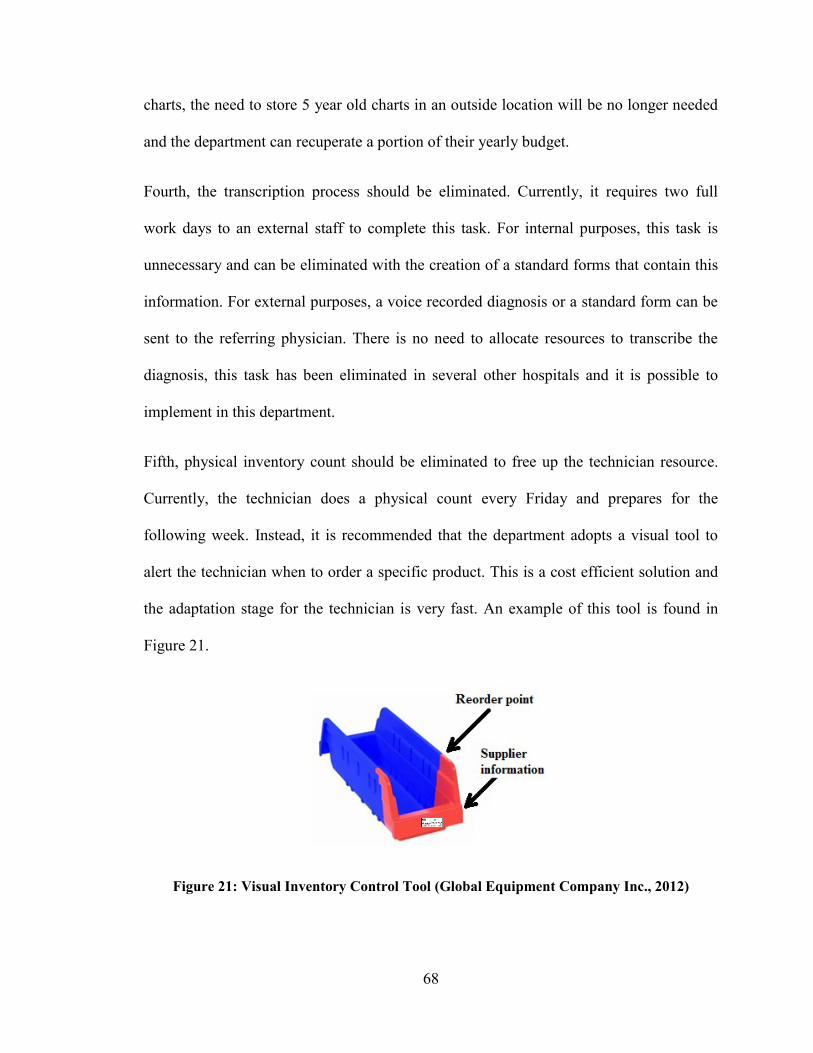
68
charts, the need to store 5 year old charts in an outside location will be no longer needed
and the department can recuperate a portion of their yearly budget.
Fourth, the transcription process should be eliminated. Currently, it requires two full
work days to an external staff to complete this task. For internal purposes, this task is
unnecessary and can be eliminated with the creation of a standard forms that contain this
information. For external purposes, a voice recorded diagnosis or a standard form can be
sent to the referring physician. There is no need to allocate resources to transcribe the
diagnosis, this task has been eliminated in several other hospitals and it is possible to
implement in this department.
Fifth, physical inventory count should be eliminated to free up the technician resource.
Currently, the technician does a physical count every Friday and prepares for the
following week. Instead, it is recommended that the department adopts a visual tool to
alert the technician when to order a specific product. This is a cost efficient solution and
the adaptation stage for the technician is very fast. An example of this tool is found in
Figure 21.
Figure 21: Visual Inventory Control Tool (Global Equipment Company Inc., 2012)

69
This type of tool will eliminate one day of technician time and allow him/her to
concentrate on tasks that are value added.
The last necessary change is to reduce the short procedure cycle time. In order to
maintain a continuous flow through the process, the cycle time of the procedure process
needs to be 8.04 minutes, as shown in Table 8. The head MD in the department is the
fastest of the three, he will provide mentoring to the other MDs to be more efficient and
reduce their processing time. In addition, the technician will acquire two minutes of the
processing time by introducing and setting up the patient in the room. Therefore, the MD
will concentrate their time in performing the procedure and improve in their processing
times with the help of the most experienced one. By doing these two changes the future
processing time will be between 5 and 10 minutes.
In the future, the department should concentrate efforts in creating safer and more
efficient procedures to reduce the cycle time at the consultation process. Furthermore, the
department should upgrade from paper based records to digital; this will free resources
and the staff can concentrate on improving their value added time and delivery of care to
the patient.
If these proposed changes are achieved, Lead Time reductions could potentially range
between 19.36% - 25.94%.
5.1.2 Proposed Surgery Value Stream
This section of the system’s flow is one of the most delicate to work with. A patient that
requires a surgery is considered highly important and patient’s safety is a main concern.

70
There are many preparation procedures and communication between departments is
constant for this type of patients.
There are two main problems are present in this section of the system. The first problem
is unnecessary motions performed by the staff; this has been described in detail in chapter
four of this thesis. The second problem is that the processing time of the surgery process
is above takt time. Table 9 demonstrates the required takt time and Chart 2 shows takt
time and Balance Chart respectively:
Request per week Available Time (hrs) Takt at 95% (hrs)
7 21 3.15
Table 9: Surgery Takt Time Calculation
Chart 2: Surgery Balance Chart
Takt Time
Takt Time
71
As part of the project constraints, medical procedures cannot be changed in a way that
would risk the health and safety of a patient, therefore, the surgery processing time will
stay the same in the proposed system (Figure 22). However, the supporting tasks around
this procedure can be improved. There are two main changes that are required to achieve
the proposed system.
First, the medical secretary should not bring the consent form and questionnaire to the
admission department. This activity is reducing the availability of the medical secretary
by 1.5 hours per week. It is important to note that the medical secretary is considered
extremely important due to the knowledge to respond to medical questions. He/she can
alleviate the questions backlog directed to an MD. Therefore, it is of great importance to
free as much as possible of his/her activities. In order to avoid the medical secretary to go
to admission, a new procedure has been developed to drop the consent forms and
questionnaires to admissions. Currently, the hospital has mail clerks (their function is to
deliver mail to each department) which can be utilized for delivering the consent form
and questionnaires to admissions. However, this information is considered to be
confidential and the misplacement of such documents can have dangerous consequences.

72
Figure 22: Proposed Surgery Value Stream Map

73
To account for this restriction, a color coded enveloped will be used for each group of
patient’s documents, this package will then be placed in a specific section of the mail cart
to avoid confusion and will be delivered only to the admissions department. The
following Figure represents the recommended mail cart configuration.
Figure 23: Hospital’s mail cart configuration (GovGroup, 2011)
This configuration will save 1.5 hours of medical secretary time in the colorectal
department and if it is adopted by the hospital, it can save valuable time in every
department. This solution is cost effective and can be adopted immediately.
Second, the surgery will be scheduled at the time the consent form and questionnaire is
finished. This will avoid having to call the patient to schedule a surgery; they will be
notified when they drop their papers at the colorectal department. It is important to note
that this task does not select a specific date and time for a surgery, it only places the
patient in the system and proceeds to schedule preparation procedures in advance.
Future research is needed to reduce surgery processing time and allow patients to flow
continuously throughout the department.

74
If these proposed changes are achieved, Lead Time reductions could potentially range
between 10.39% - 10.71%
5.1.3 Proposed Colonoscopy Value Stream
This section of the colorectal department’s flow is very complex. There is a certain
amount of patient requests that can be forecasted, but most of the patient requests that go
to this department are complex cases.
There are three main problems that are present in this section of the system. The
processing time of the colonoscopy process is above takt time; Table 10 and Chart 3
demonstrate the required takt time and Balance Chart respectively:
Request per week Available Time (min) Takt at 95% (min)
58 1260 22.67
Table 10: Colonoscopy Takt Time Calculation
The other two problems are: Unnecessary tasks and motions by the colorectal staff and
there are tasks that are performed more than once by different personnel. These problems
have been described in detail in the analysis chapter of this thesis.
After the problems are identified and analyzed, the next step is to concentrate efforts in
eliminating tasks that are unnecessary and create a more efficient flow in the system.
Figure 24 represents the proposed system for colonoscopy loop. There are four elemental
changes needed to achieve this proposed system: eliminate double charts, eliminate
processes, combine processes and reduce cycle time during colonoscopy process. First,

75
the elimination of double charts benefits has been previously discussed in the proposed
common flow section.
Chart 3: Colonoscopy Balance Chart
Eliminating and combining processes is a technique that is performed one in relation to
the other. Currently, the department calls the patient to book the appointment, confirms
the appointment two weeks later and then mails the instructions up to one month prior to
their colonoscopy. In the proposed system, the confirmation of the appointment is
eliminated; instead, the colonoscopy appointment is booked and confirmed in the same
step one month prior to the date of the appointment, in this manner the instructions can be
mailed right after the appointment is booked. Also, the department is currently updating
the patient’s status, two days after the diagnosis is performed by the MD and then a day
later the results are processed and mailed to the referring physician. In this situation,
Takt Time
Takt Time

76
Figure 24: Proposed Colonoscopy Value Stream Map

77
these three processes can be combined by updating the patient status after the diagnosis is
performed and at the same time the results can be processed and mailed at the same time.
The last change, the colonoscopy cycle time needs to be reduced. As stated in the
constraints, an additional MD will be added to the colorectal team and it will be placed
where it has the best impact for the department, that place is in the colonoscopy process.
Currently, the waiting lists for colonoscopies keep increasing and with an aging
population they will continue to increase. Therefore, the additional MD will perform
colonoscopies in a parallel process with the other three MDs. This will reduce the cycle
time from 24 to 12 minutes as shown in the proposed colonoscopy value stream map
(Figure 24).
With the addition of the new MD resource and the reduction of cycle time, the
department’s capacity will be increased by 60 patients per week. The following
calculation demonstrates the increase in throughput:
Current System
(420 min)/ (30 min per patient) ≈ 14patients * 1 resources * 3 days = 42 patients/week
Proposed System
(420 min)/ (24 min per patient) ≈ 17patients * 2 resources * 3 days = 102 patients/week
Future research is needed in this section to improve the communication between
departments where paper records are still being used instead of digital ones. Any
improvement in this process will impact the whole system positively.
78
If these proposed changes are achieved, Lead Time reductions could potentially range
between 11.17% - 20.68% and patient throughput will increase by 60 patients.
5.1.4 Proposed Calling Centre Value Stream
This part of the value stream has not a direct impact on the system. However,
improvements in the calling centre produce available resources to execute key activities
in the value stream.
There are currently two problems in the calling centre: backlog of calls in the answering
machine and an increase of messages to be returned by the MD. The backlog of calls in
the answering machine is produced by checking the messages only twice a day. This was
an issue due to large clerk workloads; however, in the proposed system the clerk has time
to check the answering machine every hour. Not only patients will receive a faster answer
but they will not place a second or third message in the answer machine about the same
issue. As for the waiting messages to be answered by the MD, they are answered twice in
the morning and twice in the afternoon. However, this seizes the MD resource for a
longer period of time each time. In the proposed system, the MD will check the messages
in smaller batches, every 30 minutes, in this manner the MD only requires a few minutes
to answer the questions and provide the patient with a faster response.
Figure 25 represents the proposed system for the calling centre with the recommended
improvements in place. Notice that there is a “FIFO”, first in first out, queue to avoid
some callers to wait longer than others. Also, this helps to avoid forgetting to answer a
message that is older than others.

79
Figure 25: Proposed Calling Centre Value Stream Map

80
6 Summary, Conclusions and Future Research
This chapter provides a summary of importance of implementing the proposed system
with a corresponding conclusion on the results previously discussed. In addition, future
research areas are recommended to further improve the system and deliver better care.
6.1 Summary
The proposed methodology is promising in healthcare and should be adopted by the
industry. In this research, the main objective was to increase the capacity of the
department and decrease the lead time.
The main factor limiting the overall capacity in the department was found to be the
number of MD resources in the colonoscopy process; this is the bottleneck of the
system’s flow. As discussed in section 5.1.3, proposed colonoscopy value stream, the
current colonoscopy processing time is almost ten more minutes above takt time.
Therefore, by allocating the new MD resource into this process, the takt time will be
increased by 22 minutes making the colonoscopy processing time lower than the required
new takt time.
With the new MD resource in the colonoscopy process, the system’s flow will be
smoother and the waiting list can be reduced by performing under takt time. It is
important to note that this proposed change will have the most impact in the system flow;
without this improvement, other efforts will have a low impact on the overall Lead time
reduction.

81
Therefore, in order to achieve the maximum results the following changes need to be
implemented: Book follow-up and first-time patients as a mix, change short scopes
scheduling techniques, eliminate double charting, remove the transcription process,
eliminate weekly inventory physical count, reduce cycle time in the short procedure and
exam processes, eliminate double charts, eliminate unnecessary processes, combine
processes when possible, reduce colonoscopy cycle time, medical secretary should not
bring the consent form and questionnaire to the admission department, surgery will be
scheduled at the time the consent form and questionnaire is finished, the MD will get
phone messages every 30 min and the clerk will check the answer machine every hour
and have the new MD resource work in parallel in the colonoscopy process.
If the proposed system is properly implemented and the changes previously stated are
adopted, the capacity of the department will increase in the common flow and
colonoscopy loop by 20 patients per week and 60 patients per week respectively. In
addition the Lead time will significantly decrease; the comparison is shown in Table 11.
This Table shows the minimum and maximum value of the current versus the proposed
system for each section of the value stream. In addition, the last column shows the
comparison result as a percentage of reduction for each row.
Section Current System (days)
Proposed System (days)
Reduction
Min
Short Procedures 31.1 25.0 19.36%
Colonoscopy 63.4 56.3 11.17%
Surgery 67.6 60.6 10.39%

82
Max
Short Procedures 169.1 125.2 25.94%
Colonoscopy 324.7 257.6 20.68%
Surgery 458.9 409.8 10.71%
Table 11: Lead Time comparison
The combination of both, increase of patients processed per week and lead time
reduction, will impact the unit cost per patient in the department. With the proper
implementation and under the right leadership, the colorectal department at the Montreal
General Hospital can become a standard to follow and a leader for other institutions.
In addition, the proposed system tackled each problem identified in the Root Cause
Analysis section of this thesis. Lead time has been reduced (Table 11), the colonoscopy
and surgery processing times are reduced to match takt time in each loop, tasks are no
longer performed twice, scheduling techniques have been adjusted to match the
department needs and relief workload from the technician, unnecessary tasks and motions
have been reduced and in most cases eliminated, call centre rework has been reduced and
culture of change is in place.
6.2 Conclusions
Healthcare institutions around the world are facing the similar underlying problems like
the ones shown in this thesis, and therefore it is important to concentrate efforts to reduce
activities that do not add value to the patient and to manage key resources efficiently.
Lean healthcare provides the methodology to identify different sources of waste, areas of
improvement and tools to improve current practices, providing the healthcare industry

83
with the opportunity to improve operations in the care delivery and impacting patient’s
experience.
This thesis not only provides a clear case where lean principles can be applied, but it is a
reference tool for any other departments and/or institutions that wish to apply A3 and
lean methodology to improve system’s operations. In addition, this research provides a
unique methodology with clear descriptions each step of the process, becoming a
valuable thesis.
The Colorectal department has acquired the necessary tools to continue to improve their
operations and reduce further their amount of waste. The increase in capacity provides
the department with the opportunity to reduce the waiting list and set an example for
other departments to concentrate efforts and do the same. Standard procedures will be set
in place by the MDs and together the cycle times in the examination procedures will be
reduced, giving am opportunity to increase their throughput.
The colorectal department at the Montreal General Hospital is pursuing to implement
these tools and concepts; it requires full collaboration of managerial staff as well as floor
staff. The proposed system should be implemented in different iterations and a culture of
change is the best tool to continue improving the system. The improvements of this
implementation can change the manner healthcare services are delivered in Canada and
help improve the quality of life for many individuals.
Lastly, the contribution this thesis provides to the healthcare is of great magnitude. The
proposed methodology combines Lean and A3 concepts to adapt these non-healthcare
concepts into a guide to achieve effectiveness and efficiency in the delivery of care. In
84
coming years, the Canadian population will continue to grow in average age and the need
for better healthcare systems will continue to increase rapidly. This proposed solution is a
great tool to commit into an improvement project and strive for perfection. By motivating
the staff and adapting to a culture of change, the healthcare community can achieve great
success. Therefore, by adopting these concepts, we could have a flexible, responsive and
efficient healthcare system that it is very much needed.
6.3 Future Research Directions
Potential research topics to further improve the healthcare operations with lean
methodology are:
Digital hospital charts instead of paper based. What are the benefits of
transferring all records into a database? What are the operational benefits of
digital charts? What is the most effective plan to achieve this transition without
affecting operations of healthcare institutions?
Optimization of colonoscopy and surgery procedures. How can these procedures
be more efficient without lowering the quality of care? What tasks should key
resources be performing and what tasks should be transferred to others? How can
these procedures be standardized to reduce the variability on processing time
between practitioners? What is the percent utilization of specialized equipment?
Analysis of personnel roles in healthcare. How can the healthcare institutions
determine the appropriate number of nurses per physicians? What type of
activities should be performed by key resources? Is there a need for flexible
resources to perform different levels of tasks? What is the proper sizing of a

85
department personnel according to the type of care, throughput and complexity of
the delivery?
Standardization of medical procedures such as colonoscopies, surgeries and small
procedures in ambulatory services. How can the medical society standardize
efficient practices to reduce the variability in processing times? What are the areas
in healthcare institutions that will benefit the most of this type of improvements?
Screening of patients eligible for surgery versus other procedures. What is the
efficiency of the current procedures for surgery screening? What are the key
factors to triage the importance of the surgery on a patient? What type of
screening techniques should be implemented and how can they be applied in a
standard manner?

86
Bibliography
1. About our hospital. (2009). Retrieved June 1, 2012, from MUHC foundation:
http://muhc.ca/homepage/page/history
2. Baker, M., Taylor, I., & Mitchell, A. (2009). Making Hospitals Work: how to
improve patient care while saving everyone's time and hospitals' resources.
Goodrich UK: Lean Enterprise Academy.
3. Brideau, L. (2004). Flow: why does it matter? Front Health Serv Manage 20 (4) ,
47-50.
4. Canadian Institute for Health Information (CIHI). (2011, November 3). National
Health Expenditure Trends, 1975 to 2011. Ottawa: Canadian Institute for Health
Information (CIHI).
5. Daniel, M., & William, S. (1993). The effects of aging and population growth on
health care costs. Health Affairs, 12, no.1, 119-125.
6. Duggan, K. J. (2002). Creating Mixed Model Value Streams. New York:
Productivity Press.
7. Erenay, F. S. (2010, December). Optimal Screening Policies for Colorectal
Cancer Prevention and Surveillance. Wisconsin, USA: University of Wisconsin-
Madison.
8. Fine, B., Golden, B., Hannam, R., & Morra, D. (2009). Leading Lean: A
Canadian Healthcare Leader's Guide . Healthcare Quartely Vol. 12 No.3, 26-35.

87
9. Global Equipment Company Inc. (2012). Akro-Mils® Indicator™ Two-Tone
Double Hopper Shelf Bins. Retrieved September 1, 2012, from Global:
http://www.globalindustrial.com/g/storage/bins-totes-containers/shelf/two-tone-
double-hopper-shelf-bins
10. GovGroup. (2011). Wire Mail Cart Fellowes 40912 FEL40912. Retrieved
September 1, 2012, from GovGroup.com: http://www.govgroup.com/wire-mail-
cart-fel40912-2177281-prd1.htm
11. Graban, M. (2008). Lean Hospitals: Improving Quality, Patient Safety, and
Employee Satisfaction. New York: CRC Press.
12. Heenan, M., & Higgins, D. (2009). Engaging Physician Leaders in Performance
Measurement and Quality. Healthcare Quarterly Vol. 12 No.2, 66-69.
13. Institut de la statistique du quebec. (2012, February 12). Quebec's budget plan.
Montreal, Quebec, Canada.
14. Jimmerson, C., Weber, D., & Sobek, D. (2005). Reducing waste and errors:
piloting lean principles at Intermountain Healthcare. Joint Commission Journal on
Quality and Safety,, 249-257.
15. Kamma, T. K. (2012, December). Framework for Lean Thinking Approach to
Healthcare Organizations: Value Stream Mapping to Reduce Patient Waiting
Time. Illinois, USA: Southern Illinois University Carbondale.

88
16. Kim, C., Spahlinger, D., Jeanne, K., & Billi, J. (2006). Lean Health Care: What
Can Hospitals Learn from a World-Class Automaker. Journal of Hospital
Medicine Vol 1 / No 3, 191-199.
17. Lummus, Vokurka, & Rodegheiro. (2006). Improving Quality through Value
Stream Mapping: A Case Study of a Physician's Clinic. Total Quality
Management Vol. 17 No. 8, 1063-1075.
18. Mann, D. (2005). The missing Link: Lean Leadership. Frontiers of Health
Services Management 26:1, 15-26.
19. Martin, K. (2009). Journey to a Lean Enterprise: Value Stream Mapping. San
Diego, CA: Karen Martin & Associates.
20. McGill University. (2011, November 1). Montreal General Hospital. Complex
Care Centre. Montreal, Quebec, Canada.
21. McGuill University Health Centre. (2012). Welcome to Volunteer Services.
Retrieved Septembre 15, 2012, from McGuill University Health Centre:
http://www.medphys.mcgill.ca/intro/hospitals.html
22. Melton, T. (2005). The Benefits of Lean Manufacturing: What Lean Thinking has
to Offer the Process Industries. Chemical Engineering Research and Design, 662-
673.
23. Miller, D. (2005). Going Lean in Health Care. Institute for Healthcare
Improvement, 1-20.

89
24. Ontarion Ministry of Health and Long-Term Care. (2007). Retrieved October 18,
2011, from ColonCancerCheck:
http://www.health.gov.on.ca/en/public/programs/coloncancercheck/
25. Piggott, Z., Weldon, E., Strome, T., & Chochinov, A. (2011). Application of Lean
principles to improve early cardiac care in the emergency department. Canadian
journal of emergency medical care, 325-332.
26. Rother, M., & Shook, J. (2003). Learning to See: Value stream mapping to create
value and eliminate muda. Cambridge, MA: The Lean Enterprise Institute.
27. Sante et Services sociaux Quebec. (2012, July). Quebec Colorectal Screening
Program. Quebec City, Quebec, Canada.
28. Spear, S. (2005). Fixing Health Care from the Inside, Today. Harvard Business
Review, 78-91.
29. Statistics Canada. (2010, June). Population Projections for Canada, Provinces
and Territories (Catalogue no. 91-520-X). Retrieved July 1, 2012, from Statistics
Canada: http://www.statcan.gc.ca/pub/91-520-x/91-520-x2010001-eng.pdf
30. Stein, D. E., & Bonheur, J. L. (2012, August 1). Colonoscopy. New York, New
York, USA.
31. Unknown. Canadian Charities. No. 1, The Montreal General Hospital. vol.X, no.
20, 308. Canadian Illustrated News: Images in the news: 1869-1883, Montreal.
32. Westwood, N., James-Moore, M., & Cooke, M. (2007). Going lean in the NHS.
NHS Institute for Innovation and Improvement, 1-22.

90
33. Winch, S. (2009). Making cars and making health care: a critical review. The
Medical Journal of Australia, 28-29.
34. Womack, J., & Jones, D. (2003). Lean Thinking: Banish Waste and Create
Wealth in your Corporation. New York: Free Press.
35. Womack, J., Jones, D., & Ross, D. (1991). The Machine That Changed the World.
New York: Free Press.

91
Appendix A: Lean sources of waste
(Graban, 2008)
1. Defects
2. Overproduction
3. Waiting
4. Transportation
5. Inventory
6. Motion
7. Excess Processing
8. Confusion

92
Appendix B: Processing time observation sheet template
Tim
e O
bse
rvat
ion
Sh
eet
Proc
ess:
Date
:
Task
Task
Dec
ript
ion
12
34
56
78
910
Bes
t Ti
me
Avg
. Tim
eN
otes
1 2 3 4 5 6 7 8 9 10 11 12 13 14 15
Obs
erve
d C
ycle
tim
e

93
Appendix C: Technician versus Assistant walking distance template
Distance Walked Date:
Staff #1 Staff #2
Time To Cleaning room To check-in office To Cleaning room To check-in office
8:00
9:00
10:00
11:00
12:00
13:00
14:00
15:00
16:00
17:00
Total

94
Appendix D: A3 Template