Embed Size (px)
Citation preview

1
Improving Mindanao Agro-Industrial Competitiveness through better Logistics and Connectivity
October 2019
A project of the World Bank Group, with the support of the Australian Government through the
Australia-World Bank Philippines Development Trust Fund.
Pub
lic D
iscl
osur
e A
utho
rized
Pub
lic D
iscl
osur
e A
utho
rized
Pub
lic D
iscl
osur
e A
utho
rized
Pub
lic D
iscl
osur
e A
utho
rized
2
© 2019 International Bank for Reconstruction and Development / The World Bank
1818 H Street NW
Washington DC 20433
Telephone: 202-473-1000
Internet: www.worldbank.org
This work is a product of the staff of The World Bank Group with external contributions. The findings,
interpretations, and conclusions expressed in this work do not necessarily reflect the view of the Australian
Government, the Canadian Government, the World Bank Group, its Board of Executive Directors, or the
governments they represent.
The World Bank does not guarantee the accuracy of the data included in this work. The boundaries, colors,
denominations, and other information shown on any map in this work do not imply any judgment on the part of
The World Bank concerning the legal status of any territory or the endorsement or acceptance of such boundaries.
Rights and Permissions
The material in this work is subject to copyright. Because The World Bank encourages dissemination of its
knowledge, this work may be reproduced, in whole or in part, for noncommercial purposes as long as full
attribution to this work is given.
Any queries on rights and licenses, including subsidiary rights, should be addressed to World Bank Publications,
The World Bank Group, 1818 H Street NW, Washington, DC 20433, USA; fax: 202-522- 2625; e-mail:
3
This report was prepared by a World Bank Group team led by Roberto Martin Nolan Galang (Private Sector Specialist). Key inputs were provided by Patrick Verissimo (Lead Agriculture Economist), Mahmoud Momtaz (Private Sector Specialist), Maya Villaluz (Senior Environmental Engineer), Eugeniu Osmochescu (Senior Private Sector Specialist), Andres Garcia (Senior Economist), Charles Kunaka (Lead Private Sector Specialist), Paul Phumpiu (Senior Economist) , Victor Dato (Senior Infrastructure Specialist), Karen Annette Lazaro (Consultant), Maria Beatrice Anne Tanjangco (Consultant), Roberto Arquiza (Consultant), Simon Peter Gregorio (Consultant), and Anton Arguelles (Consultant). Yvette Villostas (Program Assistant), Reinaluz Ona (Program Assistant), and other team members in the Philippine Country Office provided valuable logistics and administrative support. The extended team contributed background papers or provided advice. The following individual consultants prepared background papers for the report: Larry Digal and his team comprised of Marvin Louie Orbeta and Carol Balgos for their Value Chain Analysis of Vegetables and Cacao, Annette O. Pelkmans-Balaoing and Jane Lynn Capacio and their team comprised of Reinier de Guzman and Anthony John Rodriguez for their Network Analysis of Mindanao Value Chains, Celina Agaton, Richard Sigua, Noriel Tiglao, and Joe Cruz for their work on OpenStreetMap, Origin-Destination Commodity Flow Surveys, and Freight Interview Surveys, and Nikki Philline C. de la Rosa and International Alert for statistics on Mindanao security issues. The team would like to thank Natasha Beschorner (Senior Specialist), Rick van der Kamp (Senior Operations Officer – Agribusiness), Brad Roberts (Senior Private Sector Specialist) for their contributions to the IT solutions chapter. The team worked under the overall supervision and guidance of Ndiame Diop (Practice Manager), Mona E. Haddad (Director), Dahlia Khalifa (Practice Manager), Birgit Hansl (Program Leader), Souleymane Coulibaly (Program Leader), and Mara K. Warwick, (Country Director for the Philippines). The team would like to thank those who participated in the Concept Note and Decision review meeting, particularly the reviewers Tanja Goodwin (Senior Economist), Petter Lundkvist (Regulatory Specialist), Carolina Figueroa-Geron (Lead Rural Development Specialist), and Massimiliano Cali (Senior Economist) and other participants who provided helpful comments, Achim Fock (Operations Manager), Ndiame Diop (Practice Manager), Victor Dato (Senior Infrastructure Specialist), Yolanda Azarcon (Senior Operations Officer), David Llorito (Communications Officer), Clarissa David (Senior Communication Officer), Nora Weisskopf (Transport Specialist), and Steven Jaffee (Lead Agriculture Economist). The findings, interpretations, and conclusions expressed in this Report are those of World Bank staff and do not necessarily reflect the views of the Australian Government and the World Bank or its management, Executive Board, or the governments they represent. For questions and comments on the content of this publication, please contact Roberto Martin Nolan Galang ([email protected]). Questions from the media can be addressed to David Llorito ([email protected]). For information on the work of the World Bank Group on Competition Policy, please visit www.worldbank. org/en/topic/competitiveness/brief/competition-policy. For information about the World Bank and its activities in the Philippines, please visit www.worldbank.org/ph
4
Tables of Contents
EXECUTIVE SUMMARY ........................................................................................................................................... 8
INTRODUCTION AND CONTEXT ............................................................................................................................ 14
CHAPTER 1. RURAL LOGISTICS AND AGRICULTURAL DEVELOPMENT ................................................................... 20
UNDERSTANDING THE VEGETABLE LOGISTICS CHAIN IN MINDANAO .................................................................. 22 PRODUCTION .............................................................................................................................................................. 22 CONSOLIDATION .......................................................................................................................................................... 24 RETAILERS .................................................................................................................................................................. 26
UNDERSTANDING THE CACAO LOGISTICS CHAIN IN MINDANAO ......................................................................... 31 PRODUCTION .............................................................................................................................................................. 31 CONSOLIDATION .......................................................................................................................................................... 32 PROCESSING AND RETAIL ............................................................................................................................................... 33
INEFFICIENCIES IN THE AGRICULTURAL LOGISTICS CHAINS .................................................................................. 34 LACK OF INFORMATION ................................................................................................................................................. 34 DOUBLE HANDLING AND SPOILAGE ................................................................................................................................. 35 QUALITY CONTROL ....................................................................................................................................................... 37
SOLUTIONS TO BETTER ORGANIZING THE AGRO-LOGISTIC VALUE CHAIN ............................................................ 38 AGRICULTURAL COOPERATIVES ....................................................................................................................................... 39 LEAD FIRMS ................................................................................................................................................................ 43 PRODUCTIVE ALLIANCES ................................................................................................................................................ 44 TRADING CENTERS ....................................................................................................................................................... 46 IT SOLUTIONS .............................................................................................................................................................. 49 SUMMARY .................................................................................................................................................................. 52
CHAPTER 2. URBAN-TO-URBAN LOGISTICS AND INDUSTRIAL DEVELOPMENT ..................................................... 53 SPATIAL DISPERSION AND FOUR-POLE DEVELOPMENT ......................................................................................................... 56 POTENTIAL FROM BETTER INTER-CITY LOGISTICS ................................................................................................................. 59 SECURITY CONCERNS .................................................................................................................................................... 66 PORT CONSOLIDATION AND REGULATION ......................................................................................................................... 70 SUMMARY .................................................................................................................................................................. 73
CHAPTER 3. COMPLEX REGULATORY PROCEDURES ............................................................................................. 74 REGIONAL AUTONOMY: THE CASE OF THE BANGSAMORO AUTONOMOUS REGION OF MUSLIM MINDANAO .................................. 81
CHAPTER 4. COMPETITION ASSESSMENT OF KEY LOGISTICS SECTORS ................................................................. 82 ANTI-COMPETITIVE REGULATIONS AND GOVERNMENT INTERVENTION .................................................................................... 85
Trucking .............................................................................................................................................................. 86 Ports ................................................................................................................................................................... 88 Domestic Shipping .............................................................................................................................................. 89 Freight Forwarding ............................................................................................................................................. 90
CONCLUSION ....................................................................................................................................................... 93
RECOMMENDATIONS .......................................................................................................................................... 95
REFERENCES ......................................................................................................................................................... 99
APPENDIX .......................................................................................................................................................... 100 METHODOLOGIES USED ............................................................................................................................................... 100 ADDITIONAL TABLES ................................................................................................................................................... 102
5
List of Tables TABLE 1 - FOOD AND LIVE ANIMALS INTER-ISLAND COMMODITY FLOW PATTERNS (2017) ............................................................. 14 TABLE 2 - GROWTH RATES OF SELECT SECTORS BY REGION (2016 – 2018) ................................................................................ 15 TABLE 3 - SHARE OF EMPLOYMENT IN MANUFACTURING FROM TOTAL, BY MAJOR ISLAND GROUPS, APRIL 2017 ............................. 16 TABLE 4 - COMPARATIVE STATISTICS ................................................................................................................................... 17 TABLE 5 - HOUSEHOLD CONSUMPTION PER CAPITA OF SELECTED VEGETABLES IN THE PHILIPPINES (2000, 2009, 2012) .................... 21 TABLE 6 - SAMPLE QUALITY REQUIREMENTS OF SUPERMARKETS IN DAVAO CITY ......................................................................... 27 TABLE 7 - COST AND RETURNS COMPARISON OF VEGETABLE CLUSTERS BETWEEN THEIR MARKETS ................................................... 27 TABLE 8 - COINTEGRATION OF VEGETABLE PRICES ACROSS MARKETS (RETAIL, WHOLESALE, AND FARMGATE) .................................... 29 TABLE 9 - ESTIMATED VOLUME OF DRIED, FERMENTED BEANS PER ORGANIZATION IN DAVAO REGION ............................................ 33 TABLE 10 - SEASONALITY OF FARM PRICES OF SELECTED VEGETABLES IN MAJOR MARKETS OF MINDANAO (1990-2015) ................... 35 TABLE 11 - AVERAGE POST-HARVEST LOSSES PER MARKET LEVEL ............................................................................................. 36 TABLE 12 - PROFITABILITY COMPARISON: FIRST AND SECOND CHANNELS ................................................................................... 41 TABLE 13 - SAMPLE PRICES OF COMMODITIES PER MARKET OUTLET .......................................................................................... 42 TABLE 14 – AGRI-PINOY TRADING CENTERS PER REGION AND BY STATUS AS OF NOVEMBER 2018 ................................................ 46 TABLE 15 - GROWTH RATES OF SELECT SECTORS BY REGION (2016 – 2018) .............................................................................. 53 TABLE 16 - MODE OF SALE OF PRODUCTS AND BY-PRODUCTS ................................................................................................. 54 TABLE 17 - TRUCKING COSTS BETWEEN CITIES ....................................................................................................................... 60 TABLE 18 - EXAMPLE TURNAROUND SCHEDULE OF TRUCK PLYING MANILA-CALAMBA ROUTE AND PANABO-MADAUM ..................... 61 TABLE 19 - LOAD FACTORS OF FREIGHT VEHICLES EXTRACTED FROM THE FREIGHT INTERVIEW SURVEY ........................................... 62 TABLE 20 - TRUCK BANS IN MINDANAO URBAN CITIES ........................................................................................................... 63 TABLE 21 - NUMBER OF VIOLENT INCIDENTS DUE TO ILLICIT TAXES AND TOLL FEES INCLUDING FORCED PAY-OFFS, BARMM, BY PROVINCE, 2011-17 ... 67 TABLE 22 - EXPORT CONTAINER COSTS - PORT OF MANILA VS. DIRECT SHIPMENT ...................................................................... 73 TABLE 23 – PARTIAL MATRIX OF GOVERNMENT PERMITS FOR LOGISTICS SERVICE PROVIDERS ...................................................... 75 TABLE 24 - PERMIT COMPARISON WITH MALAYSIA, THAILAND, PHILIPPINES ............................................................................. 76 TABLE 25 – LOCAL ENTRY PERMITS ..................................................................................................................................... 76 TABLE 26 - REQUIREMENTS FOR FTEB SEA FREIGHT FORWARDER ACCREDITATION ..................................................................... 77 TABLE 27 - STANDARD COST MODEL - DOCUMENTARY REQUIREMENTS FOR APPLICATION OF ACCREDITATION OF NEW SEA FREIGHT FORWARDERS ... 80 TABLE 28 - KEY PILLARS FOR FOSTERING COMPETITION .......................................................................................................... 83 TABLE 29 - RECOMMENDATIONS FOR ENHANCING PROCOMPETITIVE REGULATIONS AND GOVERNMENT INTERVENTION .................... 91 TABLE 30 - EXPANDED MATRIX OF GOVERNMENT PERMITS INVOLVING LOGISTIC SERVICE PROVIDERS ......................................... 102
List of Figures FIGURE 1 - OUTPUT PER WORKER BY SIZE FIGURE 2 - SHARE OF FIRMS BY FIRM SIZE .............................................................. 16 FIGURE 3 - RURAL BARANGAYS NOT CONNECTED TO A NATIONAL HIGHWAY, BY REGION, 2010, PERCENT ....................................... 18 FIGURE 4 - OPEN SIGNAL MAP FIGURE 5 - BASS MAP ..................................................................................................... 18 FIGURE 6 - ANNUAL PERCENTAGE GROWTH RATE OF VEGETABLE PER CAPITA CONSUMPTION IN SOUTHEAST ASIA (2000 – 2013) ...... 21 FIGURE 7 - LOGISTICS VALUE CHAIN OF VEGETABLE MARKET IN DAVAO REGION ........................................................................ 22 FIGURE 8 - PRODUCTION OF VEGETABLES BY REGION (2019) .................................................................................................. 23 FIGURE 9 - MINDANAO AGRICULTURE INFRASTRUCTURE......................................................................................................... 24 FIGURE 10 - ORIGIN-DESTINATION MAP FOR DAVAO, CAGAYAN DE ORO, AND GENERAL SANTOS WITH RESPECTIVE CATCHMENT AREA ................... 30 FIGURE 11-DISTRIBUTION OF VOLUME OF CARROTS FROM BULUA MARKET (OUTBOUND) IN CAGAYAN DE ORO.............................. 30 FIGURE 12 - VALUE CHAIN OF CACAO MARKET IN DAVAO REGION ........................................................................................... 31 FIGURE 13 - UTILIZATION OF VEGETABLE SUPPLY IN THE PHILIPPINES FROM 2007 – 2016 ........................................................... 36 FIGURE 14 - CACAO PRODUCT PRICE LADDER, AS OF 2018 ..................................................................................................... 37 FIGURE 15 - VALUE CHAIN OF CACAO MARKET IN DAVAO REGION, WITH COOP/LEAD FIRM ........................................................ 39 FIGURE 16 - COMPARISON OF LOGISTICS COST BETWEEN SMALLHOLDER FARMERS ....................................................................... 40 FIGURE 17 - PAFA - DIRECTED GRAPH ................................................................................................................................. 42 FIGURE 18 - CORE ELEMENTS OF A PRODUCTIVE ALLIANCE ...................................................................................................... 45 FIGURE 19 - PROPOSED PROJECTS FROM STAKEHOLDERS ......................................................................................................... 48 FIGURE 20 - LOOP BOOKING STEPS .................................................................................................................................... 51
6
FIGURE 21 - MINDANAO'S INDUSTRY SECTOR HAS RECENTLY GAINED MOMENTUM... .................................................................. 54 FIGURE 22 - ALTHOUGH ITS OUTPUT SHARE HAS CONSISTENTLY REMAINED RELATIVELY SMALL COMPARED TO LUZON ........................ 54 FIGURE 23 - SHARE OF TOTAL REVENUE FROM MANUFACTURING GOODS SOLD DOMESTICALLY ACROSS ISLAND GROUPS ..................... 55 FIGURE 24 - SHARE OF TOTAL REVENUE FROM MANUFACTURING GOODS SOLD ABROAD ACROSS ISLAND GROUPS ............................. 55 FIGURE 25 - OUTPUT PER WORKER BY SIZE ........................................................................................................................... 56 FIGURE 26 - SHARE OF FIRMS BY FIRM SIZE ........................................................................................................................... 56 FIGURE 27 - LOCATIONS OF INDUSTRIAL CLUSTERS IN MINDANAO ............................................................................................ 57 FIGURE 28 - LOCATIONS OF INDUSTRIAL CLUSTERS ALONG THE ROUTE FROM MANILA TO LA UNION (LUZON) ................................. 58 FIGURE 29 - MINDANAO HAS LOW INTER-URBAN TRAFFIC FIGURE 30 - MINDANAO HAS RELATIVELY WIDER PROVINCIAL ROADS DUE
TO FEWER VEHICLES PLYING THE ROADS………………………………………………………………………………………………………………….59 FIGURE 31 - LOGISTICS SERVICE VEHICLES LIKE TRUCKS AND TRAILERS THAT PLY MINDANAO’S PRIMARY ROADS ARE FEWER COMPARED TO THOSE IN LUZON… ....... 60 FIGURE 32 - … AND THE SAME TREND IS OBSERVED EVEN IF UTILITY VEHICLES ARE USED FOR LOGISTICS SERVICES. ............................. 60 FIGURE 33 - CONTAINER TRUCKS ALONG MAIN ROUTE MANILA – LA UNION ............................................................................ 63 FIGURE 34 - CONTAINER TRUCKS ALONG MAIN ROUTE CAGAYAN DE ORO, DAVAO AND GEN SAN PORT ROUTES ............................ 65 FIGURE 35 -CONFLICT IN MINDANAO BY TYPE ...................................................................................................................... 66 FIGURE 36 - MAP OF ILLICIT TAXES AND TOLL FEES INCLUDING FORCED PAY-OFFS, BARMM, 2011-17 (AGGREGATE) ...................... 67 FIGURE 37 - MINDANAO MAP ........................................................................................................................................... 68 FIGURE 38 - VESSEL TRAFFIC, DAVAO SASA VS. DICT ............................................................................................................ 72 FIGURE 39 - MAP OF PHIVIDEC INDUSTRIAL ESTATE AND MICT ............................................................................................... 73 FIGURE 40 - LOGISTICS VALUE CHAIN AND POTENTIAL BOTTLENECKS ........................................................................................ 86 FIGURE 41 - DISTRIBUTION OF TRUCKING COMPANIES BY FLEET SIZE FOR REGION XI .................................................................... 87 FIGURE 42 - THE STANDARD COST MODEL FORMULA .......................................................................................................... 101
List of Boxes BOX 1 - DAVAO FOOD TERMINAL COMPLEX ......................................................................................................................... 49 BOX 2 - INFORMAL PAYMENTS IN THE WOOD INDUSTRY DRIVING LOGISTIC COSTS ..................................................................... 69 BOX 3 - ECONOMY-WIDE MARKET STRUCTURE .................................................................................................................... 84
List of Acronyms
ACIAR Australian Center for International Agricultural Research
APTC Agri-Pinoy Trading Center
ARTA Anti-Red Tape Authority
BASS Bandwidth and Signal Statistics
BARMM Bangsamoro Autonomous Region in Muslim Mindanao
BAPTC Benguet Agri-Pinoy Trading Center
BSU Benguet State University
BIR Bureau of Internal Revenue
BPS Bureau of Philippine Standards
CSI Chokolate de San Isidro
CDA Cooperative Development Authority
CCN Customs Client Number
DICT Davao International Container Terminal
DAR Department of Agriculture
DTI Department of Trade and Industry
DOTR Department of Transportation

7
DFF Domestic Freight Forwarders
EDSA Epifanio delos Santos Avenue
FTEB Fair Trade and Enforcement Bureau
FMR Farm-to-market roads
FEB Farmer Entrepreneurship Program
FIS Freight Interview Survey
GIS Geographic Information System
GVA Gross Value Added
HHI Herfindahl-Hirschman Indices
ICC Import Commodity Clearance
IT Information Technology
IFC International Finance Corporation
IFF International Freight Forwarders
JFC Jollibee Foods Corporation
KFI Kennemer Foods International
LTFRB Land Transport and Franchising Regulatory Board
LPI Logistics Performance Index
MICT Manila International Container Terminal
MARINA Maritime Industry Authority
MCPAT Markets Competition Policy Assessment Tool
NGO Non-governmental organization
NPDL Non-Professional Driver’s License
NVOCC Non-Vessel Operating Cargo Carrier
NVOCC Non-Vessel Owning Common Carriers
PAFA Pamuhatan Farmer’s Association
PCM Price Cost Margins
PTO Permit to Operate
PEZA Philippine Economic Zone Authority
POS Point-Of-Sale
PPA Philippine Ports Authority
PRDP Philippine Rural Development Project
PMO Port Management Office
PMR Product Market Regulation
PA Productive Alliance
PDL Professional Driver’s License
SPS sanitary and phytosanitary
SEC Securities and Exchange Commission
SME Small and Medium Enterprises
TEFASCO Terminal Facilities and Services Corp
TEU Twenty-foot Equivalent Unit
8
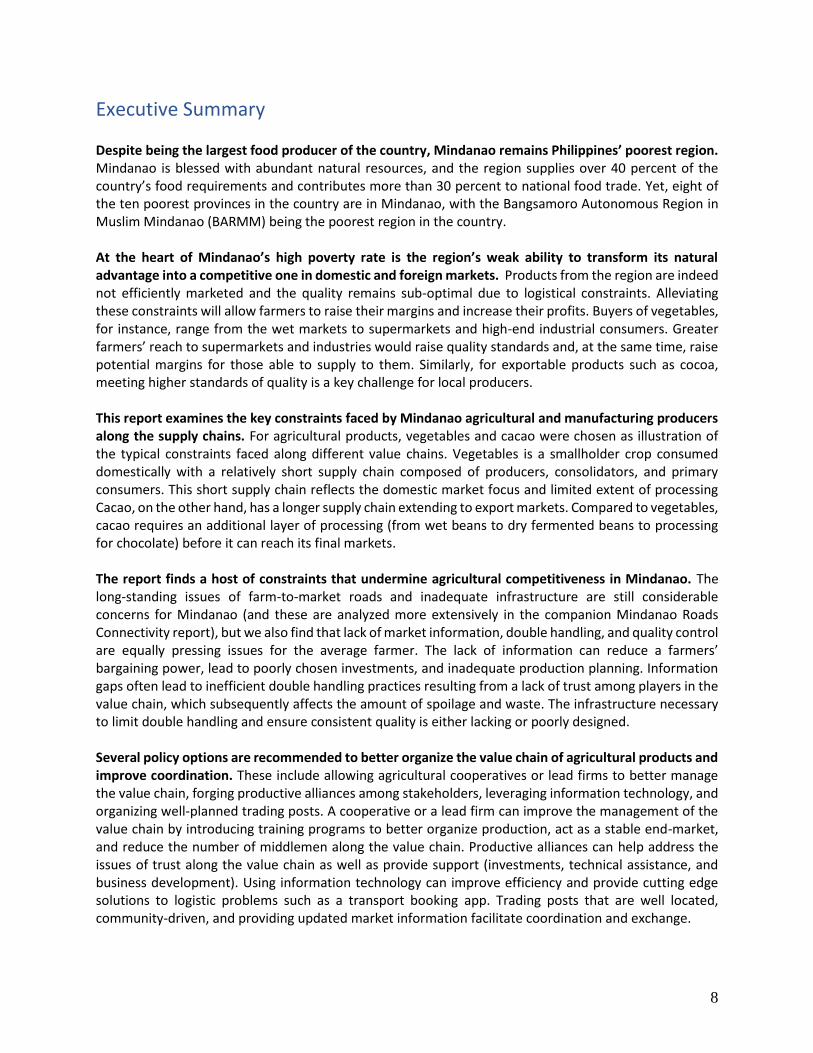
Executive Summary Despite being the largest food producer of the country, Mindanao remains Philippines’ poorest region. Mindanao is blessed with abundant natural resources, and the region supplies over 40 percent of the country’s food requirements and contributes more than 30 percent to national food trade. Yet, eight of the ten poorest provinces in the country are in Mindanao, with the Bangsamoro Autonomous Region in Muslim Mindanao (BARMM) being the poorest region in the country. At the heart of Mindanao’s high poverty rate is the region’s weak ability to transform its natural advantage into a competitive one in domestic and foreign markets. Products from the region are indeed not efficiently marketed and the quality remains sub-optimal due to logistical constraints. Alleviating these constraints will allow farmers to raise their margins and increase their profits. Buyers of vegetables, for instance, range from the wet markets to supermarkets and high-end industrial consumers. Greater farmers’ reach to supermarkets and industries would raise quality standards and, at the same time, raise potential margins for those able to supply to them. Similarly, for exportable products such as cocoa, meeting higher standards of quality is a key challenge for local producers. This report examines the key constraints faced by Mindanao agricultural and manufacturing producers along the supply chains. For agricultural products, vegetables and cacao were chosen as illustration of the typical constraints faced along different value chains. Vegetables is a smallholder crop consumed domestically with a relatively short supply chain composed of producers, consolidators, and primary consumers. This short supply chain reflects the domestic market focus and limited extent of processing Cacao, on the other hand, has a longer supply chain extending to export markets. Compared to vegetables, cacao requires an additional layer of processing (from wet beans to dry fermented beans to processing for chocolate) before it can reach its final markets. The report finds a host of constraints that undermine agricultural competitiveness in Mindanao. The long-standing issues of farm-to-market roads and inadequate infrastructure are still considerable concerns for Mindanao (and these are analyzed more extensively in the companion Mindanao Roads Connectivity report), but we also find that lack of market information, double handling, and quality control are equally pressing issues for the average farmer. The lack of information can reduce a farmers’ bargaining power, lead to poorly chosen investments, and inadequate production planning. Information gaps often lead to inefficient double handling practices resulting from a lack of trust among players in the value chain, which subsequently affects the amount of spoilage and waste. The infrastructure necessary to limit double handling and ensure consistent quality is either lacking or poorly designed. Several policy options are recommended to better organize the value chain of agricultural products and improve coordination. These include allowing agricultural cooperatives or lead firms to better manage the value chain, forging productive alliances among stakeholders, leveraging information technology, and organizing well-planned trading posts. A cooperative or a lead firm can improve the management of the value chain by introducing training programs to better organize production, act as a stable end-market, and reduce the number of middlemen along the value chain. Productive alliances can help address the issues of trust along the value chain as well as provide support (investments, technical assistance, and business development). Using information technology can improve efficiency and provide cutting edge solutions to logistic problems such as a transport booking app. Trading posts that are well located, community-driven, and providing updated market information facilitate coordination and exchange.

9
The report finds a striking contrast between agricultural and manufacturing supply chains, as logistics for the manufacturing sector is quite developed, compared to Luzon. Mindanao’s advantage over Luzon in terms of inter-city road freight and logistics stems from the dispersion of the population of Mindanao across different cities which reduces the level of transport congestion of Mindanao-based firms compared with their Luzon counterparts. Mindanao enjoys low-interurban traffic, relatively wider national roads, cheaper trucking costs on a per kilometer basis, an absence of number coding schemes, and more opportunities for backhaul. These provide significant potential benefits for growth and upgrading for manufacturing firms seeking to expand their activities. In fact, a large number of firms are leveraging this advantage already: Mindanao has been experiencing the highest rates of growth in the country over the past decade. Despite its rapid growth in recent years, further growth opportunities exist. First, firms on the island are still small, less productive, still focused on primary product processing, and generally geared for the domestic market, and thus display significant room for further development. Second, Mindanao itself is not yet considered a single market given its four urban centers are widely dispersed. Instead of treating the island as a potential 22-million wide consumer market, firms treat the cities of Davao, Cagayan de Oro, General Santos, and Zamboanga as separate markets. Industrial clusters have formed around these poles, while in contrast, in Luzon, industrial clusters developed in regions near highways. This helps explain why logistic development on the island has generally been port-city driven. Mindanao can also avoid the mistakes Metro Manila has made in addressing some of its logistic concerns. Many of the congestion problems in Metro Manila have started to appear in Mindanao such as traffic, lack of truck parking space, and container yard congestion issues. Mindanao has the opportunity to learn from Luzon’s experience by ensuring storage facilities remain sufficient and roads and parking areas for trucks are developed while land remains abundant. To address within-city congestion, Mindanao has opted to follow Metro Manila by implementing its own truck bans. While decongesting the roads, this may have implications for competition. For a durable expansion of an efficient logistics industry to support agriculture and manufacturing in Mindanao, however, further issues must be addressed:
• Security. Existing security concerns in urban areas pose additional impediments to moving cargo
around. Idle trucks can be victim to gas theft and informal checkpoints may impose additional
costs for travelling trucks. Conflict in certain areas also limits the routes a truck may travel through
and act as a deterrent for investments in affected areas.
• Ports. An upgrading of Mindanao’s ports should complement the improvements in inter-city
travel and lead to greater port consolidation and more direct shipments. The government should
more strongly leverage the private sector to design and implement large scale projects, utilizing
the privately-owned Davao International Container Terminal as an example for expanding the
capacity of Cagayan de Oro, General Santos and Davao-Sasa ports.
• Complex regulations and red tape. Complex regulatory procedures continue to hamper
investments in the logistics sector, especially the centralized processing of paper-based
requirements in Manila, the annual renewal of permits, and the prevalence of local pass-through
permits. Doing business in the Philippines is notably difficult with the country ranking 95th out of
190 countries in the latest 2020 World Bank Doing Business Indicators. To compound this, many
of the requirements are paper-based and processed centrally in Metro Manila.

10
• Limited clarity of responsibilities between public entities. The complexity of the regulations is
made worse by the lack of clarity in the devolution of powers to the Bangsamoro Autonomous
Region of Muslim Mindanao (BARMM). Instead of regional offices, BARMM has parallel
government agencies that may or may not be coordinated with the national government. There
does not seem to be any clear guidelines detailing which particular functions have been devolved
to the BARMM regional government and which functions are retained by the national
government.
• Competition issues. Several regulations reduce the degree of competition in logistics services,
namely trucking, port operations, domestic shipping, and freight forwarding. To illustrate, there
are foreign ownership restrictions in transportation and freight forwarding. Other competition
restrictions include the truck bans that limit the number of vehicles on the road, and inadequate
port facilities and other physical infrastructural limitations that restrict the kind of vessels serving
Mindanao.
In sum, Mindanao is rich with untapped potential that can be unleashed if we can better organize the agro-logistic value chain, further enhance inter-city logistics so Mindanao can function as an entire market and producer, streamline regulations and remove complex regulatory barriers, and improve market competition to ensure a more efficient and lower cost of doing business on the island. The table below summarizes the recommendations in the paper.
Issue Recommendation Instrument
Rural-to-Urban Logistics
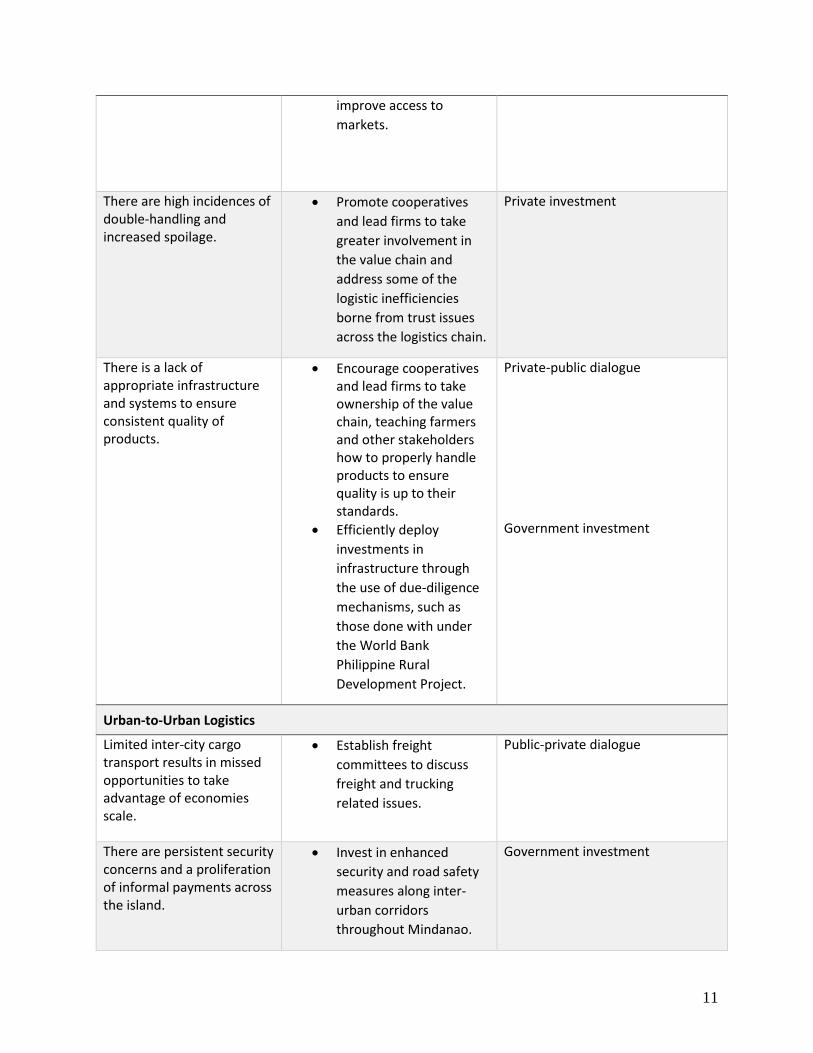
There is a general lack of information or access to up-to-date information in terms of market prices and consumer demand.
• Set up additional trading centers that provide better information. These centers should be based on intensive consultations with users and built with specifications required by stakeholders.
• Employ suggested IT solutions to improve access to information and finance.
• Encourage the formation
of productive alliances
between producers,
buyers, and the public
sector to better
coordinate production,
sell collectively, increase
competitiveness, and
Private – public partnership Private investment Public-private dialogue
11
improve access to
markets.
There are high incidences of double-handling and increased spoilage.
• Promote cooperatives
and lead firms to take
greater involvement in
the value chain and
address some of the
logistic inefficiencies
borne from trust issues
across the logistics chain.
Private investment
There is a lack of appropriate infrastructure and systems to ensure consistent quality of products.
• Encourage cooperatives and lead firms to take ownership of the value chain, teaching farmers and other stakeholders how to properly handle products to ensure quality is up to their standards.
• Efficiently deploy
investments in
infrastructure through
the use of due-diligence
mechanisms, such as
those done with under
the World Bank
Philippine Rural
Development Project.
Private-public dialogue Government investment
Urban-to-Urban Logistics
Limited inter-city cargo transport results in missed opportunities to take advantage of economies scale.
• Establish freight
committees to discuss
freight and trucking
related issues.
Public-private dialogue
There are persistent security concerns and a proliferation of informal payments across the island.
• Invest in enhanced
security and road safety
measures along inter-
urban corridors
throughout Mindanao.
Government investment
12
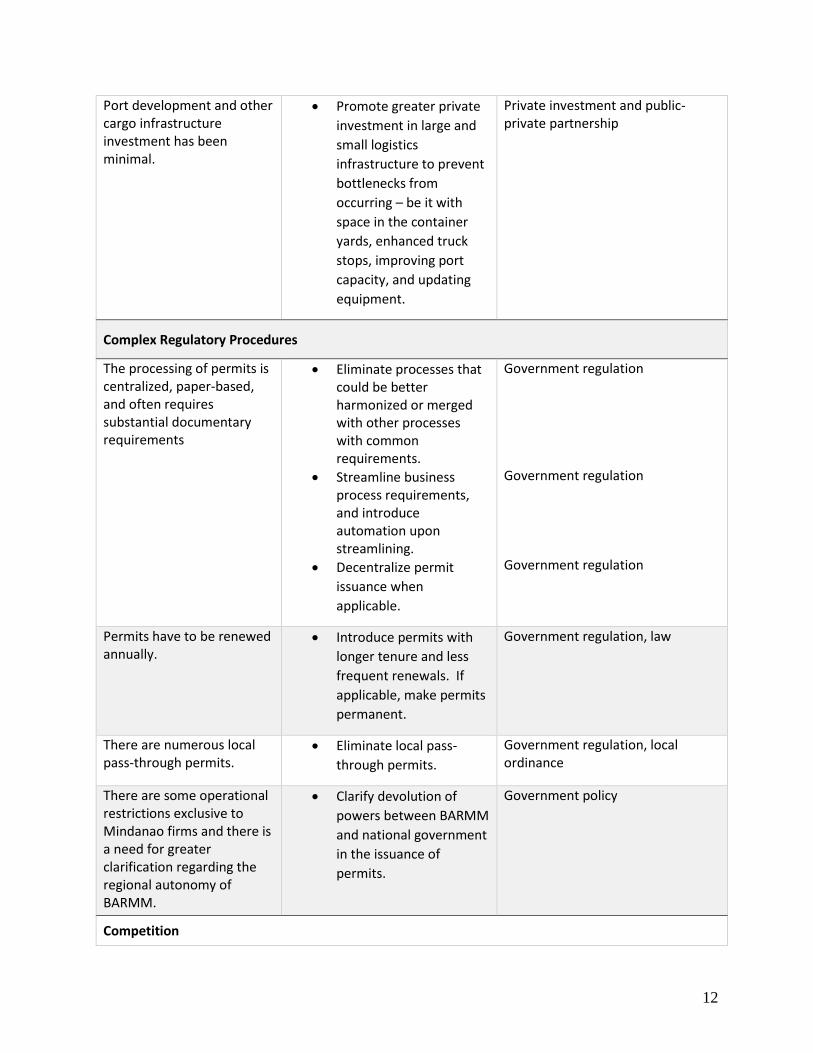
Port development and other cargo infrastructure investment has been minimal.
• Promote greater private
investment in large and
small logistics
infrastructure to prevent
bottlenecks from
occurring – be it with
space in the container
yards, enhanced truck
stops, improving port
capacity, and updating
equipment.
Private investment and public-private partnership
Complex Regulatory Procedures
The processing of permits is centralized, paper-based, and often requires substantial documentary requirements
• Eliminate processes that could be better harmonized or merged with other processes with common requirements.
• Streamline business process requirements, and introduce automation upon streamlining.
• Decentralize permit
issuance when
applicable.
Government regulation Government regulation Government regulation
Permits have to be renewed annually.
• Introduce permits with
longer tenure and less
frequent renewals. If
applicable, make permits
permanent.
Government regulation, law
There are numerous local pass-through permits.
• Eliminate local pass-
through permits.
Government regulation, local ordinance
There are some operational restrictions exclusive to Mindanao firms and there is a need for greater clarification regarding the regional autonomy of BARMM.
• Clarify devolution of
powers between BARMM
and national government
in the issuance of
permits.
Government policy
Competition

13
The ban on private trucking from carrying freight not belonging to the registered owner reduces efficiency and may represent a barrier to entry for new digital platforms.
• Reduce the restrictions
on private trucks to carry
freight not belonging to
the registered owner
while ensuring safety
standards are still met.
Government regulation
There are restrictions on foreign entry into public utility services.
• Clarify the legal definition
of Public Utilities to allow
greater foreign
investments in trucking
and other transport
services.
National law
The discretionary power granted to MARINA to intervene in prices for domestic shipping may negatively affect competition.
• Elimination of price
interference in Freight
Forwarding and Domestic
Shipping.
Government policy
There is a conflict of interest regarding the PPA's role as both regulator and operator of ports.
• Ensure competitive neutrality between public and private ports.
• Separate the PPA
regulatory function from
its ports development
and operations functions
to level the playing field
through greater private
management of ports.
Government policy National law
14
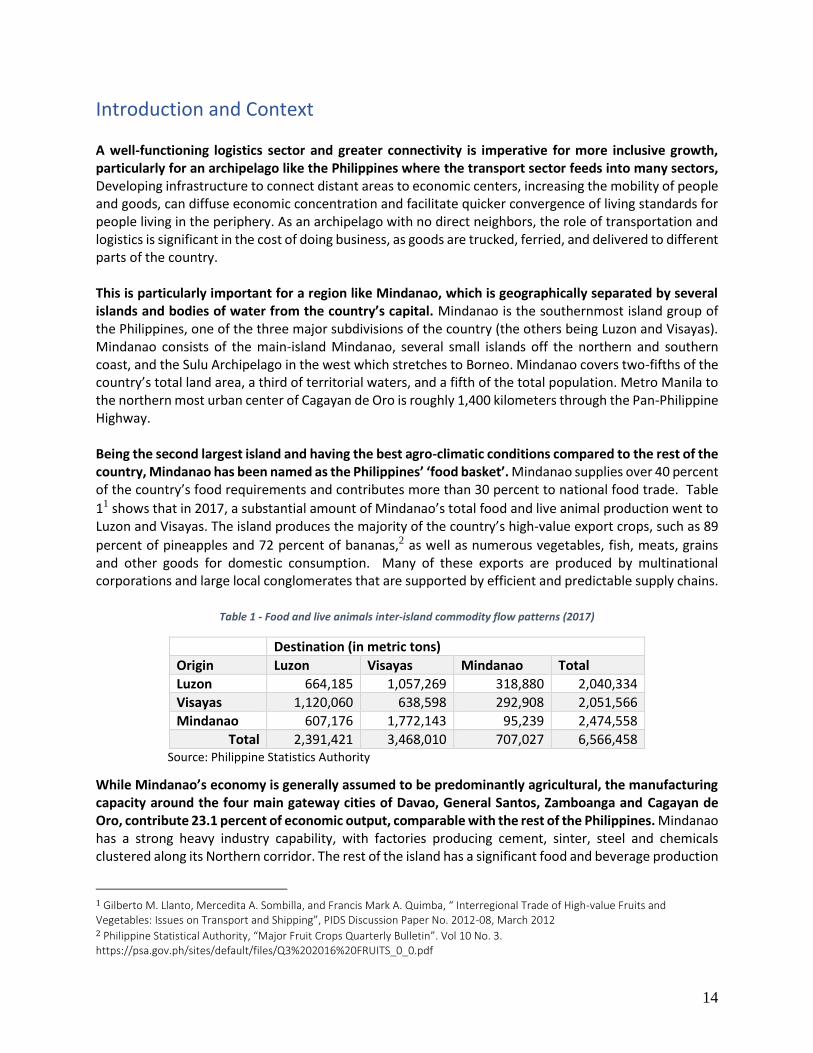
Introduction and Context A well-functioning logistics sector and greater connectivity is imperative for more inclusive growth, particularly for an archipelago like the Philippines where the transport sector feeds into many sectors, Developing infrastructure to connect distant areas to economic centers, increasing the mobility of people and goods, can diffuse economic concentration and facilitate quicker convergence of living standards for people living in the periphery. As an archipelago with no direct neighbors, the role of transportation and logistics is significant in the cost of doing business, as goods are trucked, ferried, and delivered to different parts of the country. This is particularly important for a region like Mindanao, which is geographically separated by several islands and bodies of water from the country’s capital. Mindanao is the southernmost island group of the Philippines, one of the three major subdivisions of the country (the others being Luzon and Visayas). Mindanao consists of the main-island Mindanao, several small islands off the northern and southern coast, and the Sulu Archipelago in the west which stretches to Borneo. Mindanao covers two-fifths of the country’s total land area, a third of territorial waters, and a fifth of the total population. Metro Manila to the northern most urban center of Cagayan de Oro is roughly 1,400 kilometers through the Pan-Philippine Highway. Being the second largest island and having the best agro-climatic conditions compared to the rest of the country, Mindanao has been named as the Philippines’ ‘food basket’. Mindanao supplies over 40 percent of the country’s food requirements and contributes more than 30 percent to national food trade. Table
11 shows that in 2017, a substantial amount of Mindanao’s total food and live animal production went to Luzon and Visayas. The island produces the majority of the country’s high-value export crops, such as 89
percent of pineapples and 72 percent of bananas,2 as well as numerous vegetables, fish, meats, grains and other goods for domestic consumption. Many of these exports are produced by multinational corporations and large local conglomerates that are supported by efficient and predictable supply chains.
Table 1 - Food and live animals inter-island commodity flow patterns (2017)
Destination (in metric tons)
Origin Luzon Visayas Mindanao Total
Luzon 664,185 1,057,269 318,880 2,040,334
Visayas 1,120,060 638,598 292,908 2,051,566
Mindanao 607,176 1,772,143 95,239 2,474,558
Total 2,391,421 3,468,010 707,027 6,566,458 Source: Philippine Statistics Authority
While Mindanao’s economy is generally assumed to be predominantly agricultural, the manufacturing capacity around the four main gateway cities of Davao, General Santos, Zamboanga and Cagayan de Oro, contribute 23.1 percent of economic output, comparable with the rest of the Philippines. Mindanao has a strong heavy industry capability, with factories producing cement, sinter, steel and chemicals clustered along its Northern corridor. The rest of the island has a significant food and beverage production
1 Gilberto M. Llanto, Mercedita A. Sombilla, and Francis Mark A. Quimba, “ Interregional Trade of High-value Fruits and Vegetables: Issues on Transport and Shipping”, PIDS Discussion Paper No. 2012-08, March 2012 2 Philippine Statistical Authority, “Major Fruit Crops Quarterly Bulletin”. Vol 10 No. 3. https://psa.gov.ph/sites/default/files/Q3%202016%20FRUITS_0_0.pdf
15
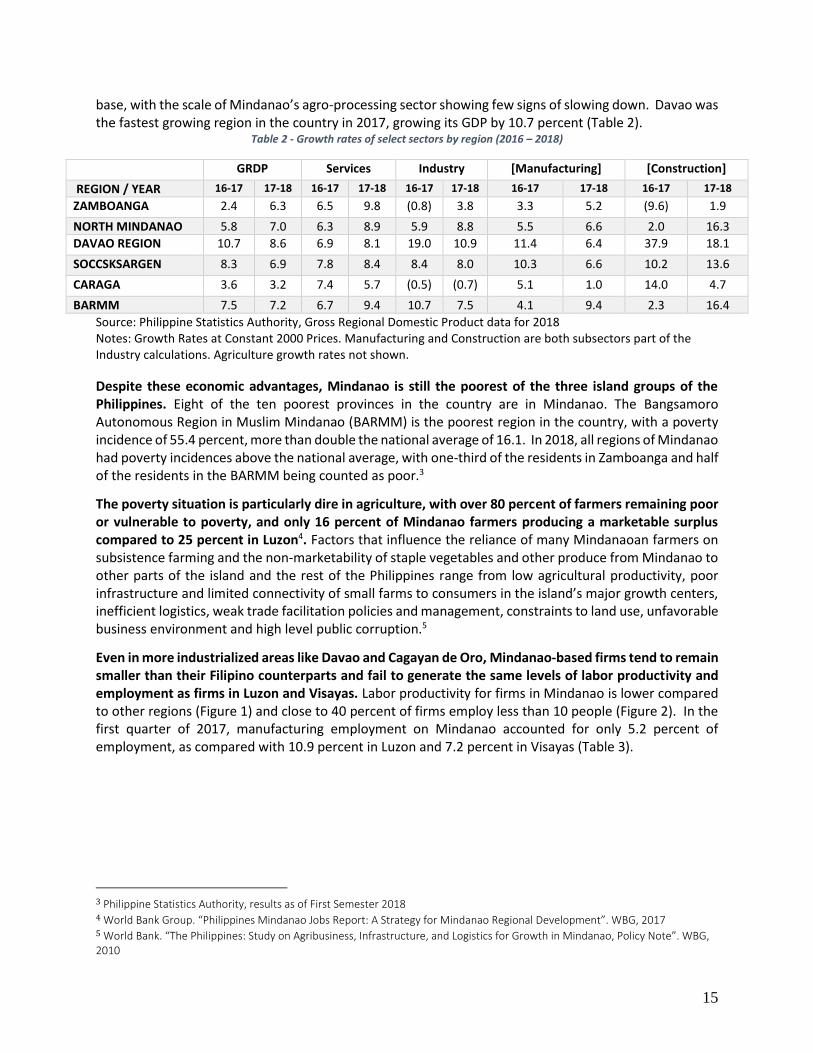
base, with the scale of Mindanao’s agro-processing sector showing few signs of slowing down. Davao was the fastest growing region in the country in 2017, growing its GDP by 10.7 percent (Table 2).
Table 2 - Growth rates of select sectors by region (2016 – 2018)
GRDP Services Industry [Manufacturing] [Construction]
REGION / YEAR 16-17 17-18 16-17 17-18 16-17 17-18 16-17 17-18 16-17 17-18
ZAMBOANGA 2.4 6.3 6.5 9.8 (0.8) 3.8 3.3 5.2 (9.6) 1.9
NORTH MINDANAO 5.8 7.0 6.3 8.9 5.9 8.8 5.5 6.6 2.0 16.3
DAVAO REGION 10.7 8.6 6.9 8.1 19.0 10.9 11.4 6.4 37.9 18.1
SOCCSKSARGEN 8.3 6.9 7.8 8.4 8.4 8.0 10.3 6.6 10.2 13.6
CARAGA 3.6 3.2 7.4 5.7 (0.5) (0.7) 5.1 1.0 14.0 4.7
BARMM 7.5 7.2 6.7 9.4 10.7 7.5 4.1 9.4 2.3 16.4
Source: Philippine Statistics Authority, Gross Regional Domestic Product data for 2018 Notes: Growth Rates at Constant 2000 Prices. Manufacturing and Construction are both subsectors part of the Industry calculations. Agriculture growth rates not shown.
Despite these economic advantages, Mindanao is still the poorest of the three island groups of the Philippines. Eight of the ten poorest provinces in the country are in Mindanao. The Bangsamoro Autonomous Region in Muslim Mindanao (BARMM) is the poorest region in the country, with a poverty incidence of 55.4 percent, more than double the national average of 16.1. In 2018, all regions of Mindanao had poverty incidences above the national average, with one-third of the residents in Zamboanga and half of the residents in the BARMM being counted as poor.3
The poverty situation is particularly dire in agriculture, with over 80 percent of farmers remaining poor or vulnerable to poverty, and only 16 percent of Mindanao farmers producing a marketable surplus compared to 25 percent in Luzon4. Factors that influence the reliance of many Mindanaoan farmers on subsistence farming and the non-marketability of staple vegetables and other produce from Mindanao to other parts of the island and the rest of the Philippines range from low agricultural productivity, poor infrastructure and limited connectivity of small farms to consumers in the island’s major growth centers, inefficient logistics, weak trade facilitation policies and management, constraints to land use, unfavorable business environment and high level public corruption.5
Even in more industrialized areas like Davao and Cagayan de Oro, Mindanao-based firms tend to remain smaller than their Filipino counterparts and fail to generate the same levels of labor productivity and employment as firms in Luzon and Visayas. Labor productivity for firms in Mindanao is lower compared to other regions (Figure 1) and close to 40 percent of firms employ less than 10 people (Figure 2). In the first quarter of 2017, manufacturing employment on Mindanao accounted for only 5.2 percent of employment, as compared with 10.9 percent in Luzon and 7.2 percent in Visayas (Table 3).
3 Philippine Statistics Authority, results as of First Semester 2018 4 World Bank Group. “Philippines Mindanao Jobs Report: A Strategy for Mindanao Regional Development”. WBG, 2017 5 World Bank. “The Philippines: Study on Agribusiness, Infrastructure, and Logistics for Growth in Mindanao, Policy Note”. WBG, 2010

16
Figure 1 - Output per worker by size Figure 2 - Share of firms by firm size
Source: Census of Philippine Businesses and Industries, 2012,
Manufacturing Source: Census of Philippine Businesses and Industries, 2012,
Manufacturing
Table 3 - Share of Employment in Manufacturing from Total, by major island groups, April 2017
Region/Year April 2017 Share of Manufacturing from Total Employment
Total Manufacturing Employment
Luzon 2,434 10.9%
Visayas 597 7.2%
Mindanao 502 5.2%
Total Employment
Luzon 22,390
Visayas 8,291
Mindanao 9,591 Source: Philippine Statistics Authority Note: units in (‘000 persons)
While Mindanao can ideally be seen as a single island market, it is still logistically divided around its main urban centers, leading to the loss of economies of scale. Firms consider the four major cities as four separate markets. Unlike Luzon where a bulk of the population is concentrated around a highly congested capital region, Mindanao’s population is spread across the urban centers on its Northern, Eastern, Southern and Western sides. The four major cities are Cagayan de Oro, Davao, General Santos and Zamboanga, respectively, each of which has a population that ranges from 600,000 to 1.5 million people6. With a total population comprising of almost 22 million people, Mindanao’s market can benefit from being treated as a single market, which can lead to economies of scale and dramatically lower logistics costs.
6 According to the 2010 Census, Davao city had a population of 1,449,296, Cagayan de Oro City had a population of 602,088, General Santos City had a population of 538,086, and Zamboanga of 807,129.
17
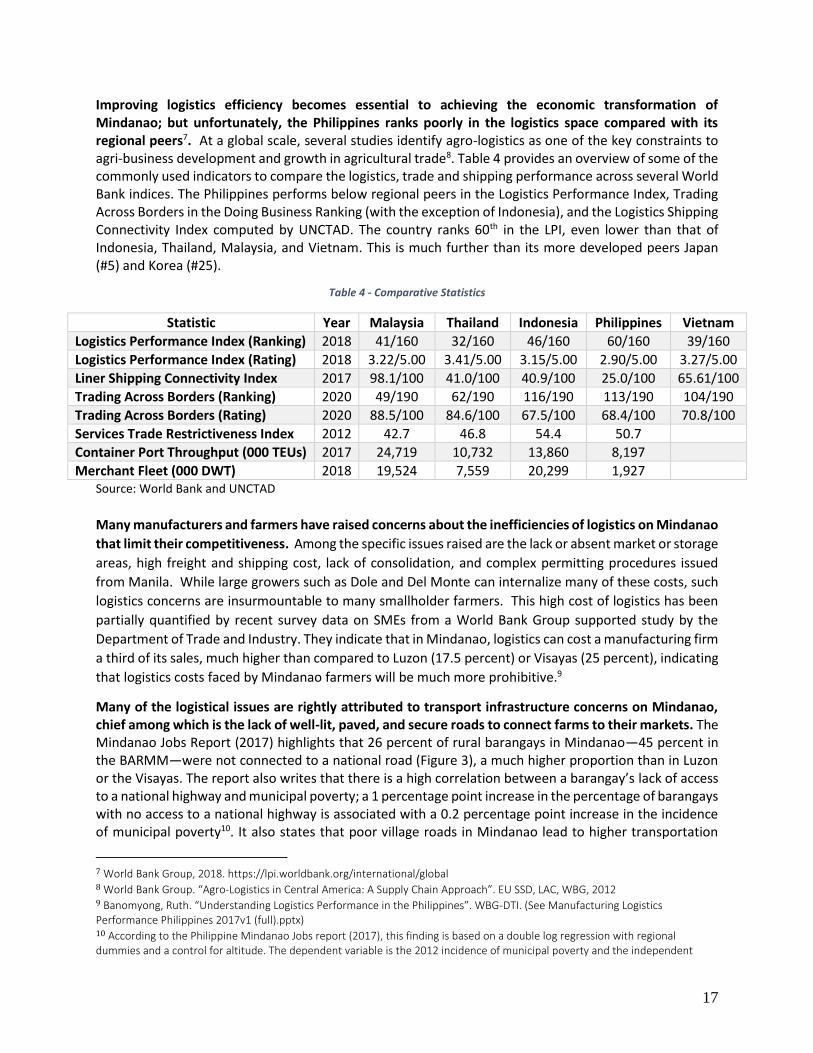
Improving logistics efficiency becomes essential to achieving the economic transformation of Mindanao; but unfortunately, the Philippines ranks poorly in the logistics space compared with its regional peers7. At a global scale, several studies identify agro-logistics as one of the key constraints to agri-business development and growth in agricultural trade8. Table 4 provides an overview of some of the commonly used indicators to compare the logistics, trade and shipping performance across several World Bank indices. The Philippines performs below regional peers in the Logistics Performance Index, Trading Across Borders in the Doing Business Ranking (with the exception of Indonesia), and the Logistics Shipping Connectivity Index computed by UNCTAD. The country ranks 60th in the LPI, even lower than that of Indonesia, Thailand, Malaysia, and Vietnam. This is much further than its more developed peers Japan (#5) and Korea (#25).
Table 4 - Comparative Statistics
Statistic Year Malaysia Thailand Indonesia Philippines Vietnam
Logistics Performance Index (Ranking) 2018 41/160 32/160 46/160 60/160 39/160
Logistics Performance Index (Rating) 2018 3.22/5.00 3.41/5.00 3.15/5.00 2.90/5.00 3.27/5.00
Liner Shipping Connectivity Index 2017 98.1/100 41.0/100 40.9/100 25.0/100 65.61/100
Trading Across Borders (Ranking) 2020 49/190 62/190 116/190 113/190 104/190
Trading Across Borders (Rating) 2020 88.5/100 84.6/100 67.5/100 68.4/100 70.8/100
Services Trade Restrictiveness Index 2012 42.7 46.8 54.4 50.7
Container Port Throughput (000 TEUs) 2017 24,719 10,732 13,860 8,197
Merchant Fleet (000 DWT) 2018 19,524 7,559 20,299 1,927 Source: World Bank and UNCTAD
Many manufacturers and farmers have raised concerns about the inefficiencies of logistics on Mindanao
that limit their competitiveness. Among the specific issues raised are the lack or absent market or storage
areas, high freight and shipping cost, lack of consolidation, and complex permitting procedures issued
from Manila. While large growers such as Dole and Del Monte can internalize many of these costs, such
logistics concerns are insurmountable to many smallholder farmers. This high cost of logistics has been
partially quantified by recent survey data on SMEs from a World Bank Group supported study by the
Department of Trade and Industry. They indicate that in Mindanao, logistics can cost a manufacturing firm
a third of its sales, much higher than compared to Luzon (17.5 percent) or Visayas (25 percent), indicating
that logistics costs faced by Mindanao farmers will be much more prohibitive.9
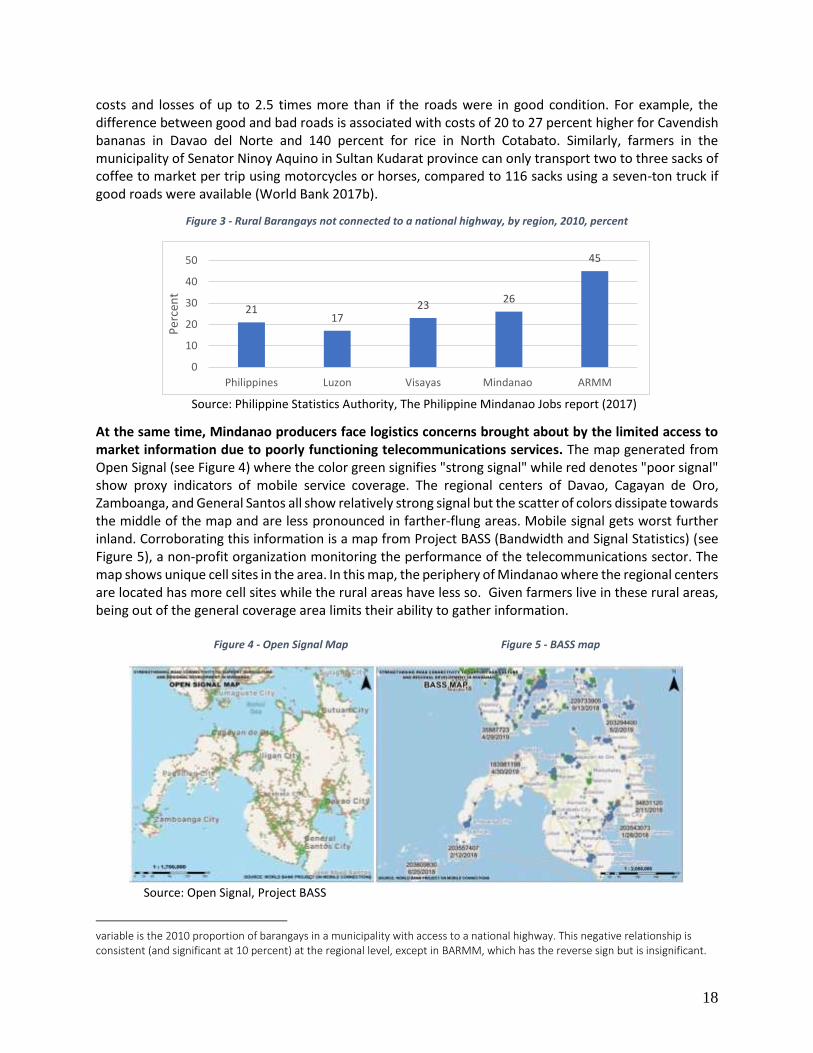
Many of the logistical issues are rightly attributed to transport infrastructure concerns on Mindanao, chief among which is the lack of well-lit, paved, and secure roads to connect farms to their markets. The Mindanao Jobs Report (2017) highlights that 26 percent of rural barangays in Mindanao—45 percent in the BARMM—were not connected to a national road (Figure 3), a much higher proportion than in Luzon or the Visayas. The report also writes that there is a high correlation between a barangay’s lack of access to a national highway and municipal poverty; a 1 percentage point increase in the percentage of barangays with no access to a national highway is associated with a 0.2 percentage point increase in the incidence of municipal poverty10. It also states that poor village roads in Mindanao lead to higher transportation
7 World Bank Group, 2018. https://lpi.worldbank.org/international/global 8 World Bank Group. “Agro-Logistics in Central America: A Supply Chain Approach”. EU SSD, LAC, WBG, 2012 9 Banomyong, Ruth. “Understanding Logistics Performance in the Philippines”. WBG-DTI. (See Manufacturing Logistics Performance Philippines 2017v1 (full).pptx) 10 According to the Philippine Mindanao Jobs report (2017), this finding is based on a double log regression with regional dummies and a control for altitude. The dependent variable is the 2012 incidence of municipal poverty and the independent
18
costs and losses of up to 2.5 times more than if the roads were in good condition. For example, the difference between good and bad roads is associated with costs of 20 to 27 percent higher for Cavendish bananas in Davao del Norte and 140 percent for rice in North Cotabato. Similarly, farmers in the municipality of Senator Ninoy Aquino in Sultan Kudarat province can only transport two to three sacks of coffee to market per trip using motorcycles or horses, compared to 116 sacks using a seven-ton truck if good roads were available (World Bank 2017b).
Figure 3 - Rural Barangays not connected to a national highway, by region, 2010, percent
Source: Philippine Statistics Authority, The Philippine Mindanao Jobs report (2017)
At the same time, Mindanao producers face logistics concerns brought about by the limited access to market information due to poorly functioning telecommunications services. The map generated from Open Signal (see Figure 4) where the color green signifies "strong signal" while red denotes "poor signal" show proxy indicators of mobile service coverage. The regional centers of Davao, Cagayan de Oro, Zamboanga, and General Santos all show relatively strong signal but the scatter of colors dissipate towards the middle of the map and are less pronounced in farther-flung areas. Mobile signal gets worst further inland. Corroborating this information is a map from Project BASS (Bandwidth and Signal Statistics) (see Figure 5), a non-profit organization monitoring the performance of the telecommunications sector. The map shows unique cell sites in the area. In this map, the periphery of Mindanao where the regional centers are located has more cell sites while the rural areas have less so. Given farmers live in these rural areas, being out of the general coverage area limits their ability to gather information.
Figure 4 - Open Signal Map Figure 5 - BASS map
Source: Open Signal, Project BASS
variable is the 2010 proportion of barangays in a municipality with access to a national highway. This negative relationship is consistent (and significant at 10 percent) at the regional level, except in BARMM, which has the reverse sign but is insignificant.
2117
2326
45
0
10
20
30
40
50
Philippines Luzon Visayas Mindanao ARMM
Per
cen
t

19
As transportation and communications infrastructure issues are tackled in different World Bank Reports, this study will focus solely on other logistical concerns that lead to inefficient outcomes. Logistics refers to the services, technology, infrastructure and information systems that allow commodities to move from the original point of production to the final point of consumption. Logistics concerns all activities in the supply chain to match product supply from the producer to the market demand for those products. It aims at getting the right commodity in the right place, at the right time, with the right specifications (including quality requirements), and at the lowest cost. Logistics inefficiencies can manifest in the form of poor coordination, limited information, limited consolidation centers, security issues, trucking bans, absence of laboratory testing facilities, and complex permitting procedures for compliance with business registration, biosecurity and food safety requirements.11 Large agri-business firms can internalize many of these costs and can operate with a higher degree of vertical integration, giving them a comparative advantage over unorganized, SME-based supply chain suppliers. For smaller firms, difficulties in compliance with regulations to formalize prevent even simple transactions, such as producers wanting to sell directly to hotels or supermarkets as they require formal contracts and official receipts.
More specific logistic concerns pertaining to physical infrastructure will be tackled separately in the
Mindanao Roads Connectivity report produced by the Transport Global Practice of the World Bank, as
such, this paper will limit its discussion towards soft logistic issues. Logistics issues often concern
infrastructure which can be subdivided into “Hard Infrastructure” and “Soft Infrastructure.” Hard
Infrastructure refers to the physical networks necessary (i.e. roads and bridges) to ensure movements of
goods from their origin to their destination. This report looks at the softer logistics infrastructure affecting
private sector development. For the purposes of this report, soft infrastructure refers to the non-physical
requirements for distribution such as technology, regulations, competition, and so on. This paper shows
that while farm-to-market roads are important, the information that farmers receive, the trust among
stakeholders, the regulations and market competition that govern the supply chain, are all equally
important to ensure the most efficient delivery of products.
This study reflects on the logistics performance of Mindanao across four interrelated lenses: rural-to-
urban logistics, urban-to-urban logistics, government regulation and private-sector competition. These
four topics allow us to subdivide the analysis of logistics by focusing on the logistics requirements of
archetypal agricultural and industrial products produced on the island, the regulations imposed by the
government on the firm that produces these products, and the government interventions that affect the
behavior of third-party firms that supply the logistics inputs. Such a holistic approach allows us a better
snapshot of the main logistics issues faced by firms and helps highlight the priority reform areas that
would allow for the flourishing of the logistics sector on Mindanao. More details on some of the
methodology used in this report can be found in the Appendix.
11 Issues raised during consultation workshops held in Davao, November 2017

20
Chapter 1.
Rural Logistics and Agricultural Development
In rural Mindanao, inefficient rural-to-urban logistics contribute to the low performance of most agricultural supply chains and the persistence of high rates of poverty.12 For producers of fruits, meats and other agricultural commodities, logistics efficiency is critical to guarantee freshness, quality and safety when the product reaches the final market. Particularly for export agri-business products, costs remain the main driver for competition for these widely-traded commodities, and therefore, the value chain needs to be cost-efficient at all stages.13 Efficient logistics is the first factor of competitiveness in agriculture and a primary constraint particularly for smallholders.
Especially given the growing urban population on the island, food security and economic livelihoods are becoming increasingly dependent on agricultural supply chains that can overcome many logistic inefficiencies, particularly those found at the farm level. With greater urbanization and increasing consumption on the island, the ability of the rural hinterlands to produce and deliver fresh fruits, meats and vegetables for households, restaurants, or food processors to the main towns and cities is integral to Mindanao’s economic development. This chapter seeks to understand these issues in greater detail by (1) identifying rural-urban logistics inefficiencies, from farm gate to the retail point in Mindanao; (2) performing a network analysis of a key value chain; and (3) providing examples of mechanisms to facilitate more efficient rural-urban logistics. For the sake of expediency, the logistics chain analyses in this paper focuses on only two archetypal value chains: vegetables for the domestic market and cacao for the export market, in order to demonstrate the logistics issues that are prevalent, albeit in different degrees, to other agricultural production chains, such as fruit, livestock and grains. The former serves as a good example of a value chain with a large end domestic market, while the latter serves as a good example of a value chain that has strong linkages with the international supply chain. Vegetables were chosen primarily because this smallholder crop has a relatively short logistics chain of producers, consolidators, and primary consumers since vegetables are consumed locally as a food source in Mindanao, with only a small percentage used for food processing. Yet, the product has many logistics concerns given its significant handling needs to maintain freshness and limit wastage. The largest trading center in the country, the Benguet Trading complex, estimates that 330 MT per day volume of waste is generated in its facilities alone during peak operation (Development Academy of the Philippines 2011). Over the last fifteen years, vegetable supply registered an average annual growth rate of 3 percent resulting to a total of volume of 5.26 million metric tons, even though the land area planted for vegetables experienced only an average growth rate of 0.2 percent, which is not sufficient to feed the growing local population. As such, vegetable consumption is trending down in the country (Philippine Statistics Authority 2018), especially with the consumption of root crops and leguminous vegetables taking a significant fall from 2000 to 2012 (See Table 5). Consumption of vegetables is even less apparent when compared to neighboring countries where the Philippines falls last among its neighbors in Southeast Asia
12 World Bank. “Rural Connectivity and Smallholder Agricultural Supply Chains in Remote Areas of Southeast Asia: Case Studies from Vietnam and the Philippines”. WBG: 2014 13 World Bank. “The Philippines: Study on Agribusiness, Infrastructure, and Logistics for Growth in Mindanao, Policy Note”. WBG, 2010
21
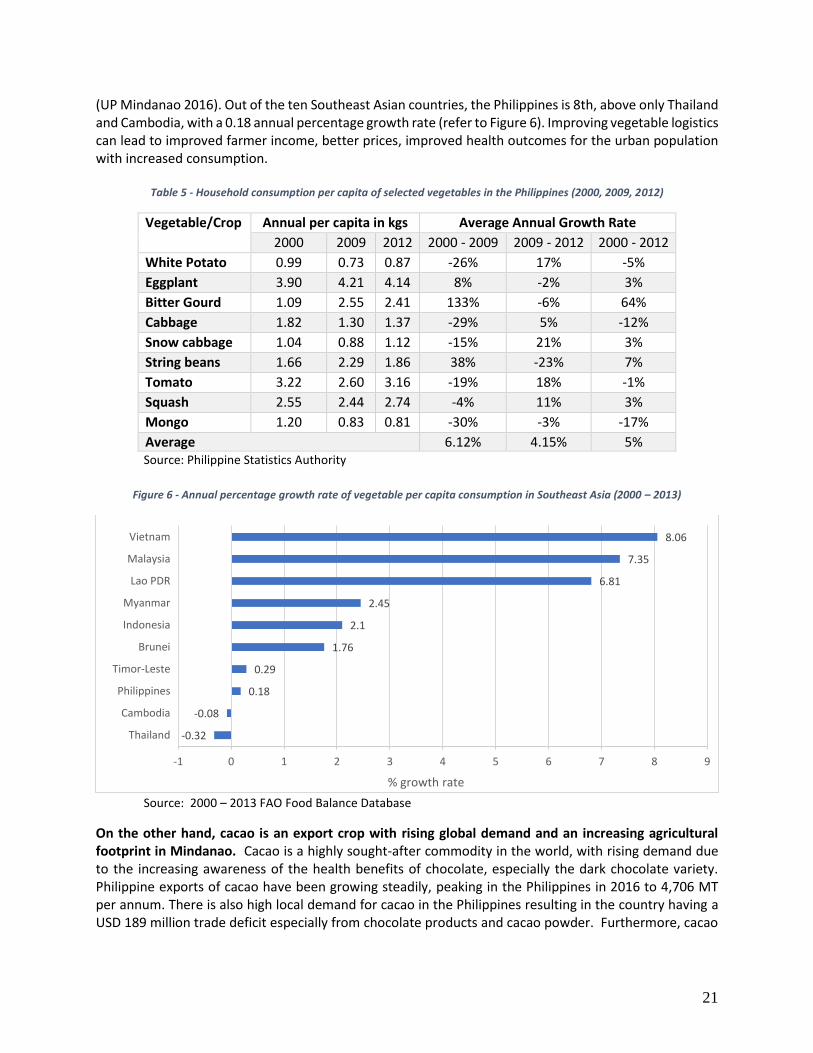
(UP Mindanao 2016). Out of the ten Southeast Asian countries, the Philippines is 8th, above only Thailand and Cambodia, with a 0.18 annual percentage growth rate (refer to Figure 6). Improving vegetable logistics can lead to improved farmer income, better prices, improved health outcomes for the urban population with increased consumption.
Table 5 - Household consumption per capita of selected vegetables in the Philippines (2000, 2009, 2012)
Vegetable/Crop Annual per capita in kgs Average Annual Growth Rate
2000 2009 2012 2000 - 2009 2009 - 2012 2000 - 2012
White Potato 0.99 0.73 0.87 -26% 17% -5%
Eggplant 3.90 4.21 4.14 8% -2% 3%
Bitter Gourd 1.09 2.55 2.41 133% -6% 64%
Cabbage 1.82 1.30 1.37 -29% 5% -12%
Snow cabbage 1.04 0.88 1.12 -15% 21% 3%
String beans 1.66 2.29 1.86 38% -23% 7%
Tomato 3.22 2.60 3.16 -19% 18% -1%
Squash 2.55 2.44 2.74 -4% 11% 3%
Mongo 1.20 0.83 0.81 -30% -3% -17%
Average 6.12% 4.15% 5% Source: Philippine Statistics Authority
Figure 6 - Annual percentage growth rate of vegetable per capita consumption in Southeast Asia (2000 – 2013)
Source: 2000 – 2013 FAO Food Balance Database
On the other hand, cacao is an export crop with rising global demand and an increasing agricultural footprint in Mindanao. Cacao is a highly sought-after commodity in the world, with rising demand due to the increasing awareness of the health benefits of chocolate, especially the dark chocolate variety. Philippine exports of cacao have been growing steadily, peaking in the Philippines in 2016 to 4,706 MT per annum. There is also high local demand for cacao in the Philippines resulting in the country having a USD 189 million trade deficit especially from chocolate products and cacao powder. Furthermore, cacao
-0.32
-0.08
0.18
0.29
1.76
2.1
2.45
6.81
7.35
8.06
-1 0 1 2 3 4 5 6 7 8 9
Thailand
Cambodia
Philippines
Timor-Leste
Brunei
Indonesia
Myanmar
Lao PDR
Malaysia
Vietnam
% growth rate
22
requires a more complex supply chain, which includes processors, grinders, and chocolate manufacturers, allowing us to also assess product quality and transformation issues.
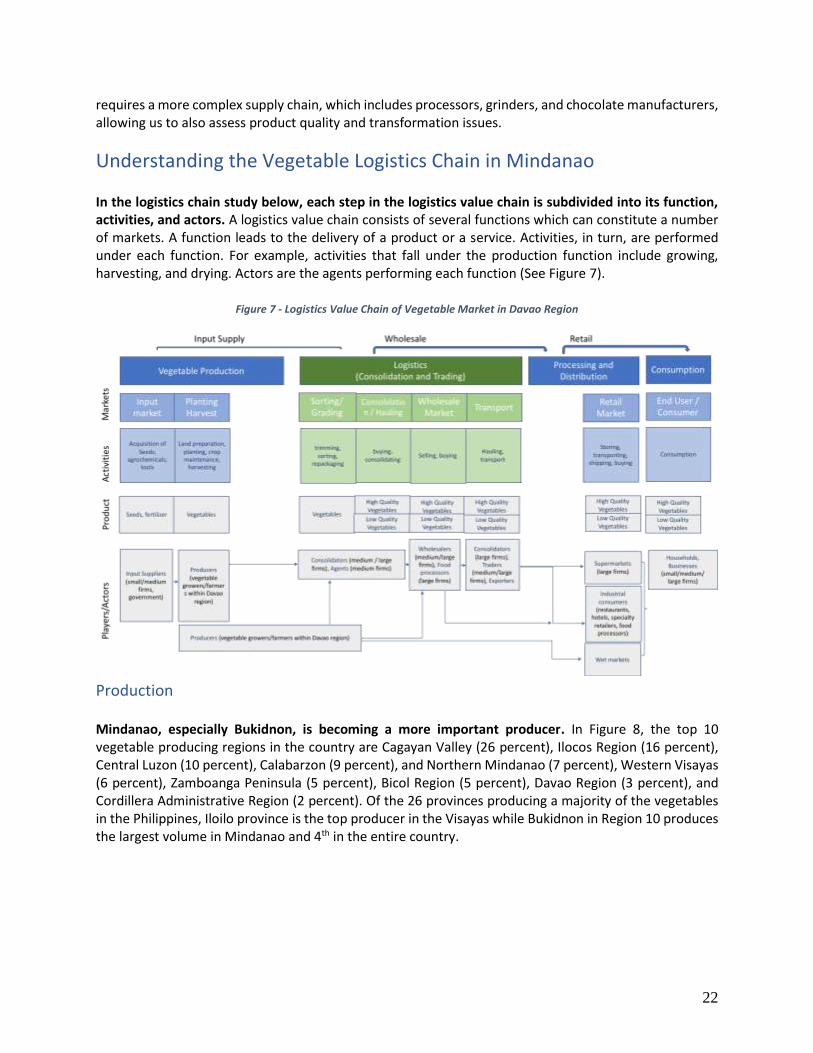
Understanding the Vegetable Logistics Chain in Mindanao In the logistics chain study below, each step in the logistics value chain is subdivided into its function, activities, and actors. A logistics value chain consists of several functions which can constitute a number of markets. A function leads to the delivery of a product or a service. Activities, in turn, are performed under each function. For example, activities that fall under the production function include growing, harvesting, and drying. Actors are the agents performing each function (See Figure 7).
Figure 7 - Logistics Value Chain of Vegetable Market in Davao Region
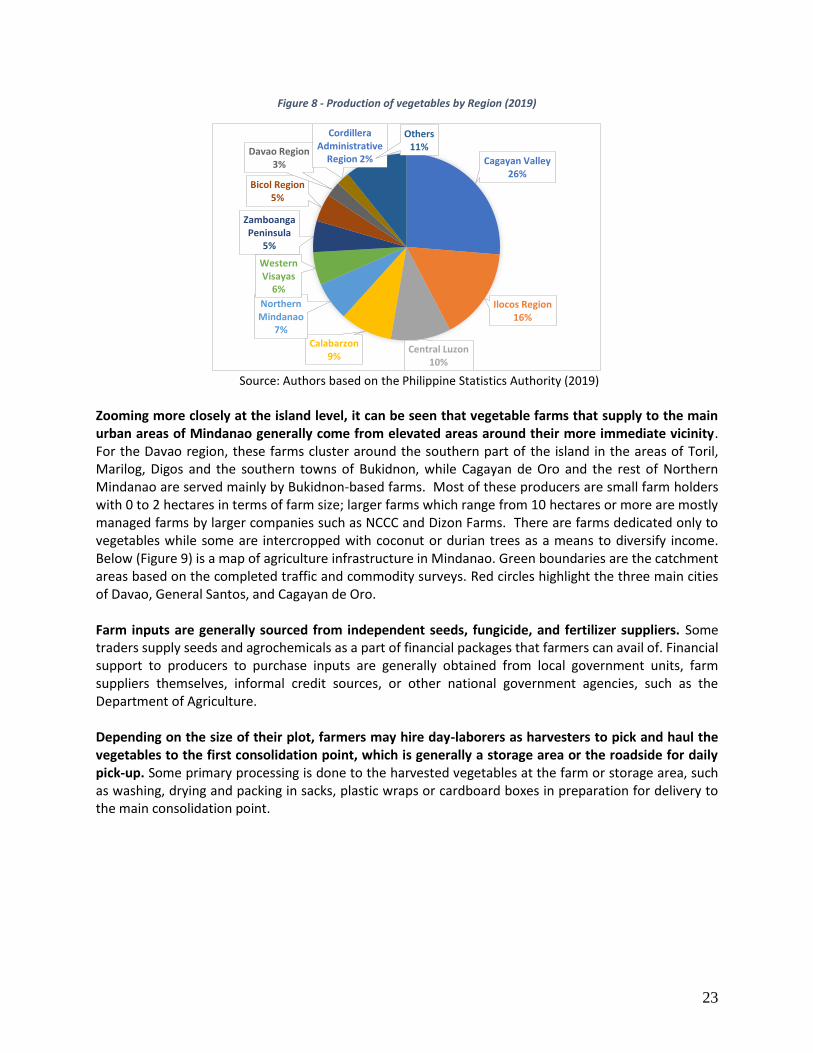
Production Mindanao, especially Bukidnon, is becoming a more important producer. In Figure 8, the top 10 vegetable producing regions in the country are Cagayan Valley (26 percent), Ilocos Region (16 percent), Central Luzon (10 percent), Calabarzon (9 percent), and Northern Mindanao (7 percent), Western Visayas (6 percent), Zamboanga Peninsula (5 percent), Bicol Region (5 percent), Davao Region (3 percent), and Cordillera Administrative Region (2 percent). Of the 26 provinces producing a majority of the vegetables in the Philippines, Iloilo province is the top producer in the Visayas while Bukidnon in Region 10 produces the largest volume in Mindanao and 4th in the entire country.
23
Figure 8 - Production of vegetables by Region (2019)
Source: Authors based on the Philippine Statistics Authority (2019)
Zooming more closely at the island level, it can be seen that vegetable farms that supply to the main urban areas of Mindanao generally come from elevated areas around their more immediate vicinity. For the Davao region, these farms cluster around the southern part of the island in the areas of Toril, Marilog, Digos and the southern towns of Bukidnon, while Cagayan de Oro and the rest of Northern Mindanao are served mainly by Bukidnon-based farms. Most of these producers are small farm holders with 0 to 2 hectares in terms of farm size; larger farms which range from 10 hectares or more are mostly managed farms by larger companies such as NCCC and Dizon Farms. There are farms dedicated only to vegetables while some are intercropped with coconut or durian trees as a means to diversify income. Below (Figure 9) is a map of agriculture infrastructure in Mindanao. Green boundaries are the catchment areas based on the completed traffic and commodity surveys. Red circles highlight the three main cities of Davao, General Santos, and Cagayan de Oro. Farm inputs are generally sourced from independent seeds, fungicide, and fertilizer suppliers. Some traders supply seeds and agrochemicals as a part of financial packages that farmers can avail of. Financial support to producers to purchase inputs are generally obtained from local government units, farm suppliers themselves, informal credit sources, or other national government agencies, such as the Department of Agriculture. Depending on the size of their plot, farmers may hire day-laborers as harvesters to pick and haul the vegetables to the first consolidation point, which is generally a storage area or the roadside for daily pick-up. Some primary processing is done to the harvested vegetables at the farm or storage area, such as washing, drying and packing in sacks, plastic wraps or cardboard boxes in preparation for delivery to the main consolidation point.
Cagayan Valley26%
Ilocos Region16%
Central Luzon10%
Calabarzon9%
Northern Mindanao
7%
Western Visayas
6%
Zamboanga Peninsula
5%
Bicol Region5%
Davao Region3%
Cordillera Administrative
Region 2%
Others11%

24
Figure 9 - Mindanao Agriculture Infrastructure
As the sorting and grading of vegetables are relatively simple, given relatively simple size, texture and shape requirements by high-end customers like modern supermarkets, food processors and restaurant chains, the initial sorting is done at the farm level. Farmers can sort the vegetables by quality at the premises and achieve higher compensation for the product that is targeted for more sophisticated buyers.
Consolidation While there are different consolidation practices done by value chain actors participating in the vegetable industry, as the practices differ based on their market, location, farm terrain, labor presence, and the available infrastructure and facilities in their area, the processes described in this section provides a general description of the main consolidation mechanism through the main vegetable trading hubs. Before shipment to the main trading hub, the vegetables are sorted and packaged by the individual or a small group of farmers for delivery, and the farmers hire a jeepney or truck to transport the vegetables to the nearest rural trading point, usually the most central village in the rural hinterlands. Farmers pay for the transport fare of the vegetables they want to be delivered. These are then further consolidated and brought to one of the two main trading hubs in Mindanao.
25
Bankerohan in Davao City and Bulua in Cagayan de Oro are the primary vegetable trading hubs of Mindanao that operate in a similar fashion as many trading hubs in the country. The vegetables produced in the Davao Region are shipped usually to the Bankerohan Public Market within the city itself which acts as the main vegetable trading hub in Southern Mindanao; while vegetables produced in Bukidnon and other vegetable producing areas end up in the Bulua Public Market in Cagayan de Oro City for distribution. Some individual farmers selling to Bankerohan or Bulua can directly deliver to their preferred traders after each harvest. The trading hub consists of a concrete floor and a roof, with trading operations consisting mainly of the rental of stalls to different traders or farmers groups. The hub is usually owned by the government, sometimes by the local government or by the Department of Agriculture. For example, part of the Bankerohan vegetable wholesale market is being managed by the Davao City government and part-owned
and managed by the Marfori Family14. Traders generally rent infrastructure and maintain basic stalls at the trading hubs to solicit produce from their farmer-suppliers and sell goods to their customers. These buyers are usually larger consolidators or direct-to-customer firms with large volumes, such as restaurants, supermarkets, hotels or food processors. The Bankerohan and Bulua trading hubs currently do not offer cold storage facilities. The entire operation is managed mainly by the traders and the hubs do not provide additional published information to farmers such as price monitoring, quality requirements, scheduling, or transportation. Trading is done in an unorganized manner where buyers transact directly with their particular seller and agreeing on the price and quality is done on a relatively opaque basis. In essence, the only service of the consolidation center is to provide a site for different farmers, traders, and buyers to meet and transact at the hub on an individual basis. Even if the vegetables have been pre-sorted, weighed, and graded at the farm, a secondary quality control process that involves the re-sorting, packing, grading, and weighing on site is completed to ensure the fairness of the transaction among parties. Frequent disputes among the farmer, trader, and even the transport provider, require that this process is duly witnessed by all transaction parties to ensure the validity of the transaction. Traders complain of being sold produce with only the top layer being of top quality while farmers complain of being short-changed by the trader. Apart from the wasted time, the peeling and discarding of misshapen or damaged portions of the vegetables due to the re-sorting process adds to the logistics inefficiencies at this stage. Trading hubs that provide cold storage facilities find these areas hardly being used by the vegetable industry. In most cases, vegetables are sold within the day, with minimal need for storage at the trading hub. As the costs of using refrigerated trucks are generally 40 percent higher than unrefrigerated trucks, vegetable traders generally prefer to maintain the vegetables at the ambient temperature and only put them in cold storage once they reach the final buyers’ destination such as the main commissary or the main supermarket. Very limited storage is done at the trading hub and produce that is unsold will need to be disposed of or transported back by the farmer.
14 It is important to note that while they manage the trading hub, the city government cannot provide proof that the area they are managing was donated. It is not under a usufruct contract according to the City Economic Enterprise Officer. Although it has been known that the property has been donated by the Marforis long prior and they are waiting for the documents. The issue of ownership in fact brought up in June 2019 as the city government cannot push through with its plan of rehabilitation, given the Commission on Audit (COA) may ask for proof of ownership which the city cannot provide yet.
26
For farming communities that are further from the city, smaller rural trading posts serve as the first collection posts. There is a main trading post operating as the central collection point for agricultural products, including vegetables, from the highland farms in the area, usually managed privately by a local trading association or a large trader. Similar to the main city trading posts, these smaller, privately owned trading posts conduct another initial sorting and quality check at this node. Generally, these private trading posts mostly cater to small individual farmers in the hinterlands who are too small to afford a transport vehicle to get their products from their farms down to the main trading post (Key Informant Interviews, 2018). Buyers at the trading posts consist mainly of consolidators who play a role in the supply of vegetables to major buyers in the city, such as restaurants, malls or supermarkets. From the trading hub, the volume is consolidated inside their cold storage warehouse before it is delivered to the final consumer. The role of the consolidator is to buy from numerous trading hubs to ensure that the vegetable supply of their end-customer is fulfilled with the right amount, time, and quality. These consolidators are also in charge of transporting the goods from Mindanao to anywhere in the Philippines, including Manila and Cebu, if prices and quantities so dictate. Competition among consolidators is high as their services are substitutable. In Bankerohan alone, more than 50 small-scale wholesalers are operating and there are constant negotiations for supply agreements and business relationships with traders to ease the threat of their customers from going to other consolidators for the supply they need.
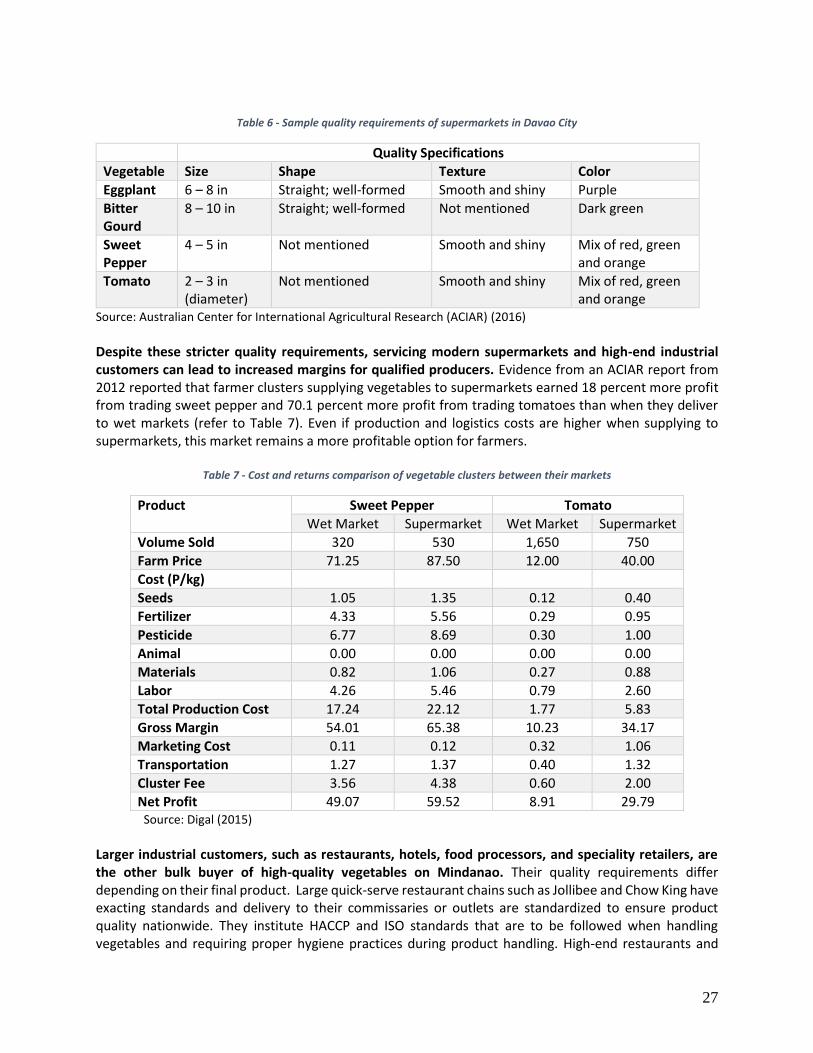
Retailers The consolidators generally sell vegetables in bulk to three types of outlets: wet markets, supermarkets, and industrial customers, with lower quality vegetables destined for wet markets. The wet market continues to be the main market for farmers and producer organizations, which are generally small stalls attached close to trading hubs. Quality requirements for this type of retail outlet are low as they serve a more price-sensitive consumer that shops on a daily basis. Stalls near the Bangkerohan market would only require that the vegetables provided are delivered in sacks or cardboard boxes to be packed in large volumes. Most of their customers have no requirements in terms of size, shape, or color. Supermarkets require higher quality vegetables and their proliferation has risen with the expansion of modern retailing in Mindanao, where more and more people buy directly from groceries and supermarkets such as national chains like SM, Gaisano, or local chains like NCCC. These buyers tend to have stricter requirements for quality control and freshness, and impose penalties for providers that run out of stock. They generally have some cold storage space to allow them to maintain vegetable quality for longer than the wet market. Consolidators serving these customers need to consider numerous physical characteristics, degree of ripeness, and that the vegetable must have no damage. These retailers have merchandisers waiting at the malls’ receiving area to check the vegetables for quality based on the identified physical characteristics of specific vegetables, visible damage, ripeness, among others. For example, for vegetables such as eggplants, supermarkets accept only a specific variety because the grown plant produces vegetables that follow their preferred dimensions. Table 6 shows a sample set of specifications certain supermarkets have in Davao City.
27
Table 6 - Sample quality requirements of supermarkets in Davao City
Quality Specifications
Vegetable Size Shape Texture Color
Eggplant 6 – 8 in Straight; well-formed Smooth and shiny Purple
Bitter Gourd
8 – 10 in Straight; well-formed Not mentioned Dark green
Sweet Pepper
4 – 5 in Not mentioned Smooth and shiny Mix of red, green and orange
Tomato 2 – 3 in (diameter)
Not mentioned Smooth and shiny Mix of red, green and orange
Source: Australian Center for International Agricultural Research (ACIAR) (2016) Despite these stricter quality requirements, servicing modern supermarkets and high-end industrial customers can lead to increased margins for qualified producers. Evidence from an ACIAR report from 2012 reported that farmer clusters supplying vegetables to supermarkets earned 18 percent more profit from trading sweet pepper and 70.1 percent more profit from trading tomatoes than when they deliver to wet markets (refer to Table 7). Even if production and logistics costs are higher when supplying to supermarkets, this market remains a more profitable option for farmers.
Table 7 - Cost and returns comparison of vegetable clusters between their markets
Product Sweet Pepper Tomato
Wet Market Supermarket Wet Market Supermarket
Volume Sold 320 530 1,650 750
Farm Price 71.25 87.50 12.00 40.00
Cost (P/kg)
Seeds 1.05 1.35 0.12 0.40
Fertilizer 4.33 5.56 0.29 0.95
Pesticide 6.77 8.69 0.30 1.00
Animal 0.00 0.00 0.00 0.00
Materials 0.82 1.06 0.27 0.88
Labor 4.26 5.46 0.79 2.60
Total Production Cost 17.24 22.12 1.77 5.83
Gross Margin 54.01 65.38 10.23 34.17
Marketing Cost 0.11 0.12 0.32 1.06
Transportation 1.27 1.37 0.40 1.32
Cluster Fee 3.56 4.38 0.60 2.00
Net Profit 49.07 59.52 8.91 29.79 Source: Digal (2015)
Larger industrial customers, such as restaurants, hotels, food processors, and speciality retailers, are the other bulk buyer of high-quality vegetables on Mindanao. Their quality requirements differ depending on their final product. Large quick-serve restaurant chains such as Jollibee and Chow King have exacting standards and delivery to their commissaries or outlets are standardized to ensure product quality nationwide. They institute HACCP and ISO standards that are to be followed when handling vegetables and requiring proper hygiene practices during product handling. High-end restaurants and
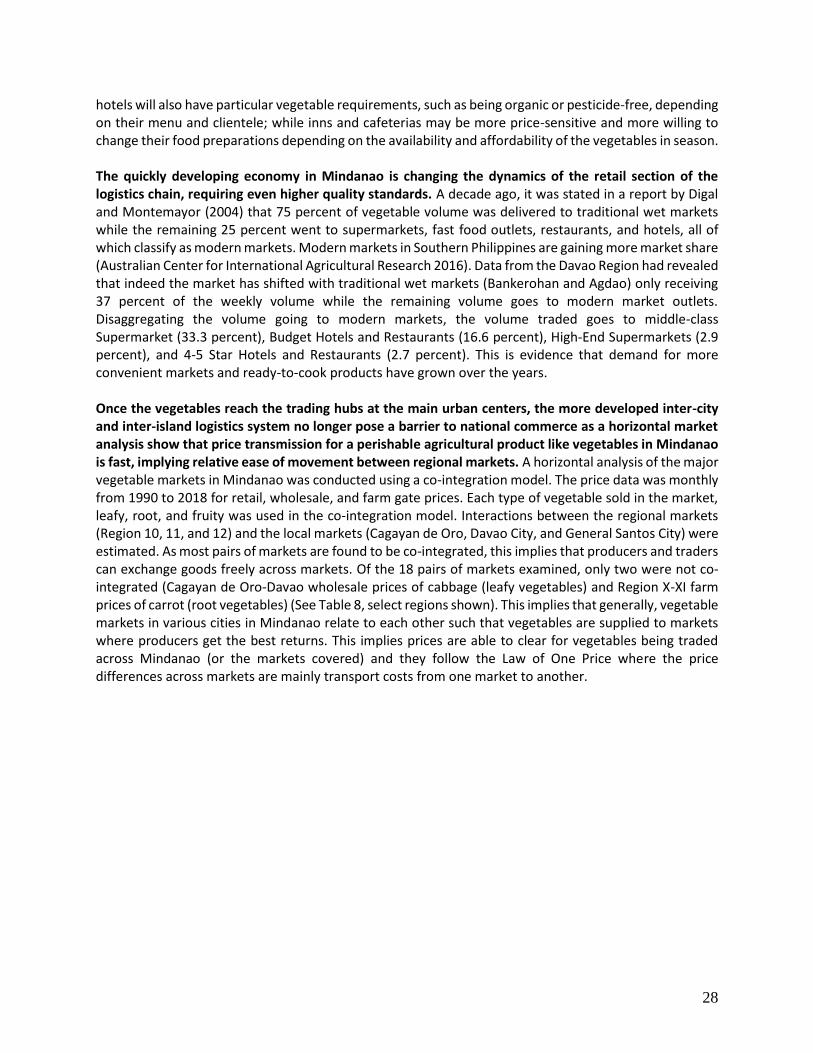
28
hotels will also have particular vegetable requirements, such as being organic or pesticide-free, depending on their menu and clientele; while inns and cafeterias may be more price-sensitive and more willing to change their food preparations depending on the availability and affordability of the vegetables in season. The quickly developing economy in Mindanao is changing the dynamics of the retail section of the logistics chain, requiring even higher quality standards. A decade ago, it was stated in a report by Digal and Montemayor (2004) that 75 percent of vegetable volume was delivered to traditional wet markets while the remaining 25 percent went to supermarkets, fast food outlets, restaurants, and hotels, all of which classify as modern markets. Modern markets in Southern Philippines are gaining more market share (Australian Center for International Agricultural Research 2016). Data from the Davao Region had revealed that indeed the market has shifted with traditional wet markets (Bankerohan and Agdao) only receiving 37 percent of the weekly volume while the remaining volume goes to modern market outlets. Disaggregating the volume going to modern markets, the volume traded goes to middle-class Supermarket (33.3 percent), Budget Hotels and Restaurants (16.6 percent), High-End Supermarkets (2.9 percent), and 4-5 Star Hotels and Restaurants (2.7 percent). This is evidence that demand for more convenient markets and ready-to-cook products have grown over the years. Once the vegetables reach the trading hubs at the main urban centers, the more developed inter-city and inter-island logistics system no longer pose a barrier to national commerce as a horizontal market analysis show that price transmission for a perishable agricultural product like vegetables in Mindanao is fast, implying relative ease of movement between regional markets. A horizontal analysis of the major vegetable markets in Mindanao was conducted using a co-integration model. The price data was monthly from 1990 to 2018 for retail, wholesale, and farm gate prices. Each type of vegetable sold in the market, leafy, root, and fruity was used in the co-integration model. Interactions between the regional markets (Region 10, 11, and 12) and the local markets (Cagayan de Oro, Davao City, and General Santos City) were estimated. As most pairs of markets are found to be co-integrated, this implies that producers and traders can exchange goods freely across markets. Of the 18 pairs of markets examined, only two were not co-integrated (Cagayan de Oro-Davao wholesale prices of cabbage (leafy vegetables) and Region X-XI farm prices of carrot (root vegetables) (See Table 8, select regions shown). This implies that generally, vegetable markets in various cities in Mindanao relate to each other such that vegetables are supplied to markets where producers get the best returns. This implies prices are able to clear for vegetables being traded across Mindanao (or the markets covered) and they follow the Law of One Price where the price differences across markets are mainly transport costs from one market to another.
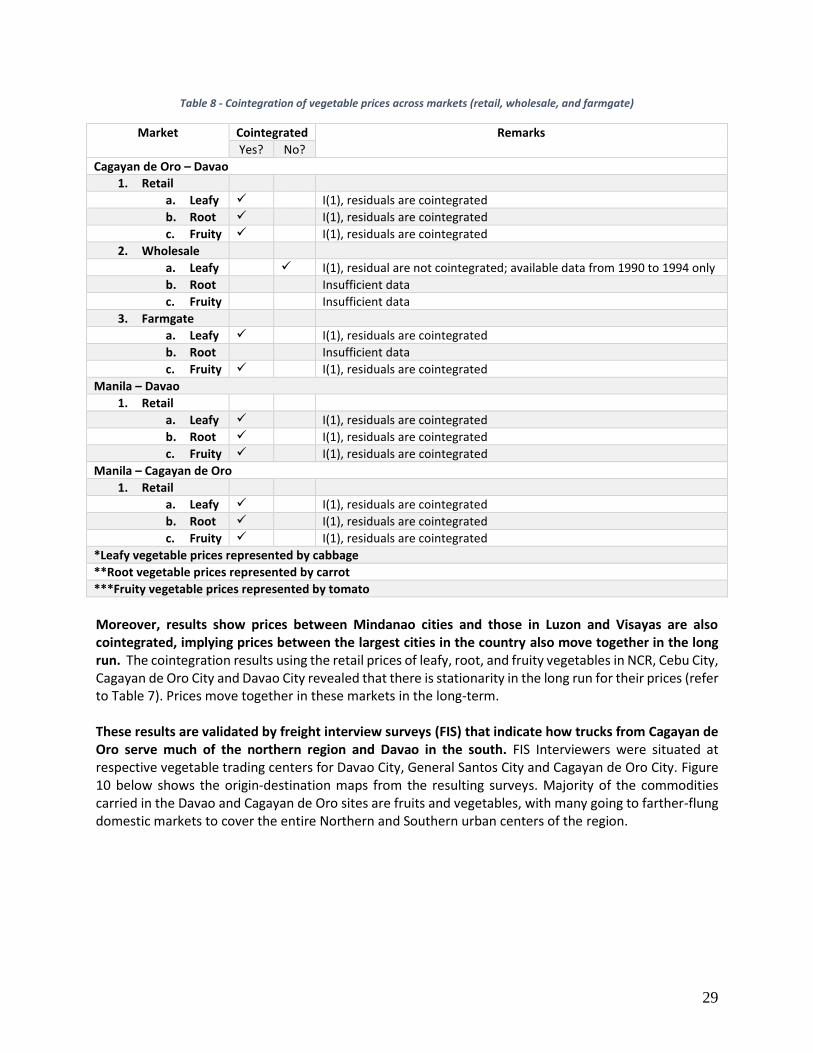
29
Table 8 - Cointegration of vegetable prices across markets (retail, wholesale, and farmgate)
Market Cointegrated Remarks
Yes? No?
Cagayan de Oro – Davao
1. Retail
a. Leafy ✓ I(1), residuals are cointegrated
b. Root ✓ I(1), residuals are cointegrated
c. Fruity ✓ I(1), residuals are cointegrated
2. Wholesale
a. Leafy ✓ I(1), residual are not cointegrated; available data from 1990 to 1994 only
b. Root Insufficient data
c. Fruity Insufficient data
3. Farmgate
a. Leafy ✓ I(1), residuals are cointegrated
b. Root Insufficient data
c. Fruity ✓ I(1), residuals are cointegrated
Manila – Davao
1. Retail
a. Leafy ✓ I(1), residuals are cointegrated
b. Root ✓ I(1), residuals are cointegrated
c. Fruity ✓ I(1), residuals are cointegrated
Manila – Cagayan de Oro
1. Retail
a. Leafy ✓ I(1), residuals are cointegrated
b. Root ✓ I(1), residuals are cointegrated
c. Fruity ✓ I(1), residuals are cointegrated
*Leafy vegetable prices represented by cabbage
**Root vegetable prices represented by carrot
***Fruity vegetable prices represented by tomato
Moreover, results show prices between Mindanao cities and those in Luzon and Visayas are also cointegrated, implying prices between the largest cities in the country also move together in the long run. The cointegration results using the retail prices of leafy, root, and fruity vegetables in NCR, Cebu City, Cagayan de Oro City and Davao City revealed that there is stationarity in the long run for their prices (refer to Table 7). Prices move together in these markets in the long-term. These results are validated by freight interview surveys (FIS) that indicate how trucks from Cagayan de Oro serve much of the northern region and Davao in the south. FIS Interviewers were situated at respective vegetable trading centers for Davao City, General Santos City and Cagayan de Oro City. Figure 10 below shows the origin-destination maps from the resulting surveys. Majority of the commodities carried in the Davao and Cagayan de Oro sites are fruits and vegetables, with many going to farther-flung domestic markets to cover the entire Northern and Southern urban centers of the region.

30
Figure 10 - Origin-Destination map for Davao, Cagayan de Oro, and General Santos with Respective Catchment Area
In particular, the Cagayan de Oro trading port has become a prime source of vegetables nationwide. Given the size of the Bukidnon vegetable production region, Bulua market has become a consolidation point to serve other parts of the country. Figure 11 shows that the major market for carrots shipped out of Bulua is Visayas at 62 percent of the total outbound volume. The trading dates covered for the data was from November 5 – 9, 2016. At the gathering of data, no carrots were shipped out to Luzon. Cebu received the bulk of the cabbage volume going to the Visayas with 68 percent going the province. Bohol received the other 32 percent of the volume shipped to the Visayas. In Mindanao, 38 percent of the volume of carrots was transported by domestic shippers. Dipolog received majority of the volume at 52 percent. Other key cities in Northern Mindanao that received a significant volume of carrots from the Bulua market were Surigao city (19 percent) and Ozamis City (17 percent).
Figure 11-Distribution of Volume of Carrots from Bulua Market (outbound) in Cagayan de Oro
Bulua Market
Visayas
Mindanao
Cagayan de
Oro
Ozamis
Dipolog
Surigao
Zamboanga
Butuan
Cebu
Bohol
62
38
5
17
52
5
2
19
68
32
Source: (Sabines, Mosqueda, & Larroza, 2016)

31
Understanding the Cacao Logistics Chain in Mindanao The other product chain analyzed for this study is the cacao logistics chain, an example of an export product with a more complex logistics chain. Unlike cacao, vegetables can be consumed as-is from farm to table, bypassing the additional processing cacao has to go through before it is consumed. Additional levels of processing in the cacao value chain involve drying and fermenting done post-harvest and further processing that includes roasting, grinding, and packing before the final product reaches its end markets. Further, since some cacao is destined for foreign processors, it requires producers to follow more stringent standards in terms of quality and quantity. Comparing Figure 7 and Figure 12 shows the additional logistics layers across the two value chains.
Figure 12 – Logistics Value Chain of Cacao Market in Davao Region
Production Many of the components of the production process of Cacao is similar to vegetables, except for Cacao there is an added layer of basic primary processing that can be done by some producers. In general, the activities done in cacao farms include land preparation, planting, pod care, maintenance, pest and disease management, and harvesting. The farmers can already sell the wet beans at this point, as many local processors are willing to source their wet beans for fermentation and drying. Farmers haul, transport, and sell their products to reach their buyers. The farms can also extend their operation to include primary processing of the wet beans towards the more lucrative fermented and dried cacao beans. Farmers who ferment and dry have equipment such as boxes and dryers to produce the more valuable dried fermented beans. Many farmers also perform drying activities directly which they do on make-shift platforms, basketball courts, and some even on the road. Dried, fermented beans sell at a much higher price than the sun-dried beans. Farmers that do not perform drying activities lack the capacity to start fermenting their beans for various reasons such as lack of capital

32
and limited knowledge on the proper fermentation process to achieve the quality control requirements of the final buyer. Quality control requirements are more stringent for cacao, as the proper sorting, fermenting and drying process can dictate whether the final product can be sold to high-end chocolatiers or lower-end makers of cacao nibs or chocolate powder products. Local processors purchase wet beans and possess the machinery to perform the necessary fermentation and drying activities to consistently produce dried beans to be used as input for the downstream production of Tableya products, cacao nibs, and chocolate. These can include larger agricultural cooperatives who can do primary processing such as Rehobooth Agricultural Cooperative, or private processors such as Kennemer Foods International (KFI) or Chokolate de San Isidro (CSI). Many local processors also do re-drying to ensure the quality of dried beans used in processing. Processed cacao products are sent to either local manufacturers or exported to foreign processors for grinding.
Consolidation Dried beans are consolidated by sourcing directly from cacao traders, local processors, cacao cooperatives, and large cacao producers, as there are no trading hubs per se where cacao is sold regularly. They have the capability to finance consolidator-agents to keep a steady source of supply for their processing needs. Local consolidators are in-charge of shipping their produce to ports for delivery using their trucks or third-party logistics providers to deliver in bulk to toll grinders and other chocolate makers. In contrast to the vegetable value chain, consolidation is often necessary within the cacao value chain because firms need to reach the volume required by export market demands or their processing requirements. The processing of value-added products can be limited because the supply of cacao is low and the low supply compromises the capacity of fermentation and drying facilities leading to some breaking down because of underutilization. In this case, there was often underutilization due to “stop buying” because of the lack of trust between the processor and farmers. In the case of CSI, their fermentation facilities went underutilized because they stopped buying wet beans from local farmers due to malpractice e.g. mixing water with wet beans. Local cacao companies have lost some of their biggest clients because of the lack of volume to comply with their requirements. Foreign processors, usually toll grinders in Malaysia, Singapore, and Indonesia, are companies with large volume demands for bulk beans which are sent to larger food processors and chocolate makers. The processing scheme they employ mainly produces cacao butter, cacao paste, and cacao liquor. In general, these additional layers of processing to bring the cacao bean to the market results in a longer logistics chain. Cacao undergoes multiple transformations before it can be consumed and this entails additional activities along the value chain before it reaches consumers. These products are sold to buyers who use them either as raw materials, wholesale selling, rebranded for retailing, and food consumption. Higher quality product is sent abroad or to local manufacturers paying a premium for better quality beans. Consolidation is done by a few companies within the Davao region. The organizations highlighted in Table 9 are the major players for bean-buying in the Davao Region. Kennemer Foods International (KFI) had an estimated 600 MT of dried fermented beans which coincides with the 3,500 MT procured volume for the year 2017 as revealed in key informant interviews. Next is CSI who purchases dried beans for their Tableya production.
33
Table 9 - Estimated Volume of dried, fermented beans per organization in Davao Region
Company Estimated volume per year (based on production period)
Kennemer Foods International 600
Chokolate de San Isidro, Inc. 200
Puentespina / Malagos Farms 60
CASCO Commodities 50
Subasta Cooperative 30
Sta. Maria Cooperative 20
Dela Cerna Farms 20
Disiano Farms 60
Mayo Cooperative 30
TOTAL 1,070 Source: Muyco (2016)
Thus, because of the volume and quality control requirements, vertical integration across the chain is more prevalent, with single entities doing the purchasing, processing, and consolidations. Some cooperatives also engage in primary processing which includes sorting, drying, fermenting, turning, and sacking to sell dried fermented beans. Larger consolidator-processors have also opted to use pick-up systems, bypassing the need for multiple handling. This method is used by buyers such as CSI, Malagos, and KFI who have the logistics capability to purchase beans in bulk and are capable of financing consolidators/agents to create consolidation points.
Processing and Retail The main cacao products are dried fermented beans that are further transformed into the final products that end-consumers are willing to purchase. The global value chain helps shape the cacao industry in the Philippines despite being only a small player. On the international level, the value chain involves five major products being exchanged: cacao beans, butter, paste, powder, and chocolates. Processors use up a bulk of the wet beans and dried cacao beans sold in the market. Low-grade cacao beans are typically bought by local food manufacturers who perform further processing to produce food-grade quality chocolate and inputs to other cacao final products, and these are sold to the domestic market. For example, bulk beans are roasted and ground to produce cacao nibs and paste/liquor. The nibs are sold as-is in vacuum packaging or used as ingredients to food items. Cacao paste/liquor is further refined via tempering and pressing to produce high-quality cacao butter and cacao powder. This level of processing is done with a full cacao facility to be able to properly extract the butter which makes it a capital-intensive requirement which can limit the entry of groups with less capital or funding. Chocolates, Tableya, chocolate powder, are some examples of the final products produced by some of these local manufacturers and are sold in the domestic market. They have established brands in a niche market. Non-food manufacturers process cacao paste and cacao liquor to industrial-grade inputs for pharmaceutical and cosmetic products. Cacao that can meet the high-quality standards expected by exporters are processed and marketed overseas or are sold to premium chocolate makers in the Philippines. Mars Chocolate and Puratos Chocolate are the final buyers of Kennemer cacao beans exports which account for 99 percent of their trading. The beans that are exported are shipped either to Singapore or Malaysia but mainly Malaysia
34
because of the presence of the toll grinder supplying to Mars Chocolate in the country. Others go to high-end local chocolatiers. For example, Puentespina’s Malagos Chocolate has a processing capacity of 500 tons for their award-winning chocolate products. They sell their chocolate products to both the local and export market with products such as their Malagos 100 percent unsweetened chocolate grabbing a Silver medal under the Drinking Chocolate Category from the Academy of Chocolate Awards in the UK (Malagos Chocolate 2017). The 65 percent and 72 percent Malagos Dark Chocolate won the Bronze in the Tree-to-Bar category (Malagos Chocolate, 2017).
The retailing and marketing of chocolates and other cacao products is the final step in the cacao value chain. These are sent to retail outlets such as supermarkets, convenience stores, and vending machines. They are also sent to food service outlets such as bakeries, restaurants, and small chocolate shops for direct consumption. Chocolate products are high-value products that will provide a lucrative income option for producers and processors alike. Consumption of chocolate is mainly driven by special occasions such as Valentine's Day, Mother’s Day, or birthdays as chocolates are usually given as gifts during these occasions.
Inefficiencies in the Agricultural Logistics Chains Many of the logistic issues faced at the farm level can be summarized in three main themes, (1) Lack of Information, (2) Double handling and spoilage, and (3) Quality control.
Lack of Information At the beginning of the logistic chain, farmers often find themselves starting at a disadvantaged position early in the production cycle with their limited access to market information. The chain begins with the relationship between farmer and trader that is built on familiarity due to a long-standing business partnership. Here, the farmers are price takers because the collector-wholesalers provide market information to their farmers. Come harvest, farmers typically lack the price information beyond the prices provided by their main trading partners. There are no prices displayed at the trading posts or other possible prices sources such as web portals or bulletin boards. The search for alternative traders or trading posts that may be willing to source the product from the farmers at a higher price is very costly, limiting the options of the farmers to the personal contacts he or she has. Furthermore, the coordination problem arising from the dearth of information regarding market requirements or quality characteristics in the production stage results in fluctuating supply that fails to match consumption demand in urban areas. To illustrate, with consumption trending up in recent years, there is a shortage of certain vegetables in major urban areas in the city. The expansion of demand from supermarkets, fast food outlets, and others make it important to supply vegetables but the quality requirements of such outlets make it difficult for the farmer to produce for these markets without access to proper information. Lack of planning in the production stage makes it difficult to meet high demand since key producing areas such as Kapatagan and Bukidnon might send large volumes of a single type of vegetable to the market which would be in excess of what is needed. Consequently, this results in a shortage of supply for other vegetables which drive the price up. For example, a medium-scale farmer in Bukidnon revealed that one of the reasons behind the exponential drops in the price (as low as PHP5 per kilo) of bell pepper in Bulua market was due to the oversupply of bell pepper coming from the farms in

35
Bukidnon. Thus, the lack of production planning and scheduling is seen as a major practice that has not been adopted by most small farmers and producer organizations alike. This requires proper farm management on both the individual farmer level and the cooperative level. The benefits of which is exemplified by one cooperative in Lantapan, Bukidnon. Key informant interviews say they instituted a planting calendar with the help of the DA and the LGU to address their supply problems. Before, institutional buyers required specific vegetables at set volumes and their previous system of unsynchronized planting schedules made it difficult to fulfil their client demands. Obtaining accurate market information would help farmers plan their investments and stocks accordingly. The producer-wholesaler must keep updated with the latest market information for their buyers regarding quality requirements, pricing, volume needed, etc. These dictate the investments that need to be made by the producer on their farm and what sourcing decisions they make when it comes to the product they supply. Moreover, supply shocks drive the price volatility of crops including vegetables due to stock-storage decisions to be made by value chain actors (Geman, 2015). Oversupply due to imports and domestic suppliers coming in should encourage storing of available stocks of vegetables to avoid low prices. Small farmers and wholesalers don’t have that luxury because they lack the cold chain facilities to effectively store vegetables to avoid price drops. Table 10 shows the price seasonality of certain farm produce.
Table 10 - Seasonality of farm prices of selected vegetables in major markets of Mindanao (1990-2015)
Source: Philippine Statistics Authority (2018)
Double Handling and Spoilage On the side of the buyers, despite providing market information (e.g. quality requirements and price) to farmers, traders fear that farmers will mix lower quality product with the low quality product in their shipments. This lack of trust between buyer and seller creates a situation where packing and re-sorting occur at every node of the logistics chain. This results in redundancies and multiple handlings. Anecdotal evidence shared with the team shows that even transporters in charge of the delivery of crops make themselves present in the digital weighing area to ensure they are paid correctly by the kilo. This lack of trust changes the behavior of the entire value chain wherein certain cacao buyers prefer that farmers deliver heavier and more perishable wet beans than more compact dried beans to ensure that only high-quality products are delivered to the buyer.
Carrot Potato Ampalaya Eggplant Squash Tomato Cabbage
January 14.76 16.87 15.81 11.47 4.84 12.73 10.86
February 15.55 16.64 16.84 12.27 5.43 11.84 11.65
March 15.71 16.95 15.92 11.52 5.05 9.86 12.02
April 16.12 16.79 15.25 11.56 5.26 10.61 13.67
May 15.97 16.83 15.34 10.91 4.83 10.72 14.16
June 15.55 15.98 14.12 10.22 4.16 12.81 14.49
July 15.58 15.26 14.20 9.95 4.01 11.50 12.24
August 14.51 15.13 13.26 9.29 4.01 10.55 11.63
September 14.41 15.23 13.44 8.86 4.37 10.97 11.38
October 14.40 15.72 13.83 8.84 4.45 11.45 11.42
November 14.72 14.93 14.78 9.08 4.49 11.94 11.17
December 15.40 16.67 14.58 9.49 4.47 11.98 13.17
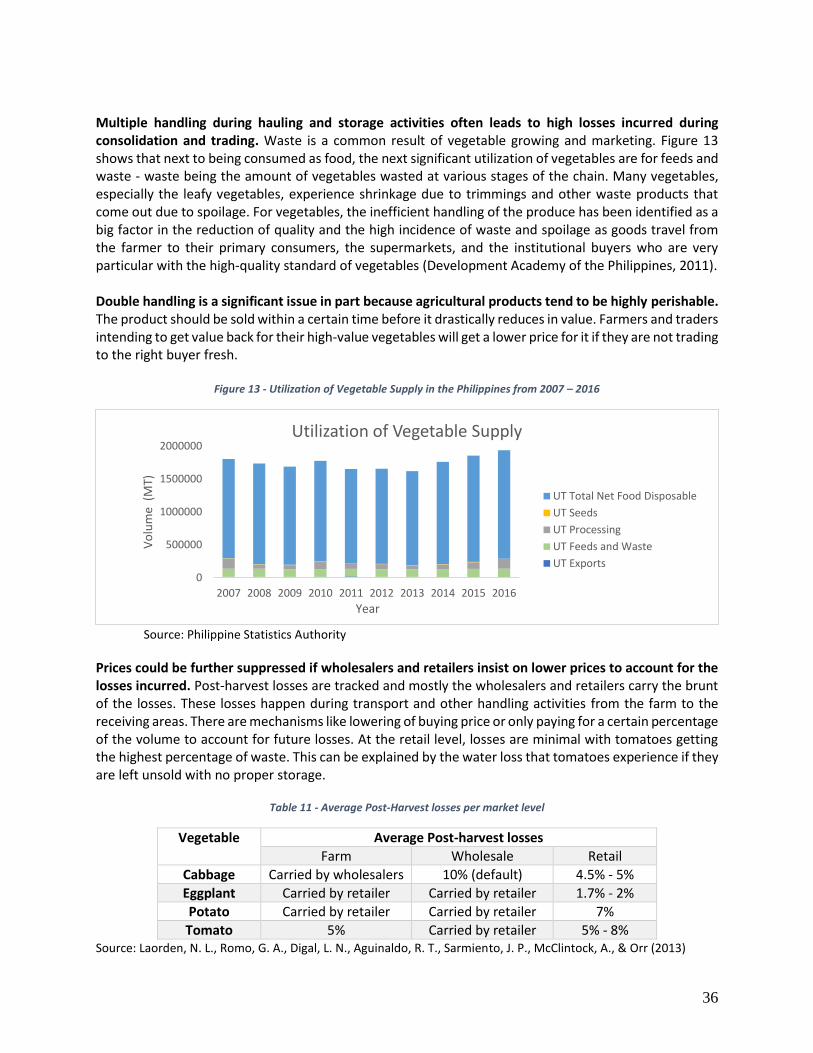
36
Multiple handling during hauling and storage activities often leads to high losses incurred during consolidation and trading. Waste is a common result of vegetable growing and marketing. Figure 13 shows that next to being consumed as food, the next significant utilization of vegetables are for feeds and waste - waste being the amount of vegetables wasted at various stages of the chain. Many vegetables, especially the leafy vegetables, experience shrinkage due to trimmings and other waste products that come out due to spoilage. For vegetables, the inefficient handling of the produce has been identified as a big factor in the reduction of quality and the high incidence of waste and spoilage as goods travel from the farmer to their primary consumers, the supermarkets, and the institutional buyers who are very particular with the high-quality standard of vegetables (Development Academy of the Philippines, 2011). Double handling is a significant issue in part because agricultural products tend to be highly perishable. The product should be sold within a certain time before it drastically reduces in value. Farmers and traders intending to get value back for their high-value vegetables will get a lower price for it if they are not trading to the right buyer fresh.
Figure 13 - Utilization of Vegetable Supply in the Philippines from 2007 – 2016
Source: Philippine Statistics Authority
Prices could be further suppressed if wholesalers and retailers insist on lower prices to account for the losses incurred. Post-harvest losses are tracked and mostly the wholesalers and retailers carry the brunt of the losses. These losses happen during transport and other handling activities from the farm to the receiving areas. There are mechanisms like lowering of buying price or only paying for a certain percentage of the volume to account for future losses. At the retail level, losses are minimal with tomatoes getting the highest percentage of waste. This can be explained by the water loss that tomatoes experience if they are left unsold with no proper storage.
Table 11 - Average Post-Harvest losses per market level
Vegetable Average Post-harvest losses
Farm Wholesale Retail
Cabbage Carried by wholesalers 10% (default) 4.5% - 5%
Eggplant Carried by retailer Carried by retailer 1.7% - 2%
Potato Carried by retailer Carried by retailer 7%
Tomato 5% Carried by retailer 5% - 8% Source: Laorden, N. L., Romo, G. A., Digal, L. N., Aguinaldo, R. T., Sarmiento, J. P., McClintock, A., & Orr (2013)
0
500000
1000000
1500000
2000000
2007 2008 2009 2010 2011 2012 2013 2014 2015 2016
Vo
lum
e (
MT)
Year
Utilization of Vegetable Supply
UT Total Net Food Disposable
UT Seeds
UT Processing
UT Feeds and Waste
UT Exports
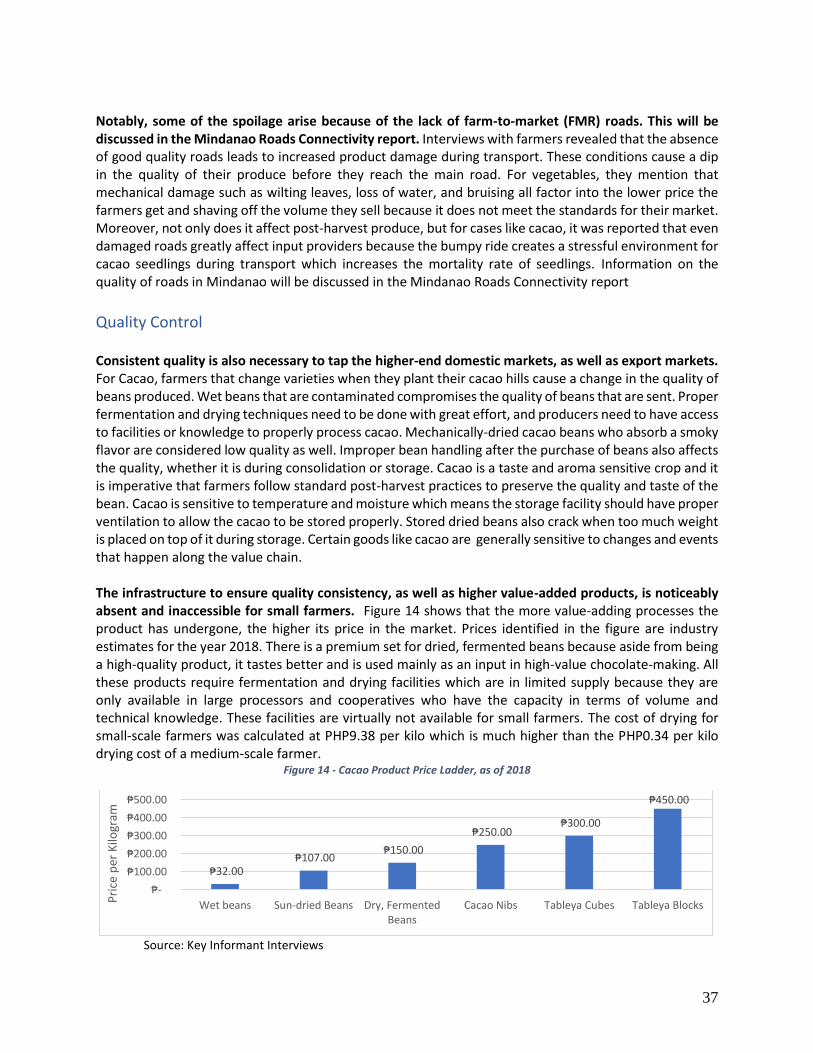
37
Notably, some of the spoilage arise because of the lack of farm-to-market (FMR) roads. This will be discussed in the Mindanao Roads Connectivity report. Interviews with farmers revealed that the absence of good quality roads leads to increased product damage during transport. These conditions cause a dip in the quality of their produce before they reach the main road. For vegetables, they mention that mechanical damage such as wilting leaves, loss of water, and bruising all factor into the lower price the farmers get and shaving off the volume they sell because it does not meet the standards for their market. Moreover, not only does it affect post-harvest produce, but for cases like cacao, it was reported that even damaged roads greatly affect input providers because the bumpy ride creates a stressful environment for cacao seedlings during transport which increases the mortality rate of seedlings. Information on the quality of roads in Mindanao will be discussed in the Mindanao Roads Connectivity report
Quality Control Consistent quality is also necessary to tap the higher-end domestic markets, as well as export markets. For Cacao, farmers that change varieties when they plant their cacao hills cause a change in the quality of beans produced. Wet beans that are contaminated compromises the quality of beans that are sent. Proper fermentation and drying techniques need to be done with great effort, and producers need to have access to facilities or knowledge to properly process cacao. Mechanically-dried cacao beans who absorb a smoky flavor are considered low quality as well. Improper bean handling after the purchase of beans also affects the quality, whether it is during consolidation or storage. Cacao is a taste and aroma sensitive crop and it is imperative that farmers follow standard post-harvest practices to preserve the quality and taste of the bean. Cacao is sensitive to temperature and moisture which means the storage facility should have proper ventilation to allow the cacao to be stored properly. Stored dried beans also crack when too much weight is placed on top of it during storage. Certain goods like cacao are generally sensitive to changes and events that happen along the value chain. The infrastructure to ensure quality consistency, as well as higher value-added products, is noticeably absent and inaccessible for small farmers. Figure 14 shows that the more value-adding processes the product has undergone, the higher its price in the market. Prices identified in the figure are industry estimates for the year 2018. There is a premium set for dried, fermented beans because aside from being a high-quality product, it tastes better and is used mainly as an input in high-value chocolate-making. All these products require fermentation and drying facilities which are in limited supply because they are only available in large processors and cooperatives who have the capacity in terms of volume and technical knowledge. These facilities are virtually not available for small farmers. The cost of drying for small-scale farmers was calculated at PHP9.38 per kilo which is much higher than the PHP0.34 per kilo drying cost of a medium-scale farmer.
Figure 14 - Cacao Product Price Ladder, as of 2018
Source: Key Informant Interviews
₱32.00 ₱107.00
₱150.00
₱250.00 ₱300.00
₱450.00
₱-
₱100.00
₱200.00
₱300.00
₱400.00
₱500.00
Wet beans Sun-dried Beans Dry, FermentedBeans
Cacao Nibs Tableya Cubes Tableya BlocksPri
ce p
er K
ilogr
am
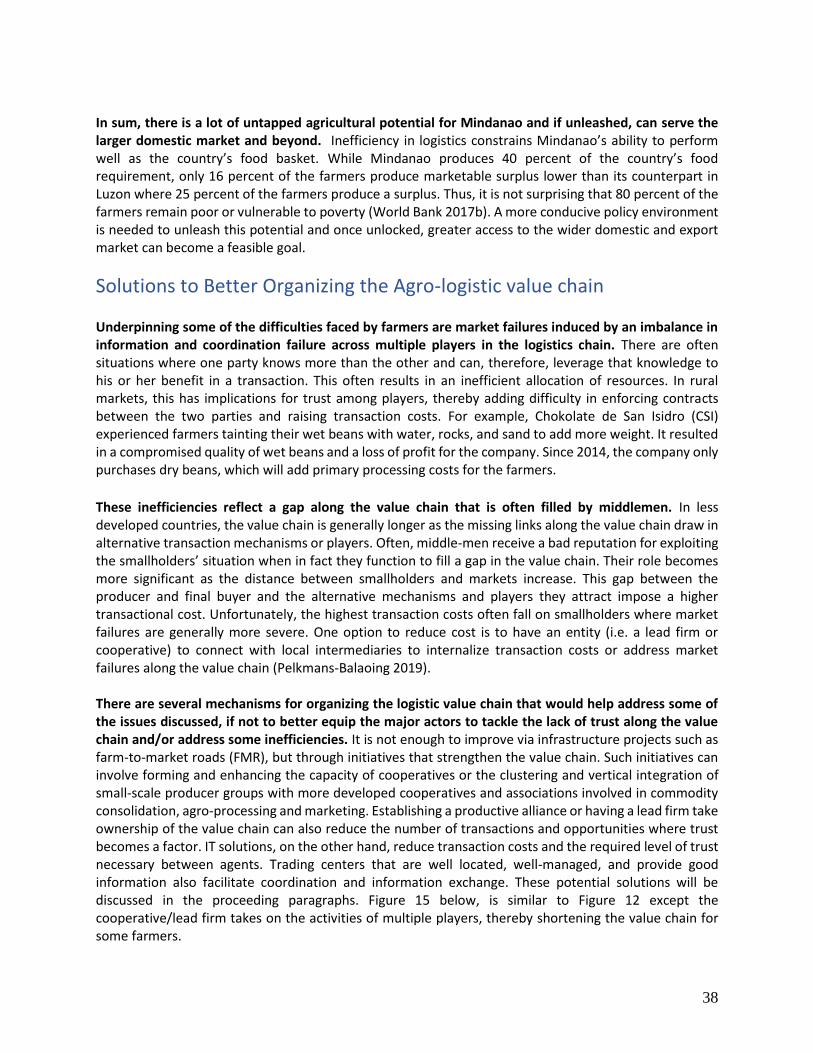
38
In sum, there is a lot of untapped agricultural potential for Mindanao and if unleashed, can serve the larger domestic market and beyond. Inefficiency in logistics constrains Mindanao’s ability to perform well as the country’s food basket. While Mindanao produces 40 percent of the country’s food requirement, only 16 percent of the farmers produce marketable surplus lower than its counterpart in Luzon where 25 percent of the farmers produce a surplus. Thus, it is not surprising that 80 percent of the farmers remain poor or vulnerable to poverty (World Bank 2017b). A more conducive policy environment is needed to unleash this potential and once unlocked, greater access to the wider domestic and export market can become a feasible goal.
Solutions to Better Organizing the Agro-logistic value chain Underpinning some of the difficulties faced by farmers are market failures induced by an imbalance in information and coordination failure across multiple players in the logistics chain. There are often situations where one party knows more than the other and can, therefore, leverage that knowledge to his or her benefit in a transaction. This often results in an inefficient allocation of resources. In rural markets, this has implications for trust among players, thereby adding difficulty in enforcing contracts between the two parties and raising transaction costs. For example, Chokolate de San Isidro (CSI) experienced farmers tainting their wet beans with water, rocks, and sand to add more weight. It resulted in a compromised quality of wet beans and a loss of profit for the company. Since 2014, the company only purchases dry beans, which will add primary processing costs for the farmers. These inefficiencies reflect a gap along the value chain that is often filled by middlemen. In less developed countries, the value chain is generally longer as the missing links along the value chain draw in alternative transaction mechanisms or players. Often, middle-men receive a bad reputation for exploiting the smallholders’ situation when in fact they function to fill a gap in the value chain. Their role becomes more significant as the distance between smallholders and markets increase. This gap between the producer and final buyer and the alternative mechanisms and players they attract impose a higher transactional cost. Unfortunately, the highest transaction costs often fall on smallholders where market failures are generally more severe. One option to reduce cost is to have an entity (i.e. a lead firm or cooperative) to connect with local intermediaries to internalize transaction costs or address market failures along the value chain (Pelkmans-Balaoing 2019). There are several mechanisms for organizing the logistic value chain that would help address some of the issues discussed, if not to better equip the major actors to tackle the lack of trust along the value chain and/or address some inefficiencies. It is not enough to improve via infrastructure projects such as farm-to-market roads (FMR), but through initiatives that strengthen the value chain. Such initiatives can involve forming and enhancing the capacity of cooperatives or the clustering and vertical integration of small-scale producer groups with more developed cooperatives and associations involved in commodity consolidation, agro-processing and marketing. Establishing a productive alliance or having a lead firm take ownership of the value chain can also reduce the number of transactions and opportunities where trust becomes a factor. IT solutions, on the other hand, reduce transaction costs and the required level of trust necessary between agents. Trading centers that are well located, well-managed, and provide good information also facilitate coordination and information exchange. These potential solutions will be discussed in the proceeding paragraphs. Figure 15 below, is similar to Figure 12 except the cooperative/lead firm takes on the activities of multiple players, thereby shortening the value chain for some farmers.
39
Figure 15 - Value Chain of Cacao Market in Davao Region, with Coop/Lead Firm
In general, collective action can help design cooperative solutions for the management of common resources. It helps reduce transaction costs and allows farmers to benefit from economies of scale. Farmers can take joint economic action to pool their risk, market their products, avail of resources such as post-processing facilities and better market information, and negotiate for better prices.
Agricultural Cooperatives Agricultural cooperatives are a means to formally organize a group of individual farmers, generally allowing its members to pool their resources and strengthen market power. Markets are often not perfect and cooperatives give farmers greater bargaining power as they have more leverage collectively than just individually. Smallholder farmers often become beholden to traders and larger market powers and are forced to accept lower prices. Being a part of a cooperative gives them greater bargaining power, and subsequently access to better prices. To illustrate, the cacao industry in Davao del Norte and Davao City have strong cooperatives that allow small farmers to gain economic benefits. Small cacao farmers get a premium on their selling price when they sell a large volume achieved via consolidation through cooperatives (UP Mindanao, 2015). Cooperatives can also provide access to services and equipment farmers cannot procure themselves. Not only can farmers take advantage of economies of scale, but cooperatives assist in the negotiation of contracts, logistic arrangements, post-processing facilities which can increase the value of their products, and provide other training initiatives. The case of NorMin Veggies provides a good example. NorMin Veggies take on a lead role in providing its members with the necessary assistance to supply to
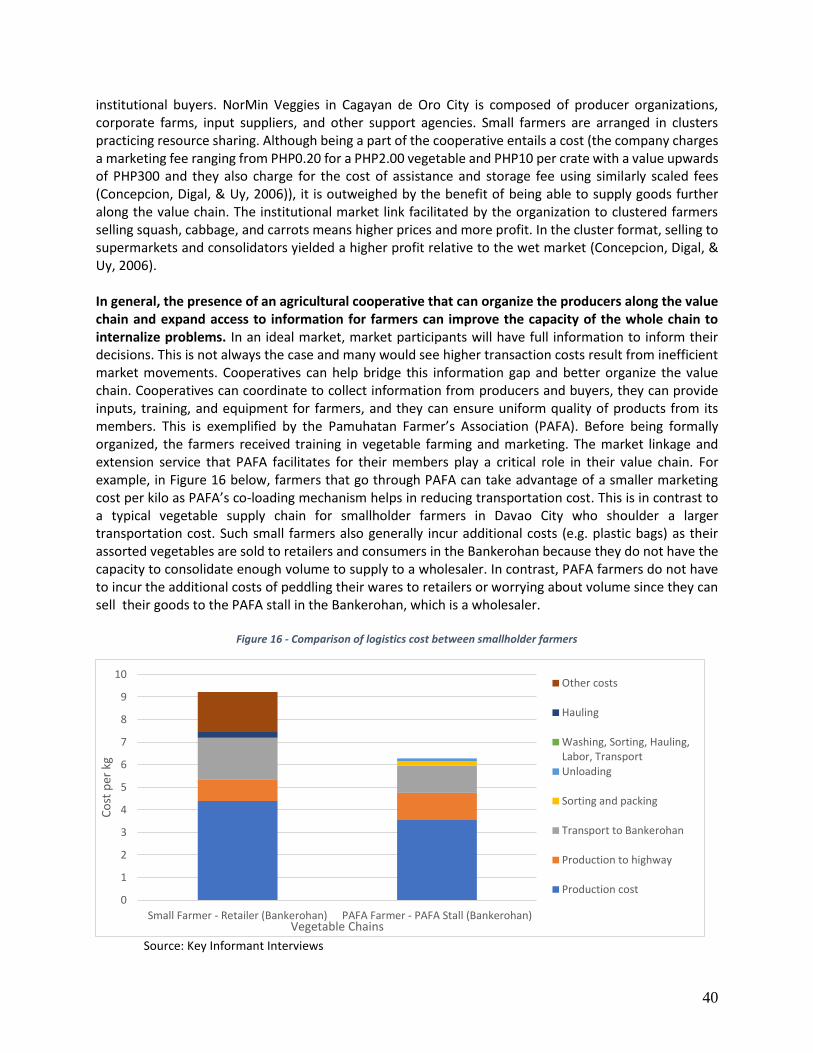
40
institutional buyers. NorMin Veggies in Cagayan de Oro City is composed of producer organizations, corporate farms, input suppliers, and other support agencies. Small farmers are arranged in clusters practicing resource sharing. Although being a part of the cooperative entails a cost (the company charges a marketing fee ranging from PHP0.20 for a PHP2.00 vegetable and PHP10 per crate with a value upwards of PHP300 and they also charge for the cost of assistance and storage fee using similarly scaled fees (Concepcion, Digal, & Uy, 2006)), it is outweighed by the benefit of being able to supply goods further along the value chain. The institutional market link facilitated by the organization to clustered farmers selling squash, cabbage, and carrots means higher prices and more profit. In the cluster format, selling to supermarkets and consolidators yielded a higher profit relative to the wet market (Concepcion, Digal, & Uy, 2006). In general, the presence of an agricultural cooperative that can organize the producers along the value chain and expand access to information for farmers can improve the capacity of the whole chain to internalize problems. In an ideal market, market participants will have full information to inform their decisions. This is not always the case and many would see higher transaction costs result from inefficient market movements. Cooperatives can help bridge this information gap and better organize the value chain. Cooperatives can coordinate to collect information from producers and buyers, they can provide inputs, training, and equipment for farmers, and they can ensure uniform quality of products from its members. This is exemplified by the Pamuhatan Farmer’s Association (PAFA). Before being formally organized, the farmers received training in vegetable farming and marketing. The market linkage and extension service that PAFA facilitates for their members play a critical role in their value chain. For example, in Figure 16 below, farmers that go through PAFA can take advantage of a smaller marketing cost per kilo as PAFA’s co-loading mechanism helps in reducing transportation cost. This is in contrast to a typical vegetable supply chain for smallholder farmers in Davao City who shoulder a larger transportation cost. Such small farmers also generally incur additional costs (e.g. plastic bags) as their assorted vegetables are sold to retailers and consumers in the Bankerohan because they do not have the capacity to consolidate enough volume to supply to a wholesaler. In contrast, PAFA farmers do not have to incur the additional costs of peddling their wares to retailers or worrying about volume since they can sell their goods to the PAFA stall in the Bankerohan, which is a wholesaler.
Figure 16 - Comparison of logistics cost between smallholder farmers
Source: Key Informant Interviews
0
1
2
3
4
5
6
7
8
9
10
Small Farmer - Retailer (Bankerohan) PAFA Farmer - PAFA Stall (Bankerohan)
Co
st p
er k
g
Vegetable Chains
Other costs
Hauling
Washing, Sorting, Hauling,Labor, TransportUnloading
Sorting and packing
Transport to Bankerohan
Production to highway
Production cost
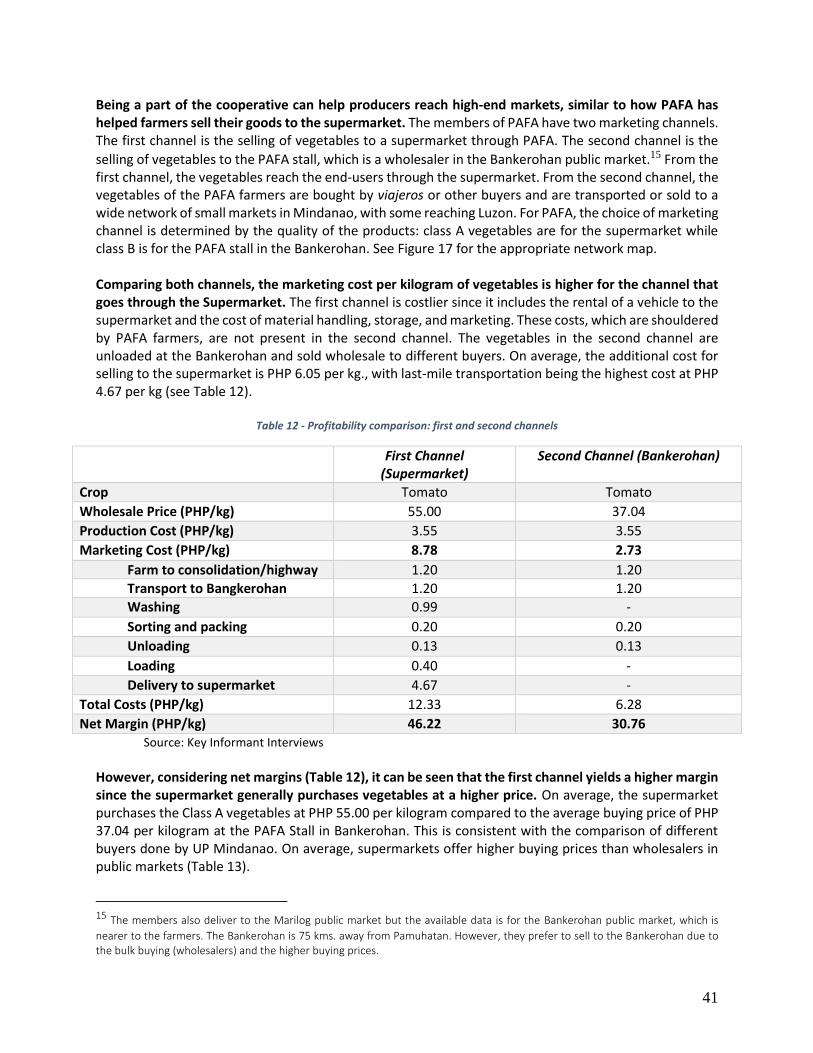
41
Being a part of the cooperative can help producers reach high-end markets, similar to how PAFA has helped farmers sell their goods to the supermarket. The members of PAFA have two marketing channels. The first channel is the selling of vegetables to a supermarket through PAFA. The second channel is the
selling of vegetables to the PAFA stall, which is a wholesaler in the Bankerohan public market.15 From the first channel, the vegetables reach the end-users through the supermarket. From the second channel, the vegetables of the PAFA farmers are bought by viajeros or other buyers and are transported or sold to a wide network of small markets in Mindanao, with some reaching Luzon. For PAFA, the choice of marketing channel is determined by the quality of the products: class A vegetables are for the supermarket while class B is for the PAFA stall in the Bankerohan. See Figure 17 for the appropriate network map. Comparing both channels, the marketing cost per kilogram of vegetables is higher for the channel that goes through the Supermarket. The first channel is costlier since it includes the rental of a vehicle to the supermarket and the cost of material handling, storage, and marketing. These costs, which are shouldered by PAFA farmers, are not present in the second channel. The vegetables in the second channel are unloaded at the Bankerohan and sold wholesale to different buyers. On average, the additional cost for selling to the supermarket is PHP 6.05 per kg., with last-mile transportation being the highest cost at PHP 4.67 per kg (see Table 12).
Table 12 - Profitability comparison: first and second channels
First Channel (Supermarket)
Second Channel (Bankerohan)
Crop Tomato Tomato
Wholesale Price (PHP/kg) 55.00 37.04
Production Cost (PHP/kg) 3.55 3.55
Marketing Cost (PHP/kg) 8.78 2.73
Farm to consolidation/highway 1.20 1.20
Transport to Bangkerohan 1.20 1.20
Washing 0.99 -
Sorting and packing 0.20 0.20
Unloading 0.13 0.13
Loading 0.40 -
Delivery to supermarket 4.67 -
Total Costs (PHP/kg) 12.33 6.28
Net Margin (PHP/kg) 46.22 30.76 Source: Key Informant Interviews
However, considering net margins (Table 12), it can be seen that the first channel yields a higher margin since the supermarket generally purchases vegetables at a higher price. On average, the supermarket purchases the Class A vegetables at PHP 55.00 per kilogram compared to the average buying price of PHP 37.04 per kilogram at the PAFA Stall in Bankerohan. This is consistent with the comparison of different buyers done by UP Mindanao. On average, supermarkets offer higher buying prices than wholesalers in public markets (Table 13).
15 The members also deliver to the Marilog public market but the available data is for the Bankerohan public market, which is
nearer to the farmers. The Bankerohan is 75 kms. away from Pamuhatan. However, they prefer to sell to the Bankerohan due to the bulk buying (wholesalers) and the higher buying prices.
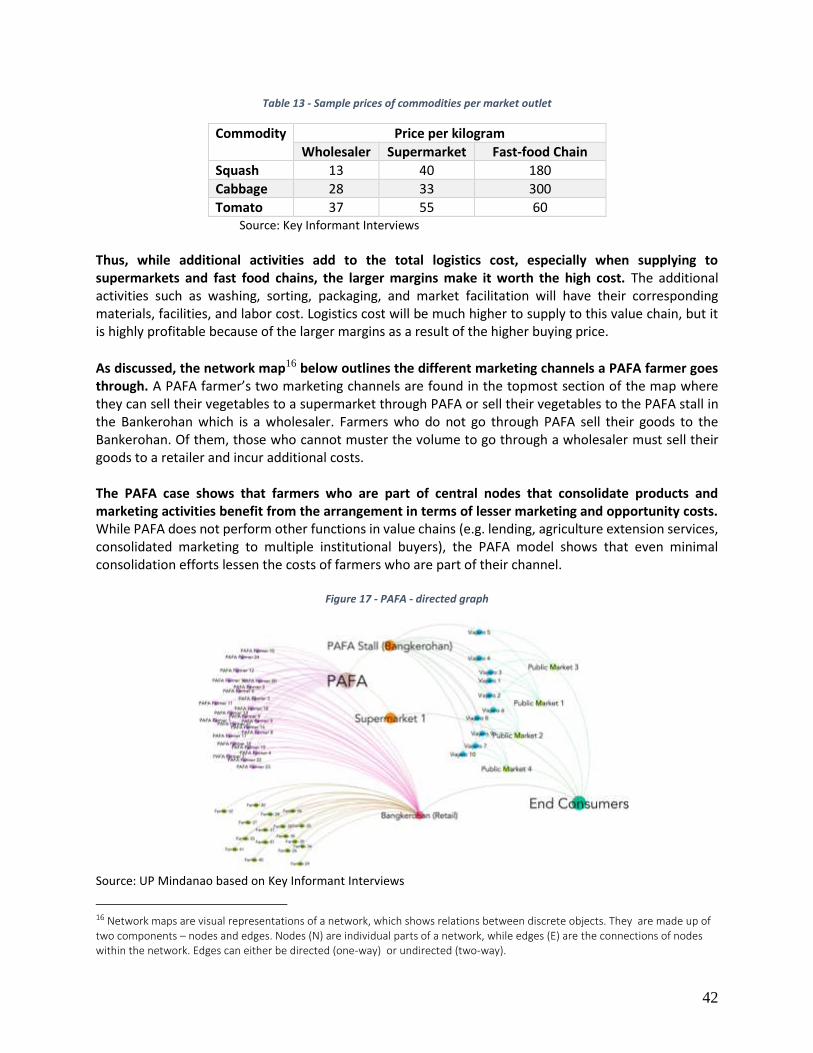
42
Table 13 - Sample prices of commodities per market outlet
Commodity Price per kilogram
Wholesaler Supermarket Fast-food Chain
Squash 13 40 180
Cabbage 28 33 300
Tomato 37 55 60 Source: Key Informant Interviews
Thus, while additional activities add to the total logistics cost, especially when supplying to supermarkets and fast food chains, the larger margins make it worth the high cost. The additional activities such as washing, sorting, packaging, and market facilitation will have their corresponding materials, facilities, and labor cost. Logistics cost will be much higher to supply to this value chain, but it is highly profitable because of the larger margins as a result of the higher buying price.
As discussed, the network map16 below outlines the different marketing channels a PAFA farmer goes through. A PAFA farmer’s two marketing channels are found in the topmost section of the map where they can sell their vegetables to a supermarket through PAFA or sell their vegetables to the PAFA stall in the Bankerohan which is a wholesaler. Farmers who do not go through PAFA sell their goods to the Bankerohan. Of them, those who cannot muster the volume to go through a wholesaler must sell their goods to a retailer and incur additional costs. The PAFA case shows that farmers who are part of central nodes that consolidate products and marketing activities benefit from the arrangement in terms of lesser marketing and opportunity costs. While PAFA does not perform other functions in value chains (e.g. lending, agriculture extension services, consolidated marketing to multiple institutional buyers), the PAFA model shows that even minimal consolidation efforts lessen the costs of farmers who are part of their channel.
Figure 17 - PAFA - directed graph
Source: UP Mindanao based on Key Informant Interviews
16 Network maps are visual representations of a network, which shows relations between discrete objects. They are made up of two components – nodes and edges. Nodes (N) are individual parts of a network, while edges (E) are the connections of nodes within the network. Edges can either be directed (one-way) or undirected (two-way).

43
Generally, if not save on costs, cooperatives or powerful players that have the necessary skills (organizing, consolidation, financing) would allow farmers to better consolidate and reach higher end-markets. Institutional buyers (companies like Jollibee, supermarkets like SM, exporters like the Taiwanese buyer of Rehoboth) have quantity, quality and timing requirements. Intermediaries (or nodes) that are able to fill these requisites need to have the skills and resources to organize smallholders and build their capacity. These intermediaries must also deal with buyers and ask for support from other players (e.g. government). These tasks are not necessarily easy. Groups like PAFA have the skills and resources needed to provide efficiency gains (e.g. scale, timing, quality) for institutional buyers. A central hub such as that would subsume functions either at the upstream or downstream of the value chain, which makes the network shorter and more efficient. Notably, the establishment of efficient and fully functional cooperatives can be complex and challenging. Cooperatives have to worry about acquiring capital and sustainable financing for its services and activities, especially if members do not have sufficient financing to re-invest in the cooperative. Some cooperatives feature weak internal governance to their detriment. Without proper management, cooperatives run the risk of failing to realize various goals and losing direction. Management problems can also affect the management of funds and resources and bad managers can lead to poor record-keeping, inadequate training, low trust among members, and failure to diversify, among other issues.
(Concepcion, S., Digal, L. N., & Uy 2006)
Lead Firms Lead firms have the potential to address many market failures because they have the capacity to offer a stable market for producers and they have the resources to help address the high cost and risks that plague an inefficient value chain. A partnership between large buyers and government or non-government entities can be developed where the logistics chain can be properly managed. Major buyers such as NCCC, SM, and fast food chains such as Jollibee and Chowking have now become a major market for vegetables in urban areas and a partnership with these firms can address inefficiencies in the logistic chain. The supporting organization can inject development interventions where logistic activities across the value chain can improve in terms of the equipment, facilities, and other infrastructure that facilitate it. Moreover, their involvement would encourage other investments (NGOs, development organizations, and government entities) and create a virtuous cycle of inclusion. In time, coordination and repetitive cooperation can build trust among players and producers themselves can even invest in their own development (Pelkmans-Balaoing 2019). Some lead firms take ownership of the value chain from the producer or buyer level. Value chains can be buyer-driven in that the leading firm controls the end-market, or it can be producer-driven in that the lead firm controls the input and production, or it can be both. For example, Jollibee Foods Corporation (JFC), one of the largest fast-food chains in the country, launched the Farmer Entrepreneurship Program (FEB) to build up the capacity of the smallholder farmers they source their agricultural inputs from. They help control the input as well as function as the main buyer in the value chain. The firm purchases directly from the farmers and helps them produce goods that meet their standards. They also coordinate with other key suppliers along the value chain. The reported rise in incomes of involved smallholders is largely attributed to the involvement of the most powerful actor along the value chain, namely the Jollibee Group Foundation (Pelkmans-Balaoing 2019).
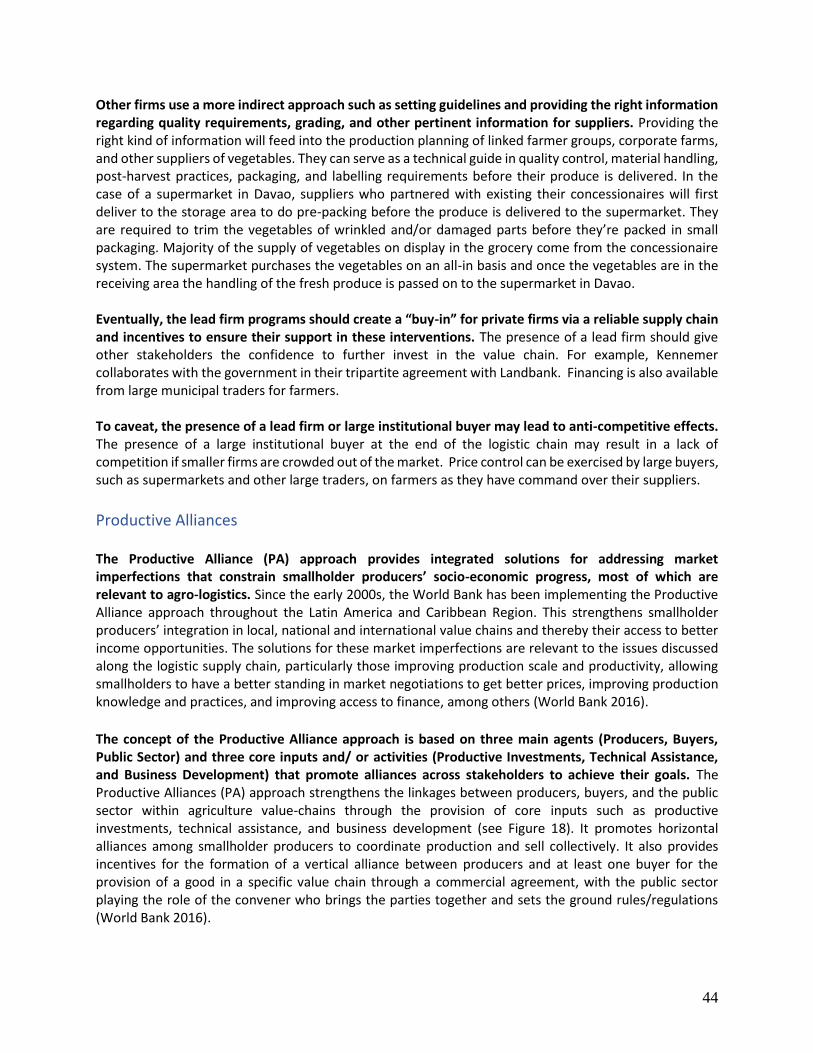
44
Other firms use a more indirect approach such as setting guidelines and providing the right information regarding quality requirements, grading, and other pertinent information for suppliers. Providing the right kind of information will feed into the production planning of linked farmer groups, corporate farms, and other suppliers of vegetables. They can serve as a technical guide in quality control, material handling, post-harvest practices, packaging, and labelling requirements before their produce is delivered. In the case of a supermarket in Davao, suppliers who partnered with existing their concessionaires will first deliver to the storage area to do pre-packing before the produce is delivered to the supermarket. They are required to trim the vegetables of wrinkled and/or damaged parts before they’re packed in small packaging. Majority of the supply of vegetables on display in the grocery come from the concessionaire system. The supermarket purchases the vegetables on an all-in basis and once the vegetables are in the receiving area the handling of the fresh produce is passed on to the supermarket in Davao. Eventually, the lead firm programs should create a “buy-in” for private firms via a reliable supply chain and incentives to ensure their support in these interventions. The presence of a lead firm should give other stakeholders the confidence to further invest in the value chain. For example, Kennemer collaborates with the government in their tripartite agreement with Landbank. Financing is also available from large municipal traders for farmers. To caveat, the presence of a lead firm or large institutional buyer may lead to anti-competitive effects. The presence of a large institutional buyer at the end of the logistic chain may result in a lack of competition if smaller firms are crowded out of the market. Price control can be exercised by large buyers, such as supermarkets and other large traders, on farmers as they have command over their suppliers.
Productive Alliances The Productive Alliance (PA) approach provides integrated solutions for addressing market imperfections that constrain smallholder producers’ socio-economic progress, most of which are relevant to agro-logistics. Since the early 2000s, the World Bank has been implementing the Productive Alliance approach throughout the Latin America and Caribbean Region. This strengthens smallholder producers’ integration in local, national and international value chains and thereby their access to better income opportunities. The solutions for these market imperfections are relevant to the issues discussed along the logistic supply chain, particularly those improving production scale and productivity, allowing smallholders to have a better standing in market negotiations to get better prices, improving production knowledge and practices, and improving access to finance, among others (World Bank 2016).
The concept of the Productive Alliance approach is based on three main agents (Producers, Buyers, Public Sector) and three core inputs and/ or activities (Productive Investments, Technical Assistance, and Business Development) that promote alliances across stakeholders to achieve their goals. The Productive Alliances (PA) approach strengthens the linkages between producers, buyers, and the public sector within agriculture value-chains through the provision of core inputs such as productive investments, technical assistance, and business development (see Figure 18). It promotes horizontal alliances among smallholder producers to coordinate production and sell collectively. It also provides incentives for the formation of a vertical alliance between producers and at least one buyer for the provision of a good in a specific value chain through a commercial agreement, with the public sector playing the role of the convener who brings the parties together and sets the ground rules/regulations (World Bank 2016).
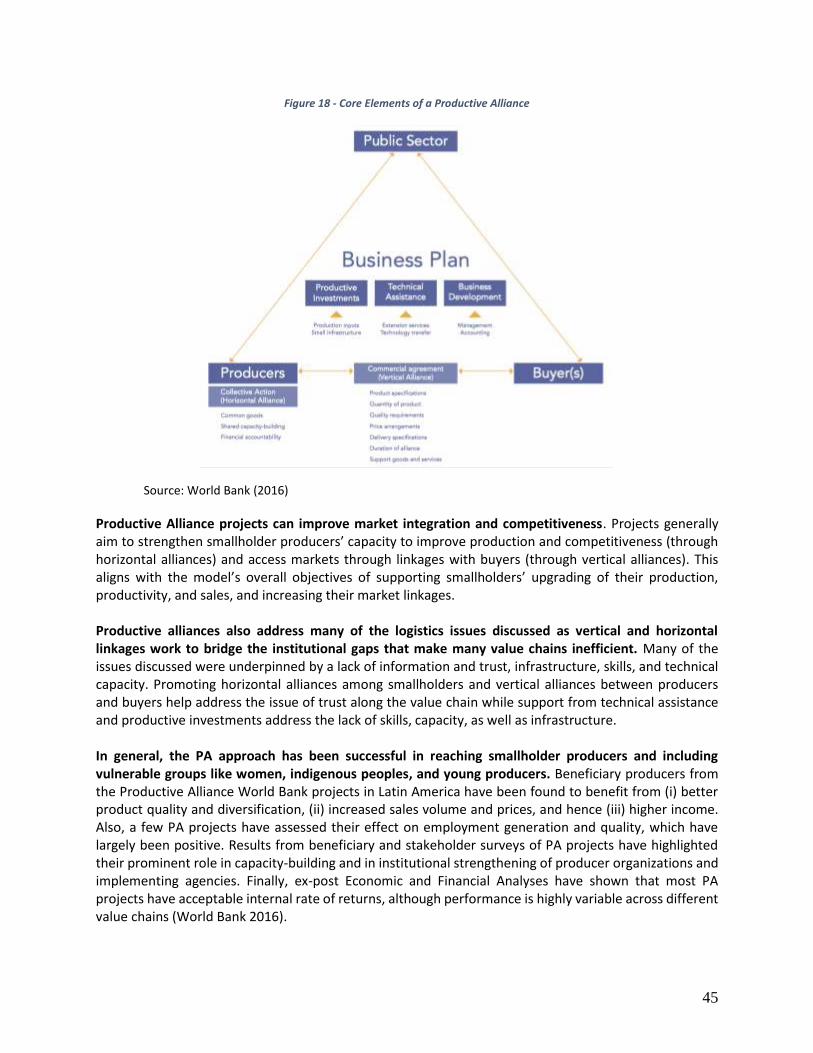
45
Figure 18 - Core Elements of a Productive Alliance
Source: World Bank (2016)
Productive Alliance projects can improve market integration and competitiveness. Projects generally aim to strengthen smallholder producers’ capacity to improve production and competitiveness (through horizontal alliances) and access markets through linkages with buyers (through vertical alliances). This aligns with the model’s overall objectives of supporting smallholders’ upgrading of their production, productivity, and sales, and increasing their market linkages. Productive alliances also address many of the logistics issues discussed as vertical and horizontal linkages work to bridge the institutional gaps that make many value chains inefficient. Many of the issues discussed were underpinned by a lack of information and trust, infrastructure, skills, and technical capacity. Promoting horizontal alliances among smallholders and vertical alliances between producers and buyers help address the issue of trust along the value chain while support from technical assistance and productive investments address the lack of skills, capacity, as well as infrastructure. In general, the PA approach has been successful in reaching smallholder producers and including vulnerable groups like women, indigenous peoples, and young producers. Beneficiary producers from the Productive Alliance World Bank projects in Latin America have been found to benefit from (i) better product quality and diversification, (ii) increased sales volume and prices, and hence (iii) higher income. Also, a few PA projects have assessed their effect on employment generation and quality, which have largely been positive. Results from beneficiary and stakeholder surveys of PA projects have highlighted their prominent role in capacity-building and in institutional strengthening of producer organizations and implementing agencies. Finally, ex-post Economic and Financial Analyses have shown that most PA projects have acceptable internal rate of returns, although performance is highly variable across different value chains (World Bank 2016).
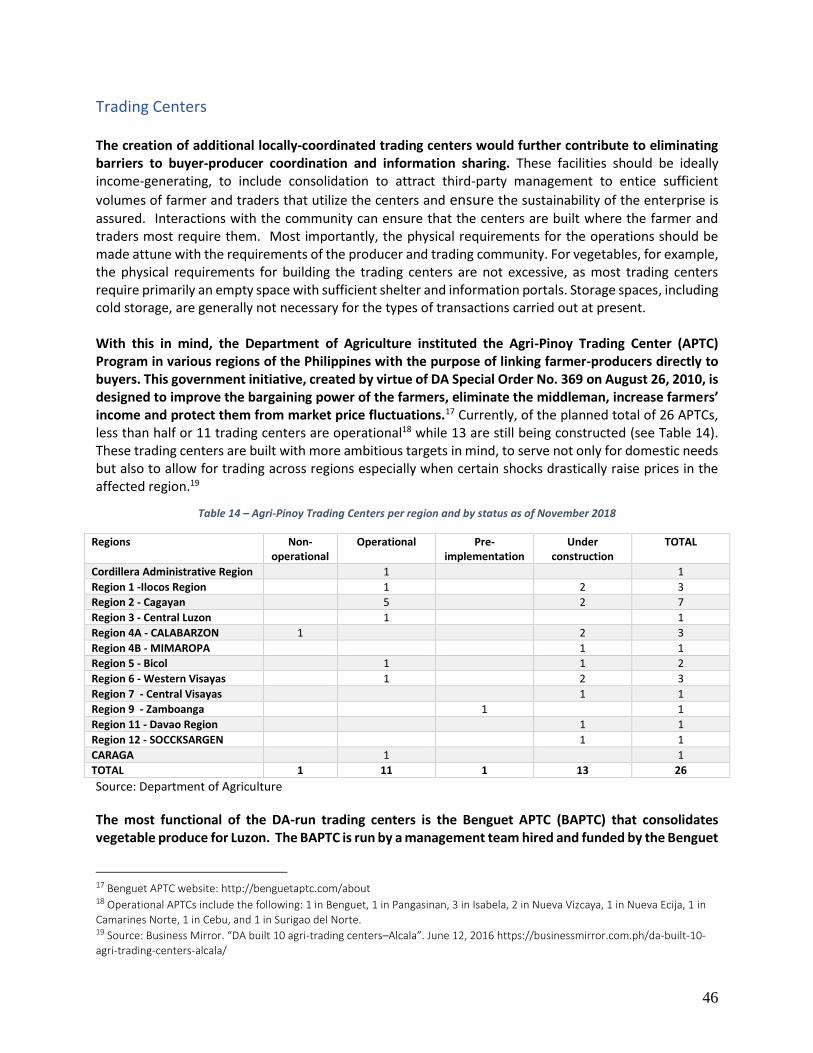
46
Trading Centers The creation of additional locally-coordinated trading centers would further contribute to eliminating barriers to buyer-producer coordination and information sharing. These facilities should be ideally income-generating, to include consolidation to attract third-party management to entice sufficient
volumes of farmer and traders that utilize the centers and ensure the sustainability of the enterprise is assured. Interactions with the community can ensure that the centers are built where the farmer and traders most require them. Most importantly, the physical requirements for the operations should be made attune with the requirements of the producer and trading community. For vegetables, for example, the physical requirements for building the trading centers are not excessive, as most trading centers require primarily an empty space with sufficient shelter and information portals. Storage spaces, including cold storage, are generally not necessary for the types of transactions carried out at present. With this in mind, the Department of Agriculture instituted the Agri-Pinoy Trading Center (APTC) Program in various regions of the Philippines with the purpose of linking farmer-producers directly to buyers. This government initiative, created by virtue of DA Special Order No. 369 on August 26, 2010, is designed to improve the bargaining power of the farmers, eliminate the middleman, increase farmers’ income and protect them from market price fluctuations.17 Currently, of the planned total of 26 APTCs, less than half or 11 trading centers are operational18 while 13 are still being constructed (see Table 14). These trading centers are built with more ambitious targets in mind, to serve not only for domestic needs but also to allow for trading across regions especially when certain shocks drastically raise prices in the affected region.19
Table 14 – Agri-Pinoy Trading Centers per region and by status as of November 2018
Regions Non-operational
Operational Pre-implementation
Under construction
TOTAL
Cordillera Administrative Region 1 1
Region 1 -Ilocos Region 1 2 3
Region 2 - Cagayan 5 2 7
Region 3 - Central Luzon 1 1
Region 4A - CALABARZON 1 2 3
Region 4B - MIMAROPA 1 1
Region 5 - Bicol 1 1 2
Region 6 - Western Visayas 1 2 3
Region 7 - Central Visayas 1 1
Region 9 - Zamboanga 1 1
Region 11 - Davao Region 1 1
Region 12 - SOCCKSARGEN 1 1
CARAGA 1 1
TOTAL 1 11 1 13 26
Source: Department of Agriculture
The most functional of the DA-run trading centers is the Benguet APTC (BAPTC) that consolidates vegetable produce for Luzon. The BAPTC is run by a management team hired and funded by the Benguet
17 Benguet APTC website: http://benguetaptc.com/about 18 Operational APTCs include the following: 1 in Benguet, 1 in Pangasinan, 3 in Isabela, 2 in Nueva Vizcaya, 1 in Nueva Ecija, 1 in
Camarines Norte, 1 in Cebu, and 1 in Surigao del Norte. 19 Source: Business Mirror. “DA built 10 agri-trading centers–Alcala”. June 12, 2016 https://businessmirror.com.ph/da-built-10-
agri-trading-centers-alcala/
47
State University (BSU), rather than the farmers, traders, or the government. The BAPTC officially launched on October 27, 2015, but only became fully operational on June 7, 2017. BSU is essentially the fund manager of the BAPTC. The actual operations are being run by managers and staff who were hired under a contract of service agreement with BSU. The management group, however, hinted its request to have their own legal entity to avoid delaying activities at the APTC, which involve perishable goods, due to funding request setbacks. The center was designed to have spaces and programs for several post-harvest service activities; however, many of these are not used by the trading community. It has a processing unit and cold
storage20 but they are still not operational. The facility has a washing area per stall as well. BAPTC has
small reefer trucks which are for rent21 and can also be used to bring commodities to Manila. The facility is equipped with conveyor belts which were expected to facilitate the handling process but they are still unused up to date. Presently, it provides only marketing services and linkages and much of the facilities and equipment remain unused. In addition, BAPTC has no involvement in the daily price determination and volume data is not recorded properly nor used in the operations. The prices are determined through the usual bidding process between the farmers, buyers (middlemen), and traders. They then inform BAPTC management of these prevailing trading prices, which they then post online through the BAPTC
website.22 Management attempted to estimate the prevailing price using the volume of trade (supply and demand), however, they lack the capacity to sustain price determination activity. They do look at the prices of similar produce in nearby trading posts, such as Nueva Vizcaya APTC, which also sell highland vegetables, but do not systematically record nor monitor it. Furthermore, they provide an information system that is not frequently updated and no historical record is available online. Once management determines the volume required for a specific day by the traders and consolidators, this information is disseminated to the farmers through text message. Daily prices are monitored by management and the prevailing prices are flashed on big screens located at the trading centers and are supposed to be reflected online in their website, however, as of this writing, the latest price data is dated October 2018. Like many of the other trading centers, the ambitious infrastructure built around the center is not fully optimized. However, the mere presence of the trading center has improved the situation for vegetables. Before the launching of BAPTC, there used to be just a single trading center in La Trinidad valley with a maximum capacity of 200 farmer trucks. Before, the queue of trucks trying to get into the trading post extended to 15 kilometers or about 700 trucks. The long wait leads to high rates of spoilage and low farmer incomes as they agree to sell at lower prices instead of going back to the farm with nothing. With the existence of BAPTC that can accommodate 400 trucks, the congestion in the older trading center was reduced. Now, farmers can sell more and at higher prices. For instance, before BAPTC, cabbages were sold at a very trivial price of PHP 1 per kilogram, now it is worth PHP 50 to 70. The farmers are also selling more in terms of volume. Many of these trading centers are sometimes not fully suited to the community’s needs, lacking thorough vetting to ensure the project maximizes its potential. The World Bank Philippine Rural Development Project (PRDP) provides a good example of how to best respond to a community’s needs. Projects under the PRDP are demand-driven and chosen strategically. Projects also come with planning
20 Mainly for strawberries. 21 PHP 4,000 rental fee excluding toll, gas, and driver meals. BAPTC has 3 elf trucks, and 3 forwards. 22 See BAPTC website: http://benguetaptc.com/about

48
activities such as assessments of the value chain to account for climate resilience, the sustainability of design, and changing market conditions. Once chosen, the execution of the project will include the participation of Municipal LGUs in its implementation and receive support to ensure investments are income-generating – this includes the development of business plans. In the early stages of the operation, enterprises will also get continued support in areas such as procurement, financial management, marketing, processing, safeguards, or food safety. Lately, the operation also aims to address the potential effects of the vulnerability of the agriculture (and roads infrastructure) sector to climate variability. In all, the PRDP provides a model of project selection and delivery. Solutions are collaborative, owned by the community, timely, and sustainable. There is still a demand for additional trading centers. Consultations with government and community stakeholders (NGO, Business, Academe, Community Leaders) during a WBG mapping project show that the community still clamors for bagsakan centers as among the proposed agriculture infrastructure projects they feel a need for. Figure 19 shows an example map of proposed stakeholder projects from one of the consultations, including the need for more bagsakans. Increased consultations can ensure that the correct infrastructure is generated at the correct mode and location, in order to ensure the sustainability of these projects. Please see the Mindanao Roads Connectivity report for more project suggestions.
Figure 19 - Proposed projects from stakeholders

49
Box 1 - Davao Food Terminal Complex
IT solutions Advancements in Information Technology (IT) can also be leveraged to improve the efficiency of the logistic supply chain and facilitate its restructuring. With the exponential growth of technological development, several sectors are being disrupted by digitalization, including agriculture. New technological solutions can create new opportunities to bring smallholders into a more digitally-driven agriculture sector. Such advancements in technology can also be used to restructure the value chain i.e. IT services can be used to replace some of the intermediaries in the chain. There are several IT solutions that have worked in other countries, and these include using a cloud-based application and mobile
The Davao Food Terminal Complex (DFTC) was established to assist small farmers in the Davao Region to gain access to high-end markets within Davao City. The DFTC is a 25-hectare property located in Toril, Davao City, first conceptualized in 2014. The development of the food terminal was funded in part by JICA. The initiative had partner agencies such as the DA – PRDP, NEDA – ICC and LGU who involved a technical working group, the city planning office, city engineer, and city agriculture office. The inspiration for the food terminal complex was the success of a similar food complex in South Korea. It aims to serve as the main consolidation point “bagsakan” for agricultural products such as fruits and vegetables and it is also projected to lessen the traffic caused by trucks going in and out of Bankerohan in the downtown area. It aims to achieve a sustainable supply chain which includes small farmers and provide the logistics support that they need to supply to the private sector. The DFTC officially opened on May 28, 2019 but it is not functionating as initially envisioned just yet. Management already hired a few personnel to start operations inside the food terminal complex including L/UL crew, washers, security guards, janitors, etc. The complex had a soft opening last August 2018 which helped facilitate transactions for a few farmers and their traders. However, the transactions did not follow the proposed business model of DFTC yet. The farmer and his buyer were doing the transactions inside the complex, but it was the traditional buyer-seller transaction and was not facilitated by the FFDC or the trading department. No fees were collected. Presently, there are no locators yet.
High fees have made doing business in DFTC unprofitable and many of the proposed facilities are still lacking. Initial observations from key informants had revealed that operators considered the fees they were required to pay too high which cut into their margins. FFDC had also been using their own shared funds from their member cooperatives to fund the operations that were on-going from the remainder of 2018 and up to February of 2019. Further, as of right now, many proposed facilities are still absent. The terminal complex does not have its own POS system yet. It also needs a separate storage facility for both fruits and vegetables. A conveyor belt, chiller and food processing facility will also be installed for use in materials handling of fresh produce. Stakeholders are looking to install more features and facilities that would help in creating a better logistics environment for farmers and producer organizations to sell products that are high quality. The terminal remains a work in progress and DRACO is still in the process of cultivating relationships with the farmers. DRACO still needs to build a relationship with the farmers and they continue working on the profiling of farmers to have better information.
50
technology to help farmers gain access to finance (Vietnam), and using a mobile application to book logistic services for smallholder farmers (India). One IFC pilot project in Vietnam uses FarmForce, a cloud-based app, to help farmers gain access to finance. FarmForce (by the Syngenta Foundation) is a SaaS, cloud-based web application using mobile technology to replace existing paper-based documentation. This improves efficiency, transparency, simplifies traceability audits, and facilitates farmer access to finance. Using mobile field devices, FarmForce can digitalize farmer profiles (including GIS, photos etc.), keep records of inputs (incl. alert on banned chemicals), production plans, farm surveys (certification, yield estimation), training management, farmer group management, harvest and inventory management, SMS messaging and responses from farmers (e.g. production, pricing, weather alerts). The outcome from using the app has been positive so far with its ease of use. Configuration and implementation time is short, as the tool has already been used in multiple countries and with more than 100,000 farmers. The client does not need to employ additional IT and FarmForce covers hosting, upgrades, second-line technical support and backups. Tools are also translated to facilitate training and use for field officers, mobile device configuration and go live. It also has the benefits of reducing paperwork when reaching out to thousands of farmers in certification audits and they are able to track data/issues over years, comparing regions and farmer groups to make continuous improvement. There’s room for improvement with several lessons learned for future projects. The testing of a Bankability Scorecard requires local banks for the most suitable credit risk rating and this is not always easy to find. The business case is not quantified yet and the client may incur additional data collection costs. Farmers have to pay to receive SMS messages while the lead firm is still considering whether it wants to cover these costs. After the project, the implementing partner will face subscription fees and FarmForce is still working on the business case and pricing matrix. There is also the issue of confidentiality. There are questions around the ownership and control of Simexco farmer data vs. sharing with banks.
Also using an app, smallholder farmers in India can now use a mobile platform to facilitate the transport of their produce. Smallholder farmers grow the majority of India’s fresh produce but have little support to get it to market. Loop is a shared transport service for farmers to pick up their produce, drop it off at the market, and pay them back. To book the service, the farmer just needs to tell Loop how much harvest they want to sell the next day. A nearby right-sized vehicle then collects multiple farmer’s produce. Produce is sold to traders at markets and farmers are paid through mobile payments. The service also allows farmers to discover crop prices and take advantage of cost data curated to provide market recommendations. Loop provides convenience, cost-savings, the use of digital payments, and it unlocks new markets. More specifically, it saves 4 to 8 hours per market trip for all farmers, women and men, who often harvest multiple times each week, it allows shared truck loads and optimized routing to reduce per farmer costs, digitized payments minimize chances of fraud and theft while building farmers’ credit histories, and the information gathered lets farmers discover price arbitrage opportunities with the expanding network of markets.

51
Figure 20 - LOOP Booking steps
Source: LOOP
The app has improved the welfare of farmers and allows them to bypass the more inefficient unorganized sector. The app has high retention and repeat farmer usage with seasonal variation. Farmer incomes increased by 13 percent by reducing costs by 17 percent and realizing 11 percent higher prices at markets and saving 4-8 hours/trip. It becomes profitable with automation and network effects. Loop competes primarily with hyper local transporters and buyers in the unorganized sector where 80 percent of farm produce is sold. The unorganized sector, in particular, is characterized by dominant, rent-seeking agents which impose a high cost for buyers and sellers. The use of apps can also be used to help farms receive more up-to-date information. More current price information would facilitate the reduction in market distortion and allow farmers to better plan their production processes. The M-Farm application in Kenya is such an app and has encouraged farmers to adjust their cropping patterns based on the information. Not only is price information helpful, but information on climatic changes, weather, pest attacks, and other patterns of crop failure can help farmers anticipate and respond accordingly. Notably, there are challenges rural communities may face before taking advantage of the digitalization of agriculture. There is a danger of increasing the “digital divide” as the lack of technological infrastructure (limited network service), prohibitive costs, and inadequacy of digital skills, and limited access to services can potentially deny rural areas the chance to take advantage of these new technologies.
52
Summary Logistic issues along the agriculture value chain in Mindanao are much more prevalent at the farm level. A horizontal price analysis showed that prices across Mindanao and prices between Mindanao and the large cities in Luzon and Visayas are cointegrated in the long term, implying a co-movement of prices and a market that clears. This implies that generally, agricultural markets in various cities in Mindanao and in the country relate to each other such that products can easily be mobilized from the primary urban centers to the other markets where producers can get the best returns. Instead, many of the inefficiencies seem to come from the farm level. The issues at the farm level can be summarized as the lack of information, double handling and spoilage, and issues with quality control. These issues are consistent regardless of whether the produce are destined for the domestic market or the export market, such as the case with the Vegetable and Cacao value chains. In both, farmers become price takers given the dearth of accessible and reliable market information. This leads to fluctuating prices and supply issues as planning at the production level becomes difficult. Double handling and high incidences of spoilage arises as a lack of trust between buyer and seller creates a situation where packing and re-sorting occur at every node of the logistics chain. This eventually affects the quality of the product which keeps farmers from servicing high-end markets or the export market. The value chain can benefit from better organization to address some of these inefficiencies. In less developed countries, the value chain is generally longer as the missing links along the value chain draw in alternative transaction mechanisms or players. These inefficiencies thus reflect a gap along the value chain that is often filled by middlemen. This gap consequently imposes a higher transactional cost. Unfortunately, the highest transaction costs often fall on smallholders where market failures are generally more severe. In general, a value chain with fewer middlemen is more compact and efficient. One option to reduce cost is to have an entity (i.e. a lead firm or cooperative) to connect with local intermediaries to internalize transaction costs or address market failures along the value chain, such was the case of the PAFA market. Suggested mechanisms to better organize the logistics value chain to overcome the coordination and information issues include cooperatives or lead firm, productive alliances among stakeholders, the use of information technology, and building functional trade centers. The presence of a cooperative or lead firm taking ownership of the value chain can help address the inefficiencies of a value chain because they have the resources, stable market, and business incentive to do so. Their presence can, in turn, create a “buy-in” from other private firms to support their interventions. Productive alliances can help address the issues of trust along the value chain as well as provide support (investments, technical assistance, and business development). IT solutions can improve efficiency through technological innovations that facilitate movement along the value chain such as through mobile apps or other platforms. Trading centers that are well located, well-managed and provide good information also facilitate coordination and information exchange.
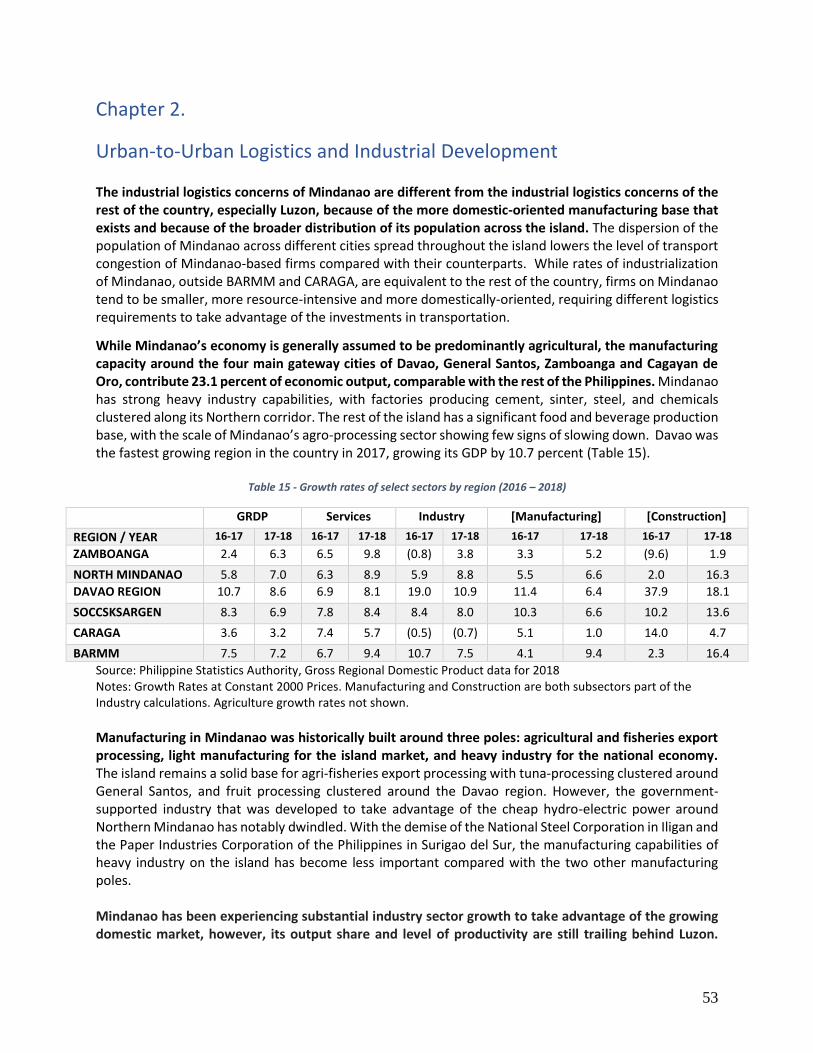
53
Chapter 2.
Urban-to-Urban Logistics and Industrial Development The industrial logistics concerns of Mindanao are different from the industrial logistics concerns of the rest of the country, especially Luzon, because of the more domestic-oriented manufacturing base that exists and because of the broader distribution of its population across the island. The dispersion of the population of Mindanao across different cities spread throughout the island lowers the level of transport congestion of Mindanao-based firms compared with their counterparts. While rates of industrialization of Mindanao, outside BARMM and CARAGA, are equivalent to the rest of the country, firms on Mindanao tend to be smaller, more resource-intensive and more domestically-oriented, requiring different logistics requirements to take advantage of the investments in transportation.
While Mindanao’s economy is generally assumed to be predominantly agricultural, the manufacturing capacity around the four main gateway cities of Davao, General Santos, Zamboanga and Cagayan de Oro, contribute 23.1 percent of economic output, comparable with the rest of the Philippines. Mindanao has strong heavy industry capabilities, with factories producing cement, sinter, steel, and chemicals clustered along its Northern corridor. The rest of the island has a significant food and beverage production base, with the scale of Mindanao’s agro-processing sector showing few signs of slowing down. Davao was the fastest growing region in the country in 2017, growing its GDP by 10.7 percent (Table 15).
Table 15 - Growth rates of select sectors by region (2016 – 2018)
GRDP Services Industry [Manufacturing] [Construction]
REGION / YEAR 16-17 17-18 16-17 17-18 16-17 17-18 16-17 17-18 16-17 17-18
ZAMBOANGA 2.4 6.3 6.5 9.8 (0.8) 3.8 3.3 5.2 (9.6) 1.9
NORTH MINDANAO 5.8 7.0 6.3 8.9 5.9 8.8 5.5 6.6 2.0 16.3
DAVAO REGION 10.7 8.6 6.9 8.1 19.0 10.9 11.4 6.4 37.9 18.1
SOCCSKSARGEN 8.3 6.9 7.8 8.4 8.4 8.0 10.3 6.6 10.2 13.6
CARAGA 3.6 3.2 7.4 5.7 (0.5) (0.7) 5.1 1.0 14.0 4.7
BARMM 7.5 7.2 6.7 9.4 10.7 7.5 4.1 9.4 2.3 16.4
Source: Philippine Statistics Authority, Gross Regional Domestic Product data for 2018 Notes: Growth Rates at Constant 2000 Prices. Manufacturing and Construction are both subsectors part of the Industry calculations. Agriculture growth rates not shown.
Manufacturing in Mindanao was historically built around three poles: agricultural and fisheries export processing, light manufacturing for the island market, and heavy industry for the national economy. The island remains a solid base for agri-fisheries export processing with tuna-processing clustered around General Santos, and fruit processing clustered around the Davao region. However, the government-supported industry that was developed to take advantage of the cheap hydro-electric power around Northern Mindanao has notably dwindled. With the demise of the National Steel Corporation in Iligan and the Paper Industries Corporation of the Philippines in Surigao del Sur, the manufacturing capabilities of heavy industry on the island has become less important compared with the two other manufacturing poles. Mindanao has been experiencing substantial industry sector growth to take advantage of the growing domestic market, however, its output share and level of productivity are still trailing behind Luzon.
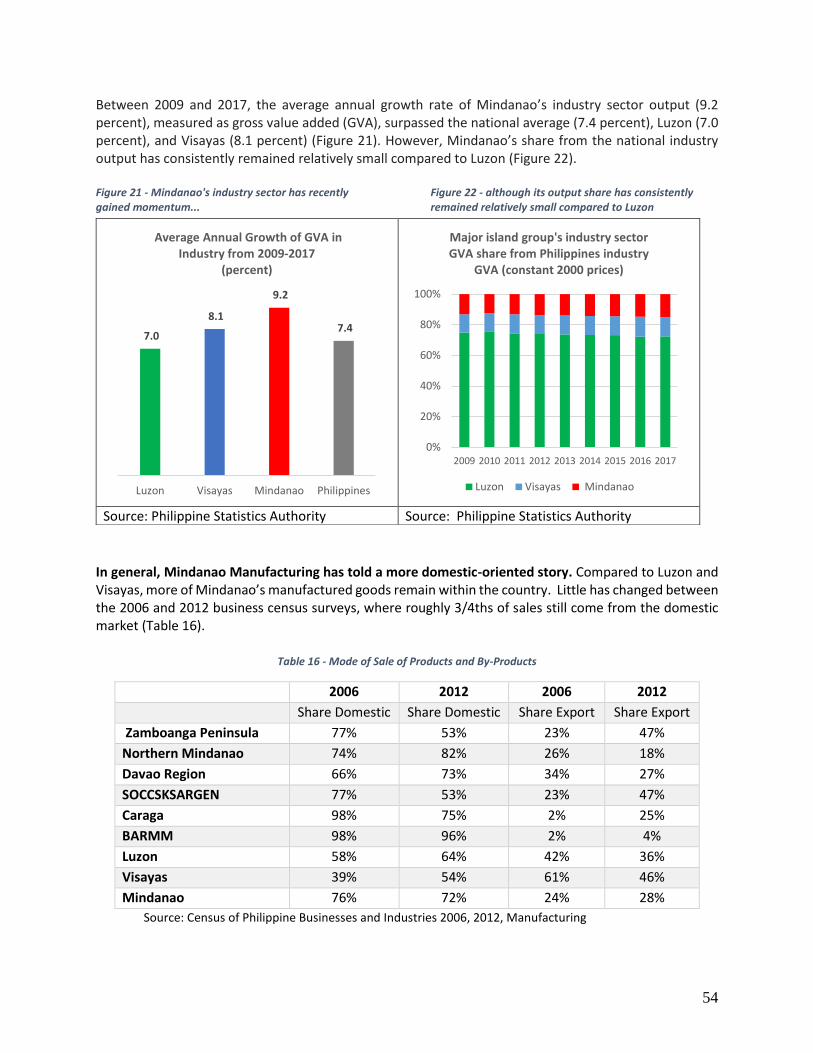
54
Between 2009 and 2017, the average annual growth rate of Mindanao’s industry sector output (9.2 percent), measured as gross value added (GVA), surpassed the national average (7.4 percent), Luzon (7.0 percent), and Visayas (8.1 percent) (Figure 21). However, Mindanao’s share from the national industry output has consistently remained relatively small compared to Luzon (Figure 22). Figure 21 - Mindanao's industry sector has recently gained momentum...
Figure 22 - although its output share has consistently remained relatively small compared to Luzon
In general, Mindanao Manufacturing has told a more domestic-oriented story. Compared to Luzon and Visayas, more of Mindanao’s manufactured goods remain within the country. Little has changed between the 2006 and 2012 business census surveys, where roughly 3/4ths of sales still come from the domestic market (Table 16).
Table 16 - Mode of Sale of Products and By-Products
2006 2012 2006 2012
Share Domestic Share Domestic Share Export Share Export
Zamboanga Peninsula 77% 53% 23% 47%
Northern Mindanao 74% 82% 26% 18%
Davao Region 66% 73% 34% 27%
SOCCSKSARGEN 77% 53% 23% 47%
Caraga 98% 75% 2% 25%
BARMM 98% 96% 2% 4%
Luzon 58% 64% 42% 36%
Visayas 39% 54% 61% 46%
Mindanao 76% 72% 24% 28%
Source: Census of Philippine Businesses and Industries 2006, 2012, Manufacturing
Source: Philippine Statistics Authority Source: Philippine Statistics Authority
7.0
8.1
9.2
7.4
Luzon Visayas Mindanao Philippines
Average Annual Growth of GVA in Industry from 2009-2017
(percent)
0%
20%
40%
60%
80%
100%
2009 2010 2011 2012 2013 2014 2015 2016 2017
Major island group's industry sector GVA share from Philippines industry
GVA (constant 2000 prices)
Luzon Visayas Mindanao

55
Mindanao manufacturing has remained focused on primary product processing, in contrast to Luzon and Visayas which moved on to more sophisticated forms of manufacturing. Studying the revenue share by sector reveals that most of Mindanao’s firm income from the manufacturing sector is derived from non-fuel primary commodities, both from selling to the domestic market and through exports (Figure 23 and 24). This is in contrast to Luzon and Visayas where their sources of revenue are more diversified across manufacturing categories. The majority of their revenue from exports comes from medium- and low-skilled technology-intensive manufacturing, and not just from the further processing of primary commodities. Figure 23 - Share of total revenue from manufacturing goods sold domestically across island groups
Figure 24 - Share of total revenue from manufacturing goods sold abroad across island groups
Often, manufacturing firms are relatively small and less productive on Mindanao compared to the rest of the country. Even in more industrialized areas like Davao and Cagayan de Oro, Mindanao-based firms tend to remain smaller than their Filipino counterparts and fail to generate the same levels of labor productivity and employment as firms in Luzon and Visayas. Labor productivity for firms in Mindanao is lower compared to other regions (Figure 25) and close to 40 percent of firms employ less than 10 people (Figure 26). Opportunities exist as Mindanao itself is not yet considered a single market. Small firms serving the mainly local market reduce the need for inter-city travel. Herein lies opportunities to start seeing the potential in Mindanao as a large consumer market. Firms can scale up and take advantage of the wider Mindanao market, increasing size, capacity, and productivity along the way.

56
Figure 25 - Output per worker by size Figure 26 - Share of firms by firm size
Spatial Dispersion and Four-pole development There is potential in the large and growing domestic market. Mindanao has the advantage of having a large domestic market within a single island. The population is roughly 23.79 percent of the Philippine Population and its main cities are experiencing modest population growth. Zamboanga City’s population grew at a rate of 2.98 percent. Davao City and General Santos City saw growth rates of 2.37 and 2.71 percent respectively. Up north, Cagayan de Oro City’s population saw a growth rate of 2.69 percent. These growth rates are higher than the 1.90 percent country-average growth rate from 2000 to 2010. 23
Unlike Luzon where a bulk of the population is concentrated around a single highly congested National Capital Region, Mindanao’s population is spread across four urban port cities on its Northern, Eastern, Southern and Western sides. With a total population comprising of almost 22 million people, Mindanao has the potential to become a large economic hub for the country. Instead of congregating in one main city, there are four major cities in Mindanao that draw economic activity, and these are Cagayan de Oro, Davao, General Santos and Zamboanga, respectively, each of which has a population that ranges from 600,000 to 1.5 million people24.
This multi-polar economic development has led to the distribution of manufacturing sites clustered around the four port cities in Mindanao, in contrast to Luzon where industry emanates from the capital and spread through the contiguous regions connected by major expressways. In Figure 27, the black pins represent industrial facilities where clusters of warehouses, container yards, logistics depots and factories exist in close proximity. This analysis was completed via satellite imagery and OpenStreetMap attribute analysis and tagged as industrial facilities in OpenStreetMap. The clusters congregate near the large city poles of Davao in the south, Cagayan de Oro in the north, and General Santos in the southwest. Up north in Luzon, most industrial clusters lie along or near expressways in NCR, Region 4A and Central Luzon. Figure 28 illustrates this point by showing the industrial clusters along the route from Manila to La Union.
23 Please see http://minda.gov.ph/products-and-services/statistical-reference/demography 24 According to the 2010 Census, Davao city had a population of 1,449,296, Cagayan de Oro City had a population of 602,088, General Santos City had a population of 538,086, and Zamboanga of 807,129.
Source: Census of Philippine Businesses and Industries, 2012,
Manufacturing Source: Census of Philippine Businesses and Industries, 2012,
Manufacturing
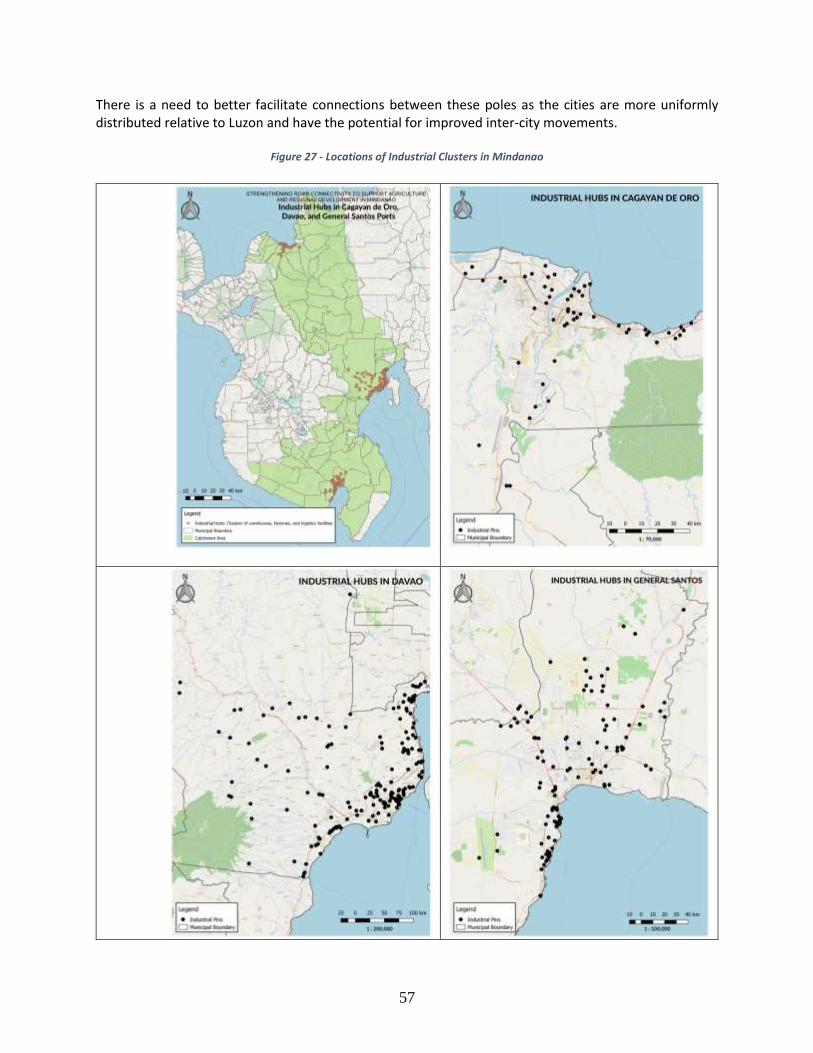
57
There is a need to better facilitate connections between these poles as the cities are more uniformly distributed relative to Luzon and have the potential for improved inter-city movements.
Figure 27 - Locations of Industrial Clusters in Mindanao
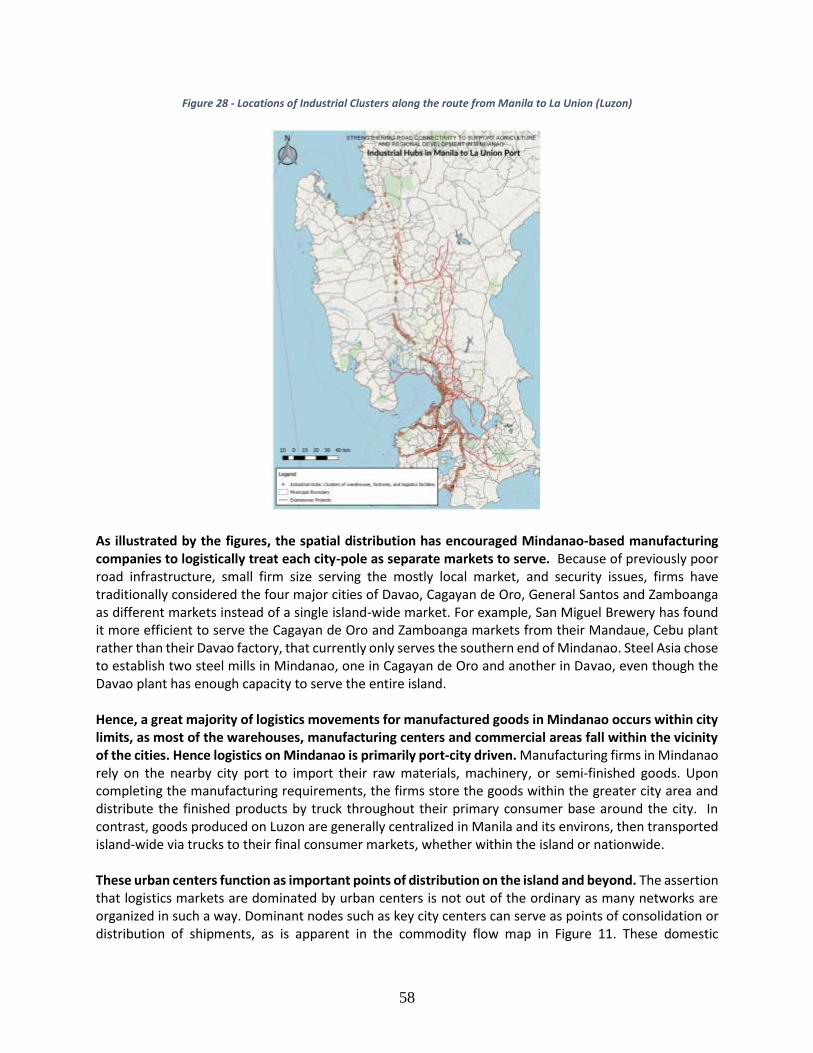
58
Figure 28 - Locations of Industrial Clusters along the route from Manila to La Union (Luzon)
As illustrated by the figures, the spatial distribution has encouraged Mindanao-based manufacturing companies to logistically treat each city-pole as separate markets to serve. Because of previously poor road infrastructure, small firm size serving the mostly local market, and security issues, firms have traditionally considered the four major cities of Davao, Cagayan de Oro, General Santos and Zamboanga as different markets instead of a single island-wide market. For example, San Miguel Brewery has found it more efficient to serve the Cagayan de Oro and Zamboanga markets from their Mandaue, Cebu plant rather than their Davao factory, that currently only serves the southern end of Mindanao. Steel Asia chose to establish two steel mills in Mindanao, one in Cagayan de Oro and another in Davao, even though the Davao plant has enough capacity to serve the entire island. Hence, a great majority of logistics movements for manufactured goods in Mindanao occurs within city limits, as most of the warehouses, manufacturing centers and commercial areas fall within the vicinity of the cities. Hence logistics on Mindanao is primarily port-city driven. Manufacturing firms in Mindanao rely on the nearby city port to import their raw materials, machinery, or semi-finished goods. Upon completing the manufacturing requirements, the firms store the goods within the greater city area and distribute the finished products by truck throughout their primary consumer base around the city. In contrast, goods produced on Luzon are generally centralized in Manila and its environs, then transported island-wide via trucks to their final consumer markets, whether within the island or nationwide. These urban centers function as important points of distribution on the island and beyond. The assertion that logistics markets are dominated by urban centers is not out of the ordinary as many networks are organized in such a way. Dominant nodes such as key city centers can serve as points of consolidation or distribution of shipments, as is apparent in the commodity flow map in Figure 11. These domestic

59
distribution nodes can eventually serve as gateways for trade with the rest of the country and internationally. This is especially true as the economic geography, particularly the spatial dispersion of Mindanao, and its recent infrastructure investments have created a situation where there are fewer logistics issues compared to the Luzon. In fact, Since 2015, intra-city commodity flows has increased in conjunction with regional growth when previously goods were shipped to Luzon and Visayas. For more information, please see the Mindanao Roads Connectivity report.
Potential from better Inter-city Logistics The development of four strong economic poles is commendable and there is further potential for greater manufacturing growth and upgrading if firms take advantage of Mindanao’s relatively better logistics network due to its low inter-urban traffic and relatively wider25 provincial roads. Infrastructure investments have improved the trunk roads of the island, and the road network compares favorably with Luzon given the vehicular traffic. In Mindanao, primary roads26 that connect Davao City, Cagayan de Oro City, General Santos City and other cities are utilized by only 214 vehicles per kilometer except for motorcycles and tricycles, much lower compared to 795 in Luzon and 569 in Visayas (Figure 29). In addition, provincial roads27 in Mindanao have lower potential utilization rates with only 95 motor vehicles (except motorcycles and tricycles) per kilometer, a hundred less than that of Luzon’s, indicating a much wider passage between Mindanao provinces (Figure 30).
Figure 29 - Mindanao has low inter-urban traffic figure Figure 30 - Mindanao has relatively wider provincial roads due to fewer vehicles plying the roads
Sources: Department of Public Works and Highways, Philippine Statistics Authority
Sources: Department of Public Works and Highways, Philippine Statistics Authority
25 When referring to wide provincial roads, the team refers to National roads. Barangay and Municipal roads are still in poor condition. 26 Per DPWH national roads classification, primary roads connect major cities with a population of at least 100,00, secondary roads complement with national primary roads to provide access to main population and production centers of the country, and tertiary roads are other existing roads under DPWH which perform local function. Also, see Figure 30 for an atlas of national roads classification as of 2016. http://www.dpwh.gov.ph/dpwh/2016%20DPWH%20ATLAS/Road%20Data%202016/index.htm 27 Provincial roads could be comprised of secondary and tertiary national roads. Also see Figure 32 for DPWH National Road Classification (2016).
795
569
214
Luzon Visayas Mindanao
Four-wheel and above motor vehicles per kilometer of primary national road, 2016
195
98 95
Luzon Visayas Mindanao
Four-wheel and above vehicles per kilometer of secondary and tertiary
national road, 2016
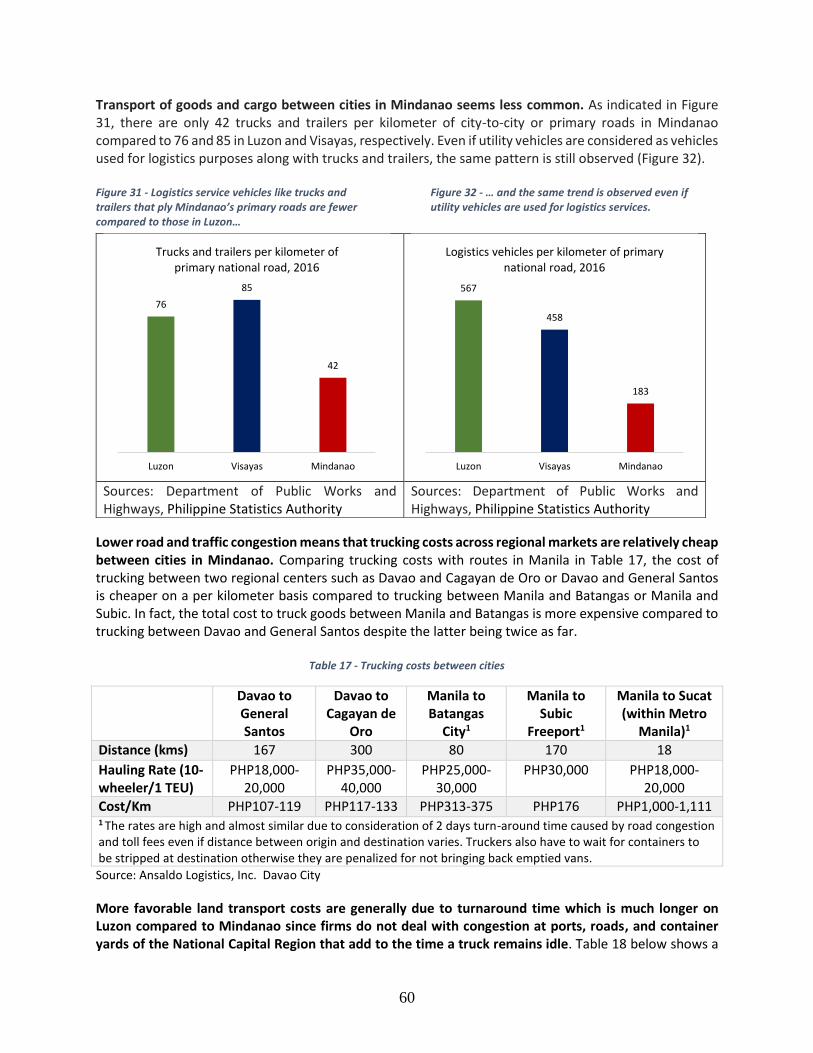
60
Transport of goods and cargo between cities in Mindanao seems less common. As indicated in Figure 31, there are only 42 trucks and trailers per kilometer of city-to-city or primary roads in Mindanao compared to 76 and 85 in Luzon and Visayas, respectively. Even if utility vehicles are considered as vehicles used for logistics purposes along with trucks and trailers, the same pattern is still observed (Figure 32). Figure 31 - Logistics service vehicles like trucks and trailers that ply Mindanao’s primary roads are fewer compared to those in Luzon…
Figure 32 - … and the same trend is observed even if utility vehicles are used for logistics services.
Lower road and traffic congestion means that trucking costs across regional markets are relatively cheap between cities in Mindanao. Comparing trucking costs with routes in Manila in Table 17, the cost of trucking between two regional centers such as Davao and Cagayan de Oro or Davao and General Santos is cheaper on a per kilometer basis compared to trucking between Manila and Batangas or Manila and Subic. In fact, the total cost to truck goods between Manila and Batangas is more expensive compared to trucking between Davao and General Santos despite the latter being twice as far.
Table 17 - Trucking costs between cities
Davao to General Santos
Davao to Cagayan de
Oro
Manila to Batangas
City1
Manila to Subic
Freeport1
Manila to Sucat (within Metro
Manila)1
Distance (kms) 167 300 80 170 18
Hauling Rate (10-wheeler/1 TEU)
PHP18,000-20,000
PHP35,000-40,000
PHP25,000-30,000
PHP30,000 PHP18,000-20,000
Cost/Km PHP107-119 PHP117-133 PHP313-375 PHP176 PHP1,000-1,111 1 The rates are high and almost similar due to consideration of 2 days turn-around time caused by road congestion and toll fees even if distance between origin and destination varies. Truckers also have to wait for containers to be stripped at destination otherwise they are penalized for not bringing back emptied vans.
Source: Ansaldo Logistics, Inc. Davao City
More favorable land transport costs are generally due to turnaround time which is much longer on Luzon compared to Mindanao since firms do not deal with congestion at ports, roads, and container yards of the National Capital Region that add to the time a truck remains idle. Table 18 below shows a
Sources: Department of Public Works and Highways, Philippine Statistics Authority
Sources: Department of Public Works and Highways, Philippine Statistics Authority
76
85
42
Luzon Visayas Mindanao
Trucks and trailers per kilometer of primary national road, 2016
567
458
183
Luzon Visayas Mindanao
Logistics vehicles per kilometer of primary national road, 2016
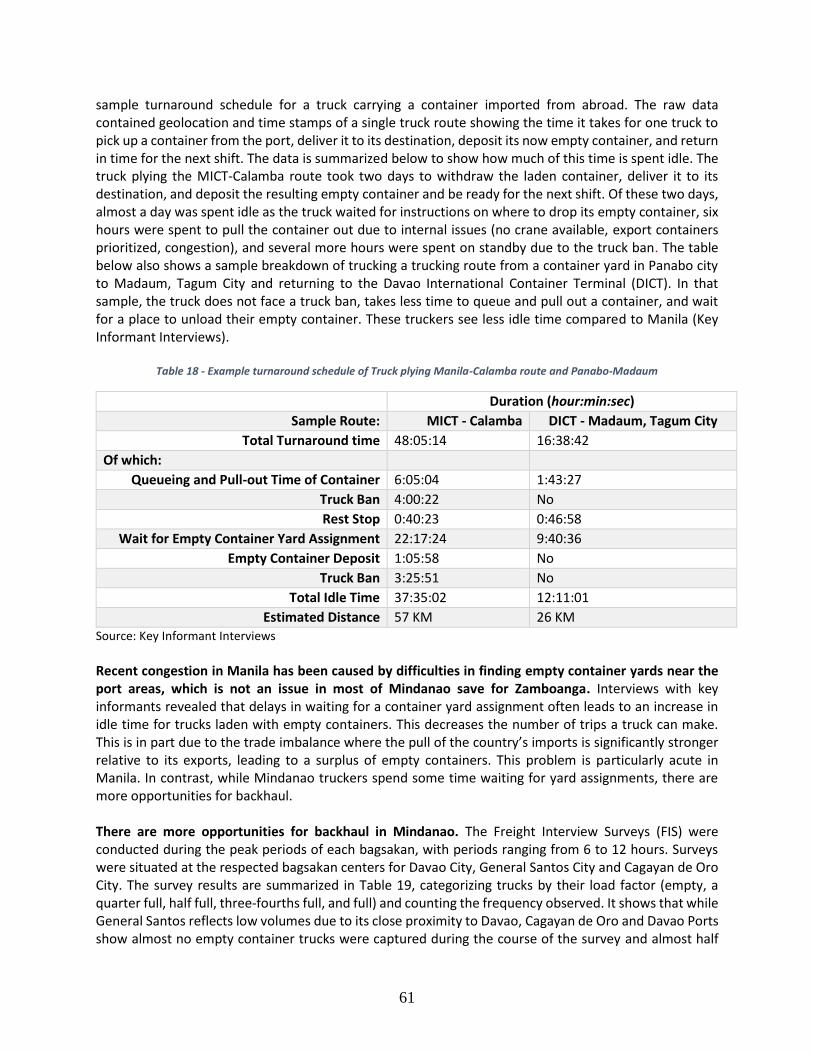
61
sample turnaround schedule for a truck carrying a container imported from abroad. The raw data contained geolocation and time stamps of a single truck route showing the time it takes for one truck to pick up a container from the port, deliver it to its destination, deposit its now empty container, and return in time for the next shift. The data is summarized below to show how much of this time is spent idle. The truck plying the MICT-Calamba route took two days to withdraw the laden container, deliver it to its destination, and deposit the resulting empty container and be ready for the next shift. Of these two days, almost a day was spent idle as the truck waited for instructions on where to drop its empty container, six hours were spent to pull the container out due to internal issues (no crane available, export containers prioritized, congestion), and several more hours were spent on standby due to the truck ban. The table below also shows a sample breakdown of trucking a trucking route from a container yard in Panabo city to Madaum, Tagum City and returning to the Davao International Container Terminal (DICT). In that sample, the truck does not face a truck ban, takes less time to queue and pull out a container, and wait for a place to unload their empty container. These truckers see less idle time compared to Manila (Key Informant Interviews).
Table 18 - Example turnaround schedule of Truck plying Manila-Calamba route and Panabo-Madaum
Duration (hour:min:sec)
Sample Route: MICT - Calamba DICT - Madaum, Tagum City
Total Turnaround time 48:05:14 16:38:42
Of which:
Queueing and Pull-out Time of Container 6:05:04 1:43:27
Truck Ban 4:00:22 No
Rest Stop 0:40:23 0:46:58
Wait for Empty Container Yard Assignment 22:17:24 9:40:36
Empty Container Deposit 1:05:58 No
Truck Ban 3:25:51 No
Total Idle Time 37:35:02 12:11:01
Estimated Distance 57 KM 26 KM
Source: Key Informant Interviews
Recent congestion in Manila has been caused by difficulties in finding empty container yards near the port areas, which is not an issue in most of Mindanao save for Zamboanga. Interviews with key informants revealed that delays in waiting for a container yard assignment often leads to an increase in idle time for trucks laden with empty containers. This decreases the number of trips a truck can make. This is in part due to the trade imbalance where the pull of the country’s imports is significantly stronger relative to its exports, leading to a surplus of empty containers. This problem is particularly acute in Manila. In contrast, while Mindanao truckers spend some time waiting for yard assignments, there are more opportunities for backhaul. There are more opportunities for backhaul in Mindanao. The Freight Interview Surveys (FIS) were conducted during the peak periods of each bagsakan, with periods ranging from 6 to 12 hours. Surveys were situated at the respected bagsakan centers for Davao City, General Santos City and Cagayan de Oro City. The survey results are summarized in Table 19, categorizing trucks by their load factor (empty, a quarter full, half full, three-fourths full, and full) and counting the frequency observed. It shows that while General Santos reflects low volumes due to its close proximity to Davao, Cagayan de Oro and Davao Ports show almost no empty container trucks were captured during the course of the survey and almost half
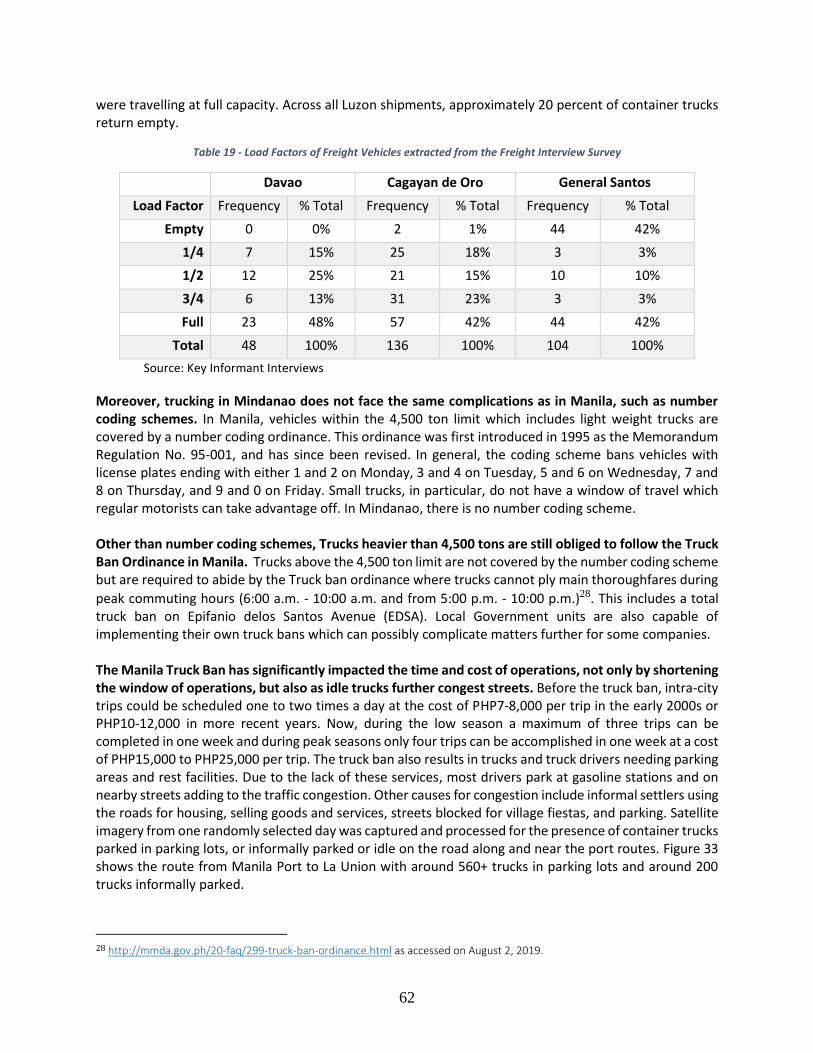
62
were travelling at full capacity. Across all Luzon shipments, approximately 20 percent of container trucks return empty.
Table 19 - Load Factors of Freight Vehicles extracted from the Freight Interview Survey
Davao Cagayan de Oro General Santos
Load Factor Frequency % Total Frequency % Total Frequency % Total
Empty 0 0% 2 1% 44 42%
1/4 7 15% 25 18% 3 3%
1/2 12 25% 21 15% 10 10%
3/4 6 13% 31 23% 3 3%
Full 23 48% 57 42% 44 42%
Total 48 100% 136 100% 104 100%
Source: Key Informant Interviews
Moreover, trucking in Mindanao does not face the same complications as in Manila, such as number coding schemes. In Manila, vehicles within the 4,500 ton limit which includes light weight trucks are covered by a number coding ordinance. This ordinance was first introduced in 1995 as the Memorandum Regulation No. 95-001, and has since been revised. In general, the coding scheme bans vehicles with license plates ending with either 1 and 2 on Monday, 3 and 4 on Tuesday, 5 and 6 on Wednesday, 7 and 8 on Thursday, and 9 and 0 on Friday. Small trucks, in particular, do not have a window of travel which regular motorists can take advantage off. In Mindanao, there is no number coding scheme. Other than number coding schemes, Trucks heavier than 4,500 tons are still obliged to follow the Truck Ban Ordinance in Manila. Trucks above the 4,500 ton limit are not covered by the number coding scheme but are required to abide by the Truck ban ordinance where trucks cannot ply main thoroughfares during
peak commuting hours (6:00 a.m. - 10:00 a.m. and from 5:00 p.m. - 10:00 p.m.)28. This includes a total truck ban on Epifanio delos Santos Avenue (EDSA). Local Government units are also capable of implementing their own truck bans which can possibly complicate matters further for some companies. The Manila Truck Ban has significantly impacted the time and cost of operations, not only by shortening the window of operations, but also as idle trucks further congest streets. Before the truck ban, intra-city trips could be scheduled one to two times a day at the cost of PHP7-8,000 per trip in the early 2000s or PHP10-12,000 in more recent years. Now, during the low season a maximum of three trips can be completed in one week and during peak seasons only four trips can be accomplished in one week at a cost of PHP15,000 to PHP25,000 per trip. The truck ban also results in trucks and truck drivers needing parking areas and rest facilities. Due to the lack of these services, most drivers park at gasoline stations and on nearby streets adding to the traffic congestion. Other causes for congestion include informal settlers using the roads for housing, selling goods and services, streets blocked for village fiestas, and parking. Satellite imagery from one randomly selected day was captured and processed for the presence of container trucks parked in parking lots, or informally parked or idle on the road along and near the port routes. Figure 33 shows the route from Manila Port to La Union with around 560+ trucks in parking lots and around 200 trucks informally parked.
28 http://mmda.gov.ph/20-faq/299-truck-ban-ordinance.html as accessed on August 2, 2019.
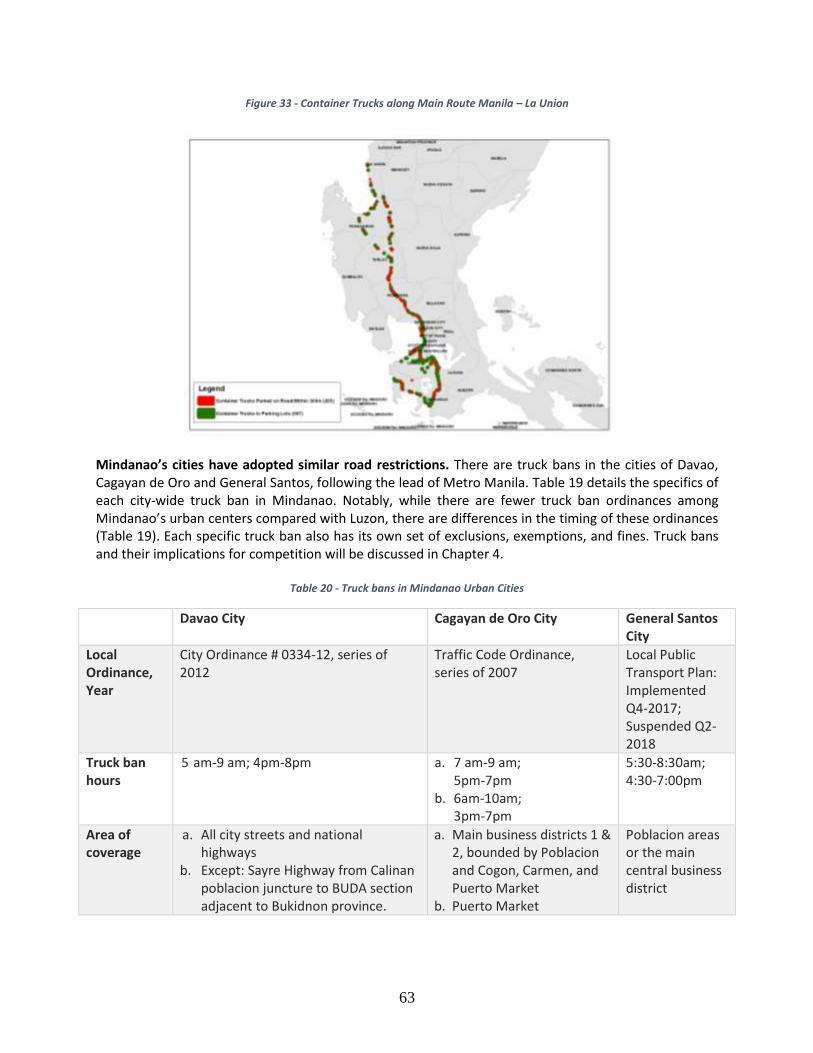
63
Figure 33 - Container Trucks along Main Route Manila – La Union
Mindanao’s cities have adopted similar road restrictions. There are truck bans in the cities of Davao, Cagayan de Oro and General Santos, following the lead of Metro Manila. Table 19 details the specifics of each city-wide truck ban in Mindanao. Notably, while there are fewer truck ban ordinances among Mindanao’s urban centers compared with Luzon, there are differences in the timing of these ordinances (Table 19). Each specific truck ban also has its own set of exclusions, exemptions, and fines. Truck bans and their implications for competition will be discussed in Chapter 4.
Table 20 - Truck bans in Mindanao Urban Cities
Davao City Cagayan de Oro City General Santos City
Local Ordinance, Year
City Ordinance # 0334-12, series of 2012
Traffic Code Ordinance, series of 2007
Local Public Transport Plan: Implemented Q4-2017; Suspended Q2-2018
Truck ban hours
5 am-9 am; 4pm-8pm a. 7 am-9 am; 5pm-7pm
b. 6am-10am; 3pm-7pm
5:30-8:30am; 4:30-7:00pm
Area of coverage
a. All city streets and national highways
b. Except: Sayre Highway from Calinan poblacion juncture to BUDA section adjacent to Bukidnon province.
a. Main business districts 1 & 2, bounded by Poblacion and Cogon, Carmen, and Puerto Market
b. Puerto Market
Poblacion areas or the main central business district
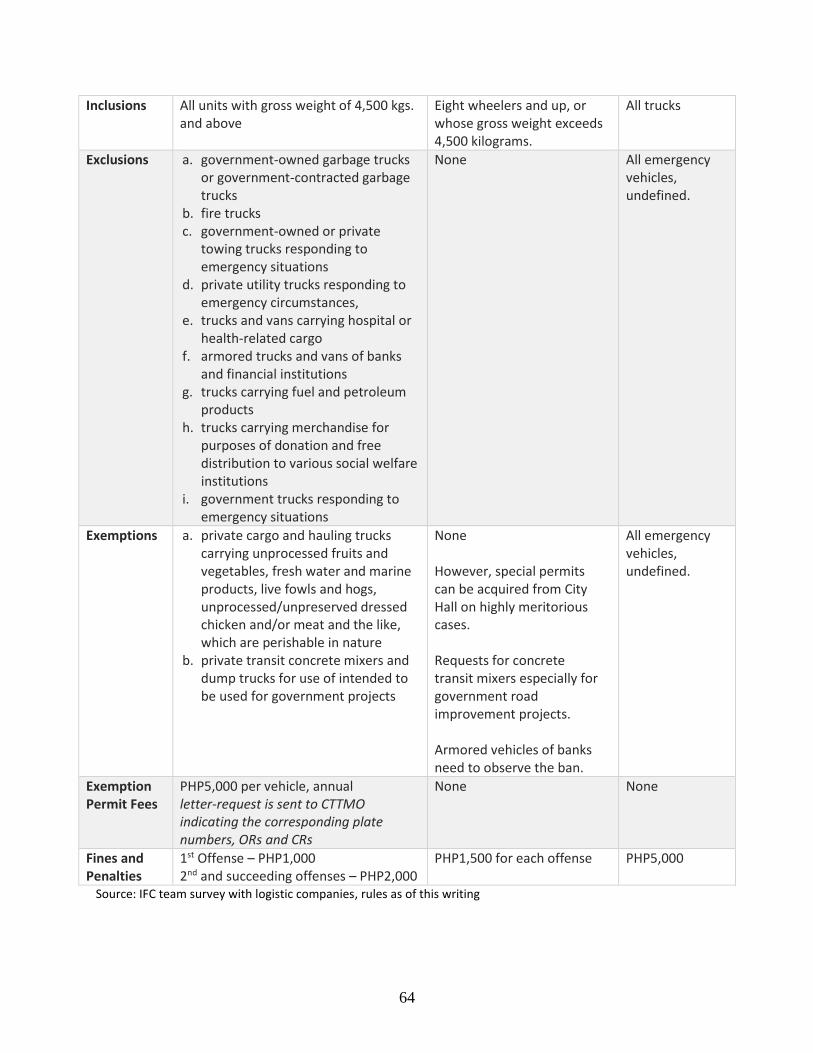
64
Inclusions All units with gross weight of 4,500 kgs. and above
Eight wheelers and up, or whose gross weight exceeds 4,500 kilograms.
All trucks
Exclusions a. government-owned garbage trucks or government-contracted garbage trucks
b. fire trucks c. government-owned or private
towing trucks responding to emergency situations
d. private utility trucks responding to emergency circumstances,
e. trucks and vans carrying hospital or health-related cargo
f. armored trucks and vans of banks and financial institutions
g. trucks carrying fuel and petroleum products
h. trucks carrying merchandise for purposes of donation and free distribution to various social welfare institutions
i. government trucks responding to emergency situations
None All emergency vehicles, undefined.
Exemptions a. private cargo and hauling trucks carrying unprocessed fruits and vegetables, fresh water and marine products, live fowls and hogs, unprocessed/unpreserved dressed chicken and/or meat and the like, which are perishable in nature
b. private transit concrete mixers and dump trucks for use of intended to be used for government projects
None However, special permits can be acquired from City Hall on highly meritorious cases. Requests for concrete transit mixers especially for government road improvement projects. Armored vehicles of banks need to observe the ban.
All emergency vehicles, undefined.
Exemption Permit Fees
PHP5,000 per vehicle, annual letter-request is sent to CTTMO indicating the corresponding plate numbers, ORs and CRs
None None
Fines and Penalties
1st Offense – PHP1,000 2nd and succeeding offenses – PHP2,000
PHP1,500 for each offense PHP5,000
Source: IFC team survey with logistic companies, rules as of this writing
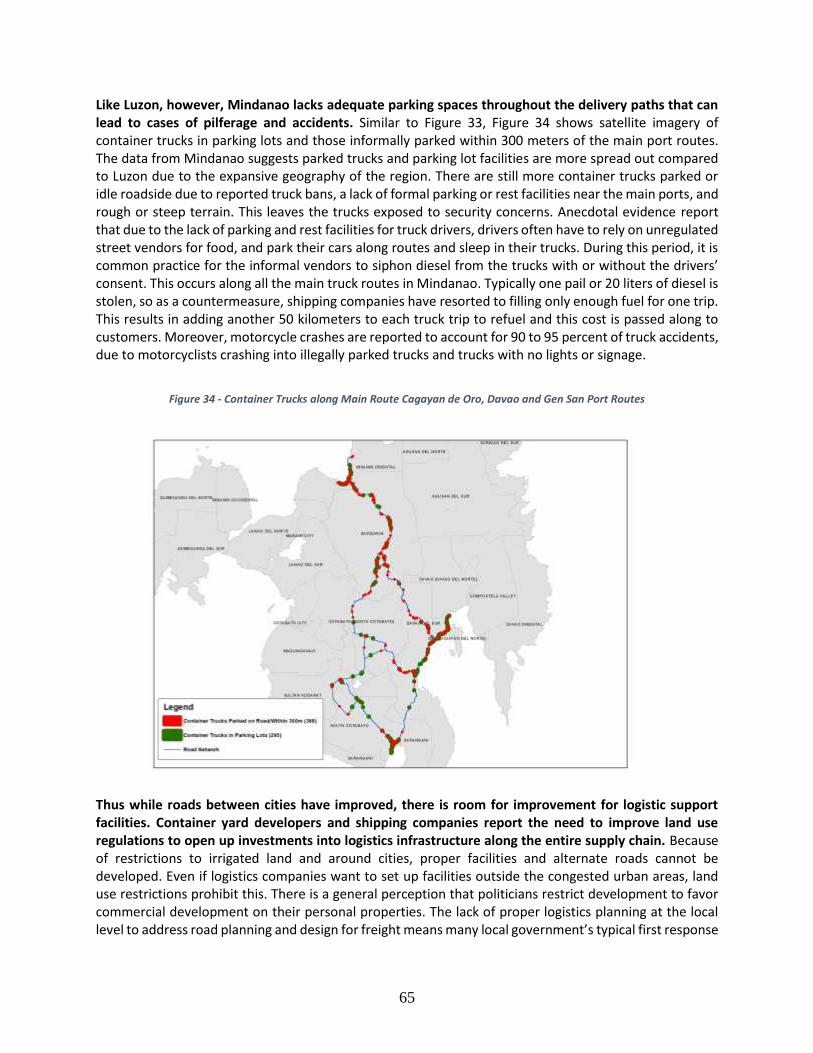
65
Like Luzon, however, Mindanao lacks adequate parking spaces throughout the delivery paths that can lead to cases of pilferage and accidents. Similar to Figure 33, Figure 34 shows satellite imagery of container trucks in parking lots and those informally parked within 300 meters of the main port routes. The data from Mindanao suggests parked trucks and parking lot facilities are more spread out compared to Luzon due to the expansive geography of the region. There are still more container trucks parked or idle roadside due to reported truck bans, a lack of formal parking or rest facilities near the main ports, and rough or steep terrain. This leaves the trucks exposed to security concerns. Anecdotal evidence report that due to the lack of parking and rest facilities for truck drivers, drivers often have to rely on unregulated street vendors for food, and park their cars along routes and sleep in their trucks. During this period, it is common practice for the informal vendors to siphon diesel from the trucks with or without the drivers’ consent. This occurs along all the main truck routes in Mindanao. Typically one pail or 20 liters of diesel is stolen, so as a countermeasure, shipping companies have resorted to filling only enough fuel for one trip. This results in adding another 50 kilometers to each truck trip to refuel and this cost is passed along to customers. Moreover, motorcycle crashes are reported to account for 90 to 95 percent of truck accidents, due to motorcyclists crashing into illegally parked trucks and trucks with no lights or signage.
Figure 34 - Container Trucks along Main Route Cagayan de Oro, Davao and Gen San Port Routes
Thus while roads between cities have improved, there is room for improvement for logistic support facilities. Container yard developers and shipping companies report the need to improve land use regulations to open up investments into logistics infrastructure along the entire supply chain. Because of restrictions to irrigated land and around cities, proper facilities and alternate roads cannot be developed. Even if logistics companies want to set up facilities outside the congested urban areas, land use restrictions prohibit this. There is a general perception that politicians restrict development to favor commercial development on their personal properties. The lack of proper logistics planning at the local level to address road planning and design for freight means many local government’s typical first response
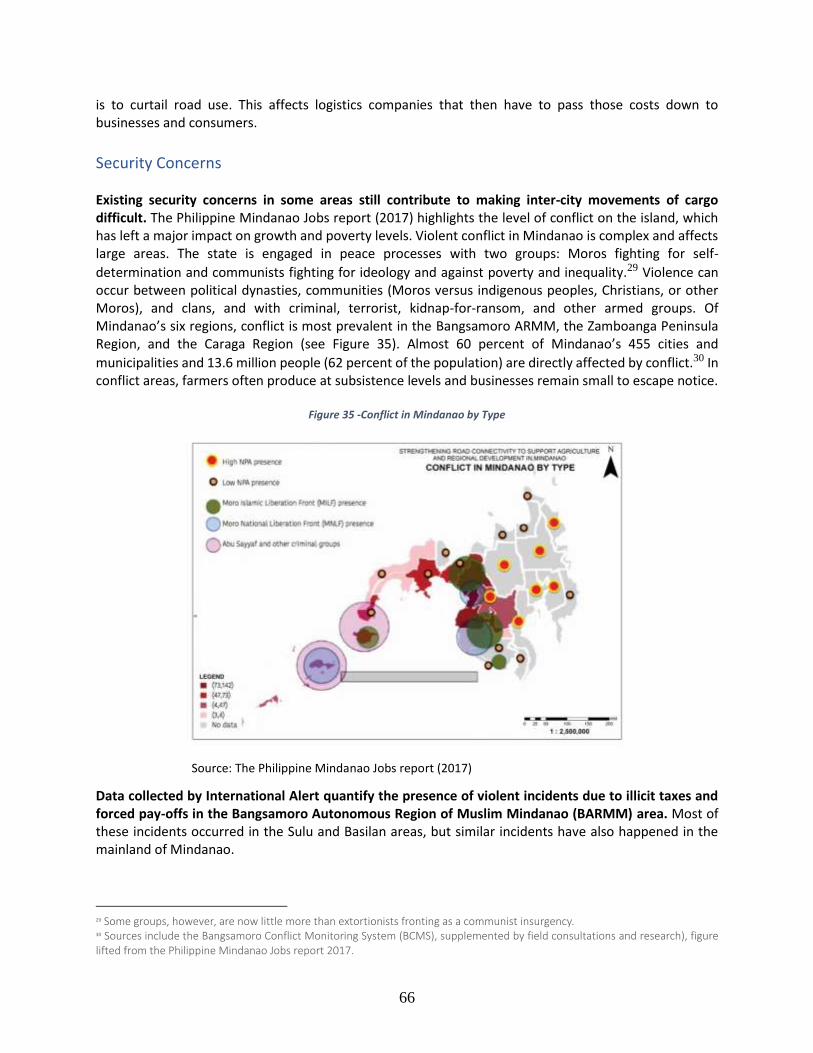
66
is to curtail road use. This affects logistics companies that then have to pass those costs down to businesses and consumers.
Security Concerns Existing security concerns in some areas still contribute to making inter-city movements of cargo difficult. The Philippine Mindanao Jobs report (2017) highlights the level of conflict on the island, which has left a major impact on growth and poverty levels. Violent conflict in Mindanao is complex and affects large areas. The state is engaged in peace processes with two groups: Moros fighting for self-
determination and communists fighting for ideology and against poverty and inequality.29 Violence can occur between political dynasties, communities (Moros versus indigenous peoples, Christians, or other Moros), and clans, and with criminal, terrorist, kidnap-for-ransom, and other armed groups. Of Mindanao’s six regions, conflict is most prevalent in the Bangsamoro ARMM, the Zamboanga Peninsula Region, and the Caraga Region (see Figure 35). Almost 60 percent of Mindanao’s 455 cities and
municipalities and 13.6 million people (62 percent of the population) are directly affected by conflict.30 In conflict areas, farmers often produce at subsistence levels and businesses remain small to escape notice.
Figure 35 -Conflict in Mindanao by Type
Source: The Philippine Mindanao Jobs report (2017)
Data collected by International Alert quantify the presence of violent incidents due to illicit taxes and forced pay-offs in the Bangsamoro Autonomous Region of Muslim Mindanao (BARMM) area. Most of these incidents occurred in the Sulu and Basilan areas, but similar incidents have also happened in the mainland of Mindanao.
29 Some groups, however, are now little more than extortionists fronting as a communist insurgency. 30 Sources include the Bangsamoro Conflict Monitoring System (BCMS), supplemented by field consultations and research), figure lifted from the Philippine Mindanao Jobs report 2017.
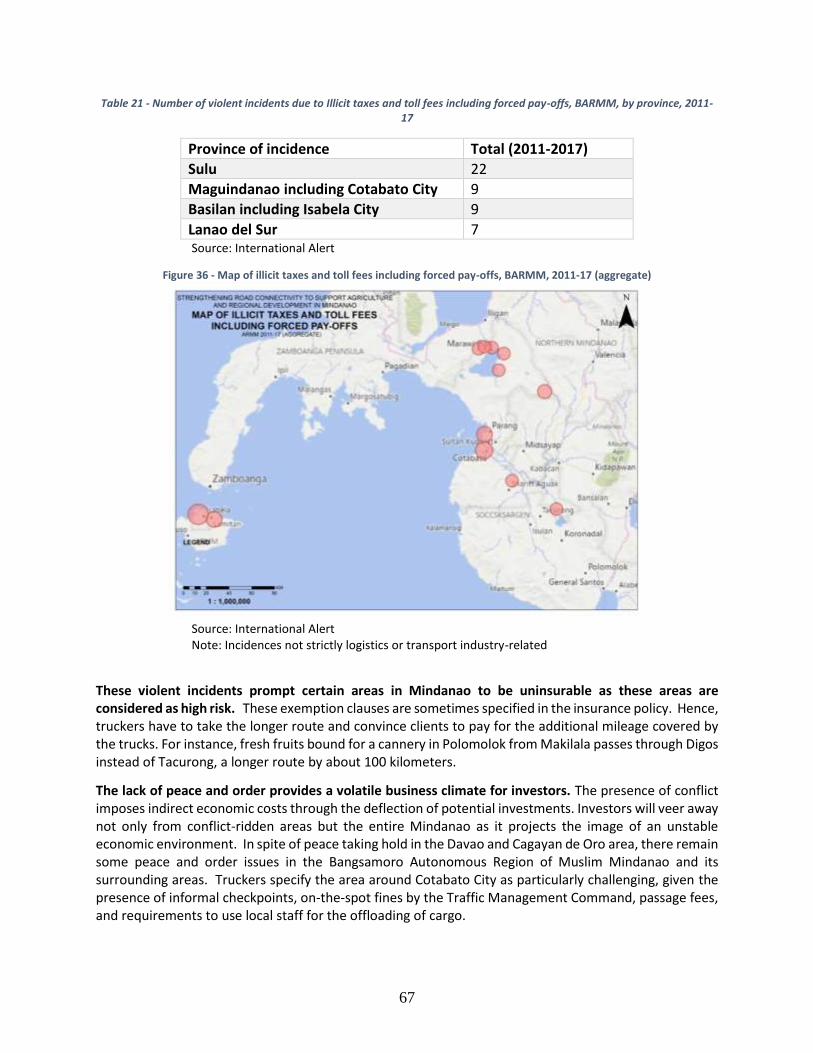
67
Table 21 - Number of violent incidents due to Illicit taxes and toll fees including forced pay-offs, BARMM, by province, 2011-17
Province of incidence Total (2011-2017)
Sulu 22
Maguindanao including Cotabato City 9
Basilan including Isabela City 9
Lanao del Sur 7 Source: International Alert
Figure 36 - Map of illicit taxes and toll fees including forced pay-offs, BARMM, 2011-17 (aggregate)
Source: International Alert Note: Incidences not strictly logistics or transport industry-related
These violent incidents prompt certain areas in Mindanao to be uninsurable as these areas are considered as high risk. These exemption clauses are sometimes specified in the insurance policy. Hence, truckers have to take the longer route and convince clients to pay for the additional mileage covered by the trucks. For instance, fresh fruits bound for a cannery in Polomolok from Makilala passes through Digos instead of Tacurong, a longer route by about 100 kilometers.
The lack of peace and order provides a volatile business climate for investors. The presence of conflict imposes indirect economic costs through the deflection of potential investments. Investors will veer away not only from conflict-ridden areas but the entire Mindanao as it projects the image of an unstable economic environment. In spite of peace taking hold in the Davao and Cagayan de Oro area, there remain some peace and order issues in the Bangsamoro Autonomous Region of Muslim Mindanao and its surrounding areas. Truckers specify the area around Cotabato City as particularly challenging, given the presence of informal checkpoints, on-the-spot fines by the Traffic Management Command, passage fees, and requirements to use local staff for the offloading of cargo.
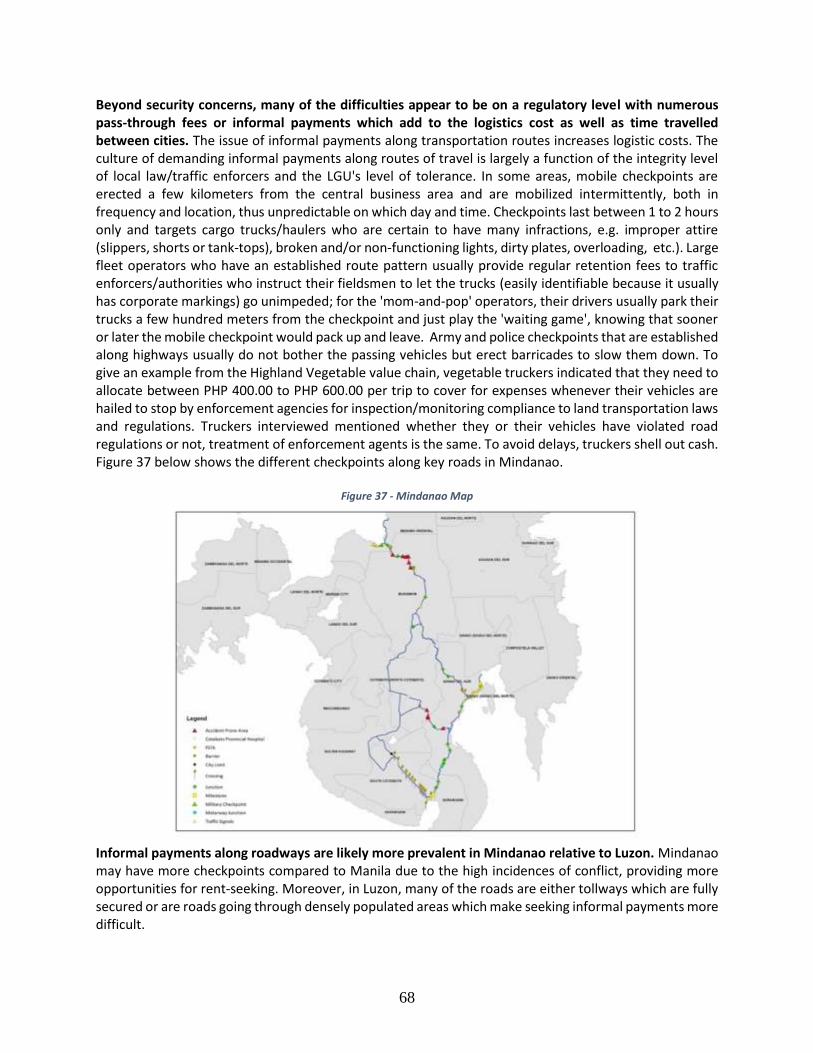
68
Beyond security concerns, many of the difficulties appear to be on a regulatory level with numerous pass-through fees or informal payments which add to the logistics cost as well as time travelled between cities. The issue of informal payments along transportation routes increases logistic costs. The culture of demanding informal payments along routes of travel is largely a function of the integrity level of local law/traffic enforcers and the LGU's level of tolerance. In some areas, mobile checkpoints are erected a few kilometers from the central business area and are mobilized intermittently, both in frequency and location, thus unpredictable on which day and time. Checkpoints last between 1 to 2 hours only and targets cargo trucks/haulers who are certain to have many infractions, e.g. improper attire (slippers, shorts or tank-tops), broken and/or non-functioning lights, dirty plates, overloading, etc.). Large fleet operators who have an established route pattern usually provide regular retention fees to traffic enforcers/authorities who instruct their fieldsmen to let the trucks (easily identifiable because it usually has corporate markings) go unimpeded; for the 'mom-and-pop' operators, their drivers usually park their trucks a few hundred meters from the checkpoint and just play the 'waiting game', knowing that sooner or later the mobile checkpoint would pack up and leave. Army and police checkpoints that are established along highways usually do not bother the passing vehicles but erect barricades to slow them down. To give an example from the Highland Vegetable value chain, vegetable truckers indicated that they need to allocate between PHP 400.00 to PHP 600.00 per trip to cover for expenses whenever their vehicles are hailed to stop by enforcement agencies for inspection/monitoring compliance to land transportation laws and regulations. Truckers interviewed mentioned whether they or their vehicles have violated road regulations or not, treatment of enforcement agents is the same. To avoid delays, truckers shell out cash. Figure 37 below shows the different checkpoints along key roads in Mindanao.
Figure 37 - Mindanao Map
Informal payments along roadways are likely more prevalent in Mindanao relative to Luzon. Mindanao may have more checkpoints compared to Manila due to the high incidences of conflict, providing more opportunities for rent-seeking. Moreover, in Luzon, many of the roads are either tollways which are fully secured or are roads going through densely populated areas which make seeking informal payments more difficult.
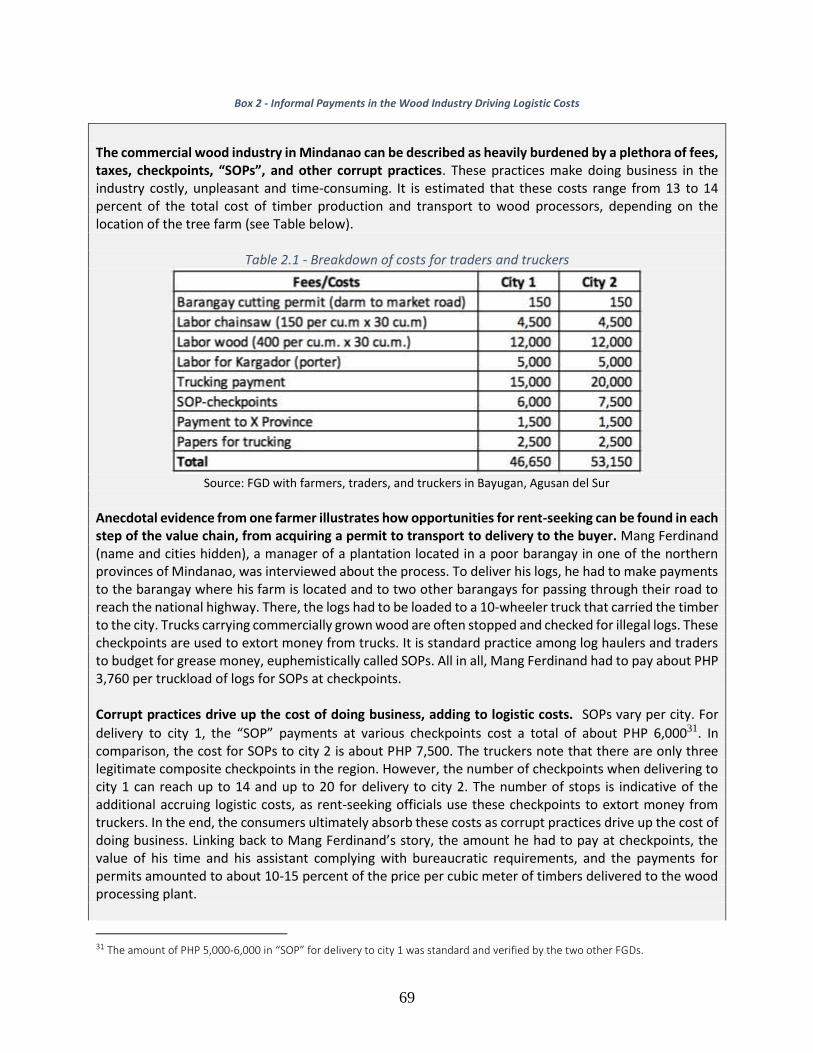
69
Box 2 - Informal Payments in the Wood Industry Driving Logistic Costs
The commercial wood industry in Mindanao can be described as heavily burdened by a plethora of fees, taxes, checkpoints, “SOPs”, and other corrupt practices. These practices make doing business in the industry costly, unpleasant and time-consuming. It is estimated that these costs range from 13 to 14 percent of the total cost of timber production and transport to wood processors, depending on the location of the tree farm (see Table below).
Table 2.1 - Breakdown of costs for traders and truckers
Source: FGD with farmers, traders, and truckers in Bayugan, Agusan del Sur
Anecdotal evidence from one farmer illustrates how opportunities for rent-seeking can be found in each step of the value chain, from acquiring a permit to transport to delivery to the buyer. Mang Ferdinand (name and cities hidden), a manager of a plantation located in a poor barangay in one of the northern provinces of Mindanao, was interviewed about the process. To deliver his logs, he had to make payments to the barangay where his farm is located and to two other barangays for passing through their road to reach the national highway. There, the logs had to be loaded to a 10-wheeler truck that carried the timber to the city. Trucks carrying commercially grown wood are often stopped and checked for illegal logs. These checkpoints are used to extort money from trucks. It is standard practice among log haulers and traders to budget for grease money, euphemistically called SOPs. All in all, Mang Ferdinand had to pay about PHP 3,760 per truckload of logs for SOPs at checkpoints. Corrupt practices drive up the cost of doing business, adding to logistic costs. SOPs vary per city. For
delivery to city 1, the “SOP” payments at various checkpoints cost a total of about PHP 6,00031. In comparison, the cost for SOPs to city 2 is about PHP 7,500. The truckers note that there are only three legitimate composite checkpoints in the region. However, the number of checkpoints when delivering to city 1 can reach up to 14 and up to 20 for delivery to city 2. The number of stops is indicative of the additional accruing logistic costs, as rent-seeking officials use these checkpoints to extort money from truckers. In the end, the consumers ultimately absorb these costs as corrupt practices drive up the cost of doing business. Linking back to Mang Ferdinand’s story, the amount he had to pay at checkpoints, the value of his time and his assistant complying with bureaucratic requirements, and the payments for permits amounted to about 10-15 percent of the price per cubic meter of timbers delivered to the wood processing plant.
31 The amount of PHP 5,000-6,000 in “SOP” for delivery to city 1 was standard and verified by the two other FGDs.
70
Unjustified bureaucratic delays could also lead to higher costs. The amount Mang Ferdinand paid could have been higher if he had encountered unjustified bureaucratic delays in the signing of the permit to transport. Many of the delays in approval are not innocent. They often occur to put pressure on the permit applicant to accede to illegitimate demands of the person in charge of approving permits. Mang Ferdinand knows of friends who were pressured and had to accept a “bloated” inventory estimate. Bloating provides legal cover for transporting illegally cut logs and this cover can be sold for a hefty price (PHP 4500/truck) to traders/haulers transporting those logs.
Furthermore, security is not just a concern from external forces but also from the lack of road safety awareness and infrastructure by road users. Shipping companies report that 90 to 95 percent of accidents with their trucks involve motorcycle crashes. Due to the lack of adequate parking and rest facilities, trucks are parked along the road. As Mindanao roads are unlit and lacking safety signage, motorcyclists crash into the parked trucks. There are also currently no regulations on required breaks per hours of driving. This would also be difficult to enforce due to the limited operational hours from the truck bans. This increases the accident rate across all modes of transportation. Despite the high accident rates in Mindanao, there are no adequate towing services in Mindanao. The rescue and retrieval of trucks with cargo require a rigger truck or high capacity tow truck with a crane. Due to the increase in construction sites, it is difficult to rent a crane. Rescue services typically take 10 to 24 hours to reach the accident site compared to the one-hour response time to accidents on the North Luzon Expressway.
Port Consolidation and Regulation Improving the inter-city transport of goods between Mindanao cities should lead to consolidation at the ports, allow firms to take advantage of scale, and encourage more direct shipments to and from Mindanao. With an efficient inland transport system, one or two of the Mindanao ports could emerge as a premier gateway and could attract a better range of direct services to major partner destinations. Larger ports in Mindanao that can entertain more efficient vessels can take advantage of scale to reduce shipping costs. This would induce a virtuous cycle of migration of cargo from the secondary ports to the primary ports, and lower per shipment costs. This consolidation may already be happening for certain products in Mindanao, as several ports are already known to ship majority of a certain product such as General Santos for tuna, bananas in Panabo, or copra oil in Granexport Iligan. Davao ports are already visited by shipping lines calling directly to Japan, Singapore, and China, allowing importers and exporters the ability to bypass Manila and save on domestic shipping costs.
However, the consolidation of cargo is hampered by Mindanao’s port infrastructure which is in dire need of upgrading. The premier gateway port of Mindanao, Davao Sasa, still lacks ship-to-shore cranes, leading shipping lines to request for its expansion to address the problem of heavy port congestion. Domestic shipping lines calling at the port complain of the additional expenses due to the 24 to 30 hour waiting time before vessels are serviced noting the absence of quay cranes. Likewise, as early as 2010, Cagayan de Oro Port was observed to operate at congested levels with a berth occupancy ratio of about 70 percent, requiring additional berth lengths. The port also needs major repair to its container yards. In General Santos, the 1st Makar Port Development Summit on July 2, 2014 identified the deficiencies of the General Santos Port to include a high berth occupancy ratio of 91 percent, inadequate cargo handling equipment, lack of cold storage facility and consolidation area for agricultural products, and inadequate capacity of reefer outlets (World Bank 2014).
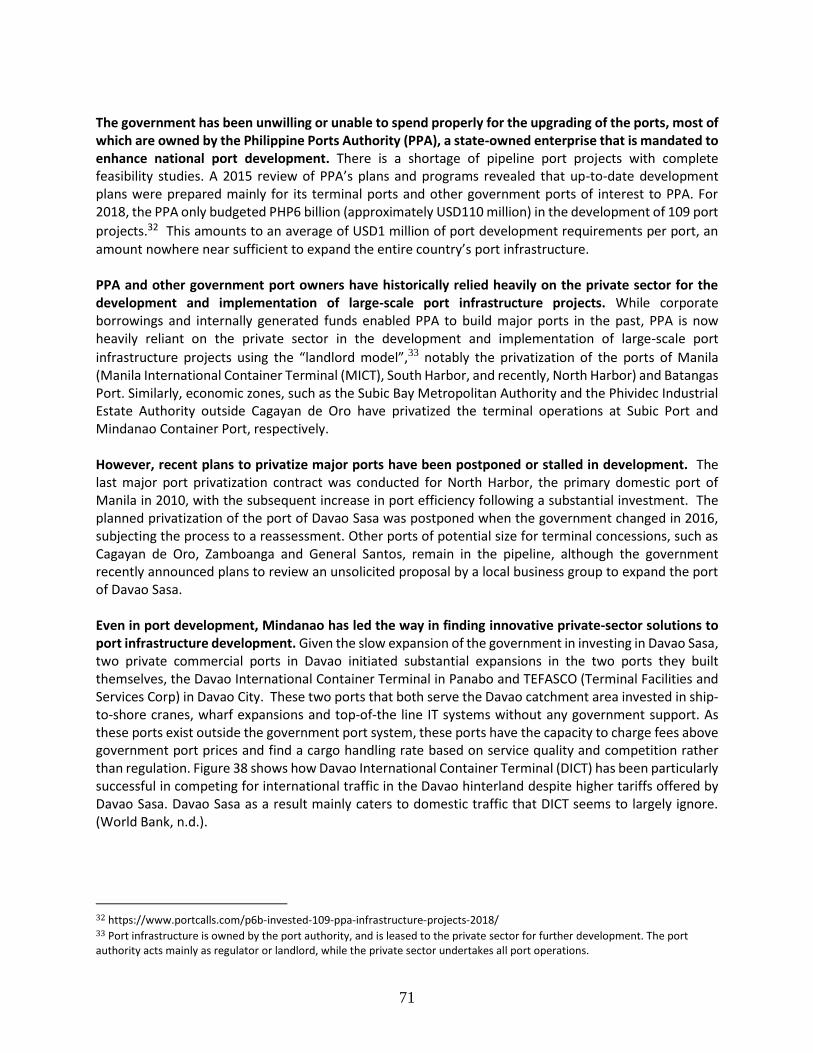
71
The government has been unwilling or unable to spend properly for the upgrading of the ports, most of which are owned by the Philippine Ports Authority (PPA), a state-owned enterprise that is mandated to enhance national port development. There is a shortage of pipeline port projects with complete feasibility studies. A 2015 review of PPA’s plans and programs revealed that up-to-date development plans were prepared mainly for its terminal ports and other government ports of interest to PPA. For 2018, the PPA only budgeted PHP6 billion (approximately USD110 million) in the development of 109 port
projects.32 This amounts to an average of USD1 million of port development requirements per port, an amount nowhere near sufficient to expand the entire country’s port infrastructure. PPA and other government port owners have historically relied heavily on the private sector for the development and implementation of large-scale port infrastructure projects. While corporate borrowings and internally generated funds enabled PPA to build major ports in the past, PPA is now heavily reliant on the private sector in the development and implementation of large-scale port
infrastructure projects using the “landlord model”,33 notably the privatization of the ports of Manila (Manila International Container Terminal (MICT), South Harbor, and recently, North Harbor) and Batangas Port. Similarly, economic zones, such as the Subic Bay Metropolitan Authority and the Phividec Industrial Estate Authority outside Cagayan de Oro have privatized the terminal operations at Subic Port and Mindanao Container Port, respectively. However, recent plans to privatize major ports have been postponed or stalled in development. The last major port privatization contract was conducted for North Harbor, the primary domestic port of Manila in 2010, with the subsequent increase in port efficiency following a substantial investment. The planned privatization of the port of Davao Sasa was postponed when the government changed in 2016, subjecting the process to a reassessment. Other ports of potential size for terminal concessions, such as Cagayan de Oro, Zamboanga and General Santos, remain in the pipeline, although the government recently announced plans to review an unsolicited proposal by a local business group to expand the port of Davao Sasa. Even in port development, Mindanao has led the way in finding innovative private-sector solutions to port infrastructure development. Given the slow expansion of the government in investing in Davao Sasa, two private commercial ports in Davao initiated substantial expansions in the two ports they built themselves, the Davao International Container Terminal in Panabo and TEFASCO (Terminal Facilities and Services Corp) in Davao City. These two ports that both serve the Davao catchment area invested in ship-to-shore cranes, wharf expansions and top-of-the line IT systems without any government support. As these ports exist outside the government port system, these ports have the capacity to charge fees above government port prices and find a cargo handling rate based on service quality and competition rather than regulation. Figure 38 shows how Davao International Container Terminal (DICT) has been particularly successful in competing for international traffic in the Davao hinterland despite higher tariffs offered by Davao Sasa. Davao Sasa as a result mainly caters to domestic traffic that DICT seems to largely ignore. (World Bank, n.d.).
32 https://www.portcalls.com/p6b-invested-109-ppa-infrastructure-projects-2018/ 33 Port infrastructure is owned by the port authority, and is leased to the private sector for further development. The port authority acts mainly as regulator or landlord, while the private sector undertakes all port operations.

72
Figure 38 - Vessel Traffic, Davao Sasa vs. DICT
Source: World Bank (n.d.)
The success of DICT in Davao hints at a new role for the private sector in port development in the country. In many areas of the country, the PPA or a respective economic zone manages the ports through concessions and regulations. In Davao, the private sector is taking on a larger role at the onset and are building their ports from the ground up. In most cases, these are more technically advanced compared to public ports. Such is the case with the success of DICT which is envisaged to be the most modern terminal in Mindanao with its ship-to-shore cranes and other state of the art facilities (World Bank 2014). Its significant headway in international export market share in Mindanao could be an encouraging precedent for other private port operators looking to enter the market. In Mindanao, given the presence of port developments that are privately owned, the landowners have begun to develop industrial parks and economic zones adjacent to the ports themselves. This industrial-park port-development system was initiated by the government. This is illustrated in Figure 39 which shows the 3,000-hectare Phividec Industrial Estate near Cagayan de Oro, possessing the logistical benefit of being within a five-minute drive to an international port, a geographic advantage possessed only by the Subic Freeport in Luzon. Some of the new ecozones are adjacent to ports or powerplants and could be a way to diminish the logistics issues on Mindanao. The land around the ports and roads that were built to service banana exporters are now being developed as industrial parks. These industrial parks, such as the Hijo Special Economic Zone beside the soon to be expanded Hijo Port in Tagum City, and the upcoming Anflo Industrial Estate next to the Davao International Container Terminal (DICT), both around the Davao Gulf are being expanded in hopes of attracting manufacturing capacity that could utilize the existing port infrastructure.
0
100
200
300
400
500
600
700
2013 2014 2015 2016 2017
Sasa (Domestic) Sasa (Foreign) DICT (Domestic) DICT(Foreign)
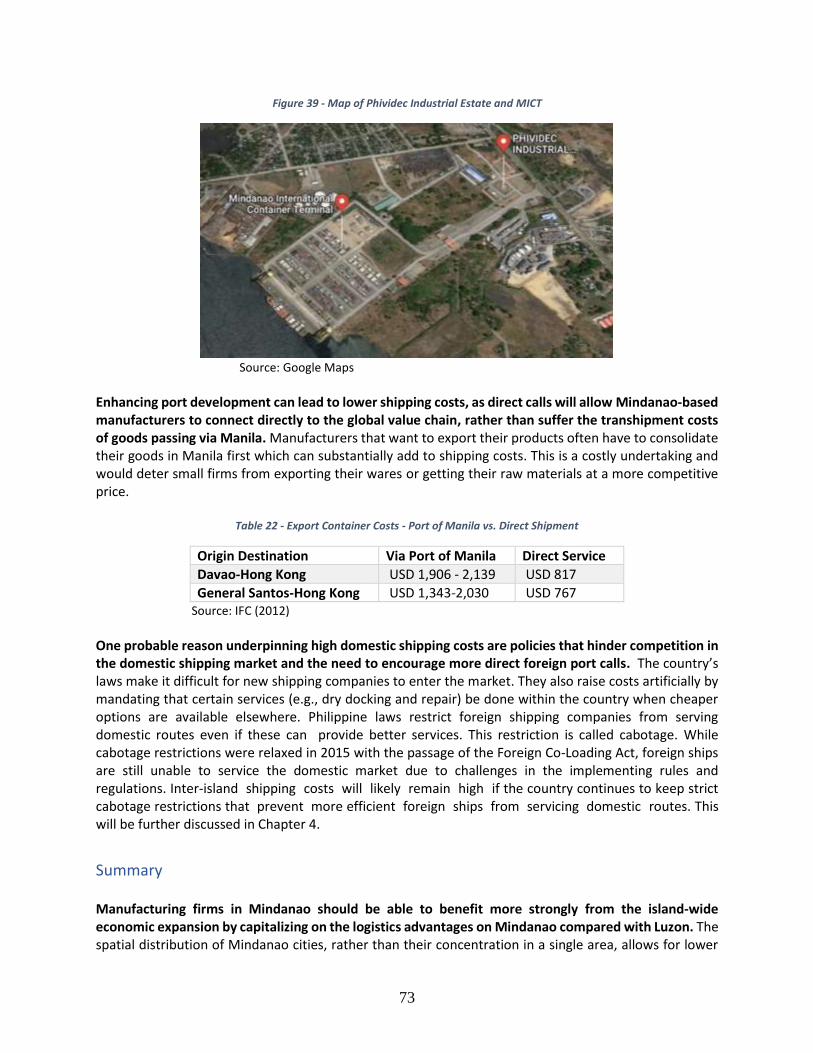
73
Figure 39 - Map of Phividec Industrial Estate and MICT
Source: Google Maps
Enhancing port development can lead to lower shipping costs, as direct calls will allow Mindanao-based manufacturers to connect directly to the global value chain, rather than suffer the transhipment costs of goods passing via Manila. Manufacturers that want to export their products often have to consolidate their goods in Manila first which can substantially add to shipping costs. This is a costly undertaking and would deter small firms from exporting their wares or getting their raw materials at a more competitive price.
Table 22 - Export Container Costs - Port of Manila vs. Direct Shipment
Origin Destination Via Port of Manila Direct Service
Davao-Hong Kong USD 1,906 - 2,139 USD 817
General Santos-Hong Kong USD 1,343-2,030 USD 767 Source: IFC (2012)
One probable reason underpinning high domestic shipping costs are policies that hinder competition in the domestic shipping market and the need to encourage more direct foreign port calls. The country’s laws make it difficult for new shipping companies to enter the market. They also raise costs artificially by mandating that certain services (e.g., dry docking and repair) be done within the country when cheaper options are available elsewhere. Philippine laws restrict foreign shipping companies from serving domestic routes even if these can provide better services. This restriction is called cabotage. While cabotage restrictions were relaxed in 2015 with the passage of the Foreign Co-Loading Act, foreign ships are still unable to service the domestic market due to challenges in the implementing rules and regulations. Inter-island shipping costs will likely remain high if the country continues to keep strict cabotage restrictions that prevent more efficient foreign ships from servicing domestic routes. This will be further discussed in Chapter 4.
Summary Manufacturing firms in Mindanao should be able to benefit more strongly from the island-wide economic expansion by capitalizing on the logistics advantages on Mindanao compared with Luzon. The spatial distribution of Mindanao cities, rather than their concentration in a single area, allows for lower
74
levels of traffic congestion, less idle time for vehicles, and substantially lower land transport costs for firms. Trucks and the ability of firms to locate in industrial parks adjacent to ports can further lower land transport costs. Truck companies can also explore mechanisms to provide both front-haul and back-haul when delivering across two relatively equivalent cities. However, while national roads are less problematic, logistic support services such as parking areas for idle truckers can still be developed. Manila’s congestion issues are not only caused by lack of road space, but also container yard congestion issues. Davao and Cagayan de Oro can learn lessons from this by ensuring storage facilities in the cities remain sufficient. Similarly, concerns about truck parking and waiting areas can be developed around Mindanao while land remains abundant. However, this requires reform in land-use regulations and local government awareness of road safety concerns. Mindanao logistics firms face additional concerns pertaining to security and corruption. Many areas of Mindanao still reflect peace and order concerns and delivery trucks tend to be possible targets for rebels or bandits seeking a quick payout. Certain areas have issues regarding informal checkpoints and illicit requests for payments by entities that are well-connected with the local government. Such concerns limit inter-city travel at night and limit the ability of firms to distribute products island-wide. Furthermore, Mindanao should capitalize on its own logistics policy innovations rather than copy Manila. Manila’s truck ban policies have worsened truck delivery times, caused cargo delays, and increased logistics costs, without providing a long-term solution to traffic congestion in the city. Yet, local governments in Mindanao are quick to copy these solutions rather than provide more innovative reforms. Mindanao needs to create its own home-grown logistics innovations, similar to the development around Davao port as the national port officials failed to find a solution to a major infrastructure bottleneck.
Chapter 3.
Complex Regulatory Procedures Complex regulatory procedures required for entrepreneurs and logistics service providers contribute significantly to the challenges faced by Mindanao-based firms. Most Philippine government agencies operate through a bureaucratic and paper-based permitting system for the purposes of business registration, import and export, logistics certification and food safety, which not only contribute to the annual operating costs faced by firms, but prevent many small and medium enterprises from entering into contracting arrangements and formalize their entry into commercial supply chains. Delays in obtaining business permits, certifications of product registration, and other licenses prevent farmers and food processors from directly selling to large industrial customers, like larger food processors, hotels, and supermarkets. Numerous Mindanao-based companies are unable to obtain commercial and food safety specifications for their products, because of limited laboratory testing facilities, and requirements for paper-based applications that need to be completed in Manila.
At the national level, business regulations in the Philippines are among the most complex in the world. In the Doing Business 2020 report, the Philippines ranks 95th out of 190 countries. Getting the necessary approvals for starting a business is among the most tedious globally, occupying the 171th position in the world, as the process requires 13 steps and 31 days to complete. There are numerous legislative gaps that prevent collaboration across the different agencies, requiring companies to visit multiple agencies to
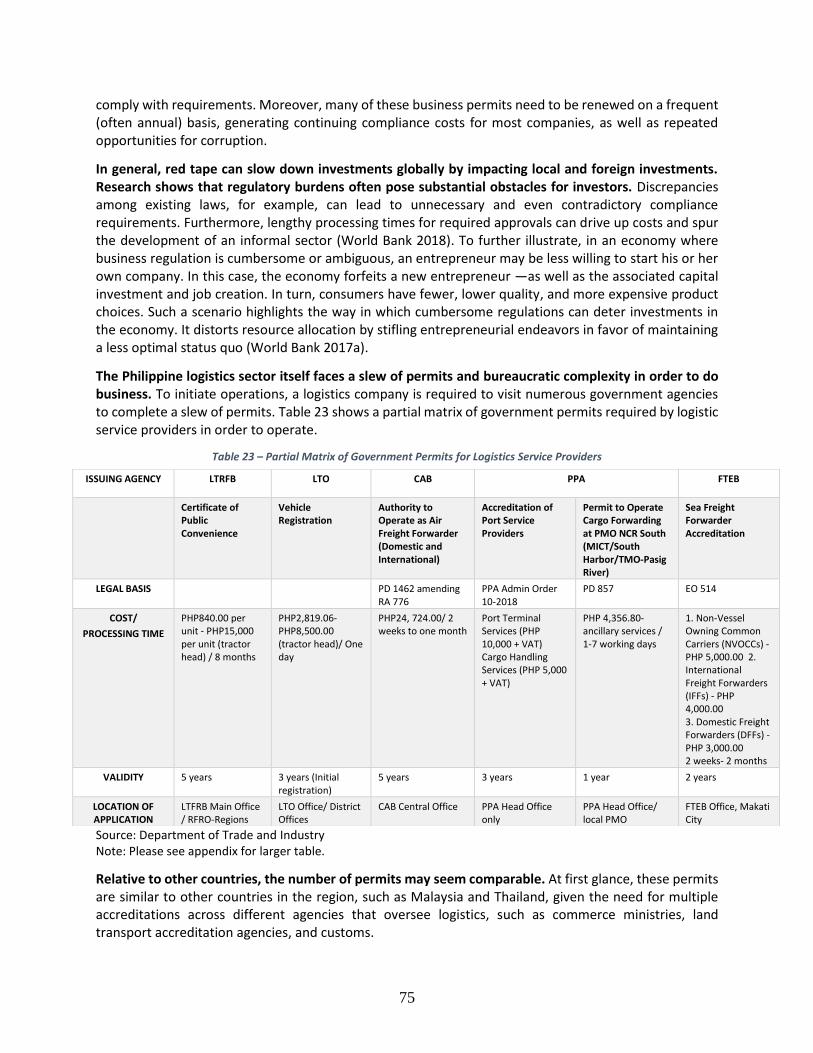
75
comply with requirements. Moreover, many of these business permits need to be renewed on a frequent (often annual) basis, generating continuing compliance costs for most companies, as well as repeated opportunities for corruption.
In general, red tape can slow down investments globally by impacting local and foreign investments. Research shows that regulatory burdens often pose substantial obstacles for investors. Discrepancies among existing laws, for example, can lead to unnecessary and even contradictory compliance requirements. Furthermore, lengthy processing times for required approvals can drive up costs and spur the development of an informal sector (World Bank 2018). To further illustrate, in an economy where business regulation is cumbersome or ambiguous, an entrepreneur may be less willing to start his or her own company. In this case, the economy forfeits a new entrepreneur —as well as the associated capital investment and job creation. In turn, consumers have fewer, lower quality, and more expensive product choices. Such a scenario highlights the way in which cumbersome regulations can deter investments in the economy. It distorts resource allocation by stifling entrepreneurial endeavors in favor of maintaining a less optimal status quo (World Bank 2017a).
The Philippine logistics sector itself faces a slew of permits and bureaucratic complexity in order to do business. To initiate operations, a logistics company is required to visit numerous government agencies to complete a slew of permits. Table 23 shows a partial matrix of government permits required by logistic service providers in order to operate.
Table 23 – Partial Matrix of Government Permits for Logistics Service Providers
Source: Department of Trade and Industry Note: Please see appendix for larger table.
Relative to other countries, the number of permits may seem comparable. At first glance, these permits are similar to other countries in the region, such as Malaysia and Thailand, given the need for multiple accreditations across different agencies that oversee logistics, such as commerce ministries, land transport accreditation agencies, and customs.
ISSUING AGENCY LTRFB LTO CAB PPA FTEB
Certificate of Public Convenience
Vehicle Registration
Authority to Operate as Air Freight Forwarder (Domestic and International)
Accreditation of Port Service Providers
Permit to Operate Cargo Forwarding at PMO NCR South (MICT/South Harbor/TMO-Pasig River)
Sea Freight Forwarder Accreditation
LEGAL BASIS
PD 1462 amending RA 776
PPA Admin Order 10-2018
PD 857 EO 514
COST/
PROCESSING TIME
PHP840.00 per unit - PHP15,000 per unit (tractor head) / 8 months
PHP2,819.06-PHP8,500.00 (tractor head)/ One day
PHP24, 724.00/ 2 weeks to one month
Port Terminal Services (PHP 10,000 + VAT) Cargo Handling Services (PHP 5,000 + VAT)
PHP 4,356.80- ancillary services / 1-7 working days
1. Non-Vessel Owning Common Carriers (NVOCCs) - PHP 5,000.00 2. International Freight Forwarders (IFFs) - PHP 4,000.00 3. Domestic Freight Forwarders (DFFs) - PHP 3,000.00 2 weeks- 2 months
VALIDITY 5 years 3 years (Initial registration)
5 years 3 years 1 year 2 years
LOCATION OF APPLICATION
LTFRB Main Office / RFRO-Regions
LTO Office/ District Offices
CAB Central Office PPA Head Office only
PPA Head Office/ local PMO
FTEB Office, Makati City
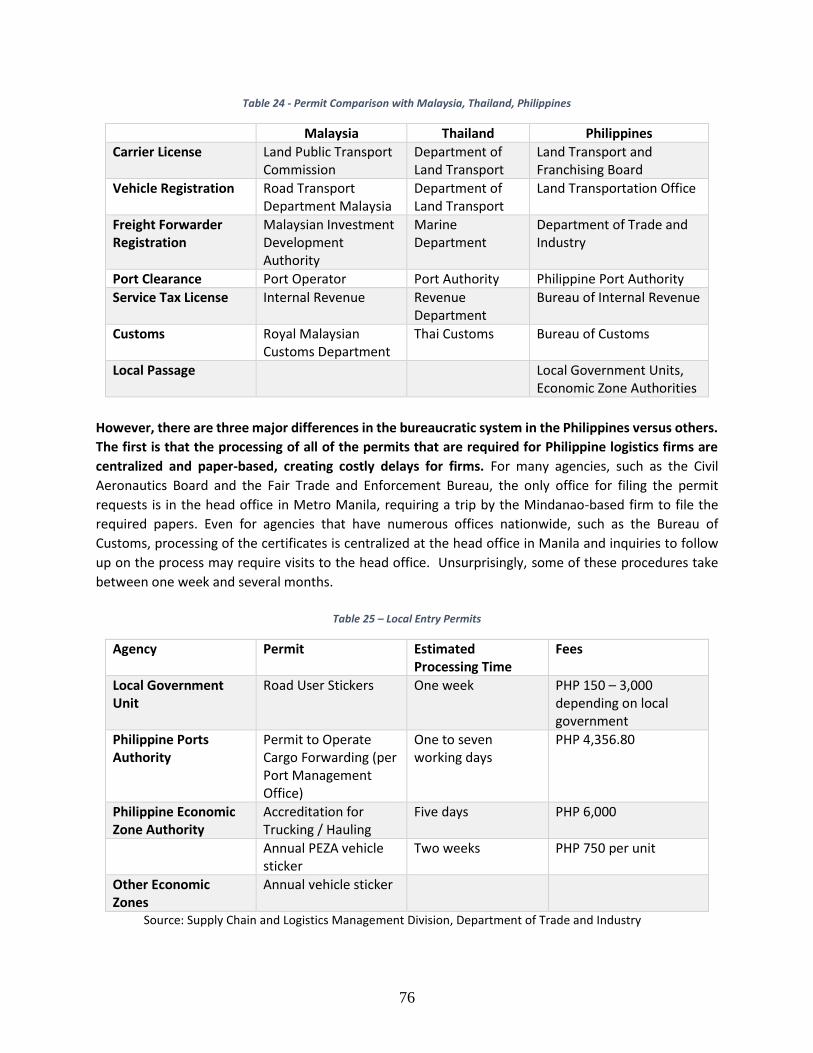
76
Table 24 - Permit Comparison with Malaysia, Thailand, Philippines
Malaysia Thailand Philippines
Carrier License Land Public Transport Commission
Department of Land Transport
Land Transport and Franchising Board
Vehicle Registration Road Transport Department Malaysia
Department of Land Transport
Land Transportation Office
Freight Forwarder Registration
Malaysian Investment Development Authority
Marine Department
Department of Trade and Industry
Port Clearance Port Operator Port Authority Philippine Port Authority
Service Tax License Internal Revenue Revenue Department
Bureau of Internal Revenue
Customs Royal Malaysian Customs Department
Thai Customs Bureau of Customs
Local Passage Local Government Units, Economic Zone Authorities
However, there are three major differences in the bureaucratic system in the Philippines versus others.
The first is that the processing of all of the permits that are required for Philippine logistics firms are
centralized and paper-based, creating costly delays for firms. For many agencies, such as the Civil
Aeronautics Board and the Fair Trade and Enforcement Bureau, the only office for filing the permit
requests is in the head office in Metro Manila, requiring a trip by the Mindanao-based firm to file the
required papers. Even for agencies that have numerous offices nationwide, such as the Bureau of
Customs, processing of the certificates is centralized at the head office in Manila and inquiries to follow
up on the process may require visits to the head office. Unsurprisingly, some of these procedures take
between one week and several months.
Table 25 – Local Entry Permits
Agency Permit Estimated Processing Time
Fees
Local Government Unit
Road User Stickers One week PHP 150 – 3,000 depending on local government
Philippine Ports Authority
Permit to Operate Cargo Forwarding (per Port Management Office)
One to seven working days
PHP 4,356.80
Philippine Economic Zone Authority
Accreditation for Trucking / Hauling
Five days PHP 6,000
Annual PEZA vehicle sticker
Two weeks PHP 750 per unit
Other Economic Zones
Annual vehicle sticker
Source: Supply Chain and Logistics Management Division, Department of Trade and Industry
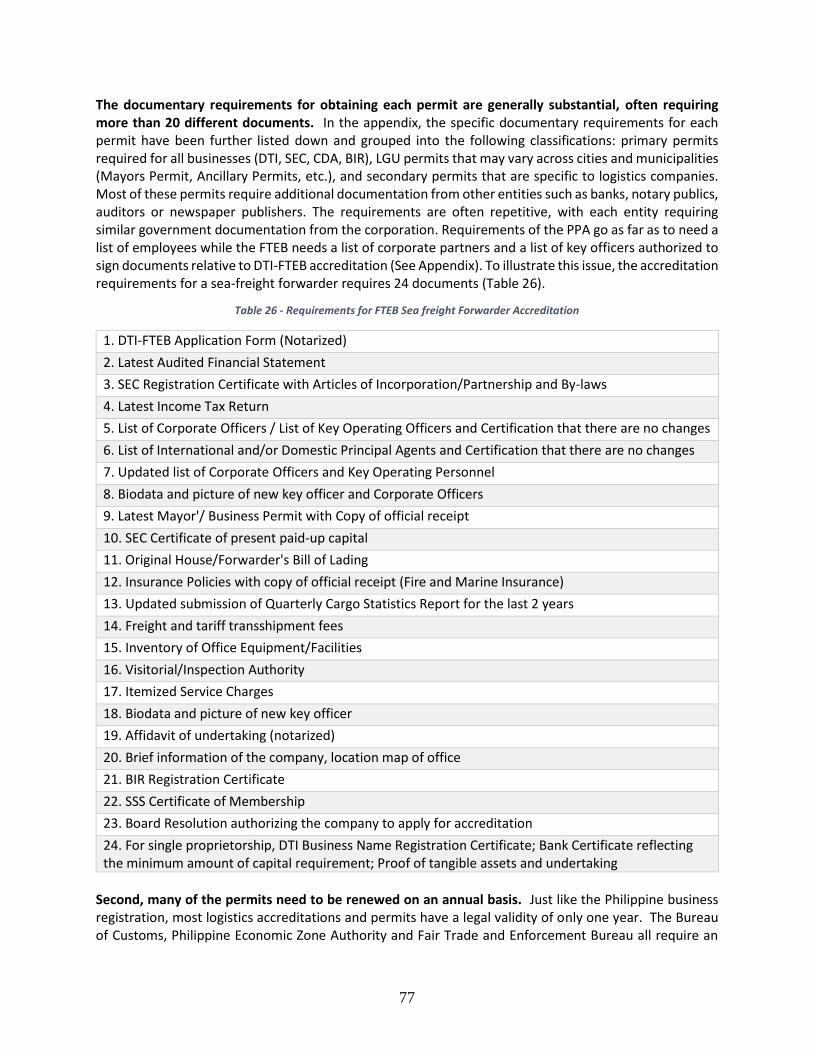
77
The documentary requirements for obtaining each permit are generally substantial, often requiring more than 20 different documents. In the appendix, the specific documentary requirements for each permit have been further listed down and grouped into the following classifications: primary permits required for all businesses (DTI, SEC, CDA, BIR), LGU permits that may vary across cities and municipalities (Mayors Permit, Ancillary Permits, etc.), and secondary permits that are specific to logistics companies. Most of these permits require additional documentation from other entities such as banks, notary publics, auditors or newspaper publishers. The requirements are often repetitive, with each entity requiring similar government documentation from the corporation. Requirements of the PPA go as far as to need a list of employees while the FTEB needs a list of corporate partners and a list of key officers authorized to sign documents relative to DTI-FTEB accreditation (See Appendix). To illustrate this issue, the accreditation requirements for a sea-freight forwarder requires 24 documents (Table 26).
Table 26 - Requirements for FTEB Sea freight Forwarder Accreditation
1. DTI-FTEB Application Form (Notarized)
2. Latest Audited Financial Statement
3. SEC Registration Certificate with Articles of Incorporation/Partnership and By-laws
4. Latest Income Tax Return
5. List of Corporate Officers / List of Key Operating Officers and Certification that there are no changes
6. List of International and/or Domestic Principal Agents and Certification that there are no changes
7. Updated list of Corporate Officers and Key Operating Personnel
8. Biodata and picture of new key officer and Corporate Officers
9. Latest Mayor'/ Business Permit with Copy of official receipt
10. SEC Certificate of present paid-up capital
11. Original House/Forwarder's Bill of Lading
12. Insurance Policies with copy of official receipt (Fire and Marine Insurance)
13. Updated submission of Quarterly Cargo Statistics Report for the last 2 years
14. Freight and tariff transshipment fees
15. Inventory of Office Equipment/Facilities
16. Visitorial/Inspection Authority
17. Itemized Service Charges
18. Biodata and picture of new key officer
19. Affidavit of undertaking (notarized)
20. Brief information of the company, location map of office
21. BIR Registration Certificate
22. SSS Certificate of Membership
23. Board Resolution authorizing the company to apply for accreditation
24. For single proprietorship, DTI Business Name Registration Certificate; Bank Certificate reflecting the minimum amount of capital requirement; Proof of tangible assets and undertaking
Second, many of the permits need to be renewed on an annual basis. Just like the Philippine business registration, most logistics accreditations and permits have a legal validity of only one year. The Bureau of Customs, Philippine Economic Zone Authority and Fair Trade and Enforcement Bureau all require an
78
annual visit to the agency, submitting relatively similar documents to continually renew the registrations by the logistics firms. To stress a point stated in the earlier paragraph, these costs are difficult for Mindanao-based companies, as visits to the head office in Manila are also required for these renewals.
Third, local pass-through permits are more prevalent in the Philippines than in other countries, with trucks being required to carry the requisite stickers to pass through certain cities, ports and economic zones. The local permits are particularly onerous, as they need to be obtained on a per city, per economic zone, and per port basis and also on an annual basis. This issue has been recognized by the national government through the DILG and has since issued a warning against the LGUs that still collect such fees.34 But national agencies are not exempt from such thinking. The Philippine Ports Authority requires separate truck stickers for serving the ports in the different port management offices. This means that for a truck to serve the ports of General Santos, Davao and Cagayan de Oro, three separate applications must be done annually for the truck to be able to serve the ports. The lack of coordination across similar agencies means that logistics firms wanting to service customers from multiple economic zones require separate permits from the Philippine Economic Zone Authority, Clark Development Corporation, Zamboanga Economic Zone and Freeport Authority, Phividec, and the individual private economic zone operators.
There are always new agencies that want to add permits and licensing procedures to an already cumbersome process. In September 2018, the Philippine Port Authority added an accreditation process to all entities that provide services to the port, including land transport providers, on top of the cargo forwarding permit that it already requires.35 In February 2019, the Bureau of Customs also promulgated a new order requiring trucks to undergo a new registration process in order to be allowed to carry imported or exported goods, although this new permit remains unimplemented due to complaints from the truck drivers’ associations.36
These procedures are particularly cumbersome for Mindanao-based firms as the same centralization and manual processing of other operational requirements, particularly trade permits, at the national level imposes additional operational issues. All requirements to import and export need to be cleared by the agency head office, and for the Philippines this could include up to 30 trade-related government agencies that are needed to clear the importation of 5,412 regulated products. SPS import clearance certificates are all issued from the national office in the Department of Agriculture. Exporters need to get a Bureau of Customs accreditation to acquire their Customs Client Number (CCN) that can only be obtained from Manila. Other accreditation procedures, such as the Food and Drug Administration Certificate of Product Registration and Bureau of Philippine Standards’ Import Commodity Clearance are also issued by their respective Manila offices. Moreover, if complications occur subsequently, such as shipments that get held at the Bureau of Customs, a trip to Manila is usually required to sort through the issues.
There are some licenses issued from Mindanao that provide operational restrictions that national licenses are exempt from. For example, the LTFRB issues two types of franchises for trucks-for-hire, those that are regional franchises (Mindanao only) or national franchises. The primary difference between a regional franchise and a national franchise is that the national franchise applicant must prove the existence of a garage located in the National Capital Region, generating an additional cost only to freight
34 “DILG warns LGUs to stop collecting pass through fees or face sanctions” September 18, 2018. Source: http://www.dilg.gov.ph/news/DILG-warns-LGUs-to-stop-collecting-pass-through-fees-or-face-sanctions-/NC-2018-1278 35 PPA Administrative Order 10-2018 36 Custom Memorandum Order 05-2019

79
forwarders that are not based in the capital. Therefore, many Mindanao-based trucking companies restrict their operations to the island only.
Even when permit procedures are decentralized, permit processing capabilities are not uniform across provincial offices. Not all regional offices in Mindanao are equipped with the same capabilities. For example, the Securities and Exchange Commission, which is required to certify all limited liability corporations, has satellite offices only in Cagayan de Oro, Zamboanga and Davao. Firms from General Santos and other cities in Mindanao have to travel to the nearest satellite office in order to register their limited liability corporations. The Bureau of Philippine Standards allows for the submission of requirements to the regional offices of the Department of Trade and Industry, however, the regional office of the Department of Trade and Industry for the SOCCSKSARGEN region is in Koronadal (population: 175,000) rather than the economic hub of General Santos (population: 600,000), requiring companies based in the larger city to travel 60 kilometers in order to complete their permitting requirements.
Exporters and other producers are critical of the lack of laboratory facilities close to their operations that can provide verified test results for use in securing access to foreign markets. For example, the Bureau of Philippine Standards has accredited only Luzon-based laboratory facilities for the testing of products that require mandatory standards such as cement, steel, and household appliances. Even when laboratory facilities are available in Davao or Cagayan de Oro for testing and certification – including those owned by the local government or state universities - these facilities are not accredited by the issuing agencies and they cannot be used by the locally-based firms. This creates an additional cost to the importer or manufacturer, who have to travel to Manila with their samples to have their products tested.
To illustrate all of these costs, a regulatory impact assessment was conducted in September 2018 to assess the cost implication of the lack of domestic permitting capabilities for firms on Mindanao versus those based in the capital. In the series of regulatory impact assessment workshops conducted by DTI in partnership with the IFC, the amount of time and costs it takes to file for the Accreditation of New Sea Freight Forwarders was calculated (please see the Appendix for the Standard Cost Model methodology). The total cost for a company to enter the sea-freight forwarding business is PHP 71,893 and the time it takes to perform the tasks to get the required documents is around 109.6 minutes or the equivalent of 4.6 days (See Table 27). While already cumbersome enough, all these procedures are centralized and need to be done in person in Manila, imposing additional costs on firms based elsewhere such as Mindanao. Moreover, inspections by a DTI Provincial office is possible, but in cases where it is not, FTEB (from Manila) does the inspection. This highlights the uneven capacities of some offices.
The full automation of the permit issuance process can substantially lower the cost of doing business for Mindanao-based logistics companies. The launch of the online ICC procedure by the BPS has been
estimated by the agency to lead to a compliance cost reduction of PHP3,600 for each applicant.37 Process automation does not have to require high investments in IT. For example, the National Tobacco Authority created an interim email-based process for the issuance of its import commodity clearance for tobacco products. The process involves the uploading and scanning of documents to a specified email by the agency, with payment conducted through accredited bank payment systems. The issuance of the approved permits is also sent back to the applicant by email. Eventually, the NTA expects to join the government automated single window system, but its current email process allows it to service its Mindanao-based importers immediately, particularly as the agency has no offices outside Luzon.
37 https://businessmirror.com.ph/2019/04/14/dtis-product-certification-goes-online/
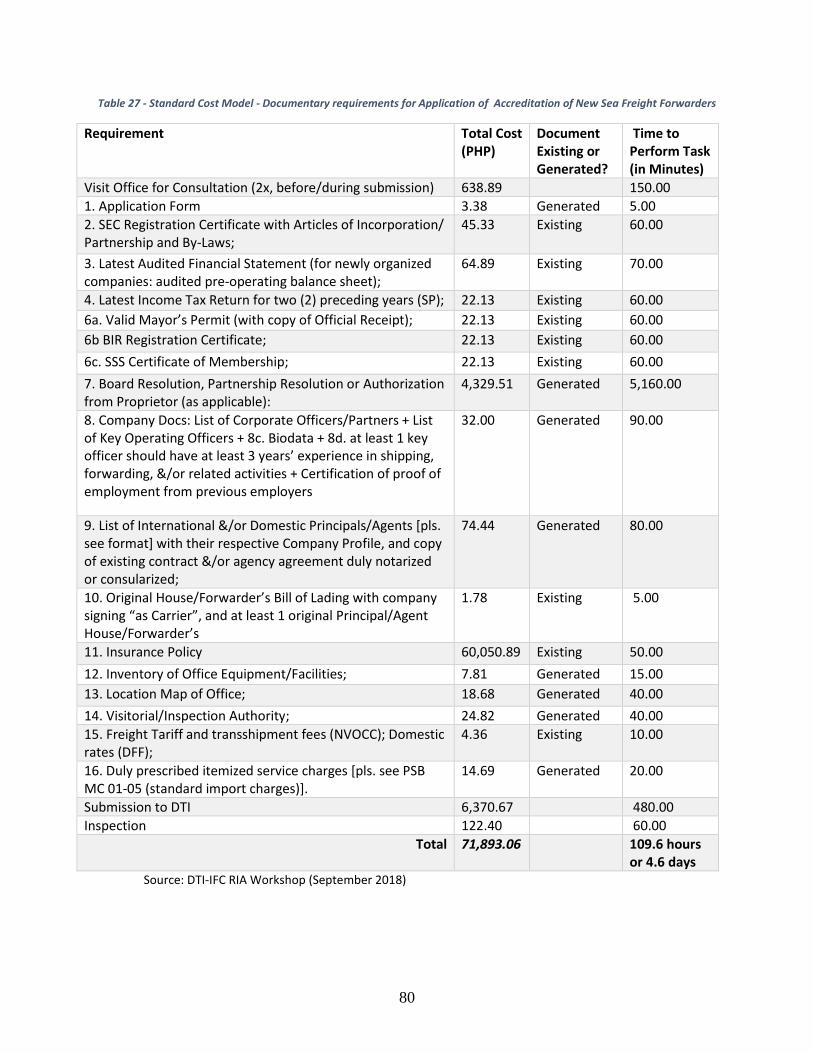
80
Table 27 - Standard Cost Model - Documentary requirements for Application of Accreditation of New Sea Freight Forwarders
Requirement Total Cost (PHP)
Document Existing or Generated?
Time to Perform Task (in Minutes)
Visit Office for Consultation (2x, before/during submission) 638.89 150.00
1. Application Form 3.38 Generated 5.00
2. SEC Registration Certificate with Articles of Incorporation/ Partnership and By-Laws;
45.33 Existing 60.00
3. Latest Audited Financial Statement (for newly organized companies: audited pre-operating balance sheet);
64.89 Existing 70.00
4. Latest Income Tax Return for two (2) preceding years (SP); 22.13 Existing 60.00
6a. Valid Mayor’s Permit (with copy of Official Receipt); 22.13 Existing 60.00
6b BIR Registration Certificate; 22.13 Existing 60.00
6c. SSS Certificate of Membership; 22.13 Existing 60.00
7. Board Resolution, Partnership Resolution or Authorization from Proprietor (as applicable):
4,329.51 Generated 5,160.00
8. Company Docs: List of Corporate Officers/Partners + List of Key Operating Officers + 8c. Biodata + 8d. at least 1 key officer should have at least 3 years’ experience in shipping, forwarding, &/or related activities + Certification of proof of employment from previous employers
32.00 Generated 90.00
9. List of International &/or Domestic Principals/Agents [pls. see format] with their respective Company Profile, and copy of existing contract &/or agency agreement duly notarized or consularized;
74.44 Generated 80.00
10. Original House/Forwarder’s Bill of Lading with company signing “as Carrier”, and at least 1 original Principal/Agent House/Forwarder’s
1.78 Existing 5.00
11. Insurance Policy 60,050.89 Existing 50.00
12. Inventory of Office Equipment/Facilities; 7.81 Generated 15.00
13. Location Map of Office; 18.68 Generated 40.00
14. Visitorial/Inspection Authority; 24.82 Generated 40.00
15. Freight Tariff and transshipment fees (NVOCC); Domestic rates (DFF);
4.36 Existing 10.00
16. Duly prescribed itemized service charges [pls. see PSB MC 01-05 (standard import charges)].
14.69 Generated 20.00
Submission to DTI 6,370.67 480.00
Inspection 122.40 60.00
Total 71,893.06
109.6 hours or 4.6 days
Source: DTI-IFC RIA Workshop (September 2018)
81
Beyond the legal permits, Mindanao-based companies also suffer from arbitrary payments in some areas of the island. As discussed in Chapter 2, demands for informal payments along the route of travel is dependent on the level of integrity of local law enforcement and the LGU’s ability to tolerate such behavior. Certain areas have mobile checkpoints that vary in frequency and location, making it unpredictable and harder to avoid. In certain areas, some of the interviewed logistics firms disclosed that they pay porter fees of PHP 5 per box, regardless of the box size and whether the porters are the firm’s or city locals. In addition to de jure arbitrary fees, de facto informal payments are still rampant in urban-urban routes especially in conflict areas especially during night time.
Regional Autonomy: The Case of the Bangsamoro Autonomous Region of Muslim Mindanao These regulatory issues are made more problematic with the uncertain devolution of powers to the BARMM. Instead of regional offices, BARMM has parallel government agencies that may or may not be coordinated with the national government. There does not seem to be any clear guidelines detailing which particular functions have been devolved to the BARMM regional governments and which functions are retained by the national government.
For certain agencies, like the Department of Trade and Industry, there has been no devolution of powers to the regional offices. Discussions with the Department of Trade and Industry (DTI) BARMM indicate that certain functions, like the FTEB freight forwarder accreditation or the BPS accreditations, were not devolved and remain with the national government. Any required inspections are performed by the nearest DTI office in Cotabato upon the request of DTI-BARMM. Inspections are performed at different premises and DTI-BARMM accompanies the DTI regional inspection teams. For other agencies, like the Department of Transportation, there has been a de facto devolution of powers, as there is no longer any coordination remaining between the Department of Transportation (DOTr) offices and their BARMM counterparts. This lack of coordination is apparent in the case for the Vessel Registry in BARMM and the records of the Maritime Industry Authority (MARINA). There is currently no single government vessel registry, as vessels registered in BARMM are not reflected in the national registry. Marine vessels registered in Sulu or Maguindanao are given a BARMM rather than a MARINA registry, and it remains unclear whether these permits are recognized by the national government. Similarly, the staff at the BARMM-Land Transport and Franchising Regulatory Board (LTFRB) feel that they have full capability and authority to issue land transport franchises, though the office has not had any applications in recent memory. Truckers interviewed in BARMM mentioned that they preferred to lodge their franchise requirements at the LTFRB offices outside BARMM due to negative experiences dealing with the BARMM office. It is unclear how the new Bangsamoro Organic Law and the creation of the new Bangsamoro Autonomous Region in Muslim Mindanao (BARMM) will change the dynamic of this devolution. The primary difference is the incorporation of Cotabato to BARMM from the national government. This may mean that applicants from BARMM’s largest city will need to deal with two permitting offices depending if they require BARMM or national certifications. The hope is that the new technocrats serving under the BARMM government understand the complexities faced by local entrepreneurs that need to deal with devolved versus centralized procedures and take immediate steps in clarifying the regulatory framework around this area.
82
Chapter 4.
Competition Assessment of Key Logistics Sectors
Not only is the regulatory environment linked to investment constraints, but regulations can also have
implications on competition, particularly if it raises barriers to entry and leaves the market more
concentrated and open to anti-competitive behavior. Regulations that would hinder entry at any stage
of the supply chain could lead to higher market power and concentration. When higher market power
impacts the upstream market, exiting players leave the supply chain more concentrated. This could add
additional barriers to entry for future players if they raise costs by blocking the supply channels through
exclusive dealings. It is important to note higher market power is not a competition issue per se, but rather
scenarios where higher concentration in the market leads to anti-competitive behavior or abuse of a
dominant position.
These inefficiencies brought on by limited competition can be found among the various nodes of the supply chain. Figure 7 and Figure 12 shows a sample logistic and process supply chain in Mindanao for Vegetables and Cacao, where it was extensively discussed in chapter one. Briefly, the supply chain involved agricultural inputs being transported to the producers. This is then followed by harvesting and minor processing if needed. The harvest is then hauled from the farm to consolidation points via delivery or pick up system. Vegetables or Beans are sold to the nearest trader, buyer, or consolidation point. Consolidation points require storage facilities for direct selling or further processing. Products are then transported to their final buyers depending on the quality of the product. Among these multiple nodes are opportunities to limit competition. Notably, the high concentration within the logistical value chain in the Philippines could be a factor that facilitates anti-competitive behavior which can inhibit growth. The economy-wide market structure indicates lack of competition (see Box 3). Moreover, based on the OECD-WBG Product Market Regulation (PMR) indicators which analyze the degree to which national rules encourage competition, it shows that
the Philippines score above the PMR average38. This may impair the economic growth of the Philippines given its archipelagic nature. Hence, it is crucial to identify the competitive bottlenecks that impair the performance of this key sector.
Using the Markets Competition Policy Assessment Tool (MCPAT) developed by the World Bank, this section will assess the competition policy along the different segments of the logistics value chain in Mindanao. The main objective of this section is to identify bottlenecks through the logistics value chain arising from restrictive regulations that increase the risk of potential anti-competitive conducts. Anti-competitive regulations may have a detrimental effect on the degree of competition within a given
market, accordingly the MCPAT methodology will be used to identify these regulations.39 Based on this methodology, anti-competitive regulations are classified into three pillars: (i) Regulations that reinforce dominance or limit entry (ii) Rules that are conducive to collusive outcomes or increase costs to compete in the market (iii) Rules that discriminate, distort the level playing field, and protect certain interests.
38 The product market regulation (PMR) indicators ) can be benchmarked across countries and over time through a methodology first developed by the OECD and rolled out in non-OECD countries by the World Bank. They help highlight how restrictive certain regulations and policies are to competition on the books. 39 The MCPAT is a tool developed by the WBG to assist governments to diagnose and provide guidance on the prioritization of
pro-competitive reforms.

83
Considering the regulatory restrictions and high-level characteristics of the markets they affect, this section provides policy recommendations for pro-competitive reforms. The overall assessment will be based on data gathered from regulations that govern the different segments of the value chain and through stakeholders’ views. To foster competition within the logistics value chain in Mindanao, there is a need to eliminate anti-competitive regulations that are unduly restrictive and ensure effective competition enforcement. The promotion of competition is based on three complementary pillars: fostering pro-competitive regulations and government interventions, promoting competitive neutrality and non-distortive state support measures and developing effective economy-wide enforcement of competition law (Table 28). The first pillar entails the removal of statutory monopolies, bans towards private investments and restrictions to the number of firms that can be active in a market, the enactment of access regulation for essential facilities, and the elimination of government interventions that are conducive to collusive outcomes or increase costs of competing. The second pillar encompasses the control of state aid to minimize distortions and guarantee a level playing field regardless of ownership. The third pillar involves the sanctioning of anti-competitive agreements that raise the costs of key inputs and final products and reduce product variety, the prevention of anti-competitive mergers and the strengthening of the general antitrust and institutional framework to fight anti-competitive conduct and abuse of dominance.
Table 28 - Key Pillars for Fostering Competition
FOSTERING COMPETITION IN MARKETS
PROCOMPETITION REGULATIONS AND GOVERNMENT INTERVENTIONS: OPENING MARKETS AND REMOVING ANTI-COMPETITIVE SECTORAL REGULATION
COMPETITIVE NEUTRALITY AND NON- DISTORTIVE PUBLIC AID SUPPORT
EFFECTIVE COMPETITION LAW AND ANTITRUST ENFORCEMENT
Reform policies and regulations that strengthen dominance: restrictions to the number of firms, statutory monopolies, bans on private investment, lack of access regulation for essential facilities
Control state aid to avoid favoritism and minimize distortions on competition
Tackle cartel agreements that raise the costs of key inputs and final products and reduce access to a broader variety of products
Eliminate government interventions that are conducive to collusive outcomes or increase the costs of competing: controls on prices and other market variables that increase business risk
Ensure competitive neutrality including vis-a vis SOEs
Prevent anti-competitive mergers
Reform government interventions that discriminate and harm competition on the merits: frameworks that distort the level playing field or grant high levels of discretion
Strengthen the general antitrust and institutional framework to combat anti-competitive conduct and abuse of dominance
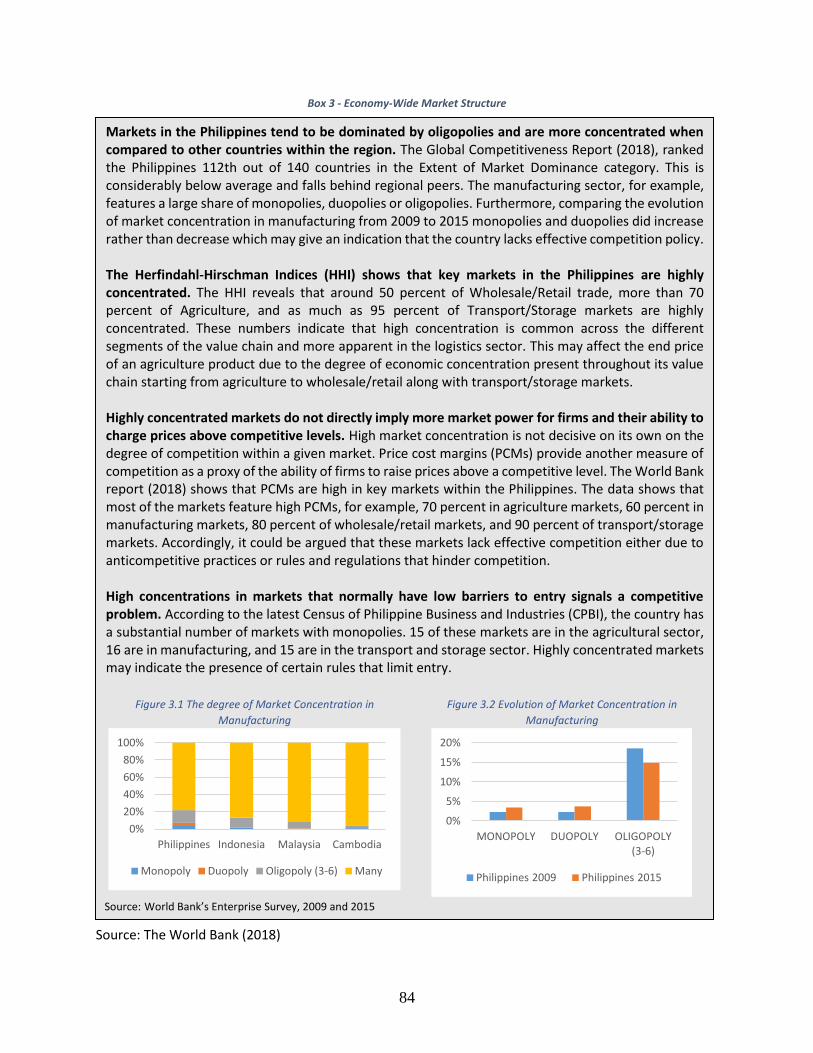
84
Box 3 - Economy-Wide Market Structure
Source: The World Bank (2018)
Markets in the Philippines tend to be dominated by oligopolies and are more concentrated when compared to other countries within the region. The Global Competitiveness Report (2018), ranked the Philippines 112th out of 140 countries in the Extent of Market Dominance category. This is considerably below average and falls behind regional peers. The manufacturing sector, for example, features a large share of monopolies, duopolies or oligopolies. Furthermore, comparing the evolution of market concentration in manufacturing from 2009 to 2015 monopolies and duopolies did increase rather than decrease which may give an indication that the country lacks effective competition policy. The Herfindahl-Hirschman Indices (HHI) shows that key markets in the Philippines are highly concentrated. The HHI reveals that around 50 percent of Wholesale/Retail trade, more than 70 percent of Agriculture, and as much as 95 percent of Transport/Storage markets are highly concentrated. These numbers indicate that high concentration is common across the different segments of the value chain and more apparent in the logistics sector. This may affect the end price of an agriculture product due to the degree of economic concentration present throughout its value chain starting from agriculture to wholesale/retail along with transport/storage markets. Highly concentrated markets do not directly imply more market power for firms and their ability to charge prices above competitive levels. High market concentration is not decisive on its own on the degree of competition within a given market. Price cost margins (PCMs) provide another measure of competition as a proxy of the ability of firms to raise prices above a competitive level. The World Bank report (2018) shows that PCMs are high in key markets within the Philippines. The data shows that most of the markets feature high PCMs, for example, 70 percent in agriculture markets, 60 percent in manufacturing markets, 80 percent of wholesale/retail markets, and 90 percent of transport/storage markets. Accordingly, it could be argued that these markets lack effective competition either due to anticompetitive practices or rules and regulations that hinder competition. High concentrations in markets that normally have low barriers to entry signals a competitive problem. According to the latest Census of Philippine Business and Industries (CPBI), the country has a substantial number of markets with monopolies. 15 of these markets are in the agricultural sector, 16 are in manufacturing, and 15 are in the transport and storage sector. Highly concentrated markets may indicate the presence of certain rules that limit entry.
Figure 3.1 The degree of Market Concentration in
Manufacturing
Figure 3.2 Evolution of Market Concentration in
Manufacturing
Source: World Bank’s Enterprise Survey, 2009 and 2015
Philippines Indonesia Malaysia Cambodia
0%
20%
40%
60%
80%
100%
Monopoly Duopoly Oligopoly (3-6) Many
MONOPOLY DUOPOLY OLIGOPOLY (3-6)
0%
5%
10%
15%
20%
Philippines 2009 Philippines 2015

85
Whereas regulations are necessary tools for Governments to achieve their policy objectives, they also have the potential to restrict competition. According to the MCPAT framework, restrictive regulations may be classified into three main groups, based on their likely effect on competition:
a. Regulations that reinforce dominance or limit entry: these include monopoly rights and absolute bans for entry, relative bans for entry and expansion of activities, the participation of incumbents in entry decisions, licenses and permits to operate, and presence of high switching costs induced by regulations;
b. Rules that are conducive to collusive outcomes or increase costs to compete in the market: these include rules that facilitate agreements among competitors, and restrictions on the type of products and services/format and location;
c. Rules that discriminate, distort the level playing field and protect vested interests: these include the discriminatory application of rules or standards, discretionary application of rules, lack of competitive neutrality vis-à-vis government entities, and state aid/incentives distorting the level playing field.
Anti-competitive regulations may have a detrimental effect on the economics of the logistical supply chain. Regulations that would hinder entry, for example, in any stage of the supply chain could lead to the higher market power. The literature shows that market power may impact both upstream and downstream markets. Regarding the upstream market, buyer power that could be exerted on upstream market players may lead to the exit of those other players from the market, further concentrating the supply chain. If a more concentrated market leads to anti-competitive behavior or abuse of a dominant position, this could stifle competition. Moreover, it could be argued that buyer power may also be used as a barrier to entry to raise the cost of their rivals by blocking the supply channels through exclusive dealings. The impact of market power on the downstream market may also have an exploitative or an exclusionary nature.
In several instances, anti-competitive regulations may be replaced by pro-competitive regulations that may foster competition. Evaluating the regulations in place currently means understanding the policy objective that the rule is seeking to serve, and then evaluating whether there are less restrictive policy options that can achieve the same objective. In general, each regulatory goal will match with several possible regulatory propositions that may enable policy-makers to achieve their objective with a less anti-competitive effect on markets. It is worth noting that in some cases, antitrust enforcement will be the best tool to promote competition in a market, particularly when problems stem from the behavior of market participants rather than the government rules in place.
Anti-competitive Regulations and Government Intervention A number of regulations that governs the logistics value chain in Mindanao may hinder competition. The regulations that govern the different segments of the logistics value chain has been reviewed to assess its effect on competition. Moreover, interviews have been conducted with key public and private sector stakeholders to better understand the impact of such anti-competitive regulations on the market. The segments that the analysis focused on are trucking, freight forwarding, ports, and domestic maritime shipping. The review of the rules and regulations of these segments resulted in identifying potential bottlenecks that may hinder competition based on the MCPAT framework as shown in Table 28.

86
Figure 40 - Logistics Value Chain and Potential Bottlenecks
Trucking Road transport is one of the most atomized markets in logistics but only a few firms can take advantage of scale. Data from the Land Transportation Franchising and Regulatory Board (LTFRB) show more than 500 franchises were issued in Region XI, with more than 2,000 trucks and trailers plying the road. Although, there is a substantial number of registered trucking companies, only 10 percent of firms own more than 10 trucks in their fleet (see Figure 41). Trucks with more specialized equipment are harder to find. More than 5,500 trucks are registered with
the LTO in 2018, and only 130 units are reported to have air-conditioned cabs.40 For reefer vans which is also used for the transportation of perishable products, discussions with relevant parties showed that the broad availability of reefer vans is still considered as a challenge.
40 This figure is likely to be understated as the LTO in region XI can only keep track of refrigerated trucks during physical
inspection to ensure compliance with the non-use of Freon.

87
Figure 41 - Distribution of trucking companies by fleet size for Region XI
Source: Land Transportation Franchising and Regulatory Board Region XI
The Philippines’ Constitution bans foreigners from operating in the trucking industry. The Constitution states that the operation of a public utility shall be granted only to citizens of the Philippines or to corporations that are at least sixty per cent owned by such citizens. Given that ‘public utility’ is undefined within the Philippines regulatory framework, this leaves the land transport regulators free to interpret which functions and trucking services where foreigners cannot operate. Hence, defining the boundaries of public utility would have a positive impact on competition within this segment of the value chain. The ban on private trucking from carrying freight not belonging to the registered owner reduces efficiency and may represent a barrier to entry for new digital platforms. The Republic Act no. 4136 set a ban on private trucks to carry freight not belonging to the registered owner. This ban would prohibit for example an agriculture company to co-share an unutilized part of its own truck with another company. The matter which will increase the cost of transportation on both companies and thus would lead to inefficiencies that affect the price of the final product. Moreover, several international markets witnessed the entry of truck hailing services using digital platforms such as Haulio in Singapore and Manbang in China. In fact, such disruptive technologies may have a positive effect on competition through exerting competitive pressure on the current market players. Accordingly, this regulation may increase inefficiencies and also act as a barrier to entry for new services. To caveat, given a potential market failure of asymmetry of information (e.g. regarding levels of insurance, safety and driver standards), governments often require trucking operators that offer services to third parties to comply with a certain minimal set of standards before granting permissions. Thus, considerations of safety must be taken into account as the market is opened to new players. The road transport sector is constrained by a number of potentially restrictive regulation. Issuing a
trucking license requires the approval with eight government agencies.41 Filipino citizenship and hauling
contracts are also required to establish a business in national road freight services.42 Firms are also required to obtain permits to perform hauling services inside the ports. As mentioned in the previous
41 License involves applications to: The Land Transportation Franchising and Regulatory Board (LTFRB), the Department of Transportation (DOT), the Department of Trade and Industry (DTI), the Land Transportation Office (LTO), the Bureau of Internal Revenue (BIR), the Local Government Unit of principal address of the Corporation or Partnership, the SEC, and the Barangay of the Principal Address of the Corporation or Partnership. 42 Land Transportation Franchising and Regulatory Board. Available at: http://www.ltfrb.gov.ph/media/Truck_FAQs.pdf
88
chapter, a Permit to Operate (PTO), the right granted to perform business activities inside the port premises, is issued for each calendar year at the Port Management Office (PMO) level for each port. Annual fees are charged for the permit, VAT, stickers for the trucks and pedestrian IDs. In Davao, it is estimated that around 60 companies have PTOs, with an average of 20 to 30 trucks from various owners/operators. The implementation of truck bans on certain routes during peak hours affects competition. The city of Davao, Cagayan de Oro and General Santos, following the lead of Manila, have implemented time-bound truck bans. In Cagayan de Oro, the truck ban runs from 7 am to 9 am and 5 pm to 7 pm daily and only applies to the main business district i.e. districts 1 and 2. In General Santos, the ban runs from 5:30 am to 8:30 am and 4:30 pm to 7:00 pm covering the National Highway among designated areas. In Davao, the ban runs from 5 am to 9 am and 4 pm to 8 pm. All city streets and national highways are included except for the portion of Sayre Highway from Calinan poblacion juncture to the BUDA section adjacent to Bukidnon province. Given the large share of agricultural produce moving around Davao, they have included an exemption for trucks carrying perishable goods. However, truckers must apply for the exemption and pay an annual permit fee of PHP5,000 (around USD 100) per vehicle. Stakeholders consider this fee in itself as a barrier that reduces their ability to compete and increases their operational costs (See Table 18 in Chapter 2). Truck bans may raise the cost of truckers by 5 to 10 percent due to the increase in waiting time. In Davao for example, the truck ban has an adverse effect on truckers willing to transport goods to Davao Sasa port. The ban increases the turnaround time for many of the trucks that deliver and pick up cargo from the ports. Stakeholders estimate an additional 4 hours per one-way trip as a result of the truck ban. Members of the trucker’s associations estimate a 5 to 10 percent cost increase due to the ban. Nevertheless, in practice the truckers started to coordinate with shipping lines to arrange schedules that match with the ban timings. Notably, the significantly affected geographic area is the route leading to Davao Sasa port. This port is considered an important port for domestic shipping. Given that most of the warehouses are located near the port, thus lifting the ban within 3 to 5 miles radius from Davao Sasa port might reduce the effect of the ban. Moreover, it is advisable to remove the fees associated with the ban exemption permit issued by Davao city to minimize the ban effect on the market. Overall, the road traffic issues in Mindanao are not yet at the level of Luzon, which allows Mindanao greater flexibility in deciding the extent of the implementation of the truck passage restrictions.
Ports Ports limited capacity act as a barrier to entry especially for domestic shipping. Port operation usually enjoys a natural monopoly given its large capital investment requirements. Few ports in Mindanao are able to receive large container vessels thus inter-port competition is considered low. Investments towards the improvement of public ports have been negligible and the move towards privatization for some of Mindanao’s biggest ports has been stalled (See Chapter 2). This lack of capacity in ports restricts the options of shippers. Anecdotal evidence from stakeholders shows that exporters have favored Davao International Container Terminal (DICT) because of its facilities and often choose to ship out of DICT despite cargo coming from as far as General Santos. Davao Sasa port does not compete very well in terms of international traffic and is often limited to shipments for the domestic market. Congestion in ports leads to higher logistics costs and creates a bottleneck. Existing port capacity and limited infrastructure to access terminals are some of the main causes of high congestion levels.
89
Stakeholders highlighted concerns regarding the shortage of adequate berths in the Davao Sasa port as a key reason for its congestion. The port cannot accommodate the volume of trade passing through. Vessels wait for their turn because there are only 10 available berths and no quay crane. As a result, drivers and other logistics providers tend to increase their fees because they know cargo movement will take longer. The allocation and assignment of physical access to limited port facilities can lead to competition issues. Interviews with stakeholders show that vessels strictly follow designated berthing schedules but anecdotes from stakeholders mention that if foreign shipping lines are already at berth in the port such as Davao Sasa Wharf and there is an incoming domestic shipping line arriving, those on the foreign shipping liner tend to be pushed out to prioritize the domestic vessel. Other interviews also mention that breakbulk cargo consumes more berthing time by almost a factor of three, congesting the limited berths.
In terms of port operations, there is a need to more clearly separate the commercial interest and the regulatory functions of the Philippine Ports Authority (PPA) by facilitating the continued privatization of PPA’s port operations and limiting it to operating as a landlord. The PPA could maintain its investment function primarily as a developer of port infrastructure in areas with limited economic viability but with a strong social need. At present, most PPA ports around Mindanao are already run by private port operators, limiting PPA’s involvement to regulating the port tariffs charged by its owned ports On this note, it has implemented steps in minimizing these conflicts through the promulgation of orders
that make the tariff increase process more formulaic and transparent.43 The primary area of concerns remains in the licensing of private port development, as PPA regulates what commercial services a port can offer and has in certain cases withheld licenses for the provision of certain services when these are in direct competition with government-owned ports. The matter that may create another bottleneck on a different level of the value chain by chilling out the competition between cargo handlers.
Domestic Shipping Domestic shipping in the Philippines is relatively more expensive compared to its neighbors. The recent World Bank report (2018) shows that the average port-to-port cost per nautical mile is USD 1.47, which is higher than Indonesia’s USD 0.77 and Malaysia’s USD 1.36. Stakeholders within the cacao industry for example highlight that domestic shipping costs are much higher per kilo compared to export shipping due to the high intra-island rates. Based on the report, one of the reasons behind these high prices of domestic shipping are the constraints on market competition, where 40 percent of shipping routes are served by a single operator.
Restrictions on domestic shipping cabotage have a detrimental effect on the logistical supply chain of the Philippines. Mindanao as previously mentioned is considered the food basket for the whole country. Due to the geography of the Philippines that comprises more than 7,000 islands, domestic shipping is essential for cargo transportation between different islands. Republic Act no. 9295 for 2004 prohibits foreigners from operating within the territorial waters of the Philippines. This prohibition limits entry to the domestic shipping market, a matter that reinforces dominance. Moreover, the barrier to entry generated from this restraint may also ease collusion due to the limited number players in the domestic shipping market.
43 Please see PPA Administrative Order 02-2018.
90
Stakeholders believe that the entry of foreign firms in the domestic shipping market will have a positive effect on competition. Although the cabotage rule was partially lifted to allow foreign vessels to ferry domestic cargo if they are bound for export through Republic Act 10668, foreign-flagged vessels still do not service domestic routes. Stakeholders believe that the entry of foreign vessels would reduce domestic shipping prices as they enjoy larger capacities and more efficient vessels. Furthermore, their presence would also increase competition with local players and prevent them from setting high prices for domestic shipping routes. There may be a need to revise the implementing rules and regulations of RA 10668 to encourage the entry of foreign vessels in the transport of tradable goods. The discretionary power granted to MARINA to intervene in prices for domestic shipping may negatively affect competition. Based on the Domestic Shipping Act, MARINA was given the authority to “determine the fairness of passenger and cargo rates needed to sustain the service taking into consideration the economic and beneficial effect which the service shall have.” This enables MARINA to discretely set domestic shipping prices. In practice, MARINA interfered in the pricing of passenger transportation. This case was initiated primarily due to a passenger complaint. These types regulations could be defined as ‘regulation above regulation’, it could be argued that the legislator tried to resolve the bottleneck created by the cabotage through regulating prices, an action that will create another restriction on market dynamics. Furthermore, such vague regulations create regulatory uncertainty as it provides MARINA with discretionary power in determining a ‘fair’ rate. Hence, it is recommended to minimize MARINA’s power regards to limiting the industry capacity and price interference, through specific rules on when to intervene and which principles to apply to minimize negative effects on market dynamics.
Freight Forwarding Foreign freight forwarders are prohibited to operate within the Philippines. The Constitution of the Republic of the Philippines as previously mentioned grants the exclusive right to citizens of the Philippines or to corporations that are at least sixty percent owned by such citizens to operate a public utility. Due to the vagueness of the definition of a public utility within the Philippines regulatory framework, it led to the restriction of entry for foreign freight forwarders. The matter which hinders competition and deprives customers to choose between different service providers. The existence of a complex registration regime to operate as a freight forwarding service provider limits entry. The Fair Trade and Enforcement Bureau (FTEB) implements the Philippine Shippers Bureau (PSB) Administrative Order No. 6 of 2005 set a number of requirements such as paid-up capital requirement of PHP four million for Non-Vessel Operating Cargo Carrier (NVOCC), PHP two million for International Freight Forwarding (IFF) and PHP250 thousand for Domestic Freight Forwarding (DFF). Moreover, it required that applicant's net equity shall be equal to or greater than the prescribed minimum paid-up capital for each category, and the amount shall not be impaired by the operating losses, the long-term liabilities, or other operating aspects affecting the net equity of the firm upon application for accreditation. Furthermore, it is required that one of the key operating officers must have at least three years of experience in shipping, freight forwarding, and/or related activities, and must submit a certification or proof of employment from previous employers. Another documentary requirement is
proof of insurance coverage. 44 These complex accreditation requirements may hinder entry and reduce the level of competition in this segment of the value chain.
44 Proofs of cargo insurance coverage, namely, a photocopy each of the policy and the official receipt showing payment of the premium. The type of cargo insurance required for accreditation under this order is either the merchandise in transit (floater) insurance which shall cover truck risks plus robbery and hijacking (standard coverage) plus losses and damaged due to loading

91
The PSB administrative order number 6 for 2005 considers overcharging and granting of rebates as unlawful acts. It could be argued that the order accordingly grants the discretionary power to DTI to intervene in prices. The matter of which increases the restrictions in this market and might be used as price control. These types of rules may be conducive to collusive outcomes and increase the cost to compete in the market. It is advisable accordingly to eliminate these sorts of price interference. These anti-competitive regulations within the different segments of the value chain should be addressed to foster competition. Each bottleneck within the value chain will have a detrimental effect on price, quality and variety of the final products. Therefore, it is essential to resolve these bottlenecks through the revision of all anti-competitive regulations that may hinder competition. Table 29 accordingly summarizes the recommendation for each segment of the value chain along with the related regulatory instrument and responsible institution to undertake the reform.
Table 29 - Recommendations for Enhancing procompetitive regulations and Government Intervention
Segment Recommendations Related Regulatory
Instrument Responsible institutions
Segment-specific Policy recommendations
A. Trucking
A.1 Reduce the restrictions on private trucks to carry freight not belonging to the registered owner.
Republic Act No. 4136 / 1964
Congress of the Philippines, LTO and LTFRB
A.2 Reduce/limit the truck ban. Davao city Ordinance No. 0227-17
City Government of Davao
A.3 The facilitation of the issuance of the ban exclusion permit.
Guidelines for Exemption Permit (Limited Truck Ban) issued by Davao City Transport and Traffic Management Office (CTTMO)
CTTMO and City Government of Davao
A.4 Clarify the legal definition of Public Utilities to allow greater foreign investments in trucking and other transport services.
Commonwealth Act 146 / 1936
Congress of the Philippines, LTO, LTFRB and PCC
B. Freight forwarding
B.1 The facilitation of foreign freight forwarders to operate in the Philippines.
Commonwealth Act 146 / 1936
Congress of the Philippines, DTI and PCC
B.2 Lessening of freight forwarders registration requirements.
PSB Administrative Order No. 6 , s. 2005
DTI-FTBE
and unloading and losses and damages whilst the vehicle is on stop overnight at an allowed territory; or any standard global comprehensive cargo liability insurance for freight forwarders and transport operators covering destinations between the Philippines and worldwide. Entities with global comprehensive cargo liability coverage must show proof that its domestic insurance representative is authorized to process claims on behalf of its principle insurer. The minimum amount of insurance coverage shall be as follows a. NVOCC P 1M b. IFF 500K, DFF 250K.

92
Segment Recommendations Related Regulatory
Instrument Responsible institutions
B.3 Elimination of price interference. PSB Administrative Order No. 6 , s. 2005
DTI-FTEB
C. Ports
C.1 Ensure competitive neutrality between public and private ports.
Presidential Decree no. 857: Revised Charter of the PPA created under Presidential Decree No. 505/1974; PPA cargo handling fees guidelines.
PPA and PCC
C.2 separate the PPA regulatory function from its ports development and operations functions to level the playing field through greater private management of ports.
Fully implement AO 003-2018
PPA
D. Domestic Shipping
D.1 The facilitation of foreign shipping to operate Philippines territorial waters.
Republic Act no. 9295/2004 / Republic Act no. 10668/ 2015.
Congress of the Philippines, MARINA, NEDA and PCC
D.2 Minimize the power of the regulator to limit industry capacity.
Presidential Decree no. 474/ 1974; Act no. 9295/2004
Congress of the Philippines, MARINA, NEDA and PCC
D.3 Minimize the power of the regulator to interfere in pricing.
Presidential Decree no. 474/ 1974; Act no. 9295/2004
Congress of the Philippines, MARINA, NEDA and PCC
Rules that reinforce dominance
or limit entry Rules that limit free strategic
choices, are conducive to collusive outcomes or increase costs to compete in the market
Rules that discriminate and protect vested interests
Business associations can play an important role for the benefit of its members and the different markets, but they can also be used as a platform to restrict competition. Most associations serve the legitimate purpose of informing their members about legislative requirements, procedures and new ordinances, give advisory services, and offer training workshops. Meanwhile, empirical evidence shows that the existence of a trade association may increase the probability of collusive behavior. Levenstein and Suslow (2006) found that between a quarter and a half of the cartels in the U.S. involved trade associations. The World Bank Group interviews with different stakeholders across the logistics value chain shows limited knowledge regarding the Philippines Competition Law. Actors on different levels of the value chain are not well informed of the competition law’s prohibitions regarding coordinated practices among competitors. This could highlight a red flag given that business associations are present across the value chain. The PCC should carefully monitor these markets, enhance awareness of the law, and implement a cartel enforcement policy. For example, in Kenya a special compliance program for business associations was put in place for selected sectors so that business associations could review whether their statutes and
93
practices were in line with the competition law and commit to change their rules and practices if they
could facilitate anti-competitive behavior.45 Furthermore, the Competition Bureau of Canada and the UK Competition and Markets Authority, for example, produced a quick do’s and don’ts guide for business
associations.46 In the end, various stakeholders should cooperate in developing an effective competition policy plan that tackles the bottlenecks throughout the logistics value chain in Mindanao. Policymakers should address the bottlenecks previously discussed to ensure having competitive markets. The reform should tackle both rules and regulations that can facilitate non-competitive market outcomes and potential anti-competitive business practices. Based on international experience, pro-competitive reforms that occurred in the logistics value chain had a positive impact on the trading costs and the overall country
competitiveness.47 Hence, Table 29 sets an initial roadmap for the required pro-competitive policy reforms. Furthermore, the PCC should systematically be consulted prior to the enactment of any rules or regulations that may have an effect on competition, for example, through integrating a competition assessment under the regulatory impact assessment system led by the Anti-Red Tape Authority (ARTA). The PCC is required by the competition Law also to measure the impact of these regulations on the market and advocate for corrective measures whenever needed.
Conclusion Mindanao’s agricultural and industrial sectors remain a beacon of potential for the country. Among the three main island groups in the country, Mindanao has the best agro-climatic conditions for farm production, rightfully dubbed as the country’s food basket. A large share of the island group’s food products go to Luzon and Visayas and it also produces majority of the country’s high-value export crops such as pineapples and bananas. Moreover, while small and mostly involving the processing of raw materials and low-skilled manufacturing, the industrial sector is experiencing high growth relative to the rest of the country. These industries remain largely untapped. To realize its full structural transformation, Mindanao will require a more enabling policy environment and appropriate investment initiatives to overcome the constraints currently affecting its sustained growth, including issues with logistics.
Logistic issues continue to plague Mindanao, with issues occurring beyond problems with roads and transportation. Other than having inadequate roads and insufficient means of transportation, inefficient logistics services raise the cost of production to the detriment of smallholder farmers and SMEs. Among the specific logistics issues raised are the lack of storage areas, high freight and shipping cost, lack of consolidation hubs, and the complex permitting procedures to ensure compliance with sanitary and phytosanitary (SPS) and food safety requirements. While large growers such as Dole and Del Monte can internalize many of these costs, such logistics concerns are insurmountable to many smallholder farmers.
45 See, Competition Authority of Kenya (2016). Special compliance process report. Retrieved from https://www.cak.go.ke/images/docs/SCP-REPORT-NON-CONFIDENTIAL-FINAL.pdf. [accessed on 19.5.2019] 46 See, Competition Bureau of Canada, trade association dos and don’ts guide. Retrieved from https://www.competitionbureau.gc.ca/eic/site/cb-bc.nsf/vwapj/cb-pam-trade-asso-e.pdf/$FILE/cb-pam-trade-asso-e.pdf [accessed on 19.5.2019]; UK Competition and Markets Authority (2014). Competition law: dos and don'ts for trade associations. Retrieved from https://www.gov.uk/government/publications/competition-law-dos-and-donts-for-trade-associations. [accessed on 19.5.2019] 47 See, Dutz, M. et al. (1999). Regulatory Reform, Competition, and Innovation: A Case Study of the Mexican Road Freight Industry. The World Bank.; Teravaninthorn, S., & Raballand, G. (2008). Transport Prices and Costs in Africa: A Review of the International Corridors. The World Bank.
94
In the agriculture sector, logistics issues are more concerning at the farm level and these can be summarized as lack of market information, double handling and spoilage, and quality control. The lack of adequate market information results in farmers surrendering any bargaining power they have, reducing them to the role of price takers in transactions with traders. This hampers their ability to respond to market demand and brings about fluctuating prices and inefficient production planning. As this affects supply, so does the amount of waste along the value chain. Double handing increases opportunities for spoilage and this generally arises with the lack of trust among players along the value chain. This then contributes to the inconsistent quality of products which prevents farmers from reaching high-end domestic buyers or the export market. Mechanisms to better organize the value chain include the presence of cooperatives and lead firms, the formation of productive alliances, and taking advantage of advanced technology. Having a cooperative or a lead firm can address some of the logistic inefficiencies along a value chain as they can take on the role of organizing players and closing the gaps between activities. In other words, they can internalize many of the problems along typical chains and act as a conduit to address the issue of trust among stakeholders. They also act as a ready market and may draw in investments or buy-ins from other institutions. Productive alliances can similarly address issues of trust as well as provide additional technical, business development, and investment support. Advanced technology can improve efficiency and provide technological solutions to logistic problems. Regarding the industrial sector, there is potential for a strong industrial base and room for greater consolidation. Mindanao’s industrial sector has grown over the past couple of years, surpassing the national average and outpacing Luzon and Visayas. Notably, much of this manufacturing is very resource-based and has yet to advance to high-skill products. Production is also dispersed across four city ports, with opportunities for firms if the island can be seen as a single market and producer. It is logistically divided into four different urban centers, namely Cagayan de Oro, Davao, General Santos and Zamboanga, which are unfortunately treated as separate markets to serve, with factories serving different poles rather than as a unified market. Thus not only does the industrial sector have the room to grow, but the region’s potential as a ready single market can be transformative as there is room for consolidation. Firms can benefit from scale and trigger a virtuous cycle of requiring more capital (trucks) and investment, encouraging growth in industry. Relative to Luzon, Mindanao has tremendous advantages due to the absence of road and traffic congestion that plagues Manila logistics and can benefit from local innovative measures to promote private sector investment. As mentioned, manufacturing industries cluster around distant major cities in Mindanao while in Luzon, they gather in contiguous regions connected by major expressways. When in fact Mindanao has a more advantageous spatial distribution given cities are distributed more uniformly across the region which allows for inter-city movements. Logistic infrastructure in Mindanao is relatively better than Luzon (i.e. wider roads and less traffic) and with timely investments can avoid repeating some of Manilas’ mistakes. Currently, Mindanao ports are near their container yards, there is a backhaul of trade, there is no number coding scheme, cities have bypass roads, and compared to Luzon, Mindanao has lower inter-urban traffic. Investments to ensure the continuous flow of goods before congestion occurs can better enable industrial growth in the region. Investments in logistics can be deterred by complex regulatory procedures, and three characteristics of the regulatory system affect Mindanao harder than most: centralized processing of paper-based requirements in Manila, annual renewal of permits, and the prevalence of local pass-through permits. Many logistics firms face processes that are lengthy and numerous in order to do business, but firms
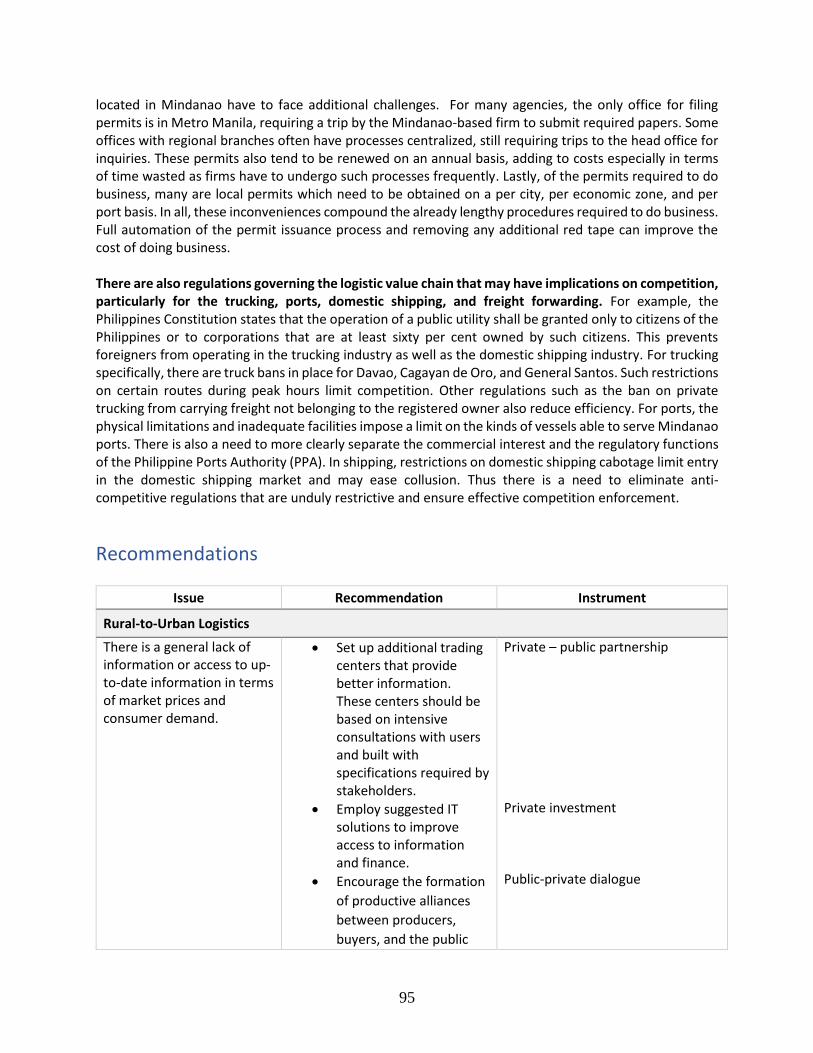
95
located in Mindanao have to face additional challenges. For many agencies, the only office for filing permits is in Metro Manila, requiring a trip by the Mindanao-based firm to submit required papers. Some offices with regional branches often have processes centralized, still requiring trips to the head office for inquiries. These permits also tend to be renewed on an annual basis, adding to costs especially in terms of time wasted as firms have to undergo such processes frequently. Lastly, of the permits required to do business, many are local permits which need to be obtained on a per city, per economic zone, and per port basis. In all, these inconveniences compound the already lengthy procedures required to do business. Full automation of the permit issuance process and removing any additional red tape can improve the cost of doing business. There are also regulations governing the logistic value chain that may have implications on competition, particularly for the trucking, ports, domestic shipping, and freight forwarding. For example, the Philippines Constitution states that the operation of a public utility shall be granted only to citizens of the Philippines or to corporations that are at least sixty per cent owned by such citizens. This prevents foreigners from operating in the trucking industry as well as the domestic shipping industry. For trucking specifically, there are truck bans in place for Davao, Cagayan de Oro, and General Santos. Such restrictions on certain routes during peak hours limit competition. Other regulations such as the ban on private trucking from carrying freight not belonging to the registered owner also reduce efficiency. For ports, the physical limitations and inadequate facilities impose a limit on the kinds of vessels able to serve Mindanao ports. There is also a need to more clearly separate the commercial interest and the regulatory functions of the Philippine Ports Authority (PPA). In shipping, restrictions on domestic shipping cabotage limit entry in the domestic shipping market and may ease collusion. Thus there is a need to eliminate anti-competitive regulations that are unduly restrictive and ensure effective competition enforcement.
Recommendations
Issue Recommendation Instrument
Rural-to-Urban Logistics
There is a general lack of information or access to up-to-date information in terms of market prices and consumer demand.
• Set up additional trading centers that provide better information. These centers should be based on intensive consultations with users and built with specifications required by stakeholders.
• Employ suggested IT solutions to improve access to information and finance.
• Encourage the formation
of productive alliances
between producers,
buyers, and the public
Private – public partnership Private investment Public-private dialogue
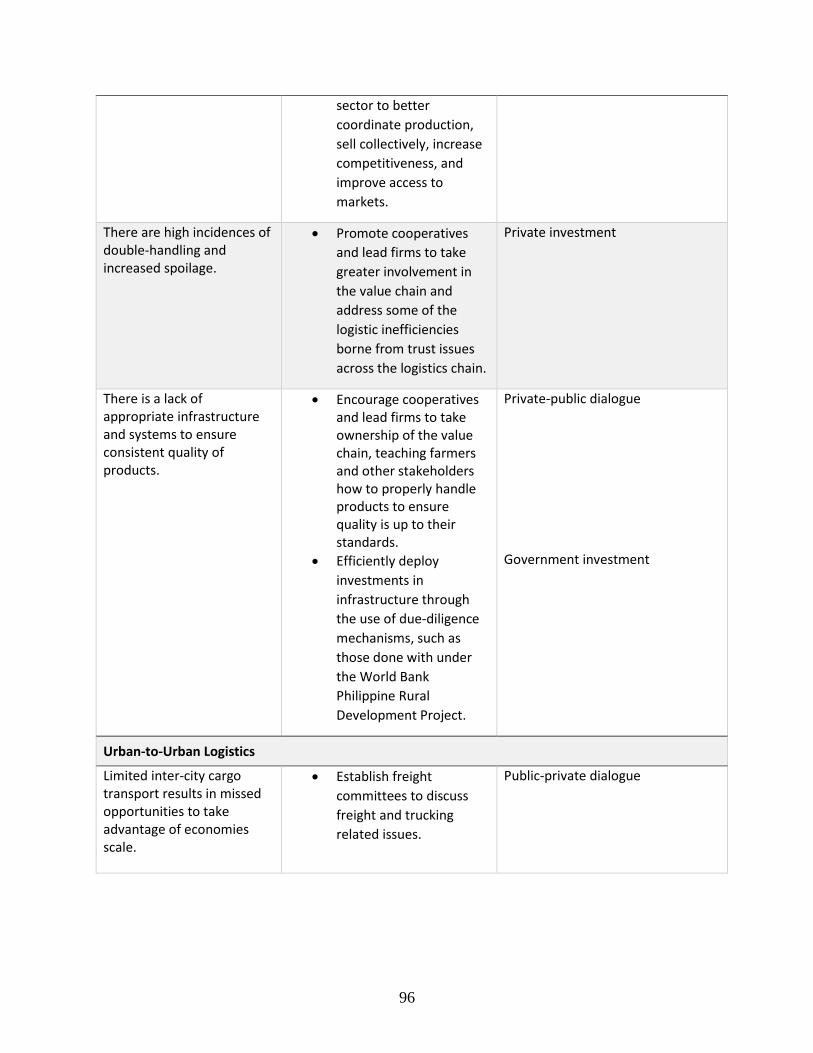
96
sector to better
coordinate production,
sell collectively, increase
competitiveness, and
improve access to
markets.
There are high incidences of double-handling and increased spoilage.
• Promote cooperatives
and lead firms to take
greater involvement in
the value chain and
address some of the
logistic inefficiencies
borne from trust issues
across the logistics chain.
Private investment
There is a lack of appropriate infrastructure and systems to ensure consistent quality of products.
• Encourage cooperatives and lead firms to take ownership of the value chain, teaching farmers and other stakeholders how to properly handle products to ensure quality is up to their standards.
• Efficiently deploy
investments in
infrastructure through
the use of due-diligence
mechanisms, such as
those done with under
the World Bank
Philippine Rural
Development Project.
Private-public dialogue Government investment
Urban-to-Urban Logistics
Limited inter-city cargo transport results in missed opportunities to take advantage of economies scale.
• Establish freight
committees to discuss
freight and trucking
related issues.
Public-private dialogue
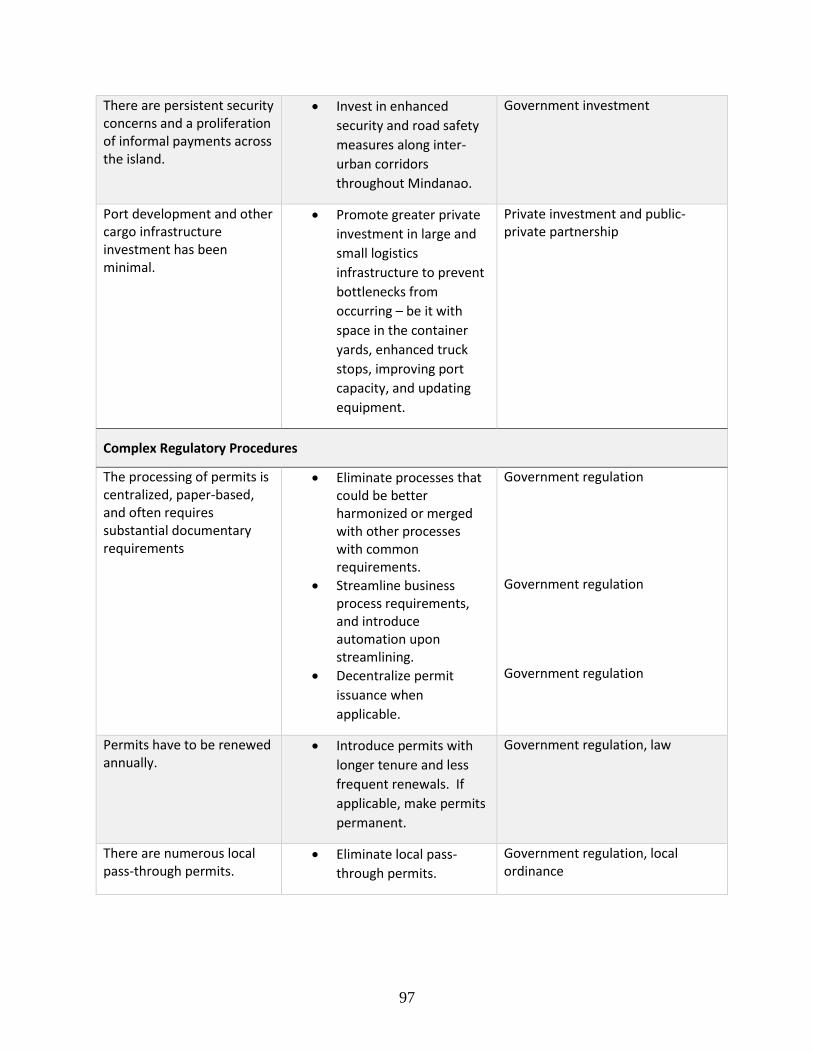
97
There are persistent security concerns and a proliferation of informal payments across the island.
• Invest in enhanced
security and road safety
measures along inter-
urban corridors
throughout Mindanao.
Government investment
Port development and other cargo infrastructure investment has been minimal.
• Promote greater private
investment in large and
small logistics
infrastructure to prevent
bottlenecks from
occurring – be it with
space in the container
yards, enhanced truck
stops, improving port
capacity, and updating
equipment.
Private investment and public-private partnership
Complex Regulatory Procedures
The processing of permits is centralized, paper-based, and often requires substantial documentary requirements
• Eliminate processes that could be better harmonized or merged with other processes with common requirements.
• Streamline business process requirements, and introduce automation upon streamlining.
• Decentralize permit
issuance when
applicable.
Government regulation Government regulation Government regulation
Permits have to be renewed annually.
• Introduce permits with
longer tenure and less
frequent renewals. If
applicable, make permits
permanent.
Government regulation, law
There are numerous local pass-through permits.
• Eliminate local pass-
through permits.
Government regulation, local ordinance
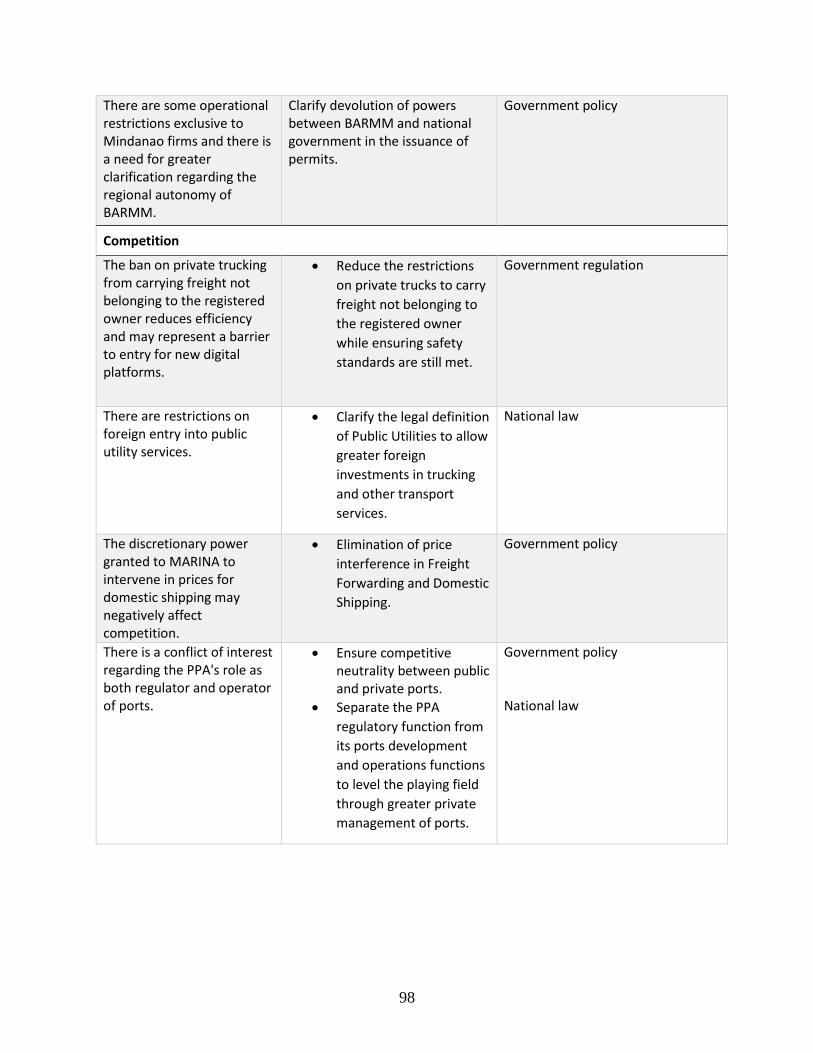
98
There are some operational restrictions exclusive to Mindanao firms and there is a need for greater clarification regarding the regional autonomy of BARMM.
Clarify devolution of powers between BARMM and national government in the issuance of permits.
Government policy
Competition
The ban on private trucking from carrying freight not belonging to the registered owner reduces efficiency and may represent a barrier to entry for new digital platforms.
• Reduce the restrictions
on private trucks to carry
freight not belonging to
the registered owner
while ensuring safety
standards are still met.
Government regulation
There are restrictions on foreign entry into public utility services.
• Clarify the legal definition
of Public Utilities to allow
greater foreign
investments in trucking
and other transport
services.
National law
The discretionary power granted to MARINA to intervene in prices for domestic shipping may negatively affect competition.
• Elimination of price
interference in Freight
Forwarding and Domestic
Shipping.
Government policy
There is a conflict of interest regarding the PPA's role as both regulator and operator of ports.
• Ensure competitive neutrality between public and private ports.
• Separate the PPA
regulatory function from
its ports development
and operations functions
to level the playing field
through greater private
management of ports.
Government policy National law

99
References Australian Center for International Agricultural Research (ACIAR). 2016. “Regional Market
Analysis for Selected Vegetables in the Southern Philippines Markets of Davao, Cebu, Ormoc and Tacloban.” Davao City.
Concepcion, S., Digal, L. N., & Uy, J. 2006. “Keys to Inclusion of Small Farmers in the Dynamic Vegetable Market: The Case of NorminVeggies in the Philippines.” London.
Development Academy of the Philippines. 2011. “Benguet Trading Center: Feasibility Study.” Benguet.
Digal, L. 2015. “The Growth of the Supermarket Phenomenon.” In Executive Forum on Food Security: Leaders in ASEAN Agriculture and Development. Los Banos.
Digal, L., and R. Montemayor. 2004. “The Philippine Vegetable Industry: Trends, Issues, and Implications.” In International Federation of Agricultural Producers, Regoverning Markets Program.
IFC. 2012. “Philippine Agribusiness Competitiveness and Benchmarking Study: Component on Trade Facilitation and Logistics.”
Laorden, N. L., Romo, G. A., Digal, L. N., Aguinaldo, R. T., Sarmiento, J. P., McClintock, A., & Orr, L. 2013. “Net Margins Analysis of Selected Fruits and Vegetables in Mindanao.” Davao City.
Malagos Chocolate. 2017. “2017 Academy of Chocolate Awards.” 2017. http://malagoschocolate.com/2017-academy-of-chocolate-awards-uk/.
Pelkmans-Balaoing, Annette. 2019. “Levelling the Playing Field for the Rural Poor through Inclusive Agricultural Value Chains.” Vol. UP CIDS Di.
Philippine Statistics Authority. 2018. “Other Crops: Volume of Production by Crop and Year.” 2018.
The World Bank. 2018. “Fostering Competition in the Philippines: The Challenge of Restrictive Regulations,” no. November. https://openknowledge.worldbank.org/handle/10986/31353.
UP Mindanao. 2016. “Regional Market Analysis for Selected Vegetables in the Southern Philippines Markets of Davao, Cebu, Ormoc and Tacloban.” Davao.
World Bank. n.d. “Comparative Study Investment Climate Shipping Industry in the Philippines and Indonesia.”
———. 2014. “Philippines: Ports for Enhanced Transport and Trade.” ———. 2016. “Linking Farmers to Markets through Productive Alliances An Assessment of the
World Bank Experience in Latin America.” ———. 2017a. “Doing Business 2018 : Reforming to Create Jobs.” Washington, DC.
http://documents.worldbank.org/curated/en/803361509607947633/Doing-Business-2018-Reforming-to-Create-Jobs.
———. 2017b. Philippines Mindanao Jobs Report: A Strategy of Mindanao Regional Development.
———. 2018. “Doing Business 2019 : Training for Reform (Vol. 2).” Washington, D.C.
100
Appendix
Methodologies used In addition to desk research and interviews with key informants, the team enlisted the help of consultants to gather new information to help assess logistics in Mindanao. This includes the production of value chain studies, network analysis, origin-destination surveys, a regulatory impact analysis, and the use of the World Bank group’s Markets Competition Policy Assessment Tool (MCPAT) to assess competition policy.
Rural-Urban Logistics
To better understand rural and urban logistics, the Logistics Chain Analysis (LCA) methodology was used to identify the bottlenecks that impact on the commercialization of locally-produced commodities in Mindanao. The LCA is a survey-based tool that helps identify where rural-urban logistics inefficiencies, from farm gate to the retail point in Mindanao, increase logistics expenses, travel times, and uncertainty. Two distinct agricultural commodity value chains were selected for the analysis (Vegetables and Cacao). For these case studies, deep-dive analysis and a comprehensive supply chain-based resource mapping were carried out. The analysis involved mapping the chain actors or players, their activities and functions and the marketing/logistics service requirements to bring the produce from the farm to the consumers. This helps examine specific regulatory bottlenecks or ‘soft issues’ affecting the post-harvest losses, trucking, consolidation, storing, and primary processing. The analysis subsequently identifies areas with room for improvement. Other elements in the chain such as information, technology, and structure particularly relevant to logistics were also examined.
In addition to collecting statistics specific to the agro-logistics value chain for the selected commodities, supplementary network mapping analysis was commissioned by the team to better understand the interaction between stakeholders along the value chain. Network maps are visual representations of a network that show relations between discrete objects. Examples of its popular applications include social network analysis, economic analysis, and epidemiology. In this paper, network maps (or network graphs) are used to represent cases from the vegetable and cacao value chains studied, particularly that of the Pamuhatan Farmers Association (PAFA).
Inter-city Logistics The report is one of two twin studies conducted on Mindanao Logistics, with both using similar data and analysis such as origin-destination (OD) surveys. As discussed, this report focuses on soft logistic issues while the second study focuses on physical infrastructure gaps in the network. Some data between the two studies overlap, and this includes the use of roadside commodity Origin-Destination interview
surveys. A freight assignment model was developed by consultants to convert commodity OD tables48 into vehicle trips. Further, freight vehicle trips were assigned to the road network together with passenger and private vehicle trips to get a realistic and comprehensive indication of the level of service of each road section. The Freight Interview Surveys (FIS) were conducted during the peak periods of each bagsakan, with periods ranging from 6 to 12 hours. Surveys were situated at the respected bagsakan centers for
48 The OD survey data was also converted into a Cube software model to compute 20-year traffic projections which were used to identify priority road projects. These will be discussed in the twin study of this report.

101
Davao City, General Santos City and Cagayan de Oro City. The exact locations of the surveys are as follows: Bankerohan (Davao City), General Santos Bagsakan Market (General Santos City,) and Bulua Market (Cagayan de Oro City).
Regulatory Impact Assessment (RIA)
A simplified RIA approach was used to assess the regulatory inefficiencies found in the logistic sector in Mindanao. The chapter on regulation and licensing simplification aims to review the requirements for compliance with business registration, transportation, storage, product quality certifications, and food safety regulations, as well as to measure their regulatory impact in inhibiting large scale commercial arrangements for farmers and entrepreneurs.
To quantify the current burdens of the private sector, a Standard Cost Model (SCM), an RIA tool, was applied to some of DTI’s permit issuances and accreditation procedures to calculate the regulatory compliance costs faced by applicants. The procedures and corresponding fees were identified, as well as those implicit steps and costs that a private sector firm goes through and incurs in the process of obtaining a DTI permit or accreditation.
The SCM is the most common formula to express administrative burdens in monetary terms. Administrative burdens are the costs of complying with information obligations stemming from government regulation. Examples of such obligations include gathering information, processing information, and submitting and filing reports. The SCM multiplies the costs of the activities that have to be carried out to meet information obligations (Price “P”) by the number of activities per year (Quantity “Q”) (see Figure 42).
Figure 42 - The Standard Cost Model Formula
Competition Assessment of Key Logistics Markets
In the fourth chapter of the report, the section assesses competition policy along the different segments of the logistics value chain in Mindanao using the Markets Competition Policy Assessment Tool (MCPAT). Building on the WBG’s MCPAT Transport Toolkit applied to Peru, Philippines and Vietnam (2018), the chapter conducts an expanded markets and competition diagnostic in key transport and logistics markets such as domestic trucking, infrastructure access, storage, freight forwarding, and other logistics sectors, with a more specific focus on Mindanao. It also identifies the regulatory barriers to competition including licenses, permits, clearances, infrastructure access rules, and registrations as well as other government interventions by agencies involved in the logistics of commodities, both agricultural and non-agricultural, that pose as barriers to entry and competition.
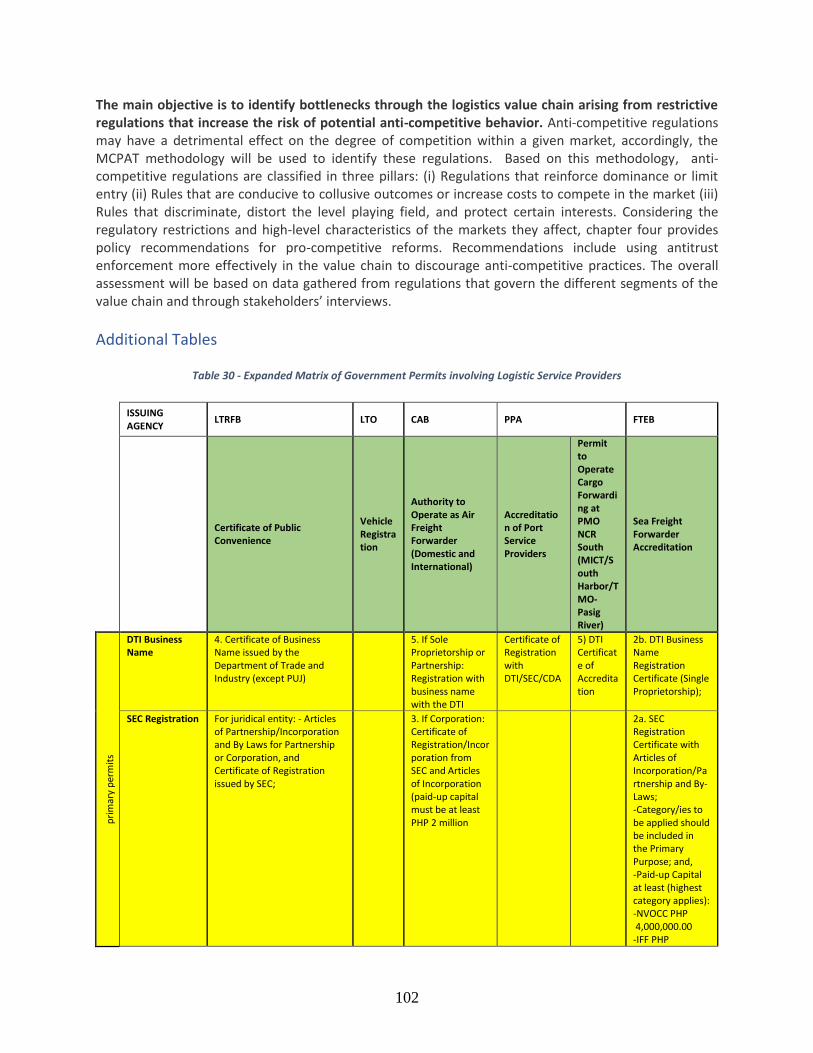
102
The main objective is to identify bottlenecks through the logistics value chain arising from restrictive regulations that increase the risk of potential anti-competitive behavior. Anti-competitive regulations may have a detrimental effect on the degree of competition within a given market, accordingly, the MCPAT methodology will be used to identify these regulations. Based on this methodology, anti-competitive regulations are classified in three pillars: (i) Regulations that reinforce dominance or limit entry (ii) Rules that are conducive to collusive outcomes or increase costs to compete in the market (iii) Rules that discriminate, distort the level playing field, and protect certain interests. Considering the regulatory restrictions and high-level characteristics of the markets they affect, chapter four provides policy recommendations for pro-competitive reforms. Recommendations include using antitrust enforcement more effectively in the value chain to discourage anti-competitive practices. The overall assessment will be based on data gathered from regulations that govern the different segments of the value chain and through stakeholders’ interviews.
Additional Tables
Table 30 - Expanded Matrix of Government Permits involving Logistic Service Providers
ISSUING AGENCY
LTRFB LTO CAB PPA FTEB
Certificate of Public Convenience
Vehicle Registration
Authority to Operate as Air Freight Forwarder (Domestic and International)
Accreditation of Port Service Providers
Permit to Operate Cargo Forwarding at PMO NCR South (MICT/South Harbor/TMO-Pasig River)
Sea Freight Forwarder Accreditation
pri
mar
y p
erm
its
DTI Business Name
4. Certificate of Business Name issued by the Department of Trade and Industry (except PUJ)
5. If Sole Proprietorship or Partnership: Registration with business name with the DTI
Certificate of Registration with DTI/SEC/CDA
5) DTI Certificate of Accreditation
2b. DTI Business Name Registration Certificate (Single Proprietorship);
SEC Registration For juridical entity: - Articles of Partnership/Incorporation and By Laws for Partnership or Corporation, and Certificate of Registration issued by SEC;
3. If Corporation: Certificate of Registration/Incorporation from SEC and Articles of Incorporation (paid-up capital must be at least PHP 2 million
2a. SEC Registration Certificate with Articles of Incorporation/Partnership and By-Laws; -Category/ies to be applied should be included in the Primary Purpose; and, -Paid-up Capital at least (highest category applies): -NVOCC PHP 4,000,000.00 -IFF PHP
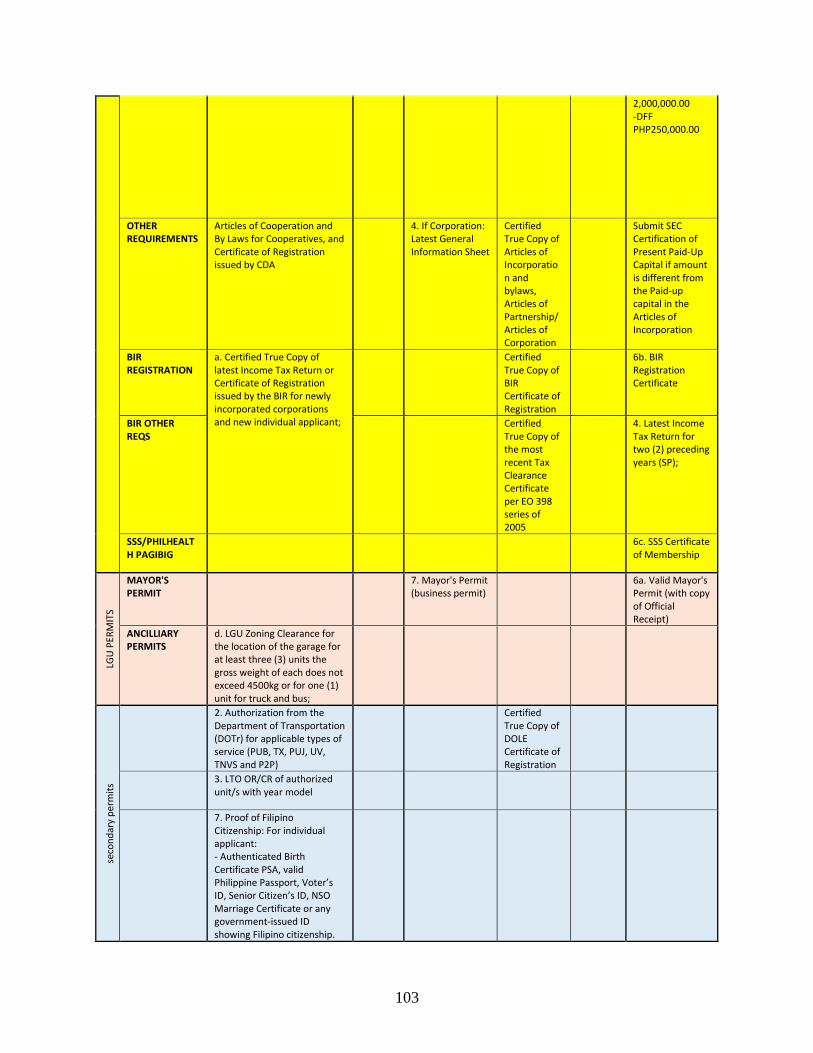
103
2,000,000.00 -DFF PHP250,000.00
OTHER REQUIREMENTS
Articles of Cooperation and By Laws for Cooperatives, and Certificate of Registration issued by CDA
4. If Corporation: Latest General Information Sheet
Certified True Copy of Articles of Incorporation and bylaws, Articles of Partnership/Articles of Corporation
Submit SEC Certification of Present Paid-Up Capital if amount is different from the Paid-up capital in the Articles of Incorporation
BIR REGISTRATION
a. Certified True Copy of latest Income Tax Return or Certificate of Registration issued by the BIR for newly incorporated corporations and new individual applicant;
Certified True Copy of BIR Certificate of Registration
6b. BIR Registration Certificate
BIR OTHER REQS
Certified True Copy of the most recent Tax Clearance Certificate per EO 398 series of 2005
4. Latest Income Tax Return for two (2) preceding years (SP);
SSS/PHILHEALTH PAGIBIG
6c. SSS Certificate of Membership
LGU
PER
MIT
S
MAYOR'S PERMIT
7. Mayor's Permit (business permit)
6a. Valid Mayor's Permit (with copy of Official Receipt)
ANCILLIARY PERMITS
d. LGU Zoning Clearance for the location of the garage for at least three (3) units the gross weight of each does not exceed 4500kg or for one (1) unit for truck and bus;
seco
nd
ary
pe
rmit
s
2. Authorization from the Department of Transportation (DOTr) for applicable types of service (PUB, TX, PUJ, UV, TNVS and P2P)
Certified True Copy of DOLE Certificate of Registration
3. LTO OR/CR of authorized unit/s with year model
7. Proof of Filipino Citizenship: For individual applicant: - Authenticated Birth Certificate PSA, valid Philippine Passport, Voter’s ID, Senior Citizen’s ID, NSO Marriage Certificate or any government-issued ID showing Filipino citizenship.
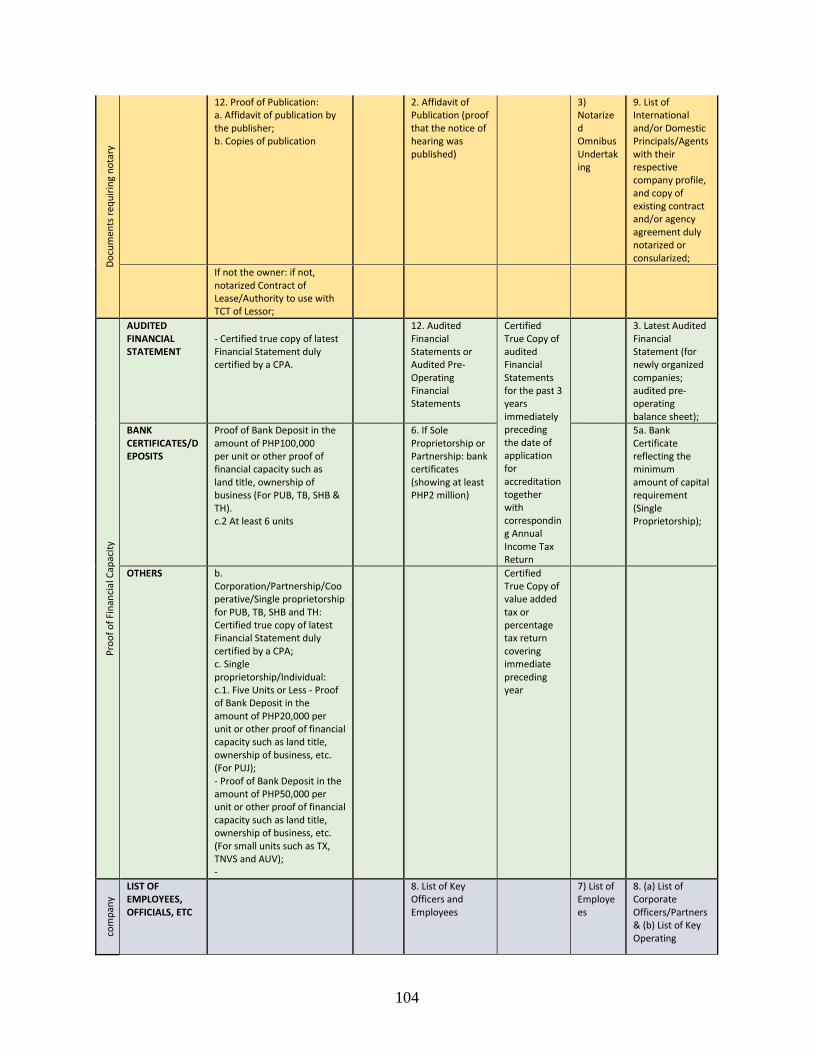
104
Do
cum
ents
req
uir
ing
no
tary
12. Proof of Publication:
a. Affidavit of publication by the publisher; b. Copies of publication
2. Affidavit of Publication (proof that the notice of hearing was published)
3) Notarized Omnibus Undertaking
9. List of International and/or Domestic Principals/Agents with their respective company profile, and copy of existing contract and/or agency agreement duly notarized or consularized;
If not the owner: if not, notarized Contract of Lease/Authority to use with TCT of Lessor;
Pro
of
of
Fin
anci
al C
apac
ity
AUDITED FINANCIAL STATEMENT
- Certified true copy of latest Financial Statement duly certified by a CPA.
12. Audited Financial Statements or Audited Pre-Operating Financial Statements
Certified True Copy of audited Financial Statements for the past 3 years immediately preceding the date of application for accreditation together with corresponding Annual Income Tax Return
3. Latest Audited Financial Statement (for newly organized companies; audited pre-operating balance sheet);
BANK CERTIFICATES/DEPOSITS
Proof of Bank Deposit in the amount of PHP100,000 per unit or other proof of financial capacity such as land title, ownership of business (For PUB, TB, SHB & TH). c.2 At least 6 units
6. If Sole Proprietorship or Partnership: bank certificates (showing at least PHP2 million)
5a. Bank Certificate reflecting the minimum amount of capital requirement (Single Proprietorship);
OTHERS b. Corporation/Partnership/Cooperative/Single proprietorship for PUB, TB, SHB and TH: Certified true copy of latest Financial Statement duly certified by a CPA; c. Single proprietorship/Individual: c.1. Five Units or Less - Proof of Bank Deposit in the amount of PHP20,000 per unit or other proof of financial capacity such as land title, ownership of business, etc. (For PUJ); - Proof of Bank Deposit in the amount of PHP50,000 per unit or other proof of financial capacity such as land title, ownership of business, etc. (For small units such as TX, TNVS and AUV); -
Certified True Copy of value added tax or percentage tax return covering immediate preceding year
com
pan
y p
rofi
le/i
nfo
LIST OF EMPLOYEES, OFFICIALS, ETC
8. List of Key Officers and Employees
7) List of Employees
8. (a) List of Corporate Officers/Partners & (b) List of Key Operating

105
Officers + (c) Biodata & Passport size picture of Corporate/Partners and Key Operating officers (d) at least 1 key officer should have at least 3 years’ experience in shipping, forwarding, and/or related activities & (e) Certification or proof of employment from previous employers.
OTHERS 6) List of Authorized signatories
7. Board Resolution, Partnership Resolution, or Authorization from proprietor (as applicable): -Authorizing the company to apply for accreditation, -Key officers authorized to sign documents relative to DTI-FTEB accreditation, follow-up, and receive the accreditation certificate;
LOCATION MAP/SKETCH OF OFFICE LOCATION
5. Sketch of Area of Operation
13. Location Map of Office;
oth
er r
equ
irem
ents
sp
eci
fic
to t
he
agen
cy
1. Four (4) copies of Verified Application alleging proof of citizenship and financial capacity with annexes and verification and certification of Non-Forum Shopping
3. Original Certificate of Stock Reported (CSR) for Electric Motor and Chassis
10. Lease contract of principal/branch office and warehouse if leased; Certificate of Ownership if owned
4) Customer Registration Form
10. Original House/Forwarder's Bill of Lading with company signing "as carrier", and at least 1 original Principal/Agent House/Forwarder's Bill of Lading (NVOCC);
10. LTFRB Inspection Report with picture of unit taken during inspection
4. Original PNP-HPG MV Clearance
11. Insurance Policy covering Office/Property (i.e. fire, comprehensive general liability, property and all-
15. Freight Tariff and transshipment fees (NVOCC); Domestic rates (DFF)
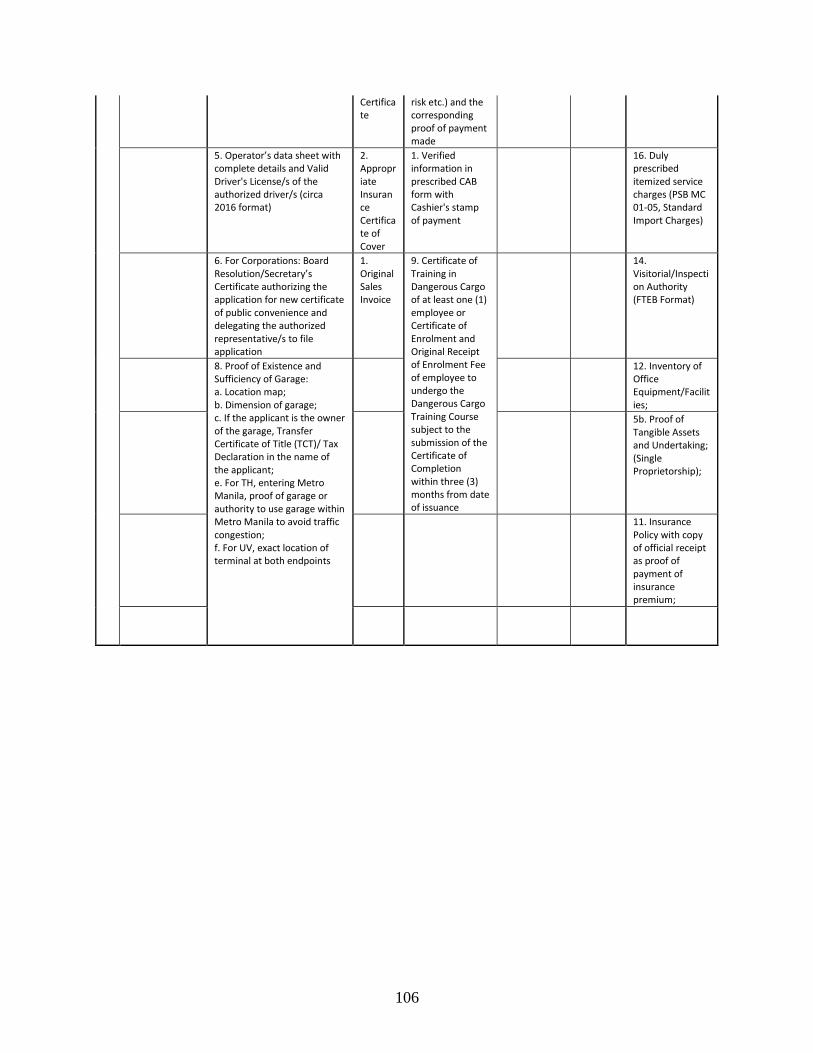
106
Certificate
risk etc.) and the corresponding proof of payment made
5. Operator’s data sheet with complete details and Valid Driver's License/s of the authorized driver/s (circa 2016 format)
2. Appropriate Insurance Certificate of Cover
1. Verified information in prescribed CAB form with Cashier's stamp of payment
16. Duly prescribed itemized service charges (PSB MC 01-05, Standard Import Charges)
6. For Corporations: Board Resolution/Secretary’s Certificate authorizing the application for new certificate of public convenience and delegating the authorized representative/s to file application
1. Original Sales Invoice
9. Certificate of Training in Dangerous Cargo of at least one (1) employee or Certificate of Enrolment and Original Receipt of Enrolment Fee of employee to undergo the Dangerous Cargo Training Course subject to the submission of the Certificate of Completion within three (3) months from date of issuance
14. Visitorial/Inspection Authority (FTEB Format)
8. Proof of Existence and Sufficiency of Garage: a. Location map; b. Dimension of garage; c. If the applicant is the owner of the garage, Transfer Certificate of Title (TCT)/ Tax Declaration in the name of the applicant; e. For TH, entering Metro Manila, proof of garage or authority to use garage within Metro Manila to avoid traffic congestion; f. For UV, exact location of terminal at both endpoints
12. Inventory of Office Equipment/Facilities;
5b. Proof of Tangible Assets and Undertaking; (Single Proprietorship);
11. Insurance Policy with copy of official receipt as proof of payment of insurance premium;