Embed Size (px)
Citation preview
Improving Merchandise/CategoryManagement Performancethrough Industry Benchmarking
Chris Verheuvel, Senior Vice President, SAP RetailGreg MacKinnon, Value Engineering Senior PrincipalMichael Met, Value Engineering Principal
October 23, 2007
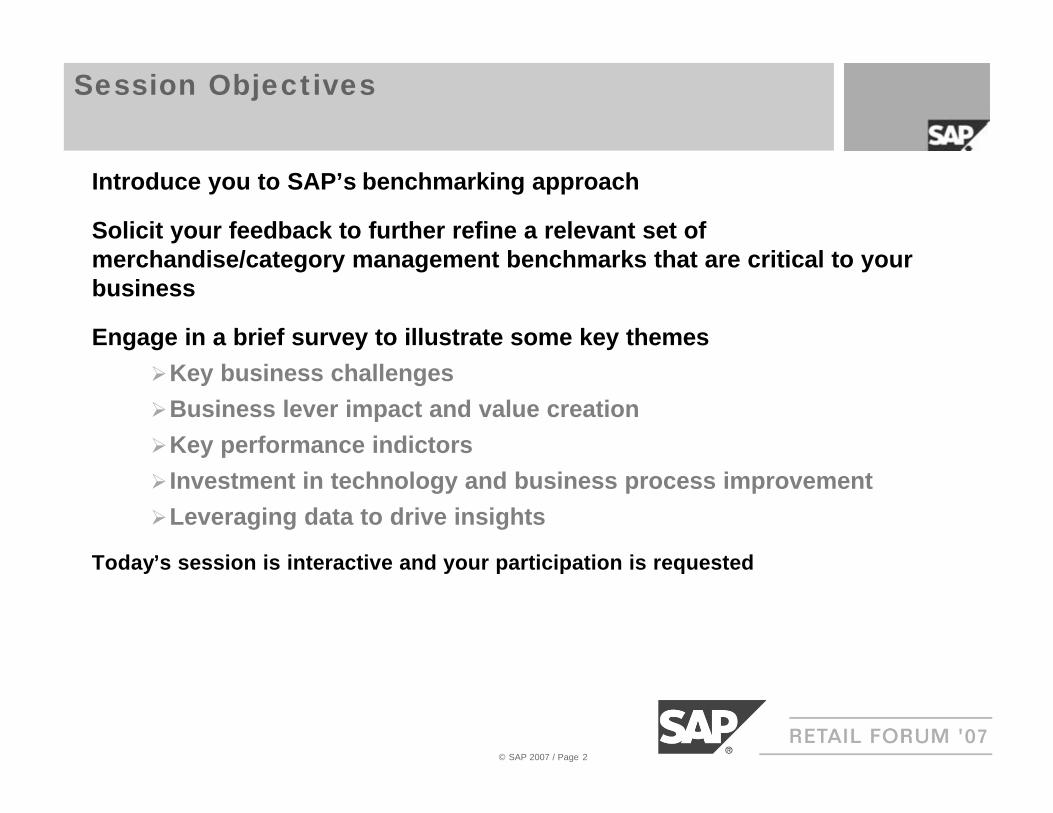
Session Objectives
Introduce you to SAP’s benchmarking approach
Solicit your feedback to further refine a relevant set of merchandise/category management benchmarks that are critical to your business
Engage in a brief survey to illustrate some key themesØKey business challengesØBusiness lever impact and value creationØKey performance indictorsØ Investment in technology and business process improvementØLeveraging data to drive insights
Today’s session is interactive and your participation is requested
© SAP 2007 / Page 2
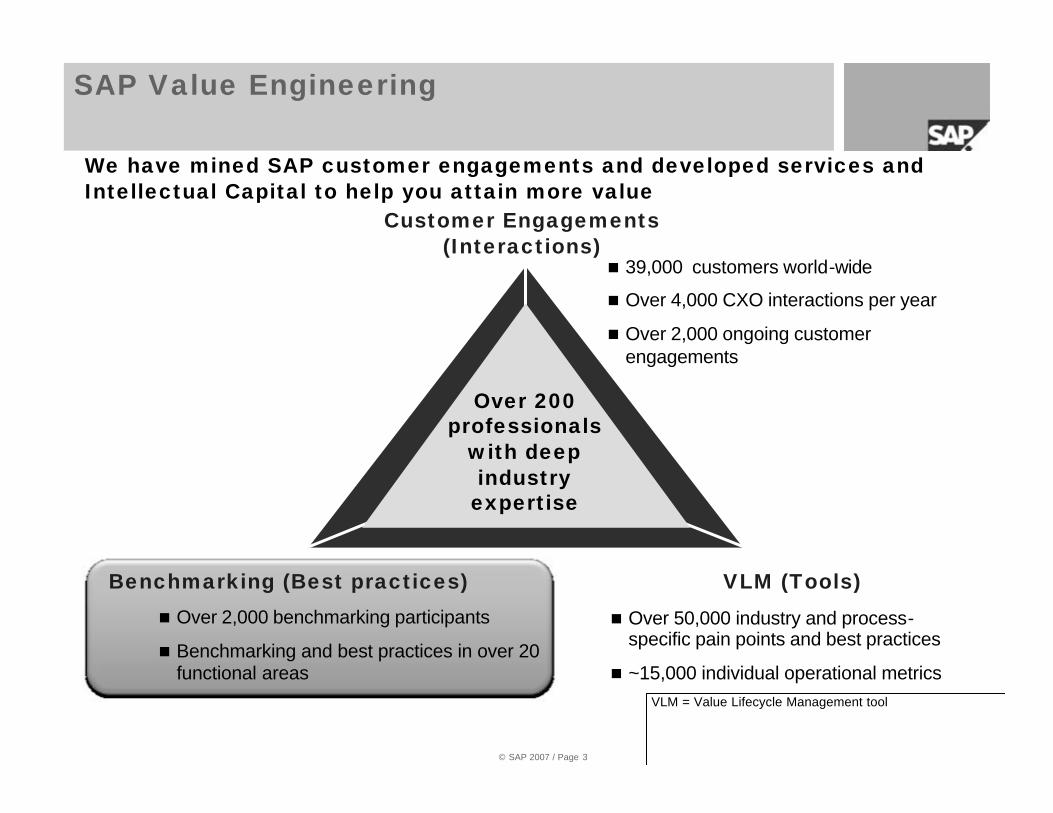
SAP Value Engineering
Benchmarking (Best practices) VLM (Tools)
Customer Engagements(Interactions)
n 39,000 customers world-wide
n Over 4,000 CXO interactions per year
n Over 2,000 ongoing customer engagements
n Over 2,000 benchmarking participants
n Benchmarking and best practices in over 20 functional areas
n Over 50,000 industry and process-specific pain points and best practices
n ~15,000 individual operational metrics
Over 200 professionals
with deep industry
expertise
We have mined SAP customer engagements and developed services and Intellectual Capital to help you attain more value
VLM = Value Lifecycle Management tool
© SAP 2007 / Page 3
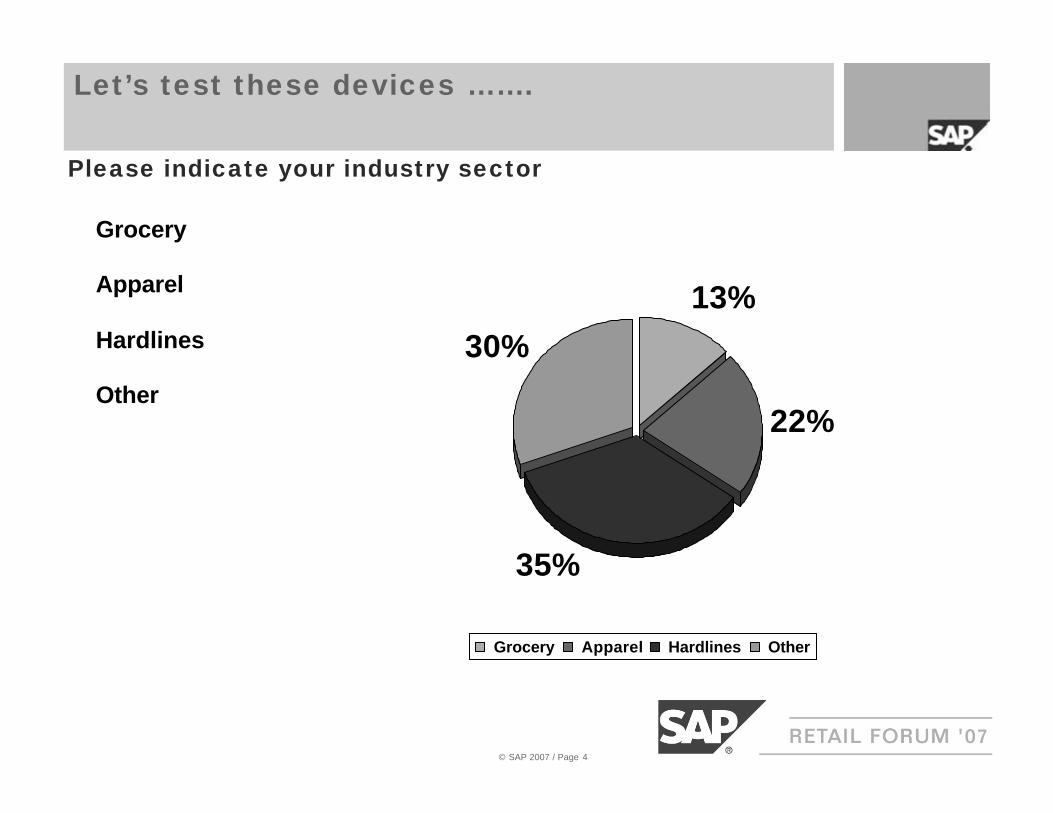
Please indicate your industry sector
Let’s test these devices …….
13%
22%
30%
35%
Grocery Apparel Hardlines Other
Grocery
Apparel
Hardlines
Other
© SAP 2007 / Page 4
What Does It Mean To Benchmark?
Definition:
To measure and compare various aspects of a business process against a specified standard or best practice in order to improve upon one’s own business process performance
© SAP 2007 / Page 5
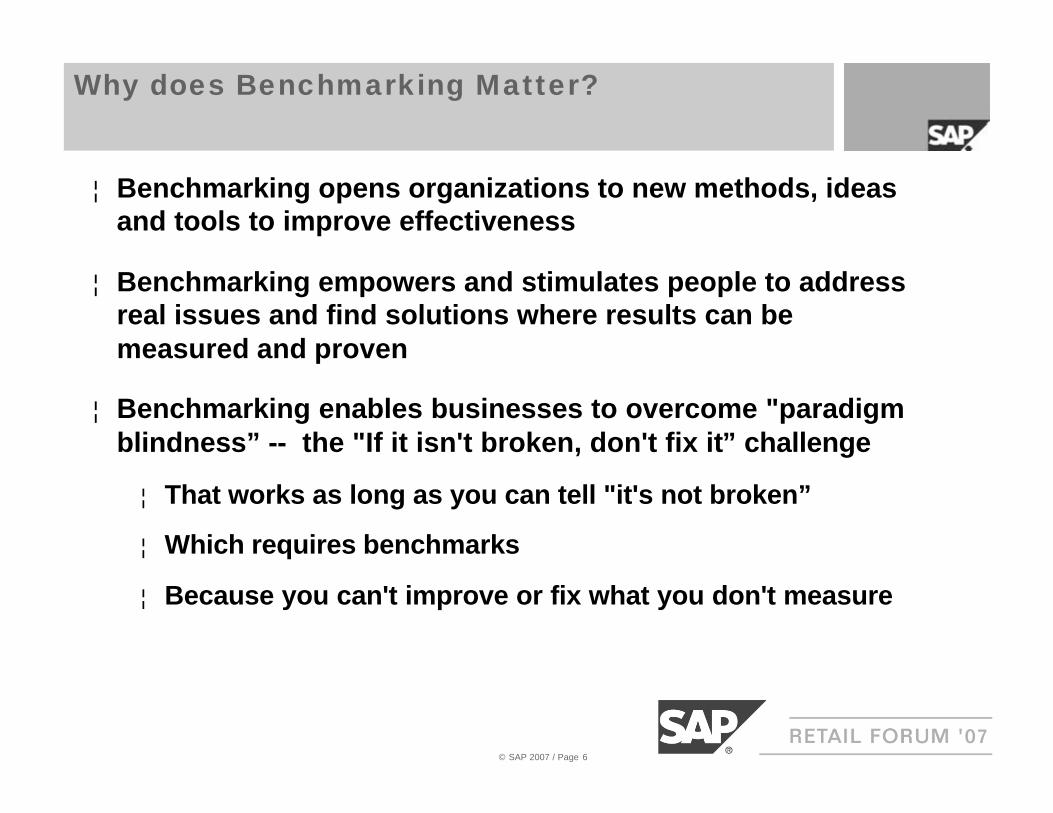
Why does Benchmarking Matter?
¦ Benchmarking opens organizations to new methods, ideas and tools to improve effectiveness
¦ Benchmarking empowers and stimulates people to address real issues and find solutions where results can be measured and proven
¦ Benchmarking enables businesses to overcome "paradigm blindness” -- the "If it isn't broken, don't fix it” challenge
¦ That works as long as you can tell "it's not broken”
¦ Which requires benchmarks
¦ Because you can't improve or fix what you don't measure
© SAP 2007 / Page 6
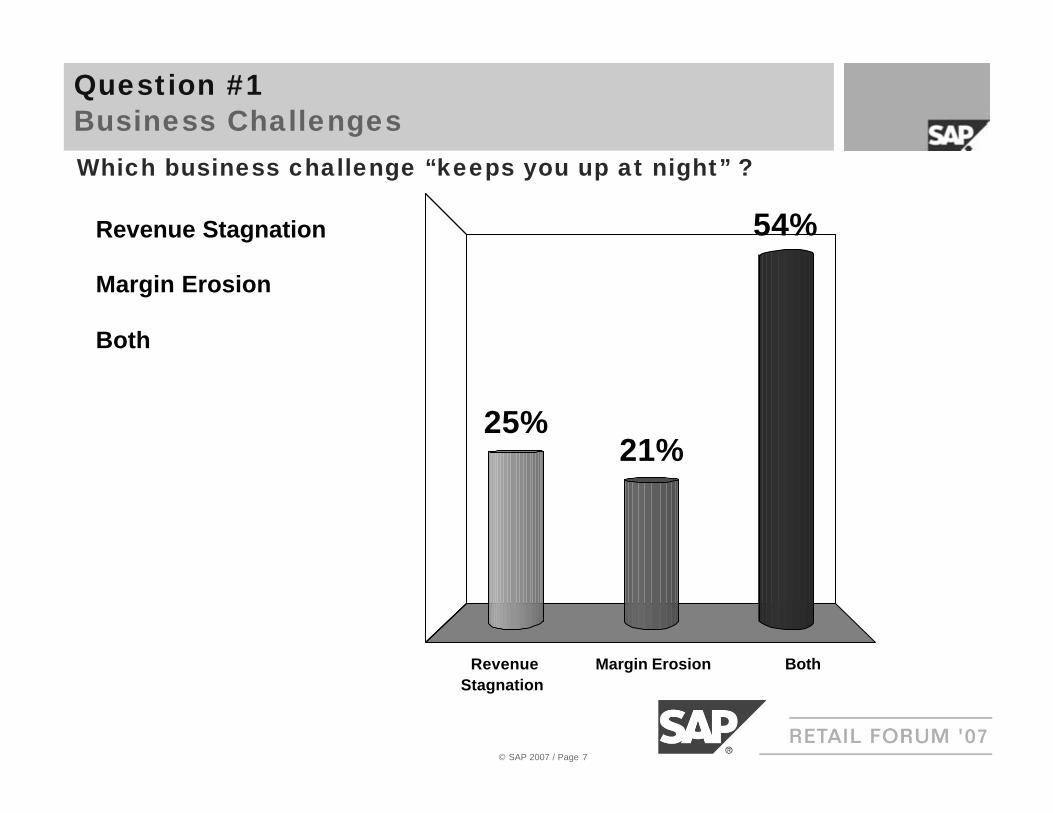
Which business challenge “keeps you up at night” ?
RevenueStagnation
Margin Erosion Both
25%
54%
21%
Revenue Stagnation
Margin Erosion
Both
Question #1Business Challenges
© SAP 2007 / Page 7
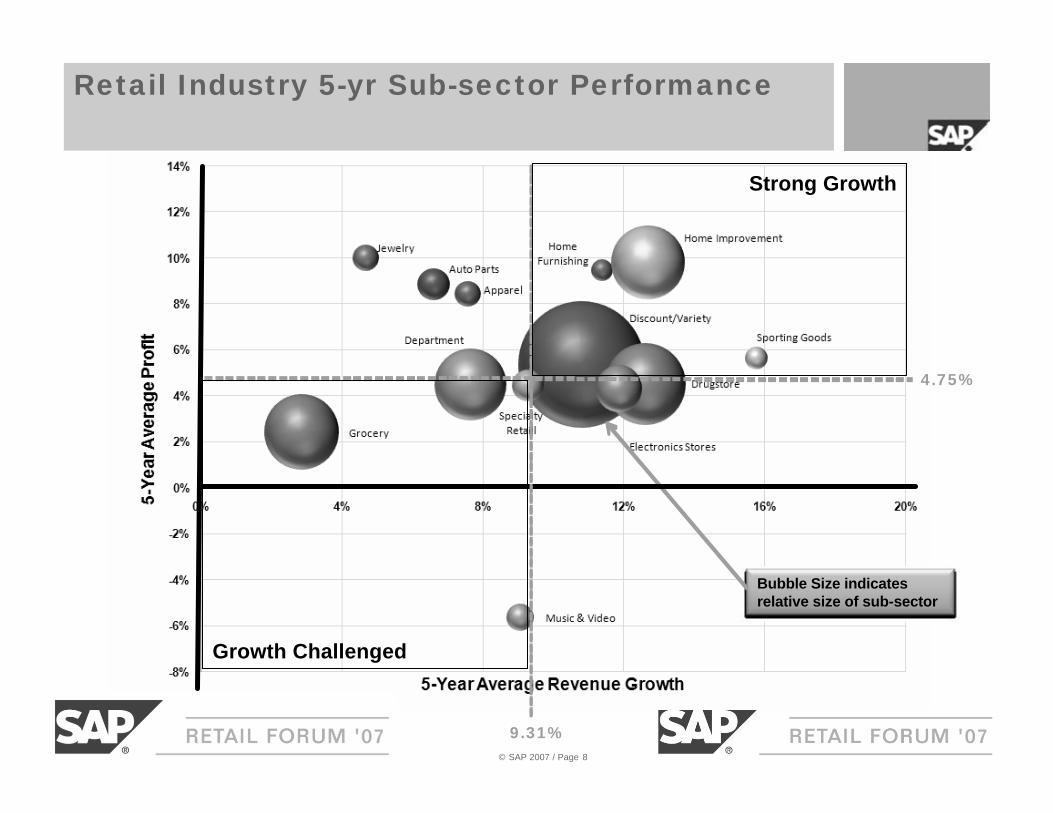
Retail Industry 5-yr Sub-sector Performance
Bubble Size indicates relative size of sub-sector
4.75%
9.31%
Strong Growth
Growth Challenged
© SAP 2007 / Page 8
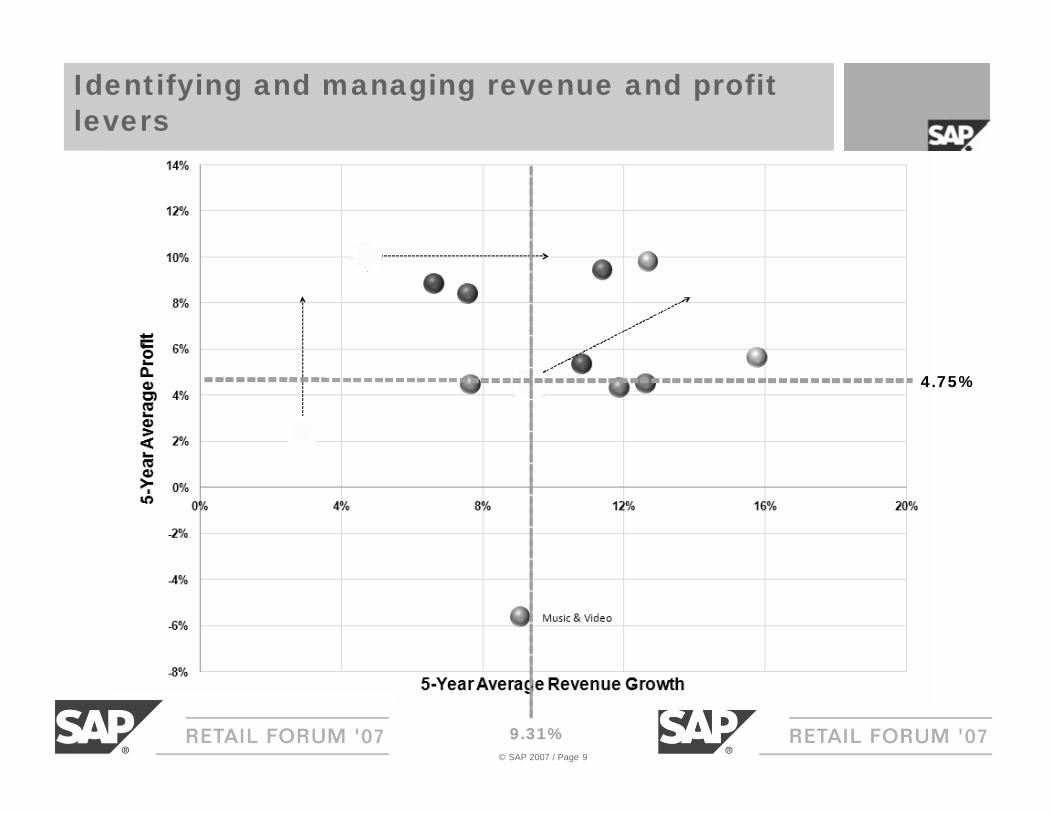
Identifying and managing revenue and profit levers
4.75%
9.31%© SAP 2007 / Page 9
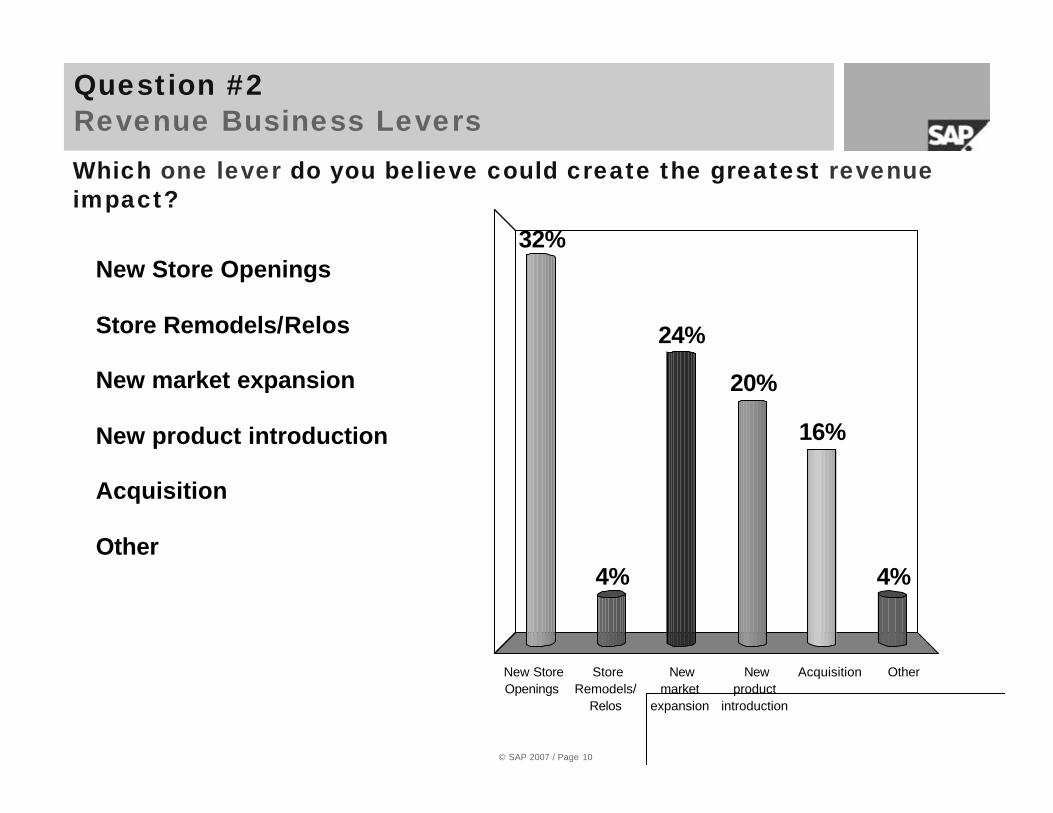
Which one lever do you believe could create the greatest revenueimpact?
Question #2Revenue Business Levers
New StoreOpenings
StoreRemodels/
Relos
Newmarket
expansion
Newproduct
introduction
Acquisition Other
32%
4% 4%
16%
20%
24%
New Store Openings
Store Remodels/Relos
New market expansion
New product introduction
Acquisition
Other
© SAP 2007 / Page 10
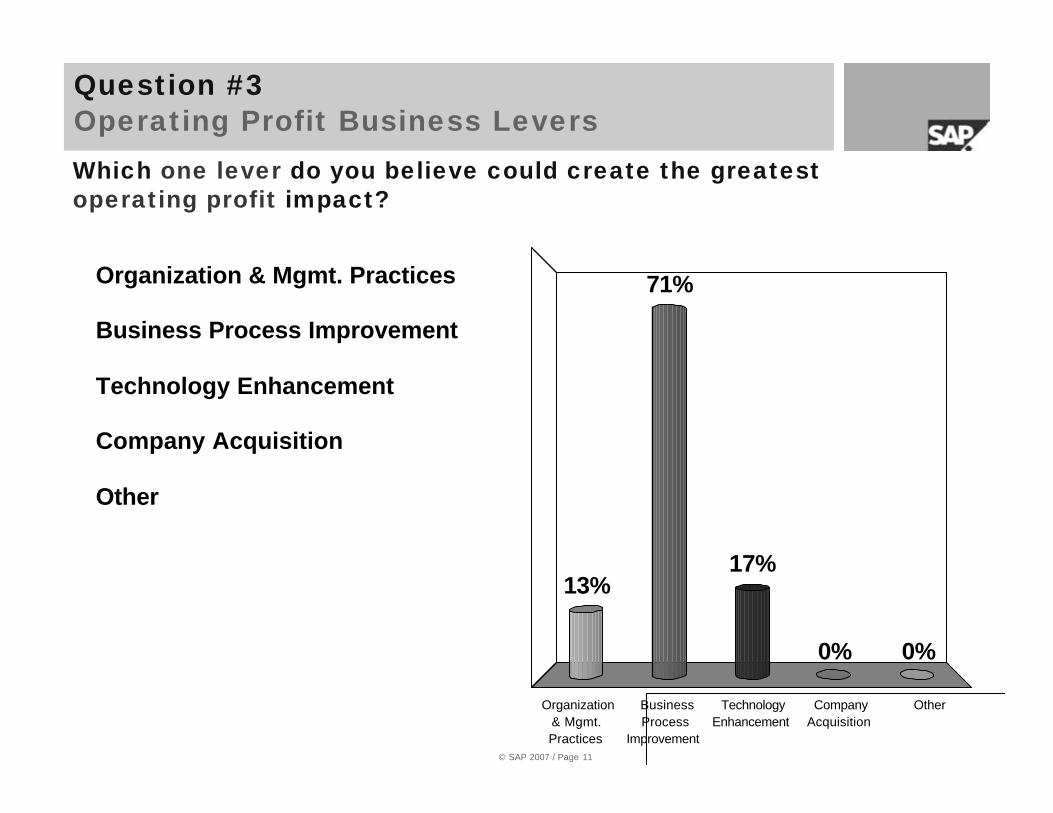
Which one lever do you believe could create the greatest operating profit impact?
Question #3Operating Profit Business Levers
Organization& Mgmt.Practices
BusinessProcess
Improvement
TechnologyEnhancement
CompanyAcquisition
Other
13%
71%
0%0%
17%
Organization & Mgmt. Practices
Business Process Improvement
Technology Enhancement
Company Acquisition
Other
© SAP 2007 / Page 11
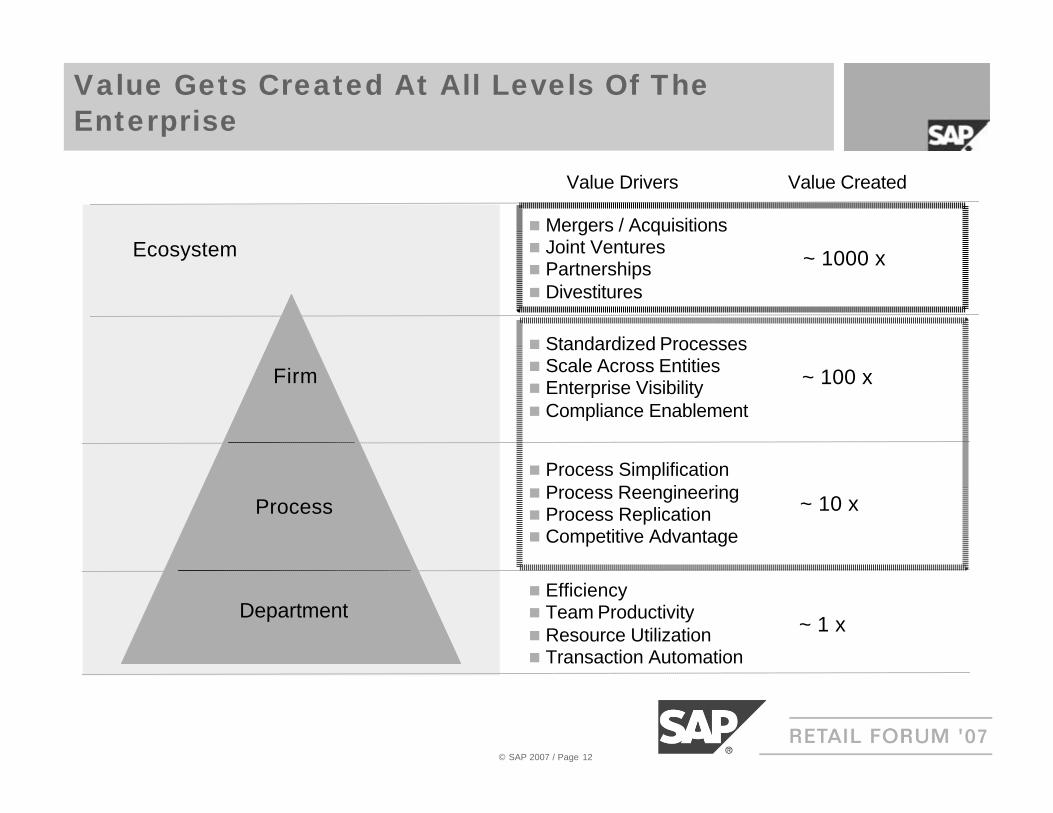
Value Gets Created At All Levels Of The Enterprise
Department
Process
Firm
Ecosystemn Mergers / Acquisitionsn Joint Venturesn Partnershipsn Divestitures
Value Drivers Value Created
~ 1 x
~ 10 x
~ 100 x
~ 1000 x
n Standardized Processesn Scale Across Entitiesn Enterprise Visibilityn Compliance Enablement
n Process Simplificationn Process Reengineeringn Process Replicationn Competitive Advantage
n Efficiencyn Team Productivityn Resource Utilizationn Transaction Automation
© SAP 2007 / Page 12
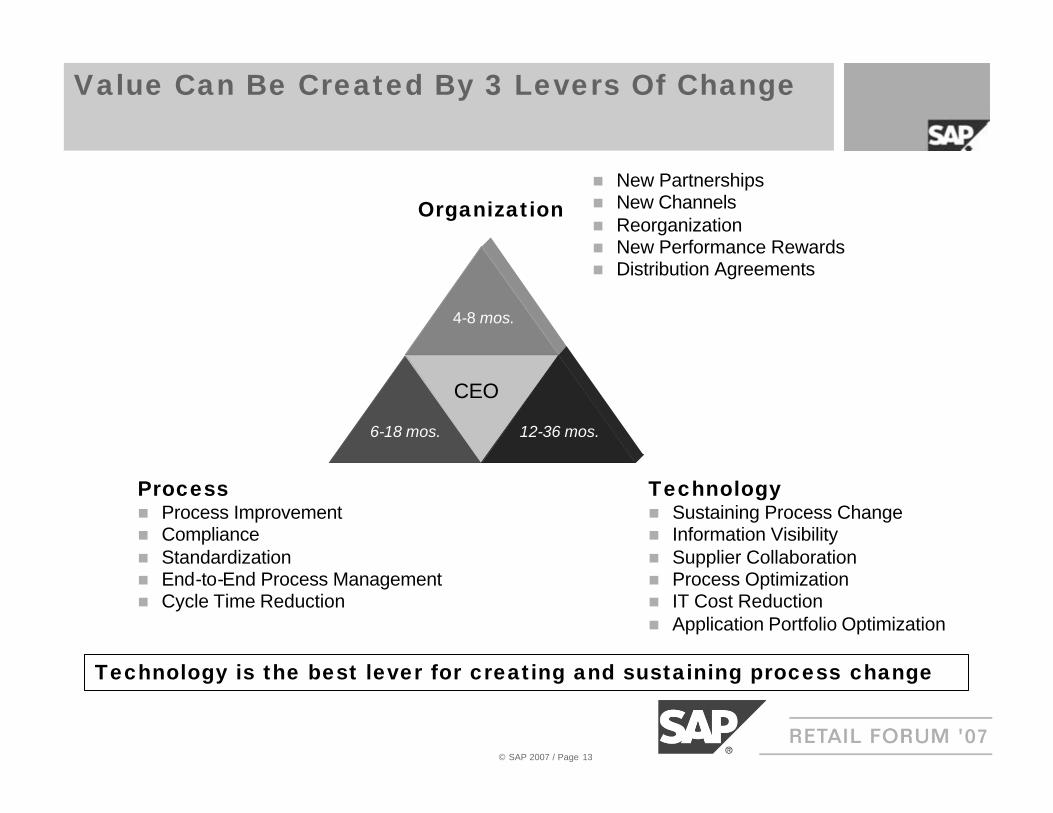
Value Can Be Created By 3 Levers Of Change
Organization
CEO
4-8 mos.
12-36 mos.6-18 mos.
Technologyn Sustaining Process Changen Information Visibilityn Supplier Collaborationn Process Optimizationn IT Cost Reductionn Application Portfolio Optimization
Processn Process Improvementn Compliancen Standardizationn End-to-End Process Managementn Cycle Time Reduction
Technology is the best lever for creating and sustaining process change
n New Partnershipsn New Channelsn Reorganizationn New Performance Rewardsn Distribution Agreements
© SAP 2007 / Page 13
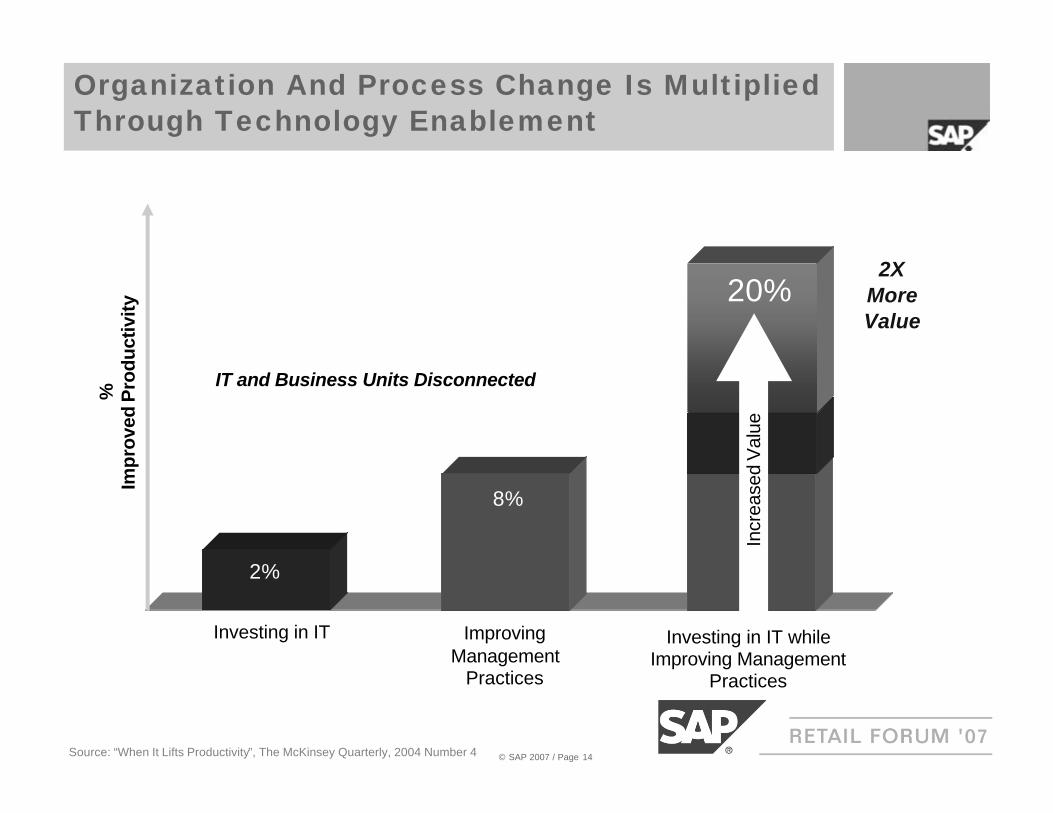
Improving Management
Practices
Investing in IT Investing in IT while Improving Management
Practices
2%
8%
%Im
prov
ed P
rodu
ctiv
ity
20%
Incr
ease
d V
alue
IT and Business Units Disconnected
2XMoreValue
Source: “When It Lifts Productivity”, The McKinsey Quarterly, 2004 Number 4
Organization And Process Change Is Multiplied Through Technology Enablement
© SAP 2007 / Page 14
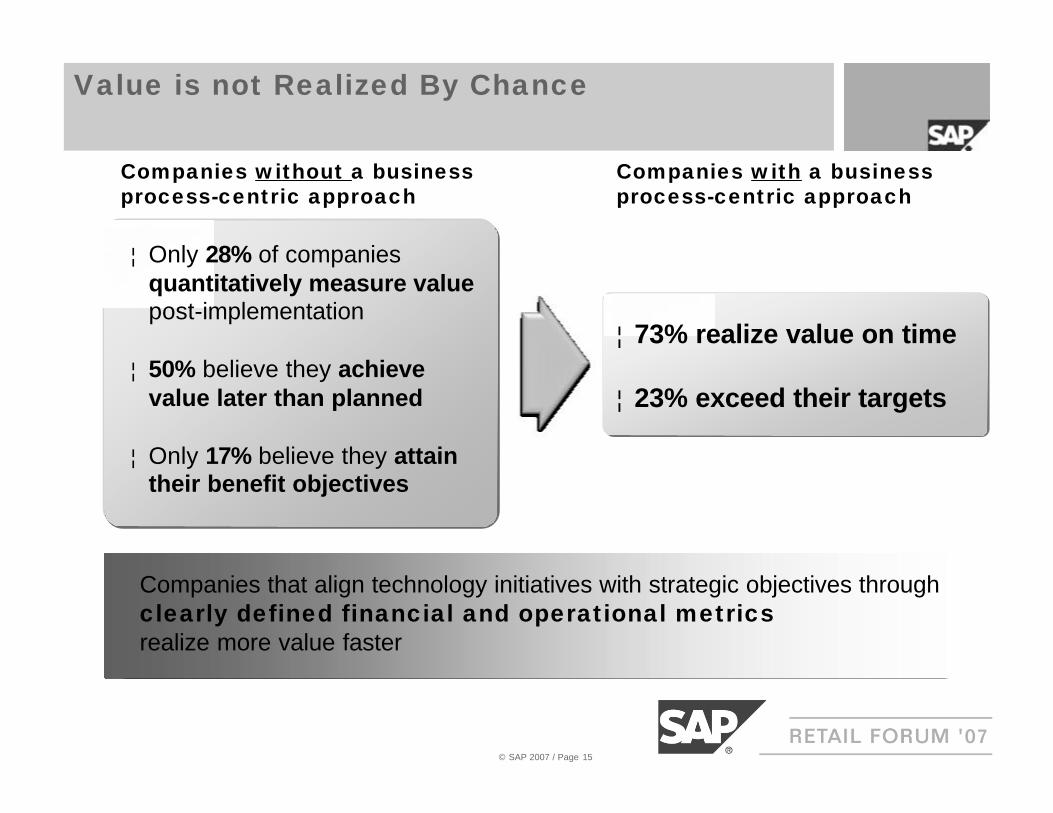
¦ Only 28% of companies quantitatively measure value post-implementation
¦ 50% believe they achieve value later than planned
¦ Only 17% believe they attain their benefit objectives
¦ 73% realize value on time
¦ 23% exceed their targets
Companies with a business process-centric approach
Companies without a business process-centric approach
Companies that align technology initiatives with strategic objectives through clearly defined financial and operational metricsrealize more value faster
Value is not Realized By Chance
© SAP 2007 / Page 15
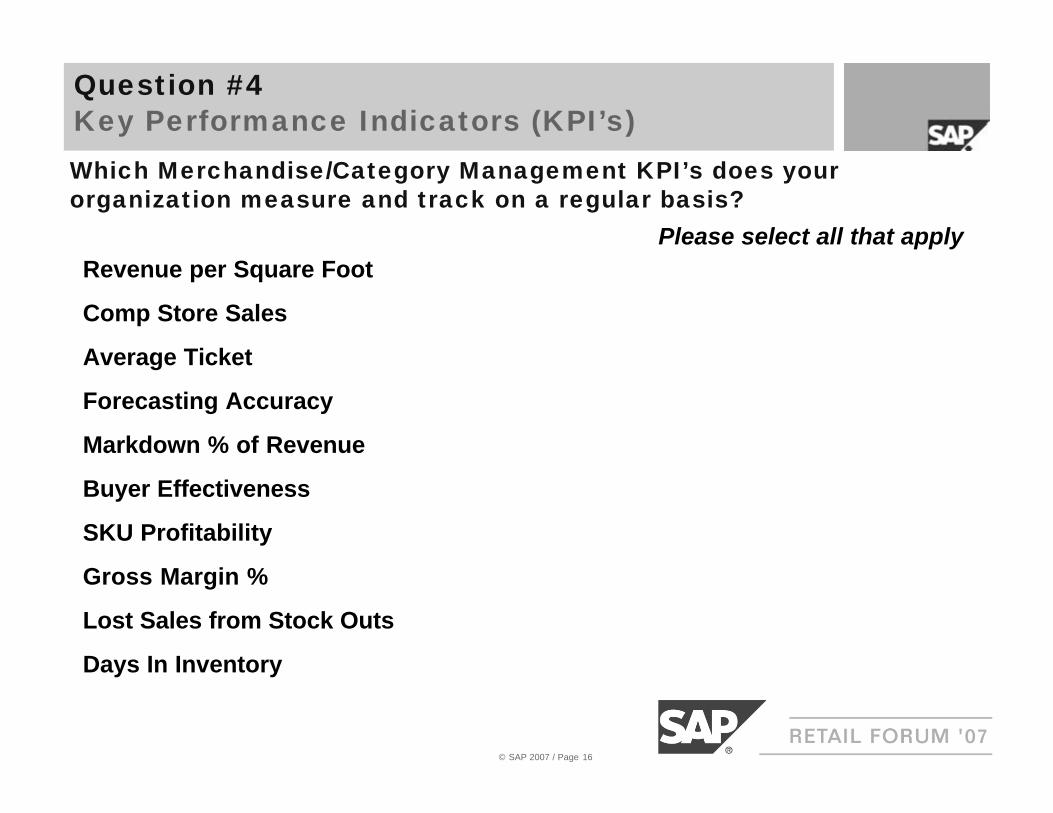
Which Merchandise/Category Management KPI’s does your organization measure and track on a regular basis?
Please select all that apply
Question #4Key Performance Indicators (KPI’s)
© SAP 2007 / Page 16
Revenue per Square Foot
Comp Store Sales
Average Ticket
Forecasting Accuracy
Markdown % of Revenue
Buyer Effectiveness
SKU Profitability
Gross Margin %
Lost Sales from Stock Outs
Days In Inventory
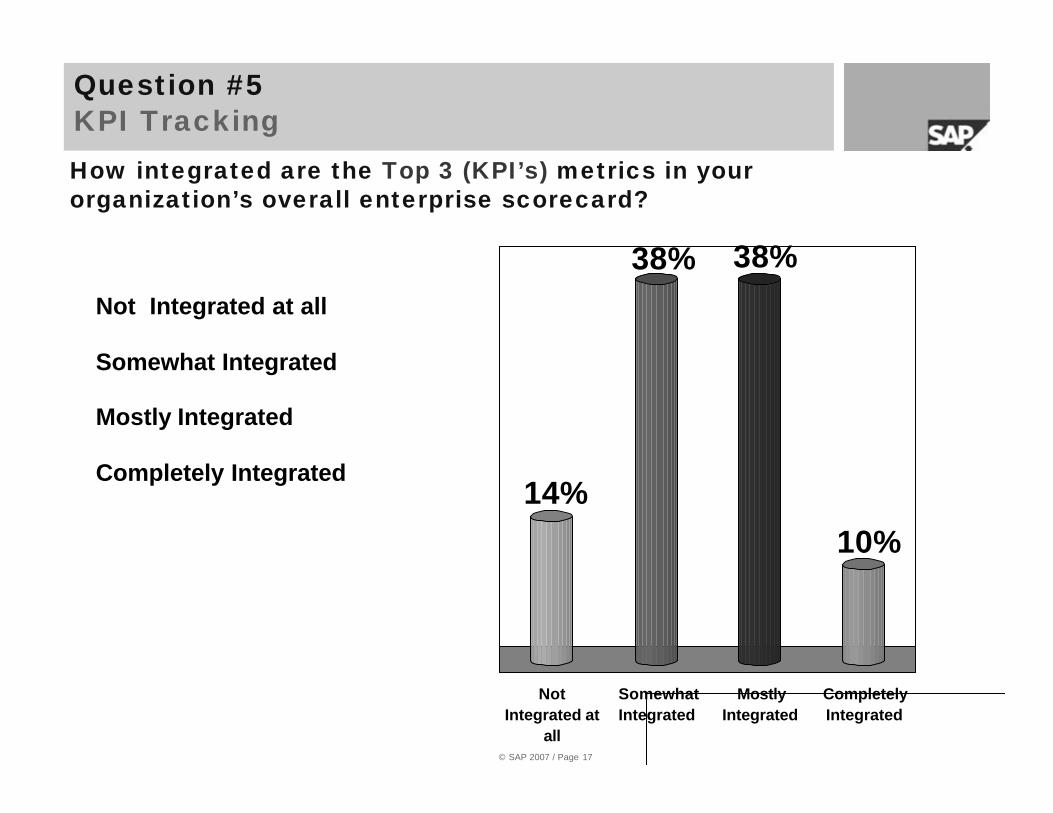
How integrated are the Top 3 (KPI’s) metrics in your organization’s overall enterprise scorecard?
Not Integrated at
all
SomewhatIntegrated
MostlyIntegrated
CompletelyIntegrated
14%
38% 38%
10%
Question #5KPI Tracking
© SAP 2007 / Page 17
Not Integrated at all
Somewhat Integrated
Mostly Integrated
Completely Integrated
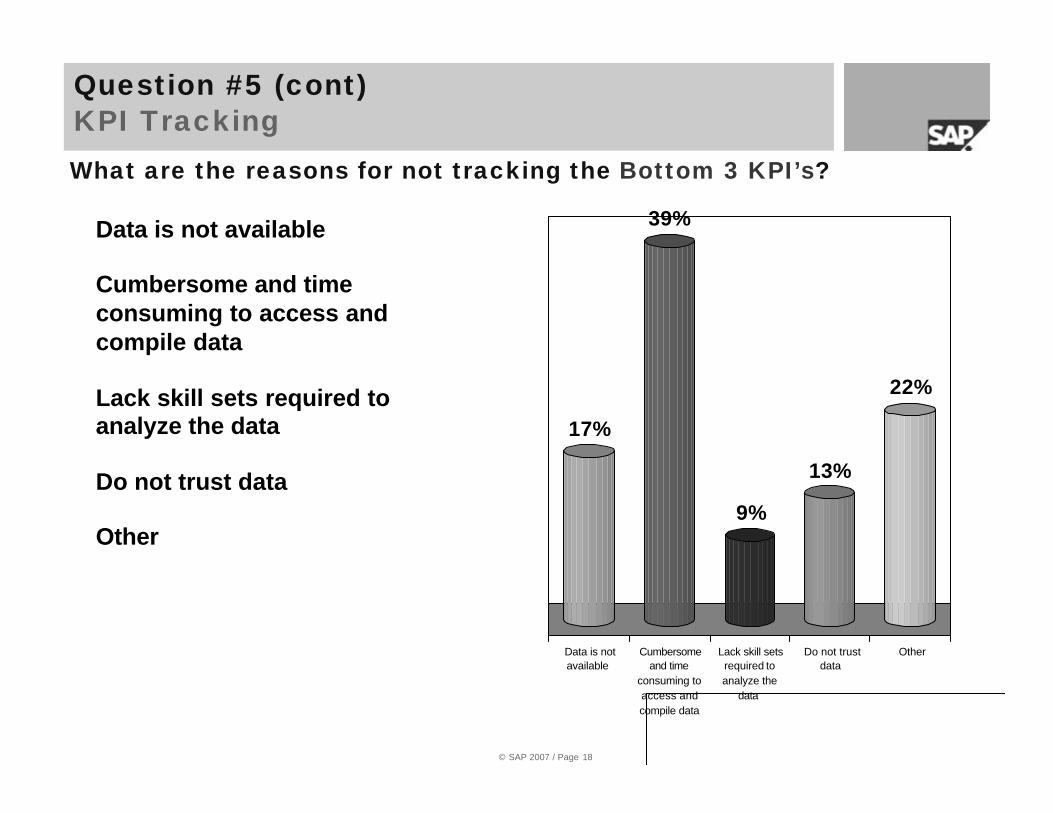
What are the reasons for not tracking the Bottom 3 KPI’s?
Data is notavailable
Cumbersomeand time
consuming toaccess andcompile data
Lack skill setsrequired toanalyze the
data
Do not trustdata
Other
17%
39%
9%
13%
22%
Data is not available
Cumbersome and time consuming to access and compile data
Lack skill sets required to analyze the data
Do not trust data
Other
Question #5 (cont)KPI Tracking
© SAP 2007 / Page 18
© SAP 2007 / Page 19
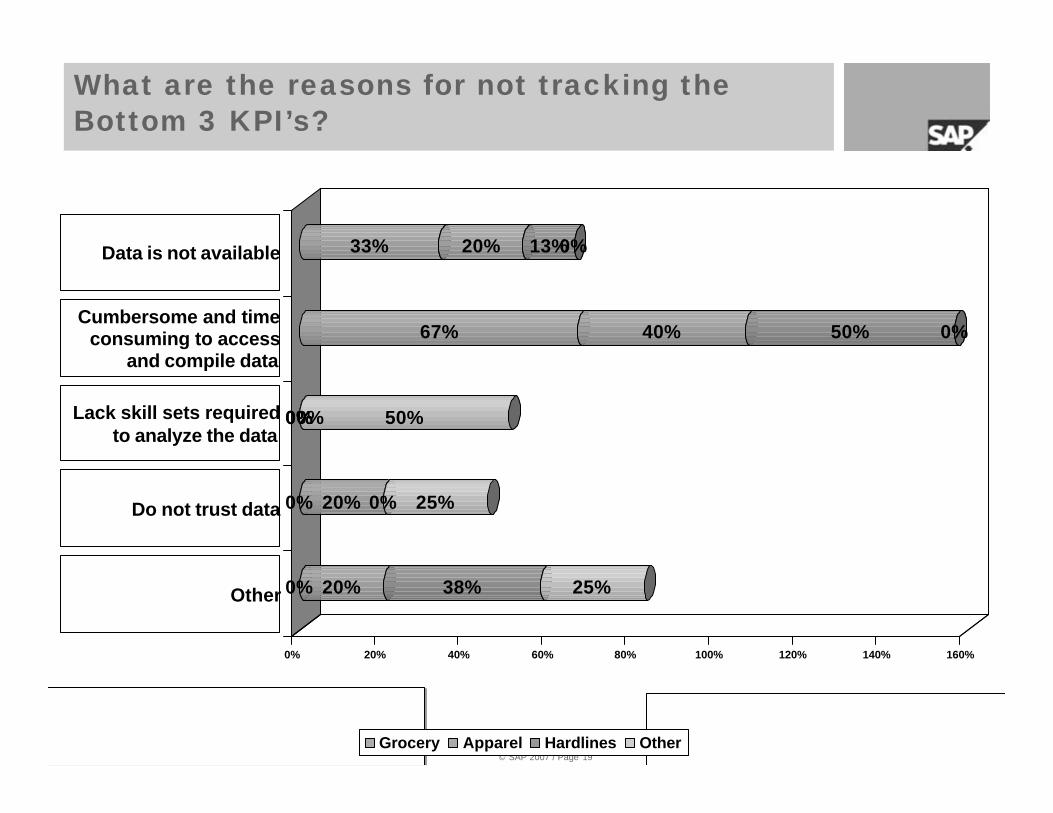
0% 20% 38% 25%
0% 20% 0% 25%
0%0%0% 50%
67% 40% 50% 0%
33% 20% 13%0%
0% 20% 40% 60% 80% 100% 120% 140% 160%
Other
Do not trust data
Lack skill sets re...
Cumbersome and tim...
Data is not availa...
Grocery Apparel Hardlines Other
Data is not available
Lack skill sets required to analyze the data
Do not trust data
Other
Cumbersome and time consuming to access
and compile data
What are the reasons for not tracking the Bottom 3 KPI’s?
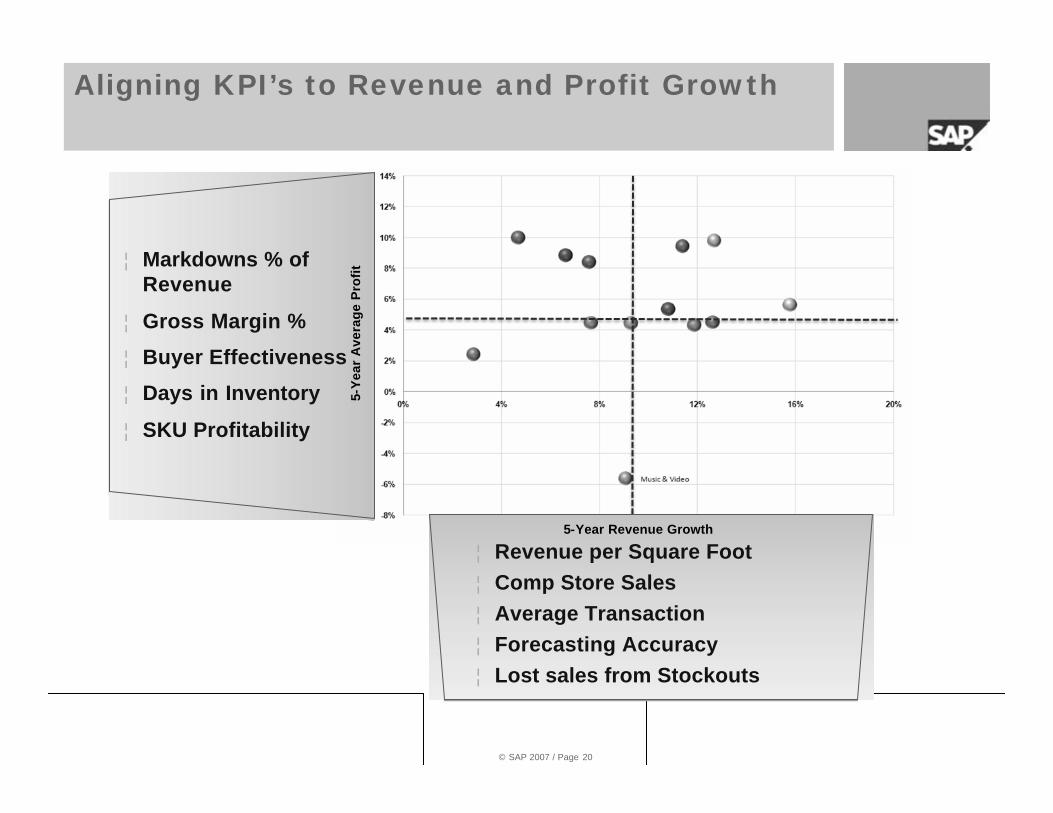
Aligning KPI’s to Revenue and Profit Growth
¦ Markdowns % of Revenue
¦ Gross Margin %
¦ Buyer Effectiveness
¦ Days in Inventory
¦ SKU Profitability
5-Y
ear
Ave
rag
e P
rofi
t
¦ Revenue per Square Foot¦ Comp Store Sales¦ Average Transaction¦ Forecasting Accuracy¦ Lost sales from Stockouts
5-Year Revenue Growth
© SAP 2007 / Page 20
Retail Business Process Investment
© SAP 2007 / Page 21
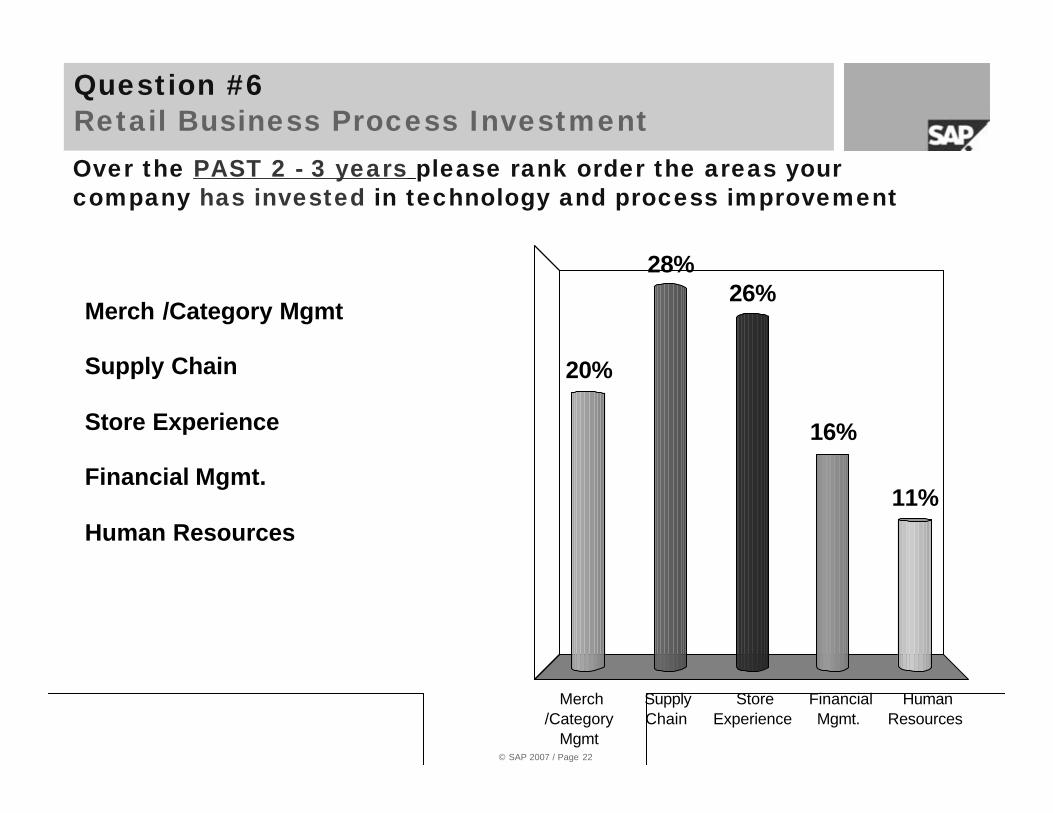
Over the PAST 2 - 3 years please rank order the areas your company has invested in technology and process improvement
Question #6Retail Business Process Investment
Merch/Category
Mgmt
SupplyChain
StoreExperience
FinancialMgmt.
HumanResources
20%
28%
11%
16%
26%Merch /Category Mgmt
Supply Chain
Store Experience
Financial Mgmt.
Human Resources
© SAP 2007 / Page 22
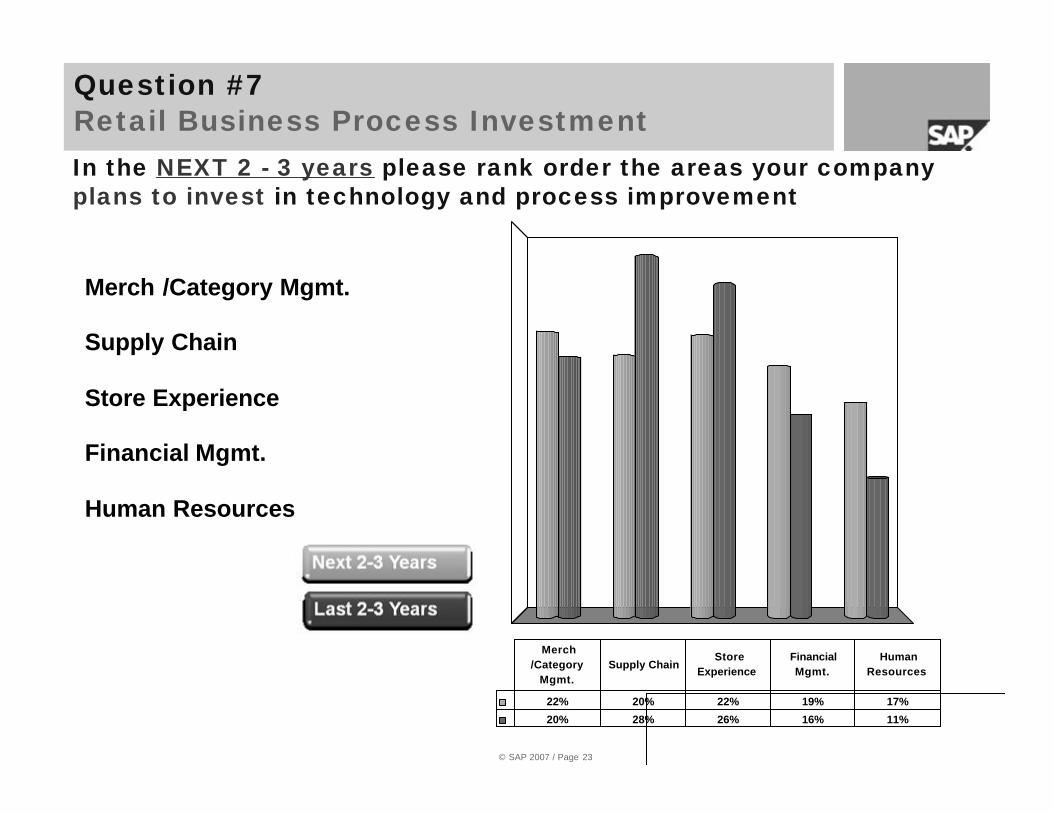
In the NEXT 2 - 3 years please rank order the areas your company plans to invest in technology and process improvement
Question #7Retail Business Process Investment
22% 20% 22% 19% 17%
20% 28% 26% 16% 11%
Merch /Category
Mgmt. Supply Chain
Store Experience
Financial Mgmt.
Human Resources
© SAP 2007 / Page 23
Merch /Category Mgmt.
Supply Chain
Store Experience
Financial Mgmt.
Human Resources
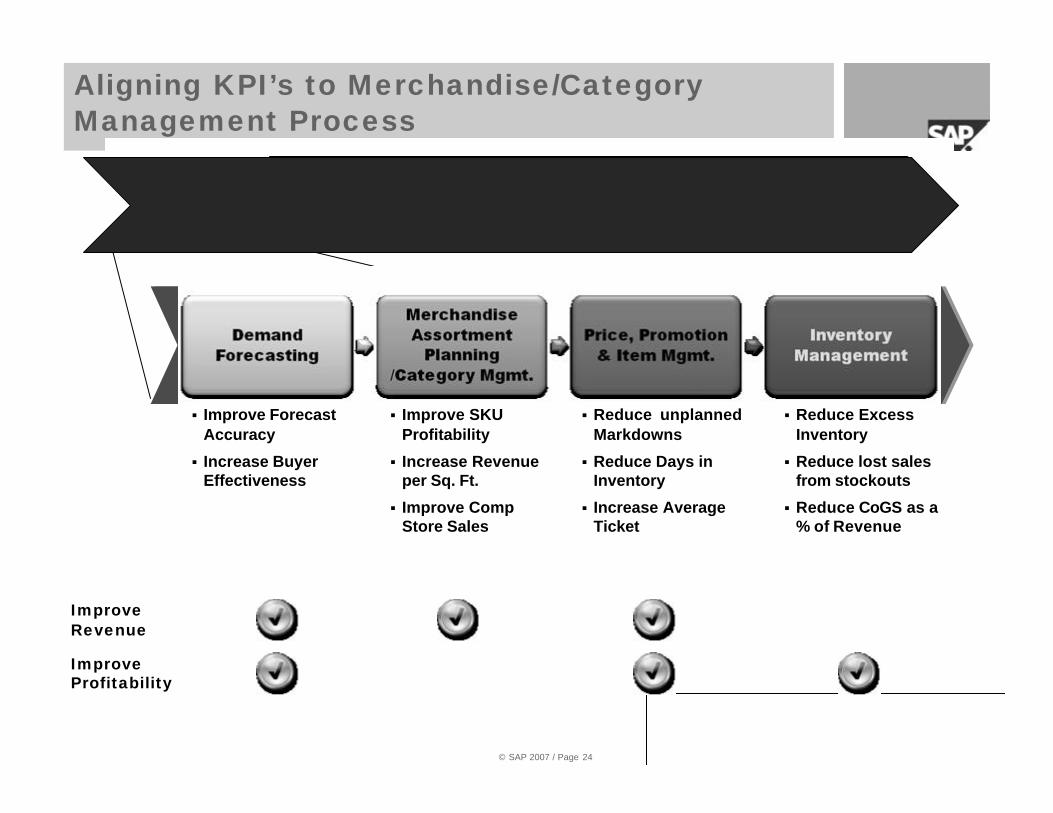
Improve Revenue
Improve Profitability
§ Improve Forecast Accuracy
§ Increase Buyer Effectiveness
§ Improve SKU Profitability
§ Increase Revenue per Sq. Ft.
§ Improve Comp Store Sales
§ Reduce unplanned Markdowns
§ Reduce Days in Inventory
§ Increase Average Ticket
§ Reduce Excess Inventory
§ Reduce lost sales from stockouts
§ Reduce CoGS as a % of Revenue
Aligning KPI’s to Merchandise/Category Management Process
© SAP 2007 / Page 24
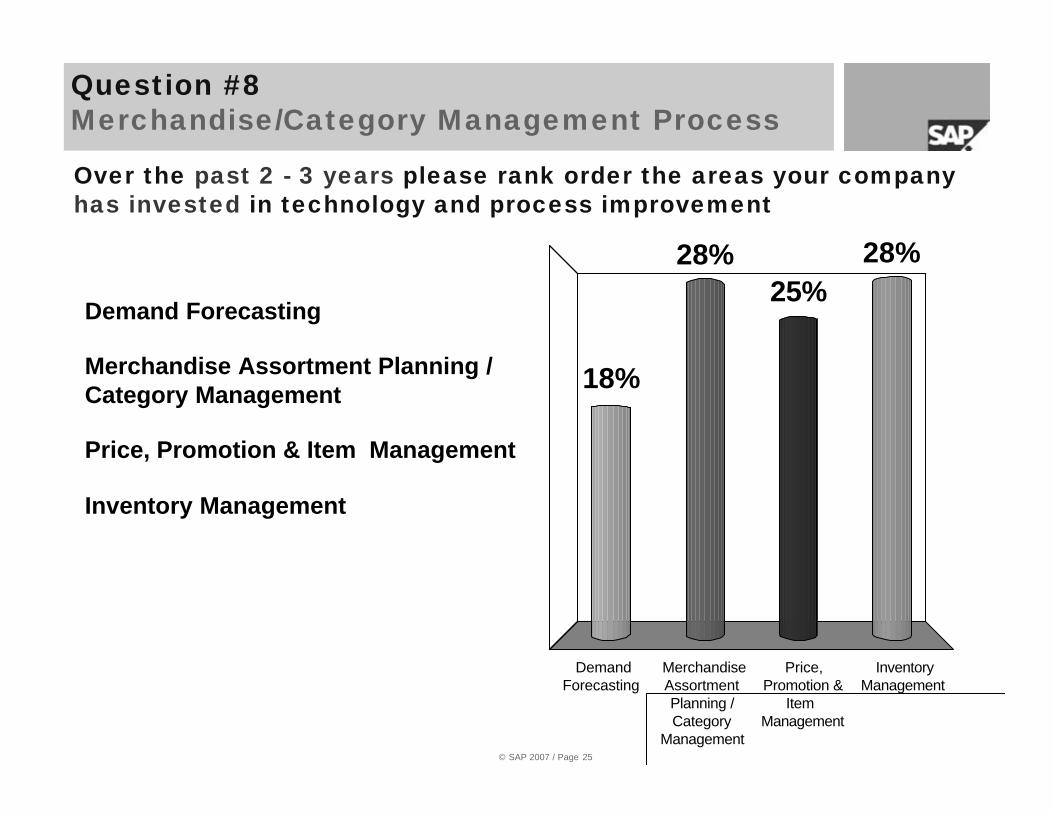
Over the past 2 - 3 years please rank order the areas your company has invested in technology and process improvement
Question #8Merchandise/Category Management Process
DemandForecasting
MerchandiseAssortmentPlanning /Category
Management
Price,Promotion &
Item Management
InventoryManagement
18%
28%25%
28%
Demand Forecasting
Merchandise Assortment Planning / Category Management
Price, Promotion & Item Management
Inventory Management
© SAP 2007 / Page 25
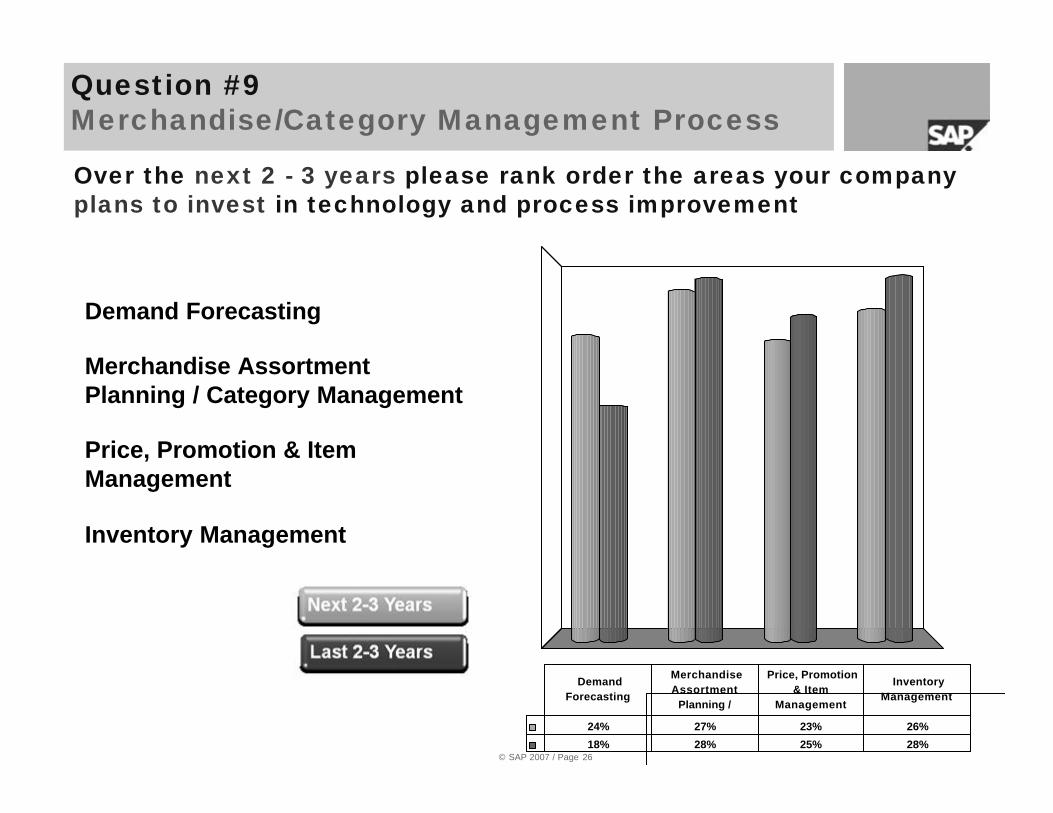
Over the next 2 - 3 years please rank order the areas your company plans to invest in technology and process improvement
24% 27% 23% 26%
18% 28% 25% 28%
Demand Forecasting
Merchandise Assortment
Planning /
Price, Promotion & Item
Management
Inventory Management
Question #9Merchandise/Category Management Process
Demand Forecasting
Merchandise Assortment Planning / Category Management
Price, Promotion & Item Management
Inventory Management
© SAP 2007 / Page 26
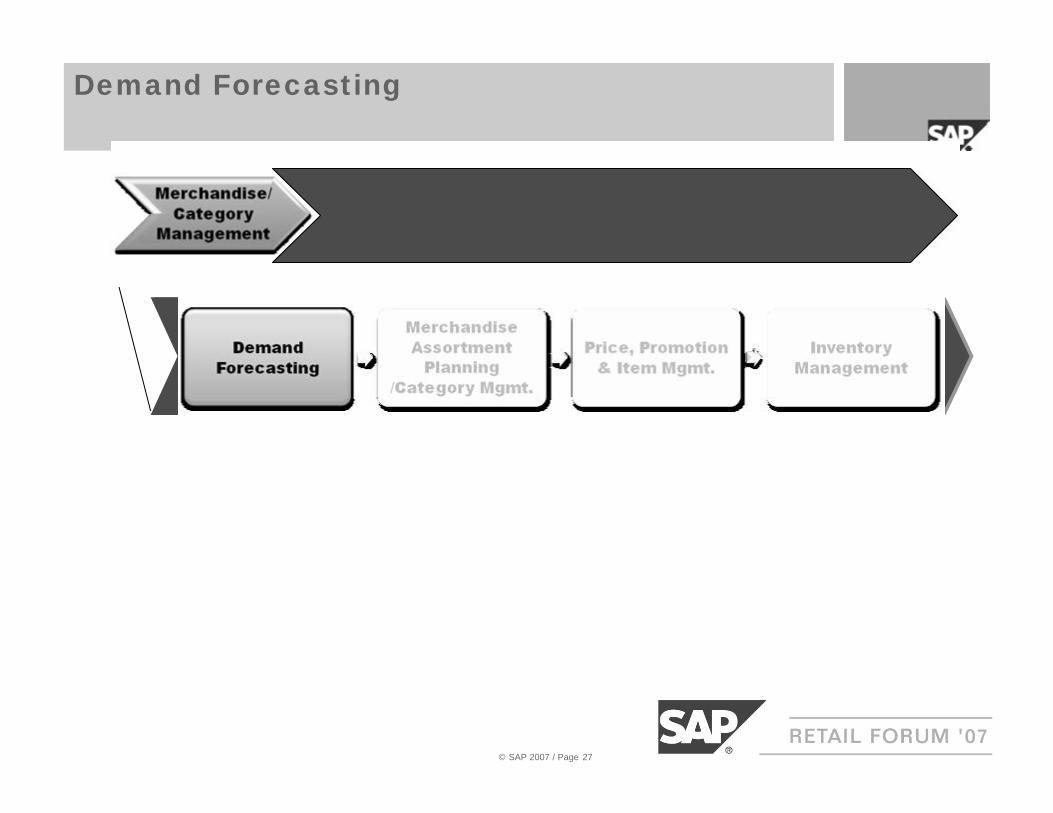
Demand Forecasting
© SAP 2007 / Page 27
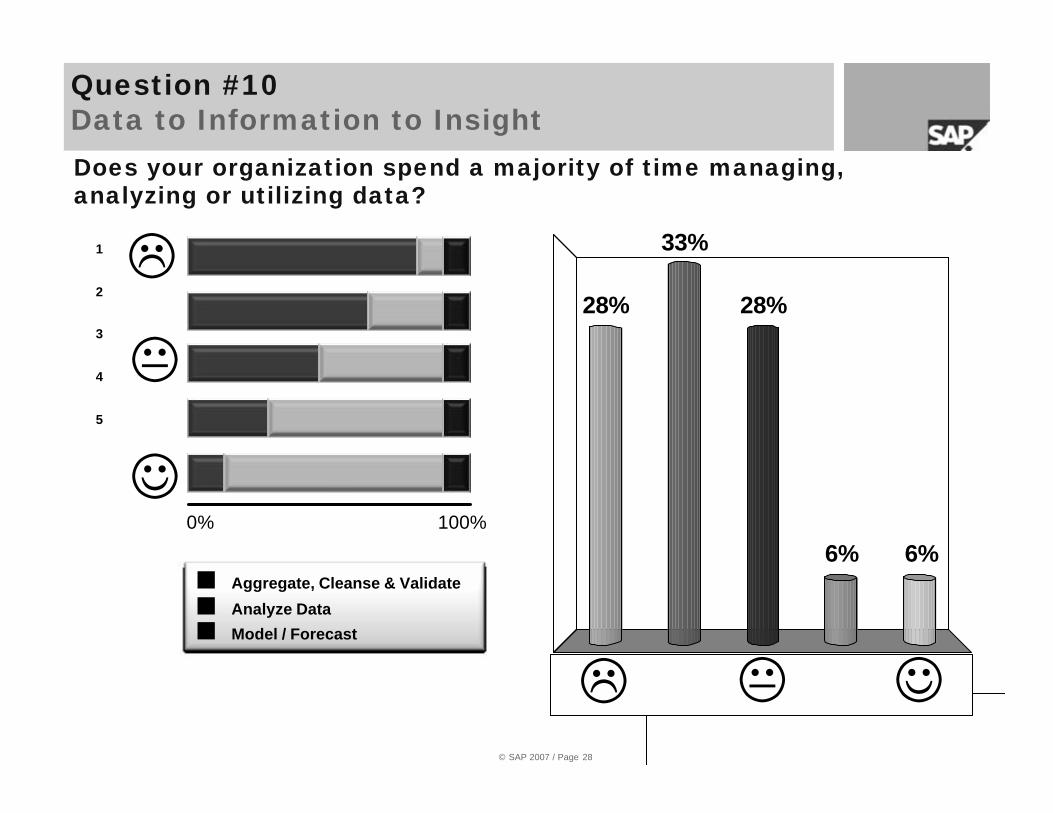
Does your organization spend a majority of time managing, analyzing or utilizing data?
© SAP 2007 / Page 28
1 2 3 4 5
28%
33%
6%6%
28%
Question #10Data to Information to Insight
1
2
3
4
5
0% 100%
¢ Aggregate, Cleanse & Validate
¢ Analyze Data
¢ Model / Forecast
L
☺
K
☺L K
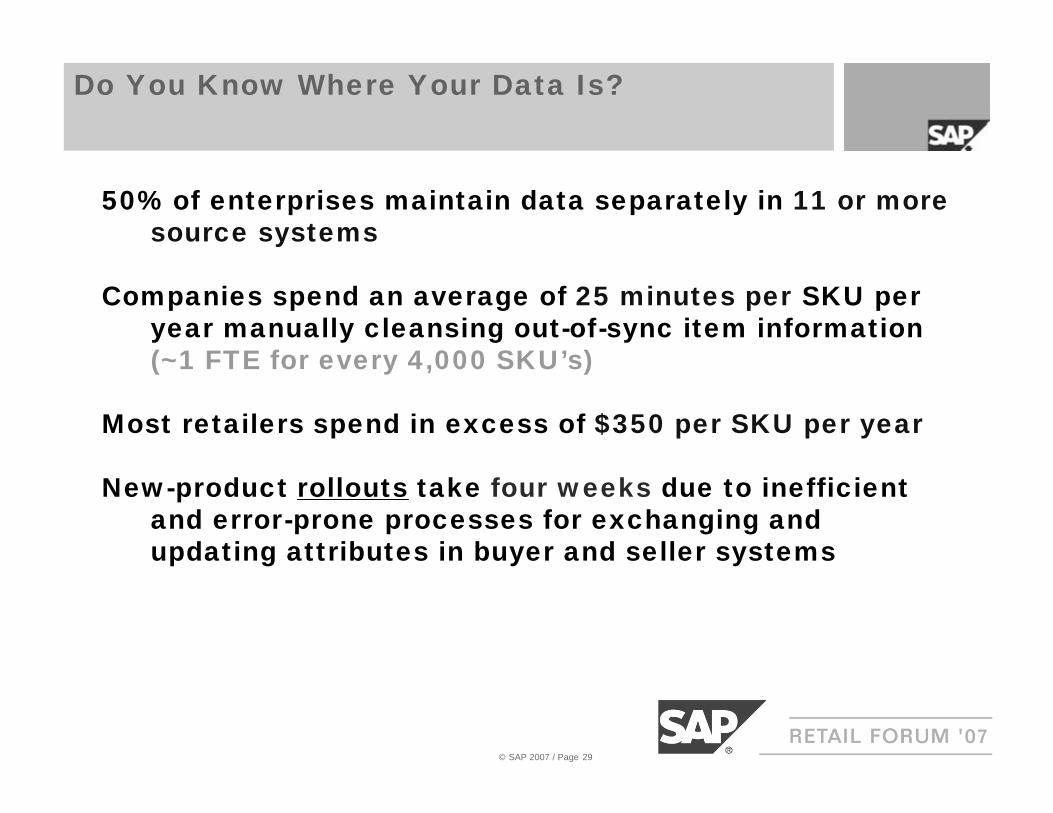
Do You Know Where Your Data Is?
50% of enterprises maintain data separately in 11 or more source systems
Companies spend an average of 25 minutes per SKU per year manually cleansing out-of-sync item information (~1 FTE for every 4,000 SKU’s)
Most retailers spend in excess of $350 per SKU per year
New-product rollouts take four weeks due to inefficient and error-prone processes for exchanging and updating attributes in buyer and seller systems
© SAP 2007 / Page 29
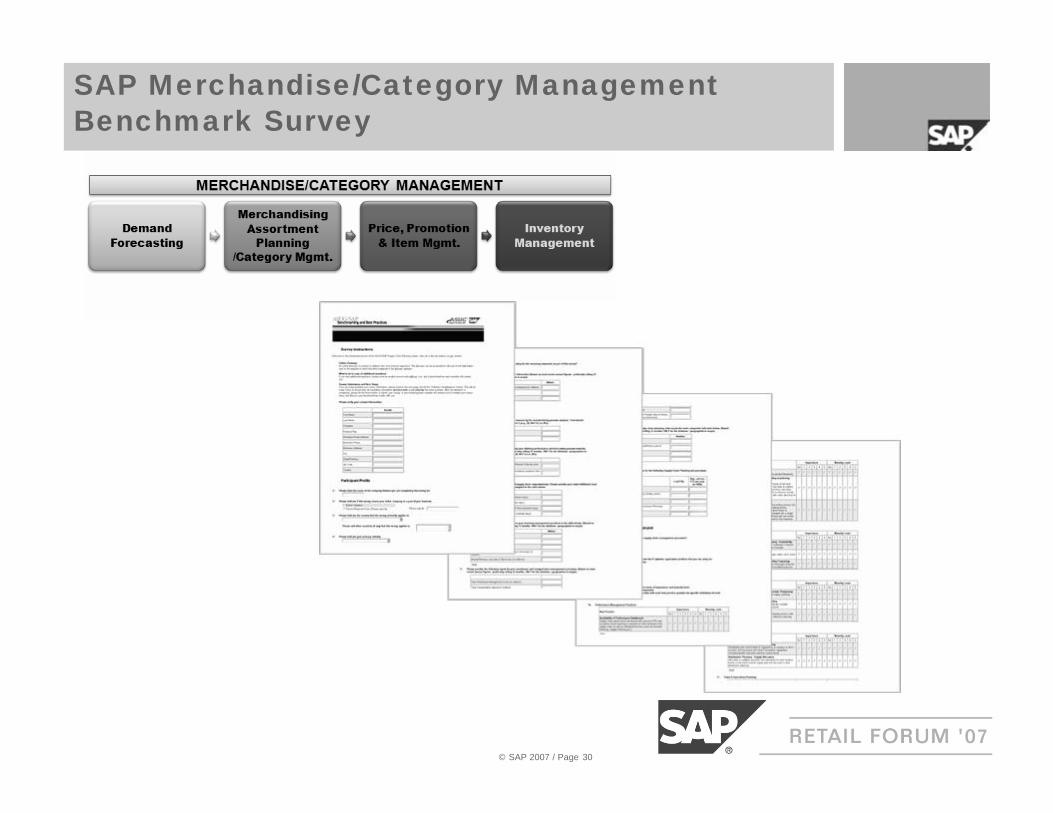
SAP Merchandise/Category Management Benchmark Survey
© SAP 2007 / Page 30
SAP BenchmarkingDesigned to Get Actionable Results
¦ Benchmarking is a strategic service offered by ASUG and SAP, launched at the end of 2004 as a forum to exchange metrics and best practices
¦ The Benchmarking program covers 15 business processes, with 2,000+ participants to date who leverage the program to:
– Build a Business Case for change– Compare performance to leading companies, industry peers,
and between regions/divisions– Assess Value Realization, year-over year– Prove Success
¦ Survey participation is FUNDED BY SAP
© SAP 2007 / Page 31
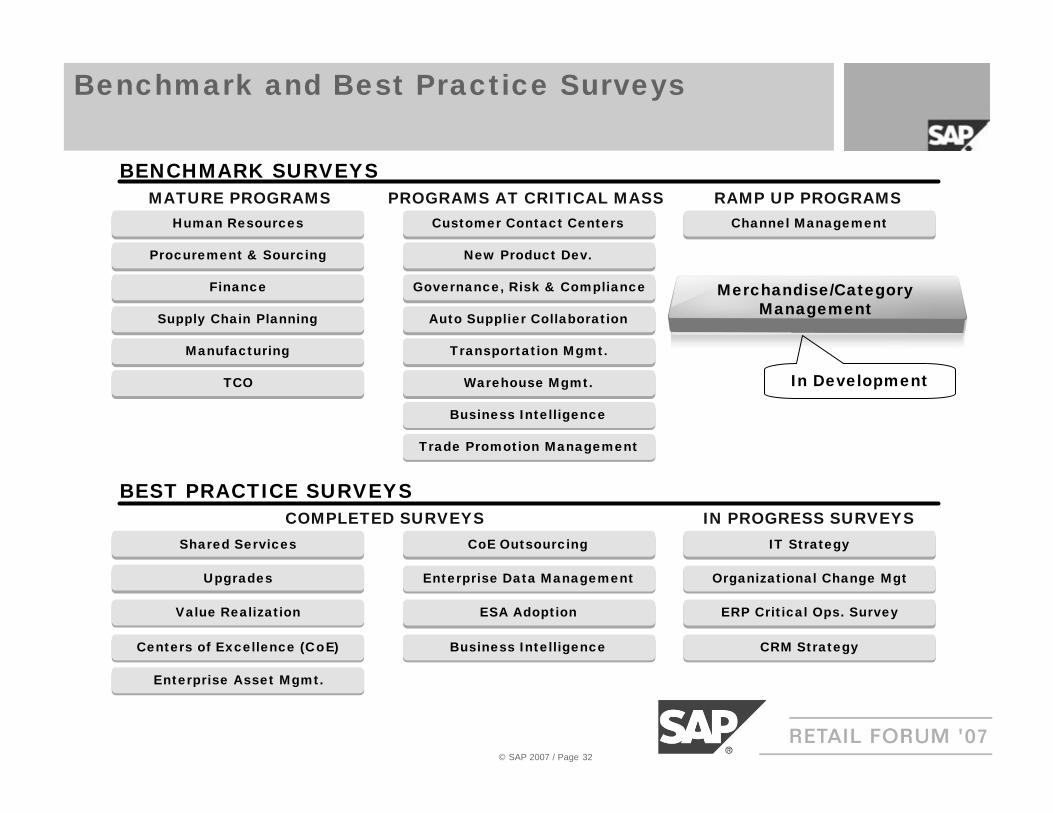
PROGRAMS AT CRITICAL MASSMATURE PROGRAMS RAMP UP PROGRAMSHuman Resources
Finance
Procurement & Sourcing
TCO
Supply Chain Planning
Manufacturing
Customer Contact Centers
New Product Dev.
Governance, Risk & Compliance
Auto Supplier Collaboration
Transportation Mgmt.
Warehouse Mgmt.
Business Intelligence
Channel Management
Trade Promotion Management
Shared Services
Value Realization
Upgrades
CoE Outsourcing
Centers of Excellence (CoE) Business Intelligence
IT Strategy
Enterprise Asset Mgmt.
Organizational Change MgtEnterprise Data Management
ESA Adoption ERP Critical Ops. Survey
CRM Strategy
IN PROGRESS SURVEYSCOMPLETED SURVEYS
BENCHMARK SURVEYS
BEST PRACTICE SURVEYS
Merchandise/Category Management
In Development
Benchmark and Best Practice Surveys
© SAP 2007 / Page 32
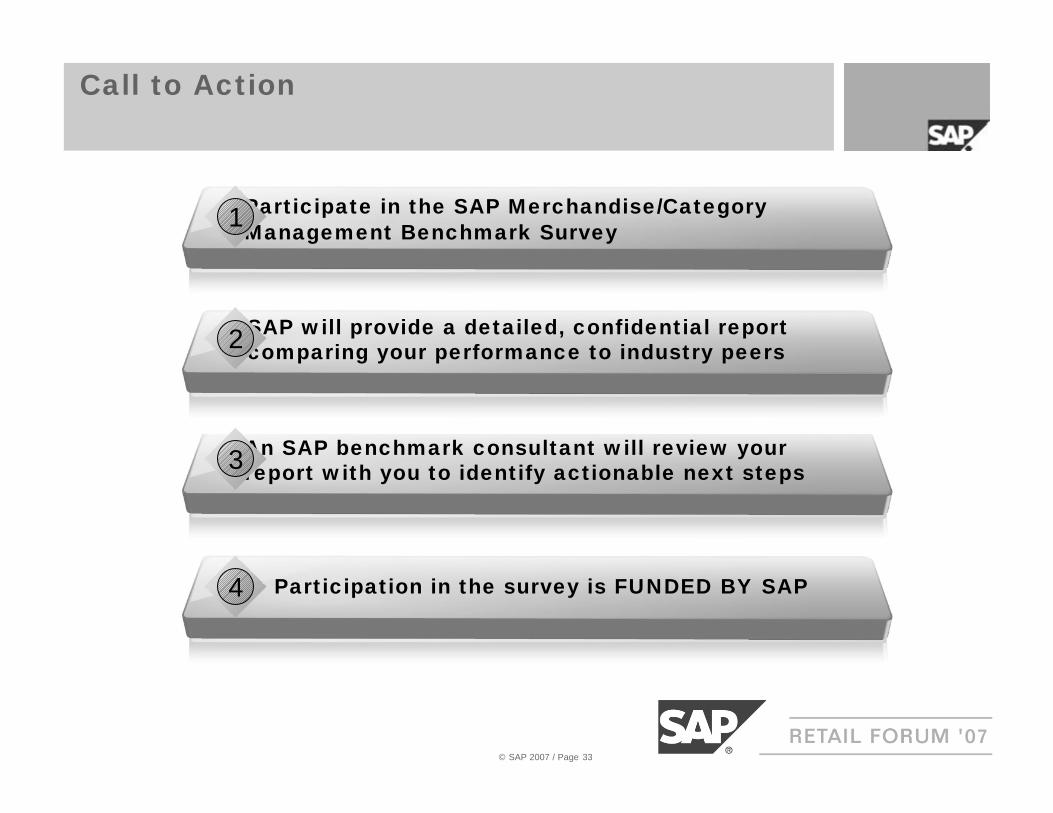
Call to Action
Participate in the SAP Merchandise/Category Management Benchmark Survey1
An SAP benchmark consultant will review your report with you to identify actionable next steps3
SAP will provide a detailed, confidential report comparing your performance to industry peers2
Participation in the survey is FUNDED BY SAP4
© SAP 2007 / Page 33
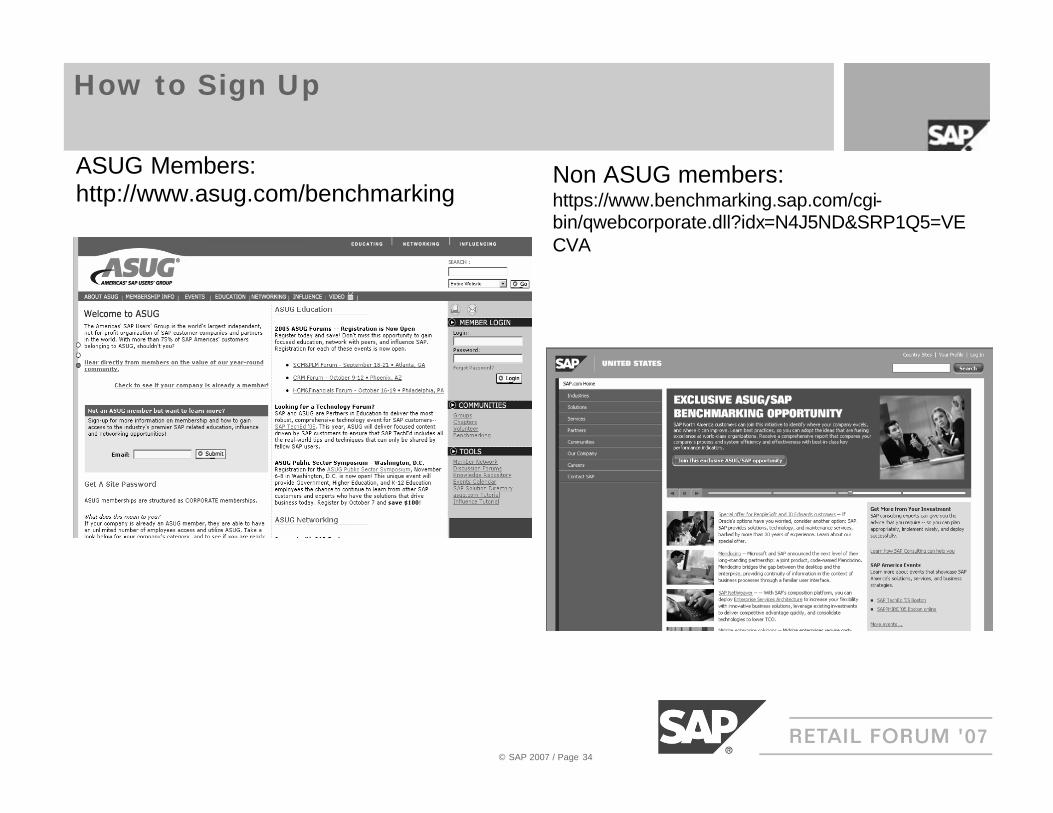
ASUG Members: http://www.asug.com/benchmarking
Non ASUG members: https://www.benchmarking.sap.com/cgi-bin/qwebcorporate.dll?idx=N4J5ND&SRP1Q5=VECVA
How to Sign Up
© SAP 2007 / Page 34
Questions
© SAP 2007 / Page 35
© SAP 2007 / Page 36
Thank you!
Gregory MacKinnonSenior Principal, Value Engineering Retail Team Lead
SAP America, Inc.3 Van De Graaff DriveBurlington, MA 01803
T/M 781.267.1772E [email protected]
Michael MetPrincipal, Value Engineering
SAP America, Inc.600 East Las Colinas Blvd.Irving, TX 75039
T/M 210.204.7307E [email protected]