Embed Size (px)
Citation preview
Improving Maternal & Child Health in America: A Life-Course Perspective
Michael C. Lu, MD, MPHAssociate Professor
Department of Obstetrics & GynecologyDavid Geffen School of Medicine at UCLA
Department of Community Health SciencesUCLA School of Public Health
UCLA OB-GYN Grand RoundsDecember 4, 2009
Acknowledgment
National Institute of Child Health and Development Community Child Health Network National Children’s Study

Acknowledgment

Finland, 12.2
Denmark, 9.2
Portugal, 8.2
Czech Republic, 8
United Kingdom, 7.7
France, 7
New Zealand, 6.8
Canada, 5.9
Slovak Republic, 5.6
Switzerland, 5.5
Netherlands, 5.2
Germany, 5.2
Poland, 4.8
Spain, 4.6
Japan, 4.4
Hungary, 4.2
Australia, 3.9
Austria, 3.8
Greece, 2.8
Belium, 2.5
Ireland, 1.6
Sweden, 1
USA, 13.1
Norway, 0
Icleand, 0
0 1 2 3 4 5 6 7 8 9 10 11 12 13 14
Maternal MortalitySource: OECD Health Data 2008
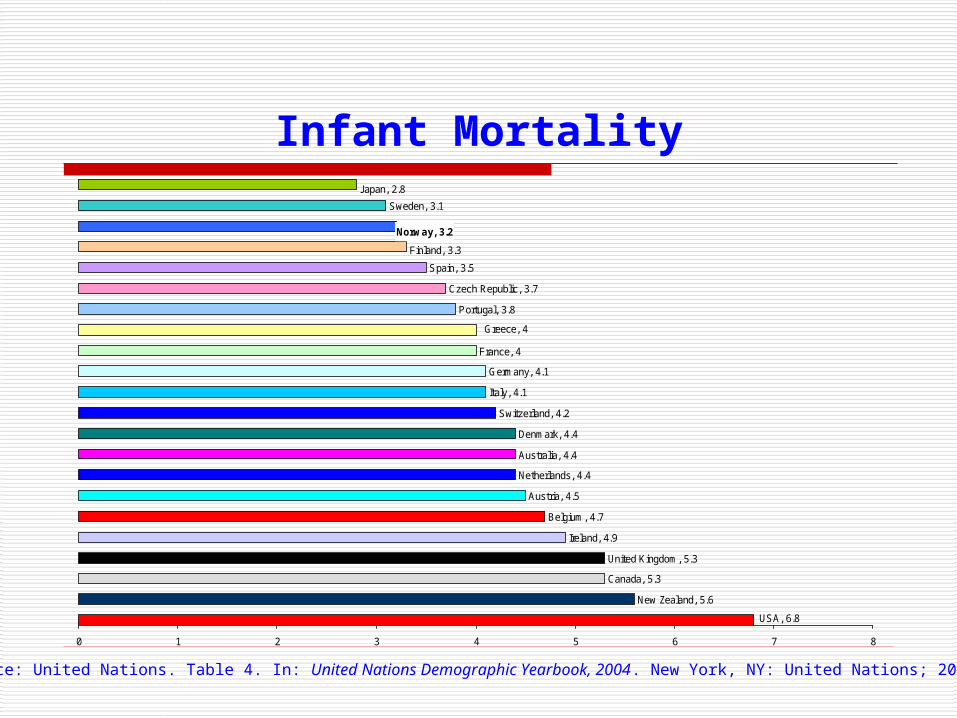
New Zealand, 5.6
Canada, 5.3
United Kingdom, 5.3
Ireland, 4.9
Belgium, 4.7
Austria, 4.5
Netherlands, 4.4
Australia, 4.4
Denmark, 4.4
Switzerland, 4.2
Italy, 4.1
Germany, 4.1
France, 4
Portugal, 3.8
Czech Republic, 3.7
Spain, 3.5
Sweden, 3.1
Japan, 2.8
USA, 6.8
Greece, 4
Finland, 3.3
Norway, 3.2
0 1 2 3 4 5 6 7 8
Infant Mortality
Source: United Nations. Table 4. In: United Nations Demographic Yearbook, 2004. New York, NY: United Nations; 2007:73–93.
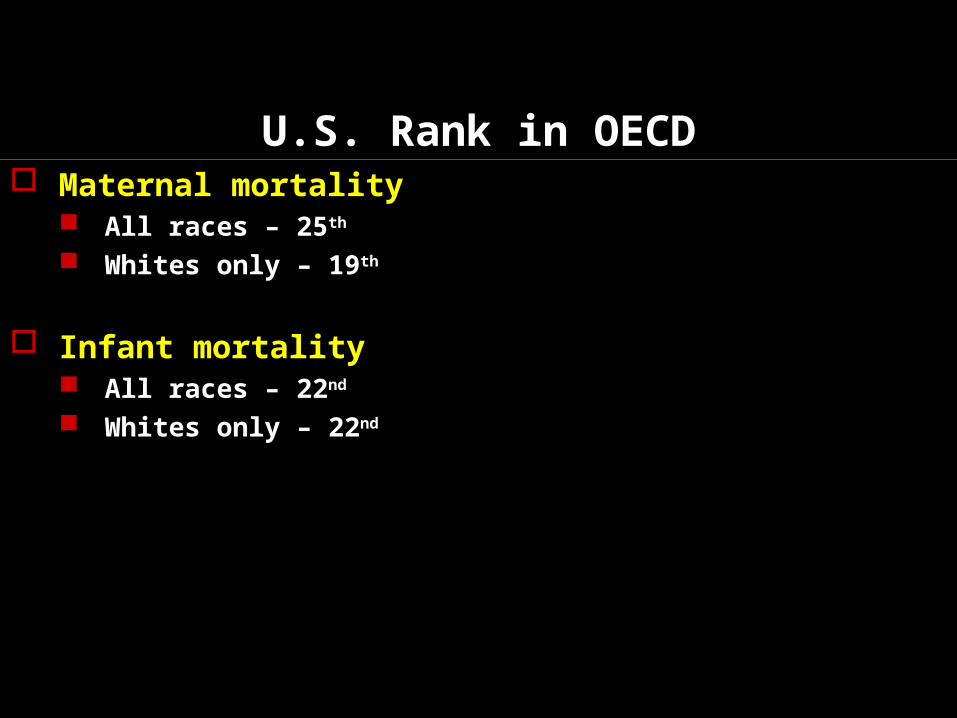
U.S. Rank in OECD Maternal mortality
All races – 25th
Whites only – 19th
Infant mortality All races – 22nd
Whites only – 22nd
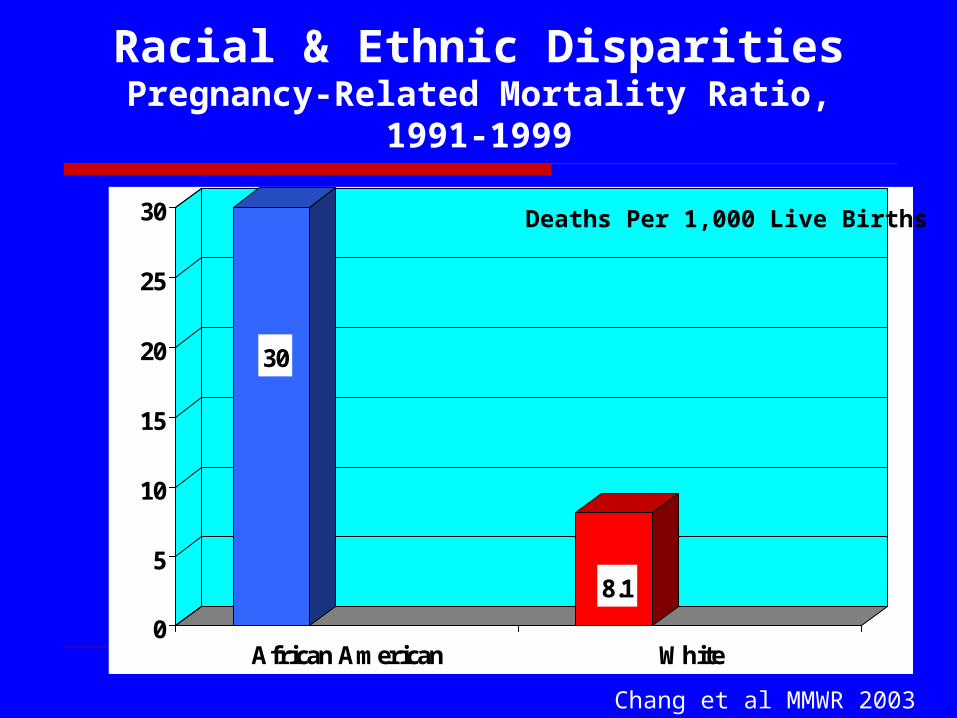
Racial & Ethnic DisparitiesPregnancy-Related Mortality Ratio, 1991-
1999
30
8.1
0
5
10
15
20
25
30
African American White
Deaths Per 1,000 Live Births
Chang et al MMWR 2003
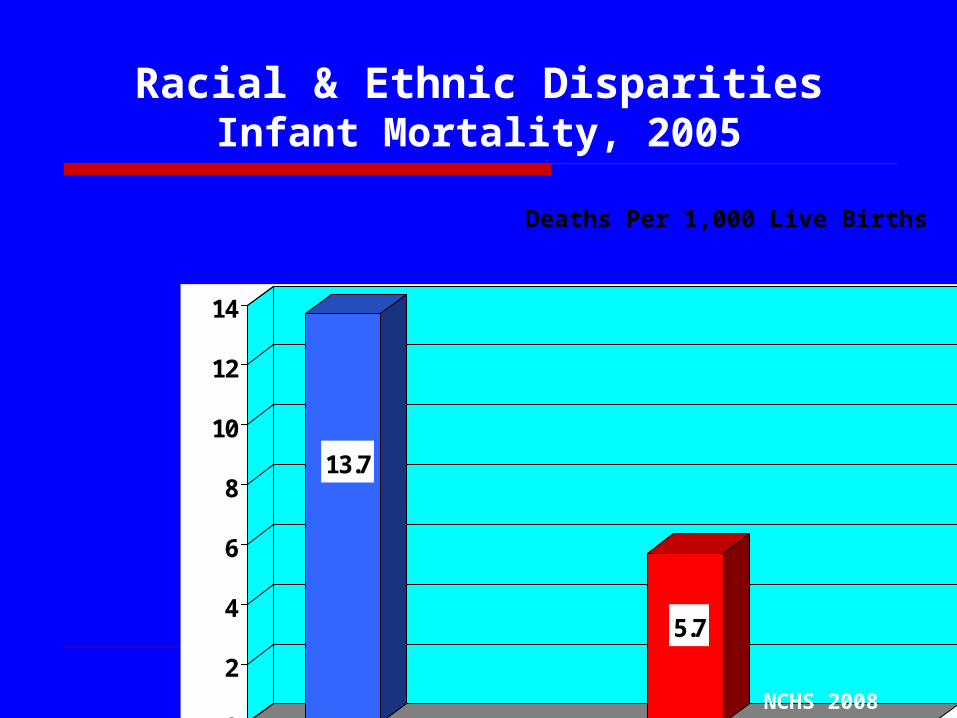
Racial & Ethnic DisparitiesInfant Mortality, 2005
13.7
5.7
0
2
4
6
8
10
12
14
African American White
Deaths Per 1,000 Live Births
NCHS 2008

How Can This Be?
Life-Course Perspective
A way of looking at life not as disconnected stages, but as an integrated continuum

Life Course Perspective
Lu MC, Halfon N. Racial and ethnic disparities in birth outcomes: a life-course perspective.Matern Child Health J. 2003;7:13-30.
Life Course Perspective
Early programming Cumulative pathways Implications for research, practice, and
policy

Early Programming

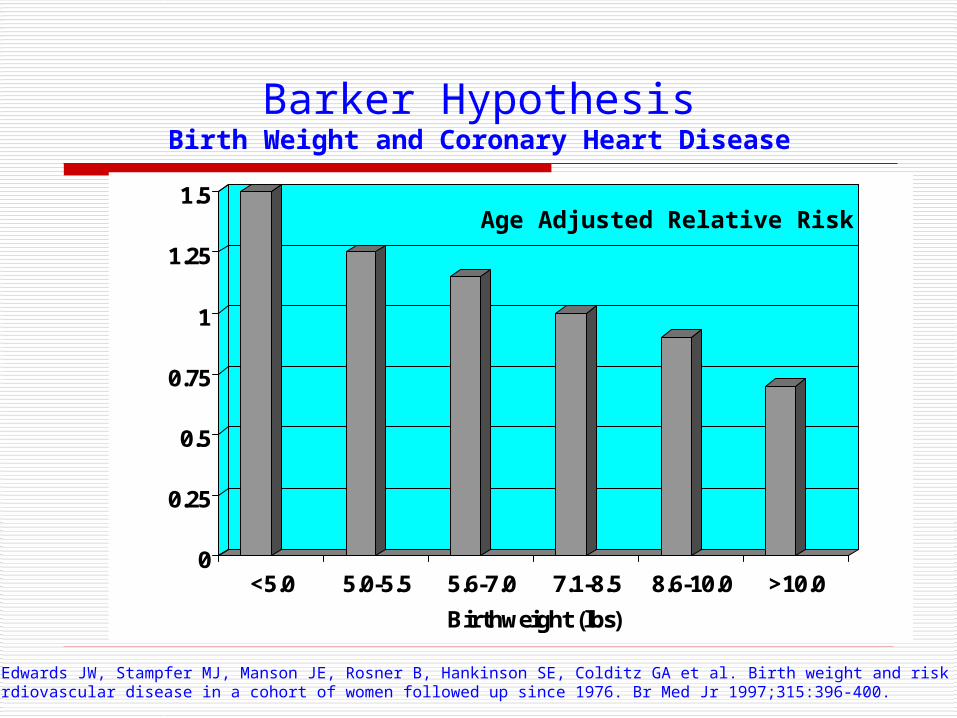
Barker HypothesisBirth Weight and Coronary Heart Disease
0
0.25
0.5
0.75
1
1.25
1.5
<5.0 5.0-5.5 5.6-7.0 7.1-8.5 8.6-10.0 >10.0
Birthweight (lbs)
Age Adjusted Relative Risk
Rich-Edwards JW, Stampfer MJ, Manson JE, Rosner B, Hankinson SE, Colditz GA et al. Birth weight and risk of cardiovascular disease in a cohort of women followed up since 1976. Br Med Jr 1997;315:396-400.

Barker HypothesisBirth Weight and Hypertension
155
160
165
170
Sys
toli
c P
ress
ure
(m
mH
g)
<=5.5 5.6-6.5 6.6-7.5 7.6-8.5 >8.5
Birthweight (lbs)
Law CM, de Swiet M, Osmond C, Fayers PM, Barker DJP, Cruddas AM, et al. Initiation of hypertension in utero and its amplification throughout life. Br Med J 1993;306:24-27.
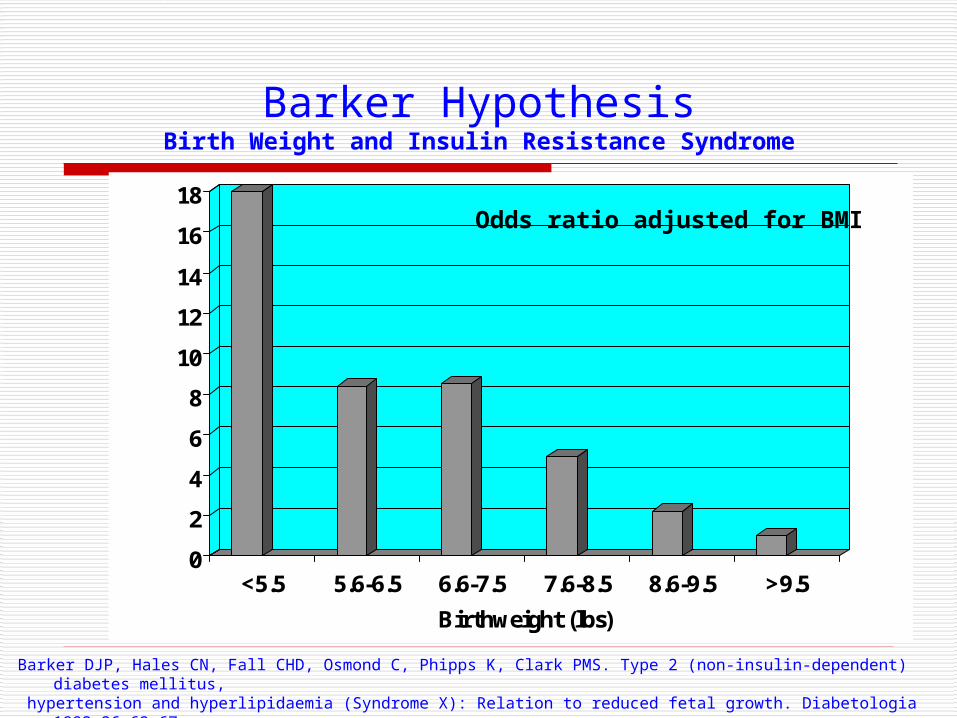
Barker HypothesisBirth Weight and Insulin Resistance Syndrome
0
2
4
6
8
10
12
14
16
18
<5.5 5.6-6.5 6.6-7.5 7.6-8.5 8.6-9.5 >9.5
Birthweight (lbs)
Odds ratio adjusted for BMI
Barker DJP, Hales CN, Fall CHD, Osmond C, Phipps K, Clark PMS. Type 2 (non-insulin-dependent) diabetes mellitus, hypertension and hyperlipidaemia (Syndrome X): Relation to reduced fetal growth. Diabetologia 1993;36:62-67.
Maternal Stress & Fetal Programming
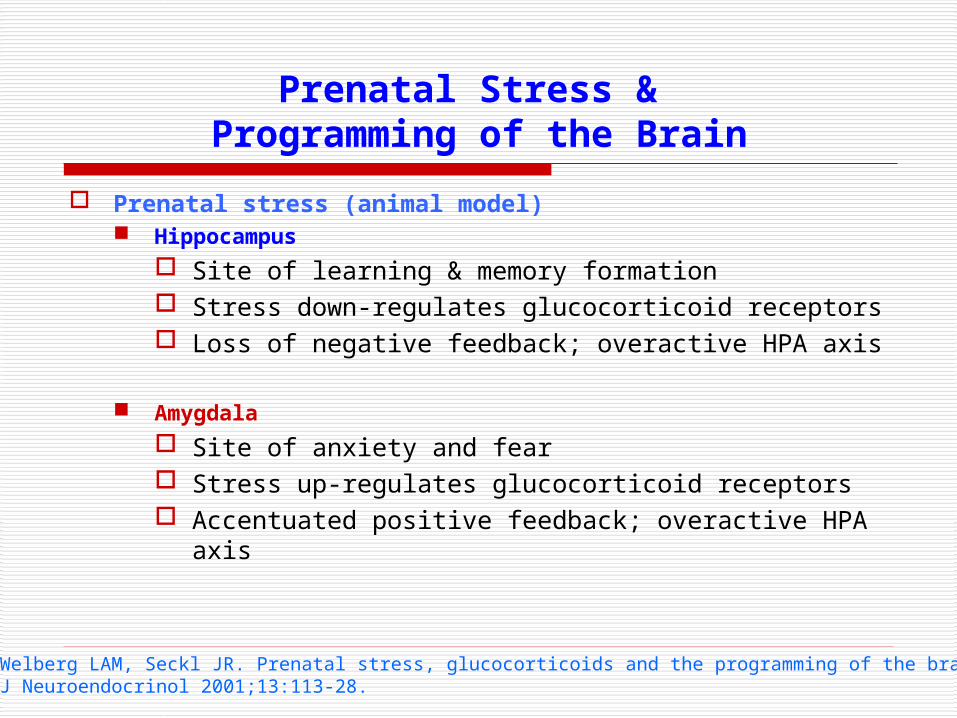
Prenatal Stress & Programming of the Brain
Prenatal stress (animal model) Hippocampus
Site of learning & memory formation Stress down-regulates glucocorticoid receptors Loss of negative feedback; overactive HPA axis
Amygdala
Site of anxiety and fear Stress up-regulates glucocorticoid receptors Accentuated positive feedback; overactive HPA
axis
Welberg LAM, Seckl JR. Prenatal stress, glucocorticoids and the programming of the brain.J Neuroendocrinol 2001;13:113-28.
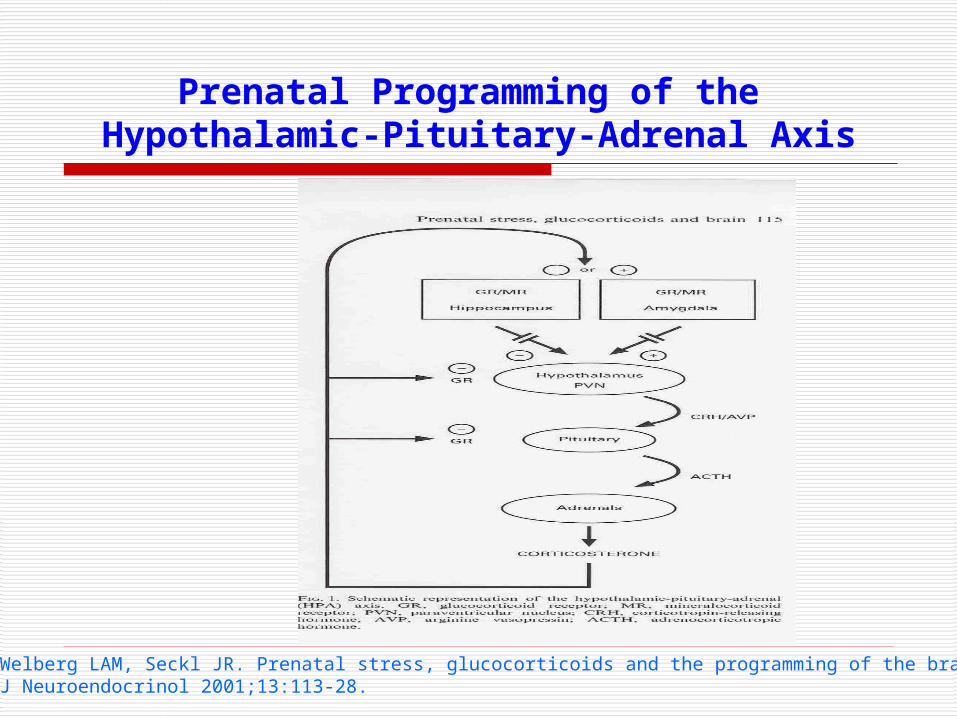
Prenatal Programming of the Hypothalamic-Pituitary-Adrenal Axis
Welberg LAM, Seckl JR. Prenatal stress, glucocorticoids and the programming of the brain.J Neuroendocrinol 2001;13:113-28.
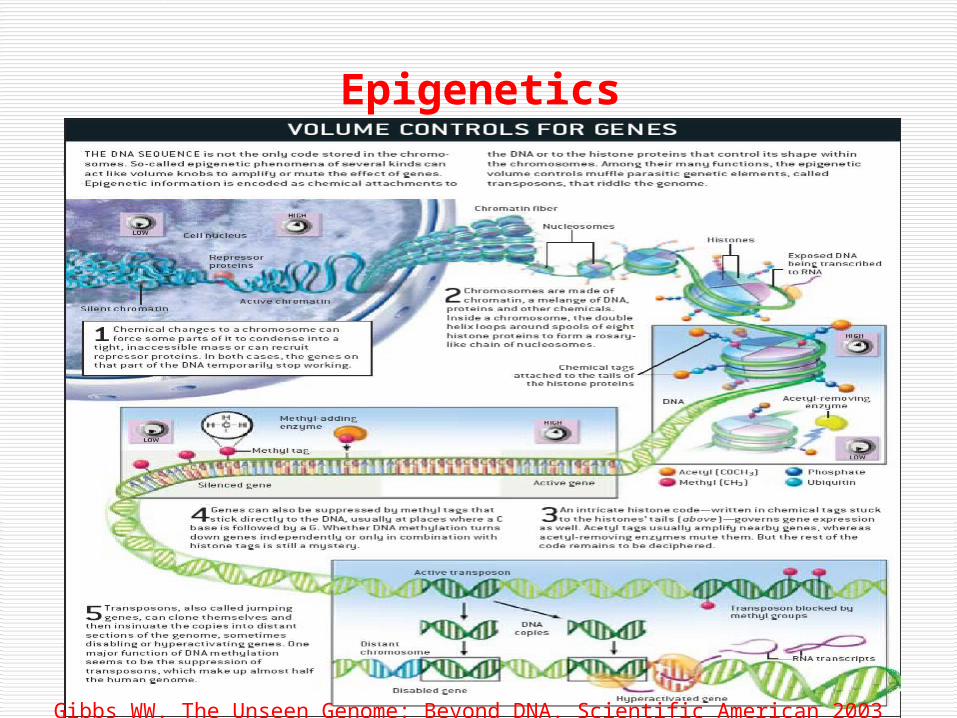
Epigenetics
Gibbs WW. The Unseen Genome: Beyond DNA. Scientific American 2003
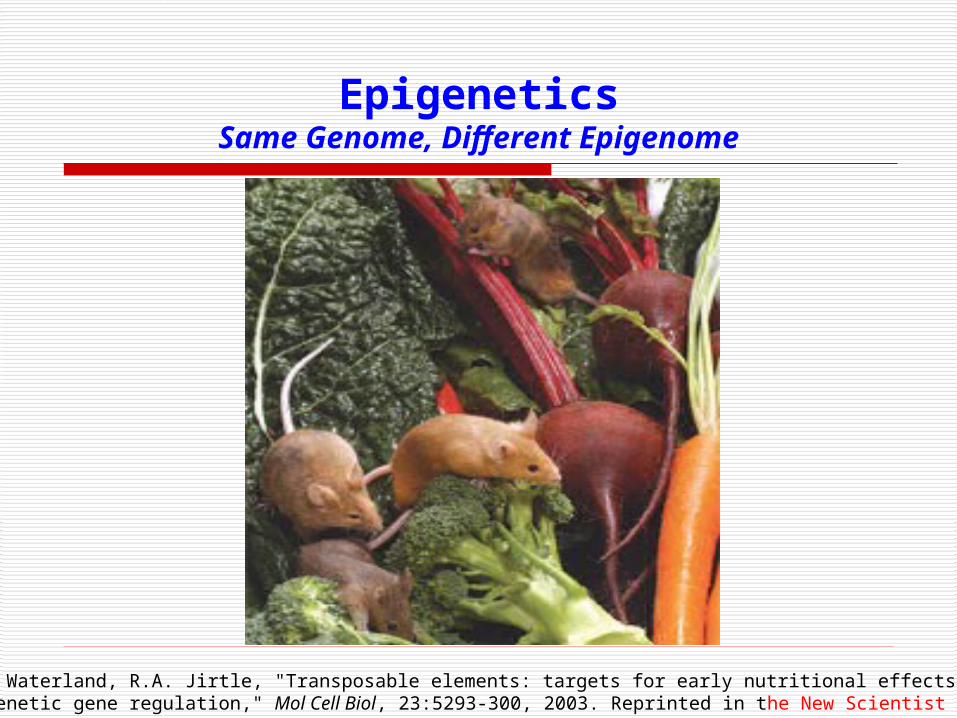
EpigeneticsSame Genome, Different Epigenome
R.A. Waterland, R.A. Jirtle, "Transposable elements: targets for early nutritional effects on epigenetic gene regulation," Mol Cell Biol, 23:5293-300, 2003. Reprinted in the New Scientist 2004

Prenatal Programming of Childhood Obesity
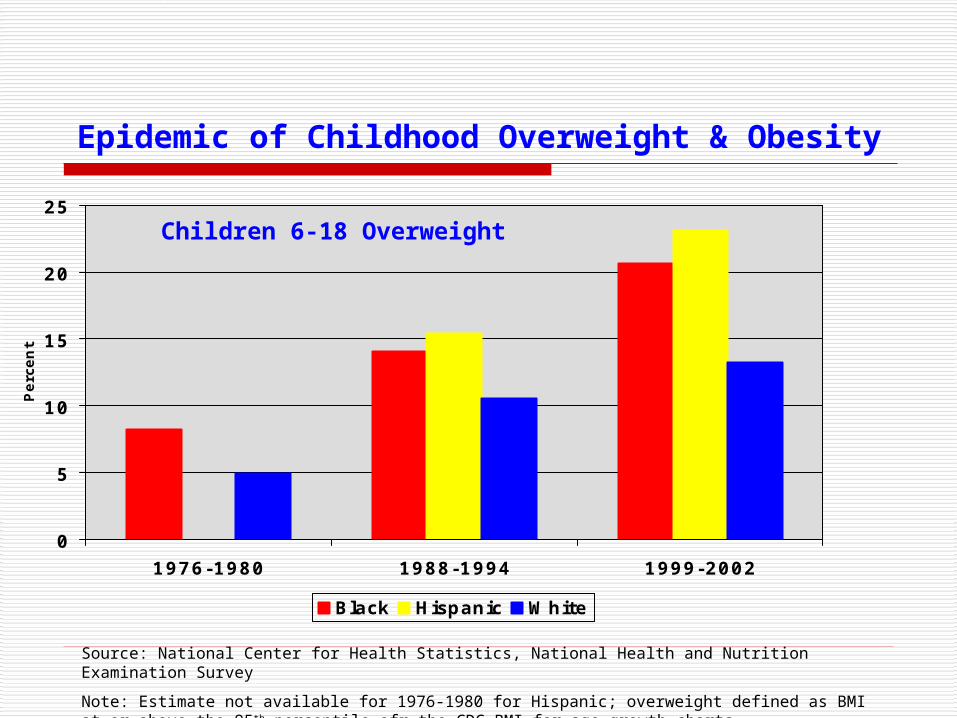
Epidemic of Childhood Overweight & Obesity
0
5
10
15
20
25
1976-1980 1988-1994 1999-2002
Perc
en
t
Black Hispanic White
Source: National Center for Health Statistics, National Health and Nutrition Examination Survey
Note: Estimate not available for 1976-1980 for Hispanic; overweight defined as BMI at or above the 95th percentile ofr the CDC BMI-for-age growth charts
Children 6-18 Overweight
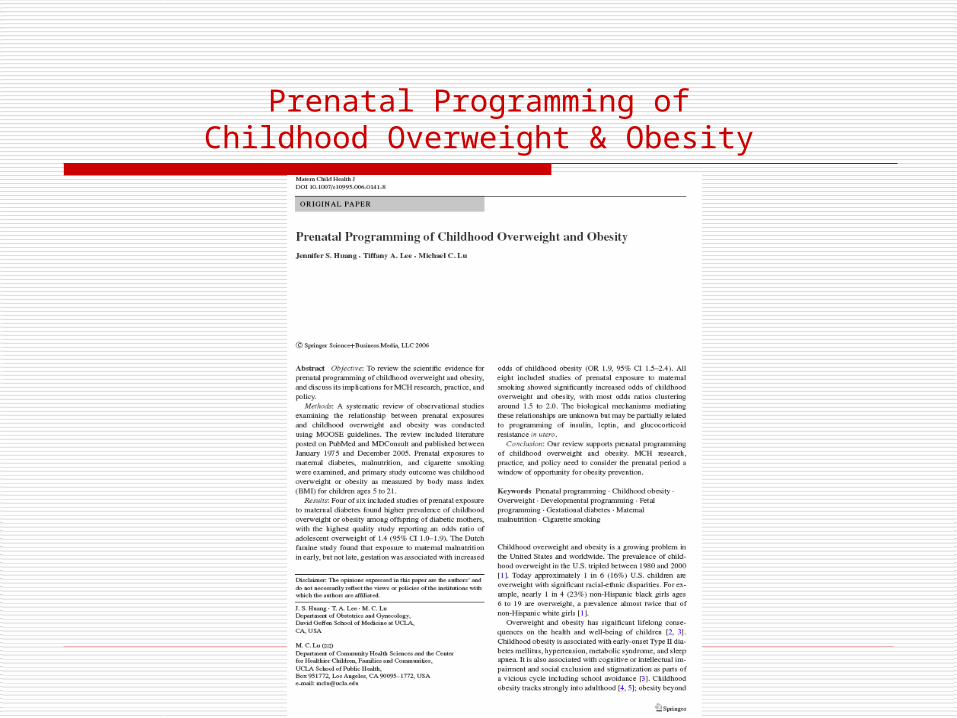
Prenatal Programming ofChildhood Overweight & Obesity

Maternal Diabetes & Intrauterine Hyperglycemia
Intrauterine Hyperinsulinemia (Fetal Pancreatic β Cells)
Prenatal& PostnatalHyperleptinemia
Preadipocyte Differentiation
Adipocyte Hyperplasia
HypothalamicLeptin Resistance
Pancreatic β- Cell Leptin Resistance
HyperphagiaHyperinsulinism
Programmed Insulin
Resistance
Postnatal Hyperinsulinemia
Adipogenesis
Prenatal Programming of Childhood Obesity
Cumulative Pathways

Photo: http://www.lam.mus.ca.us/cats/encyclo/smilodon/
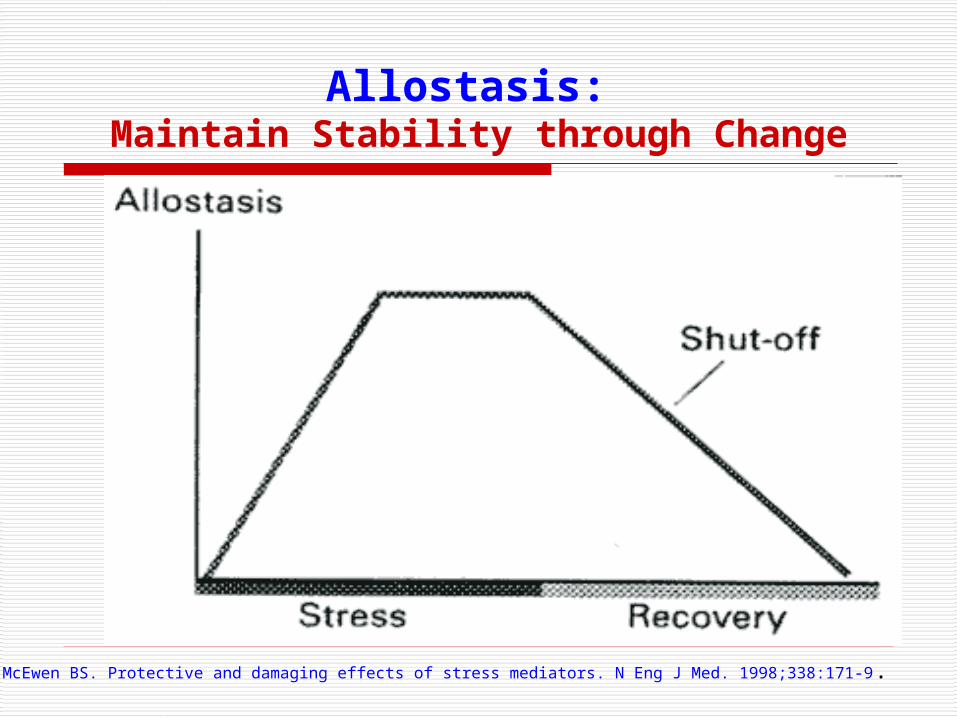
Allostasis: Maintain Stability through Change
McEwen BS. Protective and damaging effects of stress mediators. N Eng J Med. 1998;338:171-9.
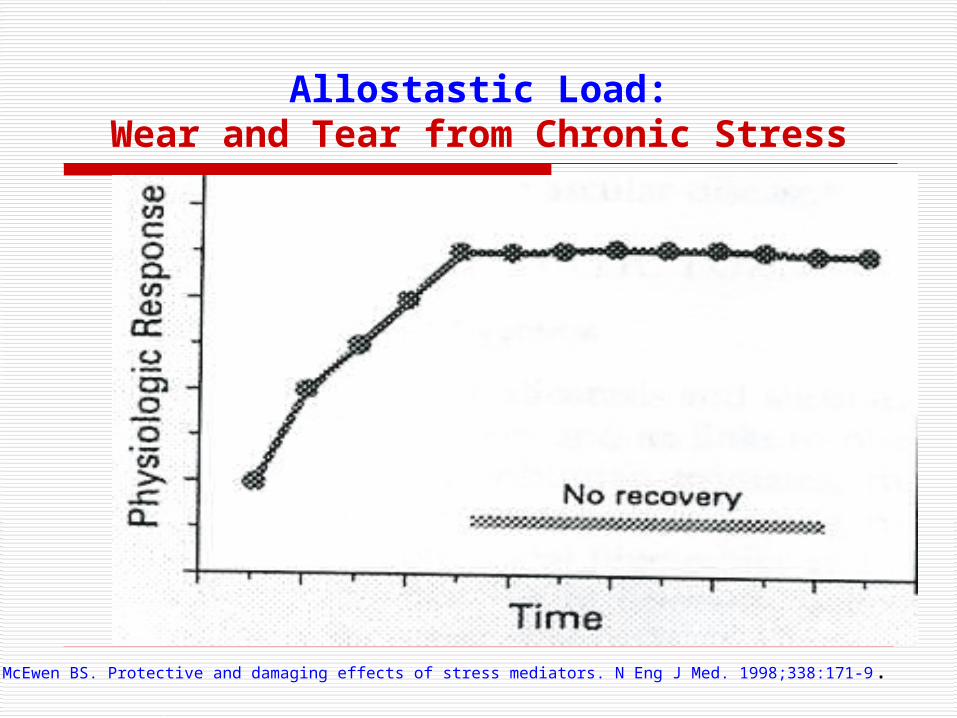
Allostastic Load:Wear and Tear from Chronic Stress
McEwen BS. Protective and damaging effects of stress mediators. N Eng J Med. 1998;338:171-9.

HPA Axis & Immune SystemChikanza 2000

Stressed vs. Stressed Out Stressed
Increased cardiac output
Increased available glucose
Enhanced immune functions
Growth of neurons in hippocampus & prefrontal cortex
Stressed Out
Hypertension & cardiovascular diseases
Glucose intolerance & insulin resistance
Infection & inflammation
Atrophy & death of neurons in hippocampus & prefrontal cortex

Allostasis & Allostatic Load
McEwen BS, Lasley EN. The end of stress: As we know it. Washington DC: John Henry Press. 2002

Rethinking Preterm Birth

Sequelae of Preterm BirthSequelae of Preterm Birth
Term Births
Preterm Birth
75%Perinatal Perinatal MortalityMortality
NeurologicNeurologicDisabilitiesDisabilities
50%
12%

Racial & Ethnic DisparitiesInfant Mortality
13.6
5.7
0
2
4
6
8
10
12
14
African American White
Deaths Per 1,000 Live Births
NCHS 2007
Year 2010 Goal

Racial & Ethnic DisparitiesPreterm Births < 37 Weeks
18.4
11.7
0
2
4
6
8
10
12
14
16
18
20
African American White
Percent of Live Births
NCHS 2007
Year 2010 Goal

Racial & Ethnic DisparitiesVery Preterm Births < 32 Weeks
4.17
1.64
0
0.5
1
1.5
2
2.5
3
3.5
4
4.5
African American White
Percent of Live Singleton Births
Year 2010 Goal
NCHS 2007

Rethinking Preterm Birth
Vulnerability to preterm delivery may be traced to not only exposure to stress & infection during pregnancy, but host response to stress & infection (e.g. stress reactivity & inflammatory dysregulation) patterned over the life course (early programming & cumulative allostatic load)

Preterm Birth &Maternal Ischemic Heart Disease
Kaplan-Meier plots of cumulative probability of survival without admission or death from ischemic heart disease after first pregnancy in relation to preterm birth
Smith et al Lancet 2001;357:2002-06

Improving MCH in America

Research

Pre-disease Pathways
Early and long-term biological, behavioral, psychological and social precursors to disease.

Community Child Health Network(CCHN)
Longitudinal study of the causes of disparities in birth and child health outcomes
4,000 families at 5 locations (LA, Baltimore, DC, NC, Chicago) recruited at birth of index child
One of the richest databases to study developmental origins of child health disparities
Community Based Participatory Research (CBPR) A collaborative process that equitably involves all partners in the research
process and recognizes the unique strengths that each brings. CBPR begins with a research topic of importance to the community with the aim of combining knowledge and action for social change to improve community health and eliminate health disparities (Minkler & Wallerstein 2003)

National Children’s Study Longitudinal study – from before birth to 21 years of age
Cohort of 100,000 children from 100 Study Locations
Study how children’s genes and their environments interact to affect their health and development
In Los Angeles, 4,000 children 56 neighborhoods 67 birth hospitals Followed for 21+ years

Practice

Prenatal Care 1.0
ReceptionistMedical
Assistant
UltrasoundTechNurse Manager

Prenatal Care 2.0
Oral Health
TeratogenInformationServices
Primary &Specialty Care
SocialServices
Mental Health
NutritionalCounseling
ReceptionistMedical
Assistant
Ultrasound TechNurse Manager
High RiskOB
Family Support

0 10 20 30 40 Years
Prenatal Care 3.0
NHVFRCPED
Rep
rodu
ctiv
e P
oten
tial
Optimal Health Development
Lower Health Development
Trajectory
Medical Home for Women’s Health
Medical Home for Adolescent Health
Pediatric Medical Home

HealthcareEducation
CommunityDevelopment
Environment
MCH

NMPPMCH Life-Course
Organization

Policy

Closing the Black-White Gap in Birth Outcomes:A 12-Point Plan
1. Provide interconception care to women with prior adverse pregnancy outcomes2. Increase access to preconception care for African American women3. Improve the quality of prenatal care4. Expand healthcare access over the life course5. Strengthen father involvement in African American families6. Enhance service coordination and systems integration7. Create reproductive social capital in African American communities8. Invest in community building and urban renewal9. Close the education gap10. Reduce poverty among Black families11. Support working mothers and families12. Undo racism
Lu MC, Kotelchuck M, Hogan V, Jones L, Jones C, Halfon N. Closing the Black-White gap in birth outcomes: A life-course approach. Ethnicity and Disease Forthcoming in 2009.

All this will not be finished in the first 100 days. Nor will it be finished in the first 1,000 days, nor in the life of this Administration, nor even perhaps in our lifetime on this planet. But let us begin.
John F Kennedy (1961)