Embed Size (px)
Citation preview
Headquarters U.S. Air ForceI n t e g r i t y - S e r v i c e - E x c e l l e n c e
Headquarters U.S. Air Force
Improving ERP Estimating in the Department of Defensein the Department of Defense
Dr Wilson RosaDr. Wilson Rosa Max Hodal (Wyle)
Brian Kolstad (MCR)Travis Packard
Capt Charles SilvanicDavid Cashin (NCCA)
Mike Tran (NCCA)Noel Bishop (DASA-CE)
1
p ( )June 11, 2010
Approved for Public Release (2010-0371)
Overview
OverviewOverview
I n t e g r i t y - S e r v i c e - E x c e l l e n c e 2
Overview:What is an ERP?What is an ERP?
Enterprise Resource Planning (ERP) softwareA t i ft li ti th t An enterprise software application that Has a single, integrated database Integrates multiple business functions across an Integrates multiple business functions across an
organization onto a single computer system that serves everyone’s needs
Eases the exchange of data and facilitates communication among departments
E h d l k t l f i Each module works separately performing specific data-processing
Typically enabled by Commercial-Off-The-Shelf
I n t e g r i t y - S e r v i c e - E x c e l l e n c e
yp y y(COTS) Software (SW)
3
Overview:ERP vs Traditional SWERP vs. Traditional SW
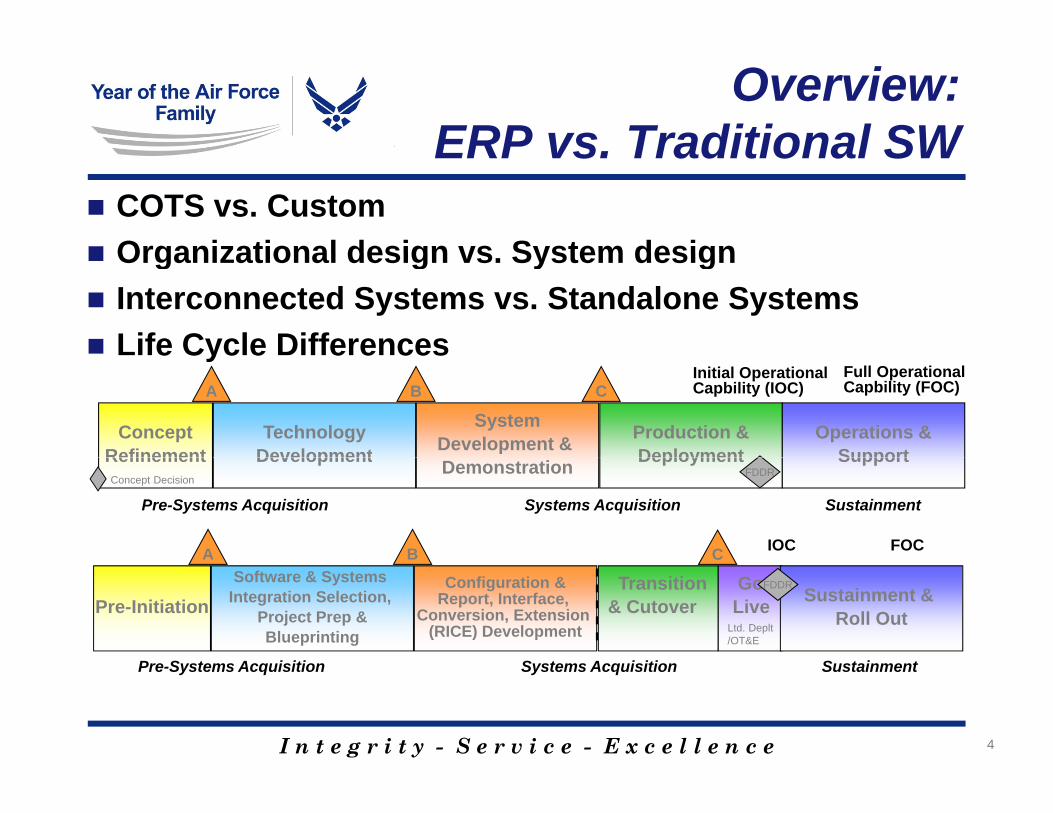
COTS vs. Custom Organizational design vs System design Organizational design vs. System design Interconnected Systems vs. Standalone Systems Life Cycle Differences
ConceptRefinement
TechnologyDevelopment
SystemDevelopment & Production &
DeploymentOperations &
Support
A B CInitial Operational Capbility (IOC)
e Cyc e e e cesFull Operational Capbility (FOC)
Refinement Development Demonstration Deployment Support
Pre-Systems Acquisition Systems Acquisition Sustainment
A B C IOC FOC
FDDRConcept Decision
GoLivePre-Initiation
Software & Systems Integration Selection,
Project Prep &Blueprinting
Configuration &Report, Interface,
Conversion, Extension (RICE) Development
Sustainment & Roll Out
P S t A i iti S t A i iti S t i t
FDDRTransition& Cutover
Ltd. Deplt/OT&E
I n t e g r i t y - S e r v i c e - E x c e l l e n c e 4
Pre-Systems Acquisition Systems Acquisition Sustainment
ERP Investment Cost Allocation
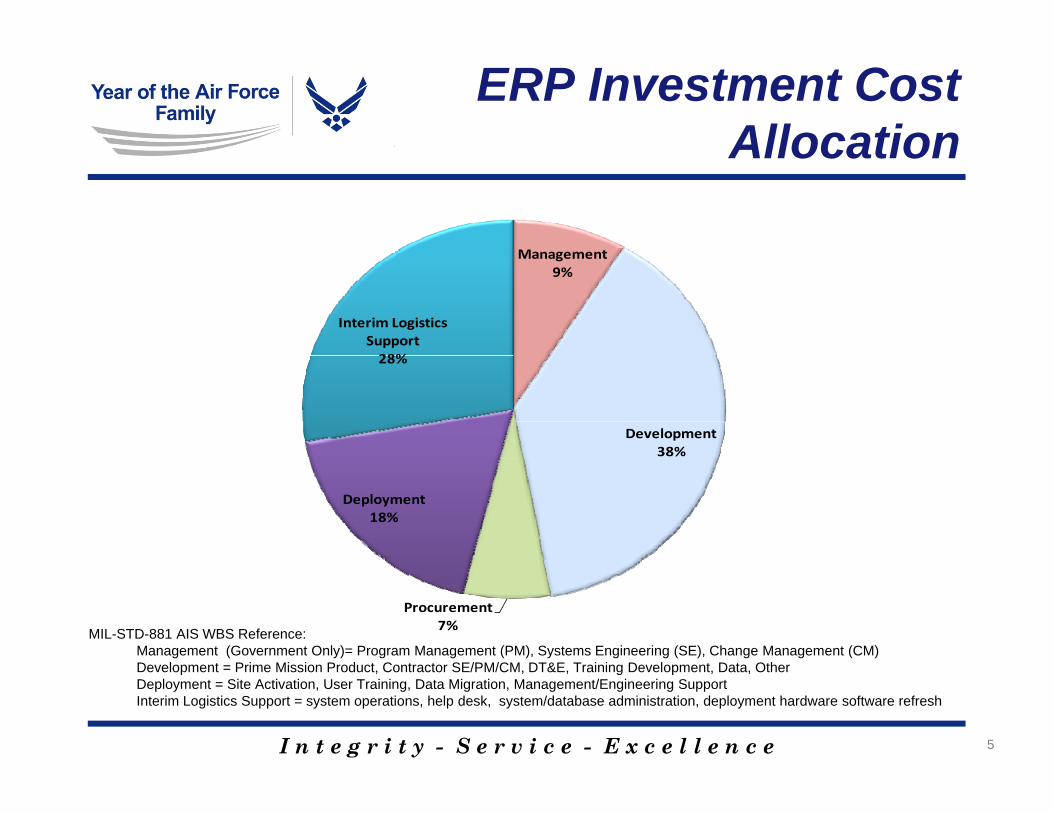
Management
Allocation
Management9%
Interim Logistics Support28%
Development38%
28%
Deployment18%
Procurement7%MIL-STD-881 AIS WBS Reference:
Management (Government Only)= Program Management (PM), Systems Engineering (SE), Change Management (CM) D l t P i Mi i P d t C t t SE/PM/CM DT&E T i i D l t D t Oth
I n t e g r i t y - S e r v i c e - E x c e l l e n c e 5
Development = Prime Mission Product, Contractor SE/PM/CM, DT&E, Training Development, Data, OtherDeployment = Site Activation, User Training, Data Migration, Management/Engineering SupportInterim Logistics Support = system operations, help desk, system/database administration, deployment hardware software refresh
Main Challenges with ERP EstimatingERP Estimating
Cost Body of Knowledge Unfamiliar with Cost and Schedule Drivers Limited ERP Cost Research Few “white papers” found on cost drivers but
none provide supporting data
P li d G id Policy and Guidance Limited data to support Program Decision
reviews and Weapon Systems Reform Act of 2009reviews and Weapon Systems Reform Act of 2009
I n t e g r i t y - S e r v i c e - E x c e l l e n c e 6
Cost Improvement InitiativeInitiative
I n t e g r i t y - S e r v i c e - E x c e l l e n c e 7
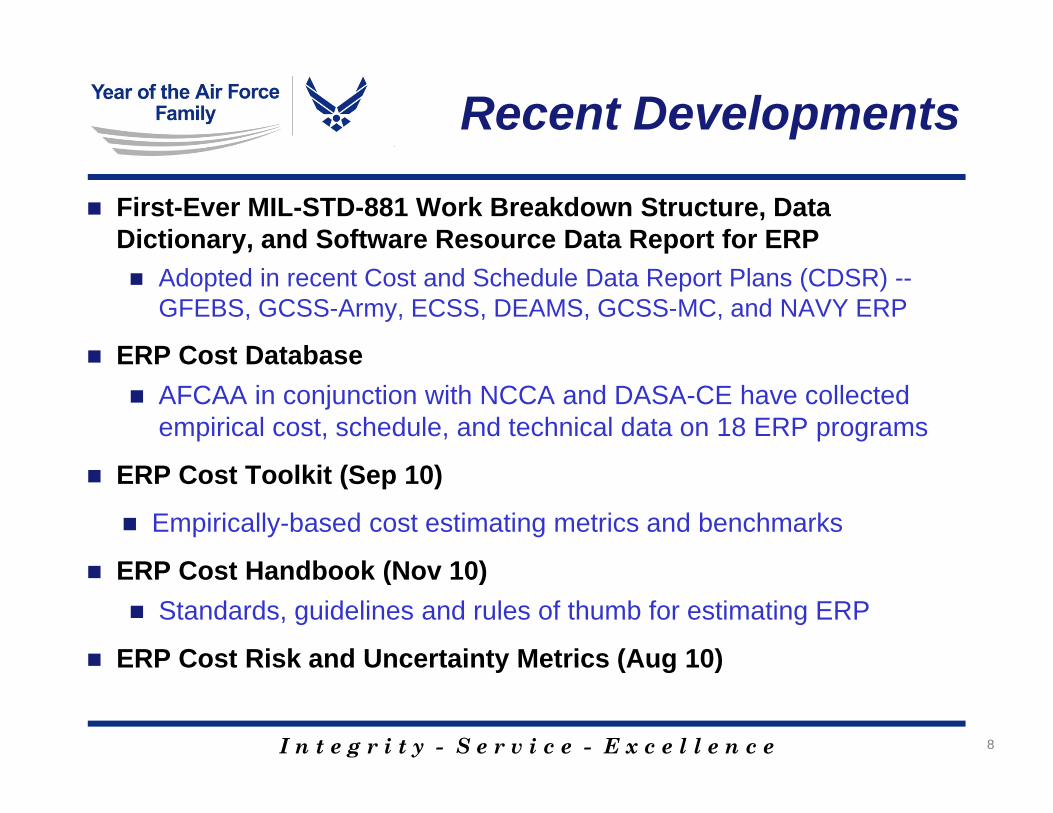
Recent Developments
First-Ever MIL-STD-881 Work Breakdown Structure, Data Dictionary, and Software Resource Data Report for ERPy p Adopted in recent Cost and Schedule Data Report Plans (CDSR) --
GFEBS, GCSS-Army, ECSS, DEAMS, GCSS-MC, and NAVY ERP
ERP Cost Database ERP Cost Database AFCAA in conjunction with NCCA and DASA-CE have collected
empirical cost, schedule, and technical data on 18 ERP programs
ERP Cost Toolkit (Sep 10)
Empirically-based cost estimating metrics and benchmarks
C ( 10) ERP Cost Handbook (Nov 10) Standards, guidelines and rules of thumb for estimating ERP
ERP Cost Risk and Uncertainty Metrics (Aug 10)
I n t e g r i t y - S e r v i c e - E x c e l l e n c e
ERP Cost Risk and Uncertainty Metrics (Aug 10)
8
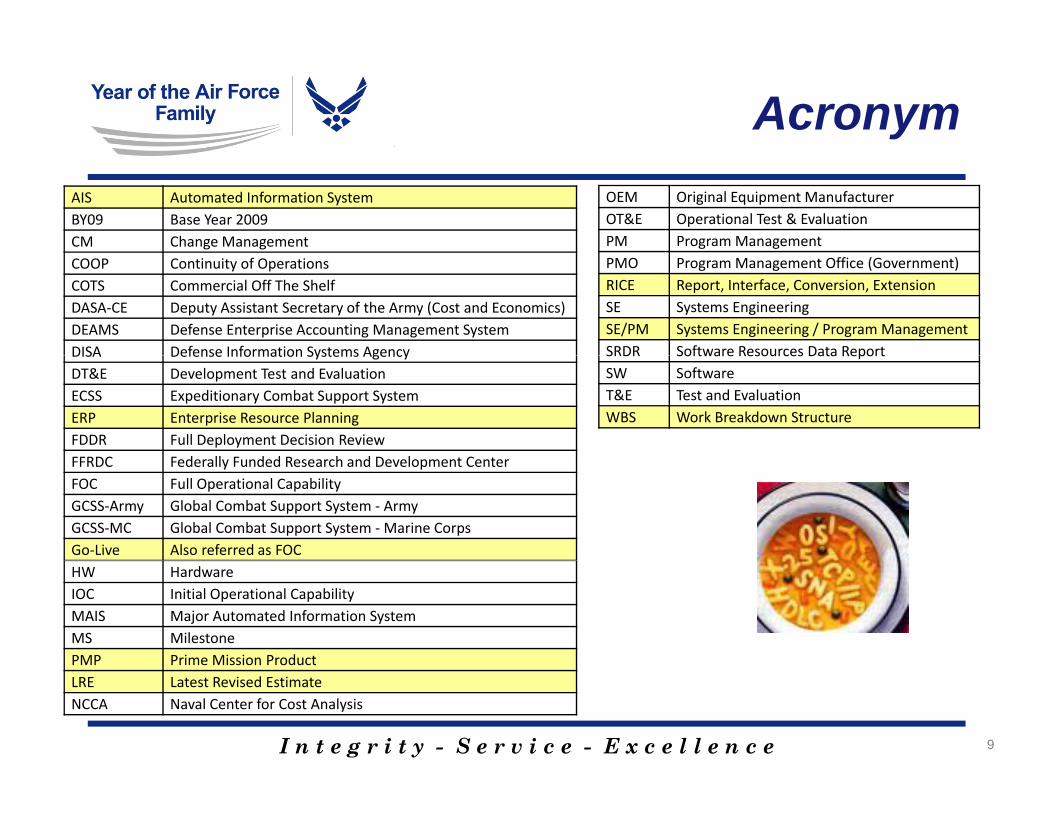
AcronymAIS Automated Information SystemBY09 Base Year 2009 CM Change Management
OEM Original Equipment ManufacturerOT&E Operational Test & EvaluationPM Program Management
COOP Continuity of OperationsCOTS Commercial Off The ShelfDASA‐CE Deputy Assistant Secretary of the Army (Cost and Economics)DEAMS Defense Enterprise Accounting Management SystemDISA Defense Information Systems Agency
PMO Program Management Office (Government)RICE Report, Interface, Conversion, ExtensionSE Systems EngineeringSE/PM Systems Engineering / Program ManagementSRDR Software Resources Data ReportDISA Defense Information Systems Agency
DT&E Development Test and EvaluationECSS Expeditionary Combat Support SystemERP Enterprise Resource PlanningFDDR Full Deployment Decision ReviewFFRDC F d ll F d d R h d D l t C t
SRDR Software Resources Data ReportSW SoftwareT&E Test and EvaluationWBS Work Breakdown Structure
FFRDC Federally Funded Research and Development CenterFOC Full Operational CapabilityGCSS‐Army Global Combat Support System ‐ ArmyGCSS‐MC Global Combat Support System ‐Marine CorpsGo‐Live Also referred as FOCHW HardwareIOC Initial Operational CapabilityMAIS Major Automated Information SystemMS MilestonePMP Prime Mission Product
I n t e g r i t y - S e r v i c e - E x c e l l e n c e
PMP Prime Mission ProductLRE Latest Revised EstimateNCCA Naval Center for Cost Analysis
9
Performance Tracker
Performance TrackerPerformance Tracker
I n t e g r i t y - S e r v i c e - E x c e l l e n c e 10
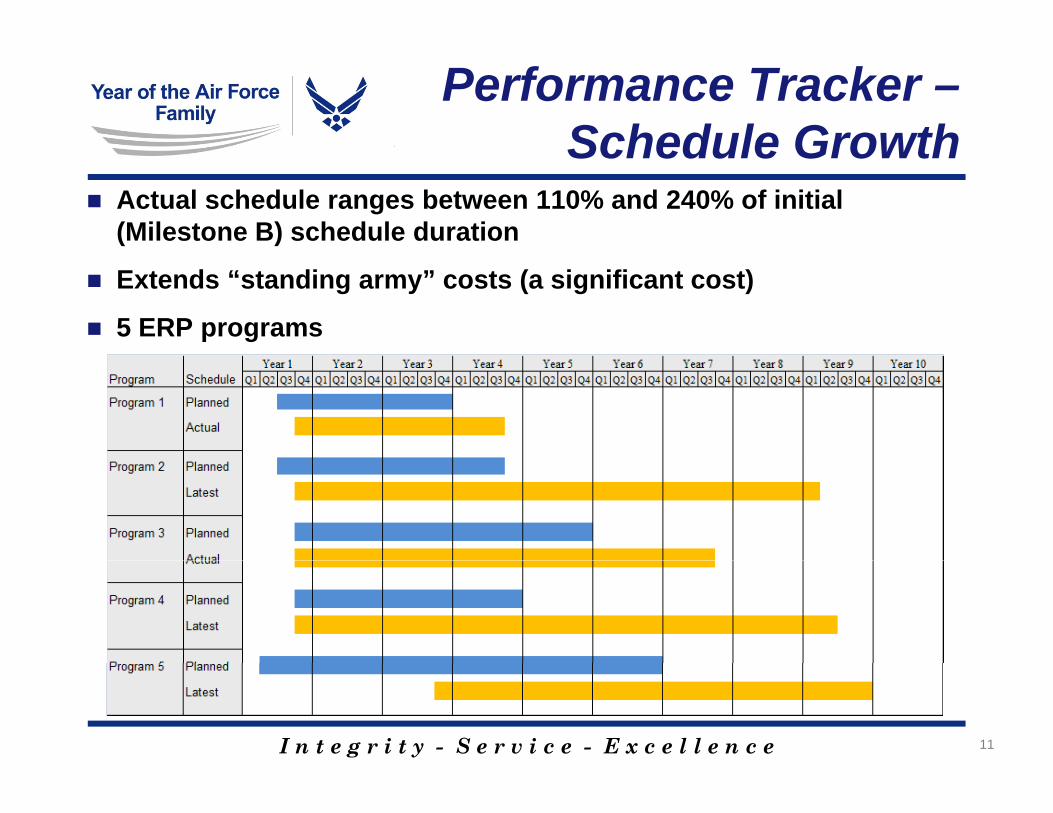
Performance Tracker –Schedule GrowthSchedule Growth
Actual schedule ranges between 110% and 240% of initial (Milestone B) schedule duration
Extends “standing army” costs (a significant cost)
5 ERP programs
I n t e g r i t y - S e r v i c e - E x c e l l e n c e 11
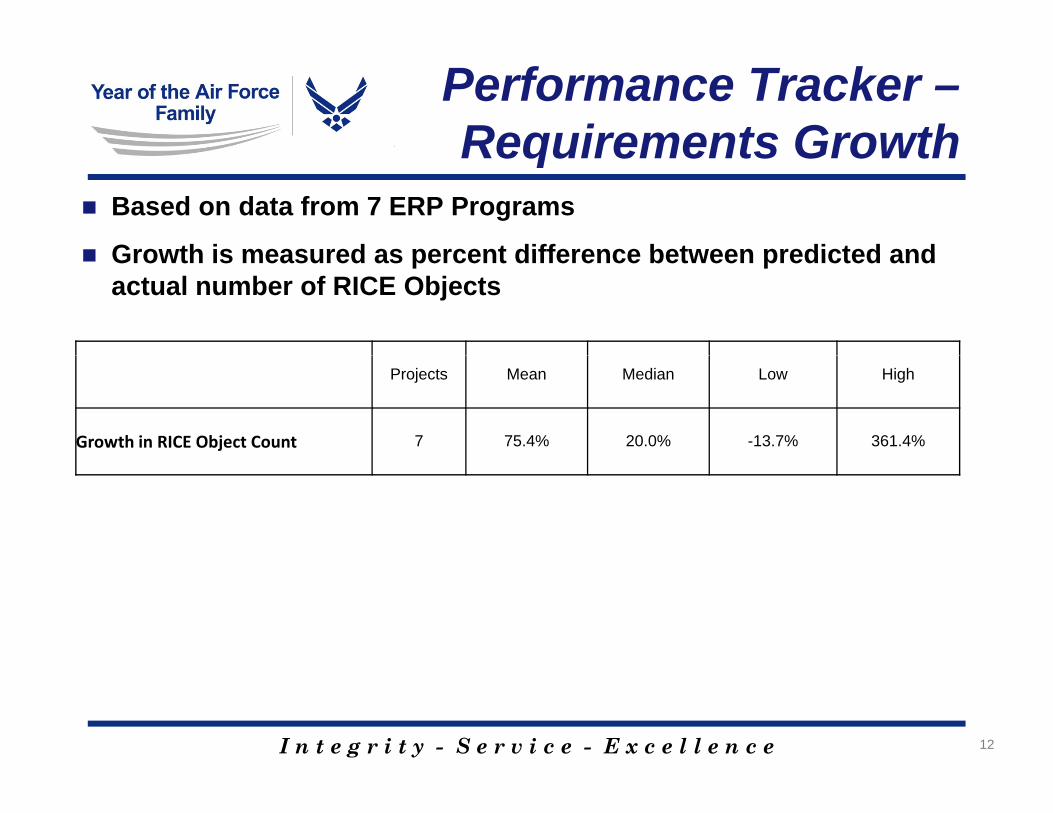
Performance Tracker –Requirements GrowthRequirements Growth
Based on data from 7 ERP Programs
Growth is measured as percent difference between predicted and Growth is measured as percent difference between predicted and actual number of RICE Objects
Projects Mean Median Low High
Growth in RICE Object Count 7 75.4% 20.0% -13.7% 361.4%
I n t e g r i t y - S e r v i c e - E x c e l l e n c e 12
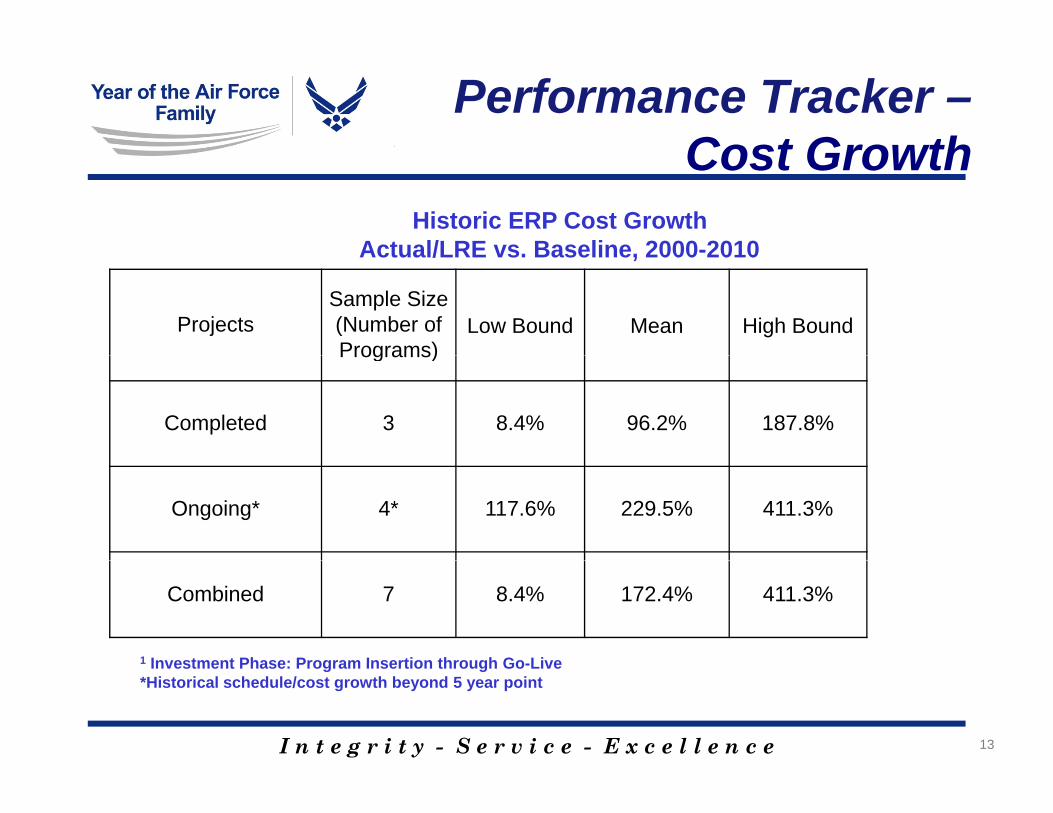
Performance Tracker –Cost GrowthCost Growth
Historic ERP Cost GrowthActual/LRE vs Baseline 2000-2010
ProjectsSample Size (Number of Programs)
Low Bound Mean High Bound
Actual/LRE vs. Baseline, 2000 2010
Programs)
Completed 3 8.4% 96.2% 187.8%
Ongoing* 4* 117.6% 229.5% 411.3%
Combined 7 8.4% 172.4% 411.3%
1 Investment Phase: Program Insertion through Go Live
I n t e g r i t y - S e r v i c e - E x c e l l e n c e
1 Investment Phase: Program Insertion through Go-Live*Historical schedule/cost growth beyond 5 year point
13
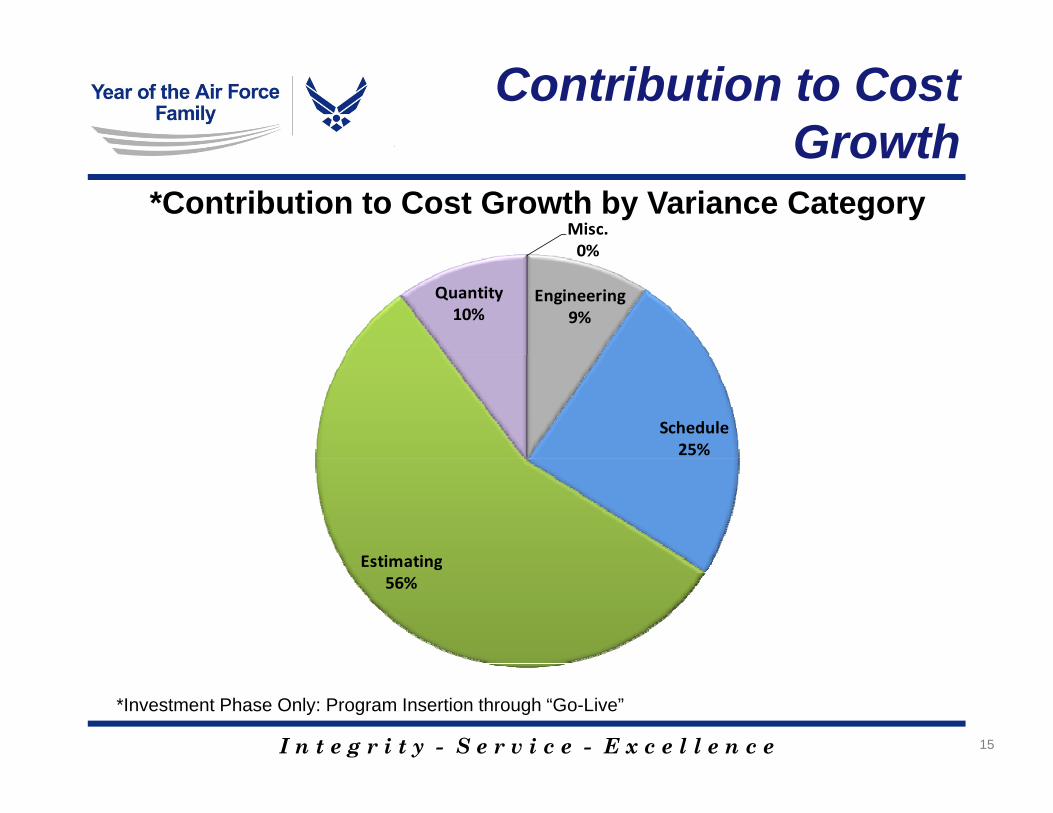
Contribution to Cost Growth
Misc.0%
Growth*Contribution to Cost Growth by Variance Category
Engineering9%
Quantity10%
0%
Schedule25%
EstimatingEstimating56%
I n t e g r i t y - S e r v i c e - E x c e l l e n c e
*Investment Phase Only: Program Insertion through “Go-Live”
15
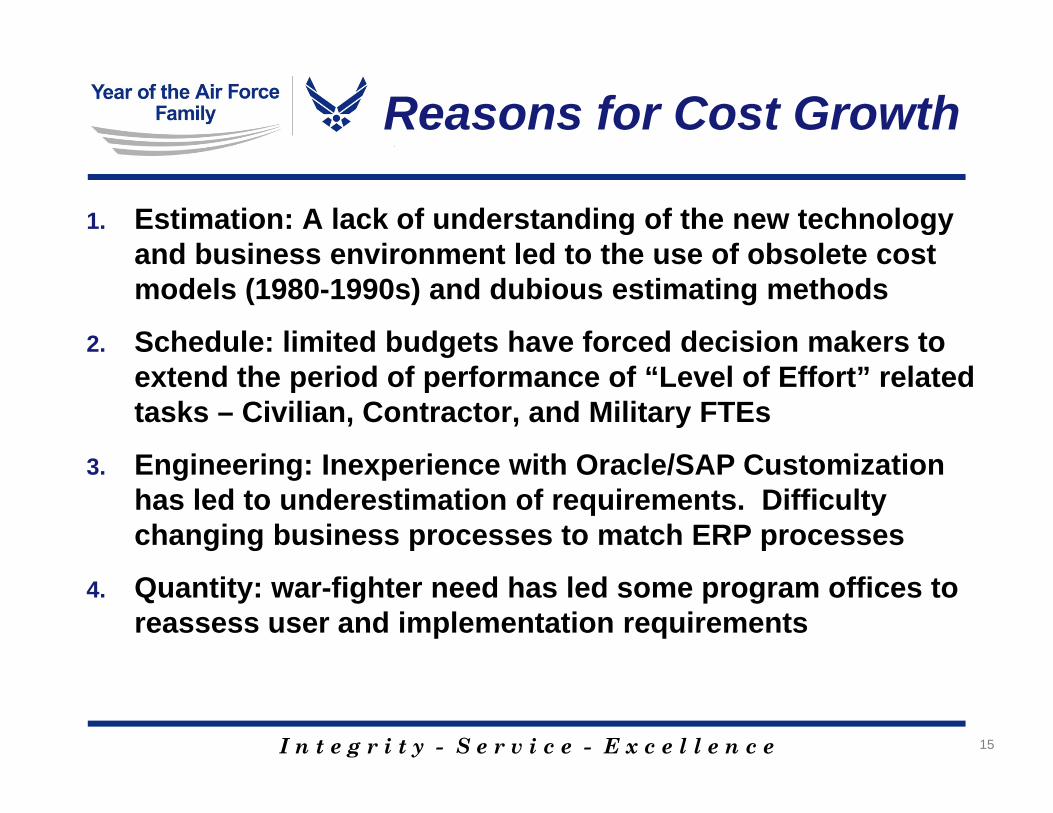
Reasons for Cost Growth
1. Estimation: A lack of understanding of the new technology and business environment led to the use of obsolete costand business environment led to the use of obsolete cost models (1980-1990s) and dubious estimating methods
2. Schedule: limited budgets have forced decision makers to gextend the period of performance of “Level of Effort” related tasks – Civilian, Contractor, and Military FTEs
3 E i i I i ith O l /SAP C t i ti3. Engineering: Inexperience with Oracle/SAP Customization has led to underestimation of requirements. Difficulty changing business processes to match ERP processes
4. Quantity: war-fighter need has led some program offices to reassess user and implementation requirements
I n t e g r i t y - S e r v i c e - E x c e l l e n c e 15
Major Costs
Major Costsj
I n t e g r i t y - S e r v i c e - E x c e l l e n c e 16
Major Costs:BackgroundBackground
The primary purpose of any metrics provided p y p p y pis to give the estimator insight into reasonable bounds and benchmarks for program size and
tcost.
The benchmarks in this presentation should not be used for a primary estimating methodology!!!
I n t e g r i t y - S e r v i c e - E x c e l l e n c e 17
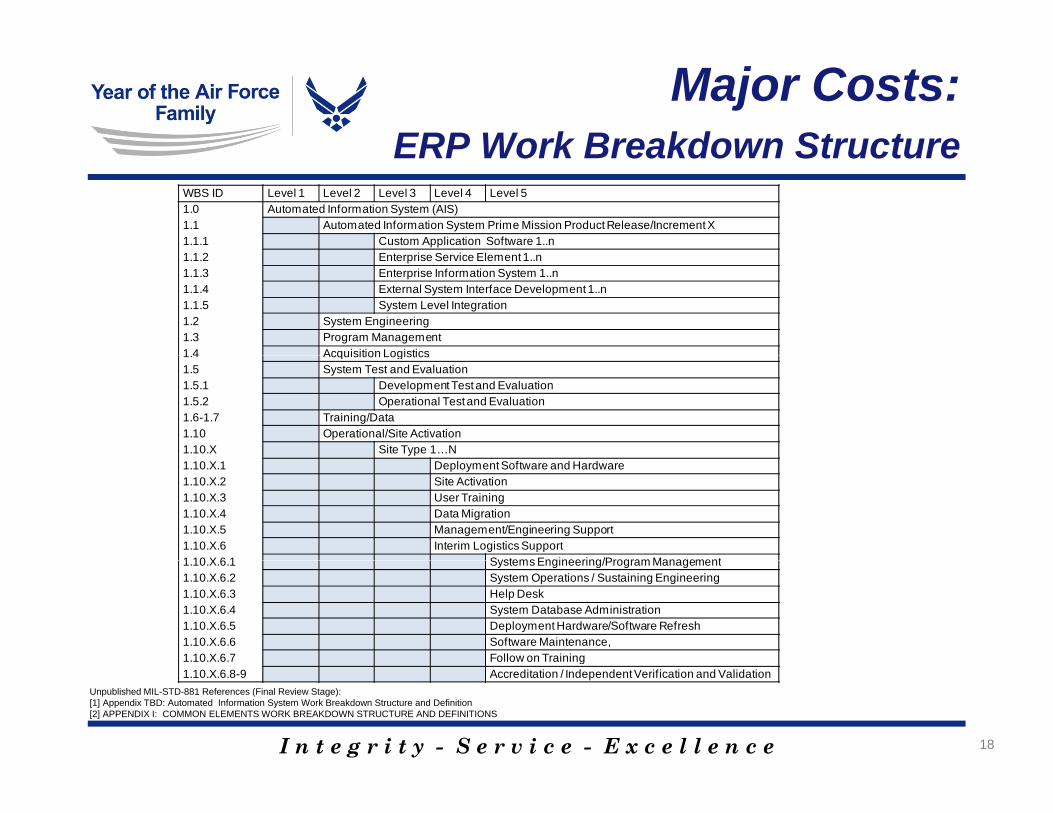
Major Costs:ERP Work Breakdown StructureERP Work Breakdown Structure
WBS ID Level 1 Level 2 Level 3 Level 4 Level 51.0 Automated Information System (AIS)1.1 Automated Information System Prime Mission Product Release/Increment X1.1.1 Custom Application Software 1..n1 1 2 E t i S i El t 11.1.2 Enterprise Service Element 1..n1.1.3 Enterprise Information System 1..n1.1.4 External System Interface Development 1..n1.1.5 System Level Integration1.2 System Engineering1.3 Program Management1 4 Acquisition Logistics1.4 Acquisition Logistics1.5 System Test and Evaluation1.5.1 Development Test and Evaluation1.5.2 Operational Test and Evaluation1.6-1.7 Training/Data1.10 Operational/Site Activation1.10.X Site Type 1…N1.10.X.1 Deployment Software and Hardware1.10.X.2 Site Activation1.10.X.3 User Training1.10.X.4 Data Migration1.10.X.5 Management/Engineering Support1.10.X.6 Interim Logistics Support1 10 X 6 1 Systems Engineering/Program Management1.10.X.6.1 Systems Engineering/Program Management1.10.X.6.2 System Operations / Sustaining Engineering1.10.X.6.3 Help Desk1.10.X.6.4 System Database Administration1.10.X.6.5 Deployment Hardware/Software Refresh1.10.X.6.6 Software Maintenance,1.10.X.6.7 Follow on Training
I n t e g r i t y - S e r v i c e - E x c e l l e n c e 18
Unpublished MIL-STD-881 References (Final Review Stage):[1] Appendix TBD: Automated Information System Work Breakdown Structure and Definition[2] APPENDIX I: COMMON ELEMENTS WORK BREAKDOWN STRUCTURE AND DEFINITIONS
g1.10.X.6.8-9 Accreditation / Independent Verification and Validation
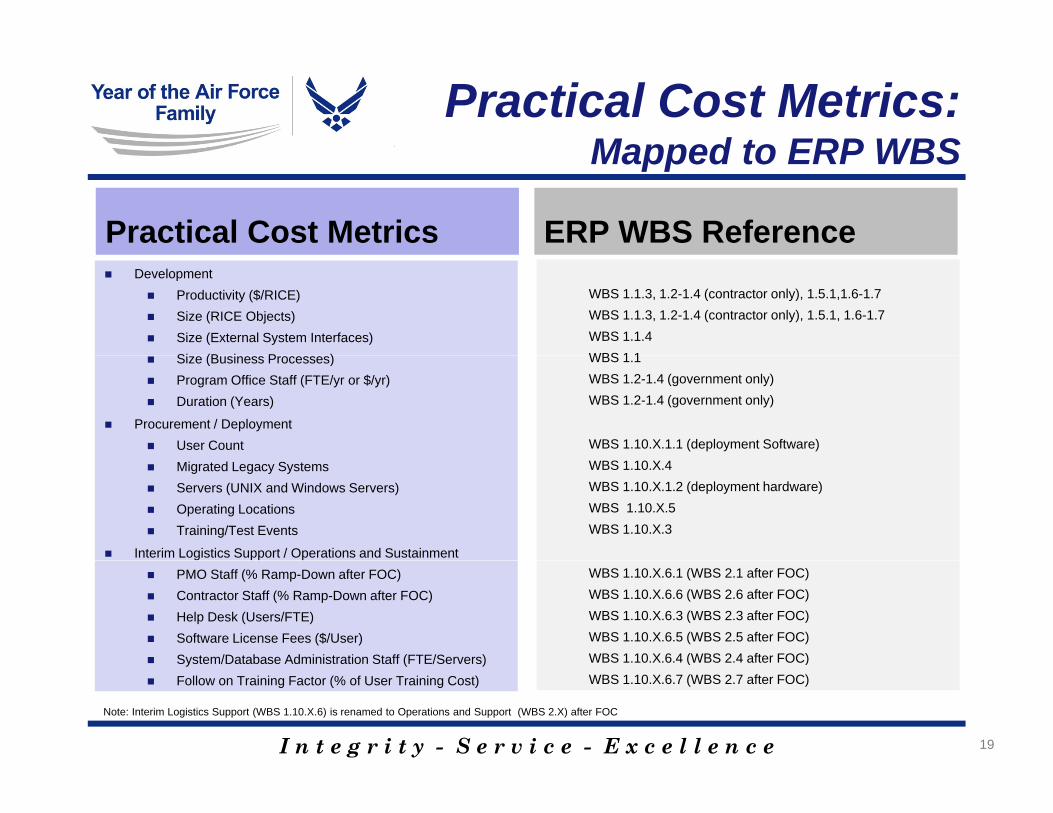
Practical Cost Metrics:Mapped to ERP WBSMapped to ERP WBS
Practical Cost Metrics ERP WBS Reference Development
Productivity ($/RICE) Size (RICE Objects) Size (External System Interfaces)
Si (B i P )
DevelopmentWBS 1.1.3, 1.2-1.4 (contractor only), 1.5.1,1.6-1.7WBS 1.1.3, 1.2-1.4 (contractor only), 1.5.1, 1.6-1.7WBS 1.1.4WBS 1 1 Size (Business Processes)
Program Office Staff (FTE/yr or $/yr) Duration (Years)
Procurement / Deployment User Count
WBS 1.1WBS 1.2-1.4 (government only)WBS 1.2-1.4 (government only)
Procurement / DeploymentWBS 1.10.X.1.1 (deployment Software)
Migrated Legacy Systems Servers (UNIX and Windows Servers) Operating Locations Training/Test Events
Interim Logistics Support / Operations and Sustainment
WBS 1.10.X.4 WBS 1.10.X.1.2 (deployment hardware)WBS 1.10.X.5WBS 1.10.X.3
Operations and Sustainment
PMO Staff (% Ramp-Down after FOC) Contractor Staff (% Ramp-Down after FOC) Help Desk (Users/FTE) Software License Fees ($/User) System/Database Administration Staff (FTE/Servers)
WBS 1.10.X.6.1 (WBS 2.1 after FOC)WBS 1.10.X.6.6 (WBS 2.6 after FOC)WBS 1.10.X.6.3 (WBS 2.3 after FOC)WBS 1.10.X.6.5 (WBS 2.5 after FOC)WBS 1.10.X.6.4 (WBS 2.4 after FOC)
I n t e g r i t y - S e r v i c e - E x c e l l e n c e
System/Database Administration Staff (FTE/Servers) Follow on Training Factor (% of User Training Cost)
19
( )WBS 1.10.X.6.7 (WBS 2.7 after FOC)
Note: Interim Logistics Support (WBS 1.10.X.6) is renamed to Operations and Support (WBS 2.X) after FOC
Major Costs
Major Cost Drivers:
D lDevelopment
I n t e g r i t y - S e r v i c e - E x c e l l e n c e 20
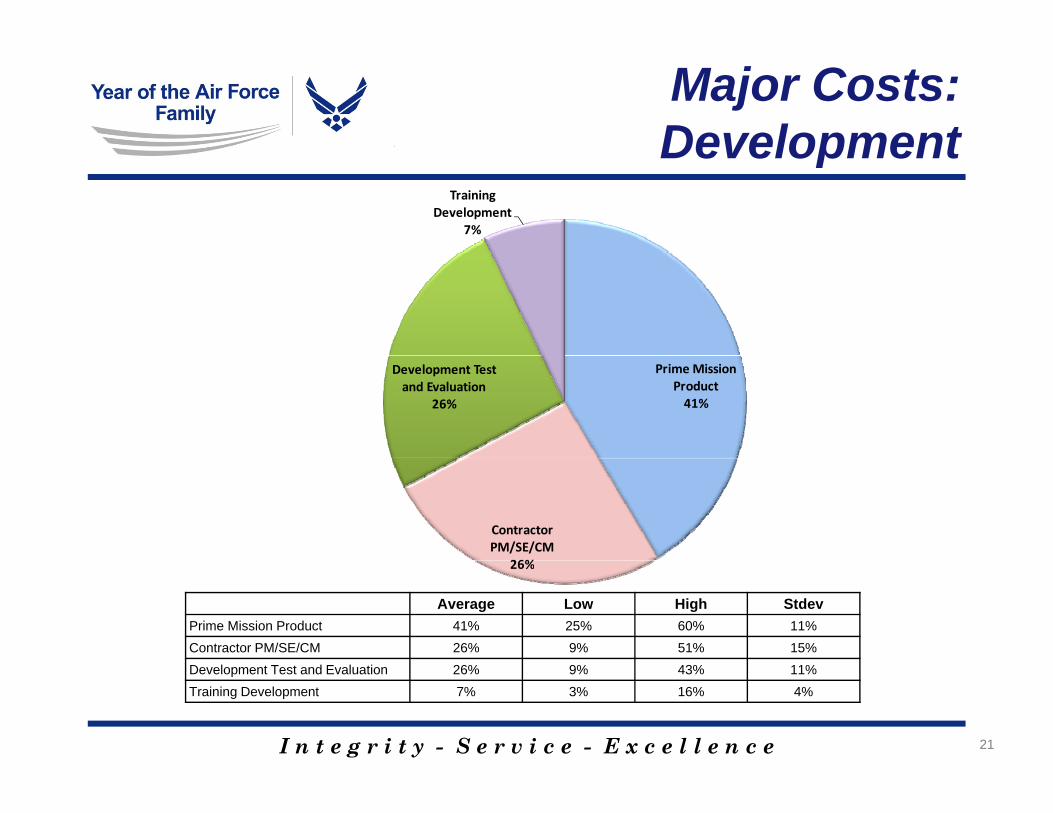
Major Costs:DevelopmentDevelopment
Training Development
7%
Prime Mission Product41%
Development Test and Evaluation
26%
Contractor PM/SE/CM
26%26%
Average Low High StdevPrime Mission Product 41% 25% 60% 11%Contractor PM/SE/CM 26% 9% 51% 15%
I n t e g r i t y - S e r v i c e - E x c e l l e n c e
Development Test and Evaluation 26% 9% 43% 11%Training Development 7% 3% 16% 4%
21
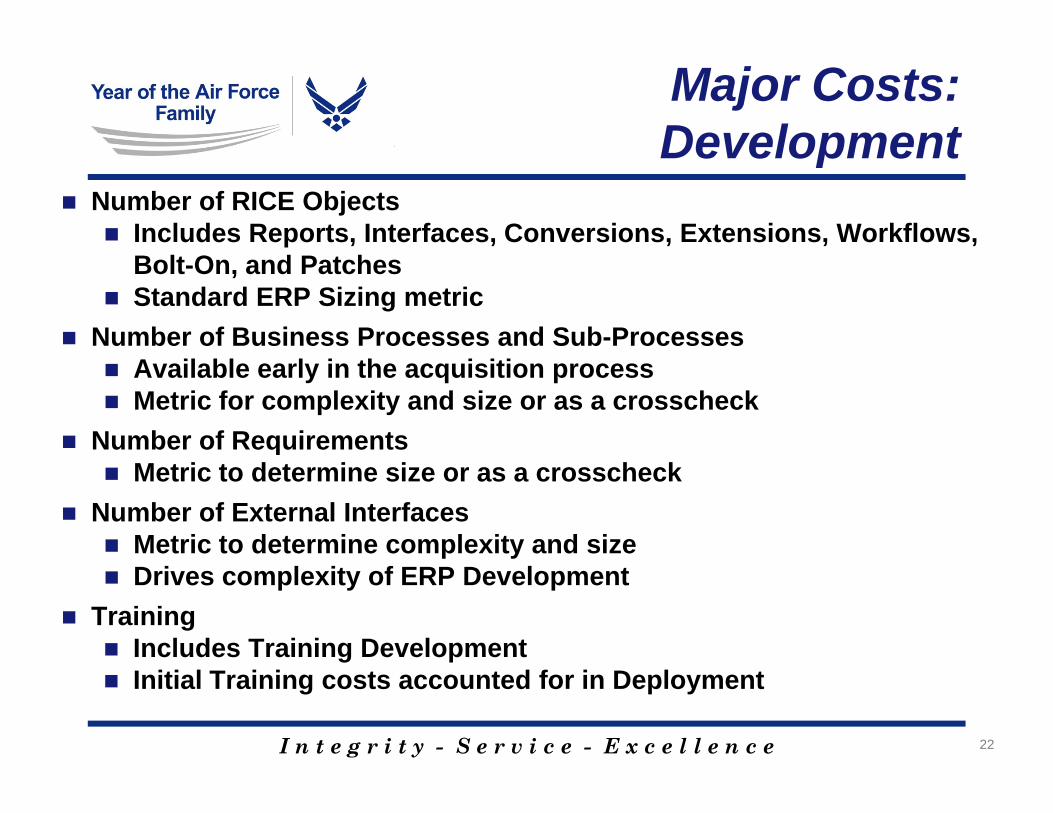
Major Costs:DevelopmentDevelopment
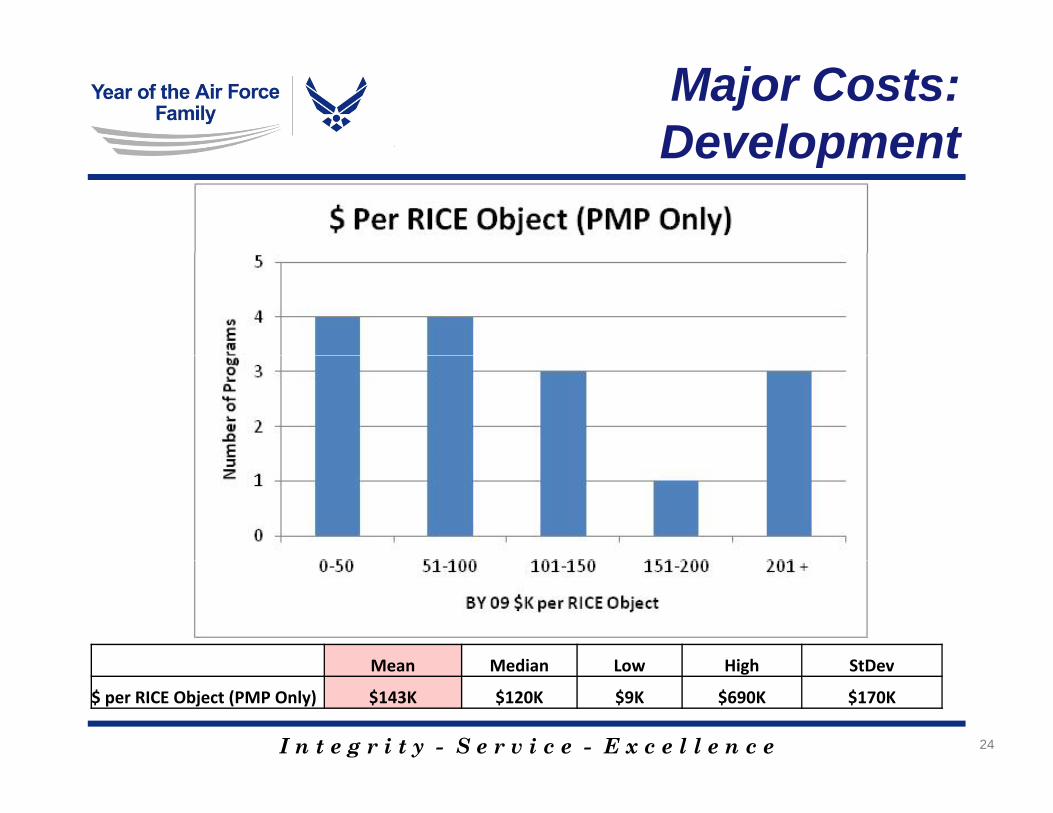
Number of RICE Objects Includes Reports, Interfaces, Conversions, Extensions, Workflows,
Bolt-On, and Patches Standard ERP Sizing metric
Number of Business Processes and Sub-Processes Available early in the acquisition process Metric for complexity and size or as a crosscheck
Number of Requirements Metric to determine size or as a crosscheck
Number of External Interfaces Metric to determine complexity and size Drives complexity of ERP Development
Training Includes Training Development
I n t e g r i t y - S e r v i c e - E x c e l l e n c e
Initial Training costs accounted for in Deployment
22

Major Costs:DevelopmentDevelopment
Mean Median Low High StDev$ per RICE Object (PMP Only) $143K $120K $9K $690K $170K
I n t e g r i t y - S e r v i c e - E x c e l l e n c e 23
$ per RICE Object (PMP Only) $143K $120K $9K $690K $170K$ per RICE Object (Development*) $400K $255K $20K $1,318K $377K
*Development = Prime Mission Product, Contractor SE/PM/CM, DT&E, Training Development, Data, Other
Major Costs:DevelopmentDevelopment
Mean Median Low High StDev
I n t e g r i t y - S e r v i c e - E x c e l l e n c e 24
Mean Median Low High StDev
$ per RICE Object (PMP Only) $143K $120K $9K $690K $170K
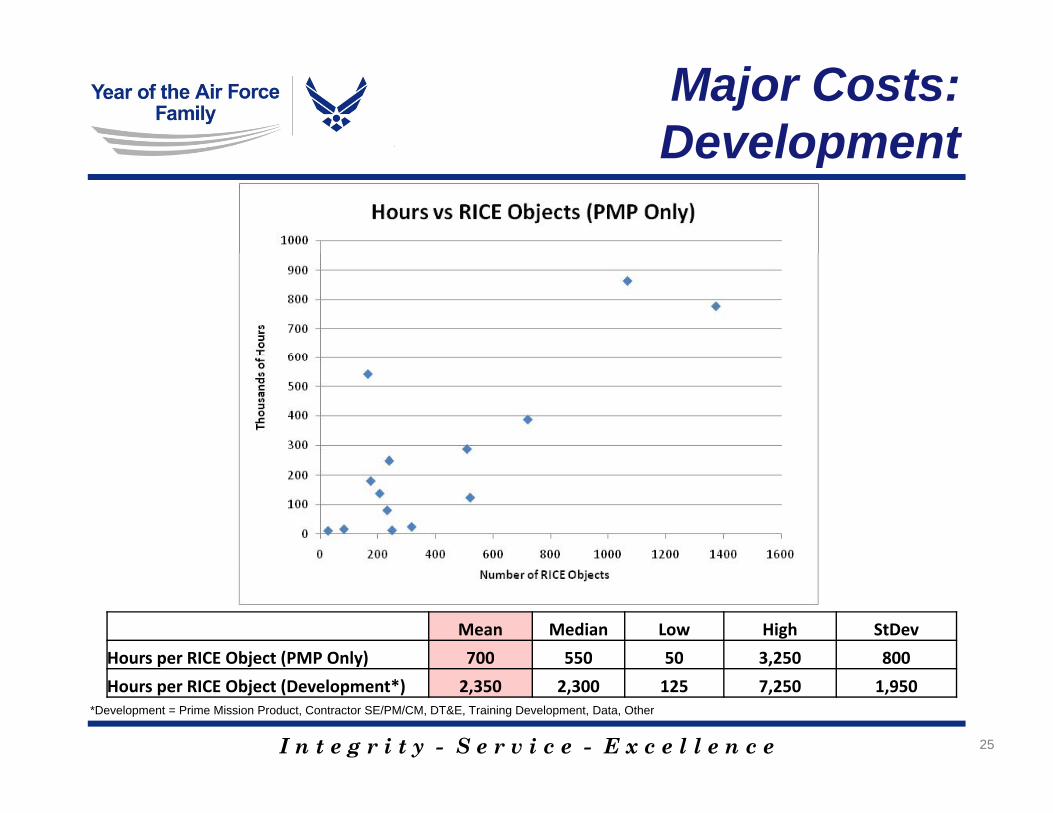
Major Costs:DevelopmentDevelopment
Mean Median Low High StDev
Hours per RICE Object (PMP Only) 700 550 50 3,250 800
I n t e g r i t y - S e r v i c e - E x c e l l e n c e 25
Hours per RICE Object (PMP Only) 700 550 50 3,250 800
Hours per RICE Object (Development*) 2,350 2,300 125 7,250 1,950*Development = Prime Mission Product, Contractor SE/PM/CM, DT&E, Training Development, Data, Other
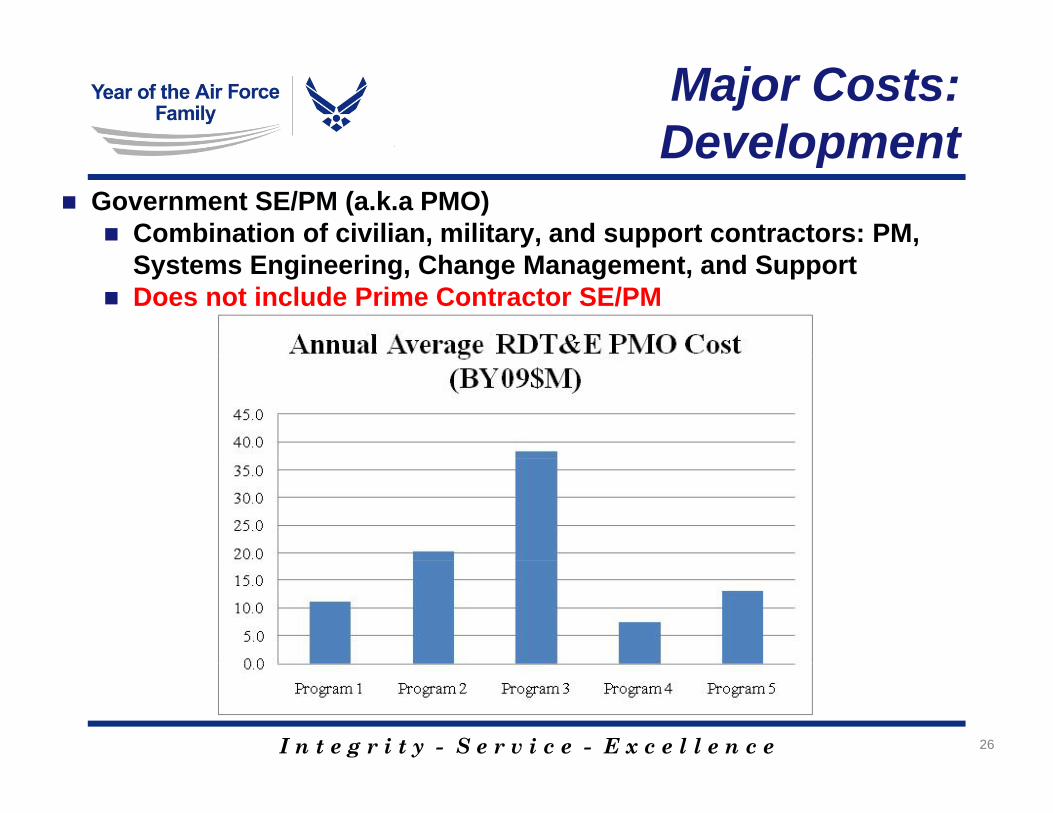
Major Costs:DevelopmentDevelopment
Government SE/PM (a.k.a PMO) Combination of civilian, military, and support contractors: PM,
Systems Engineering, Change Management, and Support Does not include Prime Contractor SE/PM
I n t e g r i t y - S e r v i c e - E x c e l l e n c e 26
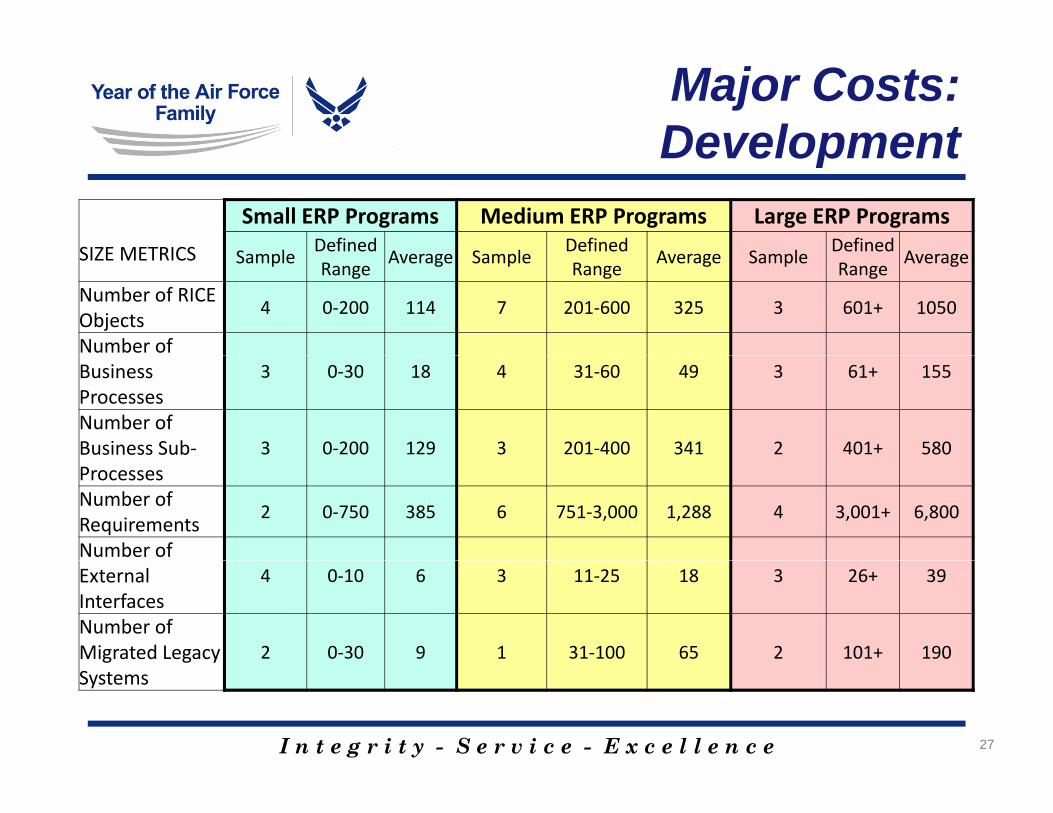
Major Costs:DevelopmentDevelopment
SIZE METRICS
Small ERP Programs Medium ERP Programs Large ERP Programs
S lDefined
A S lDefined
A S lDefined
ASIZE METRICS SampleRange
Average SampleRange
Average SampleRange
Average
Number of RICE Objects
4 0‐200 114 7 201‐600 325 3 601+ 1050
Number of Business Processes
3 0‐30 18 4 31‐60 49 3 61+ 155
Number of Business Sub‐ 3 0‐200 129 3 201‐400 341 2 401+ 580ProcessesNumber of Requirements
2 0‐750 385 6 751‐3,000 1,288 4 3,001+ 6,800
Number of External Interfaces
4 0‐10 6 3 11‐25 18 3 26+ 39
Number of Migrated Legacy 2 0‐30 9 1 31‐100 65 2 101+ 190
I n t e g r i t y - S e r v i c e - E x c e l l e n c e 27
Systems
Major Costs
Major Costs:
Procurement and Deployment
I n t e g r i t y - S e r v i c e - E x c e l l e n c e 28
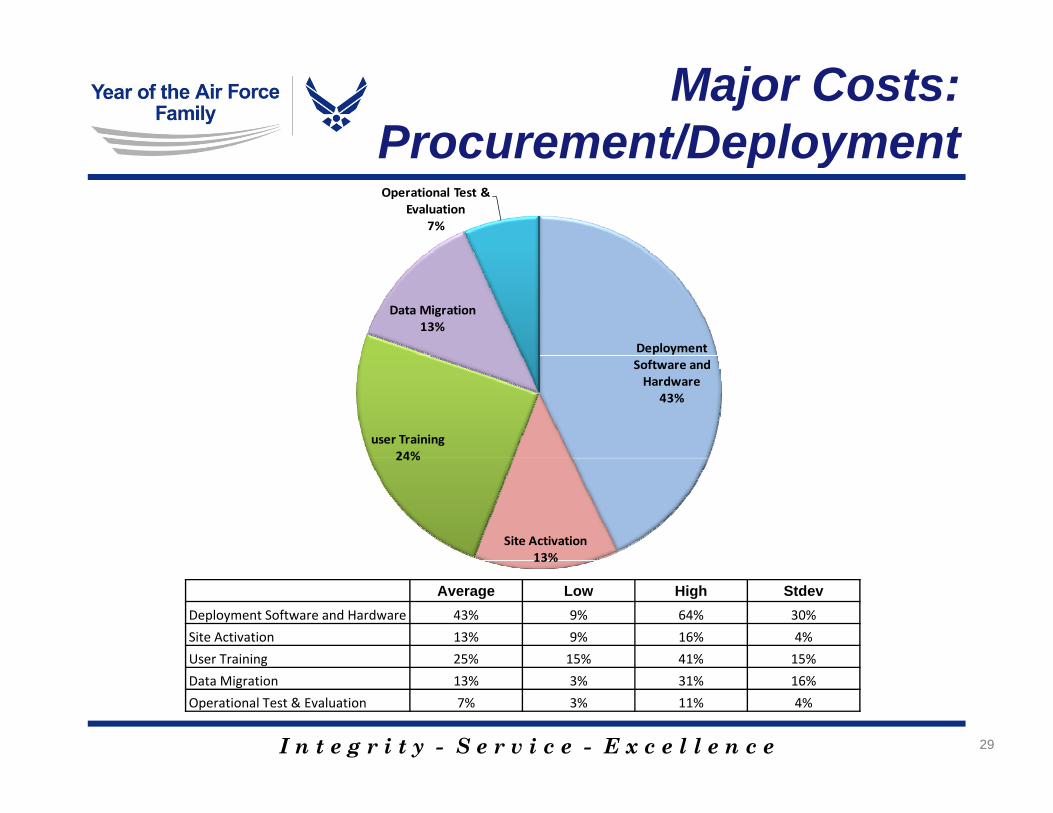
Major Costs:Procurement/DeploymentOperational Test &
Evaluation7%
Procurement/Deployment
Deployment
Data Migration13%
Software and Hardware
43%
user Training24%
Site Activation13%
24%
13%
Average Low High StdevDeployment Software and Hardware 43% 9% 64% 30%
Site Activation 13% 9% 16% 4%
User Training 25% 15% 41% 15%
I n t e g r i t y - S e r v i c e - E x c e l l e n c e
User Training 25% 15% 41% 15%
Data Migration 13% 3% 31% 16%
Operational Test & Evaluation 7% 3% 11% 4%
29
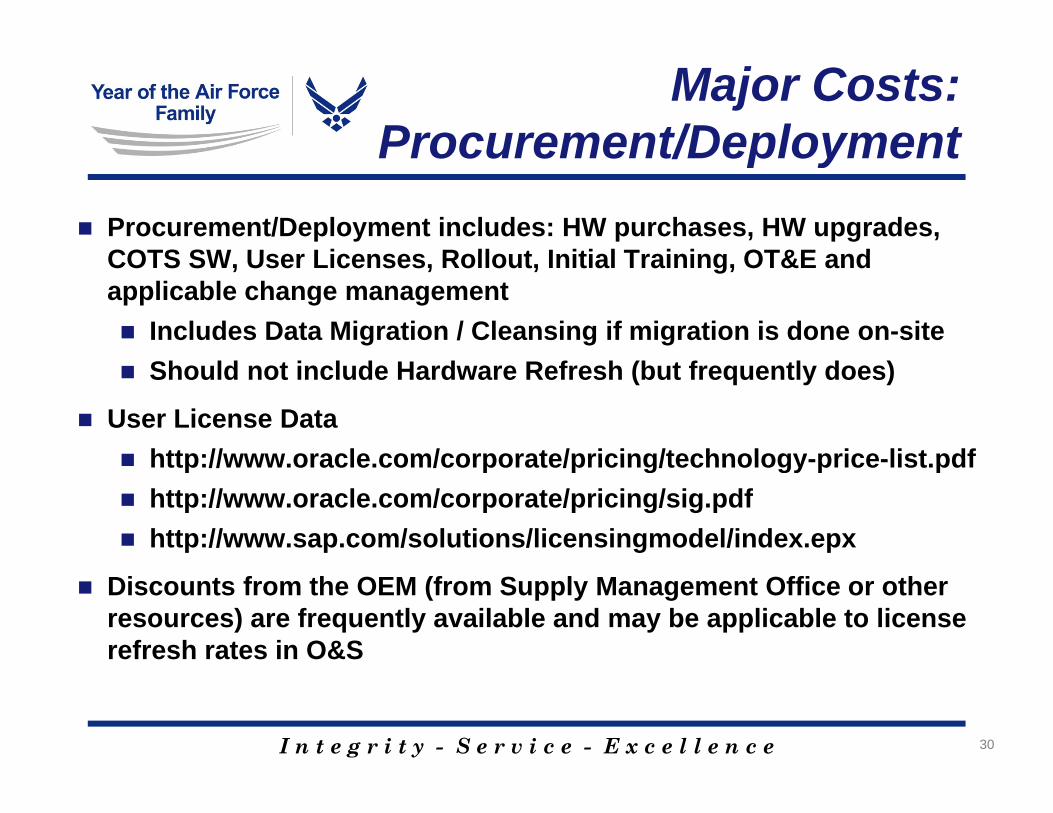
Major Costs:Procurement/DeploymentProcurement/Deployment
Procurement/Deployment includes: HW purchases, HW upgrades, COTS SW U Li R ll t I iti l T i i OT&E dCOTS SW, User Licenses, Rollout, Initial Training, OT&E and applicable change management Includes Data Migration / Cleansing if migration is done on-site Should not include Hardware Refresh (but frequently does)
User License Data http://www oracle com/corporate/pricing/technology price list pdf http://www.oracle.com/corporate/pricing/technology-price-list.pdf http://www.oracle.com/corporate/pricing/sig.pdf http://www.sap.com/solutions/licensingmodel/index.epx
Discounts from the OEM (from Supply Management Office or other resources) are frequently available and may be applicable to license refresh rates in O&S
I n t e g r i t y - S e r v i c e - E x c e l l e n c e 30
Major Costs:Procurement/DeploymentProcurement/Deployment
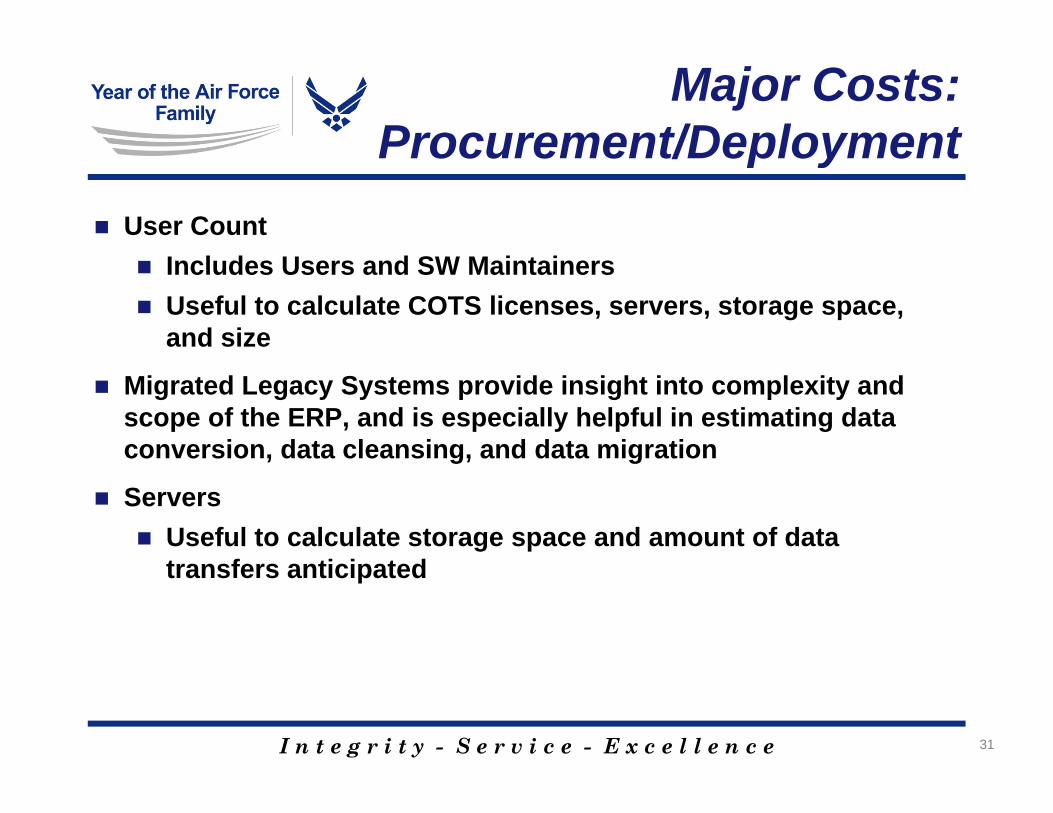
User Count Includes Users and SW Maintainers Useful to calculate COTS licenses, servers, storage space,
and size
Migrated Legacy Systems provide insight into complexity and scope of the ERP, and is especially helpful in estimating data conversion, data cleansing, and data migrationconversion, data cleansing, and data migration
Servers Useful to calculate storage space and amount of data
t f ti i t dtransfers anticipated
I n t e g r i t y - S e r v i c e - E x c e l l e n c e 31
Major Costs:Procurement/DeploymentProcurement/Deployment
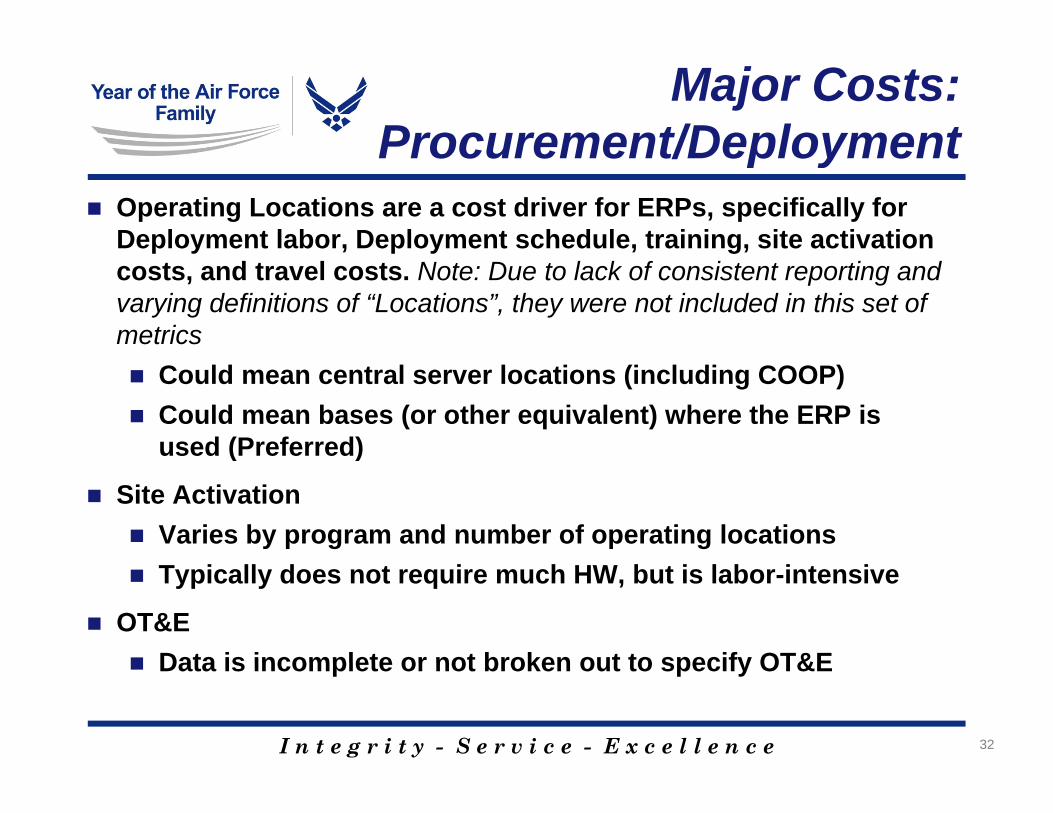
Operating Locations are a cost driver for ERPs, specifically for Deployment labor, Deployment schedule, training, site activation p y p y gcosts, and travel costs. Note: Due to lack of consistent reporting and varying definitions of “Locations”, they were not included in this set of metrics Could mean central server locations (including COOP) Could mean bases (or other equivalent) where the ERP is
used (Preferred)( )
Site Activation Varies by program and number of operating locations Typically does not require much HW, but is labor-intensive
OT&E Data is incomplete or not broken out to specify OT&E
I n t e g r i t y - S e r v i c e - E x c e l l e n c e
Data is incomplete or not broken out to specify OT&E
32
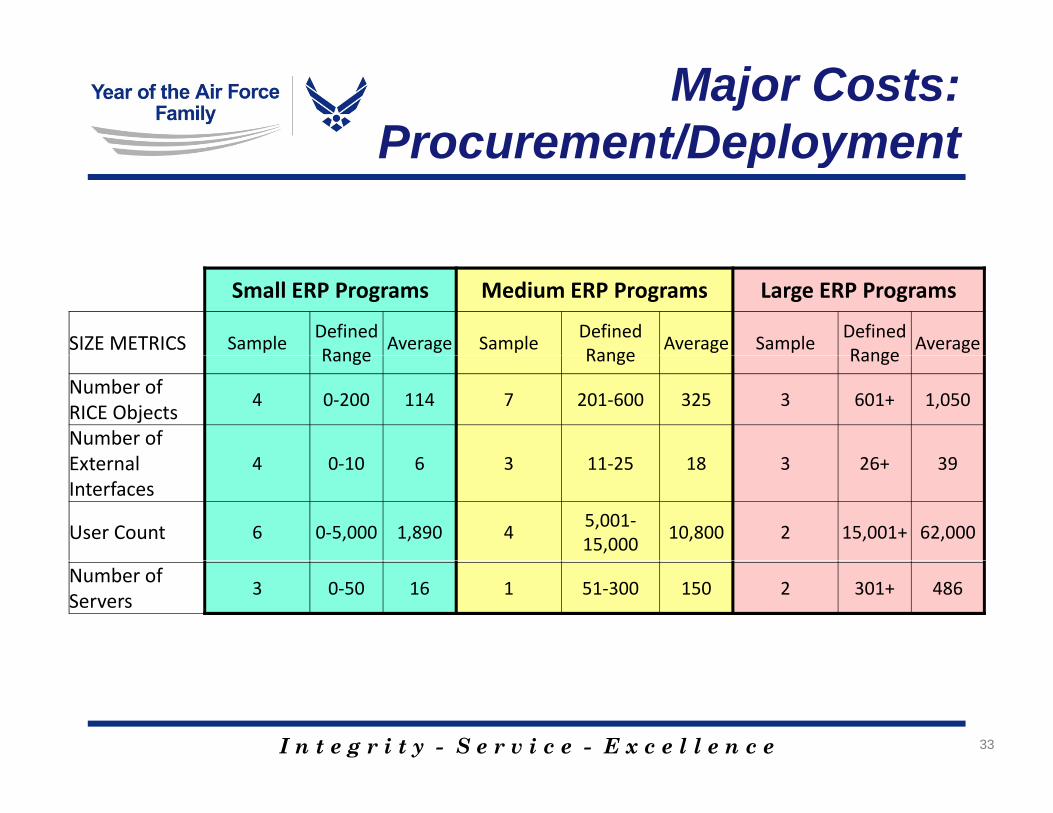
Major Costs:Procurement/DeploymentProcurement/Deployment
Small ERP Programs Medium ERP Programs Large ERP Programs
SIZE METRICS SampleDefined Range
Average SampleDefined Range
Average SampleDefined Range
AverageRange Range Range
Number of RICE Objects
4 0‐200 114 7 201‐600 325 3 601+ 1,050
Number of E t l 4 0 10 6 3 11 25 18 3 26 39External Interfaces
4 0‐10 6 3 11‐25 18 3 26+ 39
User Count 6 0‐5,000 1,890 45,001‐15,000
10,800 2 15,001+ 62,000
Number of Servers
3 0‐50 16 1 51‐300 150 2 301+ 486
I n t e g r i t y - S e r v i c e - E x c e l l e n c e 33
Major Costs
Major Costs:
Operations and Sustainment
I n t e g r i t y - S e r v i c e - E x c e l l e n c e 34
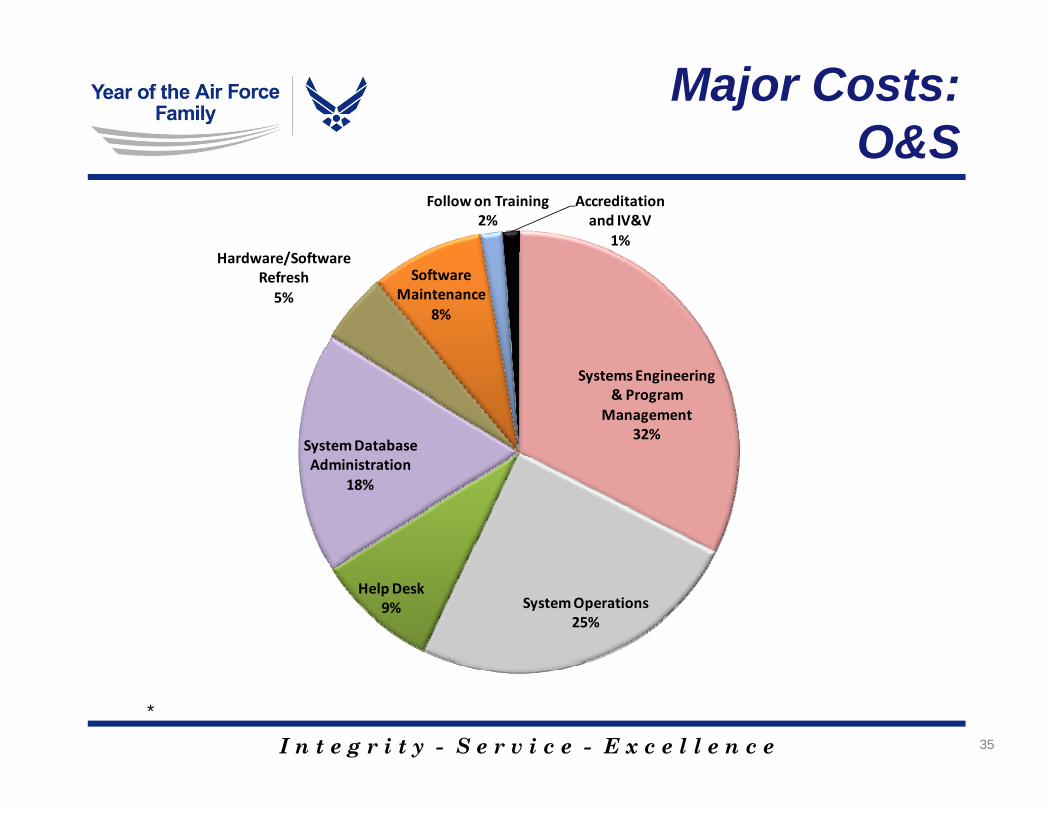
Major Costs:O&SO&S
d /S f
Follow on Training 2%
Accreditation and IV&V
1%Hardware/Software
Refresh 5%
Software Maintenance
8%
Systems Engineering & Program
Management 32%
System Database Administration
18%
System Operations 25%
Help Desk 9%
I n t e g r i t y - S e r v i c e - E x c e l l e n c e 35
*
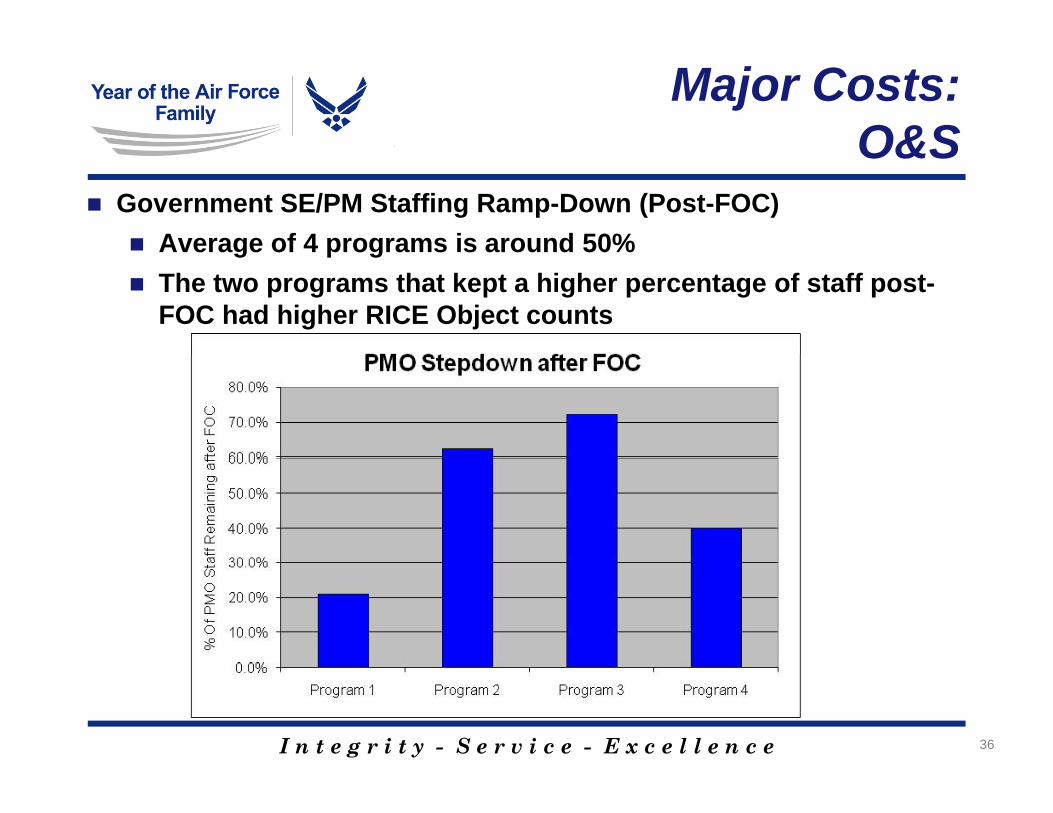
Major Costs:O&SO&S
Government SE/PM Staffing Ramp-Down (Post-FOC) Average of 4 programs is around 50%g p g The two programs that kept a higher percentage of staff post-
FOC had higher RICE Object counts
I n t e g r i t y - S e r v i c e - E x c e l l e n c e 36
Major Costs:O&SO&S
Recurring COTS License Fees Typically represented as an annual cost based on a
percentage (around 20% – 30% annually) of the initial purchase cost
Initial Purchase Cost price lists http://www.oracle.com/corporate/pricing/technology-price-
list.pdflist.pdf http://www.oracle.com/corporate/pricing/sig.pdf http://www.sap.com/solutions/licensingmodel/index.epx
Discounts on Initial Purchase of COTS may be applicable to license refresh rates in O&S
I n t e g r i t y - S e r v i c e - E x c e l l e n c e 37
Summary
SummarySummary
I n t e g r i t y - S e r v i c e - E x c e l l e n c e 38
Summary Schedule growth drives a large portion of cost growth
Some of the largest costs in the program are PMO/FMO and System Integrator staffing (“Standing Army” costs)
Schedule growth has relatively small effect on PMP cost, but the “standing army” must be kept, greatly increasing the g y p g y gbelow-the-line costs
RICE is a reasonable estimator, if uncertainty is included Very wide variations around the mean Very wide variations around the mean
The bulk of the costs are in Development and Deployment; Procurement plays a small role
DISA / Mega-Center / Database Maintenance costs figure primarily in O&S, and make up a substantial portion of O&S costs
O&S M t i l i ERP t th t lif l h d
I n t e g r i t y - S e r v i c e - E x c e l l e n c e
O&S Metrics are evolving as ERPs enter that life cycle phase and generate data
39
Questions?
I n t e g r i t y - S e r v i c e - E x c e l l e n c e 40