Embed Size (px)
Citation preview
Quality & Business Excellence Conference 26 – 27 November 2012
Quality & Business Excellence Conference 26 – 27 November 2012
Improving DuPont Businesses Through Quality
Steven P. Bailey, Ph.D. DuPont Engineering Research and Technology
Applied Statistics Group [email protected]
Quality & Business Excellence Conference 26 – 27 November 2012
DuPont case studies will be presented on
• systematic approaches to deploying experimental strategies
• developing and deploying product quality management systems
• engaging employees in executing lean six sigma improvement projects

Quality & Business Excellence Conference 26 – 27 November 2012
Learning objectives
• How the tools of experimental design were assembles into a Strategy of Experimentation (SOE) paradigm that has been deployed and refined within DuPont for nearly 50 years, leading to many new and improved products and processes.
• How a strong prevalent business need, combined with collaboration among marketing, manufacturing, and technology, led to rapid development and broad deployment of a Product Quality Management (PQM) methodology within DuPont that combines quality philosophy, management systems and unique quality technology.
• How DuPont’s deployment of lean and six sigma has simultaneously delivered bottom-line business results and improved people capability.

Quality & Business Excellence Conference 26 – 27 November 2012
Agenda
• DuPont’s Applied Statistics Group (ASG)
• Strategy of Experimentation (SOE)
• Product Quality Management (PQM)
• DuPont Six Sigma
• Wrap-up and Acknowledgements
Quality & Business Excellence Conference 26 – 27 November 2012
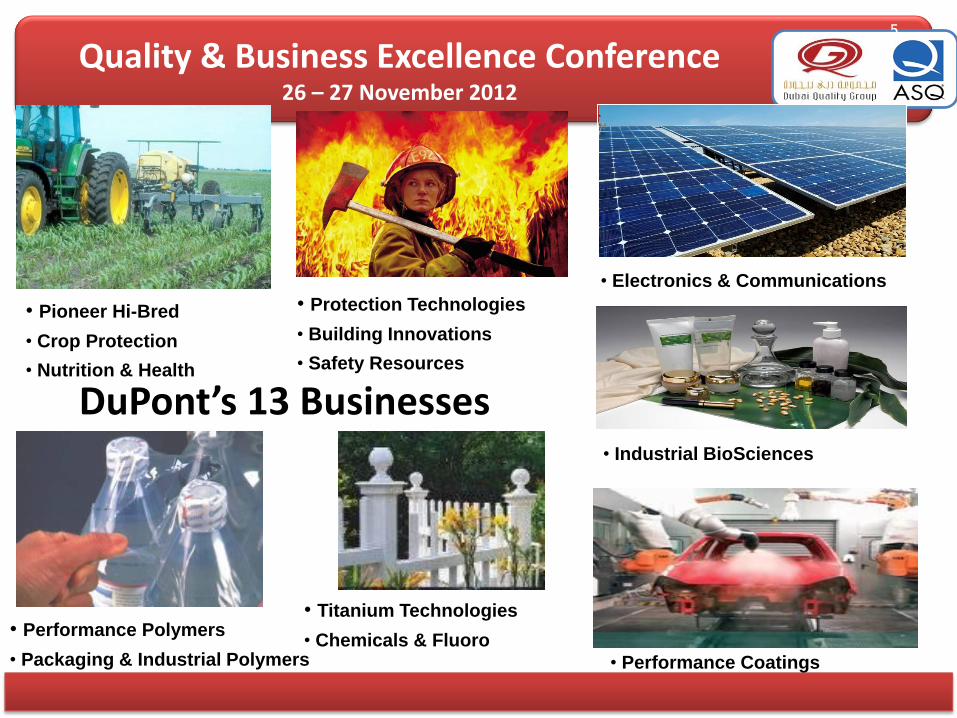
DuPont’s 13 Businesses
• Protection Technologies
• Building Innovations
• Safety Resources
• Pioneer Hi-Bred
• Crop Protection
• Nutrition & Health
• Performance Polymers
• Packaging & Industrial Polymers
• Titanium Technologies
• Chemicals & Fluoro
• Performance Coatings
• Industrial BioSciences
• Electronics & Communications
5

Quality & Business Excellence Conference 26 – 27 November 2012
1964 -- Applied Statistics Group (ASG)
Applied Statistics
Quality & Business Excellence Conference 26 – 27 November 2012
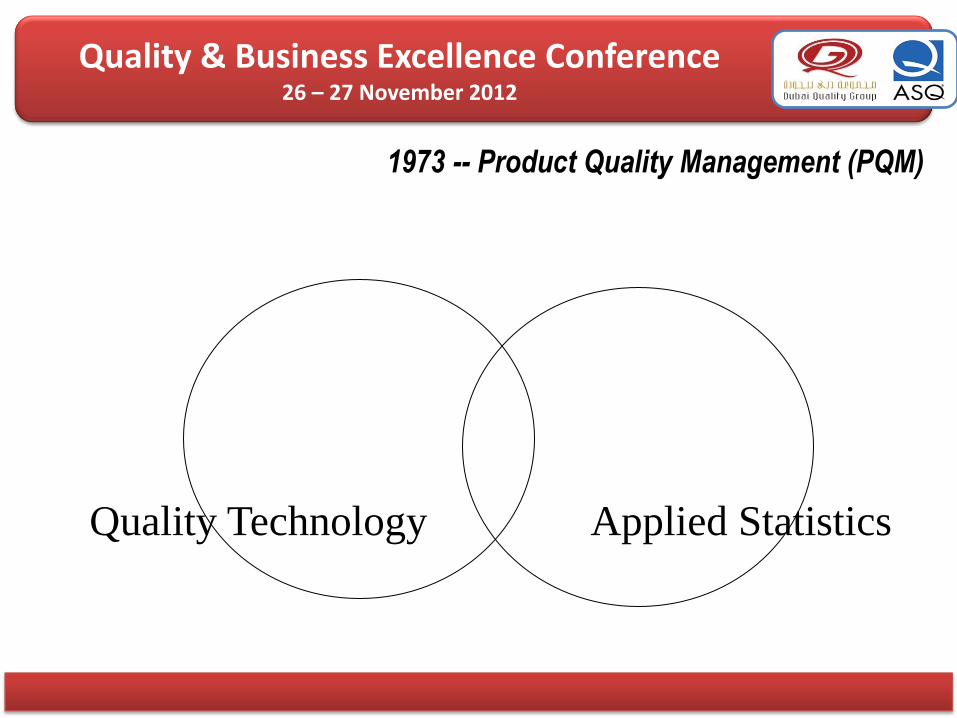
1973 -- Product Quality Management (PQM)
Applied Statistics Quality Technology

Quality & Business Excellence Conference 26 – 27 November 2012
1989 -- Quality Management and Technology (QM&T) ISO 9000, PQM, Malcolm Baldrige (DCIC)
Quality Management
Applied Statistics Quality Technology

Quality & Business Excellence Conference 26 – 27 November 2012
1999 -- DuPont Six Sigma
Quality Management Six Sigma
Applied Statistics
Note: No attempt was made at depicting the correct sizes or overlap of the above circles.
Quality Technology

Quality & Business Excellence Conference 26 – 27 November 2012
2007 (Back to the Future)
Quality Management Six Sigma
Applied Statistics
Note: No attempt was made at depicting the correct sizes or overlap of the above circles.
Quality Technology
Mgmt
Tech
Quality Statistics

Quality & Business Excellence Conference 26 – 27 November 2012
Strategy of Experimentation (SOE) History • Late 1950’s – Computing (mainframe) arrives at DuPont
• Early 1960’s – First Response Surface DOEs done in plants and labs
• Mid 1960’s – First SOE course (concurrent with ASG formation)
• Late 1960’s – Internal software developed for DOE design and analysis
• Mid 1970’s – Revised SOE text and created external business
• Late 1970’s – Strategy of Formulations Development (SFD) course
• Late 1980’s – Last SOE text revision
• Late 1980’s – Experimentation for Robust Product Design (ERPD)
• Late 1980’s – Software integrated into SOE and SFD courses
– RS/Discover, EChip, JMP®, Minitab®, etc
Over 40,000 internally and externally trained in DuPont’s SOE!

Quality & Business Excellence Conference 26 – 27 November 2012
DOE Theory
1920s Agriculture split plot
experiments (Fisher &
Yates) 1930s
1940s Plackett-Burman designs
1950s Response surface
methods (Box et al.)
1960s Mixture designs
(Scheffe)
1970s Design optimality and
computer-aided designs
Conjoint analysis
1980s Robust parameter
design
1990s Industrial split plot
designs
2000s Computer experiments

Quality & Business Excellence Conference 26 – 27 November 2012
DOE Theory DuPont DOE Use
Area Software
1920s Agriculture split plot
experiments (Fisher &
Yates)
1930s
1940s Plackett-Burman designs
1950s Response surface
methods (Box et al.) R&D
Hand calculations
Univac 1960s
Mixture designs
(Scheffe) R&D
MFG 1970s
Design optimality and
computer-aided designs
Conjoint analysis
Univac programs
developed internally
1980s Robust parameter
design
R&D, MFG
Agriculture
RS/Discover (VAX)
ECHIP (PC)
Minitab® (VAX)
1990s Industrial split plot
designs
R&D, MFG, Agriculture
Tech. Sales/Marketing JMP®, Minitab® (PC)
2000s Computer experiments
R&D, MFG, Agriculture,
Tech. Sales/Marketing
Marketing
Minitab®, JMP®, SAS®
Quality & Business Excellence Conference 26 – 27 November 2012
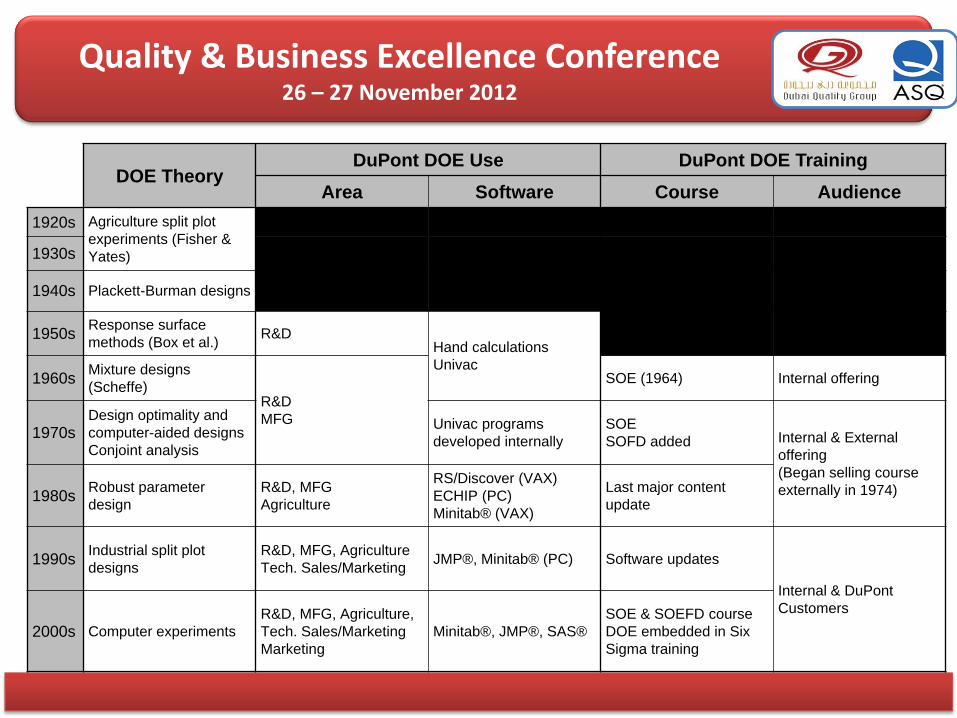
DOE Theory DuPont DOE Use DuPont DOE Training
Area Software Course Audience
1920s Agriculture split plot
experiments (Fisher &
Yates)
1930s
1940s Plackett-Burman designs
1950s Response surface
methods (Box et al.) R&D
Hand calculations
Univac
1960s Mixture designs
(Scheffe) R&D
MFG
SOE (1964) Internal offering
1970s Design optimality and
computer-aided designs
Conjoint analysis
Univac programs
developed internally
SOE
SOFD added Internal & External
offering
(Began selling course
externally in 1974) 1980s Robust parameter
design
R&D, MFG
Agriculture
RS/Discover (VAX)
ECHIP (PC)
Minitab® (VAX)
Last major content
update
1990s Industrial split plot
designs
R&D, MFG, Agriculture
Tech. Sales/Marketing JMP®, Minitab® (PC) Software updates
Internal & DuPont
Customers
2000s Computer experiments
R&D, MFG, Agriculture,
Tech. Sales/Marketing
Marketing
Minitab®, JMP®, SAS®
SOE & SOEFD course
DOE embedded in Six
Sigma training

Quality & Business Excellence Conference 26 – 27 November 2012
Strategy of Experimentation (SOE) (from Forward of 1975 SOE Text)
• Every experimental program embodies an experimental strategy that may either be good or bad.
• The strategy selection can catalyze technical progress or cause stagnation.
• “Strategy of Experimentation” teaches the information needed to apply modern experimental designs effectively.
• The course emcompasses the philosophic and practical elements of experimental programs as well as the methodology of statistical experimental design.
• The material represents, both by inclusion and exclusion, a distillation of what is most important for the working scientist (and their supervision) both to understand and be able to do.

Quality & Business Excellence Conference 26 – 27 November 2012
Evolution of the Experimental Environment Full Factorials as Building Blocks for Screening and Response Surface Experiments
X3
X2 X1
X3
X2 X1
X3
X2 X1
Full Factorial Experiments
Response Surface Experiments
Screening Experiments

Quality & Business Excellence Conference 26 – 27 November 2012
Comparison of Experimental Environments Characteristic Screening Characterization Optimization
No. of Factors More than 6 3-6 2-5
Desired
Information
Critical Factors Understand how
System Works
Prediction
Equation,
Optimization,
Design Space
Model Form Linear or
Main Effects
Linear and
Interaction
Effects
Linear, Interaction
and Curvilinear
Effects
Experiment
Design
Plackett-Burman
Fractional-
Factorials
Full and
Fractional
Factorials
Response Surface

Quality & Business Excellence Conference 26 – 27 November 2012
Input Variables (Xs)
Outputs (Ys)
Process Variables (Xs)
– Cause-effect relationships
– Mathematical models
– Optimum X settings for performance of Ys
– Powerful and cost-effective
– Generally minimizes the amount of data required to get the information you need

Quality & Business Excellence Conference 26 – 27 November 2012
Portable Power: Number Of Runs Vs. Sensitivity
Rule of Thumb: for balanced 2-level factorial designs (Plackett-Burman, Fractional Factorial, Full Factorial)
= smallest size effect worth detecting =standard deviation of experimental error (your best guess) = “signal-to-noise ratio”
2.0 1.5 1.0 0.5 n 12-16 22-28 49-64 196-256
n = 7 or 8
( )
2

Quality & Business Excellence Conference 26 – 27 November 2012
Y = f(Xs) + e Output equals Function of Inputs plus Variation
Continuous vs.
Discrete
“As Is” vs. Transformed vs. “Link Function”
Theoretical vs.
Empirical
Simple vs.
Complex
Continuous vs.
Discrete
Screening vs. Optimization
Blocking and
Randomization
Overt (Pure) and Hidden Replication
vs.
Number of rows of data
(n)
Number of parameters to estimate (p)
Number of additional treatment
combinations for checking lack
of fit (l)
Amount of pure replication
(r)
Historical Data Mining (HDM) vs Designed Experiment (DOE)
Many vs. Few
Bias Error
Random Error
= +
Output
+
Function Inputs Variation
Equation
Words
Considerations
Degrees of
Freedom
Question!

Quality & Business Excellence Conference 26 – 27 November 2012
Product Quality Management (PQM)
In response to a quality crisis in a large DuPont business (with 8 manufacturing
sites) it was recognized that
- Procedures were needed for using the tools to meet the business need
- Approaches were needed for managing the connections between
technology and business functions
The systems concept and PQM were born.

Quality & Business Excellence Conference 26 – 27 November 2012
What business needs were addressed?
• setting specifications
• product characterization and release
• improving process and product performance
• communicating with customers
• managing and improving test methods
• measuring and monitoring progress
• keeping the system up to date
While statistical tools were used to address most of these needs the
paradigm had been reversed. We were now starting with the business
need and not the technology. Within a year the quality crisis was over
and a new era had begun.
Quality & Business Excellence Conference 26 – 27 November 2012
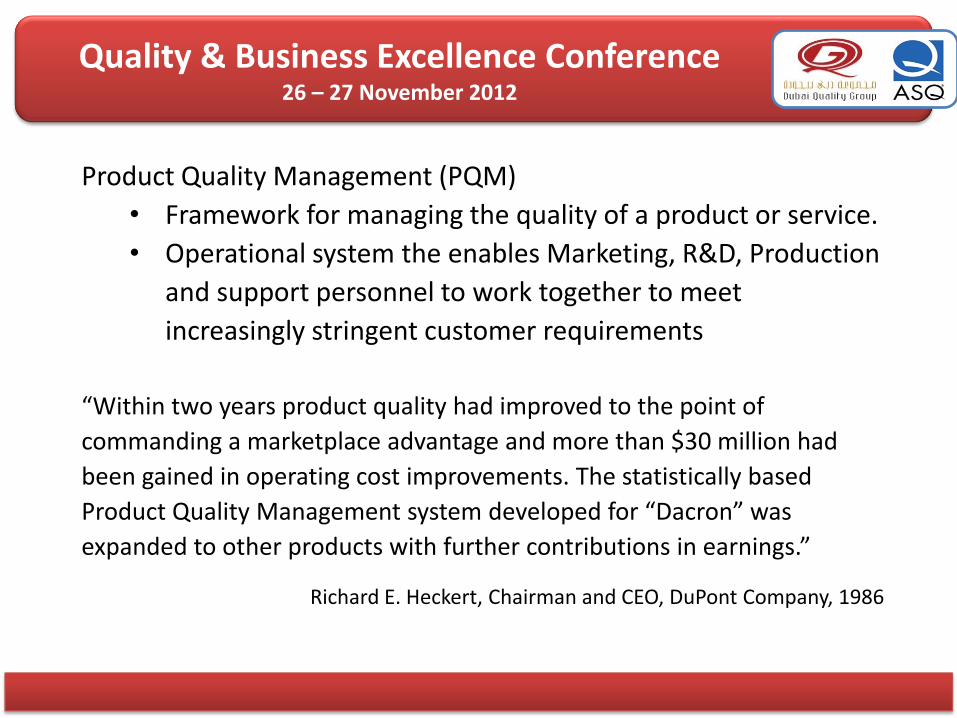
Product Quality Management (PQM)
• Framework for managing the quality of a product or service.
• Operational system the enables Marketing, R&D, Production
and support personnel to work together to meet
increasingly stringent customer requirements
“Within two years product quality had improved to the point of
commanding a marketplace advantage and more than $30 million had
been gained in operating cost improvements. The statistically based
Product Quality Management system developed for “Dacron” was
expanded to other products with further contributions in earnings.”
Richard E. Heckert, Chairman and CEO, DuPont Company, 1986

Quality & Business Excellence Conference 26 – 27 November 2012
The PQM manual was first published in 1976 (300 copies). The tenth
and final edition was published in 1991. Well over 10,000 copies were
distributed over that time.
The 1988 edition (shown here) had over 800 pages. The Table of
Contents is included in the next two charts.
During the development and
continued use of PQM regular
meetings were held among the
consultants to share experiences
with the implementing businesses
and to upgrade PQM processes.

Quality & Business Excellence Conference 26 – 27 November 2012
• Part 1 - Introduction to Product Quality Management
1) The Values of PQM for Customer and Producer
2) Quality and Quality Management
3) PQM Strategy for Continual Improvement Using the Quality Loop
4) Some Basic PQM Concepts
5) Meeting Customer Requirements
• Part 2 - Managerial Aspects
6) Quality Economics
7) The Role of National and International Standards
8) Report Card Issues
9) The Dynamic Quality Improvement Model
• Part 3 - Simple Diagnostic Techniques
10) Simple Techniques for Quality Problem Diagnostics
• Part 4 - Process Control
11) Process Control Concepts and Introduction to CUSUM
12) Design of CUSUM Control Schemes
13) Control of the Measurement Process
• Part 5 - Characterizing Variability
14) Estimating and Maintaining Variance Components
15) Using Routine and Maintenance Data for Continual Improvement

Quality & Business Excellence Conference 26 – 27 November 2012
• Part 6 - Assuring Shipped Product Conforms to Specifications
16) Product Characterization and Release Concepts
17) CUSUM-matched Product Specifications
• Part 7 - Supplier / Producer / Customer Partnerships
18) Classes of Product Properties
19) Measures of Continual Improvement
20) Procedures for Determining Candidate Specification Limits
21) Information Sharing and Acceptance Testing
• Part 8 - System Evaluation, Tuning, and Improvement
22) Product Quality Reviews
23) Applications of Experimental Data in PQM
24) Multi-variable Process Adjustment
25) Interlab Comparisons
• Part 9 - Generalization to Other Product Units
26) Other Product Unit Definitions
27) Sheet Structures
28) Counted Data and Attribute Properties
• Part 10 - Implementation Guidelines
29) Managing Quality in the Quality System Itself
30) PQM System Audits
31) Implementing PQM to Attain Quality as a Business Strategy

Quality & Business Excellence Conference 26 – 27 November 2012
The Manual – Looking at the Big Picture
Continuous Improvement Cycle
•Shared view of quality
•Focus of quality of design and
quality of conformance

Quality & Business Excellence Conference 26 – 27 November 2012
PQM Systems Technology

Quality & Business Excellence Conference 26 – 27 November 2012
CUSUM Status Chart
Quality & Business Excellence Conference 26 – 27 November 2012
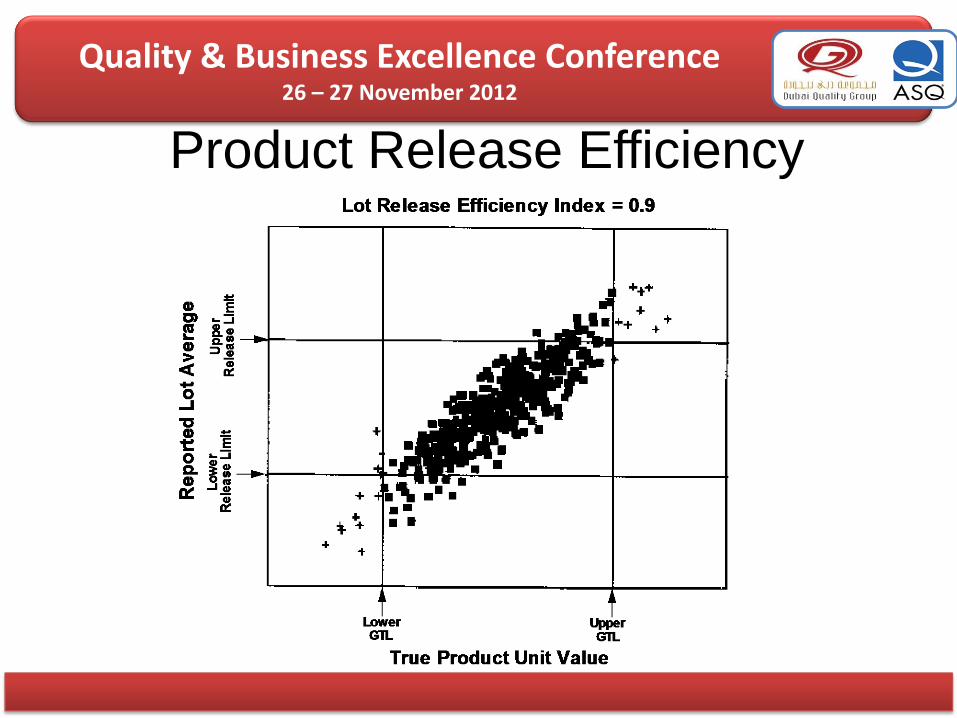
Product Release Efficiency

Quality & Business Excellence Conference 26 – 27 November 2012
Product Release Efficiency
Quality & Business Excellence Conference 26 – 27 November 2012
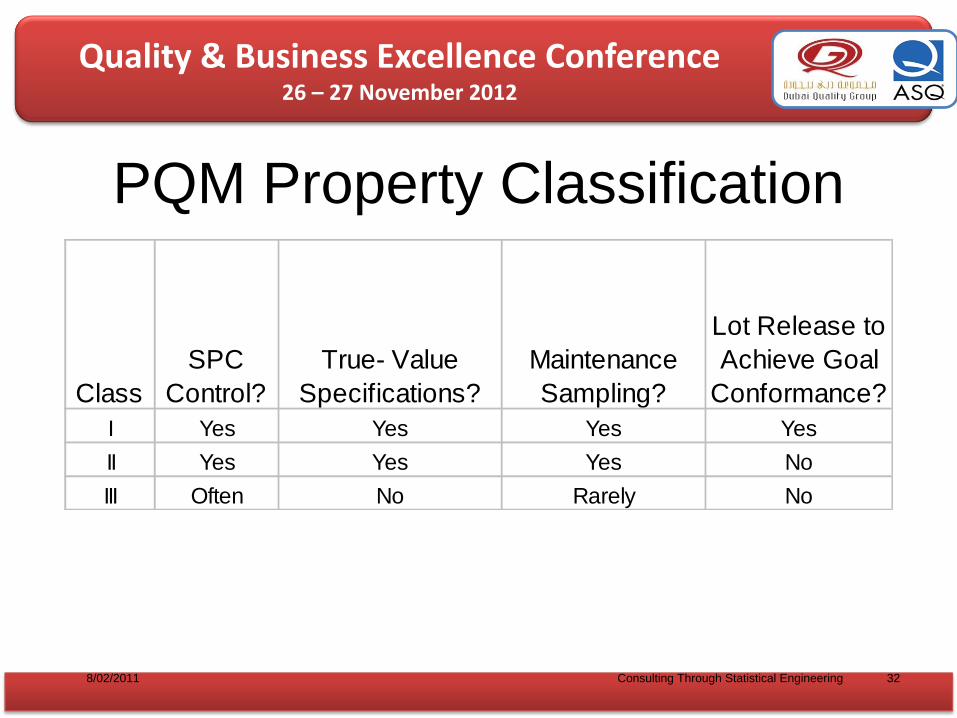
PQM Property Classification
32 Consulting Through Statistical Engineering
Class
SPC
Control?
True- Value
Specifications?
Maintenance
Sampling?
Lot Release to
Achieve Goal
Conformance?
I Yes Yes Yes Yes
II Yes Yes Yes No
III Often No Rarely No
8/02/2011
Quality & Business Excellence Conference 26 – 27 November 2012

Quality & Business Excellence Conference 26 – 27 November 2012

Quality & Business Excellence Conference 26 – 27 November 2012
Leadership GB “graduation day” in Nov 2000 Left to Right: COO Richard Goodmanson MBBs Dave Flattery and Steve Bailey CEO Chad Holliday

Quality & Business Excellence Conference 26 – 27 November 2012

Quality & Business Excellence Conference 26 – 27 November 2012
For more on DuPont’s Six Sigma
deployment, “read the book” (by Mikel
Harry and Don Linsenmann)

Quality & Business Excellence Conference 26 – 27 November 2012

Quality & Business Excellence Conference 26 – 27 November 2012 MBB Roles
Idea Merchant
Pro
ject
Exe
cuto
r
Ch
ange
Age
nt
Perf
orm
ance
Man
ager
Ad
ult
Ed
uca
tor/
Trai
ner
Co
ach
/Men
tor
Too
l Mas
ter
Brand Manager
Quality & Business Excellence Conference 26 – 27 November 2012
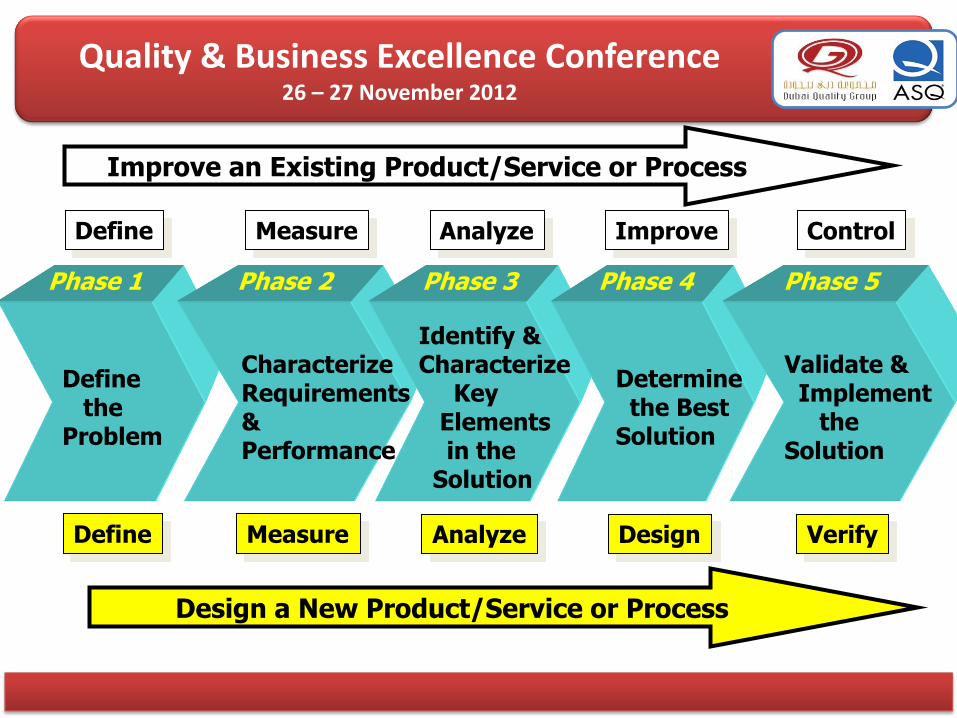
Improve an Existing Product/Service or Process
Characterize Requirements & Performance
Identify & Characterize Key Elements in the Solution
Define the Problem
Phase 1 Phase 2 Phase 3
Define
Determine the Best Solution
Phase 4
Validate & Implement the Solution
Phase 5
Measure Analyze Improve Control
Design a New Product/Service or Process
Define Measure Analyze Design Verify
Quality & Business Excellence Conference 26 – 27 November 2012
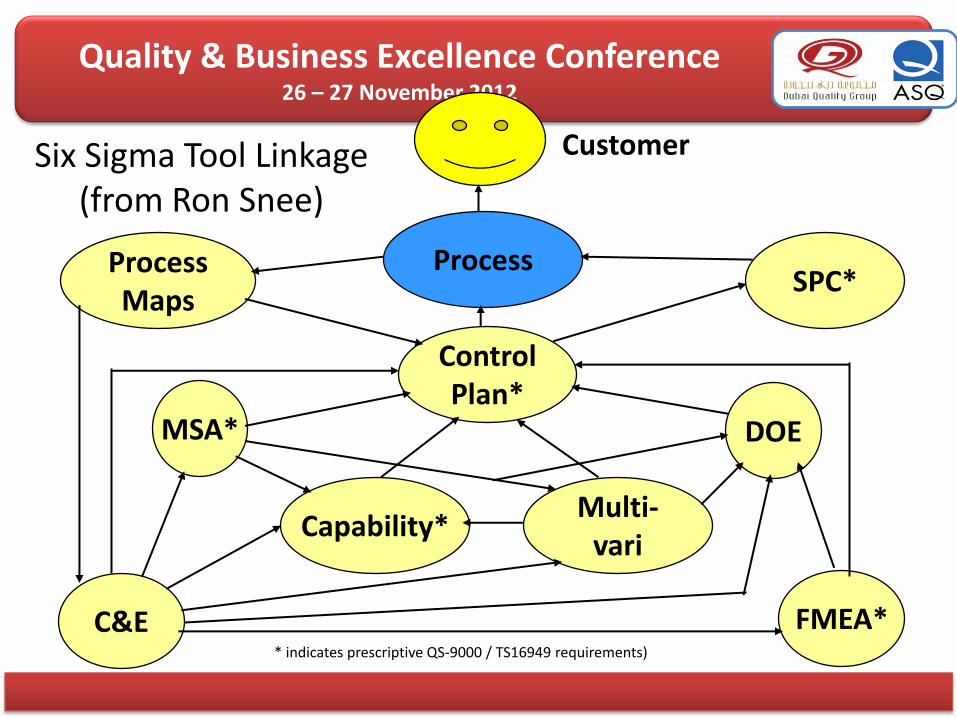
Six Sigma Tool Linkage (from Ron Snee)
Customer
Process Process Maps
SPC*
Control Plan*
C&E
Capability*
DOE
FMEA*
Multi- vari
MSA*
* indicates prescriptive QS-9000 / TS16949 requirements)

Quality & Business Excellence Conference 26 – 27 November 2012
Select a measure
(Project Y or Critical
X)
Develop Operational Definition
Verify inputs and track thru meas. system to
ensure accuracy. Obtain MBB sign-off
Document Results and Proceed
Run each component thru flow-diagram
MSA on Calculated Variable
Conduct an Attribute Gage
R&R Study
Improve method or develop a new one
Document Results and Proceed
Operational definition?
A simple MS with no
judgment or technique?
Continuous measure?
Calculated measure? A
No
No
No No
No Yes Yes
Yes
Yes Is accuracy and R&R
adequate?
A
Resolution adequate?
Improve Resolution
Standard available?
Is R&R study
feasible?
Parallel gages or systems?
Conduct a Long-term vs. Short-
term MSA
Routinely measured?
Analyze Std. Data for Bias, R&R and
Stability
Assess all MSA Results
Measurement adequate?
Contain, Improve, Develop Method
Document Results and Proceed
Collect Data to Assess Bias and
Total R&R
Conduct an Inline MSA
Institute Best Practices to
Maintain the MS
No
No
No
No
No
Yes
Yes
Yes Yes
Yes
Yes
No
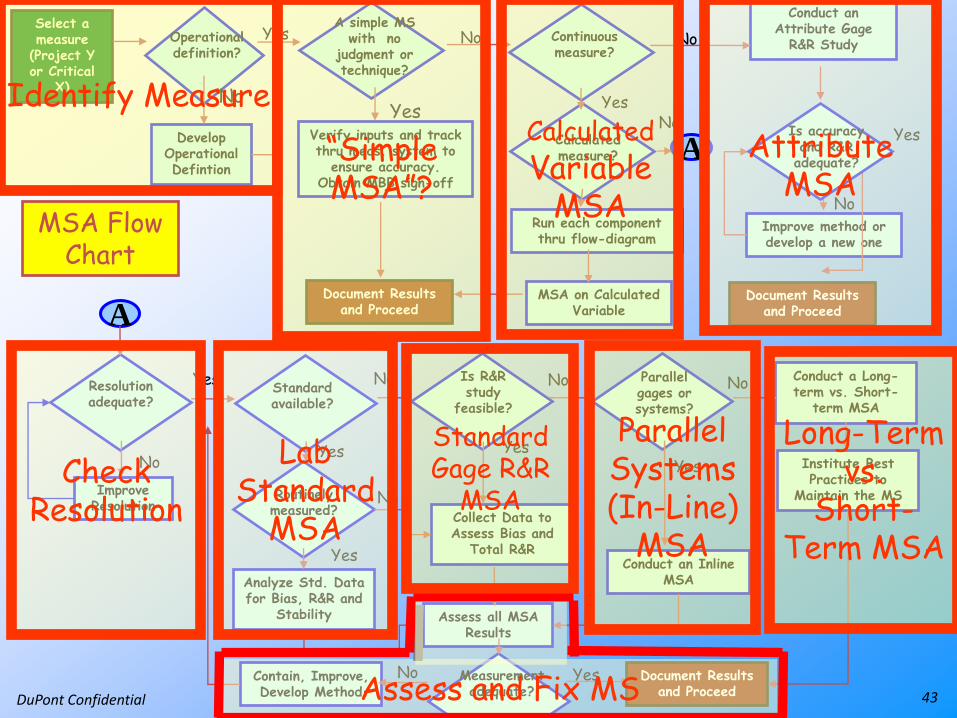
MSA Flow Chart
Quality & Business Excellence Conference 26 – 27 November 2012
Select a measure
(Project Y or Critical
X)
Develop Operational Defintion
Verify inputs and track thru meas. system to
ensure accuracy. Obtain MBB sign-off
Document Results and Proceed
Run each component thru flow-diagram
MSA on Calculated Variable
Conduct an Attribute Gage
R&R Study
Improve method or develop a new one
Document Results and Proceed
Operational definition?
A simple MS with no
judgment or technique?
Continuous measure?
Calculated measure? A
No
No
No No
No Yes Yes
Yes
Yes Is accuracy and R&R
adequate?
A
Resolution adequate?
Improve Resolution
Standard available?
Is R&R study
feasible?
Parallel gages or systems?
Conduct a Long-term vs. Short-
term MSA
Routinely measured?
Analyze Std. Data for Bias, R&R and
Stability Assess all MSA Results
Measurement adequate?
Contain, Improve, Develop Method
Document Results and Proceed
Collect Data to Assess Bias and
Total R&R Conduct an Inline
MSA
Institute Best Practices to
Maintain the MS
No
No
No
No
No
Yes
Yes
Yes Yes
Yes
Yes
No
DuPont Confidential
MSA Flow Chart
43
Identify Measure
“Simple MSA”?
Attribute MSA
Lab Standard
MSA
Standard Gage R&R
MSA
Parallel Systems (In-Line)
MSA
Long-Term vs.
Short-Term MSA
Calculated Variable
MSA
Check Resolution
Assess and Fix MS
Quality & Business Excellence Conference 26 – 27 November 2012
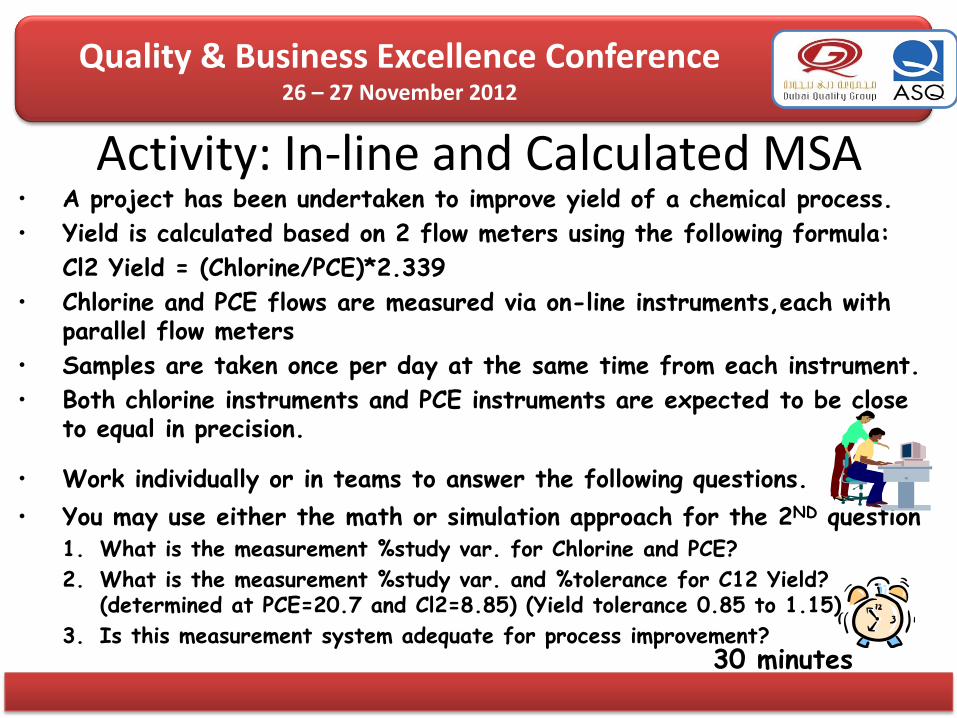
30 minutes
• A project has been undertaken to improve yield of a chemical process.
• Yield is calculated based on 2 flow meters using the following formula:
Cl2 Yield = (Chlorine/PCE)*2.339
• Chlorine and PCE flows are measured via on-line instruments,each with parallel flow meters
• Samples are taken once per day at the same time from each instrument.
• Both chlorine instruments and PCE instruments are expected to be close to equal in precision.
• Work individually or in teams to answer the following questions. • You may use either the math or simulation approach for the 2ND question
1. What is the measurement %study var. for Chlorine and PCE?
2. What is the measurement %study var. and %tolerance for C12 Yield? (determined at PCE=20.7 and Cl2=8.85) (Yield tolerance 0.85 to 1.15)
3. Is this measurement system adequate for process improvement?
Activity: In-line and Calculated MSA

Quality & Business Excellence Conference 26 – 27 November 2012
%StudyVariation
= 100*smsmt/stotal
= 35%
Voice of the Measurement (VOM)
Voice of the Process
(VOP) Voice of the Customer
(VOC)
%Tolerance
= 100*(6*smsmt)/Spec Range
= 10%
Cp = Spec Range/(6*stotal)
= 3.5
%StudyVariation
= Cp * %Tolerance
or
35% = (3.5) * (10%)

Quality & Business Excellence Conference 26 – 27 November 2012
46
Dem
and
Rev
iew
Pro
du
ct/p
roje
ct
Rev
iew
Business Strategy
Sale
s St
rate
gy
Mar
keti
ng
Stra
tegy
Tech
no
logy
St
rate
gy Supply Chain Strategy
Plan – Systems/Pr
ocesses
Buy – Sourcing
Make – Asset & Mfg
Tech
Deliver – SND &
Logistics
Required
Business
Outcomes
Current & future
requirements for
capability and
performance
Production Systems
Manufacturing Locations,
S&L, Engineering,
Across Supply Chains
Sup
ply
Rev
iew
Curr
ent
Capabilit
ies
& P
erf
orm
ance
Impro
vem
ent
Opport
unit
ies/
alt
ern
ati
ves
DIBM 0-24 months
Business Results vs. Objectives
Safety Environmental
People/Ethics
Customer Service Quality
Cash/Asset Productivity
Cost Productivity C
on
text
an
d P
ers
pe
cti
ve

Quality & Business Excellence Conference 26 – 27 November 2012
Wrap-up and Acknowledgements
• SOE, PQM and Six Sigma are “systems” that have delivered solid business benefit within DuPont
• ASG could have been “located” anywhere in DuPont
– Corporate Marketing and Sales (CMS)
– Central Research and Development (CR&D)
– Operations and Engineering
• But ASG has been in Engineering ever since it’s “birth”
• So it is not surprising that the “systems” ASG designed and deployed have a lot of the characteristics of what Roger Hoerl and Ron Snee have recently described as Statistical Engineering!
• Thanks to ASGers Steve Larson, Stephanie DeHart and Pat DeFeo

Quality & Business Excellence Conference 26 – 27 November 2012
Dr. Steven P. Bailey is Principal Consultant with DuPont's corporate Applied Statistics Group. With over 33 years at DuPont, Steve also leads DuPont's corporate Master Black Belt Network. Steve received his BS, MS and PhD in Statistics from the University of Wisconsin in the 1970's. Steve is a Past President and Chair of ASQ. He holds ASQ certifications as a Six Sigma Black Belt and a Master Black Belt.

Quality & Business Excellence Conference 26 – 27 November 2012
Thank You! … Any Questions?