Embed Size (px)
Citation preview
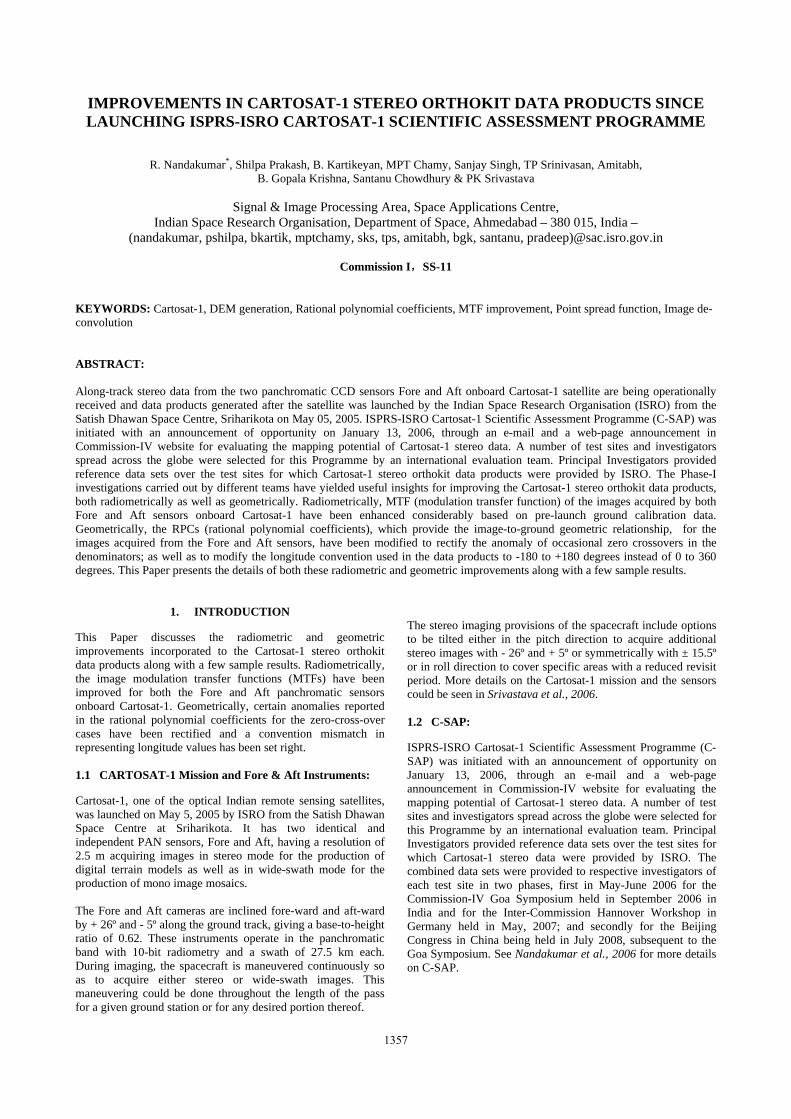
IMPROVEMENTS IN CARTOSAT-1 STEREO ORTHOKIT DATA PRODUCTS SINCE LAUNCHING ISPRS-ISRO CARTOSAT-1 SCIENTIFIC ASSESSMENT PROGRAMME
R. Nandakumar*, Shilpa Prakash, B. Kartikeyan, MPT Chamy, Sanjay Singh, TP Srinivasan, Amitabh, B. Gopala Krishna, Santanu Chowdhury & PK Srivastava
Signal & Image Processing Area, Space Applications Centre,
Indian Space Research Organisation, Department of Space, Ahmedabad – 380 015, India – (nandakumar, pshilpa, bkartik, mptchamy, sks, tps, amitabh, bgk, santanu, pradeep)@sac.isro.gov.in
Commission I,SS-11
KEYWORDS: Cartosat-1, DEM generation, Rational polynomial coefficients, MTF improvement, Point spread function, Image de-convolution ABSTRACT: Along-track stereo data from the two panchromatic CCD sensors Fore and Aft onboard Cartosat-1 satellite are being operationally received and data products generated after the satellite was launched by the Indian Space Research Organisation (ISRO) from the Satish Dhawan Space Centre, Sriharikota on May 05, 2005. ISPRS-ISRO Cartosat-1 Scientific Assessment Programme (C-SAP) was initiated with an announcement of opportunity on January 13, 2006, through an e-mail and a web-page announcement in Commission-IV website for evaluating the mapping potential of Cartosat-1 stereo data. A number of test sites and investigators spread across the globe were selected for this Programme by an international evaluation team. Principal Investigators provided reference data sets over the test sites for which Cartosat-1 stereo orthokit data products were provided by ISRO. The Phase-I investigations carried out by different teams have yielded useful insights for improving the Cartosat-1 stereo orthokit data products, both radiometrically as well as geometrically. Radiometrically, MTF (modulation transfer function) of the images acquired by both Fore and Aft sensors onboard Cartosat-1 have been enhanced considerably based on pre-launch ground calibration data. Geometrically, the RPCs (rational polynomial coefficients), which provide the image-to-ground geometric relationship, for the images acquired from the Fore and Aft sensors, have been modified to rectify the anomaly of occasional zero crossovers in the denominators; as well as to modify the longitude convention used in the data products to -180 to +180 degrees instead of 0 to 360 degrees. This Paper presents the details of both these radiometric and geometric improvements along with a few sample results.
1. INTRODUCTION
This Paper discusses the radiometric and geometric improvements incorporated to the Cartosat-1 stereo orthokit data products along with a few sample results. Radiometrically, the image modulation transfer functions (MTFs) have been improved for both the Fore and Aft panchromatic sensors onboard Cartosat-1. Geometrically, certain anomalies reported in the rational polynomial coefficients for the zero-cross-over cases have been rectified and a convention mismatch in representing longitude values has been set right. 1.1 CARTOSAT-1 Mission and Fore & Aft Instruments:
Cartosat-1, one of the optical Indian remote sensing satellites, was launched on May 5, 2005 by ISRO from the Satish Dhawan Space Centre at Sriharikota. It has two identical and independent PAN sensors, Fore and Aft, having a resolution of 2.5 m acquiring images in stereo mode for the production of digital terrain models as well as in wide-swath mode for the production of mono image mosaics. The Fore and Aft cameras are inclined fore-ward and aft-ward by + 26º and - 5º along the ground track, giving a base-to-height ratio of 0.62. These instruments operate in the panchromatic band with 10-bit radiometry and a swath of 27.5 km each. During imaging, the spacecraft is maneuvered continuously so as to acquire either stereo or wide-swath images. This maneuvering could be done throughout the length of the pass for a given ground station or for any desired portion thereof.
The stereo imaging provisions of the spacecraft include options to be tilted either in the pitch direction to acquire additional stereo images with - 26º and + 5º or symmetrically with ± 15.5º or in roll direction to cover specific areas with a reduced revisit period. More details on the Cartosat-1 mission and the sensors could be seen in Srivastava et al., 2006. 1.2 C-SAP:
ISPRS-ISRO Cartosat-1 Scientific Assessment Programme (C-SAP) was initiated with an announcement of opportunity on January 13, 2006, through an e-mail and a web-page announcement in Commission-IV website for evaluating the mapping potential of Cartosat-1 stereo data. A number of test sites and investigators spread across the globe were selected for this Programme by an international evaluation team. Principal Investigators provided reference data sets over the test sites for which Cartosat-1 stereo data were provided by ISRO. The combined data sets were provided to respective investigators of each test site in two phases, first in May-June 2006 for the Commission-IV Goa Symposium held in September 2006 in India and for the Inter-Commission Hannover Workshop in Germany held in May, 2007; and secondly for the Beijing Congress in China being held in July 2008, subsequent to the Goa Symposium. See Nandakumar et al., 2006 for more details on C-SAP.
1357
The International Archives of the Photogrammetry, Remote Sensing and Spatial Information Sciences. Vol. XXXVII. Part B1. Beijing 2008
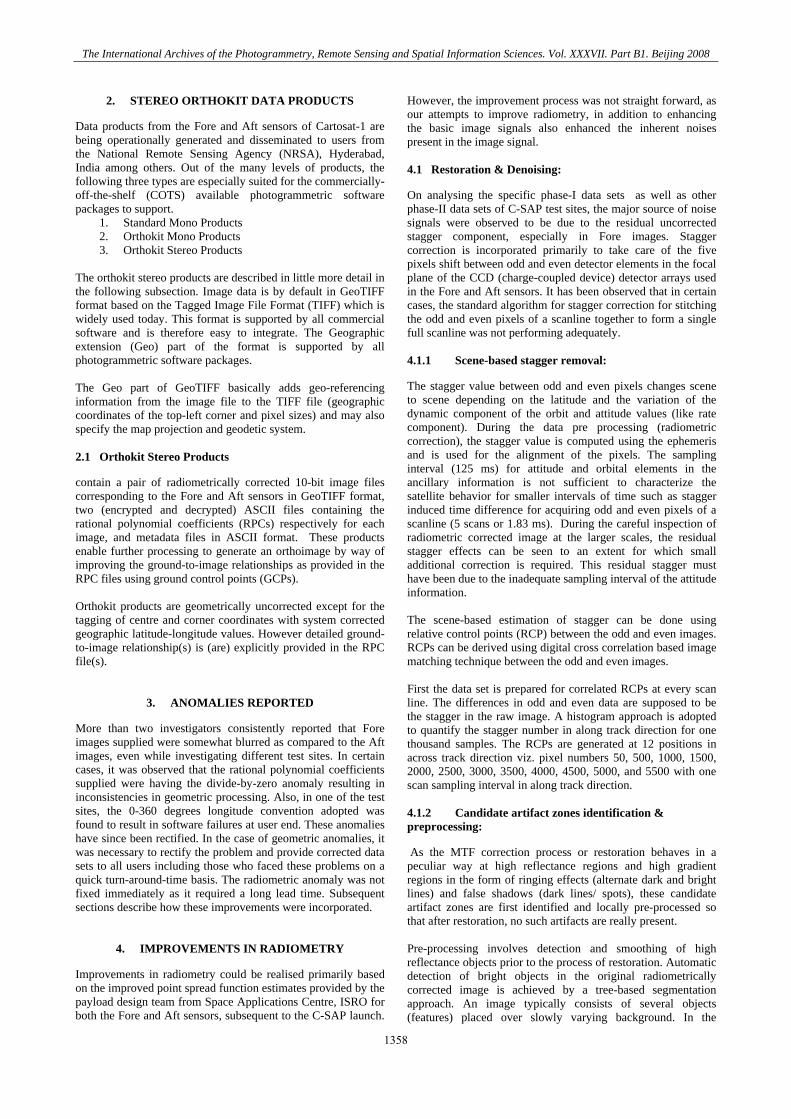
2. STEREO ORTHOKIT DATA PRODUCTS
Data products from the Fore and Aft sensors of Cartosat-1 are being operationally generated and disseminated to users from the National Remote Sensing Agency (NRSA), Hyderabad, India among others. Out of the many levels of products, the following three types are especially suited for the commercially-off-the-shelf (COTS) available photogrammetric software packages to support.
1. Standard Mono Products 2. Orthokit Mono Products 3. Orthokit Stereo Products
The orthokit stereo products are described in little more detail in the following subsection. Image data is by default in GeoTIFF format based on the Tagged Image File Format (TIFF) which is widely used today. This format is supported by all commercial software and is therefore easy to integrate. The Geographic extension (Geo) part of the format is supported by all photogrammetric software packages. The Geo part of GeoTIFF basically adds geo-referencing information from the image file to the TIFF file (geographic coordinates of the top-left corner and pixel sizes) and may also specify the map projection and geodetic system. 2.1 Orthokit Stereo Products
contain a pair of radiometrically corrected 10-bit image files corresponding to the Fore and Aft sensors in GeoTIFF format, two (encrypted and decrypted) ASCII files containing the rational polynomial coefficients (RPCs) respectively for each image, and metadata files in ASCII format. These products enable further processing to generate an orthoimage by way of improving the ground-to-image relationships as provided in the RPC files using ground control points (GCPs). Orthokit products are geometrically uncorrected except for the tagging of centre and corner coordinates with system corrected geographic latitude-longitude values. However detailed ground-to-image relationship(s) is (are) explicitly provided in the RPC file(s).
3. ANOMALIES REPORTED
More than two investigators consistently reported that Fore images supplied were somewhat blurred as compared to the Aft images, even while investigating different test sites. In certain cases, it was observed that the rational polynomial coefficients supplied were having the divide-by-zero anomaly resulting in inconsistencies in geometric processing. Also, in one of the test sites, the 0-360 degrees longitude convention adopted was found to result in software failures at user end. These anomalies have since been rectified. In the case of geometric anomalies, it was necessary to rectify the problem and provide corrected data sets to all users including those who faced these problems on a quick turn-around-time basis. The radiometric anomaly was not fixed immediately as it required a long lead time. Subsequent sections describe how these improvements were incorporated.
4. IMPROVEMENTS IN RADIOMETRY
Improvements in radiometry could be realised primarily based on the improved point spread function estimates provided by the payload design team from Space Applications Centre, ISRO for both the Fore and Aft sensors, subsequent to the C-SAP launch.
However, the improvement process was not straight forward, as our attempts to improve radiometry, in addition to enhancing the basic image signals also enhanced the inherent noises present in the image signal. 4.1 Restoration & Denoising:
On analysing the specific phase-I data sets as well as other phase-II data sets of C-SAP test sites, the major source of noise signals were observed to be due to the residual uncorrected stagger component, especially in Fore images. Stagger correction is incorporated primarily to take care of the five pixels shift between odd and even detector elements in the focal plane of the CCD (charge-coupled device) detector arrays used in the Fore and Aft sensors. It has been observed that in certain cases, the standard algorithm for stagger correction for stitching the odd and even pixels of a scanline together to form a single full scanline was not performing adequately. 4.1.1 Scene-based stagger removal:
The stagger value between odd and even pixels changes scene to scene depending on the latitude and the variation of the dynamic component of the orbit and attitude values (like rate component). During the data pre processing (radiometric correction), the stagger value is computed using the ephemeris and is used for the alignment of the pixels. The sampling interval (125 ms) for attitude and orbital elements in the ancillary information is not sufficient to characterize the satellite behavior for smaller intervals of time such as stagger induced time difference for acquiring odd and even pixels of a scanline (5 scans or 1.83 ms). During the careful inspection of radiometric corrected image at the larger scales, the residual stagger effects can be seen to an extent for which small additional correction is required. This residual stagger must have been due to the inadequate sampling interval of the attitude information. The scene-based estimation of stagger can be done using relative control points (RCP) between the odd and even images. RCPs can be derived using digital cross correlation based image matching technique between the odd and even images. First the data set is prepared for correlated RCPs at every scan line. The differences in odd and even data are supposed to be the stagger in the raw image. A histogram approach is adopted to quantify the stagger number in along track direction for one thousand samples. The RCPs are generated at 12 positions in across track direction viz. pixel numbers 50, 500, 1000, 1500, 2000, 2500, 3000, 3500, 4000, 4500, 5000, and 5500 with one scan sampling interval in along track direction. 4.1.2 Candidate artifact zones identification & preprocessing:
As the MTF correction process or restoration behaves in a peculiar way at high reflectance regions and high gradient regions in the form of ringing effects (alternate dark and bright lines) and false shadows (dark lines/ spots), these candidate artifact zones are first identified and locally pre-processed so that after restoration, no such artifacts are really present. Pre-processing involves detection and smoothing of high reflectance objects prior to the process of restoration. Automatic detection of bright objects in the original radiometrically corrected image is achieved by a tree-based segmentation approach. An image typically consists of several objects (features) placed over slowly varying background. In the
1358
The International Archives of the Photogrammetry, Remote Sensing and Spatial Information Sciences. Vol. XXXVII. Part B1. Beijing 2008
proposed algorithm, every object in an image is encapsulated by a tree structure, where root of the object tree is the brightest pixel in the object and leaves are the pixels at object/background boundaries. The pixels belonging to the object but lying between the root and the leaves are non-terminal nodes of the object tree. Many object trees are thus created all over the image corresponding to various objects. All object trees whose root gray value is greater than or equal to 1000 are identified as candidates for smoothing. A mask identifying pixels corresponding to such object trees (comprising of root, nodes and leaves) is generated. Smoothing (3x3 averaging) is done only for the masked pixels in the image. Such a selectively smoothed image forms the input for MTF correction. Due to prior smoothing of bright objects, ringing artifacts do not arise in the restored image. 4.1.3 Artifact Removal Post-processing:
Post-processing involves spatial neighborhood operation on the restored imagery to remove false shadows/dark spots. Original un-restored image and restored image form input to the proposed algorithm. All pixels in the restored image, where ratio of restored and unrestored values exceeds a threshold (say 2.0) are firstly identified. The intensity of such pixels is recomputed using corresponding un-restored gray value from original image and restored gray value from the restored image. 4.1.4 Wavelet based denoising:
The imaging mechanism (in this case, pushbroom scanning by an imaging sensor mounted on a satellite) acts as a low-pass filter and introduces degradation and noise in the observed image. The degradation is less for the lower spatial frequencies as compared to the mid and high spatial frequencies. As the high spatial frequencies (eg. features like edges) suffer more degradation (appear blurred), the signal power at high frequencies is low. However, the noise power is uniform at all frequencies (such type of noise is termed as ‘white’ noise). Therefore, at high frequencies, noise dominates over the signal. Restoration filter achieves deblurring by amplifying the high frequencies. The gain of the restoration filter is adjusted such that it is high at mid and high frequencies and unity at low frequencies. As a result, after restoration, the image appears to be deblurred (sharp), but noisy. The nature of noise that was ‘white’ prior to restoration is also changed to ‘colored’ during the process due to unequal gains of restoration filter. The amplified noise is particularly noticed in the uniform areas of the image. The stagger removed, MTF corrected (restored) and artifact removed image is decomposed into complex sub-bands using the dual tree complex wavelet transform. The signal is assumed to be concentrated on the larger scale coefficients, while noise is distributed with same variance over all the coefficients. As the signal and noise are located in nearly separate sub bands, the next step is to efficiently estimate the threshold that can eliminate the noisy coefficients. The thresholds are calculated using the adaptive ‘shrink’ method. The new wavelet coefficients are calculated by applying soft thresholding on the sub bands. Inverse transform of the thresholded bands gives the denoised image. The complex dual tree discrete wavelet transform is very efficient in higher noise conditions. 4.2 Restoration of Cartosat-1 Imagery:
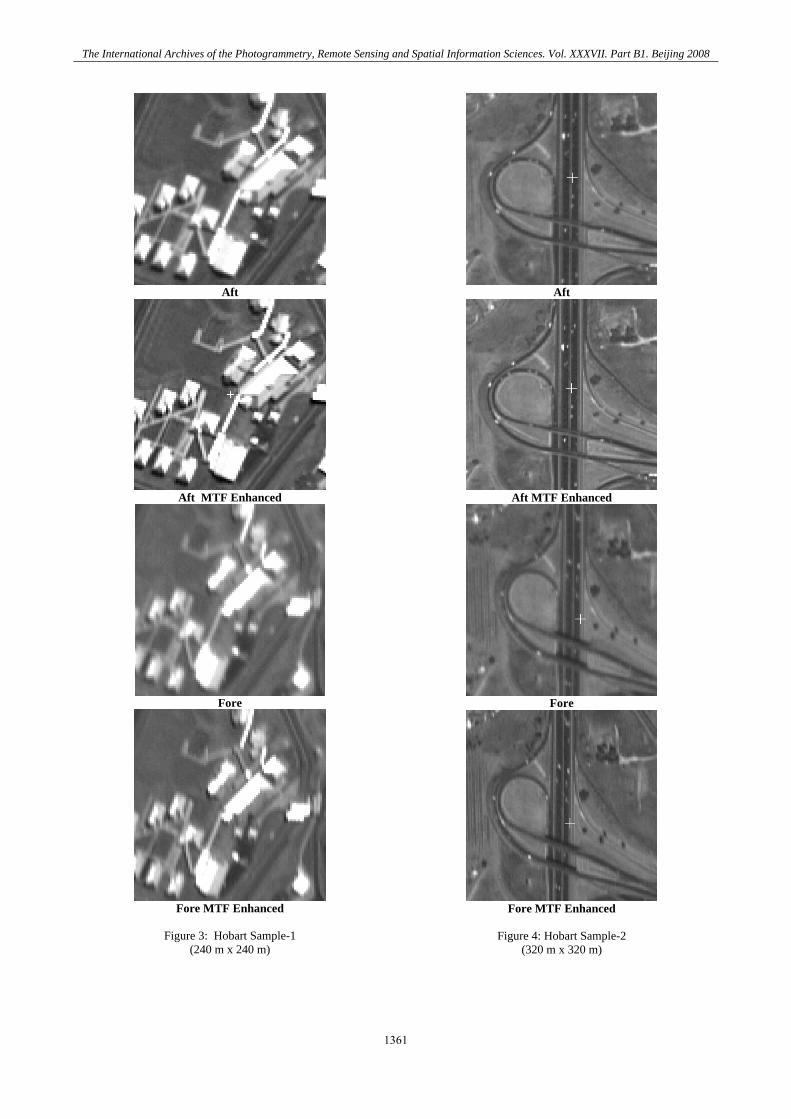
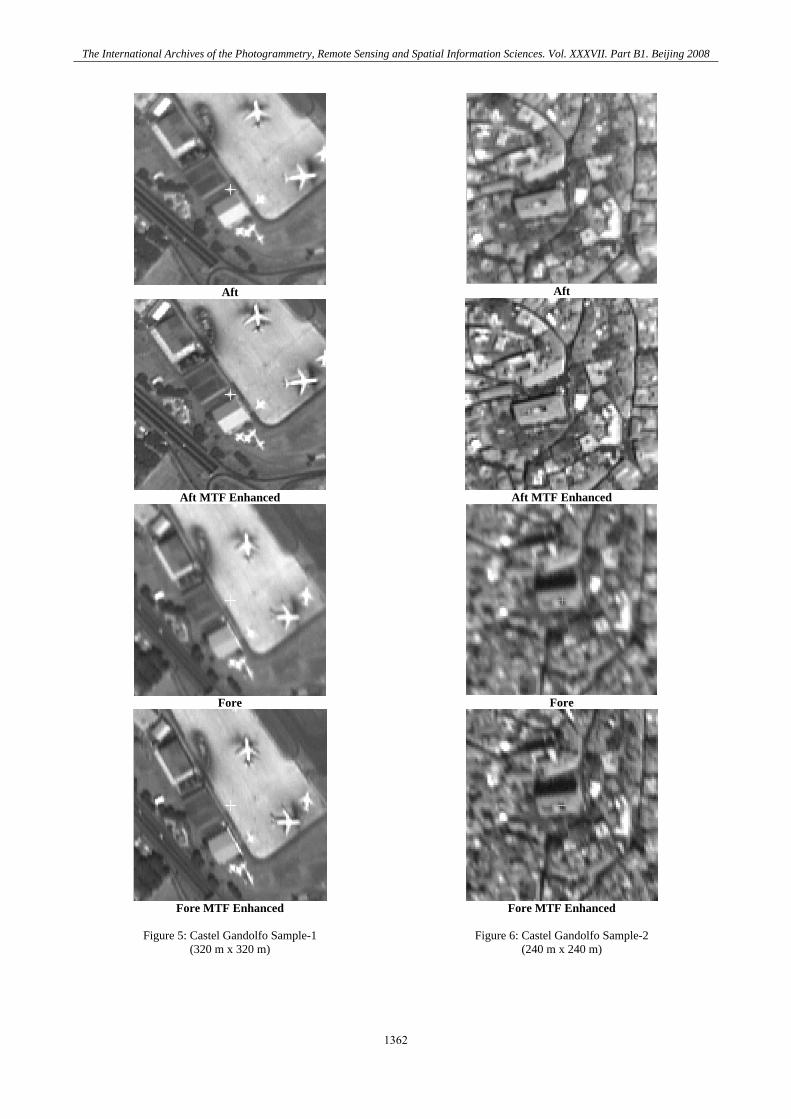
The laboratory measured point spread functions for the Fore and Aft sensors of Cartosat-1 were taken as the degradation function for restoration of respective imagery. Wiener filter, which
incorporates the degradation function as well as the model of noise, was designed in frequency domain for each sensor. After several experiments and independent qualitative and quantitative evaluations, the noise to signal ratio (nsr) was modeled to vary exponentially between nsrmin and nsrmax for low to high frequencies. The values of nsrmin and nsrmax were tuned suitably to control sharpness and noise. Restoration of the fore and aft images was performed block-wise. Every block of the input image was filtered with the Wiener filter in the frequency domain. Overlap of few pixels was maintained between successive blocks to avoid artifacts at block boundaries. Fast Fourier Transform (FFT) techniques were used to achieve high speed. The results of restoration are shown in Figures 3-6. Subsequent to restoration, Wavelet based denoising was performed. 4.3 Evaluation:
Apart from visual improvements (see Figures 3-6), the restored and denoised Cartosat-1 stereo images were independently evaluated quantitatively for their performance improvement in DEM generation. DEMs were generated from original stereo orthokit products as well as MTF enhanced products and the resulting DEMs were compared with high accuracy reference DEMs provided by respective Principal Investigators for two test sites, namely Hobart in Australia and Castel Gandolfo near Rome in Italy. The results are shown in Tables 1 and 2 and Figures 1 and 2. It could be observed in Tables 1 and 2 the third column values are consistently found larger than the corresponding values in column 2 indicating the enhanced performance in DEM generation due to the MTF improvements carried out on the stereo images. DEM improvements have expectedly been resulted due to more accurate stereo image matching after MTF enhancements. To observe the visual quality improvements in Figures 3 to 6, readers are recommended to observe them in softcopy version of this Paper accessible from ISPRS web site.
Height Difference
Comparison of DEM generated from
Original Orthokit with Reference DEM
Cumulative Percentage
Comparison of DEM generated from MTF Enhanced Orthokit
with Reference DEM Cumulative Percentage
Up to 1 m 37.5 43.25 Up to 3 m 55.16 59.98 Up to 5 m 70.03 70.74 Up to 10 m 89.76 91.65
Table-1: DEM Results for Hobart Test Site
Height Difference
Comparison of DEM generated from
Original Orthokit with Reference DEM
Cumulative Percentage
Comparison of DEM generated from MTF Enhanced Orthokit
with Reference DEM Cumulative Percentage
Up to 1 m 18.39 18.58 Up to 3 m 58.67 62.15 Up to 5 m 75.81 78.88 Up to 10 m 84.97 93.12
Table-2: DEM Test Results for Castel Gandolfo Test Site
1359
The International Archives of the Photogrammetry, Remote Sensing and Spatial Information Sciences. Vol. XXXVII. Part B1. Beijing 2008
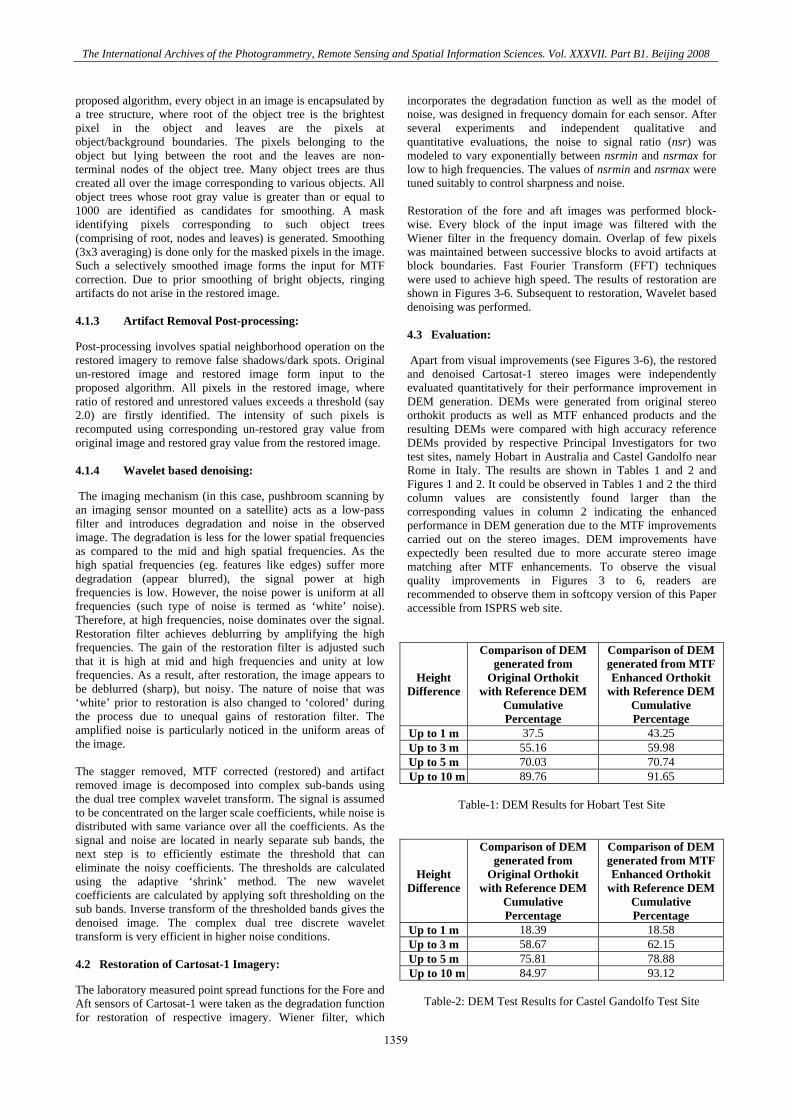
5. GEOMETRIC IMPROVEMENTS
Some C-SAP investigators reported problems in generating DEM from the rational polynomial coefficients provided. Upon analysis, it was found that the denominators were crossing zero while using RPC coefficients. And wherever the zero crossovers were there, the coordinates were going out of bound. To solve this issue, the problem was analysed in detail. It was found that possible reasons for the zero-crossovers could include irregular image boundaries or absence of orbit-attitude values or jumps in attitude values, among others. To solve this issue, the problem was reformulated with common denominator coefficients for both line and sample directions. Also, wild point removal in attitude values and smoothing them were carried out. Further more orbit-attitude samples in top and bottom of the scene were considered for modelling. After this, a number of products were generated and verified. Earlier observations were not seen and consistent results achieved for all the C-SAP products. Also, rational polynomial coefficients were regenerated to take care of longitude convention from -180 to 180 degrees for investigators of C-SAP datasets as the ephemeris and attitude data available to data products is given in 0 to 360 degrees longitude convention.
6. CONCLUSIONS
In this Paper, the radiometric improvements incorporated to Cartosat-1 stereo orthokit products by way of MTF enhancements using laboratory measured sensor point spread functions for the Fore and Aft sensors including necessary pre and post-facto artifacts and noise removals and geometric improvements to re-compute the rational polynomial coefficients to take care of the denominator zero cross-overs are described.
ACKNOWLEDGEMENTS
Authors acknowledge the support provided by Mr. Satya Soma Sekhar and Dr. Arvind Kumar Singh from SIPA, SAC during this work. Authors acknowledge all the investigators of C-SAP Phase-I evaluations who presented their findings at Goa and Hannover which resulted in the improvements reported in this Paper. Authors thank Dr. RR Navalgund, Director, SAC and Dr. G. Madhavan Nair, Chairman, ISRO respectively for permitting this work to be presented at the ISPRS Congress and permitting the participation at Beijing, China during July 3-11, 2008. Suggestions for improving an earlier version of this Paper by Shri DRM Samudraiah, SEDA, SAC and Dr. JS Parihar, RESA, SAC are acknowledged.
REFERENCES
Nandakumar, R., PK Srivastava, David Holland & Alain Baudoin, THE C-SAP INITIATIVE BY ISPRS AND ISRO: A Scientific Assessment Programme for the high resolution panchromatic stereo sensors onboard CARTOSAT-1, ISPRS Commission IV Symposium on Geospatial Databases for Sustainable Development, Goa, 27-30 September, 2006.
Srivastava, P.K.., Gopala Krishna, B., Srinivasan, T.P., Sunanda Trivedi, Amitabh and Nandakumar, R. (2006), Cartosat-1 Data Products for Topographic Mapping, ISPRS Commission IV Symposium on Geospatial Databases for Sustainable Development, Goa, 27-30 September, 2006.
Figure 1: DEM derived from MTF Enhanced Cartosat-1 Stereo
Orthokit over Hobart Test Site (Full Scene area covering 27.5 km x 27.5 km)
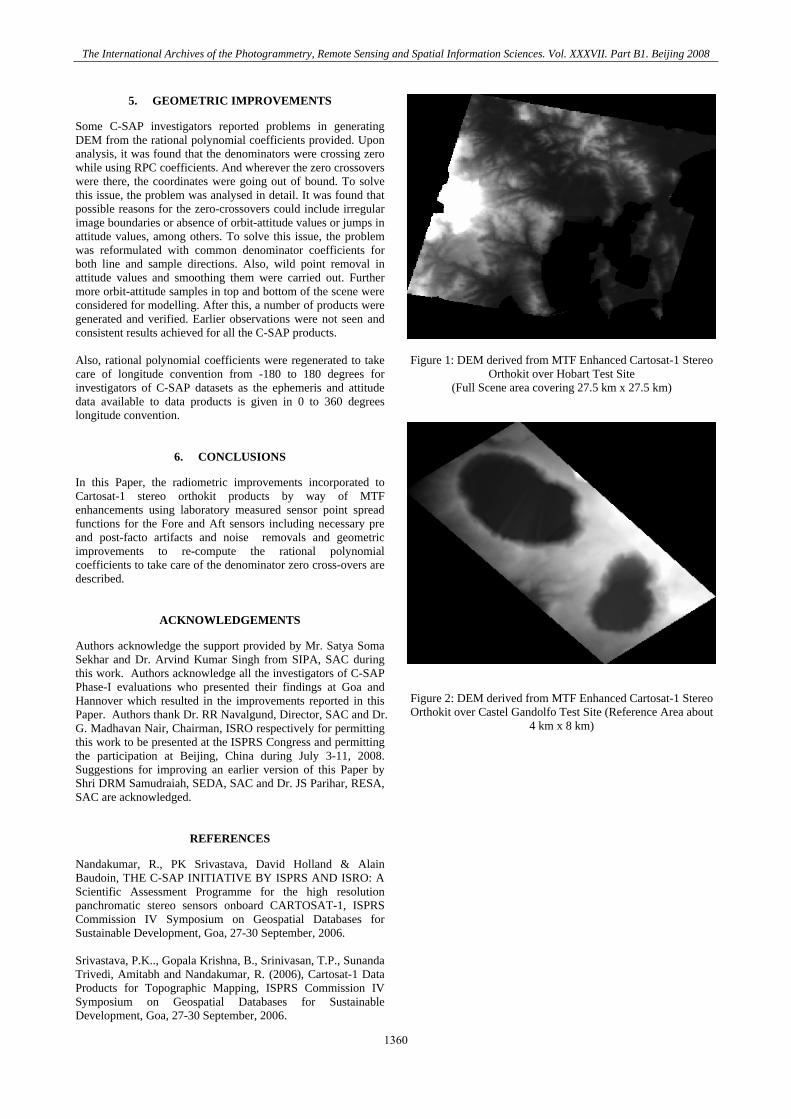
derived from MTF Enhanced Cartosat-1 Stereo
Figure 2: DEM Orthokit over Castel Gandolfo Test Site (Reference Area about
4 km x 8 km)
1360
The International Archives of the Photogrammetry, Remote Sensing and Spatial Information Sciences. Vol. XXXVII. Part B1. Beijing 2008
Aft
Aft MTF Enhanced
Fore
Fore MTF Enhanced
Figure 3: Hobart Sample-1
(240 m x 240 m)
Aft
Aft MTF Enhanced
Fore
Fore MTF Enhanced
Figure 4: Hobart Sample-2
(320 m x 320 m)
1361
The International Archives of the Photogrammetry, Remote Sensing and Spatial Information Sciences. Vol. XXXVII. Part B1. Beijing 2008
Aft
Aft MTF Enhanced
Fore
Fore MTF Enhanced
Figure 5: Castel Gandolfo Sample-1
(320 m x 320 m)
Aft
Aft MTF Enhanced
Fore
Fore MTF Enhanced
Figure 6: Castel Gandolfo Sample-2
(240 m x 240 m)
1362