Embed Size (px)
Citation preview

CARTOSAT-1: ORIENTATION, DEM AND ORTHORECTIFICATION QUALITY ASSESMENT
R. Dabrowskia, W. Fedorowicz-Jackowskia, M. Kedzierskib, P. Walczykowskib, J. Zycha
a Geosystems Polska Sp. z o.o., ul. Smolna 38/5, 00-375 Warszawa, Poland - (rafal.dabrowski, witold.fedorowicz)@geosystems.com.pl
b Military University of Technology, ul. Kaliskiego 2, 00-908 Warszawa, Poland - (mkedzierski, pwalczykowski)@wat.edu.pl
Commission I, SS-11
KEY WORDS: Photogrammetry, Digital, Orthorectification, DEM/DTM, Satellite, Accuracy, IRS ABSTRACT: CARTOSAT-1 is an Indian satellite – the 11th one in the IRS (Indian Remote Sensing) series designed to provide quality Earth imagery for telemetry and digital mapping. The satellite carries two panchromatic sensors capturing images forward (26 degrees) and backwards (5 degrees). Images are recorded almost simultaneously in both directions along the satellite’s orbit plane or with an inclination, if needed. The sensors cover the swath about 30 km wide with the resolution of 3 m (+26 degrees) and 2,5 m (-5 degrees). This article summarizes the findings of the research programme aiming to verify the quality of the imagery acquired by Cartosat-1. The verification was conducted using a test scene located in Poland. The research team included engineers from Geosystems Polska and scientists from Military University of Technology, Warsaw. The imagery was processed with Leica Photogrammetry Suite software.
1. INTRODUCTION
To assess the quality of imagery from Cartosat-1 and its viability for Earth’s Digital Elevation Models ISRO and ISPRS started a research programme named C-SAP (Cartosat Scientific Assessment Programme) inviting companies and institutions with appropriate human and technical resources. Sixteen Principal Investigators were chosen to provide reference data. The authors were part of the Principal Investigator responsible for the Test Site 9 (TS-9).
2. INPUT DATA
2.1 Image Data
The coordinator of the CSAP-ISRO programme provided a stereoscopic pair of images acquired on February 25th, 2006. The pair covers an area located slightly over 100 km South-West of Warsaw, the capital of Poland. The scenes were rated good quality though due to the winter season most of the area was covered with snow.
Figure 1. The after (left) and forward image.
2.2 Reference data
DEM: As required by C-SAP the Principal Investigator (PI) responsible for TS-9 provided two reference terrain models from two independent sources: a Digital Elevation Model (DEM) with the resolution of 25 m generated from topographic maps and a DTED-2. GCPs: To provide flexibility in data analysis, 36 Ground Control Points (GCPs) were established. The GCPs were distributed evenly over the stereopair. After a field survey the number of GCPs was reduced to 31 due to difficulty in identifying the correct location of 5 of them. As a general rule, GCPs were placed where roads or paths crossed, though in some areas only fence corners provided enough reliability.
Figure 2. GCP distribution in the scene.
he GCP field survey was conducted with a GPS receiver using T
1309
The International Archives of the Photogrammetry, Remote Sensing and Spatial Information Sciences. Vol. XXXVII. Part B1. Beijing 2008
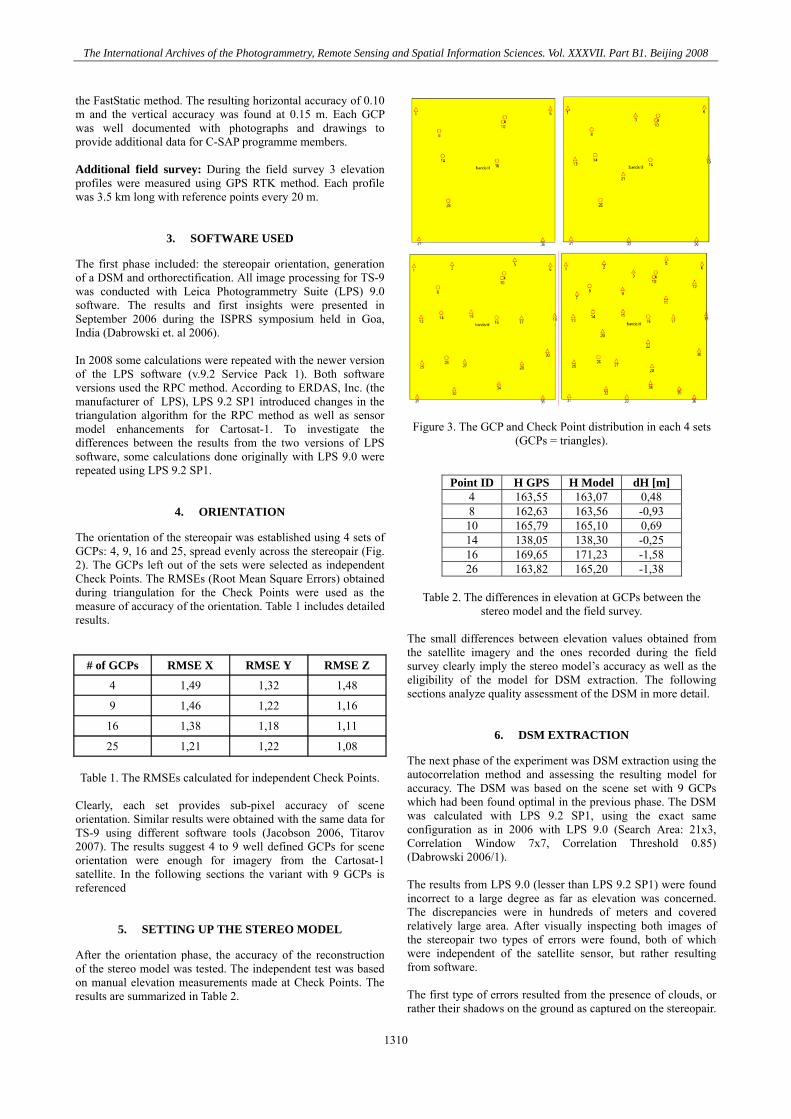
the FastStatic method. The resulting horizontal accuracy of 0.10 m and the vertical accuracy was found at 0.15 m. Each GCP was well documented with photographs and drawings to provide additional data for C-SAP programme members. Additional field survey: During the field survey 3 elevation
3. SOFTWARE USED
The first phase included: the stereopair orientation, generation
2008 some calculations were repeated with the newer version
4. ORIENTATION
The orientation of the stereopair was established using 4 sets of
# of GCPs RMSE X RMSE Y RMSE Z
profiles were measured using GPS RTK method. Each profile was 3.5 km long with reference points every 20 m.
of a DSM and orthorectification. All image processing for TS-9 was conducted with Leica Photogrammetry Suite (LPS) 9.0 software. The results and first insights were presented in September 2006 during the ISPRS symposium held in Goa, India (Dabrowski et. al 2006). Inof the LPS software (v.9.2 Service Pack 1). Both software versions used the RPC method. According to ERDAS, Inc. (the manufacturer of LPS), LPS 9.2 SP1 introduced changes in the triangulation algorithm for the RPC method as well as sensor model enhancements for Cartosat-1. To investigate the differences between the results from the two versions of LPS software, some calculations done originally with LPS 9.0 were repeated using LPS 9.2 SP1.
GCPs: 4, 9, 16 and 25, spread evenly across the stereopair (Fig. 2). The GCPs left out of the sets were selected as independent Check Points. The RMSEs (Root Mean Square Errors) obtained during triangulation for the Check Points were used as the measure of accuracy of the orientation. Table 1 includes detailed results.
4 1,49 1,32 1,48
9 1,46 1,22 1,16
16 1,38 1,18 1,11
25 1,21 1,22 1,08
Table 1. The RMSEs calculate or independent Check Points.
learly, each set provides sub-pixel accuracy of scene
5. SETTING UP THE STEREO MODEL
After the orientation phase, the accuracy of the reconstruction
d f
Corientation. Similar results were obtained with the same data for TS-9 using different software tools (Jacobson 2006, Titarov 2007). The results suggest 4 to 9 well defined GCPs for scene orientation were enough for imagery from the Cartosat-1 satellite. In the following sections the variant with 9 GCPs is referenced
of the stereo model was tested. The independent test was based on manual elevation measurements made at Check Points. The results are summarized in Table 2.
Figure 3. The GCP and Check Point distribution in each 4 sets
Point ID H GPS H Model dH [m]
(GCPs = triangles).
4 163,55 163,07 0,48 8 162,63 163,56 -0,93 10 165,79 165,10 0,69 14 138,05 138,30 -0,25 16 169,65 171,23 -1,58 26 163,82 165,20 -1,38
Table 2. The differences in el vation at GCPs between the
he small differences between elevation values obtained from
6. DSM EXTRACTION
The next phase of the experiment was DSM extraction using the
he results from LPS 9.0 (lesser than LPS 9.2 SP1) were found
he first type of errors resulted from the presence of clouds, or
estereo model and the field survey.
Tthe satellite imagery and the ones recorded during the field survey clearly imply the stereo model’s accuracy as well as the eligibility of the model for DSM extraction. The following sections analyze quality assessment of the DSM in more detail.
autocorrelation method and assessing the resulting model for accuracy. The DSM was based on the scene set with 9 GCPs which had been found optimal in the previous phase. The DSM was calculated with LPS 9.2 SP1, using the exact same configuration as in 2006 with LPS 9.0 (Search Area: 21x3, Correlation Window 7x7, Correlation Threshold 0.85) (Dabrowski 2006/1). Tincorrect to a large degree as far as elevation was concerned. The discrepancies were in hundreds of meters and covered relatively large area. After visually inspecting both images of the stereopair two types of errors were found, both of which were independent of the satellite sensor, but rather resulting from software. Trather their shadows on the ground as captured on the stereopair.
1310

The International Archives of the Photogrammetry, Remote Sensing and Spatial Information Sciences. Vol. XXXVII. Part B1. Beijing 2008
At first glance the images were cloudless. This impression resulted from the low contrast between the shadow-projecting clouds and the snow-covered ground. The older version of LPS software apparently did not manage to filter excess values. The other type of errors which came to light with the LPS 9.0
Figure 3. Gross errors identification using Blend Tool in ERDAS magine
Both types of errors i e experiment resulted ot from the sensor mounted on the satellite, but rather from the
was inaccurate elevation extracted along linear objects oriented along the left and right edges of the stereopair i.e. parallel (+/- 5 degrees) to the satellite’s orbit (Fig. 3).
I
dentified during thninaccurate sensor modeling by software or its correlation algorithm improperly designed. Additional confirmation to these claims is the non-existence of the said errors in the newer version of LPS (v. 9.2 SP1 or later) based on the same source data. The new model significantly differs from the previous ones (Fig. 4).
Figure 4. DSMs calculated in LPS 9.0 (left) and LPS 9.2 SP1
T ersions of LPS are obvious. With LPS 9.0 areas with gross
General Mass Point Quality %
.
he differences between models generated by two differentverrors are apparent while the LPS 9.2 SP1 image is much more smooth, representing better accuracy of the elevation model. Correlation analysis of both the old and the new models with the original stereopair shows major improvement (coefficient of correlation at 0.85). The LPS 9.2 SP1 image did not have a single object in the suspicious class which is coherent with the software’s manufacturer statement, regarding the improved correlation algorithm for Cartosat-1 introduced with LPS 9.2 SP1.
Excellent % (1-0.85) 87.2 Good % (0.85-0.70) 12.5 Fair % (0.70-0.5) 0.3 Isolated % 0.0 Suspicious % 0.0
7. DSM ACCURACY ASSESMENT
Accuracy o e agery was measured against the two DEMs. Each model was obtained
Table 2. Correlation quality
f th DSM generated from Cartosat-1 im
independently of the other. After the initial analysis of the DSM its accuracy was tested against the reference model based on topographic maps with the scale of 1: 25000. The difference between the DSM based on the LPS 9.2 SP1 and the reference model was very narrow. The graph below illustrates the distribution of the differences, most of which tended to stay within the +/- 3 m range. That fact proved the high fidelity of the obtained elevation models.
Figure 5. The reference DEM and the calculated DSM difference distribution.
The next phase was calculated model’s ccuracy at the 6 previously chosen Check Points. The results of
aimed at verifying the athe verification are in the Table 3. Only one of the Check Points shows noticeable deviation from the others with the value of the difference above 2 m. In all other cases the differences stay within the 2 m range, which is further evidence of the high fidelity of the model.
1311
The International Archives of the Photogrammetry, Remote Sensing and Spatial Information Sciences. Vol. XXXVII. Part B1. Beijing 2008
Pt, ID X Y DSM Z DEM Z Residual
4 464 ,98 5738 ,12 147 939 163,55 163,06 -0,49
8 451384,13 5739462,83 162,63 162,9 0,27
10 463566,51 5738103,00 165,79 165,26 -0,53
14 450570,68 5734109,76 138,05 138,32 0,27
16 460284,13 5730408,02 169,65 167,44 -2,21
26 449046,65 5724779,93 163,82 164,24 0,42
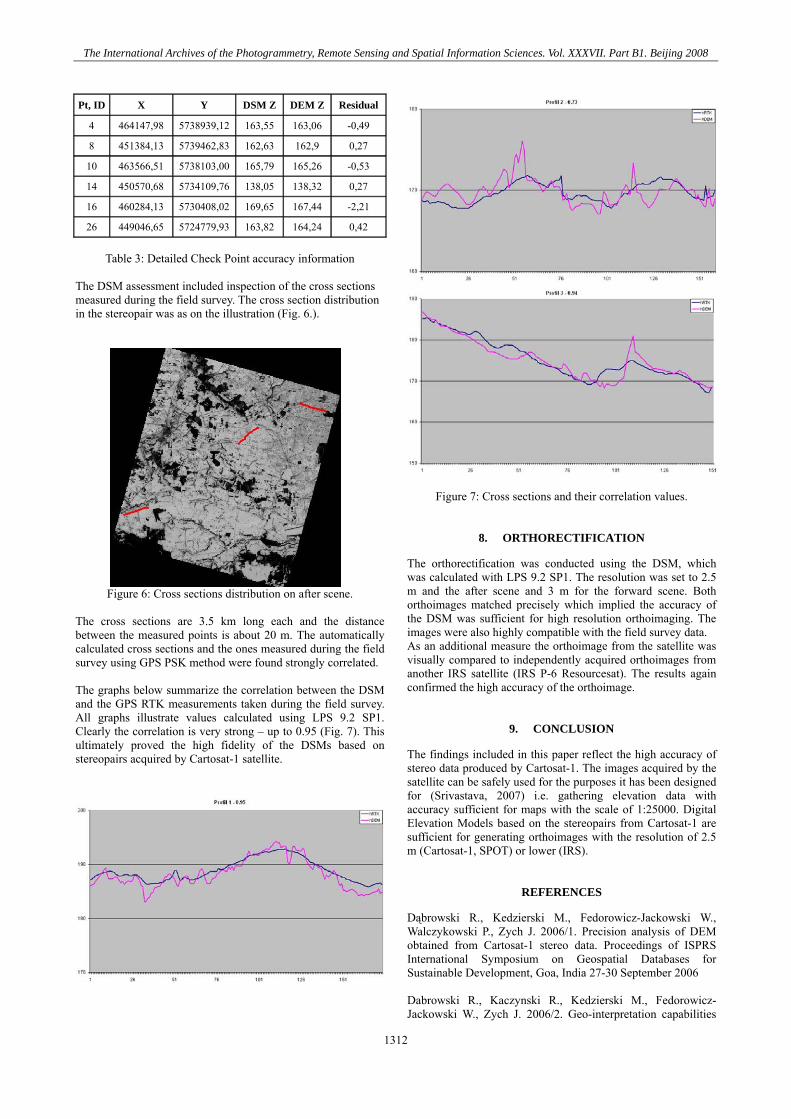
Table 3: Detailed Check Point accuracy information
he DSM assessment included inspection of the cross sections
e.
The c tance between the measured points i m. The automatically
nd the GPS RTK measurements taken during the field survey.
Tmeasured during the field survey. The cross section distribution in the stereopair was as on the illustration (Fig. 6.).
Figure 6: Cross sections distribution on after scen
ross sections are 3.5 km long each and the diss about 20
calculated cross sections and the ones measured during the field survey using GPS PSK method were found strongly correlated. The graphs below summarize the correlation between the DSMaAll graphs illustrate values calculated using LPS 9.2 SP1. Clearly the correlation is very strong – up to 0.95 (Fig. 7). This ultimately proved the high fidelity of the DSMs based on stereopairs acquired by Cartosat-1 satellite.
Figure 7: Cross sections and their correlation values.
8. ORTHORECTIFICATION
The orthorectification was conducted using the DSM, which was calculated with LPS 9.2 SP1. The resolution was set to 2.5 m and the after scene and 3 m for the forward scene. Both orthoimages matched precisely which implied the accuracy of the DSM was sufficient for high resolution orthoimaging. The images were also highly compatible with the field survey data. As an additional measure the orthoimage from the satellite was visually compared to independently acquired orthoimages from another IRS satellite (IRS P-6 Resourcesat). The results again confirmed the high accuracy of the orthoimage.
9. CONCLUSION
The findings included in this paper reflect the high accuracy of stereo data produced by Cartosat-1. The images acquired by the satellite can be safely used for the purposes it has been designed for (Srivastava, 2007) i.e. gathering elevation data with accuracy sufficient for maps with the scale of 1:25000. Digital Elevation Models based on the stereopairs from Cartosat-1 are sufficient for generating orthoimages with the resolution of 2.5 m (Cartosat-1, SPOT) or lower (IRS).
REFERENCES
Dąbrowski R., Kedzierski M., Fedorowicz-Jackowski W., Walczykowski P., Zych J. 2006/1. Precision analysis of DEM obtained from Cartosat-1 stereo data. Proceedings of ISPRS International Symposium on Geospatial Databases for Sustainable Development, Goa, India 27-30 September 2006 Dabrowski R., Kaczynski R., Kedzierski M., Fedorowicz-Jackowski W., Zych J. 2006/2. Geo-interpretation capabilities
1312

The International Archives of the Photogrammetry, Remote Sensing and Spatial Information Sciences. Vol. XXXVII. Part B1. Beijing 2008
and precision of an orthophotomap obtained from Cartosat images. Proceedings of ISPRS International Symposium on Geospatial Databases for Sustainable Development, Goa, India 27-30 September 2006 Jacobsen K. 2006. ISPRS-ISRO Cartosat Scientific Assessment Programme (C-SAP): Technical Report – Test Area Mausanne and Warsaw. Proceedings of ISPRS International Symposium on Geospatial Databases for Sustainable Development, Goa, India 27-30 September 2006 Srivastava P.K., Srinivasan T.P., Amit Gupta, Sanjay Singh, Jagjeet Singh Nain, Amitabh, Shilpa Prakash, Kartikeyan B., Gopala Krishna B. 2007. Recent Advances In Cartosat-1 Data Processing, Proceedings of ISPRS International Symposium
“High Resolution Earth Imaging for Geospatial Information” 29.05-01.06 2007 Hannover, Germany Titarov P.S. 2007. Cartosat-1 stereo orthokit data evaluation. Proceedings of ISPRS International Symposium “High Resolution Earth Imaging for Geospatial Information” 29.05-01.06 2007 Hannover, Germany
ACKNOWLEDGEMENTS
The authors would like to thank Dr. R. Nandakumar from ISRO for coordination of the Cartosat-1 Scientific Assessment Programme.
1313

The International Archives of the Photogrammetry, Remote Sensing and Spatial Information Sciences. Vol. XXXVII. Part B1. Beijing 2008
1314


![gecnet.kku.ac.th · of Agriculture and Cooperation DEM [MOAC DEM]) SRTM DEM 5 SRTM DEM 5 Suriya Polpoon ... Earth's land surface is freely available for download from internet. Taking](https://img.pdfslide.us/doc/110x75/5f088e027e708231d4229689/of-agriculture-and-cooperation-dem-moac-dem-srtm-dem-5-srtm-dem-5-suriya-polpoon.jpg)